Embed Size (px)
Citation preview

Kuehne + Nagel International AGAnalyst Conference Call – 1st Half-Year 2011 ResultsJuly 18, 2011 (CET 14.00)Schindellegi, Switzerland

1st Half-Year 2011 results July 18, 2011 Slide 2
Agenda
Welcome & Highlights 1st Half Year 2011 | Gerard van Kesteren
Operating Review 1st Half Year 2011 | Reinhard Lange
Financial Review | Gerard van Kesteren
Outlook | Reinhard Lange

1st Half-Year 2011 results July 18, 2011 Slide 3
Highlights 1st Half-Year 2011
• Strong volume growth above market in all business units:
• Material negative forex impact of 16%
• Stable Seafreight and Airfreight margins per unit, impacted by negative forex
• Road & Rail Logistics: consolidation of RH Freight (UK) as from April 2011
• Reduction of idle space in Contract Logistics from 9.2% last year to 6.0% June 2011
• Stable 3.2% working capital intensity
• ROCE at all time high 56%
• Effective tax rate 21% sustainable
Kuehne+Nagel Market- Seafreight 12% 6%- Airfreight 18% <2%- Road&Rail 21% 4%- Contract Logistics 5% 3%

1st Half-Year 2011 results July 18, 2011 Slide 4
Income Statement 1st Half-Year
Variance Growth Acquisition FX Impact
Invoiced turnover 9'849 9'786 (0.6%) 11.3% 1.9% (13.9%)(63) 1'115 188 (1'366) MCHF
Gross profit 2'961 2'954 (0.2%) 12.4% 1.5% (14.1%)(7) 368 43 (418) MCHF
Gross profit margin 30.1% 30.2%
Total expenses (2'486) (2'452)
EBITDA 475 502 5.7% 19.6% 0.8% (14.7%)EBITDA margin 4.8% 5.1%
EBITA 392 427EBITA margin 4.0% 4.4%
EBIT 357 396 10.9% 27.2% (0.8%) (15.4%)39 97 (3) (55) MCHF
EBIT margin 3.6% 4.0%
EBT 358 398 11.2% 27.7% (0.8%) (15.6%)EBT margin 3.6% 4.1%
Earnings for the period 281 312 11.0% 27.4% (0.7%) (15.7%)
CHF million 2010 2011

1st Half-Year 2011 results July 18, 2011 Slide 5
Development Main Exchange Rates vs. CHF
2009 2010 2010 2011
Income Statement (average rates) Expected full year 2011
Euro 1.5099 1.3864 1.4377 1.2608 (12.3%) (12.1)
US Dollar 1.0811 1.0430 1.0789 0.9037 (16.2%) (15.9%) (16.3) (15.7%)
British Pound 1.6774 1.6119 1.6530 1.4499 (12.3%) (13.3)
Variance %
1st Half-YearYear-End ImpactNet
Earnings
Used FX-Rates
EUR 1.17USD 0.84GBP 1.34

1st Half-Year 2011 results July 18, 2011 Slide 6
Agenda
Welcome & Highlights 1st Half Year 2011 | Gerard van Kesteren
Operating Review 1st Half Year 2011 | Reinhard Lange
Financial Review | Gerard van Kesteren
Outlook | Reinhard Lange

1st Half-Year 2011 results July 18, 2011 Slide 7
Acquisition – Grupo Eichenberg, Brazil
75 years of experience mainly in road transportation
700 employees in 11 locations in Brazil and offices in Argentina, Uruguay and Chile
One of the leading road transportation providers
Daily lines to destinations in Uruguay, Argentina and Chile
Domestic groupage network
Basis for domestic Airfreight development
Expected synergies with existing Kuehne + Nagel business

1st Half-Year 2011 results July 18, 2011 Slide 8
Acquisition – Grupo Eichenberg, Brazilfinancial key data
Transaction 100% of shares Earn-out 2 years
Turnover / volumes
Turnover CHF 160 million 55% Road, 20% Air, 15% Contract Logistics, 10% Sea
Earnings EBITDA CHF 8 million EBIT CHF 7 million
Goodwill tax deductible at 34%

1st Half-Year 2011 results July 18, 2011 Slide 9
Seafreight

1st Half-Year 2011 results July 18, 2011 Slide 10
Seafreight: Highlights 1st Half-Year 2011
Volume increased by 12% (market growth 6%)
Particular strong growth rates from exports Europe to North America/Asia and from Asia to South America/Middle East.
Continuous declining freight rates
Ongoing implementation of “Go for Growth” strategy
Continuous hiring of sales, trade lane/product experts
Increase in EBIT / Gross Profit conversion ratio
33.6% vs. 32.1% (last year to date) – stable productivity

1st Half-Year 2011 results July 18, 2011 Slide 11
Performance of Business Unit Seafreight – 1st Half-Year
'000 TEU CHF per TEU GP CHF Mio '000 TEU CHF per TEU GP CHF Mio '000 TEU CHF per TEU GP CHF Mio
Q1 563 535 301 659 432 285 754 414 312Q2 620 494 306 753 406 306 825 379 313Q3 690 436 301 779 420 327Q4 673 437 294 754 406 306
YTD 2'546 472 1'202 2'945 416 1'224 1'579 396 625
USD / CHF
USD per TEU
2010Period
2011
0.90
438.0436.6 398.5
1.041.08
2009
Invoiced turnover 3'731 4'305 4'136 (3.9%) 9.4% 0.3% (13.4%)
Gross profit 607 591 625 5.8% 20.8% 0.5% (15.1%)
EBITDA 204 204 220 7.8% 23.5% 0.5% (15.7%)
EBIT 184 190 210 10.5% 26.3% - (15.8%)
EBIT in % of GP 30.3% 32.1% 33.6% TEU's
'000 GP Exp. EBIT
2009 1'183 513 (358) 1562010 1'412 419 (284) 1352011 1'579 396 (263) 133
CHF million 2009
per TEU
20112010 Variance Growth FX ImpactAcquisition

1st Half-Year 2011 results July 18, 2011 Slide 12
Europe ExportEurope Export
Asia Pacific Export
Asia Pacific Export
North America Export
North America ExportOther Export
Other Export
-
200'000
400'000
600'000
800'000
1'000'000
1'200'000
1'400'000
1'600'000
1'800'000
June 2010 June 2011
Performance of Business Unit Seafreight – Volume by Traffic Lane
12%
9%
49%
30%
12%
9%
49%
30%
+9%
+14%
+11%
+14%
% of Total Volumes
% of Total Volumes growth
TEU‘s

1st Half-Year 2011 results July 18, 2011 Slide 13
Airfreight

1st Half-Year 2011 results July 18, 2011 Slide 14
Airfreight: Highlights 1st Half-Year 2011
Volume increased by 21% (market growth 6-7%)
259‘000 Tons handled: Highest level of volume of any quarter
Volatile freight rates
Started implementation of the “Go for Growth” strategy
Development of activities on the inter-Asian and transpacific traffics
Development of industry-specific solutions: Perishables and Pharma Logistics
Substantial increase of EBIT / Gross Profit conversion ratio
30.3% vs. 25.7% (Q1 2010)
Productivity increase by 4% YoY
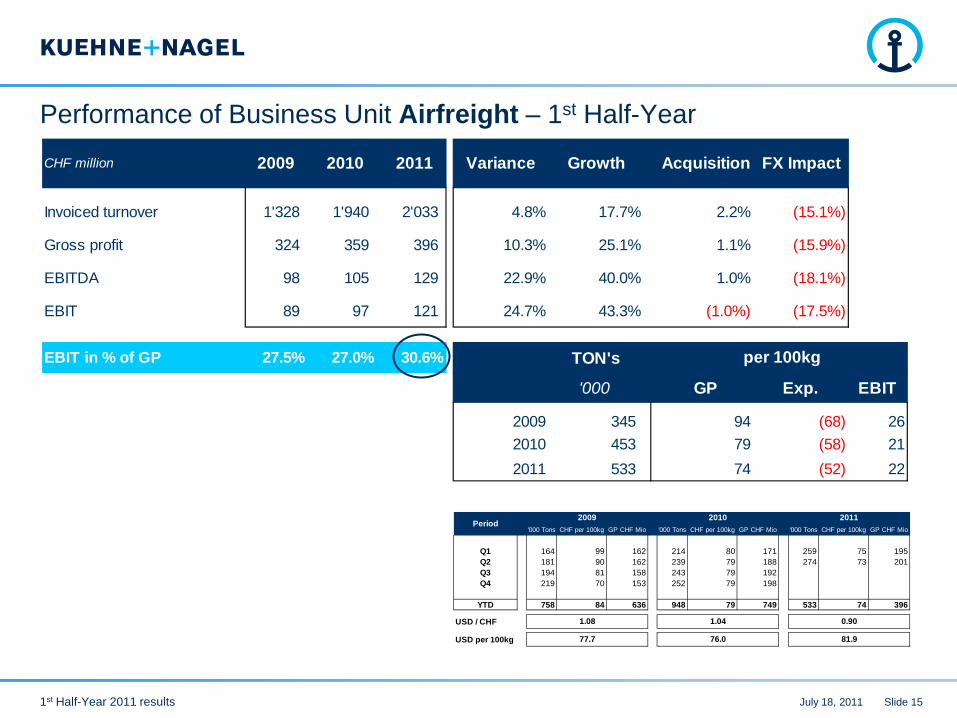
Volume increased by 18% (market growth <2%)
Particular strong growth rates from exports Europe to North America/Asia and from North America to Europe/South America.
Soft volumes from Asia to Europe
Volatile freight rates
Declining rates Asia to Europe due to over-capacity of space
Ongoing implementation of “Go for Growth” strategy
Continuous focus on building up worldwide Perishables Network
Setting up infrastructure for Pharma Logistics
Substantial increase of EBIT / Gross Profit conversion ratio
30.6% vs. 27.0% (last year to date) – continuous increase of productivity
1st Half-Year 2011 results July 18, 2011 Slide 15
Performance of Business Unit Airfreight – 1st Half-Year
'000 Tons CHF per 100kg GP CHF Mio '000 Tons CHF per 100kg GP CHF Mio '000 Tons CHF per 100kg GP CHF Mio
Q1 164 99 162 214 80 171 259 75 195Q2 181 90 162 239 79 188 274 73 201Q3 194 81 158 243 79 192Q4 219 70 153 252 79 198
YTD 758 84 636 948 79 749 533 74 396
USD / CHF
USD per 100kg
2011
0.90
81.977.7 76.0
1.041.08
2009 2010Period
Invoiced turnover 1'328 1'940 2'033 4.8% 17.7% 2.2% (15.1%)
Gross profit 324 359 396 10.3% 25.1% 1.1% (15.9%)
EBITDA 98 105 129 22.9% 40.0% 1.0% (18.1%)
EBIT 89 97 121 24.7% 43.3% (1.0%) (17.5%)
EBIT in % of GP 27.5% 27.0% 30.6% TON's
'000 GP Exp. EBIT
2009 345 94 (68) 262010 453 79 (58) 212011 533 74 (52) 22
FX ImpactCHF million 2009
per 100kg
2010 2011 Variance Growth Acquisition
1st Half-Year 2011 results July 18, 2011 Slide 16
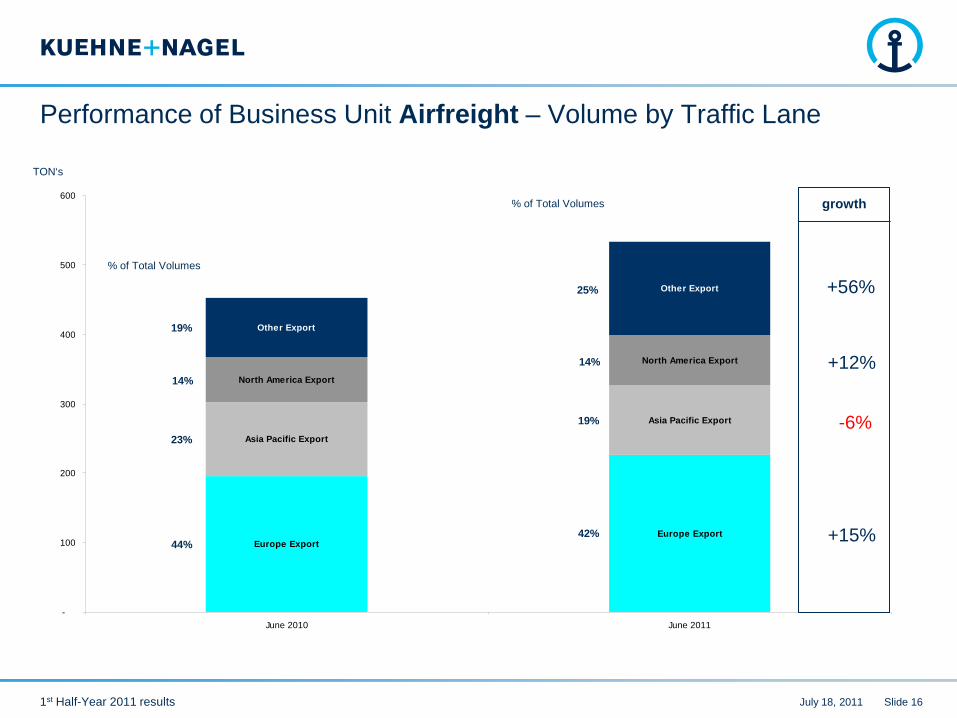
Performance of Business Unit Airfreight – Volume by Traffic Lane
Europe ExportEurope Export
Asia Pacific Export
Asia Pacific Export
North America Export
North America Export
Other Export
Other Export
-
100
200
300
400
500
600
June 2010 June 2011
44%
23%
14%
19%
42%
19%
14%
25% +56%
+12%
-6%
+15%
% of Total Volumes
% of Total Volumes growth
TON‘s

1st Half-Year 2011 results July 18, 2011 Slide 17
Road & Rail Logistics

1st Half-Year 2011 results July 18, 2011 Slide 18
Road & Rail Logistics: Highlights 1st Half-Year 2011
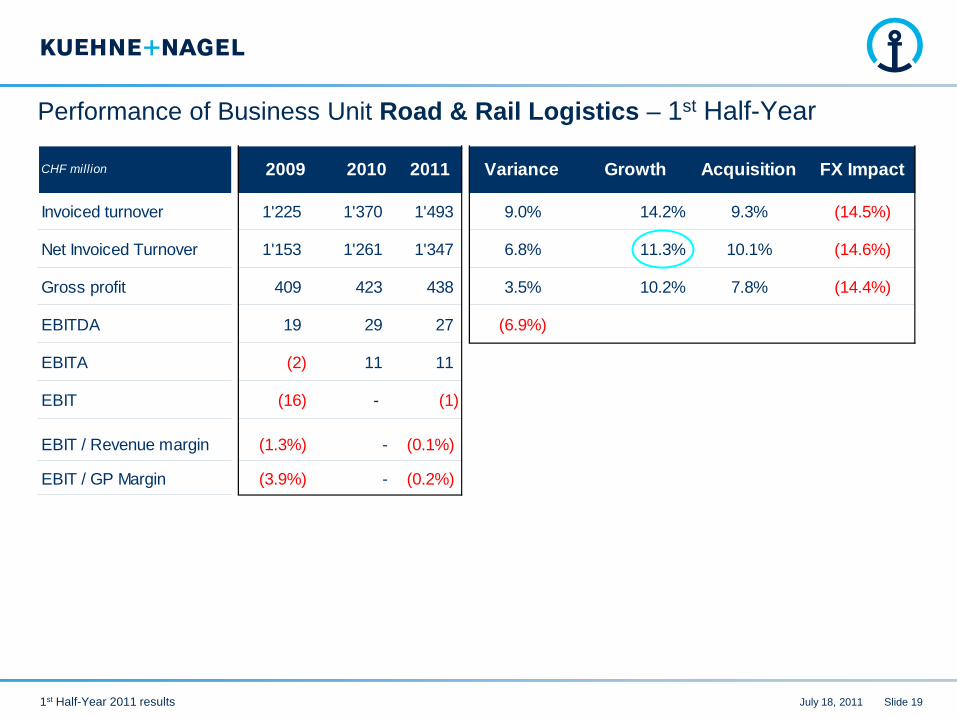
Net invoiced turnover (organically / currency adjusted) increased by 11% (market 4%); plus 10% acquisition impact
Continuous pressure on margins
Ongoing implementation of “Go for Growth” strategy
Organic development of groupage services in Poland
Organic development of road service offering in China / India
Acquisition Grupo Eichenberg
Completion expected August 2011
Consolidation expected August/September 2011
1st Half-Year 2011 results July 18, 2011 Slide 19
Performance of Business Unit Road & Rail Logistics – 1st Half-Year
CHF million 2009 2010 2011 Variance Growth Acquisition FX Impact
Invoiced turnover 1'225 1'370 1'493 9.0% 14.2% 9.3% (14.5%)
Net Invoiced Turnover 1'153 1'261 1'347 6.8% 11.3% 10.1% (14.6%)
Gross profit 409 423 438 3.5% 10.2% 7.8% (14.4%)
EBITDA 19 29 27 (6.9%) 6.9%
EBITA (2) 11 11
EBIT (16) - (1)
EBIT / Revenue margin (1.3%) - (0.1%)
EBIT / GP Margin (3.9%) - (0.2%)

1st Half-Year 2011 results July 18, 2011 Slide 20
Contract Logistics

1st Half-Year 2011 results July 18, 2011 Slide 21
Contract Logistics: Highlights 1st Half-Year 2011
Net invoiced turnover (currency adjusted) increased by 5% (market growth 3%)
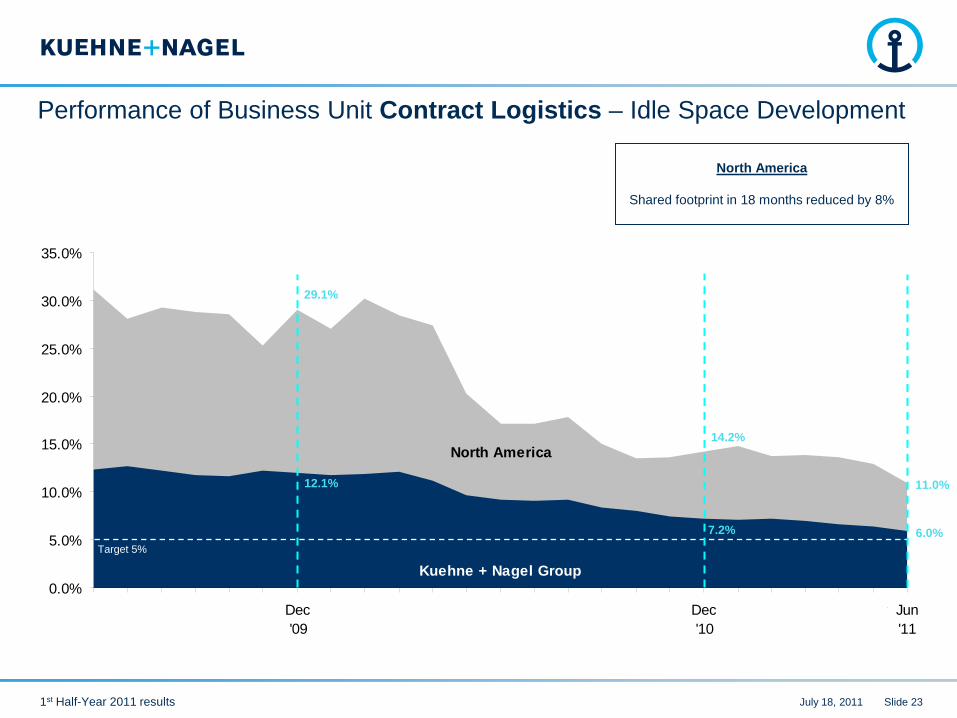
Idle space rate substantially reduced to 6% from 9% a year ago
Improvement of profitability (currency adjusted)
EBITDA growth of 6.5%
EBIT margin stable at 1.8%

1st Half-Year 2011 results July 18, 2011 Slide 22
Performance of Business Unit Contract Logistics – 1st Half-Year
CHF million 2009 2010 2011 Variance Growth Acquisition FX Impact
Invoiced turnover 2'153 2'165 2'060 (4.8%) 8.5% 0.1% (13.4%)
Net Invoiced Turnover 2'062 2'094 1'935 (7.6%) 5.3% 0.1% (13.0%)
Gross profit 1'568 1'566 1'475 (5.8%) 7.4% 0.1% (13.3%)
EBITDA 100 92 85 (7.6%) 6.5% - (14.1%)
EBITA 55 54 49
EBIT 36 38 37
EBITDA / Revenue margin 4.6% 4.2% 4.1%
EBIT / Revenue margin 1.7% 1.8% 1.8%
EBIT / GP Margin 2.3% 2.4% 2.5%
1st Half-Year 2011 results July 18, 2011 Slide 23
Performance of Business Unit Contract Logistics – Idle Space Development
North America
Kuehne + Nagel Group0.0%
5.0%
10.0%
15.0%
20.0%
25.0%
30.0%
35.0%
Jun'09
Jul'09
Aug'09
Sep'09
Oct'09
Nov'09
Dec'09
Jan'10
Feb'10
Mar'10
Apr'10
May'10
Jun'10
Jul'10
Aug'10
Sep'10
Oct'10
Nov'10
Dec'10
Jan'11
Feb'11
Mar'11
Apr'11
May'11
Jun'11
Target 5%
12.1%
29.1%
6.0%
14.2%
11.0%
7.2%
North America
Shared footprint in 18 months reduced by 8%

1st Half-Year 2011 results July 18, 2011 Slide 24
Agenda
Welcome & Highlights 1st Half Year 2011 | Gerard van Kesteren
Operating Review 1st Half Year 2011 | Reinhard Lange
Financial Review | Gerard van Kesteren
Outlook | Reinhard Lange

1st Half-Year 2011 results July 18, 2011 Slide 25
Financial Overview – Highlights 1st Half-YearCHF million 2009 2010 2011
Gross Profit 2'929 2'961 2'954
EBITDA 466 475 502
Earnings for the period 258 281 312
Cash & Cash Equivalents 639 792 684
Per share CHF
EPS (basic) 2.19 2.38 2.64
Equity % Total Assets 37.6% 37.2% 37.2%
Operational Cash Flow 445 473 505
Capex 164 58 89
ROCE 41% 37% 56%
1st Half-Year 2011 results July 18, 2011 Slide 26
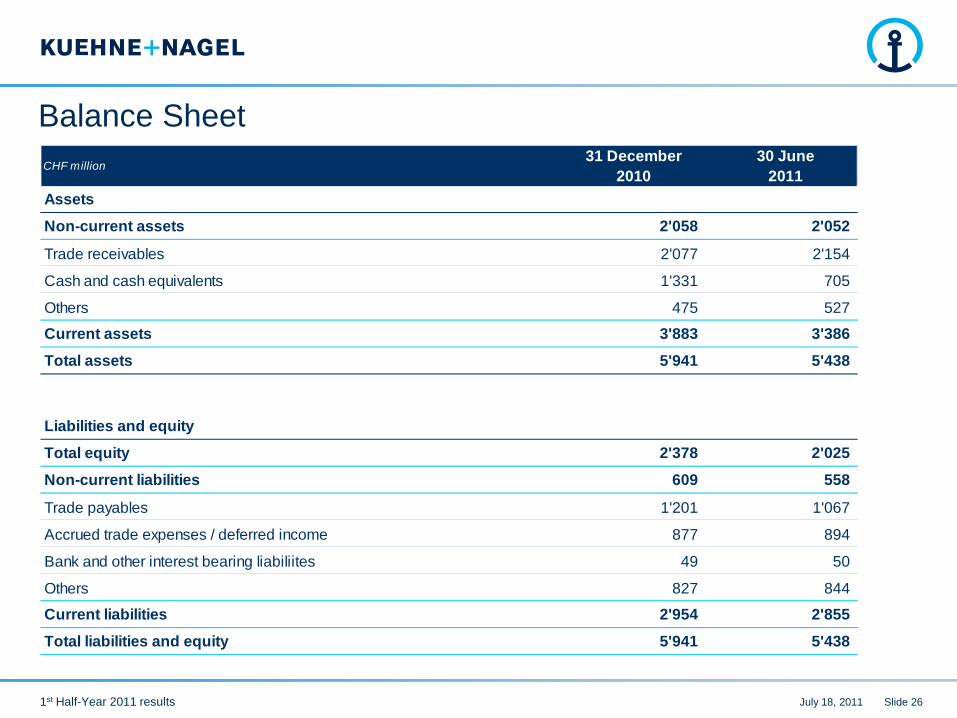
Balance SheetCHF million
31 December 2010
30 June2011
Assets
Non-current assets 2'058 2'052
Trade receivables 2'077 2'154
Cash and cash equivalents 1'331 705
Others 475 527
Current assets 3'883 3'386
Total assets 5'941 5'438
Liabilities and equity
Total equity 2'378 2'025
Non-current liabilities 609 558
Trade payables 1'201 1'067
Accrued trade expenses / deferred income 877 894
Bank and other interest bearing liabiliites 49 50
Others 827 844
Current liabilities 2'954 2'855
Total liabilities and equity 5'941 5'438

1st Half-Year 2011 results July 18, 2011 Slide 27
Cash Flow Statement – 1st Half-YearCHF million 2010 2011 Variance
Operational cash flow 473 505 32
Changes in working capital (255) (254) 1
Income taxes paid (70) (115) (45)
Cash flow from operating activities 148 136 (12)
Cash flow from investing activities (39) (201) (162)
Cash flow from financing activities (288) (512) (224)
Exchange difference on cash and cash equivalents - (54) (54)
Increase/(decrease) in cash and cash equivalents (179) (631) (452)
Cash and cash equivalents at the beginning of the period, net 971 1'315 344
Cash and cash equivalents at the end of the period, net 792 684 (108)
- Dividend payment (328)
- Distribution from CCR (179)
(507)
Shareholder Return 2011

1st Half-Year 2011 results July 18, 2011 Slide 28
Development of Working CapitalCHF million June 2010 Dec 2010 Mar 2011 Jun 2011
Trade receivables & Work in progress 2'702 2'387 2'508 2'454
Trade payables & Accrued trade expenses (2'024) (1'946) (1'887) (1'824)
Net Working Capital 678 441 621 630
KPI's:
Working Capital Intensity 3.4% 2.2% 3.2% 3.2%
DSO 41.7 37.8 42.3 40.1
DPO 49.8 48.0 51.3 46.9

1st Half-Year 2011 results July 18, 2011 Slide 29
Agenda
Welcome & Highlights 1st Half Year 2011 | Gerard van Kesteren
Operating Review 1st Half Year 2011 | Reinhard Lange
Financial Review | Gerard van Kesteren
Outlook | Reinhard Lange

1st Half-Year 2011 results July 18, 2011 Slide 30
Outlook 2011
Seafreight(TEU)
10-12%
Airfreight (Tons)
10-15%
Road & Rail Logistics
(Net Invoiced TO)15%
Contract Logistics
(Net Invoiced TO)7%
5-6%
<2%
4%
3%
Kuehne + Nagel Market
1st Half-Year 2011 results July 18, 2011 Slide 31
Upcoming Events 2011
Investor’s Day 14 September 2011 / London
Nine-months results
17 October 2011

1st Half-Year 2011 results July 18, 2011 Slide 32
Annex I: Key Data Sheet Half-Year 2011-2010CHF million
Q1 Q2 TOTAL Q1 Q2 TOTAL Q1 Q2 TOTAL Q1 Q2 TOTALSeafreightTurnover 2'071 2'065 4'136 1'992 2'313 4'305 +4.0 (10.7) (3.9) 79 (248.0) (169.0)Gross Profit 312 313 625 285 306 591 +9.5 +2.3 +5.8 27 7.0 34.0Total Expenses (200) (205) (405) (188) (199) (387) (6.4) (3.0) (4.7) (12) (6.0) 18.0EBITDA 112 108 220 97 107 204 +15.5 +0.9 +7.8 15 1.0 16.0EBIT 107 103 210 90 100 190 +18.9 +3.0 +10.5 17 3.0 20.0GP / Turnover 15.1% 15.2% 15.1% 14.3% 13.2% 13.7%EBITDA / Turnover 5.4% 5.2% 5.3% 4.9% 4.6% 4.7%EBIT / GP 34.3% 32.9% 33.6% 31.6% 32.7% 32.1%Volume (TEU's '000) 754 825 1'579 659 753 1'412 +14.4 +9.6 +11.8 95 72.0 167.0GP 414 379 396 432 406 419 (4.2) (6.7) (5.5) (18) (27.0) (23.0)EXPENSES per TEU (272) (255) (263) (296) (274) (284) +8.1 +6.9 +7.4 24 (19.0) (21.0)EBIT 142 124 133 136 132 135 +4.4 (6.1) (1.5) 6 (8.0) (2.0)AirfreightTurnover 994 1'039 2'033 873 1'067 1'940 +13.9 (2.6) +4.8 121 (28.0) 93.0Gross Profit 195 201 396 171 188 359 +14.0 +6.9 +10.3 24 13.0 37.0Total Expenses (132) (135) (267) (122) (132) (254) (8.2) (2.3) (5.1) (10) (3.0) 13.0EBITDA 63 66 129 49 56 105 +28.6 +17.9 +22.9 14 10.0 24.0EBIT 59 62 121 44 53 97 +34.1 +17.0 +24.7 15 9.0 24.0GP / Turnover 19.6% 19.3% 19.5% 19.6% 17.6% 18.5%EBITDA / Turnover 6.3% 6.4% 6.3% 5.6% 5.2% 5.4%EBIT / GP 30.3% 30.8% 30.6% 25.7% 28.2% 27.0%Volume (TON's '000) 259 274 533 214 239 453 +21.0 +14.6 +17.7 45 35.0 80.0GP 75 73 74 80 79 79 (6.3) (7.6) (6.3) (5) (6.0) (5.00)EXPENSES per 100kg (53) (51) (52) (59) (56) (58) +10.2 +8.9 +10.3 6 (5.0) (6.00)EBIT 22 22 22 21 23 21 +4.8 -4.3 +4.8 1 (1.0) 1.00
Variance in CHF million 2011 / 20102011 2010 2011 / 2010 Change in %

1st Half-Year 2011 results July 18, 2011 Slide 33
Annex I: Key Data Sheet Half-Year 2011-2010CHF million
Q1 Q2 TOTAL Q1 Q2 TOTAL Q1 Q2 TOTAL Q1 Q2 TOTALRoad & Rail LogisticsTurnover 681 812 1'493 646 724 1'370 +5.4 +12.2 +9.0 35 88.0 123.0Gross Profit 201 237 438 206 217 423 (2.4) +9.2 +3.5 (5) 20.0 15.0Total Expenses (188) (223) (411) (192) (202) (394) +2.1 (10.4) (4.3) 4 (21.0) 17.0EBITDA 13 14 27 14 15 29 (7.1) (6.7) (6.9) (1) (1.0) (2.0)EBIT 1 (2) (1) (1) 1 0 +200.0 (300.0) (100.0) 2 (3.0) (1.0)GP / Turnover 29.5% 29.2% 29.3% 31.9% 30.0% 30.9%EBITDA / Turnover 1.9% 1.7% 1.8% 2.2% 2.1% 2.1%EBIT / Turnover 0.1% -0.2% -0.1% -0.2% 0.1% 0.0%Contract Logistics Turnover 1'044 1'016 2'060 1'061 1'104 2'165 (1.6) (8.0) (4.8) (17) (88.0) (105.0)Gross Profit 741 734 1'475 770 796 1'566 (3.8) (7.8) (5.8) (29) (62.0) (91.0)Total Expenses (700) (690) (1'390) (725) (749) (1'474) +3.4 +7.9 +5.7 25 59.0 (84.0)EBITDA 41 44 85 45 47 92 (8.9) (6.4) (7.6) (4) (3.0) (7.0)EBIT 15 22 37 18 20 38 (16.7) +10.0 (2.6) (3) 2.0 (1.0)GP / Turnover 71.0% 72.2% 71.6% 72.6% 72.1% 72.3%EBITDA / Turnover 3.9% 4.3% 4.1% 4.2% 4.3% 4.2%EBIT / Turnover 1.4% 2.2% 1.8% 1.7% 1.8% 1.8%Real Estate Turnover 0 1 1 1 2 3 (100.0) (50.0) (66.7) (1) (1.0) (2.0)Gross Profit 0 1 1 1 2 3 (100.0) (50.0) (66.7) (1) (1.0) (2.0)Total Expenses 16 14 30 17 16 33 (5.9) (12.5) +9.1 (1) (2.0) 3.0EBITDA 16 15 31 18 18 36 (11.1) (16.7) (13.9) (2) (3.0) (5.0)EBIT 10 9 19 11 12 23 (9.1) (25.0) (17.4) (1) (3.0) (4.0)Insurance Broker Turnover 30 33 63 31 35 66 (3.2) (5.7) (4.5) (1) (2.0) (3.0)Gross Profit 9 10 19 9 10 19 +0.0 +0.0 +0.0 0 0.0 0.0Total Expenses (5) (4) (9) (4) (6) (10) (25.0) +33.3 +10.0 (1) 2.0 (1.0)EBITDA 4 6 10 5 4 9 (20.0) +50.0 +11.1 (1) 2.0 1.0EBIT 4 6 10 5 4 9 (20.0) +50.0 +11.1 (1) 2.0 1.0GP / Turnover 30.0% 30.3% 30.2% 29.0% 28.6% 28.8%EBITDA / Turnover 13.3% 18.2% 15.9% 16.1% 11.4% 13.6%EBIT / Turnover 13.3% 18.2% 15.9% 16.1% 11.4% 13.6%TOTAL GROUPTurnover 4'820 4'966 9'786 4'604 5'245 9'849 +4.7 (5.3) (0.6) 216 (279.0) (63.0)Gross Profit 1'458 1'496 2'954 1'442 1'519 2'961 +1.1 (1.5) (0.2) 16 (23.0) (7.0)Total Expenses (1'209) (1'243) (2'452) (1'214) (1'272) (2'486) +0.4 +2.3 +1.4 5 29.0 (34.0)EBITDA 249 253 502 228 247 475 +9.2 +2.4 +5.7 21 6.0 27.0EBIT 196 200 396 167 190 357 +17.4 +5.3 +10.9 29 10.0 39.0EBT 196 202 398 167 191 358 +17.4 +5.8 +11.2 29 11.0 40.0Net Earnings 154 158 312 131 150 281 +17.6 +5.3 +11.0 23 8.0 31.0GP / Turnover 30.2% 30.1% 30.2% 31.3% 29.0% 30.1%EBITDA / Turnover 5.2% 5.1% 5.1% 5.0% 4.7% 4.8%EBIT / Turnover 4.1% 4.0% 4.0% 3.6% 3.6% 3.6%EBT / Turnover 4.1% 4.1% 4.1% 3.6% 3.6% 3.6%Net Earnings / Turnover 3.2% 3.2% 3.2% 2.8% 2.9% 2.9%
Variance in CHF million 2011 / 20102011 2010 2011 / 2010 Change in %

1st Half-Year 2011 results July 18, 2011 Slide 34
Annex II: Annualised Impact - Acquisitions 2011 Cooltainer
New Zealand RH Freight
United Kingdom Perishables
Colombia & Ecuador Grupo Eichenberg
Brazil Apr 2011 Apr 2011 Jan 2011 Aug 2011
Business Unit
External turnover 37 170 78 160
Gross Profit 13 54 8 40
EBITDA 6 3 3 8
Employees 45 630 160 700
TEUs / TONs in '000 17 72
Additional amortisation of intangibles (2011 Estimate) 3 5 2 4
in CHF million
Road & Rail(predominantly) Seafreight Road & Rail Airfreight
1st Half-Year 2011 results July 18, 2011 Slide 35
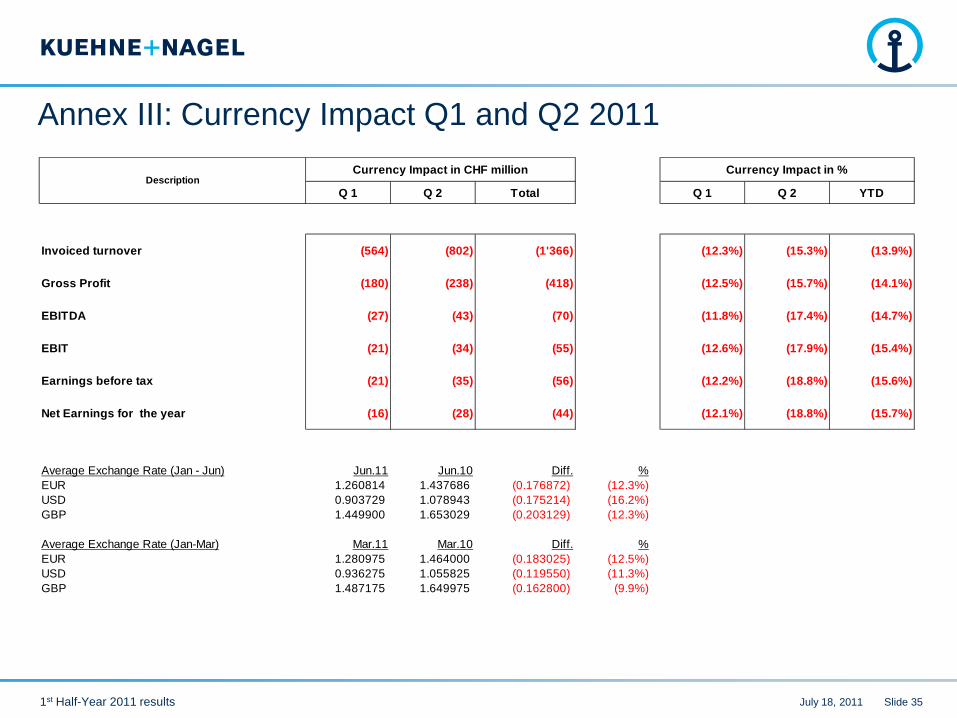
Annex III: Currency Impact Q1 and Q2 2011
Q 1 Q 2 Total Q 1 Q 2 YTD
Invoiced turnover (564) (802) (1'366) (12.3%) (15.3%) (13.9%)
Gross Profit (180) (238) (418) (12.5%) (15.7%) (14.1%)
EBITDA (27) (43) (70) (11.8%) (17.4%) (14.7%)
EBIT (21) (34) (55) (12.6%) (17.9%) (15.4%)
Earnings before tax (21) (35) (56) (12.2%) (18.8%) (15.6%)
Net Earnings for the year (16) (28) (44) (12.1%) (18.8%) (15.7%)
Average Exchange Rate (Jan - Jun) Jun.11 Jun.10 Diff. %EUR 1.260814 1.437686 (0.176872) (12.3%)USD 0.903729 1.078943 (0.175214) (16.2%)GBP 1.449900 1.653029 (0.203129) (12.3%)
Average Exchange Rate (Jan-Mar) Mar.11 Mar.10 Diff. %EUR 1.280975 1.464000 (0.183025) (12.5%)USD 0.936275 1.055825 (0.119550) (11.3%)GBP 1.487175 1.649975 (0.162800) (9.9%)
DescriptionCurrency Impact in CHF million Currency Impact in %

Thank you for your attention.

1st Half-Year 2011 results July 18, 2011 Slide 37
Disclaimer
Investing in the shares of Kuehne + Nagel International AG involves risks. Prospective investors are strongly requested to consult their investment advisors and tax advisors prior toinvesting in shares of Kuehne + Nagel International AG.This document contains forward-looking statements which involve risks and uncertainties. Thesestatements may be identified by such words as “may”, “plans”, “expects”, “believes” and similarexpressions, or by their context. These statements are made on the basis of current knowledge andassumptions. Various factors could cause actual future results, performance or events to differ materiallyfrom those described in these statements. No obligation is assumed to update any forward-lookingstatements. Potential risks and uncertainties include such factors as general economic conditions, foreignexchange fluctuations, competitive product and pricing pressures and regulatory developments.The information contained in this document has not been independently verified and no representation orwarranty, express or implied, is made to, and no reliance should be placed on, the fairness, accuracy,completeness or correctness of the information or opinions contained herein. The information in thispresentation is subject to change without notice, it may be incomplete or condensed, and it may notcontain all material information concerning the Kuehne + Nagel Group. None of Kuehne + NagelInternational AG or their respective affiliates shall have any liability whatsoever for any loss whatsoeverarising from any use of this document, or otherwise arising in connection with this document.This presentation is not an offer of securities for sale in the United States. The offer and sale of Kuehne +Nagel International AG securities has not been, and will not be registered under the United StatesSecurities Act of 1933, as amended. Kuehne + Nagel International AG securities may not be offered orsold to anyone in the United States absent such registration, except pursuant to an appropriate exemptionfrom registration. There will be no public offering of Kuehne + Nagel International AG securities in theUnited States.


![Basel, March 2007 - BC) 2 · PDF fileBasel, March 2007 Dear USGEB / [BC]2 participant, ... Carl Zeiss AG, Feldbach ... Macherey-Nagel AG, Oensingen](https://img.dokumen.tips/doc/110x75/5abe73597f8b9a5d718cfe7b/basel-march-2007-bc-2-march-2007-dear-usgeb-bc2-participant-carl-zeiss.jpg)


