Embed Size (px)
Citation preview
1
KTH Production Engineering and Management
Applying Modular Function Deployment (MFD) to software architecture
Jasmin BAHTIJAREVIC Matthieu Emmanuel DE MURCIA E PAES
Stockholm 2014
School of Industrial Engineering and Management
2
Abstract
Background With this master thesis, the authors wanted to verify if Modular Function Deployment (MFD) was applicable to other areas of knowledge than the traditional production industry. Namely, the authors tried to see if the benefits arising from MFD (more flexible and rational product structure) could be transposed to services and/or IT development. More specifically, the authors hope to provide a novel more systematic approach to software architecture when developers are confronted to new challenges and that there are no pre-existing solutions available. In order to verify the hypothesis that MFD can be extended to other domains of expertise, the authors realized a case-study with company Z, who commercializes a sports book solution for online betting.
Objective Due to the short timespan available for this study, the authors decided to only verify whether the first two steps of MFD, voice of the customer and voice of the engineer, could be successfully implemented in software architecture. This gave rise to two objectives: 1) give the company another input on how to target the different market segments and 2) give the company another input regarding their product’s architecture.
Method The authors first researched the actual literature on modularization and software architecture. Then they followed the procedure described in the first two steps of MFD with a few modifications to better suit the needs of software. Most of the data was gathered through meetings of the authors’ design and this information was then inserted in PALMATM, a piece of software for applying MFD.
Results The results consist of graphs and tables provided by PALMATM following the data inserted in it. The method successfully indicated distinct approaches for each of the market segments targeted by company Z. The results regarding the second objective were more mitigated.
Conclusions The application of MFD to software architecture seems promising. With this paper, the authors suggested a new more systematic way to approach software architecture that could prove to be an interesting alternative when considering one-of-a-kind problems or problems that cannot be answered by existing solutions. However, work still has to be done regarding the remaining three steps of MFD.

3
Acknowledgements
We would like to express our deepest appreciation to all those who provided us with the opportunity to realize this project. The list of people who contributed with their time, experience or simply encouragement is huge, and we are grateful to all of you. In those few lines, we would like to take some time to thank those whose participation, help and collaboration was crucial in ensuring the smooth execution of the project.
We are especially thankful to our supervisor, Mr. Antonio Maffei, whose suggestions, encouragements and experience proved invaluable during those six months.
Apart from our own efforts, the success of this project depended largely on the encouragement and guidelines of many others. We take this opportunity to express our gratitude to the people at Kambi Sport Solutions who have been instrumental in the successful completion of this project. We would like to show our greatest appreciation to Manasak Bantalapichai and Erik Lögdberg. We can’t say thank you enough for your tremendous support and help. We felt motivated and encouraged every time we had meetings with you. Without your encouragement and guidance this project would not have materialized.
The guidance and support received from Modular Management who contributed and who are contributing to this thesis, was vital for the success of the project. We are grateful for their constant support and help. A special thought to Gustav Grenås who put us in contact with Kambi and whose watchful eye and advice were essential to the quality of our results.
Sincerely,
Matthieu Paes & Jasmin Bahtijarevic
4
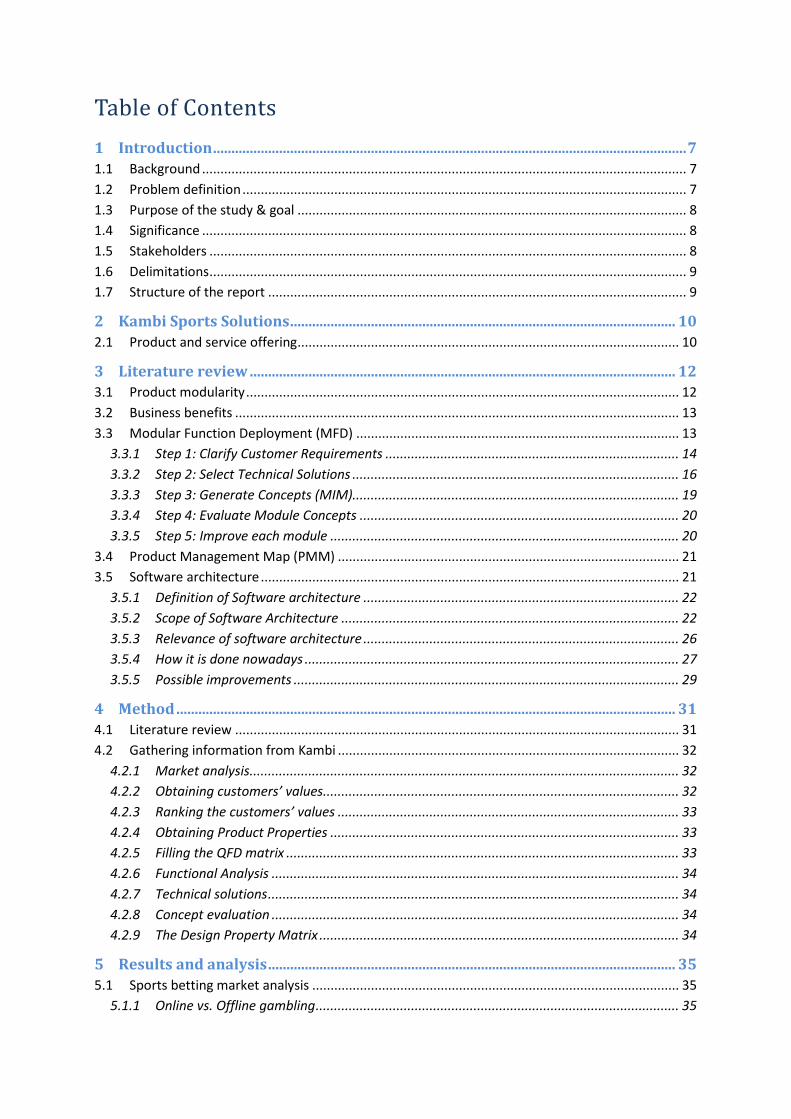
Table of Contents
1 Introduction ................................................................................................................................. 7 1.1 Background .................................................................................................................................... 7 1.2 Problem definition ......................................................................................................................... 7 1.3 Purpose of the study & goal .......................................................................................................... 8 1.4 Significance .................................................................................................................................... 8 1.5 Stakeholders .................................................................................................................................. 8 1.6 Delimitations .................................................................................................................................. 9 1.7 Structure of the report .................................................................................................................. 9
2 Kambi Sports Solutions ......................................................................................................... 10 2.1 Product and service offering ........................................................................................................ 10
3 Literature review .................................................................................................................... 12 3.1 Product modularity ...................................................................................................................... 12 3.2 Business benefits ......................................................................................................................... 13 3.3 Modular Function Deployment (MFD) ........................................................................................ 13
3.3.1 Step 1: Clarify Customer Requirements ................................................................................ 14 3.3.2 Step 2: Select Technical Solutions ......................................................................................... 16 3.3.3 Step 3: Generate Concepts (MIM)......................................................................................... 19 3.3.4 Step 4: Evaluate Module Concepts ....................................................................................... 20 3.3.5 Step 5: Improve each module ............................................................................................... 20
3.4 Product Management Map (PMM) ............................................................................................. 21 3.5 Software architecture .................................................................................................................. 21
3.5.1 Definition of Software architecture ...................................................................................... 22 3.5.2 Scope of Software Architecture ............................................................................................ 22 3.5.3 Relevance of software architecture ...................................................................................... 26 3.5.4 How it is done nowadays ...................................................................................................... 27 3.5.5 Possible improvements ......................................................................................................... 29
4 Method ........................................................................................................................................ 31 4.1 Literature review ......................................................................................................................... 31 4.2 Gathering information from Kambi ............................................................................................. 32
4.2.1 Market analysis ..................................................................................................................... 32 4.2.2 Obtaining customers’ values................................................................................................. 32 4.2.3 Ranking the customers’ values ............................................................................................. 33 4.2.4 Obtaining Product Properties ............................................................................................... 33 4.2.5 Filling the QFD matrix ........................................................................................................... 33 4.2.6 Functional Analysis ............................................................................................................... 34 4.2.7 Technical solutions ................................................................................................................ 34 4.2.8 Concept evaluation ............................................................................................................... 34 4.2.9 The Design Property Matrix .................................................................................................. 34
5 Results and analysis ............................................................................................................... 35 5.1 Sports betting market analysis .................................................................................................... 35
5.1.1 Online vs. Offline gambling ................................................................................................... 35

5
5.1.2 Steady growth rate ............................................................................................................... 35 5.2 MFD – Step one ........................................................................................................................... 36
5.2.1 Market Segmentation ........................................................................................................... 36 5.2.2 Customer values .................................................................................................................... 37 5.2.3 Customer & end user value ranking ...................................................................................... 39 5.2.4 Product properties ................................................................................................................ 42 5.2.5 QFD matrix ............................................................................................................................ 44
5.3 MFD – Step two ........................................................................................................................... 47 5.3.1 Functional analysis ................................................................................................................ 47 5.3.2 Technical solutions ................................................................................................................ 48 5.3.3 Design Property Matrix (DPM) .............................................................................................. 49
6 Critical view over the project.............................................................................................. 53 6.1 Market segmentation .................................................................................................................. 53
6.1.1 Discussion on the method ..................................................................................................... 53 6.2 Customer values .......................................................................................................................... 53
6.2.1 Discussion on the method ..................................................................................................... 53 6.2.2 Discussion on the result ........................................................................................................ 54
6.3 Ranking of customer values ......................................................................................................... 54 6.3.1 Discussion on the method ..................................................................................................... 54 6.3.2 Discussion on the results ....................................................................................................... 55
6.4 Obtaining product properties ...................................................................................................... 55 6.4.1 Discussion on the method ..................................................................................................... 55
6.5 Filling the QFD matrix .................................................................................................................. 55 6.6 Functional analysis ....................................................................................................................... 55 6.7 Concept Evaluation ...................................................................................................................... 55
7 Discussion and Final words ................................................................................................. 56 7.1 Answering RQ1 ............................................................................................................................ 56 7.2 Answering RQ2 ............................................................................................................................ 56 7.3 Verifying hypothesis .................................................................................................................... 58
8 Bibliography ............................................................................................................................. 60
9 Appendices ................................................................................................................................ 62
6
List of Tables
Table 1: Kambi's sports book solution ................................................................................................... 11 Table 2: Example of module drivers ....................................................................................................... 20 Table 3: Customer values .......................................................................................................................... 38 Table 4: End user values ........................................................................................................................... 39 Table 5: Order winners per segment ....................................................................................................... 40 Table 6: Weight of each customer value ................................................................................................. 41 Table 7: Product properties ...................................................................................................................... 42 Table 8: Product properties ...................................................................................................................... 43 Table 9: Product properties ...................................................................................................................... 44 Table 10: Resulting functions ................................................................................................................... 48 Table 11: Functions and their technical solution ................................................................................... 49 Table 12: Potential modules...................................................................................................................... 52
List of Figures
Figure 1: Project's stakeholders .................................................................................................................. 8 Figure 2: Project's mind map .................................................................................................................... 12 Figure 4: The five steps of MFD ............................................................................................................. 13 Figure 3: Strategy axis ................................................................................................................................ 14 Figure 5: Life Cycle Analysis ..................................................................................................................... 15 Figure 6: Connecting CV with PP ........................................................................................................... 16 Figure 7: QFD matrix ................................................................................................................................ 16 Figure 8: On the right top-down analysis and on the left buttom-up ................................................ 17 Figure 9: Pugh matrix example ................................................................................................................. 18 Figure 10: Strength of relationship in the DPM matrix ........................................................................ 18 Figure 11: Example of a DPM matrix ..................................................................................................... 19 Figure 12: The simplified MFD methodology framework ................................................................... 21 Figure 13: Software architecture and system architecture .................................................................... 24 Figure 14: Relationship of functional requirements .............................................................................. 25 Figure 15: The project’s framework ........................................................................................................ 31 Figure 16: The GGR in billions of euros and the GGR by product .................................................. 35 Figure 17: Growth rate of the european interactive gaming market .................................................. 36 Figure 18: Ranking of the customer values per segment ...................................................................... 39 Figure 19: CV - Trends, weight and order winners ............................................................................... 41 Figure 20: QFD matrix for operators ...................................................................................................... 46 Figure 21: Product property scores for operators ................................................................................. 47 Figure 22: DPM matrix .............................................................................................................................. 50 Figure 23: Score of technical solutions ................................................................................................... 51 Figure 24: Modularized client ................................................................................................................... 57

7
1 Introduction
1.1 Background The economic environment is evolving and becoming less predictable as the competition increases between companies and as customers gets more exigent. Consequently, it becomes vital for companies to match and go beyond what is expected of them in order to expand their customer base. Firms are thus confronted to a double challenge: to expand and acquire new markets while at the same time satisfying the existing ones leading to large catalogues of products in order to satisfy the whole range of customers. However, if not carefully planned, costs can increase sharply; a wide product range and customized solutions often mean high component complexity, which further leads to long development times and high inventory costs. Modularization is an answer to those issues. It “[... is the decomposition of a product into building blocks [...]” also known as modules (Erixon 1998). Modules do not only represent a function of a product but they actually answer a set of customer requirements. The objective being to reduce dependencies across the structure and their independency makes it easier to update and change modules when necessary. But maybe more important is that modularization requires careful analysis in the early steps of the product development, which acts as a safety net against costly precipitation.
Modular Function Deployment (MFD) is a method to decompose a product into modules and develop flexible product architectures. It aims to find the balance between customer satisfaction and business strategy. MFD’s attractiveness is due to its multi-level impact on a production system. By increasing internal cooperation it aims to increase customer understanding and satisfaction, therefore to provide more relevant products. At the same time MFD allows for an optimized distribution of resources by identifying those modules that need development in the future and those that do not. Furthermore, the methodology also indicates the modules that are common to all of the different market segments, in turn this allows the company to know where investment is required and valued by customers.
1.2 Problem definition In one hand, to the extent of the authors’ knowledge, the MFD methodology has only been applied to physical products, never on software. On the other hand modularization is something common both in the traditional industry as well as in software development. Indeed in a traditional software development process, the software engineer first decomposes the product in different areas of knowledge and then works its way down in the structure. This could be called a top-down approach. What MFD could bring is a more systematic way to find modules when there is no previous experience in answering a specific problem. Hence MFD could be considered as a bottom-up approach to software development as this will be detailed in the literature review part.
Consequently, focus on this project will be on interdisciplinary applications of modularization. More specifically the authors are interested in finding how MFD could be adapted to answer software development needs.

8
1.3 Purpose of the study & goal This project will investigate the potential applicability of MFD to software. Hopefully, this will set the base for the expansion of the MFD method to other fields, such as services and software. For the purpose of this study a collaboration was started with Kambi Sport Solutions. This gives rise to two objectives:
• RQ1: through MFD, give Kambi another input on how to approach the different market segments; and
• RQ2: use MFD to give Kambi another input on their product architecture based on customers’ needs.
The main hypothesis being that MFD can successively be applied to software architecture.
1.4 Significance Existing literature on software architecture presented little resources on how to proceed when a software engineer is confronted to a solution that has never been tackled before. The common strategy consists of always trying to find similar problems and adapting their solutions. However when confronting an original challenge those guiding lines were vaguer and offered no clear procedure. Even though the success and efficiency of the software industry is not in question, could not the industry benefit from a more systematic approach of generation of modules? Here modules are not considered as code blocks but as a group of functions that are influenced by common parameters. This research would act as a first step to such an approach. Hopefully this could rise the interest on the topic, attract more research and challenge for the better the existing view on the module generation process.
1.5 Stakeholders In this project there are four identified stakeholders. Figure 1 shows the relationships and interest of each party.
Figure 1: Project's stakeholders

9
To understand and study the necessary changes to MFD, a collaboration has been started with Kambi and Modular Management.
Kambi is an online sports betting company, who offers its services to gambling platforms such as Unibet, 888 and Paf, among others. Kambi expressed interest in this methodology especially in having another input in their targeting strategy of different market segments and on how smart variance of their product could affect this. Modular Management is a management consulting company that originated from KTH; as the developer of MFD their interest lies in knowing the potential applications of MFD to other fields of knowledge.
1.6 Delimitations This project will not consider the following:
• Step three to five of MFD; • The offline gambling market; • The products that are not covered by Kambi: casino, bingo and poker; • Modular programming and all of the IT areas exterior to software architecture; • Coding; and • The technical requirements for the software to work, such as hardware considerations
and requirements linked to some specific technology;
1.7 Structure of the report The reader will find the report organized in the following way. The second part of the report will be dedicated to a small presentation of the company with which the authors collaborated. The literature review part presents the theoretical background necessary to apprehend this paper. It will first consider modularization as a theory and in a second time it will discuss about software architecture. In the method part, the authors detailed how they proceeded in gathering information during the different steps of the project and also the different steps necessary in obtaining the results. The result part contain the data obtained through the PALMATM software, as well as the analysis of those results in order to answer the research questions. The critical overview part discusses the limitations identified by the authors during the project The discussion part answers the research questions and the hypothesis.
10
2 Kambi Sports Solutions Kambi was established in 2010 as an independent subsidiary of Unibet in order to meet the demand for Business-to-Business (B2B) sports betting services. Kambi aims to provide the best sports betting service targeting entrepreneurs and national lotteries. By being a part of Kambi’s infrastructure, the operator can solely focus on marketing to drive revenues (Kambi Group plc, 2014).
The demand for this solution is being driven by the request from Business-to-Customer (B2C) operators to have a seamless experience across all range of devices, such as mobile (both Google and Apple devices), desktop and retail terminals. This leads to high run and development costs that cannot be disregarded. Furthermore, the market is complex due to constant re-regulations and so far, every authority that has regulated online gaming has had different requirements, which leads to changes of the product in order to be able to operate in specific markets (Kambi Group plc, 2014).
Kambi’s model is unique in the market and has proven to be successful trough signings of a number of high profile operators and is now, through its independence from Unibet, well positioned to take advantage of the growing demand for fully managed sports betting services. Their current client portfolio consists of twelve operators located in different geographical areas. Three out of Kambi’s twelve operators are considered to be among the top 20 Sports betting provider according to eGaming Review’s Power (eGaming Review, 2013).
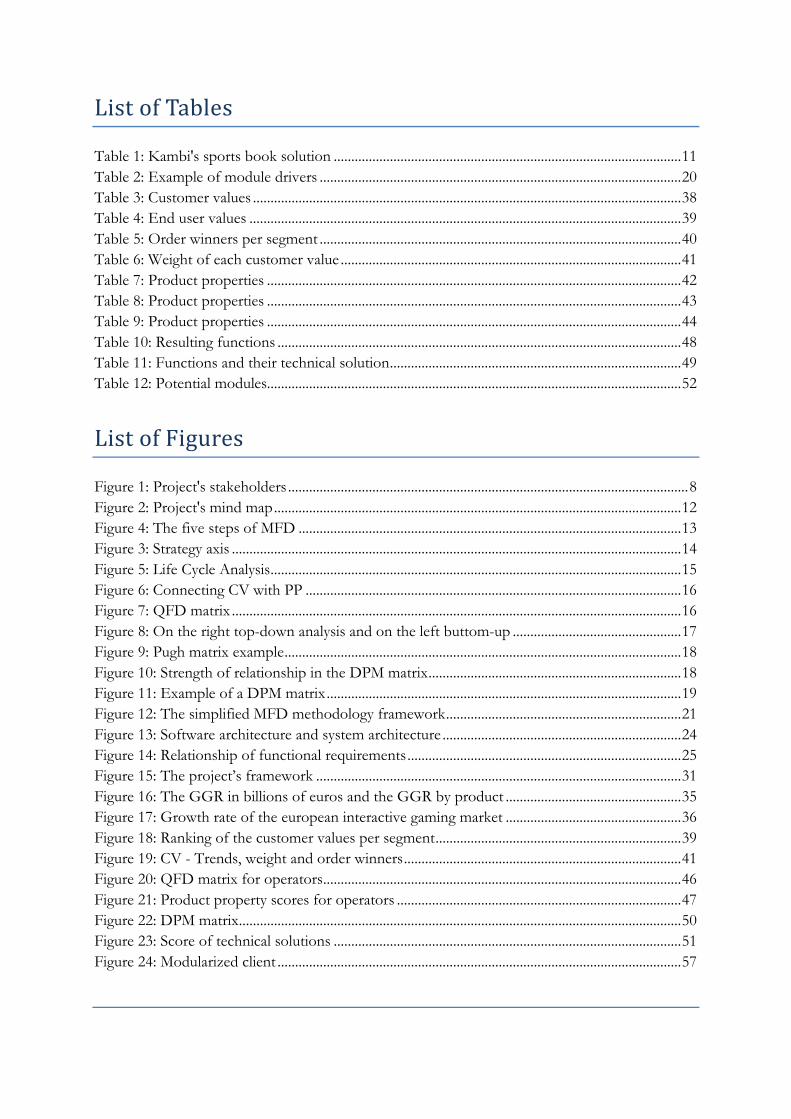
2.1 Product and service offering Kambi offers a fully managed sport book solution. Fully managed means that their customers will be provided a personalized front-end client, odds compiling by traders and a risk management solution to optimize bet margins. The front-end client is what the end-users will experience when they browse to one of Kambi’s customers and is shown for three operators in Table 1 on the next page. The variants offered in the front-end client today are restricted to the font type and size, color style and customizable widgets. Widgets are controllable “boxes” where the operator can put any content they like, but are however mostly used to present advertisement. These can then be placed on different places of the webpage. The API is open for the operators, meaning that it is possible to add extra content on top of Kambi’s layer. However, major modifications are done on request and completely handled by Kambi (Kambi, 2014).
11
Uni
bet
Paf
888S
port
Table 1: Kambi's sports book solution Source: Kambi

12
3 Literature review Following section presents the theoretical background necessary to apprehend this paper. It will first consider modularization as a theory and in a second time it will discuss about software architecture. Figure 2 shows how the literature review is related to the project goals.
Figure 2: Project's mind map
3.1 Product modularity This section will provide a distinction between the concepts of modularization and
modularity. It will also explain how a modular architecture is beneficial for the business.
The terms module, modularization and modularity are well known both in the academia and the industry. Nonetheless, it’s difficult to find an explicit, unambiguous definition of the various terms. Gunnar Erixon and Roger Stake (Erixon & Stake 2013) state in their booklet that it is still common for different authors to define modules and modularity in different ways. However, Gunnar Erixon (Erixon 1998) defines modularization as:
“Modularization is the decomposition of a product into building blocks (modules) with specified interfaces, driven by company-specific reasons”
Modular Management (Modular Management 2013) uses a similar definition for modules:
“A module is a functional building block with specified and standardized interfaces, chosen for company specific strategic reasons”
These definitions contain three important terms: functional building blocks, standardized interfaces and company strategy. The functional building block should answer which functions, features and options a product should provide. Standardized interfaces should describe where in
13
the design, while the business strategy will impact module creation and their characteristics (base, development…) (Modular Management 2013).
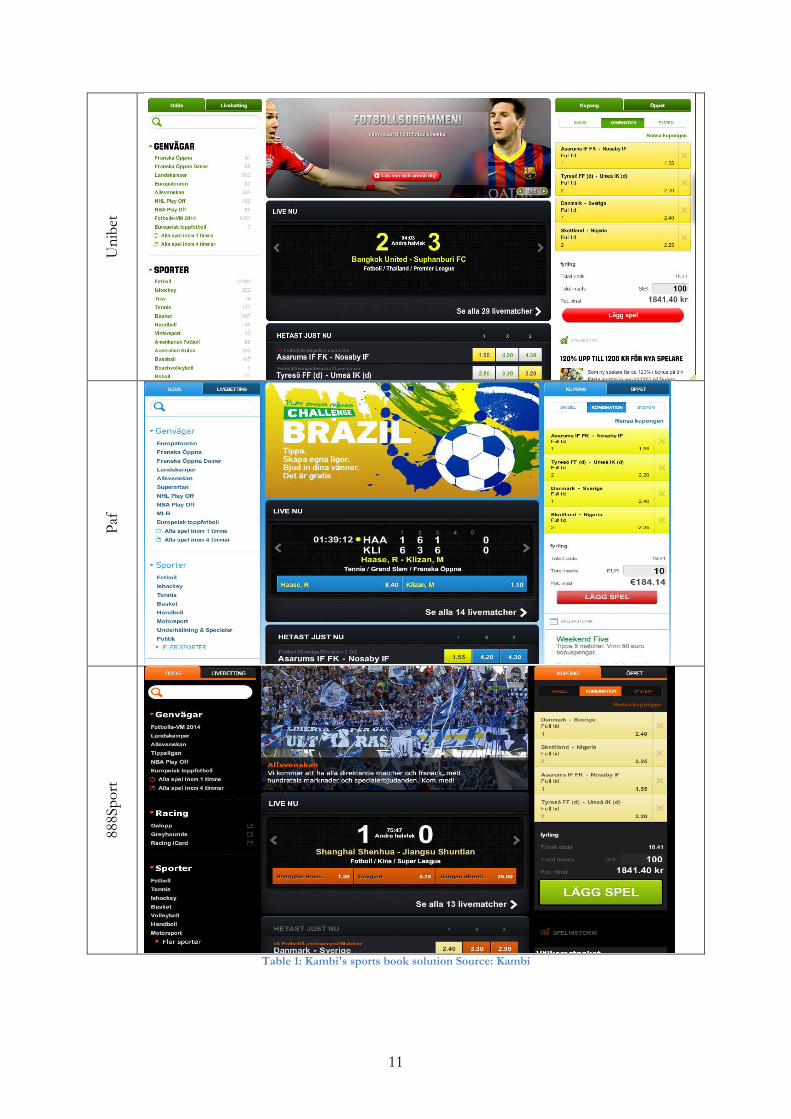
3.2 Business benefits Michael Treacy and Fred Wiersema (Treacy & Wiersema 1997) claims that there are three main competitive strategies to follow; operational excellence, product leadership and customer intimacy; these are illustrated in the strategic axis in Figure 3. In one hand, companies that strive for operational excellence look for economies of scale and efficiency. Usually, this leads to a restricted number of standard solutions offered to all the customers. On the other hand, companies aiming for customer intimacy focus on the customers and in tailor made solutions. The last business value, product leadership, means that the business strives for innovation, product features and product performance. However, the authors further discuss that improving in one direction makes the other two suffer. According to Modular management (Modular management 2013), modularization can help, from a strategic point of view, the organization grow in all directions the same time. This means that modules that are important and difficult to design can be developed independently, modules that give variance can be substituted, and modules with high development costs can be produced where it is most effective
The next section will describe the method Modular Function Deployment (MFD) that is used to suggest modules out of Kambi’s product architecture.
3.3 Modular Function Deployment (MFD) This section will describe all the steps included in the MFD, however as previously mentioned, this thesis will only examine the first two steps. The remaining steps are described to give the reader an understanding of the whole method and its features.
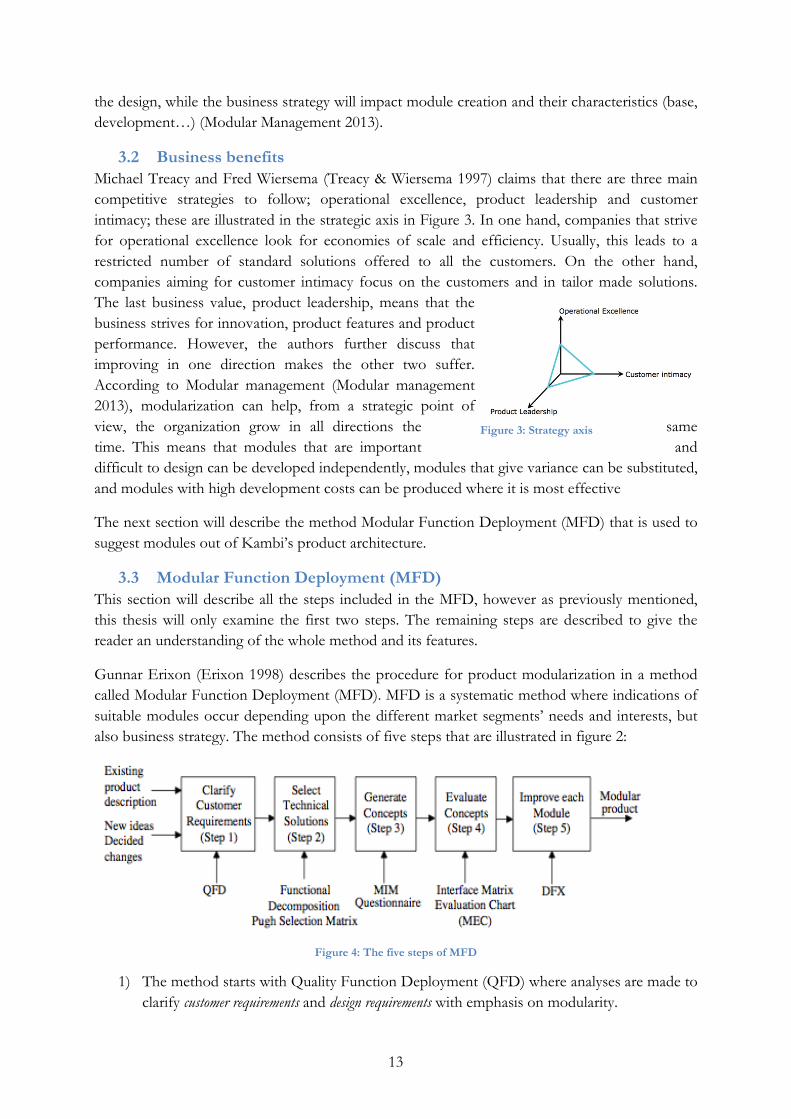
Gunnar Erixon (Erixon 1998) describes the procedure for product modularization in a method called Modular Function Deployment (MFD). MFD is a systematic method where indications of suitable modules occur depending upon the different market segments’ needs and interests, but also business strategy. The method consists of five steps that are illustrated in figure 2:
Figure 4: The five steps of MFD
1) The method starts with Quality Function Deployment (QFD) where analyses are made to clarify customer requirements and design requirements with emphasis on modularity.
Figure 3: Strategy axis
14
2) Consequently, analyses are made on functional requirements off the product and technical solutions are chosen.
3) Subsequently, modular concepts are generated in which the Modular Indication Matrix (MIM) is used to identify modules by analyzing the correlation between module drivers and technical solutions.
4) Then, evaluate which of the new concepts that should be selected and estimate the resulting effects in order to compare it with the earlier situation.
5) Finally, improve each module (Erixon 1998).
Those steps might give the impression that MFD is a strict procedure to follow while it is an iterative method; the different steps act as quality checks to each other and require constantly going back and correcting previous data. Nevertheless, it’s vital that in the end of the project, all necessary steps have been gone through in order to reach an acceptable solution. Before starting with the method it is important to perform a market analysis of the product.. Information such as the variance of the market should be investigated, but also product characteristics and how the market is segmented. It is important to stress that a modular architecture should be based on a market analysis (Modular Management 2013).
This section gave a summary of the method and the following parts will describe each of the steps in more detail.
3.3.1 Step 1: Clarify Customer Requirements The first step of MFD is characterized keywords such as “customer values” “product properties” and “quality function deployment”.
Customer values The first step is to ensure that the appropriate design requirements are derived from the customer and/or market needs. The method starts with a market analysis, where the competitors, as well as the different market are identified. Modular Management (Modular Management 2013) defines market segments as:
“A group of customers within a market who are seeking similar benefits from a product”
Further it is added that:
“Customers within a segment will be distinctly different than customers in another segment”
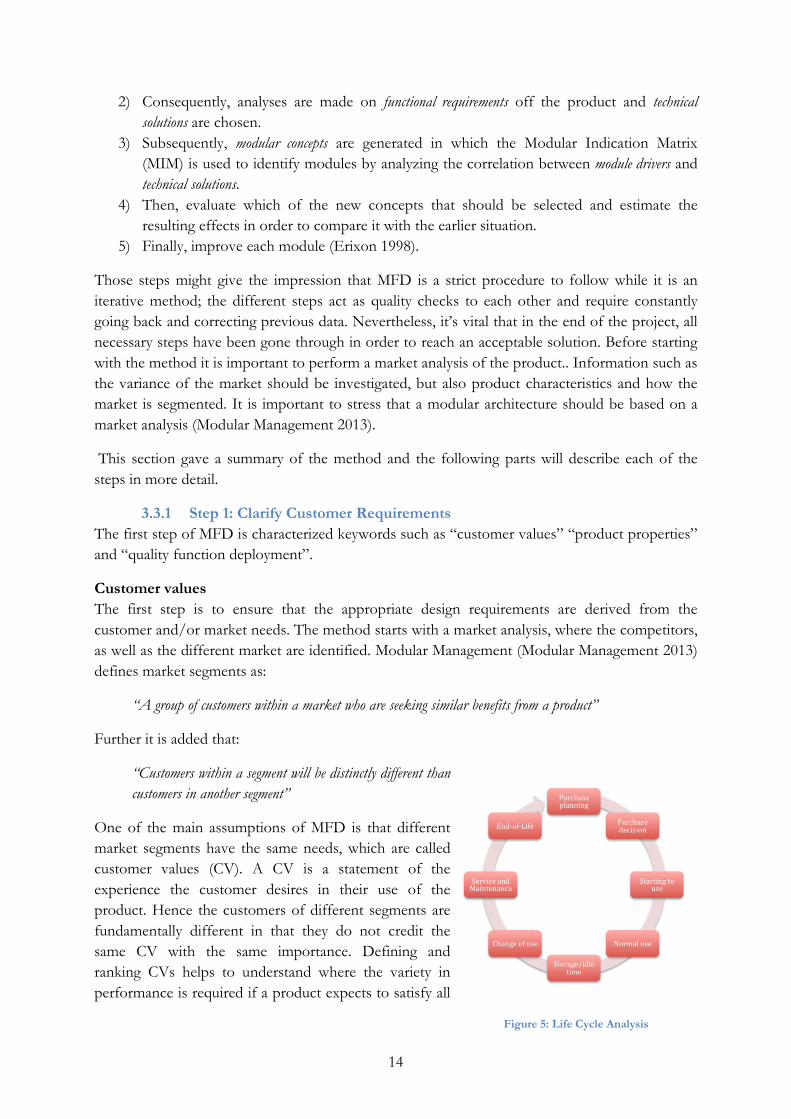
One of the main assumptions of MFD is that different market segments have the same needs, which are called customer values (CV). A CV is a statement of the experience the customer desires in their use of the product. Hence the customers of different segments are fundamentally different in that they do not credit the same CV with the same importance. Defining and ranking CVs helps to understand where the variety in performance is required if a product expects to satisfy all
Figure 5: Life Cycle Analysis
15
of the different market segments (Modular Management 2013)
The concept of CV needs to be further explained. Their formulation should be as if they were expressed by a customer, formulated in a positive way and free of technical solutions. According to Modular Management (Modular Management 2013) a CV should be clear and not “fuzzy”, vague or subject to different meanings. It should be specific and represent a single desire. Figure 5shows a detailed life cycle analysis. This tool is used to ensure that all relevant aspects of the product are considered and considered by the different CV.
In order to determine the relative importance of a CV to each market segment, each CV should be ranked per segment. The ranking shows the specificity of each market segment. Consequently, this will provide a first indication on the product’s need for development and variance. Naturally, it will also indicate areas of common concern across all the segments. All in all it will help direct the development effort (Modular Management 2013).
Product properties Design requirements, or so-called product properties can be extracted from the CVs with the help of fish bone diagrams. Product properties (PP) are statements about what will be perceived through the product. A useful product property is measurable, controllable by the design and not exclusive or included into a particular technical solution. Product properties should describe the product’s features, functions and performances. Each product property should be completed by goal values. Modular Management (Modular Management 2013) define goal values as:
“The quantity of a Product Property that delivers a specified level of value to customers”
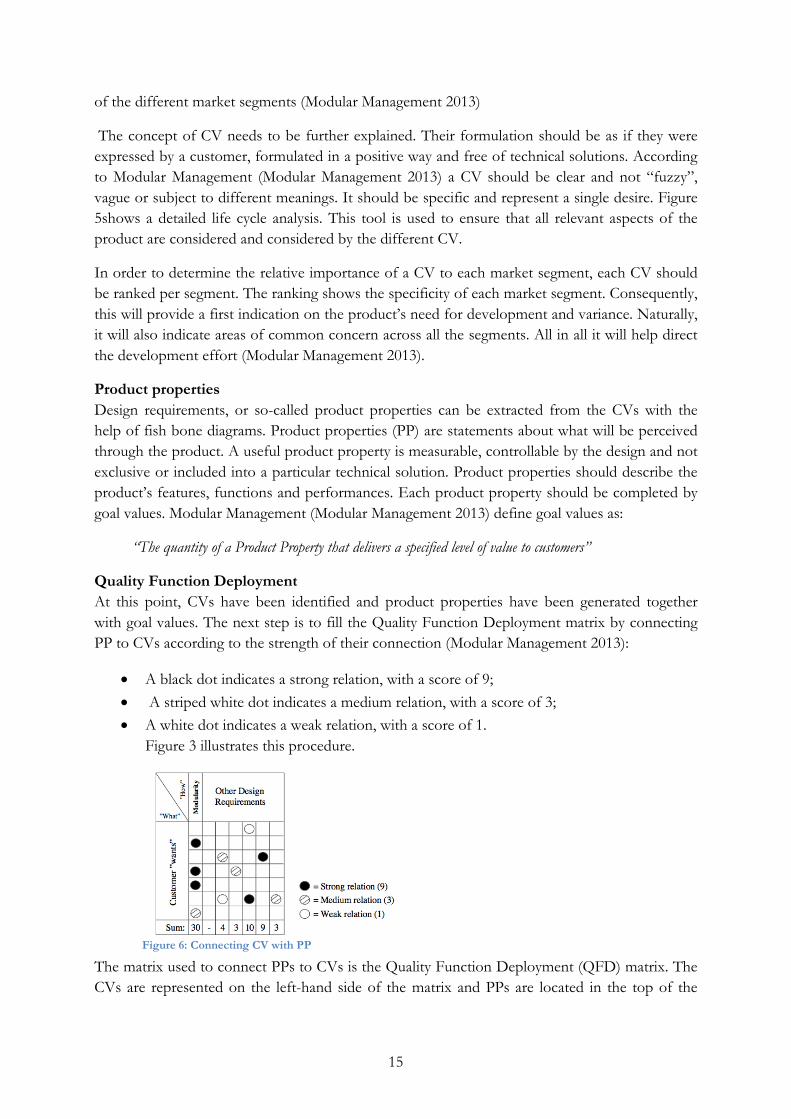
Quality Function Deployment At this point, CVs have been identified and product properties have been generated together with goal values. The next step is to fill the Quality Function Deployment matrix by connecting PP to CVs according to the strength of their connection (Modular Management 2013):
• A black dot indicates a strong relation, with a score of 9; • A striped white dot indicates a medium relation, with a score of 3; • A white dot indicates a weak relation, with a score of 1.
Figure 3 illustrates this procedure.
The matrix used to connect PPs to CVs is the Quality Function Deployment (QFD) matrix. The CVs are represented on the left-hand side of the matrix and PPs are located in the top of the
Figure 6: Connecting CV with PP
16
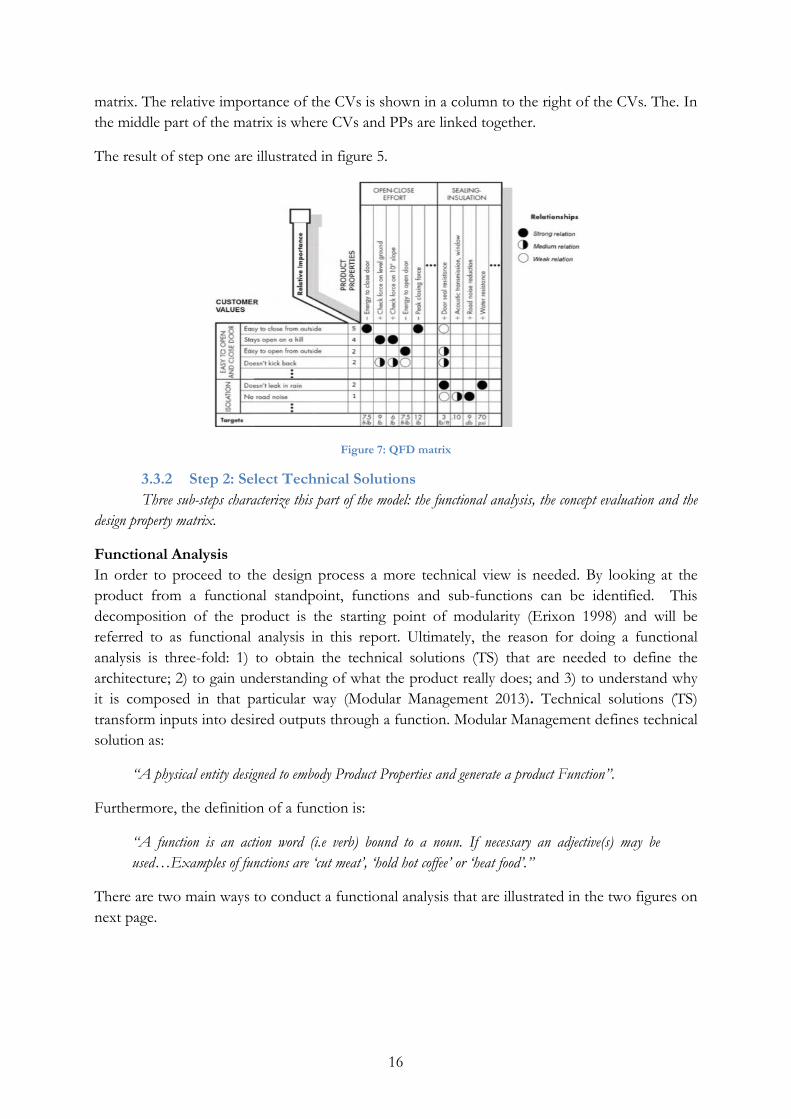
matrix. The relative importance of the CVs is shown in a column to the right of the CVs. The. In the middle part of the matrix is where CVs and PPs are linked together.
The result of step one are illustrated in figure 5.
Figure 7: QFD matrix
3.3.2 Step 2: Select Technical Solutions Three sub-steps characterize this part of the model: the functional analysis, the concept evaluation and the
design property matrix.
Functional Analysis In order to proceed to the design process a more technical view is needed. By looking at the product from a functional standpoint, functions and sub-functions can be identified. This decomposition of the product is the starting point of modularity (Erixon 1998) and will be referred to as functional analysis in this report. Ultimately, the reason for doing a functional analysis is three-fold: 1) to obtain the technical solutions (TS) that are needed to define the architecture; 2) to gain understanding of what the product really does; and 3) to understand why it is composed in that particular way (Modular Management 2013). Technical solutions (TS) transform inputs into desired outputs through a function. Modular Management defines technical solution as:
“A physical entity designed to embody Product Properties and generate a product Function”.
Furthermore, the definition of a function is:
“A function is an action word (i.e verb) bound to a noun. If necessary an adjective(s) may be used…Examples of functions are ‘cut meat’, ‘hold hot coffee’ or ‘heat food’.”
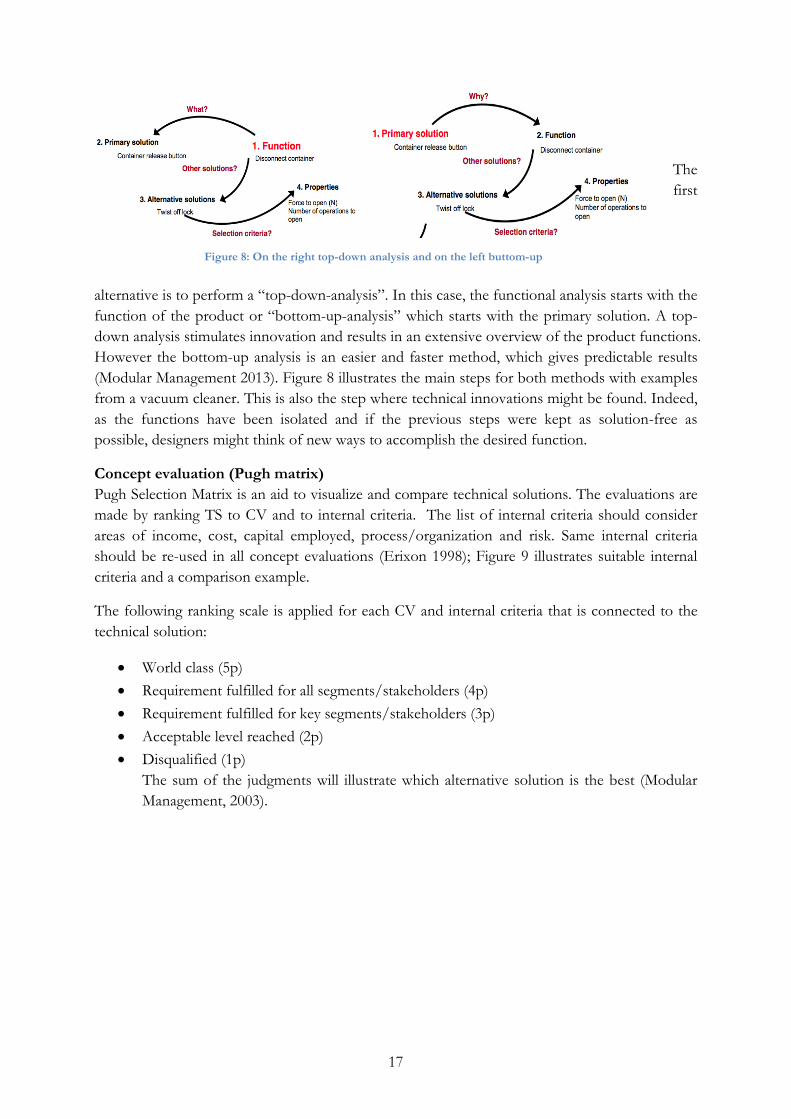
There are two main ways to conduct a functional analysis that are illustrated in the two figures on next page.
17
The first
alternative is to perform a “top-down-analysis”. In this case, the functional analysis starts with the function of the product or “bottom-up-analysis” which starts with the primary solution. A top-down analysis stimulates innovation and results in an extensive overview of the product functions. However the bottom-up analysis is an easier and faster method, which gives predictable results (Modular Management 2013). Figure 8 illustrates the main steps for both methods with examples from a vacuum cleaner. This is also the step where technical innovations might be found. Indeed, as the functions have been isolated and if the previous steps were kept as solution-free as possible, designers might think of new ways to accomplish the desired function.
Concept evaluation (Pugh matrix) Pugh Selection Matrix is an aid to visualize and compare technical solutions. The evaluations are made by ranking TS to CV and to internal criteria. The list of internal criteria should consider areas of income, cost, capital employed, process/organization and risk. Same internal criteria should be re-used in all concept evaluations (Erixon 1998); Figure 9 illustrates suitable internal criteria and a comparison example.
The following ranking scale is applied for each CV and internal criteria that is connected to the technical solution:
• World class (5p) • Requirement fulfilled for all segments/stakeholders (4p) • Requirement fulfilled for key segments/stakeholders (3p) • Acceptable level reached (2p) • Disqualified (1p)
The sum of the judgments will illustrate which alternative solution is the best (Modular Management, 2003).
Figure 8: On the right top-down analysis and on the left buttom-up

18
Figure 9: Pugh matrix example
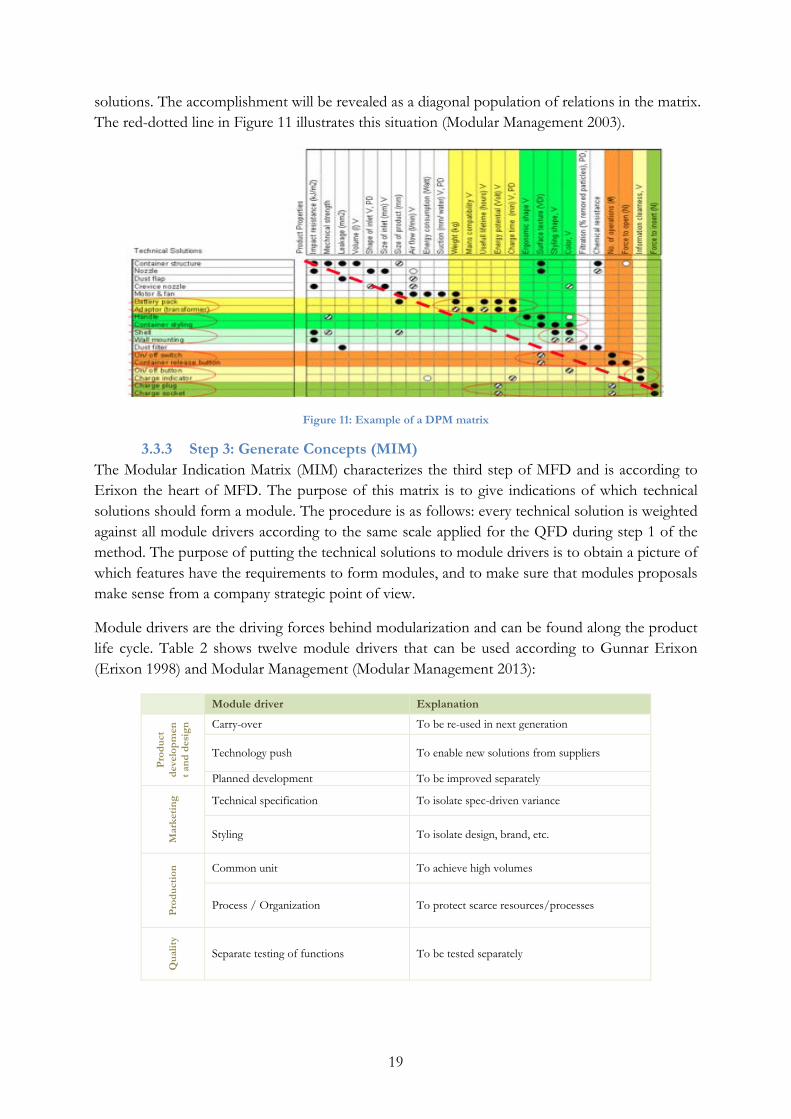
Design Property Matrix (DPM) The purpose of the Design Property Matrix (DPM) is to understand which technical solutions that have to be changed if the CVs change. Linking PP to TS through DPM enables this, which leads to simplification of the product architecture due to TS that vary for too many reasons can be broken apart. DPM also facilitates TS to be grouped into modules (Modular Management 2013).
The connection between PP with TS should be scored according to the rules illustrated in Figure 10. This leads to creation of variants and later modules, since the PP are creating variants for the connected TS (Modular Management 2013).
Figure 10: Strength of relationship in the DPM matrix
The DPM provides information on four levels. The first one is if a single product property is heavily scored against a number of technical solutions, then this is a system property and needs attention. Focus should be on investigating if this product property could be decomposed. The second one is if a single technical solution is heavily scored against a number of product properties. This means that the technical solution is too complex for the architecture and should be decomposed. The third situation is if one product property has an empty column. This means that a technical solution is missing and should either be removed or further investigated. The last situation is if one technical solution has an empty row. This either means that a product property is missing or that the customer does not care about the technical solution. An approach to this situation is to investigate if it is possible to merge it with other technical solutions, or add another product property.
The ideal situation is that of a one-to-one mapping of technical solutions and product properties is achieved. This represents good design principles and facilitates modularity as changes in customer demand will only affects fewer product properties and consequently fewer technical
19
solutions. The accomplishment will be revealed as a diagonal population of relations in the matrix. The red-dotted line in Figure 11 illustrates this situation (Modular Management 2003).
Figure 11: Example of a DPM matrix
3.3.3 Step 3: Generate Concepts (MIM) The Modular Indication Matrix (MIM) characterizes the third step of MFD and is according to Erixon the heart of MFD. The purpose of this matrix is to give indications of which technical solutions should form a module. The procedure is as follows: every technical solution is weighted against all module drivers according to the same scale applied for the QFD during step 1 of the method. The purpose of putting the technical solutions to module drivers is to obtain a picture of which features have the requirements to form modules, and to make sure that modules proposals make sense from a company strategic point of view.
Module drivers are the driving forces behind modularization and can be found along the product life cycle. Table 2 shows twelve module drivers that can be used according to Gunnar Erixon (Erixon 1998) and Modular Management (Modular Management 2013):
Module driver Explanation
Prod
uct
deve
lopm
ent a
nd d
esig
n Carry-over To be re-used in next generation
Technology push To enable new solutions from suppliers
Planned development To be improved separately
Mar
ketin
g Technical specification To isolate spec-driven variance
Styling To isolate design, brand, etc.
Prod
uctio
n Common unit To achieve high volumes
Process / Organization To protect scarce resources/processes
Qua
lity
Separate testing of functions To be tested separately

20
Purc
hasi
ng
Strategic supplier To be developed and produced by partner
Afte
r sa
les Service and maintenance To be replaced easily
Upgrading To increase after-sales Recycling To protect environment
Table 2: Example of module drivers
Throughout the evaluation of the MIM matrix there are two important aspects to consider. First, a sub-function with several highly weighted module drivers indicates complicated requirement patterns and most likely should be a module by itself. The other characteristic to consider is few, low weighted module drivers connected to a sub-function means that the sub-function might be easy to integrate and group together with other sub-functions (Erixon 1998).
3.3.4 Step 4: Evaluate Module Concepts This step is about evaluating the generated modular concepts and investigate whether they should be selected or not, and how they will affect the company strategy. Questions to answer are for instance– How much better are the new modular concepts compared with the existing ones? How can we improve them even further? Which one of the new concepts should we select? It is important to measure the resulting effects in order to evaluate the suggested changes. Hence, measurements indicating the outcome should serve as a basis for decision making (Erixon 1998).
The interfaces between modules have a vital influence on the final product’s flexibility. Therefore, an evaluation of the interface connections is an important factor to consider for the selection of the modular concepts. Furthermore, Erixon explains that an interface can be fixed, moving or media transmitting. Modular Management clarifies these interfaces further and calls them the “attachment interface”, “transfer interface” and “command and control interface”. The attachment interface describes how one component is physically connected to another, while the transfer interface explains how power or media is transferred between components. Finally, the command and control interface shows how the state of one component will be communicated and controlled by other components, such as digital and analogue signals (Modular Management 2013).
Apparently, these interfaces are strongly related to a physical product except for the command and control interface. In order to make this step suitable for software architecture some major changes to the model would probably be necessary.
3.3.5 Step 5: Improve each module In the fifth and final step suggestions for improvement on each individual module are evaluated, moreover, the MIM will now work as a tool to illustrate what is important for each module. An example could be that if it were established in MIM that a module has been created due to maintenance reasons, an improvement suggestion would be to design the module in such a way that it is easy to disassemble (Erixon 1998).
Furthermore, this step is also characterized by economic evaluation of module concepts where costs to produce each module should be estimated. The purpose is to maximize the profit of the modular system. Additionally, the listing of module variants and product configurations is part of this step as well (Modular Management 2013).
21
As it was stated in the beginning of this chapter, in theory, the project will successively go through the method step by step but in reality the project will jump back and forth between the different parts. Nevertheless, it’s vital to go through all the steps in order to reach an acceptable solution.
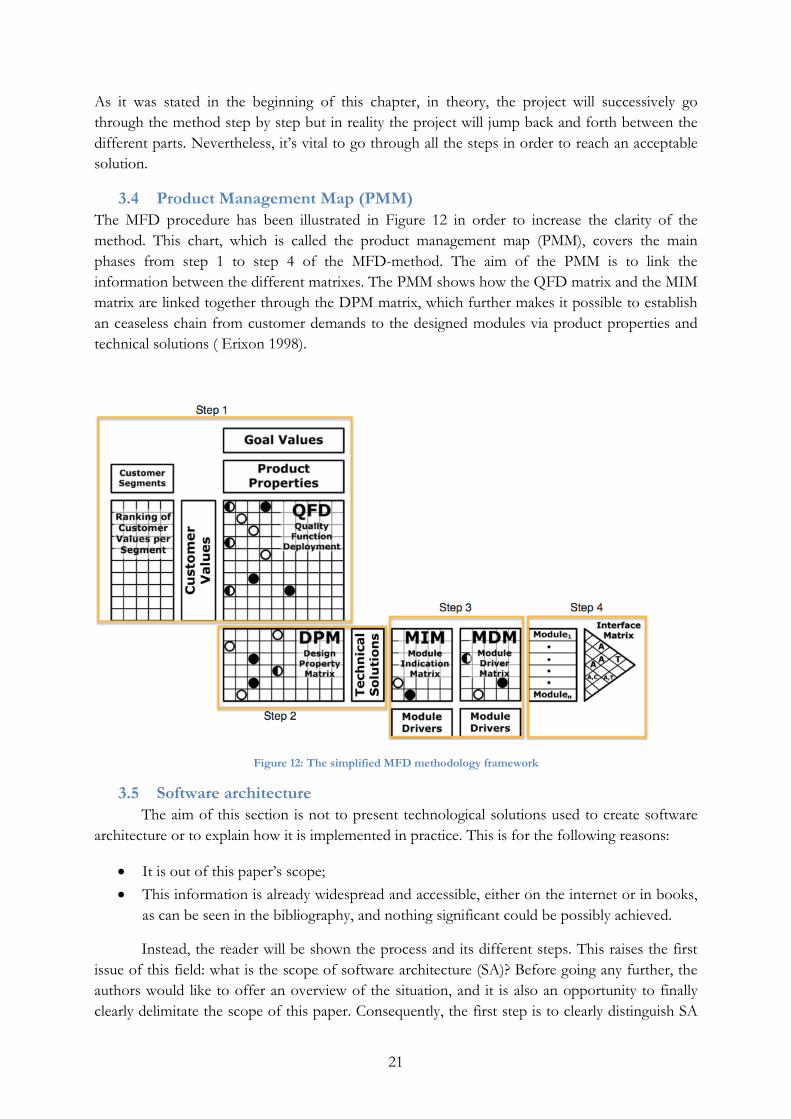
3.4 Product Management Map (PMM) The MFD procedure has been illustrated in Figure 12 in order to increase the clarity of the method. This chart, which is called the product management map (PMM), covers the main phases from step 1 to step 4 of the MFD-method. The aim of the PMM is to link the information between the different matrixes. The PMM shows how the QFD matrix and the MIM matrix are linked together through the DPM matrix, which further makes it possible to establish an ceaseless chain from customer demands to the designed modules via product properties and technical solutions ( Erixon 1998).
Figure 12: The simplified MFD methodology framework
3.5 Software architecture The aim of this section is not to present technological solutions used to create software architecture or to explain how it is implemented in practice. This is for the following reasons:
• It is out of this paper’s scope; • This information is already widespread and accessible, either on the internet or in books,
as can be seen in the bibliography, and nothing significant could be possibly achieved.
Instead, the reader will be shown the process and its different steps. This raises the first issue of this field: what is the scope of software architecture (SA)? Before going any further, the authors would like to offer an overview of the situation, and it is also an opportunity to finally clearly delimitate the scope of this paper. Consequently, the first step is to clearly distinguish SA
22
from other software-related fields. The second one will be to determine the purpose of SA. Once those definitions are answered, the next legitimate question is why doing it? This will be answered in a third paragraph. Following, current ways of approaching software architecture will be presented and from that the authors will present what they see as lacking and how MFD could be a solution.
3.5.1 Definition of Software architecture According to the ISO/IEC/IEEE 42010 standard(« ISO/IEC/IEEE Systems and software engineering – Architecture description » 2011), Software Architecture (SA) is defined as :
“[The] fundamental concepts or properties of a system in its environment embodied in its elements, relationships, and in the principles of its design and evolution”
Another definition is also given by Microsoft (Microsoft 2014a):
“[…] the organization or structure of a system, where the system represents a collection of components that accomplish a specific function or set of function.”
Finally, here is the definition given by Vogel et. al(Vogel et al. 2011, chap. 3):
“The software architecture of a system is the structure or structures of the system, which comprise software building blocks, the externally visible properties of those building blocks, and the relationship among them and with their environment.”
According to this previous definition, software architecture is thus as much about the components (also called building blocks) emerging from the requirements as it is about the environment of the software. However, this definition is still lacking as it only considers the structuring part of SA, but says naught about the activity itself. One way to approach SA is to see it as a set of design decisions that will lead to the final structure itself. Vogel et. al(Vogel et al. 2011, chap. 3) added therefore a definition about the activity of software architecture :
“As a discipline, software architecture covers the architectural activities and the related decisions about the design and implementation of software architecture.”
Finally, the same authors provided an additional relevant definition. They call system architecture the combination of the activity of SA with its structuring effect. This in turn reduces the scope covered by the term software architecture, which fits better the scope of this paper; as will be shown in the following section.
3.5.2 Scope of Software Architecture In the previous subsection, it was shown that software architecture has many facets as it was implied by the different definition. Vogel et al. overcame this issue by renaming the totality of what is usually called software architecture by system architecture. As such, system architecture is about defining building blocks and the relationship between them, i.e. how they communicate between themselves. But it also considers how the whole structure will interact with its environment; will it be an online platform? A mobile application? Or a software monitoring an engine behavior and thus having no interactions with humans? However, the same issue arises

23
again: what is software architecture? One thing is known for sure, software architecture is a part of system architecture. Therefore, the beginning of an answer can be obtained by answering the following question: what are the different parts of system architecture? This subsection has the objective to provide the reader with an understanding of the vastness of system architecture and its relationship with software architecture. Additionally, by the end of it, the scope of software architecture in this paper will be clearly defined. Before going further, please note that the authors will extend the concept of system architecture to some sources that did not explicitly use it, in order to avoid confusion.
In their article, Kruchten et al (Kruchten, Obbink, et Stafford 2006) identified five subareas of system architecture:
1 Architectural design is concerned with the creation of the architecture; 2 Analysis assesses the quality of the deliverable product based upon its architecture; 3 Realization of the architecture based on its description; 4 Representation communicates the architecture to its users (machines, software and
humans); and 5 Economics aligns the architecture with business issues.
A clearer distinction, to the authors understanding, and the one adopted for this paper, is given by Vogel et al. (Vogel et al. 2011, chap. 3). They identified the following seven areas of system architecture:
1 Software architecture; 2 Data architecture: the system collects data across the company and makes it available; 3 Integration architecture: the system is going to communicate and exchange data with
other system, within or outside the company. Those may have different platforms, technologies and data, but must nevertheless be connected;
4 Network architecture: the software is spread across different hardware, then one must consider designing a network to connect the different building blocks;
5 Security architecture: some of the data that the system exchanges might contain confidential information. Therefore there is a need to restrict the access to authorized users and parties;
6 System management architecture: the architecture should also contain aspect regarding the availability and reliability of the system’s operation;
7 Enterprise architecture: the system must respect some predefined standards and guidelines active inside of the company.
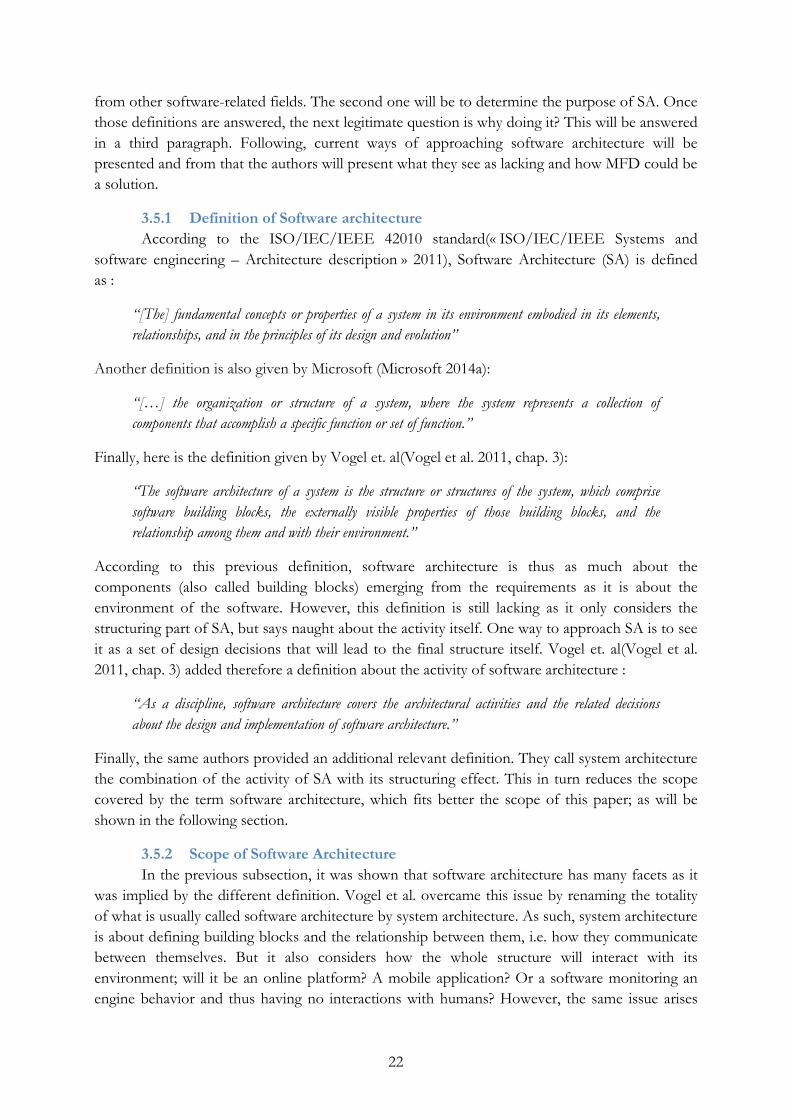
Vogel et. al(Vogel et al. 2011, chap. 3) present software architecture as the architectural answer to functional and non-functional requirement, as is shown in Figure 13 extracted from their book.
24
Figure 13: Software architecture and system architecture
Note, that here technical architecture stands for what was previously called non-functional requirements. Sommerville (Sommerville 2006) provides definitions for both terms. Functional requirements represent what the system is expected to do and consequently they will vary according to the expected users and the type of software. Functional requirements are closely related to user requirements; the degree of abstraction is what distinguishes them. User requirements in one hand are directly gathered from the customers/users and are consequently less technical. Functional requirements, on another hand, are expected to explain in detail the system’s functions: their inputs, outputs and exceptions. Nevertheless, in this paper both terms will be used interchangeably, as what truly matters is that functional requirements translate the wishes and will of the customer and users. Vogel et al.(Vogel et al. 2011, chap. 5) structure functional requirements into three closely related parts:
• Building block requirements represent the functions that the building block must possess in order to achieve a specified system requirement. For example in a ATM machine, if the user wants to see his balance, the UI will have to communicate with the account module;
• System requirements represent the concrete needs that the different users of the system have. Keeping the previous example, the requirement would be to see the bank account balance; and
• Functional organizational requirements are the more abstract level. They represent a pressure, coming from outside (user, customer, authorities) or inside the company, which wants to see a new service. They express a desire, for example in a bank the customers would like to be able to access their bank account balance. They are a solution to an observed issue. For example, it has been observed that the bank’s clients have a hard time to control their money. It has been found it is because they don’t visualize their
25
expenditures. Therefore the bank decided to create a service to show the current account balance.
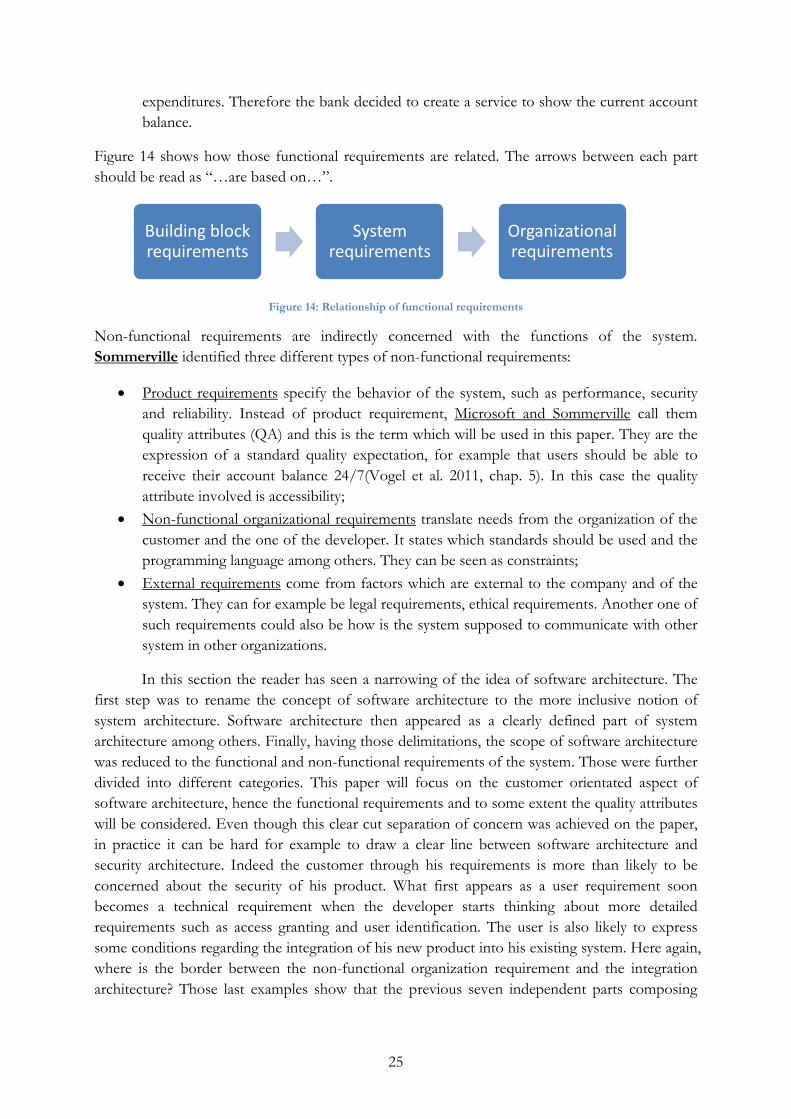
Figure 14 shows how those functional requirements are related. The arrows between each part should be read as “…are based on…”.
Figure 14: Relationship of functional requirements
Non-functional requirements are indirectly concerned with the functions of the system. Sommerville identified three different types of non-functional requirements:
• Product requirements specify the behavior of the system, such as performance, security and reliability. Instead of product requirement, Microsoft and Sommerville call them quality attributes (QA) and this is the term which will be used in this paper. They are the expression of a standard quality expectation, for example that users should be able to receive their account balance 24/7(Vogel et al. 2011, chap. 5). In this case the quality attribute involved is accessibility;
• Non-functional organizational requirements translate needs from the organization of the customer and the one of the developer. It states which standards should be used and the programming language among others. They can be seen as constraints;
• External requirements come from factors which are external to the company and of the system. They can for example be legal requirements, ethical requirements. Another one of such requirements could also be how is the system supposed to communicate with other system in other organizations.
In this section the reader has seen a narrowing of the idea of software architecture. The first step was to rename the concept of software architecture to the more inclusive notion of system architecture. Software architecture then appeared as a clearly defined part of system architecture among others. Finally, having those delimitations, the scope of software architecture was reduced to the functional and non-functional requirements of the system. Those were further divided into different categories. This paper will focus on the customer orientated aspect of software architecture, hence the functional requirements and to some extent the quality attributes will be considered. Even though this clear cut separation of concern was achieved on the paper, in practice it can be hard for example to draw a clear line between software architecture and security architecture. Indeed the customer through his requirements is more than likely to be concerned about the security of his product. What first appears as a user requirement soon becomes a technical requirement when the developer starts thinking about more detailed requirements such as access granting and user identification. The user is also likely to express some conditions regarding the integration of his new product into his existing system. Here again, where is the border between the non-functional organization requirement and the integration architecture? Those last examples show that the previous seven independent parts composing
Building block requirements
System requirements
Organizational requirements
26
system architecture are not impervious to one another. As a consequence, in the rest of the paper, such clear separations will be impossible and other topics might be considered.
3.5.3 Relevance of software architecture After having determined the scope of software architecture, this section will briefly present how SA became an important topic in software design. One of the main reasons behind SA is economical (Bosch 2004) (Coplien et Bjørnvig 2011). Indeed, it is expensive to modify a software structure after it has been implemented. Furthermore, SA also ensures that the piece of software is in the good track to meet the requirements and facilitates programming. In this sense, SA acts as a bridge between the requirements of the different stakeholders and identifies which of those requirements will have an impact on the structure of the software (Microsoft 2014b). Historically, this increasingly complex environment was the reason for emergence of architecture as an academic topic; as well as the increasing complexity of the projects themselves(Vogel et al. 2011, chap. 1). Indeed, software architecture has always been present; however within a more complex environment, what had always been an unspoken process became one of the critical factors of success. As such, SA is the foundation of the software and guarantees the long term success of the application; software architecture needs to be a conscious process (Vogel et al. 2011, chap. 1). Microsoft observed that a deficient architecture generates the following issues:
• Stability; • Requirements not met and unsupported; • Deployment.
Architecture also provides a common vocabulary for team members (Microsoft, 2014). By giving a common framework and by making clear technological choices, architecture provides a common language for the different actors
To conclude on its importance, here are some numbers and examples given by Charette in an IEEE conference (Charette 2005). Back in 2005, cellphones already had two million lines of code, nowadays this amount has probably been multiplied by ten. For cars this amount raises to one hundred million lines of code. Although the volume of code is impressive, the cost linked to projects is also consequent. Big governmental and corporate projects can cost between hundreds of millions and up to a billion dollar in development and again as much in deployment. It appears clearly that the cost of failure is very high. The US government wanted to update its air-control system to an automated system. The project was cancelled after 2.6 billion dollars were spent. Although the definition of failure can be broad, from total cancelation of the project to a project exceeding budget and running over schedule, when such amounts of money are involved even the most minimalistic definition of failure holds a considerable amount of money. And those figures considered in the article, do not take into account secondary costs such as lawsuits, lost opportunities and malfunctioning. Charette listed some of the causes of software failure, here is a non-exhaustive list of those elements the authors found relevant to the paper:
• Unarticulated project goals; • Bad communication among stakeholders; • Inability to handle complexity; and • Unconsidered external and organizational requirements.

27
3.5.4 How it is done nowadays In the literature, SA appears as a sequence of decisions to be made in order to put the
ongoing project on track. This particular task is achieved through guidelines and constraints given to the coders. Jan Bosch (Bosch 2004) uses the term architectural design decision and offers the following definition:
“We define an architecture design decision as consisting of a restructuring effect on the components and connectors that make up the software architecture, design rules imposed on the architecture (and resulting system) as a consequence of the design decision, design constrains imposed on the architecture and a rational explaining the reasoning behind the decision”
Where restructuring effects encompass the following attributes:
“[…] splitting merging and reorganization of components, but also additional interfaces and required functionality that is demanded from components”.
The last part means that restructuring effects also encompass changes inside the components which are only due to a specific technical choice. J.Bosch(Bosch 2004) gives more detail by dividing every design decision (DD) into four relevant aspects:
• A restructuring effect, as a result of the DD, one might need to add, remove, merge or split existing components;
• Design rules that impose a particular way of doing a task; • Design constraints giving restrictions on some parts of the components; • A rationale, translating different types of requirement, which the DD must fulfill on the
best possible way.
Proper design decisions also imply that the software has been broken down into building blocks, which come from identified functional requirements. Indeed the set of building blocks will require a set of decisions. Those decisions will in turn create new requirements (non-functional requirements) adding new constraints to the system. The objective of this part is to present which are those design decisions that every software architect has to face. Before going further into a more technical discussion, here are some concrete examples of design decisions (Microsoft 2014a):
• Identify the application type. Is the software for a personal computer, a mobile platform, a web application? What does that implicates in additional requirements and hardware limitations?
• Chose the deployment strategy. This considers the different possible environments where the solution will be deployed. It consequently brings another set of requirements and constraints;
• Select the appropriate technologies. The software architect needs to take into account, among other criteria, the skills available in the business, any physical restrictions, requirements and architectural styles (see below) to choose the appropriate technology, as well as the deployment strategy and the application type;

28
• Determine the relevant quality attributes. They specify the concerns of the organization regarding the product’s requirements. QA specify what the end-product should reflect, when considering its different layers (see below). As such they can be set to general design qualities ,such as maintainability, to more specific user concerns about usability;
• Identify the crosscutting concerns. Those are areas of the design which affect the software as a whole, and not only specific parts of it. An example of those is the communication between the different parts of the software. Another one is that with a single log in, the software should know which users have access to which parts.
(Vogel et al. 2011, chap. 6) describe the available means available to the software architect. They are, by increasing level of constraint: architecture principles, architecture tactic styles and patterns, basic architectures and reference architectures. A more complete description of those architectural means follows.
Architecture principles are high-end guide lines that should be taken into account when making design decisions. All of those principles lead to the creation of a loosely coupled architecture with high internal cohesion. Being very general statements, they give no indication on how to implement specific solutions and are not related to specific and recurring problems; they are just interested in providing tools to create a proper architecture.
Architecture tactics, styles and patterns, contrary to architecture principles and concepts, are answers to specific recurring problems. In that sense they can be considered as reusable design decisions. Architecture tactics help to implement identified quality attributes requirements. For more details on how to obtain quality attributes, the reader is referred to (Vogel et al. 2011, 174). Styles and patterns are very similar concepts(Microsoft 2014c) and for the sake of this short explanation, there will be no distinction among them. Patterns are solutions to common and recurring problems, as such it should be broad enough to be used as a general guide line to solving a specific issue. Here again quality attributes play an important role (Vogel et al. 2011, 180).
Basic architectures originate from styles and patterns. The delimitation between those three terms is not clear as Microsoft(Microsoft 2014c) calls “basic architectures”, “architecture styles”. Basic architectures are organized into different categories: communication, deployment, structure and domain. They provide more concrete guidelines on how to successfully face the recurring challenges of those areas of concern. As one can imagine, a software most often needs a combination of basic architectures to achieve all of its functions. Here is a table providing an example of basic architectures (here called architecture style) related to its corresponding category(Microsoft 2014c):

29
Note that when facing a problem, the software architect should always work the list from the bottom up (Vogel et al. 2011, chap. 6). This is justified as basic and reference architectures have a higher degree of reusability as they answer recurring concerns. However, if facing a new kind of issue, the architect should build its own solution using the architectural principles.
3.5.5 Possible improvements As Jan Bosch noted in his article, the research on how to actually apply software architecture is somehow lacking(Bosch 2004). From the issues he highlighted back then, here are the ones relevant to this paper:
• “Lack of first class representation”, or how to effectively keep track of the design decisions, their rationale as well as their effect on the global architecture;
• “Design decisions cross-cutting and intertwined”, refers to the broad impact that design decisions have on different components and on each other. This appears clearly if we consider Microsoft’s three stakeholders: users, business goals and IT infrastructure ;
• “High cost of change”, due to the two previous points, modifications are expensive;
In their book, Coplien and Bjørvig(Coplien et Bjørnvig 2011) give the beginning of an answer. They suggest criteria on which to build high end modules. They suggest at first to distinguish two aspects of every software; they called it “what-the-system-is” (WTSI) and “what-the-system-does” (WTSD). This respectively means that architects should distinguish between the requirements of the software to work from the requirements of the customers (both internal and external). Another way to see it is that WTSI represents a more stable part of the software while WTSD needs more flexibility, as it is related to customer needs which are constantly evolving
Specifically, to the extent of the authors’ knowledge, there are no clear ways of generating modules, in the MFD sense of the term. A module in MFD is a group of functions clustered together for strategic reasons. Concretely, the different authors seem to have focused exclusively on a top-down analysis of the issue: software engineers should decompose their potential software, identify the challenges and use as much as possible the existing solutions. However, experience and “common sense”(Coplien et Bjørnvig 2011) seem to be the guidelines when facing issues without already existing solutions. In both cases, this way of proceeding can raise some concern, which originates for both situations from a lack of a systematic approach to the generation of modules. In the first case, where the problem is common, applying the same solutions over and over again might obstruct the emergence of new solutions. While in the second case, a software engineer without experience might benefit from a framework to proceed

30
with its work. MFD could bring a complementary bottom-up approach that might be especially useful when facing one-of-a-kind issues by giving a systematic framework for software architects to follow. Then the traditional top-down approach could be used for the rest of the development.

31
4 Method This chapter examines the design and choice of research methods used during the project. Moreover, comments are made on how the collection of data affects the quality of the research and the reports validity and reliability. This information is given to the reader in order to provide a better understanding of which sources that are used in the various sections and how the data is obtained.
The project's framework consists of three main parts. The first part is to collect information from different sources to create a knowledge base in the area concerned for this project. The second part represents the actual work at Kambi and how the information is collected within the company. Finally, the last step is the actual application of MFD to software architecture. Figure 15 illustrated below shows the step-by-step procedure for this project.
Figure 15: The project’s framework
This project aims to have high level of reliability and validity and therefore weekly diaries have been written to keep track of the working progress. Moreover, all questionnaires for the meetings have been set-up beforehand to ensure that same questions are asked on all meetings. During the meetings, one of the authors acted as a secretary and took notes while the other one asked questions to ensure all information was properly captured. Furthermore, two quality check points were provided by modular management: one after the completion of the QFD matrix and the second after the DPM.
4.1 Literature review Literature studies on the concerned areas have been completed to gain a broader and deeper understanding of the chosen subject and about Kambi’s strategy. Sources of literature have been carefully chosen to increase the reliability and validity of the report. The same implies for the meetings held with the company, where the aim was to meet people with the right competence depending on the topic of the meeting.

32
The information on this section is based on both primary and secondary data. Primary data is information collected independently using observations, interviews and data gathering directly at the company. This information is collected through meetings with key personnel at Kambi in an early phase of the project to have better understanding of the company itself, their product and their business strategy. The secondary data is based on brochures, annual reports and other documents provided by the company. Furthermore, the research about Modular Function Deployment is completely based on secondary data provided by the company that invented this method, hence providing trustworthy information. However, solely relying on this source can affect the validity of the report due to uncertainty in the author’s objectivity in this topic. Additionally, information gathering about software architecture is also based on secondary data using several sources compiled in one section. Doing so increases the reliability of the section by spreading the risk of incorrect information among different sources.
4.2 Gathering information from Kambi The necessary knowledge into fulfilling customers’ requirements is usually spread across the existing departments. Indeed departments can have more or less technical orientations and people inside of each department have different backgrounds. Those factors can complicate the exchange of information inside the company and hence be a liability to performance. The goal was to collect this information and to organize it as to make it available to all members of the organization.
All the information gathered was then transferred in PALMATM, the software provided by Modular Management developed to handle MFD. Every calculation and result was processed through it.
4.2.1 Market analysis Three meetings were organized with Kambi to obtain information about the online gaming industry. Two of the meetings were with representatives of the business development department, who talked about Kambi and the competitive landscape. The last one was with one of the directors of sales, and was orientated towards the different market segments. Finally, to complete the market analysis, some secondary sources of information were used: industry’s magazines, competitors’ brochures, specialized websites and reports on the market.
4.2.2 Obtaining customers’ values Customers’ values are the expression of the customers’ needs and wants; in an IT context they can be assimilated with user stories. In order to generate them, we organized two workshops of two hours each. The objective was to gather in the same room members of different departments with different backgrounds to determine what customers look for in a sports book. The assumption behind this choice is that each activity in the company should add value to the product in the customers’ perspective; and therefore each activity answers a need. Having people from different departments fulfilling different tasks should thus help us in drawing a more complete vision of what customers look for. Participants occupied different functions inside of Kambi:
• Product owners of Horse racing, sports book client and pre-match automation; • Sales director for government regulated lotteries (GRLs); and
33
• Head of professional services.
The interviews held were created to be semi-structured as it gave more direct control and allowed to influence the direction in which the process evolved. Furthermore, it was clearer for the participants to understand what was expected of them. To have them start talking, the participants were asked to consider their tasks. Then, they had to think about the reason behind what they do and what does it bring to the customer. Finally to ensure that all aspects of the product are covered, a product usage cycle was used (see chapter 3.3 for more information) and distributed to the participants.
4.2.3 Ranking the customers’ values The MFD method makes one main assumption in its first step: all market segments have the same needs however those needs are not prioritized in the same way. Consequently, the ranking of the customers’ values was a critical step for the relevance of the results presented to the company. As stated in the objectives of this master thesis, Kambi wished to have an additional input regarding the specific needs of each market segment. Hence obtaining a proper ranking was essential to understand how to target each market segment. Concretely, an online drag and drop survey was created and submitted to a selection of three Kambi’s collaborators:
• Sales director of governmental markets; • Key account manager for the Spanish land based operators; and • Sales director of land based and private operators;
Each one was specialized in one of the different market segments to rank, while the authors completed the ranking for the gaming operators segment.
The reader can find the online survey template in Appendix 1.
4.2.4 Obtaining Product Properties It was decided to organize another round of workshops, this time without the sales department but with participants with more technical backgrounds. This solution provided better control over the session, and over the quality of the data obtained. In order to obtain the product properties two meetings with two employees on each meeting were held, respecting the following procedure. Participants were presented with one customer value at a time. They were then asked how this CV is controlled (PP) and their answers were written on a fishbone diagram. This was then repeated until all CV had been evaluated.
During the first meeting two software architects participated. During the second meeting, one of the participants came from professional services and the other was a product owner. The former acts as a bridge between customers and software developers while the latter ensures that the vision of the company is transmitted to software developers.
4.2.5 Filling the QFD matrix The participants from the second round of workshops, to obtain PP, were also asked to score how much each product property affects the corresponding customer value, as detailed in the literature review. This scoring was then used to populate the QFD matrix in PALMATM.
34
4.2.6 Functional Analysis It became possible to see the big picture of the organization by having meetings with representatives from each department. Consequently using a bottom-up and top-down analysis, as explained in the literature review, it was possible to draw a simplified map of Kambi’s product, which was then used to determine the product’s functions; the bottom-up template is in Appendix 2. The information was then inserted in PALMATM.
4.2.7 Technical solutions Technical solutions were obtained by analyzing Kambi’s current solutions and those of competitors. Using the bottom-up template, it was possible to think of several technical solutions answering a specific function. The data was then implemented in PALMATM.
4.2.8 Concept evaluation The concept evaluation is usually carried to determine which of the different technical solutions should be the primary one according to customer values, internal and external criteria, as described in the literature review. The following criteria were deemed necessary to be added in order to match the specific needs of software architecture and that can be represented by quality attributes and other cross cutting concerns of software engineering. However due to the authors’ lack of knowledge in software engineering it was decided not to implement the concept evaluation.
4.2.9 The Design Property Matrix The DPM links a product property to a certain technical solutions according to the necessary number of product variants required to satisfy the PP’s goal value(s). This is obtained by considering the product property class and by thinking where variance is required to satisfy the needs of different market segments. The literature review details the scoring procedure.
The second step was to identify clusters of technical solutions, linked by similar product properties. This was done by rearranging product properties and technical solutions until a diagonal distribution of scoring dots was achieved. Those clusters were then used to form modules.
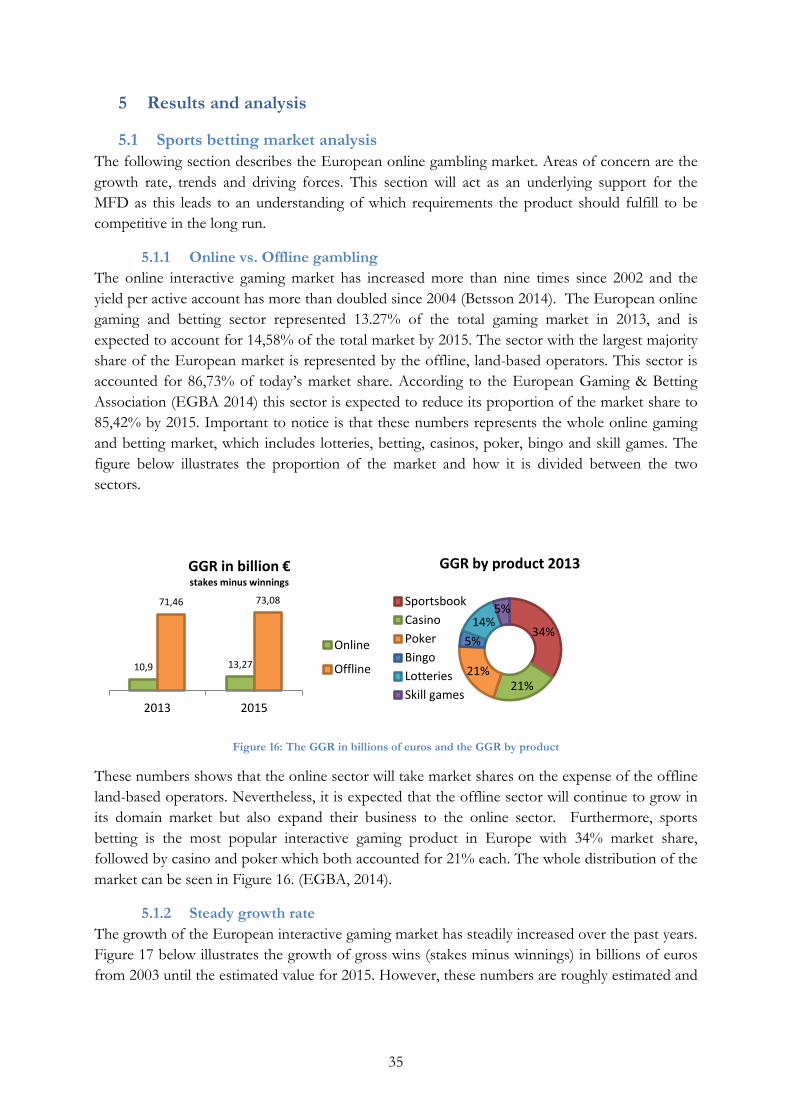
35
5 Results and analysis
5.1 Sports betting market analysis The following section describes the European online gambling market. Areas of concern are the growth rate, trends and driving forces. This section will act as an underlying support for the MFD as this leads to an understanding of which requirements the product should fulfill to be competitive in the long run.
5.1.1 Online vs. Offline gambling The online interactive gaming market has increased more than nine times since 2002 and the yield per active account has more than doubled since 2004 (Betsson 2014). The European online gaming and betting sector represented 13.27% of the total gaming market in 2013, and is expected to account for 14,58% of the total market by 2015. The sector with the largest majority share of the European market is represented by the offline, land-based operators. This sector is accounted for 86,73% of today’s market share. According to the European Gaming & Betting Association (EGBA 2014) this sector is expected to reduce its proportion of the market share to 85,42% by 2015. Important to notice is that these numbers represents the whole online gaming and betting market, which includes lotteries, betting, casinos, poker, bingo and skill games. The figure below illustrates the proportion of the market and how it is divided between the two sectors.
Figure 16: The GGR in billions of euros and the GGR by product
These numbers shows that the online sector will take market shares on the expense of the offline land-based operators. Nevertheless, it is expected that the offline sector will continue to grow in its domain market but also expand their business to the online sector. Furthermore, sports betting is the most popular interactive gaming product in Europe with 34% market share, followed by casino and poker which both accounted for 21% each. The whole distribution of the market can be seen in Figure 16. (EGBA, 2014).
5.1.2 Steady growth rate The growth of the European interactive gaming market has steadily increased over the past years. Figure 17 below illustrates the growth of gross wins (stakes minus winnings) in billions of euros from 2003 until the estimated value for 2015. However, these numbers are roughly estimated and
10,9 13,27
71,46 73,08
2013 2015
GGR in billion € stakes minus winnings
Online
Offline
34%
21% 21%
5% 14%
5%
GGR by product 2013
SportsbookCasinoPokerBingoLotteriesSkill games
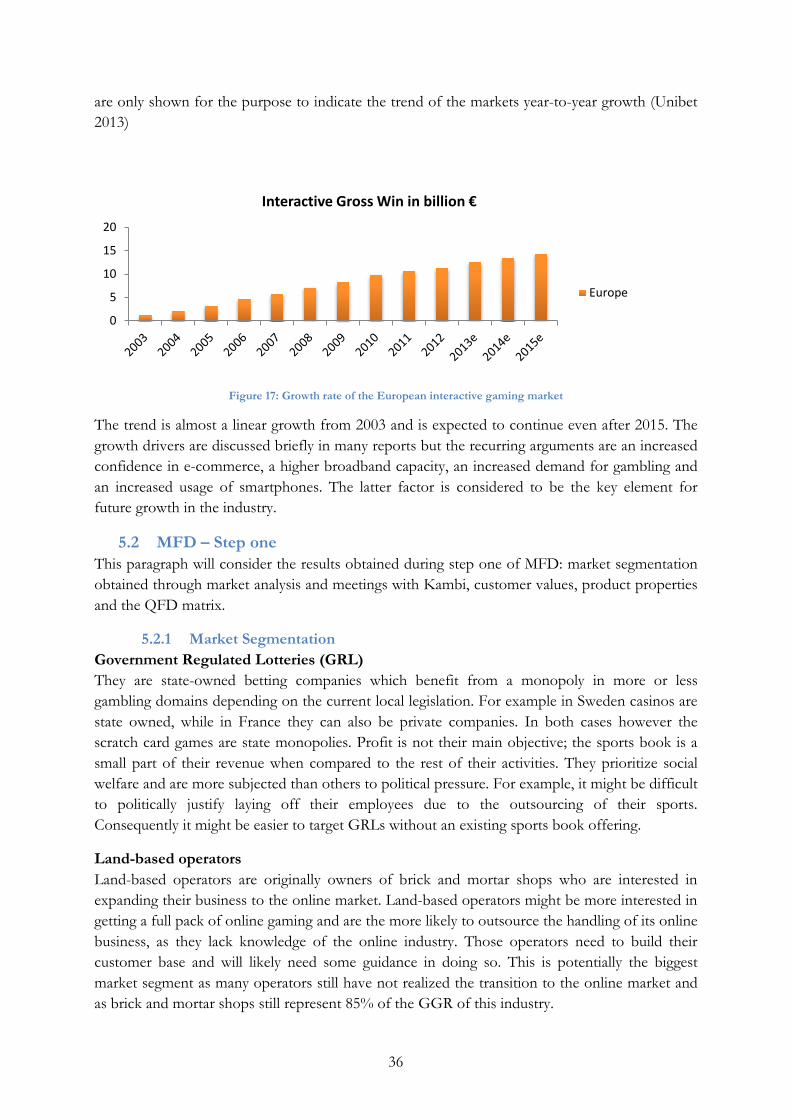
36
are only shown for the purpose to indicate the trend of the markets year-to-year growth (Unibet 2013)
Figure 17: Growth rate of the European interactive gaming market
The trend is almost a linear growth from 2003 and is expected to continue even after 2015. The growth drivers are discussed briefly in many reports but the recurring arguments are an increased confidence in e-commerce, a higher broadband capacity, an increased demand for gambling and an increased usage of smartphones. The latter factor is considered to be the key element for future growth in the industry.
5.2 MFD – Step one This paragraph will consider the results obtained during step one of MFD: market segmentation obtained through market analysis and meetings with Kambi, customer values, product properties and the QFD matrix.
5.2.1 Market Segmentation Government Regulated Lotteries (GRL) They are state-owned betting companies which benefit from a monopoly in more or less gambling domains depending on the current local legislation. For example in Sweden casinos are state owned, while in France they can also be private companies. In both cases however the scratch card games are state monopolies. Profit is not their main objective; the sports book is a small part of their revenue when compared to the rest of their activities. They prioritize social welfare and are more subjected than others to political pressure. For example, it might be difficult to politically justify laying off their employees due to the outsourcing of their sports. Consequently it might be easier to target GRLs without an existing sports book offering.
Land-based operators Land-based operators are originally owners of brick and mortar shops who are interested in expanding their business to the online market. Land-based operators might be more interested in getting a full pack of online gaming and are the more likely to outsource the handling of its online business, as they lack knowledge of the online industry. Those operators need to build their customer base and will likely need some guidance in doing so. This is potentially the biggest market segment as many operators still have not realized the transition to the online market and as brick and mortar shops still represent 85% of the GGR of this industry.
0
5
10
15
20
Interactive Gross Win in billion €
Europe
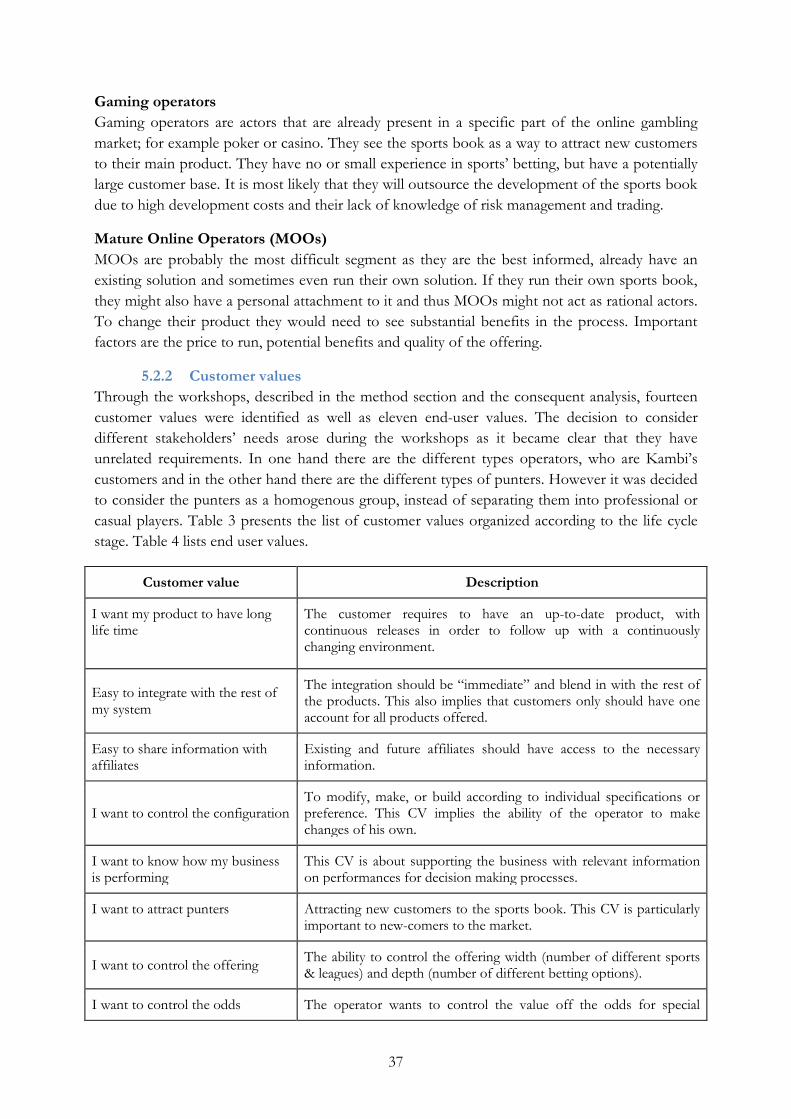
37
Gaming operators Gaming operators are actors that are already present in a specific part of the online gambling market; for example poker or casino. They see the sports book as a way to attract new customers to their main product. They have no or small experience in sports’ betting, but have a potentially large customer base. It is most likely that they will outsource the development of the sports book due to high development costs and their lack of knowledge of risk management and trading.
Mature Online Operators (MOOs) MOOs are probably the most difficult segment as they are the best informed, already have an existing solution and sometimes even run their own solution. If they run their own sports book, they might also have a personal attachment to it and thus MOOs might not act as rational actors. To change their product they would need to see substantial benefits in the process. Important factors are the price to run, potential benefits and quality of the offering.
5.2.2 Customer values Through the workshops, described in the method section and the consequent analysis, fourteen customer values were identified as well as eleven end-user values. The decision to consider different stakeholders’ needs arose during the workshops as it became clear that they have unrelated requirements. In one hand there are the different types operators, who are Kambi’s customers and in the other hand there are the different types of punters. However it was decided to consider the punters as a homogenous group, instead of separating them into professional or casual players. Table 3 presents the list of customer values organized according to the life cycle stage. Table 4 lists end user values.
Customer value Description
I want my product to have long life time
The customer requires to have an up-to-date product, with continuous releases in order to follow up with a continuously changing environment.
Easy to integrate with the rest of my system
The integration should be “immediate” and blend in with the rest of the products. This also implies that customers only should have one account for all products offered.
Easy to share information with affiliates
Existing and future affiliates should have access to the necessary information.
I want to control the configuration To modify, make, or build according to individual specifications or preference. This CV implies the ability of the operator to make changes of his own.
I want to know how my business is performing
This CV is about supporting the business with relevant information on performances for decision making processes.
I want to attract punters Attracting new customers to the sports book. This CV is particularly important to new-comers to the market.
I want to control the offering The ability to control the offering width (number of different sports & leagues) and depth (number of different betting options).
I want to control the odds The operator wants to control the value off the odds for special

38
events to either attract punters or to stand out from the competition by offer slightly different prices.
I want to understand my punters This CV means collection information to identify patterns and profitability, but also be able to provide better marketing and UX to the end users.
I want my product to be regionally relevant
The content provided should be adaptable to each geographical region the punter is located in.
I want to retain my punters The CV is about keeping and winning the loyalty of the end users.
I want my product to be compliant everywhere
The product should be compliant with local legislations around the world.
I want to have an efficient issue management
The software should deal with complaints of both the end-users(payments, event results) and of the operators (down time, extra events, customization and complaints).
I want to have a sophisticated risk management
This CV is about preventing fraudulent behavior and managing risks for each bet to optimize margins and secure revenues.
Table 3: Customer values
End-user value Description
I want betting to be exciting From an end-user perspective the sports book should be an exciting place to visit. Sports betting has become a social activity among friends. This means that everything that could disrupt the user experience will affect this CV.
I want betting to be straightforward
Betting should be straightforward and effortless. The experience should be the same no matter whether the punters are, in their couch with a tablet, at the office on a computer or while commuting on their smartphones.
I want to trust the operator As the operators are managing punters’ money, trust is essential to create loyalty.
I want to bet on what I like Punters want to bet on exactly the team or the sports they like. Therefore it’s essential to provide a wide range of offers to attract as many players as possible.
I want to receive feedback from activities that I make
This CV concern the feedback punters wants to receive after for instance winning a bet.
I want my bets to go through As soon as a punter makes a bet they expect it to immediately to go through.
I want to be able to bet wherever I am
Punters’ location should not hinder the possibility to bet. Consequently support for different platforms is required.
I expect to always have something to bet on The service should propose events around the clock.

39
I want to have a personalized experience
Punters want to have an influence on the organization of the content in order to have a more convenient experience.
I want to have assistance on betting choices (live score, news, preset of bets…)
Punters may want to have access to data to make informed decisions.
I want to monitor and control my betting habits
Punters want to be able to control their expenditures to protect themselves from unwanted consequences of online gambling.
Table 4: End user values
5.2.3 Customer & end user value ranking Customer value ranking
The ranking gives a first idea of what matters for each market segments. Concretely it indicates needs that are common to all segments and needs that are segment specific. This provides information on where product variants will be required.
Figure 18 shows the segment order winners (SOW) and ranking of each CV for the different segments.
Figure 18: Ranking of the customer values per segment
0
2
4
6
8
10
12
14
16
Segm
ent R
anki
ng
CV -Trend & Order Winners
MOOs GRLs Land operators
Gaming operators SOW Threshold
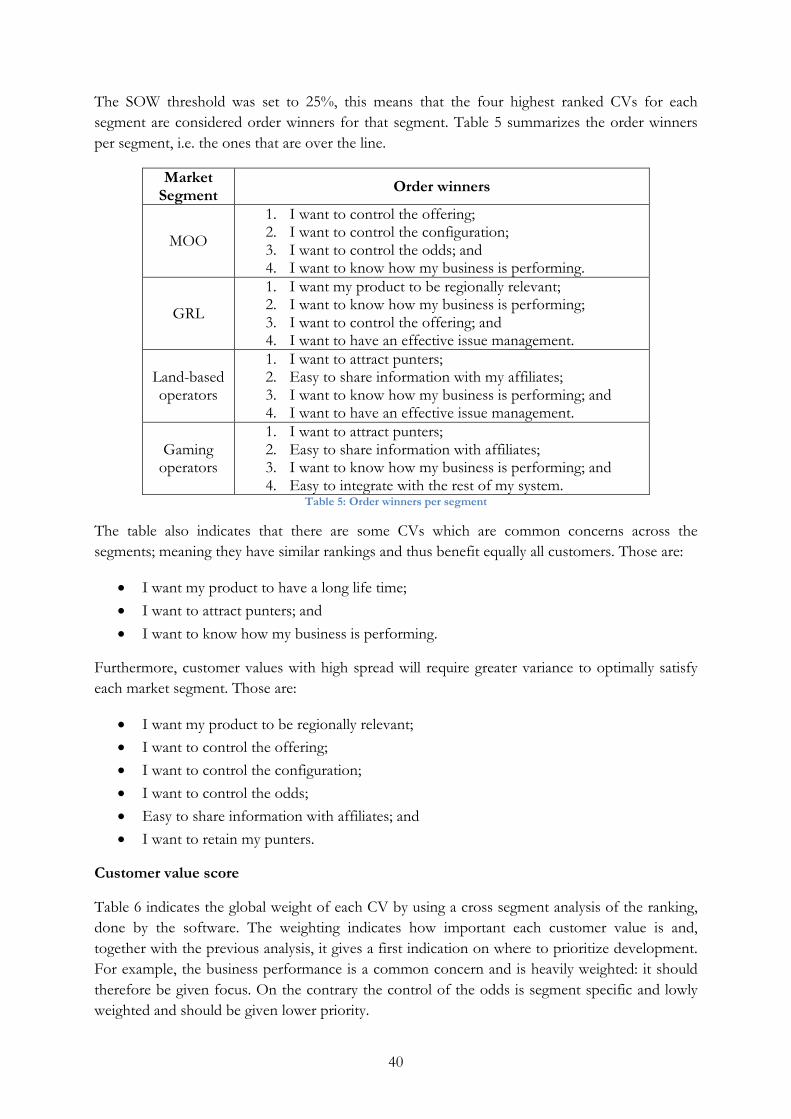
40
The SOW threshold was set to 25%, this means that the four highest ranked CVs for each segment are considered order winners for that segment. Table 5 summarizes the order winners per segment, i.e. the ones that are over the line.
Market Segment Order winners
MOO
1. I want to control the offering; 2. I want to control the configuration; 3. I want to control the odds; and 4. I want to know how my business is performing.
GRL
1. I want my product to be regionally relevant; 2. I want to know how my business is performing; 3. I want to control the offering; and 4. I want to have an effective issue management.
Land-based operators
1. I want to attract punters; 2. Easy to share information with my affiliates; 3. I want to know how my business is performing; and 4. I want to have an effective issue management.
Gaming operators
1. I want to attract punters; 2. Easy to share information with affiliates; 3. I want to know how my business is performing; and 4. Easy to integrate with the rest of my system.
Table 5: Order winners per segment
The table also indicates that there are some CVs which are common concerns across the segments; meaning they have similar rankings and thus benefit equally all customers. Those are:
• I want my product to have a long life time; • I want to attract punters; and • I want to know how my business is performing.
Furthermore, customer values with high spread will require greater variance to optimally satisfy each market segment. Those are:
• I want my product to be regionally relevant; • I want to control the offering; • I want to control the configuration; • I want to control the odds; • Easy to share information with affiliates; and • I want to retain my punters.
Customer value score
Table 6 indicates the global weight of each CV by using a cross segment analysis of the ranking, done by the software. The weighting indicates how important each customer value is and, together with the previous analysis, it gives a first indication on where to prioritize development. For example, the business performance is a common concern and is heavily weighted: it should therefore be given focus. On the contrary the control of the odds is segment specific and lowly weighted and should be given lower priority.
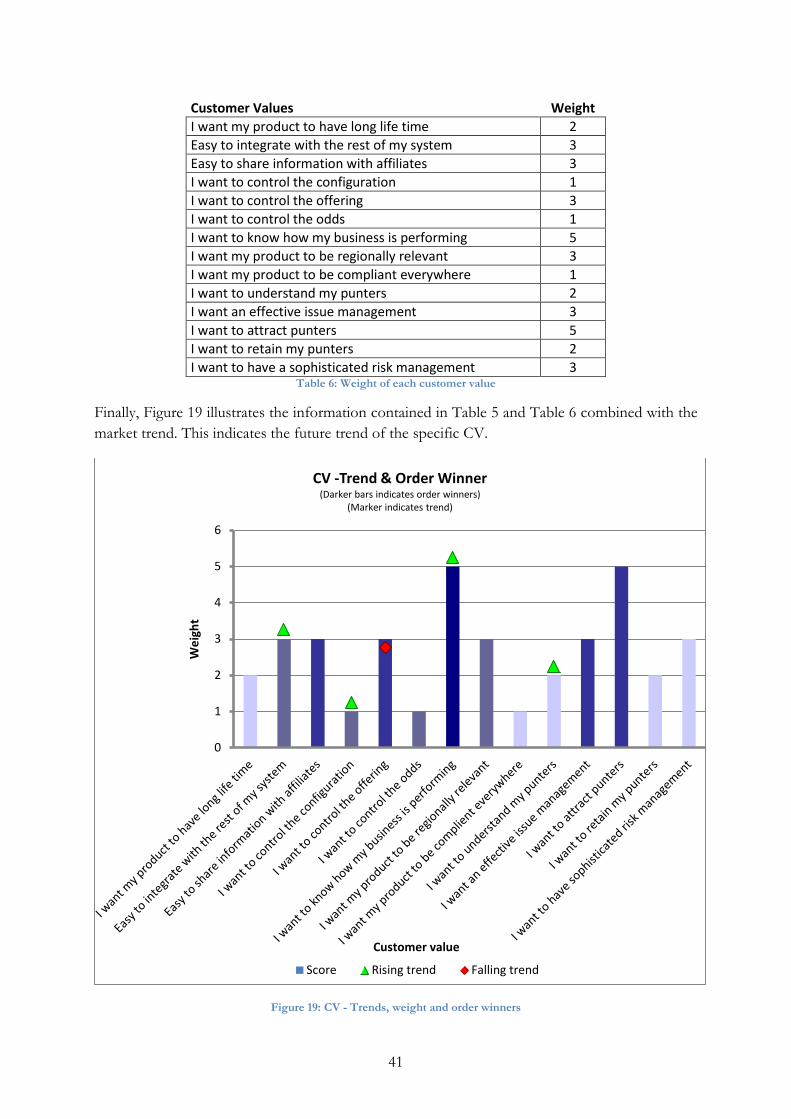
41
Customer Values Weight I want my product to have long life time 2 Easy to integrate with the rest of my system 3 Easy to share information with affiliates 3 I want to control the configuration 1 I want to control the offering 3 I want to control the odds 1 I want to know how my business is performing 5 I want my product to be regionally relevant 3 I want my product to be compliant everywhere 1 I want to understand my punters 2 I want an effective issue management 3 I want to attract punters 5 I want to retain my punters 2 I want to have a sophisticated risk management 3
Table 6: Weight of each customer value
Finally, Figure 19 illustrates the information contained in Table 5 and Table 6 combined with the market trend. This indicates the future trend of the specific CV.
Figure 19: CV - Trends, weight and order winners
0
1
2
3
4
5
6
Wei
ght
Customer value
CV -Trend & Order Winner (Darker bars indicates order winners)
(Marker indicates trend)
Score Rising trend Falling trend
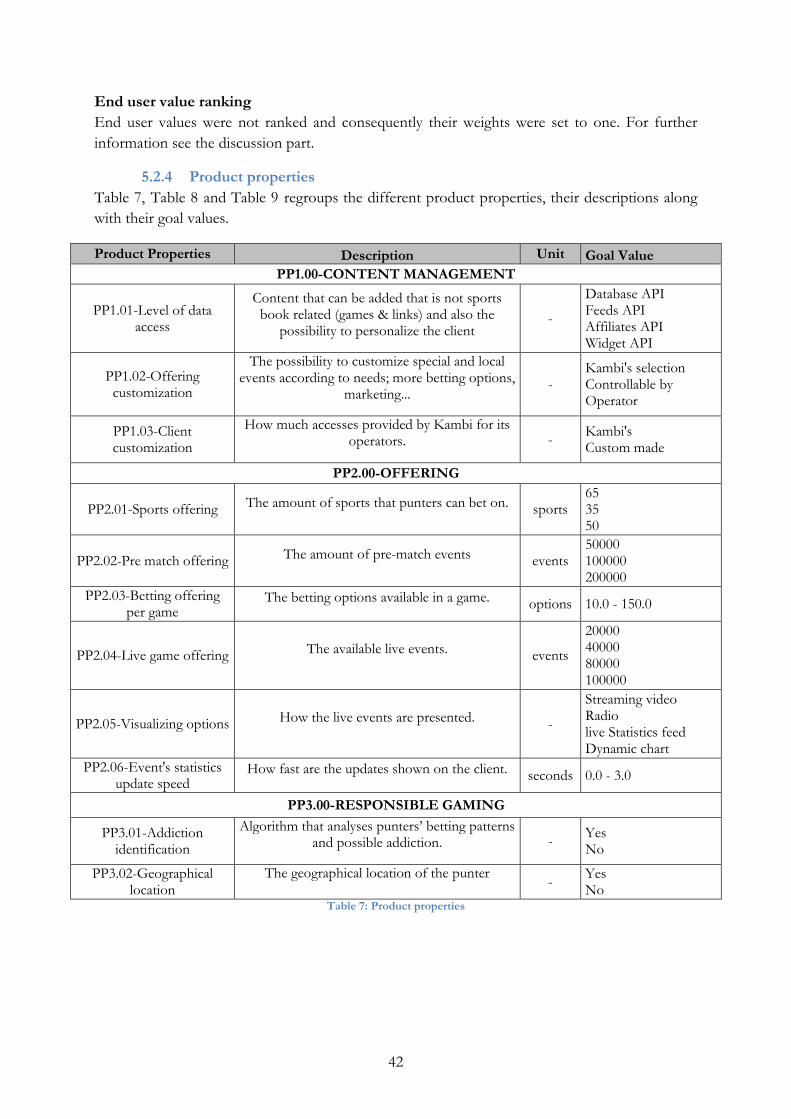
42
End user value ranking End user values were not ranked and consequently their weights were set to one. For further information see the discussion part.
5.2.4 Product properties Table 7, Table 8 and Table 9 regroups the different product properties, their descriptions along with their goal values.
Product Properties Description Unit Goal Value PP1.00-CONTENT MANAGEMENT
PP1.01-Level of data access
Content that can be added that is not sports book related (games & links) and also the
possibility to personalize the client -
Database API Feeds API Affiliates API Widget API
PP1.02-Offering customization
The possibility to customize special and local events according to needs; more betting options,
marketing... - Kambi's selection Controllable by Operator
PP1.03-Client customization
How much accesses provided by Kambi for its operators. - Kambi's
Custom made
PP2.00-OFFERING
PP2.01-Sports offering The amount of sports that punters can bet on. sports 65 35 50
PP2.02-Pre match offering The amount of pre-match events events 50000 100000 200000
PP2.03-Betting offering per game
The betting options available in a game. options 10.0 - 150.0
PP2.04-Live game offering The available live events. events 20000 40000 80000 100000
PP2.05-Visualizing options How the live events are presented. - Streaming video Radio live Statistics feed Dynamic chart
PP2.06-Event's statistics update speed
How fast are the updates shown on the client. seconds 0.0 - 3.0
PP3.00-RESPONSIBLE GAMING
PP3.01-Addiction identification
Algorithm that analyses punters’ betting patterns and possible addiction. - Yes
No PP3.02-Geographical
location The geographical location of the punter - Yes
No Table 7: Product properties

43
PP4.00-RISK MANAGEMENT
PP4.01-Punters' identity The basic account information gathered during
the creation of the account. - location sex age proof of identity
PP4.02-Punters' category
Kambi’s algorithm gives a score to each punter which will determine how
profitable/unprofitable a punter is. - Arbitrage Wise guys VIP Normal
PP4.03-Individual bet limit
Each game has a betting limit set by the trader. On top of this limit, punters can freely bet over a fixed individual percentage. This value depends on the profitability of the punter.
% 1.0 - 400.0
PP4.05-Bet countdown The lapse of time between the placement of a bet and its acceptance by the system. seconds 3.0 - 9.0
PP4.04-Fraudulent behaviour ID
Algorithm identifying suspicious behaviour (fixed and rigged matches/ cheating). - Yes
No
PP5.00-ODDS
PP5.01-Odds customization
The operator might want to change the odds to maximize gains on an event and/or to set itself
apart from competition. - preset customized
PP5.02-Odds format The way the odds presented to the punter. - decimal fractional US
PP5.03-Odds update latency
Time for the odds to be updated on the punters’ screens seconds 1
>1
PP6.00-SUPPORT
PP6.01-Report type The way the operators’ results are presented. -
paper TV monitor Mobile application web application
PP6.02-Level of feedback/performance
The level of feedback on performance the operators can receive - Raw data
Analyzed data PP6.03-Update frequency Time span between two software updates. weeks 2
PP7.00-CRM
PP7.01-Punters' habits
Identification of punters habits to better target advertisement but also use to improve UX
- favorite sports betting amount favorite team favorite events
PP7.02-Bonus offer customization
Operators ability to create/choose bonus -
Preset Partly customized Customized
PP7.03-Promotional offer customization
Operators ability to create/choose promotions -
Preset Partly customized Customized
Table 8: Product properties

44
PP8.00-REGULATION
PP8.01-Report bets Some regulations require each bet to be approved by the government. - Yes
No
PP8.02-Data location Regulations might impose the location of the data servers. countries Local
Centralized
PP8.03-Bets storing time Regulations might impose a minimum amount of time the bets must be stored months
12 24 36
PP8.04-Taxes types The software must be adapted to handle different kinds of taxes -
turnover fixed fee winning tax
PP9.00-END USERS
PP9.01-Quick search for events
The possibility for the punter to perform a quick search - Yes
No
PP9.02-Language options The client is translated into different languages languages 20
PP9.03-Different currencies
The client can handle different currencies -
Dollar Euro SEK NOK DKK CHF RUB BRL GBP
PP9.04-Supported platforms
The client has different versions for different platforms -
Mobile Tablet Web Retail
PP9.05-Notifications Punters receive notifications regarding news and their activity -
SMS Mail Online App Letter
PP9.06-Coupon type The way the coupon is presented -
Systems Combination Single
Table 9: Product properties
5.2.5 QFD matrix In this part, it was chosen to separately present the results for the different stakeholders. The QFD matrix for the operators is shown in Figure 20. The far right column shows the influence of product properties on customer values. A low score indicates that there are very few parameters influencing the CV. On the contrary, a high score suggests that the CV is controlled by too many PP and that it is therefore too general and should be split. Similarly, the last row gives a score to each product property by summing the product of each dot with the corresponding CV weight. As before a low score questions either the PP relevance or the

45
completeness of CV list. On the contrary a too highly scored product property might need to be split. The information is presented in Figure 21 for operators.
Operators’ QFD matrix Considering the last column, a simple data analysis gives a mean of 35 and a variance of 21.4, indicating that the values are spread and that in this method, the extreme values should be considered. The two biggest and two smallest values are now analyzed.
The lowest ranked CVs (“Easy to integrate with the rest of my system” and “Easy to share information with affiliates) are also the most technical ones. The low score was attributed to the authors’ limited knowledge in software engineering. Consequently both CV were kept as they are considered relevant in a customer’s perspective. The highest ranked CV (“I want to attract punters” and “I want to retain punters”) are also the ones that matter the most as they relate to the money source. Arguably everything affects the end users and the problem is to accurately identify the leading parameters. This is also why a matrix only for the end users’ needs were created in order to obtain a better understanding of what actually influences punters’ when they have to select one betting platform over another.
Figure 21 indicates that the product properties related with the offering (which directly influences the punters) are the most important ones. The need to have a product on multiple platforms also stands out as well as the need to offer a unique content.
End users’ QFD matrix A similar analysis can be performed on the end-users’ QFD matrix that can be found in Appendix 3. The product property score for end-users can be found in Appendix 4.

46
Figure 20: QFD matrix for operators
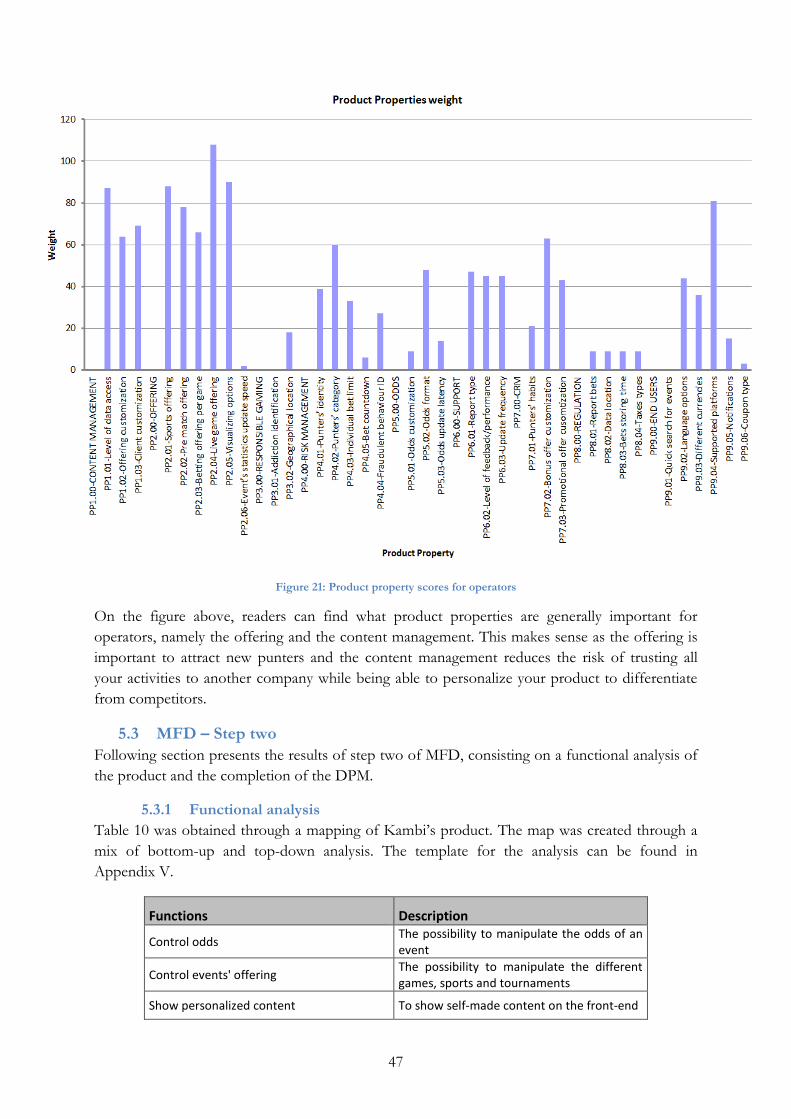
47
Figure 21: Product property scores for operators
On the figure above, readers can find what product properties are generally important for operators, namely the offering and the content management. This makes sense as the offering is important to attract new punters and the content management reduces the risk of trusting all your activities to another company while being able to personalize your product to differentiate from competitors.
5.3 MFD – Step two Following section presents the results of step two of MFD, consisting on a functional analysis of the product and the completion of the DPM.
5.3.1 Functional analysis Table 10 was obtained through a mapping of Kambi’s product. The map was created through a mix of bottom-up and top-down analysis. The template for the analysis can be found in Appendix V.
Functions Description
Control odds The possibility to manipulate the odds of an event
Control events' offering The possibility to manipulate the different games, sports and tournaments
Show personalized content To show self-made content on the front-end
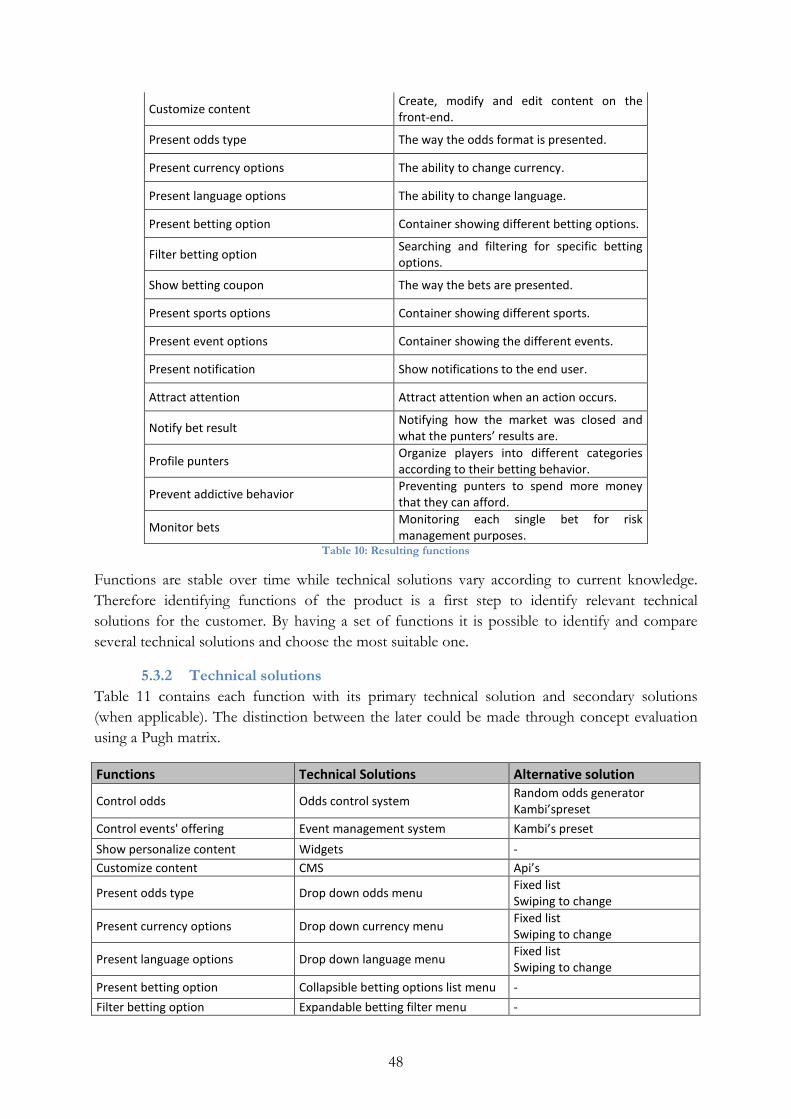
48
Customize content Create, modify and edit content on the front-end.
Present odds type The way the odds format is presented.
Present currency options The ability to change currency.
Present language options The ability to change language.
Present betting option Container showing different betting options.
Filter betting option Searching and filtering for specific betting options.
Show betting coupon The way the bets are presented.
Present sports options Container showing different sports.
Present event options Container showing the different events.
Present notification Show notifications to the end user.
Attract attention Attract attention when an action occurs.
Notify bet result Notifying how the market was closed and what the punters’ results are.
Profile punters Organize players into different categories according to their betting behavior.
Prevent addictive behavior Preventing punters to spend more money that they can afford.
Monitor bets Monitoring each single bet for risk management purposes.
Table 10: Resulting functions
Functions are stable over time while technical solutions vary according to current knowledge. Therefore identifying functions of the product is a first step to identify relevant technical solutions for the customer. By having a set of functions it is possible to identify and compare several technical solutions and choose the most suitable one.
5.3.2 Technical solutions Table 11 contains each function with its primary technical solution and secondary solutions (when applicable). The distinction between the later could be made through concept evaluation using a Pugh matrix.
Functions Technical Solutions Alternative solution
Control odds Odds control system Random odds generator Kambi’spreset
Control events' offering Event management system Kambi’s preset Show personalize content Widgets - Customize content CMS Api’s
Present odds type Drop down odds menu Fixed list Swiping to change
Present currency options Drop down currency menu Fixed list Swiping to change
Present language options Drop down language menu Fixed list Swiping to change
Present betting option Collapsible betting options list menu - Filter betting option Expandable betting filter menu -
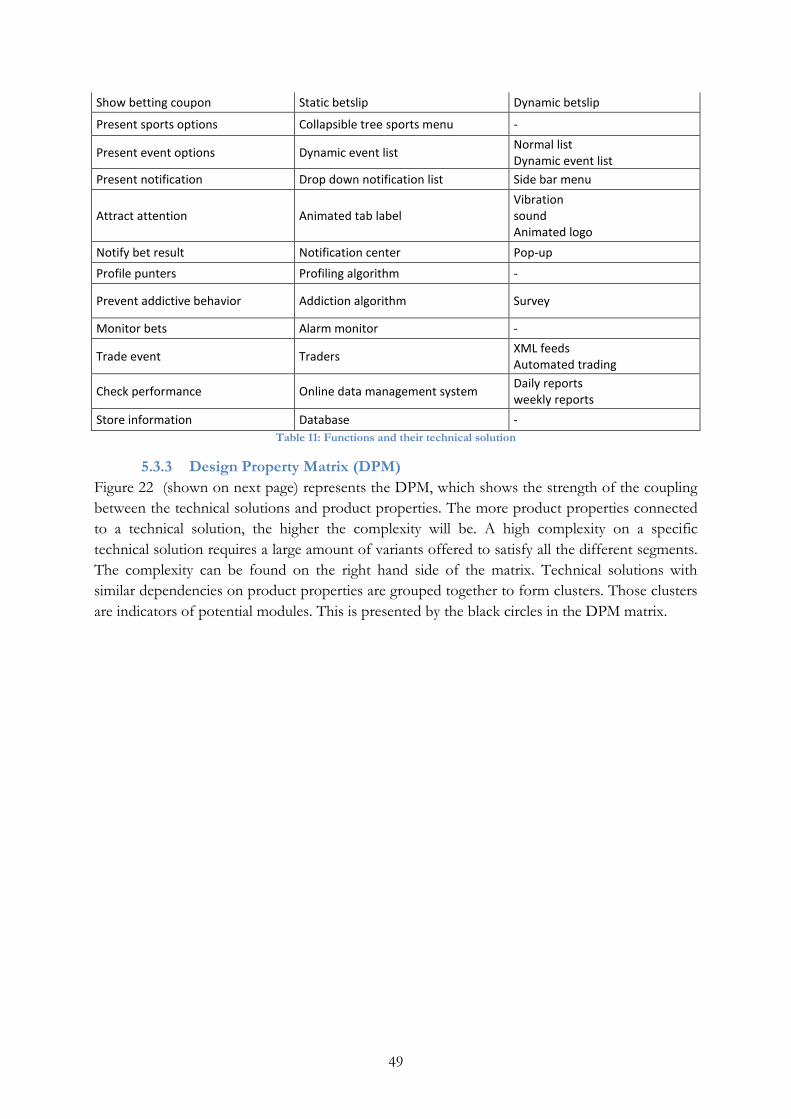
49
Show betting coupon Static betslip Dynamic betslip
Present sports options Collapsible tree sports menu -
Present event options Dynamic event list Normal list Dynamic event list
Present notification Drop down notification list Side bar menu
Attract attention Animated tab label Vibration sound Animated logo
Notify bet result Notification center Pop-up Profile punters Profiling algorithm -
Prevent addictive behavior Addiction algorithm Survey
Monitor bets Alarm monitor -
Trade event Traders XML feeds Automated trading
Check performance Online data management system Daily reports weekly reports
Store information Database - Table 11: Functions and their technical solution
5.3.3 Design Property Matrix (DPM) Figure 22 (shown on next page) represents the DPM, which shows the strength of the coupling between the technical solutions and product properties. The more product properties connected to a technical solution, the higher the complexity will be. A high complexity on a specific technical solution requires a large amount of variants offered to satisfy all the different segments. The complexity can be found on the right hand side of the matrix. Technical solutions with similar dependencies on product properties are grouped together to form clusters. Those clusters are indicators of potential modules. This is presented by the black circles in the DPM matrix.
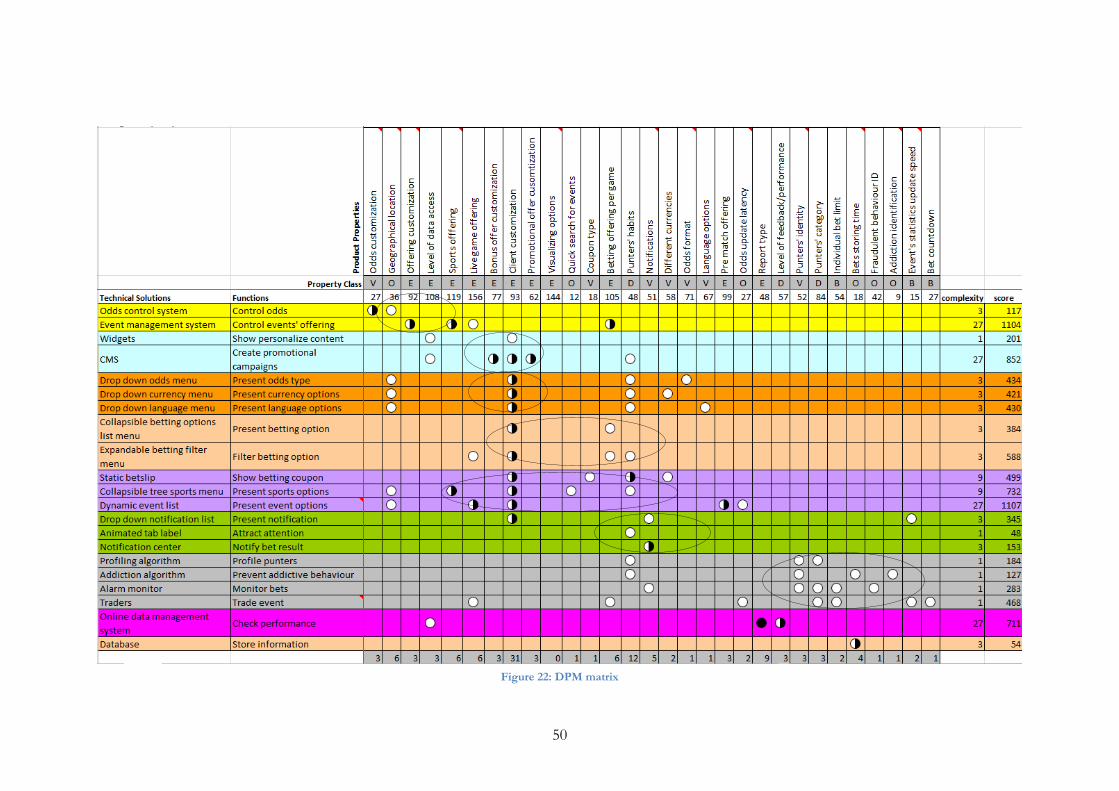
50
Figure 22: DPM matrix
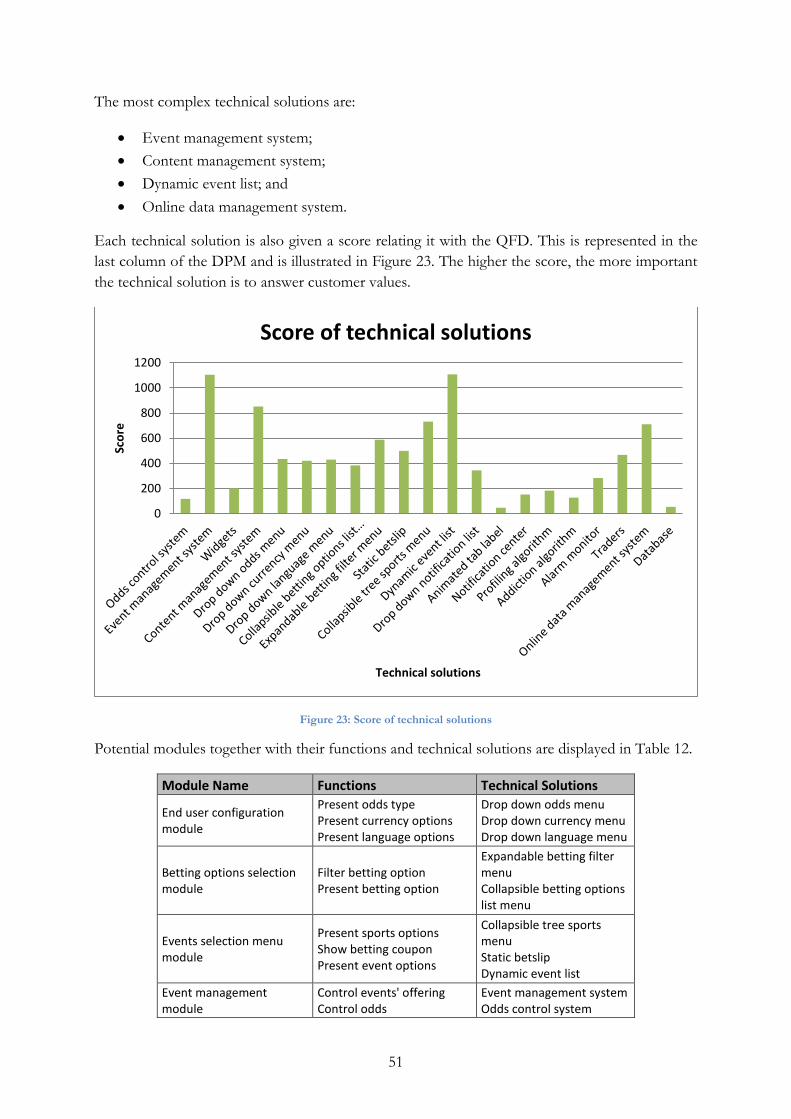
51
The most complex technical solutions are:
• Event management system; • Content management system; • Dynamic event list; and • Online data management system.
Each technical solution is also given a score relating it with the QFD. This is represented in the last column of the DPM and is illustrated in Figure 23. The higher the score, the more important the technical solution is to answer customer values.
Figure 23: Score of technical solutions
Potential modules together with their functions and technical solutions are displayed in Table 12.
Module Name Functions Technical Solutions
End user configuration module
Present odds type Present currency options Present language options
Drop down odds menu Drop down currency menu Drop down language menu
Betting options selection module
Filter betting option Present betting option
Expandable betting filter menu Collapsible betting options list menu
Events selection menu module
Present sports options Show betting coupon Present event options
Collapsible tree sports menu Static betslip Dynamic event list
Event management module
Control events' offering Control odds
Event management system Odds control system
0
200
400
600
800
1000
1200
Scor
e
Technical solutions
Score of technical solutions

52
Risk management module
Monitor bets Prevent addictive behaviour Profile punters Trade event
Alarm monitor Addiction algorithm Profiling algorithm Traders
Notification module Attract attention Present notification Notify bet result
Animated tab label Drop down notification list Notification center
Analyzing performance module Check performance Online data management
system
Manage content module Show personalize content Create promotional campaigns
Widgets CMS
Storing data module Store information Database Table 12: Potential modules
53
6 Critical view over the project This section will critically discuss, and justify the methods used for each step of the MFD, and consequently, evaluate the reliability of results. Additional, the reader will get an idea of which obstacles occurred in this projects journey.
6.1 Market segmentation
6.1.1 Discussion on the method This segmentation was mostly done with the help of Kambi and therefore carries their terms, except for the gaming operators. The reader should not think operator belong to only one categories; for example Paf first started as an operator on ferries between Sweden and Finland but it operated the online turn in 1998, which makes it an old actor in the sector with the same experience as a MOO. Also in this project it was decided not to take into account entrepreneurial operators; operators who do not have any experience whatsoever in sports betting. This decision was taken as even though Kambi has such customers, their strategy is directed towards more experienced actors and focus was given accordingly.
6.2 Customer values
6.2.1 Discussion on the method The actual customers were not available to meet, so the participants were recruited amongst Kambi’s collaborators. The challenge was in making them switch their perspectives. Indeed, in order to obtain as reliable data as possible it was important that participants did not consider themselves as Kambi’s employees but as potential customers of the ideal sports book. This also implied that they needed to “forget” all of their technical knowledge so as to become closer to an operator’s perspective. Else the following risks were incurred:
• To obtain a list of what Kambi does instead of what a customer would like his product to achieve; and
• To obtain a list of solutions and choices instead of a list of needs.
Listing which needs Kambi answers nowadays reduces the potential for future improvements, as focus is not given to what the actual needs of the customers are. Listing which solution Kambi adopted, adds no value for the same reasons. Having technical solutions instead of customers’ needs also reduced the potential to innovate, as one solution excludes all others. Contrarily, if the effort is made to seek the root reason (the customer’s need) then it can be hoped to find new ways to fulfill it. For example, one service that was repeatedly quoted is the importance of a 24/7 assistance or hotline. This is not a need; it is the answer (what we call a technical solution) for the need to have a good technical support. At first this might sound trivial and the reader might not understand why it is so important. To have solution free customers’ needs helps to keep the mind open to consider potentially innovating alternatives. Continuing with the same example, one can see that a mail service, or a technician coming in the customer’s office in less than one hour are different solutions of the same need as the one behind the 24/7 hotline (even if they are maybe not innovative or viable).
54
6.2.2 Discussion on the result Probably the absence of certain obvious concerns might have been flagrant: safety (transactions, data, access…) and communication among others are not present in the list. Indeed, for the first step of the method, it was more relevant to consider a “dumb” customer only concerned with the functionalities of the software. Or to use previous terms, the customer worries about “what the system does” and the engineers about “what the system is”. Indeed those cross cutting concerns could be used during the concept evaluation as internal criteria, as they should guide the technical choices made by the developing team.
6.3 Ranking of customer values
6.3.1 Discussion on the method In order to obtain the ranking of the customer values according to segments, two methods were considered. The first one was a drag and drop ranking survey. The other one was a pairwise ranking matrix (PRM). The main distinction between those two solutions is the amount of variables to handle. With a survey of N entries, the participant has to solve one problem with N variables. While with PRM, the participant has to solve N problems with two variables. The difficulty is thus reduced but the problem becomes considerably larger and longer to solve. The relevance of this point would be determined by the audience to participate in the survey.
Next, the audience had to be decided upon. Concretely three sources were available: Kambi, the operators and the authors of this paper; a discussion on the pros and cons of each follows.
Kambi employees were arguably the easiest to reach and the ones who could have dedicated more time to a more complete survey, as it is in the interest of their organization. However, the reason behind this project was for Kambi to try and obtain an external vision of the situation and see if Kambi’s view of the market is aligned with the market. Furthermore, there was an inherent risk of bias; having the needs that Kambi fulfill best on top of the ranking. Finally, this exercise would have required for the participants to put themselves in the shoes of operators from different segments. From the workshop experience it was shown that this is not so easily achieved.
Asking the operators seemed the natural and obvious thing to do, as it was precisely their vision that needed to be captured; and they would provide us with information directly related to their segment. However, a customer from Kambi would be difficult to reach as they are spread worldwide. Also, the probability of having an answer dropped even further if considering other operators outside of Kambi’s network. Therefore the survey had to be simplified and made as short as possible. Furthermore, Kambi has ten different customers representing only the retail segment and the MOO segment. This is also a limitation when trying to obtain an accurate view of what is important for each market segment. Finally, to have reliable and scientific results through the survey a much more significant pool of participating operator in each segment was needed.
Finally, the authors also did in their own ranking as it was interesting to compare the results with the different survey participants, but it was not presented in the results.
55
6.3.2 Discussion on the results The ranking gives a first idea of what matters for each market segments. Concretely it indicates needs that are common to all and needs that are specific. This provides information on where variance will be required or not. The ranking shows that regional relevance concern is specific to the segment while the need to understand the punters is a common concern.
The weighting in another hand tells how important each customer value is and might give an indication on where to prioritize development. For example, the business performance is a common concern and is heavily weighted: it should therefore be given focus. On the contrary the control of the odds is segment specific and lowly weighted and should be given lower priority.
6.4 Obtaining product properties
6.4.1 Discussion on the method To gather product properties another option was considered than the one presented in the method section. It was planned to distribute fishbone diagram to some people with a more technical background: they would then have to fill it for a few given customer values with the instructions not to think as a Kambi’s employee but as a general software developer. Proceeding this way had the advantage to use little of Kambi’s resources and the people concerned could spread this extra workload over one week. On the minus side, this approach might have been too minimalistic and, consequently, the participants might have been confused about how much detail was expected from them and it is why this way of proceeding was abandoned.
6.5 Filling the QFD matrix To some extent the strength of the relationship between a customer value and a product property is subjective and will vary accordingly depending on the person in charge. Thus, the results in the QFD matrix are not intended to be exact, they can be considered as a model. Arguably, if it had been done by a software engineer, the same product properties would not have been used to represent the fundamental characteristics of the system being studied.
6.6 Functional analysis According to the limitations of this paper, only functional requirements were considered. Consequently, functions regarding safety, encryption of data, transfer of information and communication with other software/platforms were not included in the map.
6.7 Concept Evaluation The foremost issue was the authors’ lack of specific knowledge in the area. This might have limited the pool of possible technical solutions but also of relevant internal criteria as well as the appropriate filling of the Pugh matrix.

56
7 Discussion and Final words Following section verifies the hypothesis and answers the project goals.
• Hypothesis: MFD can be successfully applied to a software • RQ 1: Through MFD, give Kambi another input on how to approach the different
market segments • RQ 2: Use MFD to give Kambi another input on their product architecture based on
customers’ needs.
7.1 Answering RQ1 This research question was answered through the first step of MFD. The customer value ranking, indicate what Kambi should prioritize when targeting different market segments. Table 5 offers a segment to segment view of the ranking. This combined with Table 6, indicating the weight of each customer value should shows that Kambi should develop tools for greater content control, keep investing in new ways to attract punters, provide more tools for operators and to check their performances. This answers the “what” however the “how” was answered by Figure 21. Here the reader can see that of all the identified product properties the ones that have the greater overall impact on customer values are the ones relating to the offering and the ones providing control to the operators. Those two families of product properties allow to control some of the customer values previously identified as important. Indeed, even if the customer value “I want to know how my business is performing” was the most important one in the ranking, its controlling parameter “Level of feedback/performance” is comparatively lowly ranked. However this should not be interpreted as a sign of the unimportance of the parameter. Instead it only means that there is little in the sports book product itself that controls this customer requirement; it should be developed further in another dedicated application.
7.2 Answering RQ2 The answers for this research question was done through the interpretations of both step 1 and step 2 of MFD. More specifically, through Figure 18: Ranking of the customer values and Figure 25: DPM matrix, together with Table 11: Functions and their technical solutions and Table 5: Order winners per segment. Analysis indicates that Kambi’s focus in the future should be in the following areas:
Higher flexibility of the system Offer more tools New innovative features for both operators and end users
Investigation of the CV’s shows that customers expect to have more control over the product, especially the MOO segment. Nevertheless, this area of concern is extensively discussed in various industry related magazines as a key factor in order to stand out from the competition. Therefore it is suggested that Kambi should offer more customization options in their front end client to their customers. These customization options could be based on the potential modules indicated in the DPM. The design property matrix suggests that the front-end client should be divided into smaller technical solutions such as “drop-down odds menu” or the “collapsible list menu”. It is possible to offer several variants in which the customer can choose among, allowing more unique customized products by standardizing the interfaces between the technical solutions.

57
Figure 24 shows a conceptual model of a front-end client based on modules in which the operators by themselves can choose which one to use.
Figure 24: Modularized client
One of the benefits with MFD is the possibility to see how the matrixes are connected in the other way round. More concretely, it is possible to see which CV will be affected if a technical solution changes. This way of thinking resulted in suggestions on which tools Kambi should provide to create more value for the customers. These tools are completely based on customer requirements that were identified in chapter 2.1.
The ability to monitor the performance of the company in real time has proven to be a key factor for all segments. With this in mind, Kambi should focus on creating a tool that will allow the operators to monitor KPI’s in real-time. These key figures could be presented trough for instance, a web based applet with interactive charts and graphs. The benefit of this solution is that operators can monitor if a bonus has attracted more players or if certain advertisement succeeded in its mission to generate higher revenues. By offering sophisticated tools for this purpose will allow operators to be more efficient in their marketing strategies by receiving an instant feedback on their performance.
Figure 18 in chapter 2 illustrates the importance of all the customer values. A further investigation of this figure shows that the CV “I want to control the offering” is an order winner for two of the targeted segments. Furthermore, one can see that the CV “I want to control the

58
odds” is also highly ranked by one of the segments. Both these CV’s are connected to the possibility to manipulate a game, type of betting options for that game and the odds value each option should have. To satisfy this customer preference Kambi needs to develop tools that will allow operators to control the offering and manipulate the odds. A possible solution for this is to allow each operator to have an interval where they can adjust the odds to their liking, and thus there is a possibility that each actor in Kambis’ infrastructure can have different odds.
So far, we have discussed various ways to satisfy customer values to operators. However, it is through end users that operators generate revenues. This leads us to the conclusion that Kambi should keep putting high focus on enhanced functionality of the front-end client. A future development suggestion is that the front-end client should adapt to the customers habits. A brief glance at Appendix IV confirms the need of such solution as it shows that the product property "Punters habits" have a lot of customer values connected to it. Further analysis of this figure also shows that the highest ranked product property for end-users is "Notifications". This is also a product feature that the authors have noticed is missing on basically every sports book, but possibly is sought after by many customers as the function is associated with many customer values.
The meaning of RQ2 was to provide an input to Kambi product architecture by interpreting the results of the different steps of the method. The authors' proposal is meant to provide guidelines in how the results can be interpreted and we are very well aware that different people will draw different conclusions. As an example, we recommended a notification center to notify players on the result. However this can be solved in multiple ways and therefore, we assign it to Kambi so that they continue to interpret the results and come up with innovative solutions to meet the customer’s request.
7.3 Verifying hypothesis This thesis has tried to provide a new approach to software architecture, one more suited when the recyclability of previous works is low. The literature review exposed the readers to the concepts that were used throughout the project. It detailed the concepts of modularity and MFD. The role of the part on software architecture was to highlight the lack of frame when a new and original problem appeared. Also the authors tried to highlight the difference between what they saw as a top-down approach against their suggested bottom-up approach. The method part presented the framework and the procedures followed by the authors. The reader could distinguish two distinct methodological parts: first the gathering of information and second the processing of this information on the PALMATM software. In the result part the authors analyzed the data obtained and in step one they provided the solution for RQ1 while in step two the clusters are a suggestion to answer RQ2. Finally in the last part, the authors tried to have a critical eye over their work and tried to some extent to justify the choices they made during the six months spent working on the project.
This project’s primary goal was to investigate whether or not MFD can be applied to software. It appears achievable however there are some obstacles that could not be treated in this thesis and that should be further investigated. The biggest difficulty emerged from the product itself. The company sells services, which are partially embodied in the software. For example assistance to operators is part of the services provided by the sports book but it is not a part of the software

59
itself. How should this be handled? Even though the need for assistance is a customer requirement, should it be considered as a part of the product? And if not considered, is it still the same product? Then there was the complexity of the software itself which was made of eleven different software. This could pose problems in the remaining more technical steps of MFD; those not considered in this project.
Difficulties in applying MFD to software appeared early in the process. For a B2B company it is not enough to consider only customers, but they should be mindful of all potential users. This required not to only taking into account customer values but also end user values to identify all the relevant stakeholders’ needs. Non-functional requirements and cross cutting concerns
However, not all limitations were due to the software or the method. The authors’ limited knowledge in software architecture and in the applications of MFD were an obstacle. This appeared clearly when trying to determine the proper level for product properties: i.e. they should not be too general and not too specific. For the same reasons, it was tedious to find adequate goal values and technical solutions. Concretely, this led into mixing technical solution with functions and product properties.
Finally there is one remaining barrier towards implementation of MFD to software architecture. Does MFD have the necessary tools to meet the necessities of software architecture, briefly presented in the literature review? If not, can it then be used as a complementary tool, used to determine potential clusters of functions?

60
8 Bibliography Betsson AB, Gaming Magazine n°13, 2014
Bosch, Jan. 2004. « Software Architecture: The Next Step ». In Software Architecture, édité par Flavio Oquendo, Brian C. Warboys, et Ron Morrison, 194‑ 199. Lecture Notes in Computer Science 3047. Springer Berlin Heidelberg. http://link.springer.com/chapter/10.1007/978-3-540-24769-2_14.
Charette, R.N. 2005. « Why software fails [software failure] ». IEEE Spectrum 42 (9): 42‑ 49. doi:10.1109/MSPEC.2005.1502528.
Coplien, James O., et Gertrud Bjørnvig. 2011. Lean Architecture: For Agile Software Development. John Wiley & Sons.
European gambling and betting association. 2014. «Market reality». Consulted February 13th. http://www.egba.eu/facts-and-figures/market-reality
eGaming Review. 2013. «Power 50 companies». Consulted March 3rd. http://www.egrpower50.com
Gunnar Erixon. 1998. «Modular Function Deployment - A method for product modularization». Kungliga Tekniska Högskolan. ISSN 1104-2141.
Gunnar Erixon and Roger Stake. 2003. «Course booklet: Modular Product design». Kungliga Tekniska Högskolan.
Ian Sommerville. 2006. «Software engineering, 8th edition». University of St. Andrews. Pearson
« ISO/IEC/IEEE Systems and software engineering – Architecture description ». 2011. ISO/IEC/IEEE 42010:2011(E) (Revision of ISO/IEC 42010:2007 and IEEE Std 1471-2000), décembre, 1‑ 46. doi:10.1109/IEEESTD.2011.6129467.
Kambi group plc. 2014. «Company description for listing on NASDAQ OMX First North».
Kruchten, Philippe, Henk Obbink, et Judith Stafford. 2006. « The Past, Present, and Future for Software Architecture ». IEEE Software.
Michael Treacy and Fred Wiersema. 1997. «The discipline of market leaders». Addison Wesley. ISBN 978-0201407198.
Microsoft. 2014a. « Chapter 2: Key Principles of Software Architecture ». Consulté le février 26. http://msdn.microsoft.com/en-us/library/ee658124.aspx.
———. 2014b. « Chapter 1: What is Software Architecture? » Consulté le février 26. http://msdn.microsoft.com/en-us/library/ee658098.aspx.
———. 2014c. « Chapter 3: Architectural Patterns and Styles ». Consulté le février 24. http://msdn.microsoft.com/en-us/library/ee658117.aspx.
Modular Management. 2013. MG2020: Modularization, lectures 0 to 4. Kungliga Tekniska Högskolan
Unibet group plc. 2014. «Annual report and accounts 2014».
Vogel, Oliver, Ingo Arnold, Arif Chughtai, et Timo Kehrer. 2011. Software Architecture: A Comprehensive Framework and Guide for Practitioners. Springer.

61

62
9 Appendices
Appendix 1: Survey send to participants in order to obtain the ranking of customer values for the different market segments
APPENDIX II
Appendix 2: Functional analysis - bottom-up template

63
Appendix 3: QFD matrix for end-users
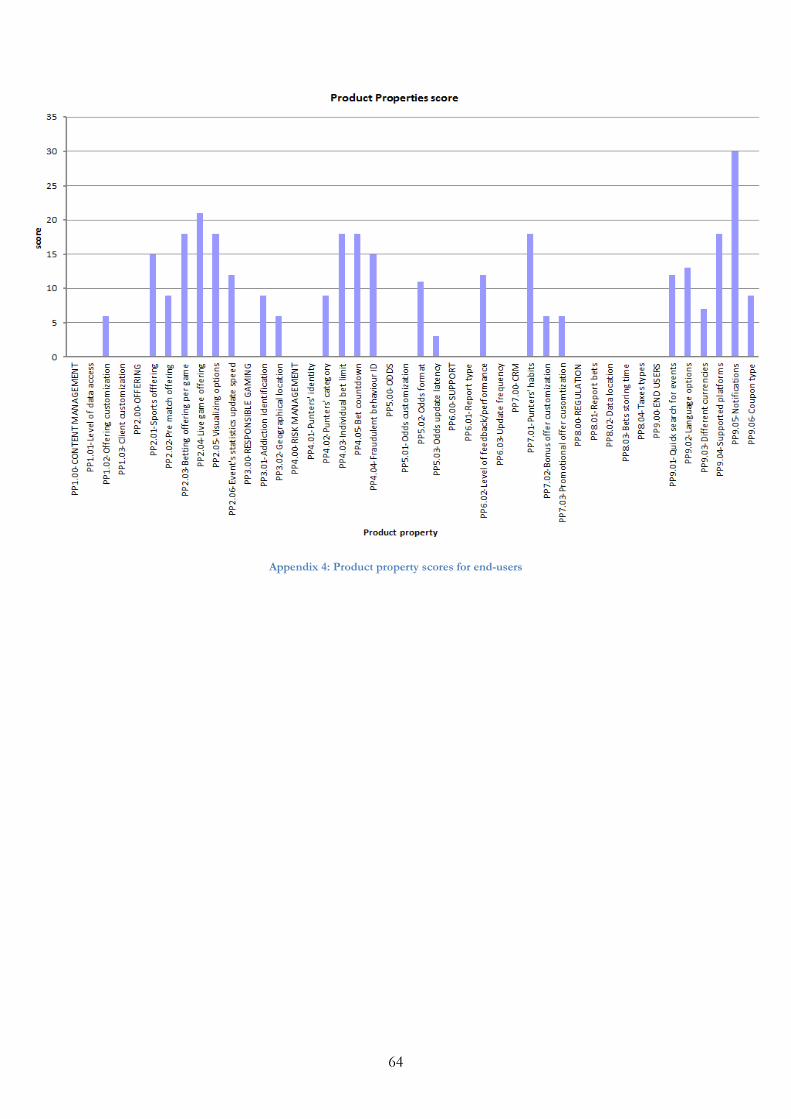
64
Appendix 4: Product property scores for end-users
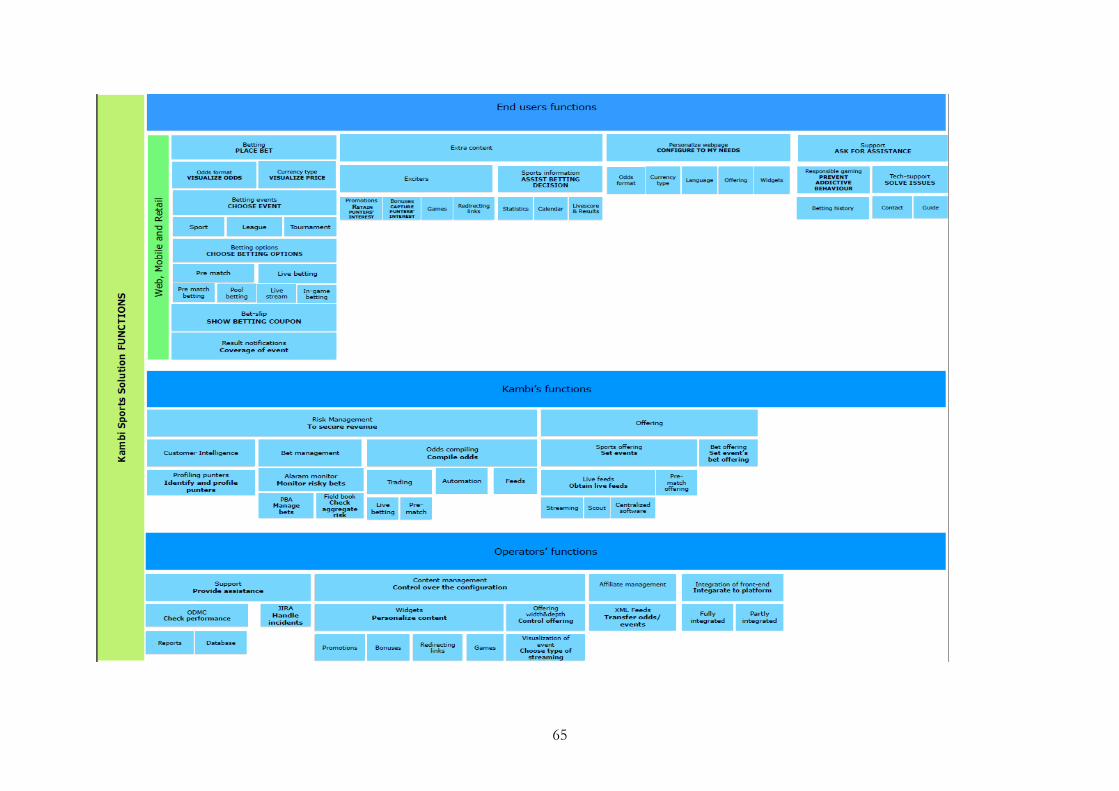
65