Embed Size (px)
Citation preview

The
info
rmat
ion
inth
ispr
elim
inar
ypr
ospe
ctus
isno
tcom
plet
ean
dm
aybe
chan
ged.
We
may
nots
ellt
hese
secu
ritie
sun
tilth
ere
gist
ratio
nst
atem
entf
iled
with
the
Secu
ritie
san
dEx
chan
geCo
mm
issi
onis
effe
ctiv
e.Th
ispr
elim
inar
ypr
ospe
ctus
isno
tan
offe
rto
sell
thes
ese
curit
ies
and
itis
not
solic
iting
anof
fer
tobu
yth
ese
secu
ritie
sin
any
juris
dict
ion
whe
reth
eof
fero
rsal
eis
notp
erm
itted
.
Subject to Completion, dated June 22, 2021Preliminary Prospectus
26,666,667 Shares
Krispy Kreme, Inc.Common Stock
This is an initial public offering of shares of common stock of Krispy Kreme, Inc. We are offering 26,666,667 shares of our commonstock.
We expect the initial public offering price will be between $21.00 and $24.00 per share. Currently, no public market exists for our commonstock.
We intend to use the net proceeds that we receive from this offering to repay certain of our outstanding indebtedness under the TermLoan Facility (as defined herein), to repurchase shares of common stock from certain of our executive officers at the price to be paid by theunderwriters (the “share repurchase”), and to make payments in respect of tax withholdings relating to certain restricted stock units that willvest or for which vesting will be accelerated in connection with this offering, with the remainder to be used for general corporate purposes.
We have granted the underwriters an option for a period of 30 days after the date of this prospectus to purchase up to an additional4,000,000 shares of common stock from us, at the initial public offering price less the underwriting discounts and commissions.
Following this offering, we will have one class of authorized common stock. Holders of our common stock will be entitled to one voteper share on all matters to be voted on by stockholders. Immediately upon the completion of this offering and the share repurchase and priorto the Distribution (as defined herein), investors purchasing common stock in this offering will own approximately 16.6% of our commonstock (or approximately 18.6% if the underwriters exercise their option to purchase additional shares of common stock in full), and JABHoldings B.V. (“JAB”), will beneficially own approximately 77.6% of our common stock through its affiliates (or approximately 75.7% if theunderwriters exercise their option to purchase additional shares of common stock in full), prior to giving effect to any purchase by JAB ofshares in this offering. Following the Distribution, JAB will beneficially own approximately 38.6% of our common stock through its affiliates(or approximately 37.7% if the underwriters exercise their option to purchase additional shares of common stock in full), prior to giving effectto any purchase by JAB of shares in this offering.
We intend to apply to list our shares of common stock on the NASDAQ Global Select Market (“Nasdaq”) under the symbol “DNUT”.
Investing in our common stock involves risks. See “Risk Factors” beginning on page 30 to read about certain factorsyou should consider before buying our common stock.
Neither the Securities and Exchange Commission (the “SEC”) nor any state securities commission has approved or disapproved ofthese securities or passed upon the adequacy or accuracy of this prospectus. Any representation to the contrary is a criminal offense.
PerShare Total
Initial public offering price (1) . . . . . . . . . . . . . . . . . . . . . . . . . . . . . . . . . . . . . . . $ $Underwriting discounts and commissions (2) . . . . . . . . . . . . . . . . . . . . . . . . . . . $ $Proceeds, before expenses . . . . . . . . . . . . . . . . . . . . . . . . . . . . . . . . . . . . . . . . . $ $
(1) The public offering price for the shares sold to the public was $ per share. The price for the shares being purchased by JAB andOlivier Goudet was $ per share.
(2) See “Underwriting (Conflict of Interest)” for a description of the compensation payable to the underwriters. No underwriting discountwas paid with respect to the shares being purchased by JAB and Olivier Goudet.JAB and Olivier Goudet, Chairman of the Company, have indicated an interest in purchasing between $50 million and $100 million, and
$5 million, respectively, in shares of common stock in this offering at a price equal to the price paid by the public, less the underwritingdiscount. Because this indication of interest is not a binding agreement or commitment to purchase, JAB and Mr. Goudet could determine topurchase more, less or no shares in this offering or the underwriters could determine to sell more, less or no shares to JAB and Mr. Goudet.
The underwriters expect to deliver the shares of common stock against payment on or about , 2021.Lead Book-Running Managers
J.P. Morgan Morgan StanleyBofA Securities Citigroup
Joint-Book Running Managers
BNP PARIBAS Deutsche Bank Securities Evercore ISIGoldman Sachs & Co. LLC HSBC Truist Securities Wells Fargo Securities
Co-Managers
Capital One Securities C.L. King & Associates Credit Agricole CIBMischler Financial Group, Inc. MUFG Ramirez & Co., Inc.Santander Investment Securities Inc. Siebert Williams Shank
Prospectus dated , 2021


TABLE OF CONTENTS
PROSPECTUS SUMMARY . . . . . . . . . . . . . . . . . . . . . . . . . . . . . . . . . . . . . . . . . . . . . . . . . . . . . . . . . . . . . . 1ABOUT THIS PROSPECTUS . . . . . . . . . . . . . . . . . . . . . . . . . . . . . . . . . . . . . . . . . . . . . . . . . . . . . . . . . . . . . 15THE OFFERING . . . . . . . . . . . . . . . . . . . . . . . . . . . . . . . . . . . . . . . . . . . . . . . . . . . . . . . . . . . . . . . . . . . . . . . . 19SUMMARY HISTORICAL CONSOLIDATED FINANCIAL INFORMATION . . . . . . . . . . . . . . . . . . . . . 23RISK FACTORS . . . . . . . . . . . . . . . . . . . . . . . . . . . . . . . . . . . . . . . . . . . . . . . . . . . . . . . . . . . . . . . . . . . . . . . . 30REORGANIZATION . . . . . . . . . . . . . . . . . . . . . . . . . . . . . . . . . . . . . . . . . . . . . . . . . . . . . . . . . . . . . . . . . . . . 57SPECIAL NOTE REGARDING FORWARD-LOOKING STATEMENTS . . . . . . . . . . . . . . . . . . . . . . . . . . 58USE OF PROCEEDS . . . . . . . . . . . . . . . . . . . . . . . . . . . . . . . . . . . . . . . . . . . . . . . . . . . . . . . . . . . . . . . . . . . . 60DIVIDEND POLICY . . . . . . . . . . . . . . . . . . . . . . . . . . . . . . . . . . . . . . . . . . . . . . . . . . . . . . . . . . . . . . . . . . . . 62CAPITALIZATION . . . . . . . . . . . . . . . . . . . . . . . . . . . . . . . . . . . . . . . . . . . . . . . . . . . . . . . . . . . . . . . . . . . . . 63DILUTION . . . . . . . . . . . . . . . . . . . . . . . . . . . . . . . . . . . . . . . . . . . . . . . . . . . . . . . . . . . . . . . . . . . . . . . . . . . . 65MANAGEMENT’S DISCUSSION AND ANALYSIS OF FINANCIAL CONDITION AND RESULTS
OF OPERATIONS . . . . . . . . . . . . . . . . . . . . . . . . . . . . . . . . . . . . . . . . . . . . . . . . . . . . . . . . . . . . . . . . . . . . 67BUSINESS . . . . . . . . . . . . . . . . . . . . . . . . . . . . . . . . . . . . . . . . . . . . . . . . . . . . . . . . . . . . . . . . . . . . . . . . . . . . 100MANAGEMENT . . . . . . . . . . . . . . . . . . . . . . . . . . . . . . . . . . . . . . . . . . . . . . . . . . . . . . . . . . . . . . . . . . . . . . . 128COMPENSATION DISCUSSION AND ANALYSIS . . . . . . . . . . . . . . . . . . . . . . . . . . . . . . . . . . . . . . . . . . . 135CERTAIN RELATIONSHIPS AND RELATED PARTY TRANSACTIONS . . . . . . . . . . . . . . . . . . . . . . . . 153PRINCIPAL STOCKHOLDERS . . . . . . . . . . . . . . . . . . . . . . . . . . . . . . . . . . . . . . . . . . . . . . . . . . . . . . . . . . . 156DESCRIPTION OF CAPITAL STOCK . . . . . . . . . . . . . . . . . . . . . . . . . . . . . . . . . . . . . . . . . . . . . . . . . . . . . . 159SHARES ELIGIBLE FOR FUTURE SALE . . . . . . . . . . . . . . . . . . . . . . . . . . . . . . . . . . . . . . . . . . . . . . . . . . 163MATERIAL U.S. FEDERAL INCOME AND ESTATE TAX CONSIDERATIONS
FOR NON-U.S. HOLDERS . . . . . . . . . . . . . . . . . . . . . . . . . . . . . . . . . . . . . . . . . . . . . . . . . . . . . . . . . . . . . 165UNDERWRITING (CONFLICT OF INTEREST) . . . . . . . . . . . . . . . . . . . . . . . . . . . . . . . . . . . . . . . . . . . . . 169LEGAL MATTERS . . . . . . . . . . . . . . . . . . . . . . . . . . . . . . . . . . . . . . . . . . . . . . . . . . . . . . . . . . . . . . . . . . . . . 184EXPERTS . . . . . . . . . . . . . . . . . . . . . . . . . . . . . . . . . . . . . . . . . . . . . . . . . . . . . . . . . . . . . . . . . . . . . . . . . . . . . 184WHERE YOU CAN FIND ADDITIONAL INFORMATION . . . . . . . . . . . . . . . . . . . . . . . . . . . . . . . . . . . . . 185INDEX TO FINANCIAL STATEMENTS . . . . . . . . . . . . . . . . . . . . . . . . . . . . . . . . . . . . . . . . . . . . . . . . . . . F-1
Through and including , 2021 (the 25th day after the date of this prospectus), all dealerseffecting transactions in these securities, whether or not participating in this offering, may be required todeliver a prospectus. This is in addition to a dealer’s obligation to deliver a prospectus when acting as anunderwriter and with respect to an unsold allotment or subscription.
We and the underwriters have not authorized anyone to provide you with different or additional informationor to make any representations other than those contained in this prospectus or in any free writing prospectuseswe have authorized for use with respect to this offering. We and the underwriters take no responsibility for, andcan provide no assurance as to the reliability of, any other information that others may give you or anyrepresentation that others may make to you. We and the underwriters are not making an offer of these securitiesin any state, country or other jurisdiction where the offer is not permitted. You should not assume that theinformation in this prospectus or any free writing prospectus is accurate as of any date other than the date of theapplicable document regardless of its time of delivery or the time of any sales of our common stock. Ourbusiness, financial condition, results of operations or cash flows may have changed since the date of theapplicable document.
i

PROSPECTUS SUMMARY
This summary highlights information contained elsewhere in this prospectus and does not contain all theinformation you should consider before making an investment decision. You should read the entire prospectuscarefully, including the sections entitled “Risk Factors,” “Special Note Regarding Forward-LookingStatements,” “Selected Consolidated Financial Data,” “Management’s Discussion and Analysis of FinancialCondition and Results of Operations” and our consolidated financial statements and the accompanying notesincluded elsewhere in this prospectus, before making an investment decision. Unless otherwise indicated or thecontext otherwise requires, all references in this prospectus to “we,” “us,” “our,” the “Company,” “KrispyKreme” and similar terms refer to Krispy Kreme, Inc. and its consolidated subsidiaries. See “About thisProspectus – Basis of Presentation” for additional terms and the basis for certain information used herein.
Our Purpose
The Joy of Krispy Kreme
Krispy Kreme is one of the most beloved and well-known sweet treat brands in the world. Over its 83-yearhistory, Krispy Kreme has developed a broad consumer base, selling 1.3 billion doughnuts across 30 countries infiscal 2020. We are an omni-channel business operating through a network of doughnut shops, partnerships withleading retailers, and a rapidly growing e-Commerce and delivery business. We believe that we have one of thelargest and most passionate consumer followings today, exemplified by the over 38 billion total mediaimpressions generated by Krispy Kreme in fiscal 2020. As an affordable indulgence enjoyed across cultures,races, and income levels, we believe that Krispy Kreme has the potential to deliver joyful experiences across theworld.
Krispy Kreme doughnuts are world-renowned for their freshness, taste and quality. Our iconic OriginalGlazed doughnut is universally recognized for its melt-in-your-mouth experience. One differentiating aspect ofthe Original Glazed® doughnut is its ability to be served hot. In our Hot Light Theater Shops, we produce freshOriginal Glazed doughnuts right in front of our guests and turn on our iconic “Hot Now” light to let the worldknow that our doughnuts are hot and ready. We dedicate ourselves to providing the freshest and most awesome
1

doughnut experience imaginable, with 73% of our surveyed customers, in a 2021 survey conducted by theCompany, reporting that if they could eat only one doughnut brand for the rest of their life, they would chooseKrispy Kreme.
Sharing and gifting are important and distinct attributes of our success. More than 75% of our doughnuts aresold in sharing quantities of a dozen or half-dozen. While 64% of our doughnut sales in fiscal 2020 were fromour Original Glazed doughnut, we also offer a wide range of fresh, high quality doughnuts and sweet treats thatare unique to Krispy Kreme. We believe we have a strong track record of innovation across varieties, shapes andflavors.
We believe our consumers’ passion for the Krispy Kreme experience combined with our expertise ininnovation provide us with unique opportunities to efficiently create major media-driven events. For example,our recent promotion gifting doughnuts to individuals who received a COVID-19 vaccination resulted in overseven billion earned media impressions. We also believe Krispy Kreme plays a significant role in moments of joybeyond simple individual food indulgence, including school and sports events, community celebrations, holidays,weddings, birthdays and many other occasions.
We are an omni-channel business, creating doughnut experiences via (1) our Hot Light Theater and FreshShops, (2) delivered fresh daily through high-traffic grocery and convenience stores (“DFD”), (3) e-Commerceand delivery and (4) our new line of packaged sweet treats offered through grocery, mass merchandise andconvenience retail locations (our “Branded Sweet Treat Line”). We have an efficient Hub & Spoke model, whichleverages a balance of our Hot Light Theater Shops with their famous glaze waterfalls, smaller Fresh Shops andbranded cabinets within high traffic grocery and convenience locations. Our e-Commerce platform and deliverycapability are significant enablers of our omni-channel growth. We also recently launched our Branded SweetTreat Line, a new line of Krispy Kreme-branded packaged sweet treats intended to extend our consumer reachwith shelf-stable, high quality products available through grocery, mass merchandise, and convenience locations.
In addition to creating awesome doughnut experiences, we create “cookie magic” through our InsomniaCookies business (“Insomnia”), which specializes in warm, delicious cookies delivered right to the doors of itsloyal customers (“Insomniacs”), along with an innovative portfolio of cookie cakes, ice cream, cookie-wichesand brownies. Since its founding in a college dorm room in 2003, Insomnia has built a dedicated followingacross its core demographic of young consumers. Insomnia is a digital-first concept with 54% of its sales driventhrough e-Commerce and 50% of sales delivered off-premise in fiscal 2020. By leveraging the power of each
2

platform, both Insomnia and Krispy Kreme enjoy significant benefits from their partnership. Insomnia’s strongexisting digital and delivery capabilities help Krispy Kreme accelerate its e-Commerce business. Insomniabenefits from Krispy Kreme’s experience in scaling and navigating omni-channel expansion. Targetingaffordable, high quality emotional indulgence experiences is at the heart of both brands.
In recent years, we substantially invested in our business to accelerate performance and position us for long-term, sustained growth. We have invested in our omni-channel model, brand positioning, product quality andinnovation capabilities. Our legacy wholesale business has evolved by transforming our DFD business channelsand introducing our new Branded Sweet Treat Line. Our DFD business is enabled by our Hot Light TheaterShops and Doughnut Factories to ensure consistent and fresh quality across all channels where consumersexperience our products. We have increased control of our network by acquiring and integrating certain of ourfranchised locations in the United States and acquiring the existing businesses in the United Kingdom, Australia,Mexico and Japan. These investments have allowed us to accelerate the implementation of our strategic vision,while ensuring a consistent and engaging experience for our customers. We are present in 30 countriesrepresenting a wide diversity of markets and cultures, with over one-third of Krispy Kreme’s global salesgenerated outside of the United States and Canada, and our aided awareness in tracked markets is 94%.
Our purpose of touching and enhancing lives is reflective of how we operate on a daily basis and the lovewe have for our people, our communities and planet. The love for our people is present in our safe, inclusive anddiverse workplace and the opportunities for growth we provide to all of our employees, whom we call “KrispyKremers.” These values are reinforced through our initiatives and programs, for example our Diversity andInclusion Council, Employee Resource Groups, and unconscious bias training. We care for our communities byensuring the highest quality products as well as through our philanthropic initiatives and Acts of Joy. We showour love of the planet through the use of sustainable practices that limit our use of resources and have a positiveimpact on our planet. This includes our commitment to responsible sourcing, waste and food waste reduction,more sustainable packaging, as well as several green energy initiatives currently underway. Going forward, weare committed to actively pursuing new opportunities to make a positive impact on our people, our communitiesand planet as well as regularly reporting on our progress, leveraging globally accepted ESG reportingframeworks.
Our strategy is built on our belief that almost all consumers desire an occasional indulgence, and that whenthey indulge, they want a high quality, emotionally differentiated experience. We believe this desire, especiallyone which is affordable to consumers, exists during good times and bad. For example, despite the challengesfaced by businesses all over the world during the COVID-19 pandemic, Krispy Kreme continued to grow,reaching the highest level of sales in our brand’s history with net revenue of $1.1 billion in fiscal 2020. Thisspeaks to the appeal and resiliency of our brand and market.
3

The strength of our brand, strategy and people is demonstrated by our strong financial performance:
• For fiscal 2020, we generated $1,122.0 million of net revenue, $145.4 million of Adjusted EBITDA,$42.3 million of Adjusted Net Income and $60.9 million of net loss
• From fiscal 2016 to fiscal 2020, our net revenue CAGR was 19.1%
• From fiscal 2016 to fiscal 2020, our global points of access increased from 5,720 to 8,275
557 645
796 961
1,122
2016 (2) 2017 2018 2019 2020 2016 2017 2018 2019 2020
5,7205,173
5,926 6,040
8,275
‘16-’20 CAGR: 19.1%
Net Revenue ($ million) (1) Global Points of Access (3)
(1) As described in Note 1 to our consolidated financial statements included elsewhere in this prospectus, weadopted the new revenue recognition standard during the annual period beginning on January 1, 2018. Priorto that time, advertising contributions and related expenditures were not included in the consolidatedstatements of operations. Net revenue for fiscal 2020, 2019 and 2018 is inclusive of advertisingcontributions totaling $8.1 million, $9.3 million and $7.8 million, respectively, in accordance with ouradoption of the new revenue recognition standard. The inclusion of these impacts was responsible for 0.2percentage points of the CAGR from fiscal 2016 to fiscal 2020. Other impacts to net revenue as a result ofadopting the new revenue recognition standard are deemed immaterial.
(2) The JAB Acquisition (as defined below) was completed on July 27, 2016. Fiscal 2016 net revenue, aspresented above, includes the predecessor period net revenue of $310 million for the period fromDecember 28, 2015 to July 27, 2016 and the successor period net revenue of $247 million for the periodfrom July 28, 2016 to January 1, 2017.
(3) Global points of access reflects all locations at which fresh doughnuts and cookies can be purchased. Wedefine global points of access to include all Hot Light Theater Shops, Fresh Shops, DFD doors and cookieshops, at both company-owned and franchise locations (does not include new Branded Sweet Treat Linedistribution points or legacy wholesale business doors).
For a description of organic revenue growth, Adjusted EBITDA and Adjusted Net Income, see “About thisProspectus – Non-GAAP Financial Measures” and for more information on global points of access, see “Aboutthis Prospectus – Key Performance Indicators.”
Our Global Opportunity
We operate in the large, stable and steadily growing approximately $650 billion global indulgence market*,and believe we are well-positioned to gain share in this attractive market. While Krispy Kreme has developed94% aided awareness in our tracked markets, only a small fraction of the world’s population has the geographicproximity to be Krispy Kreme customers today. In addition, we believe market conditions will remain highlyfavorable as global consumers’ longstanding demand for quality indulgence continues to grow. Data indicatesthat nearly all consumers (97%) enjoy indulgences at least occasionally and we believe Krispy Kreme is poised
4

to meet this growing consumer demand and seize the opportunity to be part of a growing number of sharedindulgence occasions.
Indulgence foods have proven to be recession-resistant historically, as exhibited by 4.0% category growththrough the global financial crisis (CAGR 2007-2009) and 4.3% during the current COVID-19 pandemic (year-over-year 2019-2020). We believe people love an occasional indulgence, no matter the environment. Withfavorable secular trends around indulgence and our positioning as a shared occasion treat, we aim to continue tostrengthen our position as a leader in the category and capture outsized share of this attractive marketopportunity.
The Ingredients of Our Success
We believe the following competitive differentiators position us to generate significant growth as wecontinue towards our goal of becoming the most loved sweet treat brand in the world.
Beloved Global Brand with Ubiquitous Appeal
We believe that Krispy Kreme is an iconic, globally recognized brand with rich history that is epitomized byour fresh Original Glazed doughnut. We are one of the most loved sweet treat retailers in the United States andmany markets around the world. We have an extremely loyal, energetic, and emotionally connected consumerbase and leading engagement rates that are 19% greater than those of the closest peer in the global indulgencemarket. We believe that our brand love and ubiquitous appeal, as demonstrated by our strong Net Promotor Scorein the United States, differentiate us from the competition. We continuously seek to understand what consumersare celebrating or experiencing in their lives and actively engage our passionate followers to activate thisemotional connection through memorable, sharable moments – our “Acts of Joy” – which we believe further fuelour brand love. In fiscal 2020 alone, Krispy Kreme generated over 38 billion total media impressions, up fromless than two billion media impressions in 2016.
Creating Awesome Experiences
We provide authentic indulgent experiences, delivering joy through high quality doughnuts made from ourown proprietary formulations. Our strict quality standards and uniform production systems ensure the customer’sinteraction with Krispy Kreme is consistent with our brand promise, no matter where in the world theyexperience it. We aim to create product experiences that align with seasonal and trending consumer interests andmake positive connections through simple, frequent, brand-focused offerings that encourage shared experiences.
Our experiences start with our Hot Light Theater Shops which create an immersive and interactiveenvironment to showcase our brand. When our “Hot Now” light is on, our manufacturing process is on fulldisplay to our customers, including our iconic glaze waterfall and fresh hot-off-the-line doughnuts. Sharing thismanufacturing process with consumers speaks to the authenticity and wholesomeness of our brand and highlightsthe fresh and high-quality nature of our products. We believe the sights, smells, sounds and taste of theexperience cannot be replicated at scale and result in a virtuous cycle of one generation introducing the next toour one-of-a-kind brand.
We utilize seasonal innovations, alongside the expansion of our core product offering, to inspire customerwonder and keep our consumers engaged with the brand and our products. Our sweet treat assortment beginswith our iconic Original Glazed doughnut inspired by our founder’s classic yeast-based recipe that serves as thecanvas for our product innovation and ideation. Using the Original Glazed doughnut as our foundation, we haveexpanded our offerings to feature everyday classic items such as our flavor glazes and “minis,” which lendthemselves well to gifting occasions such as birthdays and school activities. Our “Original Filled” rings offer thebenefits of a filled shell doughnut without the mess. Our seasonal items create unique assortments centered on
5

holidays and events, with St. Patrick’s Day, July Fourth, Halloween, Christmas and Easter, all examples ofholidays for which we routinely innovate. We also maintain brand relevance by participating in significantcultural moments. We have made heart-shaped conversation doughnuts with edible phrases for Valentine’s Dayand offered free Original Glazed doughnuts and election stickers to anyone who voted in the 2020 U.S.presidential election. We launched filled rings tied to the 50th anniversary of the Apollo moon landing in 2019and in 2021 we celebrated the safe landing of NASA’s Perseverance on Mars with a special Mars-themeddoughnut. We strategically launch offerings tied to these historic moments to gain mind share, grow brand loveand help drive sales.
Creating an Emotional Connection with Our Local Communities
Acts of Joy
We believe the experiences Krispy Kreme creates drive an emotional connection with our consumers and inour local communities, resulting in a positive brand halo around Krispy Kreme. We believe a truly loved brandmust maintain cultural relevance by demonstrating an understanding of what consumers are celebrating orexperiencing in their lives. We engage our passionate followers and activate this emotional connection throughstrategic initiatives, such as charitable giving and events. We call these memorable, sharable moments “Acts ofJoy” which we believe further fuels our brand love. Recent Acts of Joy include:
• “Healthcare Mondays” – across eight Mondays in fiscal 2020, we gave unlimited doughnuts to anyhealth care worker who asked, with no purchase requirement, simply to thank them for their importantwork through the COVID-19 pandemic. This drove over 4.2 billion earned media impressions and over1,800 media placements.
• “Be Sweet Saturdays” – for every Saturday in April and May of fiscal 2020, we gave consumers a free,separately sealed and bagged, Original Glazed dozen to share with friends or neighbors they could notsee due to pandemic restrictions. This drove significant media coverage and contributed to positivesales throughout respective April and May weekends.
• “Senior Week” – we gave a free “Graduate Dozen” to all graduating high school and college seniorswho were denied their moment of walking across the stage to accept a diploma in 2020. This becamean event unto itself with four-hour lines in certain locations, generating over 2 billion earned mediaimpressions and over 2,400 media placements.
6

• “COVID-19 Vaccine Offer” – in March 2021, we offered a free doughnut to anyone who received aCOVID-19 vaccination. This promotion was incredibly well received and surpassed 7.6 billion earnedmedia impressions and over 5,300 media placements in the first ten days of the initiative alone.
Raise Dough for Your Cause
In addition to these initiatives, we also help community organizations raise money for their respectiveworthwhile causes through our “Raise Dough for Your Cause” platform by offering favorable doughnut pricingfor local fundraising events. Leveraging our iconic Original Glazed doughnut dozens, these events often serve asan introduction to the brand and help bring new consumers into the Krispy Kreme experience.
Leveraging our Omni-Channel Model to Expand Our Reach
We believe our omni-channel model, enabled by our Hub & Spoke approach, allows us to maximize ourmarket opportunity while ensuring control and quality across our suite of products. We apply a tailored approachacross a variety of distinct shop formats to grow in discrete, highly attractive and diverse markets, and maintainbrand integrity and scarcity value while capitalizing on significant untapped consumer demand. Many of ourshops offer drive-thrus, which also expand their off-premises reach. Our Hot Light Theater Shops’ productioncapacity allow us to leverage our investment by efficiently expanding to our consumers wherever they may be —whether in a local Fresh Shop, in a grocery or convenience store, on their commute home or directly to theirdoorstep via home delivery.
Hub & Spoke
• Hot Light Theater Shops and other Hubs – Immersive and interactive experiential shops which provideunique and differentiated customer experiences while serving as local production facilities for ournetwork. These locations serve as Hubs to enable our Hub & Spoke model and expand our brand’sreach. Each features our famous glaze waterfalls and “Hot Now” light that communicate the joy andemotion at the core of our brand. Hot Light Theater Shops are typically destination locations, with 87%of U.S. locations featuring drive-thru capability. Our flexible drive-thru model offers a convenientoff-premise experience which accounted for 46% and 64% of U.S. doughnut shop sales in fiscal 2019and 2020, respectively. We also have smaller Mini-Hot Light Theater Shops that serve hot doughnut
7

experiences to high foot fall, urban locations. In higher density urban environments, we also utilizenon-consumer facing doughnut production Hubs (“Doughnut Factories”) to provide fresh doughnuts toSpoke locations, which include Fresh Shops and DFD doors.
• Fresh Shops – Smaller doughnut shops and kiosks, without manufacturing capabilities, selling freshdoughnuts delivered daily from Hub locations. Fresh Shops expand our consumer-serving capacity,while maintaining quality and scarcity value.
• Delivered Fresh Daily – Krispy Kreme branded doughnut cabinets within high traffic grocery andconvenience locations, selling fresh doughnuts delivered daily from Hub locations. Through our DFDpartnerships, we are able to significantly expand our points of access so that more consumers canexperience Krispy Kreme doughnuts. These additional Spoke locations further leverage ourmanufacturing Hub locations, creating greater system efficiency. Consistent with our commitment toproduct quality, our current DFD business has been transformed materially from our legacy wholesalemodel. In 2018, we began strategically exiting unprofitable, low-volume doors and pivoting towardsdelivered-fresh-daily products offered in branded in-store cabinets. This evolution, which had anegative short-term financial impact, was largely completed in 2020 and we believe positions us forstrong and sustainable growth in DFD.
• e-Commerce and Delivery – Fresh doughnuts for pickup or delivery, ordered via our brandede-Commerce platforms or through third-party digital channels. In the United States and Canada ourbranded e-Commerce platform enables attractive opportunities like gifting and office catering, furtherfueling our momentum across key geographies. For fiscal 2020, 18% of our U.S. sales, inclusive ofInsomnia and exclusive of our Branded Sweet Treat Line and DFD, were digital and we aim to growthis significantly in the next few years, both domestically and internationally. The acquisition ofInsomnia allowed us to further develop our e-Commerce business by leveraging Insomnia’s expertiseand capabilities to accelerate Krispy Kreme’s digital opportunity.
Branded Sweet Treat Line
Our Krispy Kreme branded packaged sweet treat line offers a delicious, quality experience free of artificialflavors. This new line of products is distributed in the United States through major grocery, mass merchandise,and convenience locations, allowing us to capture the sweet snacking occasion for our customers seeking moreconvenience.
8

Our Fast-Growing, Digital-First Cookie Concept
Our addition of Insomnia has expanded our sweet treat platform to include a complementary brand rooted inthe belief that indulgent experiences are better enjoyed together. Insomnia delivers warm, delicious cookies rightto the doors of individuals and companies alike. Insomnia is a digital-first brand with 54% of its sales comingfrom e-Commerce channels in fiscal 2020. We own the night through incredibly craveable offerings of cookies(over 65 million sold in 2020), brownies, cookie cakes, ice cream, cookie-wiches and cold milk. In addition tosatisfying late night cravings, Insomnia delivers the cookie magic across a broad set of daytime occasions,including retail, gifting and catering. Through its 191 locations as of April 4, 2021, Insomnia is able to deliverlocally within 30 minutes while also expanding its nationwide delivery capabilities that allows it to delivernext-day to more than 95% of addresses in the United States. We continue to leverage these digital and internaldelivery capabilities while expanding Insomnia’s omni-channel presence, combining both of our strengths toimprove our overall platform.
Proven Team Creating and Leading Distinct Entrepreneurial and Collaborative Culture
Led by a team of highly experienced, passionate and committed executives, we maintain an entrepreneurialculture, which we call our “Leadership Mix.” Our “Krispy Kremers” bring our culture to life every day. Ourvalues are underpinned by a timeless aspiration to touch and enhance lives – delivering joy to our customers isfundamental to everything we do at Krispy Kreme. Giving back to our communities through fundraising andphilanthropic work is at our core and ingrained in our culture and hiring.
Our talent and culture serve as our foundation for achieving our growth strategies. We believe we haveinstilled our purpose and Leadership Mix across our system, globally. Utilizing global key performanceobjectives, we inspire our Krispy Kremers to continually improve and never settle. We believe that our cultureplays a key role in our position as one of the most loved sweet treat brands in the world.
Our Growth Strategies
We have made investments in our brand, our people and our infrastructure and believe we are wellpositioned to drive sustained growth as we execute on our strategy. Across our global organization, we have builta team of talented and highly engaged Krispy Kremers and Insomniac team members. Over the past several yearswe have taken increased control of the U.S. market to enable execution of our omni-channel strategy, includingaccelerating growth across our doughnut shops, DFD, e-Commerce and Branded Sweet Treat Line. Globally, wehave developed an operating model that sets the foundation for continued expansion in both existing and newgeographies. As a result, we believe we are in a position to combine a globally recognized and loyalty-inspiringbrand with a leading management team and we aim to unlock increased growth in sales and profitability throughthe following strategies:
• Increase trial and frequency;
• Expand our omni-channel network in new and existing markets;
• Continue to grow Insomnia Cookies; and
• Drive additional efficiency benefits from our omni-channel execution.
Increase trial and frequency
Almost all consumers desire an occasional indulgence, and when they indulge, they want a high quality,emotionally differentiated experience. We believe we have significant runway to be part of a greater number ofshared indulgence occasions. On average, consumers visit Krispy Kreme less than three times per year, creating asignificant frequency opportunity. The success of recently launched products including filled rings and minis,
9

seasonal favorites and flavored glazes affirms our belief that our innovations create greater opportunities forconsumers to engage with our brand. We intend to strengthen our product portfolio by centering furtherinnovation around seasonal, and societal events, and through the development of new innovation platforms todrive sustained baseline growth. Our strategy of linking product launches with relevant events has allowed us toeffectively increase consumption occasions while meaningfully engaging with our communities and consumers.
Our marketing and innovation efforts have expanded the number of incremental consumer use cases forKrispy Kreme doughnuts. For example, our gifting value proposition makes doughnuts an ideal way to celebrateeveryday occasions like birthdays and holidays, through gifting sleeves and personalized gift messaging. TheBranded Sweet Treat Line creates a new opportunity in snacking or everyday “lunchbox” occasions. Our giftingvalue proposition and Branded Sweet Treat Line’s products, which each fulfill distinct consumption occasions,will continue to make our brand and products more accessible and allow us to participate with greater frequencyin small and large indulgent occasions, from impromptu daily gatherings with family and friends to holidays andweddings, and everything in between.
Expand our omni-channel network in new and existing markets
We believe there are opportunities to continue to grow in new and existing markets in which we currentlyoperate by further capitalizing on our strong brand awareness as we deploy our Hub & Spoke model. We apply adeliberate approach to growing these discrete, highly attractive markets and maintain our brand integrity andscarcity value while unlocking significant consumer demand.
We believe our omni-channel strategy, empowered by our Hub & Spoke model, will allow us to effectivelyseize expansion opportunities both domestically and internationally. Despite our high brand awareness, we havea limited presence in certain key U.S. markets, such as New York and Chicago and have yet to build a significantpresence in key U.S. cities, including Boston and Minneapolis. We believe this provides us ample opportunity togrow within markets in which we are already present. We have also identified similar key internationalwhitespace market opportunities such as China, Brazil, and parts of Western Europe. Our successful track recordof entering new diverse markets including the Philippines, South Africa, Guatemala and Saudi Arabiademonstrates our ability to effectively penetrate a broad range of market types. New markets will either consistof company-owned shops or entered via franchise operations, to be determined on a case-by-case basis.
Our dynamic omni-channel strategy allows us to efficiently tailor our model and add e-Commerce, Spokesand Branded Sweet Treat Line channels to most effectively pursue each market opportunity, leveraging ourexisting footprint and technology and innovation capabilities.
Hot Light Theater Shops: We intend to efficiently and selectively grow our physical presence in existingand underserved markets, including our international markets. Our strategy to deploy our Hub & Spoke modelincludes strategically opening new Hot Light Theater Shops to ensure we are creating scarcity value of ourexperiential format while providing sufficient market capacity to fuel growth across our other formats. Wecontinue to transform and reimagine key locations into Hot Light Theater Shops to strengthen our experientialoffering and inspire interactive brand occasions for more consumers.
Fresh Shops and DFD: Maximizing potential distribution is a key growth driver for Krispy Kreme and weintend to supplement market penetration by adding Fresh Shops and DFD locations to further expand our brandreach and ensure our products are available wherever our consumers choose to shop. Our current DFD businesshas been transformed from our legacy wholesale model and we believe positions us for strong and sustainablegrowth in DFD. Expanding through our Spoke locations allows us to leverage existing capacity in our Hublocations to drive capital efficient growth. Today, our DFD presence reaches over 4,700 doors across the UnitedStates and Canada, and 2,100 doors internationally. New listings in key markets have seen marked success,which we intend to emulate globally by leveraging our brand equity and consumer pull to continue penetratingnew doors through Fresh Shops and DFD.
10
e-Commerce and delivery: e-Commerce is a key driver of our growth, driven both by increased consumerconvenience and the expansion of digitally enabled value propositions. Our branded e-Commerce networkenables us to build a direct relationship with our consumers and creates a fully integrated and highly convenientexperience, whether through “click and collect” or home delivery. As consumer expectations around convenienceincrease, we have been able to meet our consumers’ needs with a highly personal digital platform. e-Commercealso enables and supports a broad range of occasions, including home delivery, gifting, in-office catering andbusiness solutions, and further activation of our fundraising program. We will continue to expand through third-party delivery aggregators as an additional way to drive penetration with new consumers. Growth ofe-Commerce and the delivery channel leverages our existing doughnut shop network, helping achieve operatingefficiencies. With the expansion of this channel, we believe we can leverage valuable consumer data to acquirenew consumers and extract higher consumer lifetime value by creating relationships with them outside of ourshops.
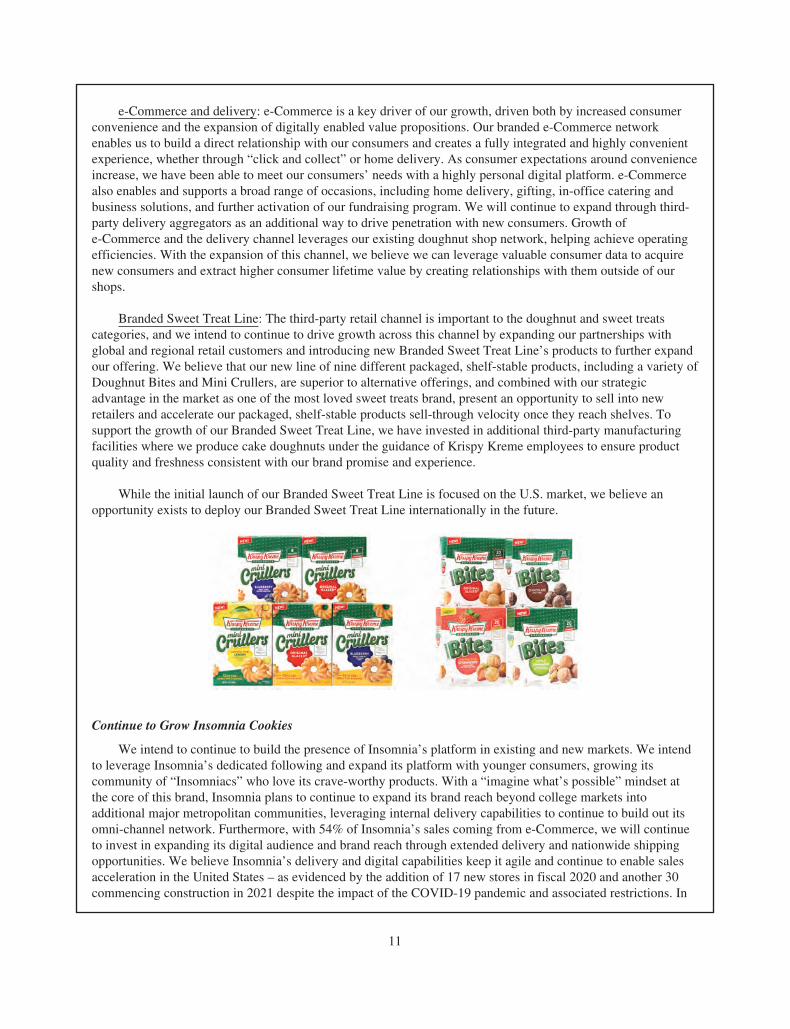
Branded Sweet Treat Line: The third-party retail channel is important to the doughnut and sweet treatscategories, and we intend to continue to drive growth across this channel by expanding our partnerships withglobal and regional retail customers and introducing new Branded Sweet Treat Line’s products to further expandour offering. We believe that our new line of nine different packaged, shelf-stable products, including a variety ofDoughnut Bites and Mini Crullers, are superior to alternative offerings, and combined with our strategicadvantage in the market as one of the most loved sweet treats brand, present an opportunity to sell into newretailers and accelerate our packaged, shelf-stable products sell-through velocity once they reach shelves. Tosupport the growth of our Branded Sweet Treat Line, we have invested in additional third-party manufacturingfacilities where we produce cake doughnuts under the guidance of Krispy Kreme employees to ensure productquality and freshness consistent with our brand promise and experience.
While the initial launch of our Branded Sweet Treat Line is focused on the U.S. market, we believe anopportunity exists to deploy our Branded Sweet Treat Line internationally in the future.
Continue to Grow Insomnia Cookies
We intend to continue to build the presence of Insomnia’s platform in existing and new markets. We intendto leverage Insomnia’s dedicated following and expand its platform with younger consumers, growing itscommunity of “Insomniacs” who love its crave-worthy products. With a “imagine what’s possible” mindset atthe core of this brand, Insomnia plans to continue to expand its brand reach beyond college markets intoadditional major metropolitan communities, leveraging internal delivery capabilities to continue to build out itsomni-channel network. Furthermore, with 54% of Insomnia’s sales coming from e-Commerce, we will continueto invest in expanding its digital audience and brand reach through extended delivery and nationwide shippingopportunities. We believe Insomnia’s delivery and digital capabilities keep it agile and continue to enable salesacceleration in the United States – as evidenced by the addition of 17 new stores in fiscal 2020 and another 30commencing construction in 2021 despite the impact of the COVID-19 pandemic and associated restrictions. In
11

fiscal 2020, Insomnia also demonstrated its highly effective innovation capabilities to drive deeper engagementthrough consumer-centric products like vegan cookies, mini cookies, deluxe cookies, cookie butter, lil’ and bigdippers and three layer cookie cakes.
Drive Additional Efficiency Benefits from Our Omni-Channel Execution
We are making focused investments in our omni-channel strategy to expand our presence efficiently whiledriving top-line growth and margin expansion. The Hub & Spoke model enables an integrated approach tooperations, which is designed to bring efficiencies in production, distribution and supervisory management whileensuring product freshness and quality are consistent with our brand promise no matter where customersexperience our doughnuts. To support the Hub & Spoke model in the United States, we are implementing newlabor management systems and processes in our shops and new delivery route optimization technology to supportour DFD logistics chain. In addition, we are launching a new demand planning system that is intended toimprove service and to deliver both waste and labor efficiencies across all of our business channels, includingproduction of our Branded Sweet Treat Line. We are also investing in our manufacturing capabilities to supportgrowth of our Branded Sweet Treat Line by implementing new packing automation technology, which isintended to significantly increase productivity through labor savings and increased capacity. By streamliningthese operations across our platform, we believe we can continue to deliver on our brand promise and provide joyto our consumers while continuing to drive efficiencies across our platform.
Risk Factor Summary
Risks Related to Our Business and Industry
• Pandemics, including the global COVID-19 outbreak, have disrupted and may continue to disrupt, ourbusiness.
• Changes in consumer preferences and demographic trends could negatively impact our business.
• Adverse weather conditions, including as a result of climate change, could adversely affect ourbusiness.
• Litigation, regulation and publicity concerning food quality, safety, health and other issues, maymaterially impact consumer demand.
• We will face risks as we complete our legacy wholesale business transformation, as a result of theintroduction of our new Branded Sweet Treat Line and evolution of DFD.
• We are exposed to risks related to any future acquisitions.
• Our success depends on our ability to compete with many food service businesses.
• We may be unable to successfully grow nationally and internationally.
• We are subject to risks related to our reliance on key customers in our Branded Sweet Treat Line andDFD business channels.
• We face risks to our supply of product ingredients and doughnut-making equipment, including risks toour supply chain as a result of climate change.
• Our profitability is sensitive to changes in the cost of raw materials.
• Our information technology may suffer material failures, inadequacies, interruptions and limitedavailability, which may materially harm our results of operation and business strategy.
• If we or our franchisees are unable to protect our customers’ protected or personally identifiableinformation, we or our franchisees could be exposed to data loss, litigation and other liability.
12

• We or our franchisees may experience data breaches, unauthorized access to customer data or otherdisruptions in connection with our day-to-day operations.
• Political, economic, currency and other risks associated with our international operations couldadversely affect our and our international franchisees’ operating results.
• We are exposed to risks related to our reliance on our franchisees.
• We are subject to franchise laws and regulations that govern our status as a franchisor and regulatesome aspects of our franchise relationships.
• Recent healthcare legislation and other potential employment legislation could adversely affect ourbusiness.
Risks Related to Our Organizational Structure
• A significant amount of our voting power will be concentrated in a single stockholder following thisoffering and the Distribution.
• High concentration in our common stock’s ownership may prevent you from influencing significantcorporate decisions and may result in conflicts of interest.
• Certain provisions of Delaware Law, our amended and restated certificate of incorporation and ouramended and restated bylaws could hinder, delay or prevent a change in control of us, which couldadversely affect the price of our common stock.
Risks Related to Our Intellectual Property
• Our failure or inability to obtain, maintain, protect and enforce our intellectual property couldadversely affect our business, including the value of our brands.
• We may become involved in lawsuits to protect or enforce our intellectual property rights, which couldbe expensive, time consuming and unsuccessful.
• Loss of our trade secret recipes could adversely affect our sales.
• Our reliance on third parties, including our franchisees, may negatively impact our ability to protectour intellectual property.
Risks Related to this Offering
• An active trading market for our common stock may never develop or be sustained.
• The market price and trading volume of our common stock may be volatile, which could result in rapidand substantial losses for our stockholders.
• Future offerings of debt or equity securities by us may materially adversely affect the market price ofour common stock.
• The market price of our common stock could be negatively affected by sales of substantial amounts ofour common stock in the public markets or the issuance of additional common stock.
• Investors in this offering will suffer immediate and substantial dilution.
• We will have broad discretion in the use of a significant part of the net proceeds from this offering andmay not use them effectively.
• We may be unable to pay dividends on our common stock.
13

General Risks
• If tax laws change or we experience adverse outcomes resulting from examination of our income taxreturns, it could adversely affect our results of operations.
• We may be affected by a lack of analyst reports or the publication of negative analyst reports.
• The Court of Chancery of the State of Delaware is the sole and exclusive forum for certain stockholderlitigation matters.
• We will incur increased costs as a result of operating as a public company due to regulatorycompliance.
14

ABOUT THIS PROSPECTUS
Basis of Presentation
We report on the basis of a 52- or 53-week fiscal year, ending on the Sunday closest to December 31.Accordingly, references herein to “fiscal 2018” relate to the 52 weeks ended December 30, 2018, “fiscal 2019”relate to the 52 weeks ended December 29, 2019 and “fiscal 2020” relate to the 53 weeks ended January 3, 2021.Our fiscal quarters end on the Sunday closest to March 31, June 30 and September 30, respectively. Accordingly,reference herein to, for example, the first fiscal quarters of 2021 and 2020 relate to the 13 weeks ended April 4,2021 and March 29, 2020 respectively. Certain amounts, percentages and other figures presented in this prospectushave been subject to rounding adjustments. Accordingly, figures shown as totals, dollars or percentage amounts ofchanges may not represent the arithmetic summation or calculation of the figures that precede them. As used herein,references to “domestic” data are inclusive of our U.S. and Canadian operations within our U.S. and Canadabusiness segment. We completed our acquisition of a 74.7% controlling interest in Insomnia in September 2018,and as such Insomnia is reflected in our consolidated results only for such periods following its acquisition.
Market and Industry Data
Within this prospectus, we reference certain market and industry data, including information and statisticsregarding the Packaged Food industry. We have obtained this information and statistics from various independentthird-party sources, including independent industry publications, reports by market research firms and otherindependent sources, such as Euromonitor International Limited. Some data and other information contained in thisprospectus are also based on management’s estimates and calculations, which are derived from our review andinterpretation of internal surveys and independent sources. Data regarding the industries in which we compete andour market position and market share within these industries are inherently imprecise and are subject to significantbusiness, economic and competitive uncertainties beyond our control, but we believe they generally indicate size,position and market share within this industry. While we believe such information is reliable, we have notindependently verified any third-party information. While we believe our internal company research and estimatesare reliable, such research and estimates have not been verified by any independent source.
Certain information included in this prospectus concerning brand favorability is based on our Krispy Kreme2020 U.S. Brand Survey, a company-designed survey with an average of approximatley 3,086 survey respondents.The survey responses were used to measure brand love amongst U.S. sweet treat consumers and to explore how webenchmark against our competition. We designed the Krispy Kreme 2020 U.S. Brand Survey in accordance withwhat we believe are best practices for conducting a survey. Nevertheless, while we believe this survey is reliable, itinvolves a number of assumptions and limitations, and no independent sources have verified such survey.
Assumptions and estimates of our and our industries’ future performance are necessarily subject to a highdegree of uncertainty and risk due to a variety of factors, including those discussed under the headings “SpecialNote Regarding Forward-Looking Statemens” and “Risk Factors” in this prospectus. These and other factorscould cause our future performance to differ materially from our assumptions and estimates. As a result, youshould be aware that market, ranking and other similar industry data included in this prospectus, and estimatesand beliefs based on that data, may not be reliable. Neither we nor the underwriters can guarantee the accuracy orcompleteness of any such information contained in this prospectus.
Trademarks, Service Marks and Trade Names
We own or have rights to various trademarks, service marks and trade names that we use in connection withthe operation of our business. We use our Krispy Kreme®, Original Glazed®, Doughnut Theater®, Hot KrispyKreme Original Glazed Now® registered trademarks and related design marks in this prospectus. This prospectusmay also contain trademarks, service marks and trade names of third parties, which are the property of theirrespective owners. Our use or display of third parties’ trademarks, service marks or trade names in this
15

prospectus is not intended to, and does not imply a relationship with, or endorsement or sponsorship by, us.Solely for convenience, the trademarks, service marks and trade names referred to in this prospectus may appearwithout the ®, TM or SM symbols, but the omission of such references is not intended to indicate, in any way,that we will not assert, to the fullest extent under applicable law, our rights or the right of the applicable owner ofthese trademarks, service marks and trade names.
Key Performance Indicators
Throughout this prospectus, we utilize “global points of access” and “Hubs” as key performance indicators.Global points of access reflects all locations at which fresh doughnuts and cookies can be purchased. We defineglobal points of access to include all Hot Light Theater Shops, Fresh Shops, DFD doors and cookie shops, at bothcompany-owned and franchise locations as of the end of the respective reporting period. Global points of accessexcludes Branded Sweet Treat Line distribution points and legacy wholesale business doors. We monitor globalpoints of access as a metric that informs the growth of our retail presence over time and believe this metric isuseful to investors to understand our footprint in each of our segments and by shop type.
Hubs reflect locations where we have substantial doughnut production capacity. We define Hubs to includeall Hot Light Theater Shops and Doughnut Factories, at both company-owned and franchise locations as of theend of the respective reporting period. In addition, we track Hubs with “Spokes” and Hubs without “Spokes.” Wedefine Spokes, including Fresh Shops and DFD doors, as locations without their own doughnut productioncapabilities that are provided products by Hub locations. Hubs that service Spokes are considered to be “Hubswith Spokes and Hubs” that have yet to service Spokes are considered to be “Hubs without Spokes.” Hub countsdo not include Mini-Hot Light Theater Shops. We monitor Hubs as an indicator of our production capacity tosupport incremental global points of access across our segments.
Non-GAAP Financial Measures
We report our financial results in accordance with generally accepted accounting principles in the UnitedStates (“GAAP”); however, management evaluates our results of operations using, among other measures,organic revenue growth, adjusted earnings before interest, taxes, depreciation and amortization (“AdjustedEBITDA”), Adjusted Net Income, Fresh Revenue from Hubs with Spokes and Fresh Revenue per Average Hubwith Spokes. Organic revenue growth, Adjusted EBITDA, Adjusted Net Income, Fresh Revenue from Hubs withSpokes and Fresh Revenue per Average Hub with Spokes are non-GAAP financial measures.
We present organic revenue growth, Adjusted EBITDA, Adjusted Net Income, Fresh Revenue from Hubswith Spokes and Fresh Revenue per Average Hub with Spokes because our management uses these measures toanalyze our performance on a comparative basis, as well as to assess the underlying trends of our performance ona comparative basis, and believe it useful to investors for the same reason. These non-GAAP financial measureshave limitations as analytical tools and should not be considered in isolation from, or as a substitute for, theanalysis of other GAAP financial measures, such as net income.
These non-GAAP financial measures are not universally consistent calculations, limiting their usefulness ascomparative measures. Other companies may calculate similarly titled financial measures differently than we door may not calculate them at all. Additionally, these non-GAAP financial measures are not measurements offinancial performance under GAAP. In order to facilitate a clear understanding of our consolidated historicaloperating results, you should examine our non-GAAP financial measures in conjunction with our historicalconsolidated financial statements and notes thereto included elsewhere in this prospectus.
Organic revenue growth
Organic revenue growth measures our revenue growth trends excluding the impact of acquisitions andreflects our efforts to expand our global footprint through selective capital expenditures rather than acquisitionsof pre-existing companies.
16

We define “organic revenue growth” as the estimated growth in revenue from company-owned businesses,shops and other operations that were either (i) opened or launched by us (including any business, shop or productdeveloped or launched by us) or (ii) owned by us for at least twelve months following their acquisition,calculated on a constant currency basis. With respect to acquisitions (but not new launches), our calculation oforganic revenue growth includes only revenue for the portion of the earlier comparative period during which theacquired business, shop or other operation was owned by us and a proportional part of the subsequentcomparative period. For example, in calculating our fiscal 2020 organic growth attributable to a businessacquired by us on the last day of the third quarter of fiscal 2019, we measure revenue from the acquired businessfor the fourth quarter of fiscal 2020 against the fourth quarter of fiscal 2019, while the calculation of our organicgrowth for fiscal 2021 would include 100% of revenue from the acquired shop for both fiscal 2021 and 2020. Wecalculate organic revenue growth on a constant currency basis by applying the relevant average exchange ratesused in the preparation of our consolidated financial statements for the earlier comparative period and apply themto the actual foreign currency organic revenue amounts for the more recent comparative period.
Adjusted EBITDA
We define “Adjusted EBITDA” as earnings before interest expense, net (including interest payable torelated parties), income tax expense/(benefit), and depreciation and amortization, with further adjustments forshare-based compensation, certain strategic initiatives, acquisition and integration expenses, and other certainnon-recurring, infrequent or non-core income and expense items. Adjusted EBITDA enables operatingperformance to be reviewed across reporting periods on a consistent basis and is one of the principal measuresused by management to evaluate and monitor our operating performance. Adjusted EBITDA has certainlimitations, including adjustments for income and expense items that are required by GAAP. In evaluatingAdjusted EBITDA, you should be aware that in the future we will incur expenses that are the same as or similarto some of the adjustments in this presentation, such as share-based compensation. Our presentation of AdjustedEBITDA should not be construed to imply that our future results will be unaffected by any such adjustments.Management compensates for these limitations by relying on our GAAP results in addition to using AdjustedEBITDA supplementally. We also measure compliance under certain of our debt agreements under a calculationtermed Adjusted EBITDA, though such metric is calculated differently and is used for different purposes.
Adjusted Net Income
We define “Adjusted Net Income” as net loss adjusted for interest expense – related party, share-basedcompensation, certain strategic initiatives, acquisition and integration expenses, amortization of acquisition-related intangibles, the tax impact of adjustments and other certain non-recurring, infrequent or non-core incomeand expense items. Adjusted Net Income has certain limitations, including adjustments for income and expenseitems that are required by GAAP. In evaluating Adjusted Net Income, you should be aware that in the future wewill incur expenses that are the same as or similar to some of the adjustments in this presentation, such as share-based compensation. Our presentation of Adjusted Net Income should not be construed to imply that our futureresults will be unaffected by any such adjustments. Management compensates for these limitations by relying onour GAAP results in addition to using Adjusted Net Income supplementally.
Fresh Revenue from Hubs with Spokes
Fresh revenue includes product sales generated from our retail business (including e-Commerce anddelivery), as well as DFD sales, but excluding sales from our legacy wholesale business and our Branded SweetTreat Line. Fresh Revenue from Hubs with Spokes equals the fresh revenue derived from those Hubs currentlyproducing product sold through fresh shops and/or DFD doors, but excluding fresh revenue derived from thosehubs not currently producing product sold through Fresh Shops and/or DFD doors. It also excludes all Insomnia
17

revenue as the measure is focused on the Krispy Kreme business. This performance measure allows us tocalculate a numerator for the Fresh Revenue per Average Hub with Spokes metric below. Fresh Revenue perAverage Hub with Spokes allows us to measure our effectiveness at leveraging the Hubs in the Hub and Spokeproduction model to distribute product and generate cost efficiencies and profitability.
Fresh Revenue per Average Hub with Spokes
The Average Hub with Spokes for a period is calculated as the simple average of the number of Hubs withSpokes at the end of the current period and the number of Hubs with Spokes at the end of the comparative period,adjusted for the pro rata period of acquired Hubs with Spokes outstanding following the acquisition date. FreshRevenue per Average Hub with Spokes equals Fresh Revenue from Hubs with Spokes divided by the averagenumber of Hubs with Spokes during the period. This performance measure allows us to measure oureffectiveness at leveraging the Hubs in the Hub and Spoke production model to distribute product and generatecost efficiencies and profitability.
Corporate Information
Krispy Kreme Doughnuts was founded in 1937. The Company was incorporated in 2012 and, following aname change on May 10, 2021, operates under the name Krispy Kreme, Inc. The address of our principalexecutive offices is currently 2116 Hawkins Street Charlotte, NC 28203 and our phone number is (800)457-4779. Our website is currently www.krispykreme.com. The information contained in, or that can be accessedthrough, our website is not incorporated by reference in, and is not part of, this prospectus.
Our Structure
Immediately following this offering and the use of proceeds therefrom and the Distribution:
• our common stock will be held as follows: 26,666,667 shares by investors in this offering (or30,666,667 if the underwriters exercise their option to purchase additional shares of common stock infull), 62,142,733 shares by an affiliate of JAB, 62,669,457 shares by the distributees receiving shares inthe Distribution who currently participate in the affiliate of JAB that owns 100% of our outstandingcommon stock and 6,282,955 shares by certain of our officers, directors and employees; and
• the combined voting power in the Company will be as follows: (i) 16.6% by investors in this offering(or 18.6% if the underwriters exercise their option to purchase additional shares of common stock infull); and (ii) 83.4% by our existing owners, of which JAB will continue to be our largest owner, withbeneficial ownership of 38.6% of our common stock (or 81.4% and 37.7%, respectively, if theunderwriters exercise their option to purchase additional shares of common stock in full), prior togiving effect to any purchase by JAB of shares in this offering.
18

THE OFFERING
Issuer . . . . . . . . . . . . . . . . . . . . . . . . . . . . Krispy Kreme, Inc.
Common stock offered by us . . . . . . . . . 26,666,667 shares (or 30,666,667 shares, if the underwriters exercisetheir option to purchase additional shares of common stock in full).
Common stock to be outstandingimmediately after this offering and theshare repurchase . . . . . . . . . . . . . . . . . 160,890,354 shares (or 164,890,354 shares, if the underwriters
exercise their option to purchase additional shares of common stockin full).
Option to purchase additional shares ofcommon stock . . . . . . . . . . . . . . . . . . . We have granted the underwriters an option to purchase up to
4,000,000 additional shares of common stock, pro rata. Theunderwriters may exercise this option at any time within 30 days fromthe date of this prospectus. See “Underwriting (Conflict of Interest).”
Use of Proceeds . . . . . . . . . . . . . . . . . . . . We will receive net proceeds of approximately $565.0 million (orapproximately $650.5 million if the underwriters exercise their optionto purchase additional shares of common stock in full) from the saleof the common stock by us in this offering assuming an initial publicoffering price of $22.50 per share (the midpoint of the price range setforth on the cover of this prospectus) and after deducting estimatedoffering expenses and underwriting discounts and commissionspayable by us. Each $1.00 increase (decrease) in the public offeringprice would increase (decrease) our net proceeds by approximately$25.3 million. Similarly, each increase (decrease) of 1,000,000 sharesof common stock offered by us would increase (decrease) our netproceeds by approximately $21.4 million.
We intend to use the net proceeds that we receive from this offering,together with cash on hand, if required, to repay certain of ouroutstanding indebtedness under the Term Loan Facility, to repurchaseshares of common stock from certain of our executive officers at theprice to be paid by the underwriters, and to make payments in respectof tax withholdings relating to certain restricted stock units that willvest or for which vesting will be accelerated in connection with thisoffering, with the remainder, if any, to be used for general corporatepurposes. The share repurchases are based on the midpoint of theprice range set forth on the cover of this prospectus or such lowernumber if such number would exceed the number of shares vesting.
This offering is not conditioned upon the completion of the sharerepurchase, but the share repurchase is conditioned upon completionof this offering.
See “Use of Proceeds.”
Voting . . . . . . . . . . . . . . . . . . . . . . . . . . . Each share of our common stock will entitle its holder to one vote onall matters to be voted on by stockholders generally.
19

Upon the completion of this offering, investors purchasing commonstock in this offering will own approximately 16.6% of our commonstock (or approximately 18.6% if the underwriters exercise theiroption to purchase additional shares of common stock in full) andJAB will beneficially own approximately 77.6% of our commonstock through its affiliates (or approximately 75.7% if theunderwriters exercise their option to purchase additional shares ofcommon stock in full), prior to giving effect to any purchase by JABof shares in this offering. Following the Distribution, JAB willbeneficially own approximately 38.6% of our common stock throughits affiliates (or approximately 37.7% if the underwriters exercisetheir option to purchase additional shares of common stock in full),prior to giving effect to any purchase by JAB of shares in thisoffering.
Dividends . . . . . . . . . . . . . . . . . . . . . . . . Commencing on the fiscal quarter ending October 3, 2021 and subjectto legally available funds, we intend to pay quarterly cash dividendson our common stock. We expect to pay an initial quarterly cashdividend of $0.035 per share for the quarter ending October 3, 2021,which is expected to be paid in October 2021. Thereafter, we expectto pay a dividend subsequent to the close of each fiscal quarter.
The declaration, amount and payment of any dividends will be at thesole discretion of our board of directors and will depend on manyfactors, including the restrictions in certain of our subsidiaries’ creditfacilities. See “Dividend Policy.”
Directed Share Program . . . . . . . . . . . . . At our request, the underwriters have reserved for sale, at the initialpublic offering price, up to 5.0% of the shares offered by thisprospectus for sale to some of our directors, officers, employees,distributors, dealers, business associates and related persons. Thesales will be made at our direction by Morgan Stanley & Co. LLC andits affiliates through a directed share program. If these personspurchase reserved shares it will reduce the number of shares availablefor sale to the general public. Any reserved shares that are not sopurchased will be offered by the underwriters to the general public onthe same terms as the other shares offered by this prospectus. Ifpurchased by our directors and officers, the shares will be subject to a180-day lock-up restriction. See “Underwriting (Conflict of Interest)—Directed Share Program for additional information.”
Investors’ Rights Agreement . . . . . . . . . . Following the completion of this offering, we will have an investors’rights agreement (the “Investors’ Rights Agreement”) with JAB thatwill provide certain registration rights to JAB and such holders andinformation rights to JAB. See “Certain Relationships and RelatedParty Transactions – Investors’ Rights Agreement.”
Indication of Interest . . . . . . . . . . . . . . . . JAB and Olivier Goudet have indicated an interest in purchasingbetween $50 million and $100 million, and $5 million, respectively,in shares of common stock in this offering at a price equal to the price
20

paid by the public, less the underwriting discount. Because thisindication of interest is not a binding agreement or commitment topurchase, JAB and Mr. Goudet could determine to purchase more,less or no shares in this offering or the underwriters could determineto sell more, less or no shares to JAB and Mr. Goudet. If purchasedby JAB or Mr. Goudet, such shares will be subject to a 180-day lock-up restriction.
Proposed Nasdaq Symbol . . . . . . . . . . . . “DNUT”.
Risk Factors . . . . . . . . . . . . . . . . . . . . . . . See “Risk Factors” for a discussion of factors you should carefullyconsider before deciding to invest in our common stock.
Conflict of Interest . . . . . . . . . . . . . . . . . Each of (i) JPMorgan Chase Bank, N.A., an affiliate of J.P. MorganSecurities LLC, an underwriter of this offering, is the administrativeagent and holds a portion of the outstanding balance of our TermLoan Facility and (ii) Morgan Stanley Senior Funding, Inc., anaffiliate of Morgan Stanley & Co. LLC, an underwriter of thisoffering, holds a portion of the outstanding balance of our Term LoanFacility, and as a result, each of J.P. Morgan Securities LLC andMorgan Stanley & Co. LLC, will receive at least 5.0% of the netproceeds from this offering in connection with the ReorganizationTransactions. See “Use of Proceeds.” Therefore, each of J.P. MorganSecurities LLC and Morgan Stanley & Co. LLC, is deemed to have a“conflict of interest” within the meaning of Rule 5121 of theFinancial Industry Regulatory Authority (“FINRA”).
Accordingly, this offering is being conducted in accordance withFINRA Rule 5121. FINRA Rule 5121 prohibits each of J.P. MorganSecurities LLC and Morgan Stanley & Co. LLC from making sales todiscretionary accounts without the prior written approval of theaccount holder and requires that a “qualified independentunderwriter,” as defined in FINRA Rule 5121, participate in thepreparation of the registration statement and exercise its usualstandards of due diligence with respect thereto. Wells FargoSecurities, LLC is acting as the “qualified independent underwriter”for this offering. Wells Fargo Securities, LLC will not receive anyadditional fees for serving as qualified independent underwriter inconnection with this offering. No underwriter having a conflict ofinterest under FINRA Rule 5121 will sell to a discretionary accountany security with respect to which the conflict exists, unless themember has received specific written approval of the transaction fromthe account holder and retains documentation of the approval in itsrecords. See “Underwriting (Conflict of Interest)” for moreinformation.
The number of shares of our common stock to be outstanding immediately after this offering is based on134,183,750 shares of common stock outstanding as of June 21, 2021, and excludes:
• 2,817,398 shares of common stock issuable upon exercise of 2,817,398 outstanding stock options witha weighted average exercise price of $14.61 per share;
• 4,807,508 shares of common stock issuable upon vesting of 4,807,508 restricted stock units awardscurrently outstanding; and
21

• 7,240,066 shares of common stock reserved for issuance under our equity incentive plan.
Unless otherwise indicated, the information in this prospectus:
• Gives effect to the Reorganization Transactions (as defined below under the section entitled“Reorganization”);
• Gives effect to the repurchase of approximately $26.2 million (or approximately 1.2 million shares)assuming an initial public offering price of $22.50 per share (the midpoint of the price range set forthon the cover);
• Assumes an initial public offering price of $22.50 per share of common stock, which is the midpoint ofthe estimated initial public offering price range set forth on the cover page of this prospectus;
• Assumes no exercise by the underwriters of their option to purchase additional shares; and
• Assumes the filing and effectiveness of our amended and restated certificate of incorporation and theadoption of our amended and restated bylaws each of which will occur prior to the closing of thisoffering.
• Assumes no purchase of shares of common stock by JAB or Olivier Goudet in this offering.
22

SUMMARY HISTORICAL CONSOLIDATED FINANCIAL INFORMATION
The following table presents our summary historical consolidated financial information for the periods andas of the dates indicated.
The summary historical consolidated financial information as of January 3, 2021 and December 29, 2019and for the fiscal years ended January 3, 2021, December 29, 2019 and December 30, 2018, have been derivedfrom the audited financial statements included elsewhere in this prospectus. The summary historical consolidatedfinancial information as of April 4, 2021 and for the quarters ended April 4, 2021 and March 29, 2020, have beenderived from the unaudited condensed consolidated financial statements included elsewhere in this prospectus.The unaudited condensed consolidated financial statements have been prepared on a basis consistent with ouraudited financial statements and, in our opinion, contain all adjustments, consisting of only normal recurringadjustments, necessary for fair presentation of such financial data.
Historical results for any prior period are not necessarily indicative of results to be expected in any futureperiod, and results for any interim period are not necessarily indicative of the results to be expected for the fullfiscal year. You should read the summary historical financial information presented below in conjunction withthe information included under the heading “Management’s Discussion and Analysis of Financial Condition andResults of Operations” and the consolidated financial statements and the related notes included elsewhere in thisprospectus.
Quarters Ended Fiscal Years Ended
(in thousands, except share and per share data)April 4,
2021March 29,
2020January 3,
2021December 29,
2019December 30,
2018
STATEMENT OF OPERATIONS DATANet revenue:
Product sales . . . . . . . . . . . . . . . . . . . . . . . . . . . . $313,585 $251,536 $1,085,110 $912,805 $748,860Royalties and other revenues . . . . . . . . . . . . . . . . 8,224 9,680 36,926 46,603 47,023
Total net revenues . . . . . . . . . . . . . . . . . . . . . . . . . . . . 321,809 261,216 1,122,036 959,408 795,883Expenses:
Product and distribution costs . . . . . . . . . . . . . . . 79,997 68,148 310,909 262,013 246,458Operating expenses . . . . . . . . . . . . . . . . . . . . . . . 147,541 115,779 488,061 390,849 295,966Selling, general and administrative expense . . . . 59,044 49,196 216,317 190,237 160,932Pre-opening costs . . . . . . . . . . . . . . . . . . . . . . . . . 1,391 3,437 11,583 7,078 1,903Other expenses, net . . . . . . . . . . . . . . . . . . . . . . . (3,245) 1,171 10,488 7,465 6,708Depreciation and amortization expense . . . . . . . . 23,401 19,087 80,398 63,767 49,447
Operating income . . . . . . . . . . . . . . . . . . . . . . . . . . . . . 13,680 4,398 4,280 37,999 34,469Interest expense, net . . . . . . . . . . . . . . . . . . . . . . . . . . . 8,249 8,644 34,741 38,085 27,881Interest expense – related party . . . . . . . . . . . . . . . . . . 5,566 5,566 22,468 21,947 18,902Other non-operating (income)/expense, net . . . . . . . . . (442) 2,548 (1,101) (609) 5,443
Loss before income taxes . . . . . . . . . . . . . . . . . . . . . . . 307 (12,360) (51,828) (21,424) (17,757)Income tax expense/(benefit) . . . . . . . . . . . . . . . . . . . . 685 (1,412) 9,112 12,577 (5,318)
Net loss . . . . . . . . . . . . . . . . . . . . . . . . . . . . . . . . . . . . . (378) (10,948) (60,940) (34,001) (12,439)Net income attributable to noncontrolling interest . . . 2,683 567 3,361 3,408 1,633
Net loss attributable to Krispy Kreme, Inc. . . . . . . . . . $ (3,061) $ (11,515) $ (64,301) $ (37,409) $ (14,072)
Net loss per share:Common stock – Basic . . . . . . . . . . . . . . . . . . . . $ (44.71) $ (159.29) $ (904.39) $ (518.40) $ (173.52)Common stock – Diluted . . . . . . . . . . . . . . . . . . . $ (45.89) $ (159.39) $ (904.53) $ (519.30) $ (173.85)
Weighted-average shares outstandingBasic and diluted (1) . . . . . . . . . . . . . . . . . . . . . . . 71,626 71,626 71,626 71,626 71,626
Pro forma net loss per share (2):Common stock – Basic . . . . . . . . . . . . . . . . . . . . $ 0.02 $ (0.33)Common stock – Diluted . . . . . . . . . . . . . . . . . . . $ 0.02 $ (0.33)
23

Quarters Ended Fiscal Years Ended
(in thousands)April 4,
2021March 29,
2020January 3,
2021December 29,
2019December 30,
2018
STATEMENTS OF CASH FLOWS DATANet cash provided by operating activities . . . . . . $ 40,641 $ (89) $ 28,675 $ 80,812 $ 148,337Net cash used for investing activities . . . . . . . . . . (63,653) (22,399) (168,128) (226,606) (303,283)Net cash provided by financing activities . . . . . . 36,814 281,680 139,441 129,077 166,195Effect of exchange rate changes on cash, cash
equivalents and restricted cash . . . . . . . . . . . . . (507) (739) 2,045 (941) 410Net increase/(decrease) in cash, cash equivalents
and restricted cash . . . . . . . . . . . . . . . . . . . . . . 13,295 258,453 2,033 (17,658) 11,659Cash, cash equivalents and restricted cash at
beginning of the fiscal year . . . . . . . . . . . . . . . 37,483 35,450 35,450 53,108 41,449
Cash, cash equivalents and restricted cash at endof the fiscal year . . . . . . . . . . . . . . . . . . . . . . . . $ 50,778 $293,903 $ 37,483 $ 35,450 $ 53,108
As of
(in thousands) April 4, 2021January 3,
2021December 29,
2019
Actual Pro Forma (4)
BALANCE SHEET DATA (ATPERIOD END)
Cash and cash equivalents . . . . . . . . . . . . . $ 50,650 $ 78,213 $ 37,460 $ 35,373Working deficit . . . . . . . . . . . . . . . . . . . . . (328,902) (308,273) (333,742) (264,626)Total assets . . . . . . . . . . . . . . . . . . . . . . . . . 3,116,731 3,136,860 3,060,995 2,874,626Total debt (3) . . . . . . . . . . . . . . . . . . . . . . . . 1,204,604 710,402 1,171,636 1,100,278Total shareholders’ equity . . . . . . . . . . . . . $ 863,403 $1,378,234 $ 848,359 $ 883,417
Quarters Ended Fiscal Years Ended
April 4,2021
March 29,2020
January 3,2021
December 29,2019
December 30,2018
OTHER FINANCIAL DATA, KEYPERFORMANCE INDICATORS ANDNON-GAAP MEASURES (5)
Global points of access . . . . . . . . . . . . . . . . . . . . . . 9,077 5,842 8,275 6,040 5,926Total Hubs (as defined)(6) . . . . . . . . . . . . . . . . . . . . . 410 406 409 405 398Net revenue growth % . . . . . . . . . . . . . . . . . . . . . . . 23% 15% 17% 21% 23%Organic revenue growth % . . . . . . . . . . . . . . . . . . . 8% 1% 1% 5% 3%Adjusted EBITDA (thousands) . . . . . . . . . . . . . . . . $46,403 $36,444 $145,434 $146,384 $124,247Adjusted net income (thousands) . . . . . . . . . . . . . . . $17,626 $11,111 $ 42,346 $ 39,749 $ 49,604
(1) See Note 17 to our audited consolidated financial statements included elsewhere in this prospectus foran explanation of the calculations of net loss per share, basic and diluted.
24

(2) The following table sets forth the computations of unaudited pro forma basic and diluted net loss pershare to reflect the effect of the Reorganization Transactions, other than the Distribution, repayment ofthe Term Loan Facility with the proceeds of this offering, and other transactions as described in thetable below:
QuarterEnded
Fiscal YearEnded
(In thousands, except share and per share amounts)April 4,
2021January 3,
2021
Net loss attributable to Krispy Kreme, Inc. . . . . . . . . . . . . . . . . . . . . . $ (3,061) $ (64,301)Adjustment to net loss attributable to common stockholders . . . . . . . (141) (477)Pro forma adjustments:Term Loan Facility financing costs . . . . . . . . . . . . . . . . . . . . . . . . . . . — (1500)Term Loan Facility interest expense (A) . . . . . . . . . . . . . . . . . . . . . . . — (1,192)Eliminate noncontrolling interest as a result of the Merger . . . . . . . . 147 (2,688)Share-based compensation expense related to accelerated vesting of
certain RSUs . . . . . . . . . . . . . . . . . . . . . . . . . . . . . . . . . . . . . . . . . . — (2,388)Remove interest expense related to the repayment of Related Party
Notes . . . . . . . . . . . . . . . . . . . . . . . . . . . . . . . . . . . . . . . . . . . . . . . . 5,566 22,468
Total pro forma adjustments(B) 5,713 14,700
Pro forma net income (loss) attributable to commonshareholders — Basic . . . . . . . . . . . . . . . . . . . . . . . . . . . . . . . . . . 2,511 (50,078)
Additional income attributed to noncontrolling interest due tosubsidiary potential common shares . . . . . . . . . . . . . . . . . . . . . . . . (85) (10)
Pro forma adjustment to eliminate noncontrolling interest as a resultof the Merger (B) . . . . . . . . . . . . . . . . . . . . . . . . . . . . . . . . . . . . . . . 58 (1)
Pro forma net income (loss) attributable to commonshareholders — Diluted . . . . . . . . . . . . . . . . . . . . . . . . . . . . . . . . $ 2,484 $ (50,089)
Basic and diluted weighted average common shares outstanding . . . 71,626 71,626Pro forma adjustments:Eliminate noncontrolling interest as a result of the Merger . . . . . . . . 6,615 6,615Redemption of certain common stock held by KK G.P.) . . . . . . . . . . (4,110) (4,110)Use of proceeds for pro rata dividend in excess of earnings . . . . . . . . 1,078 1,078Use of proceeds to repay Related Party Notes in excess of
earnings . . . . . . . . . . . . . . . . . . . . . . . . . . . . . . . . . . . . . . . . . . . . . . 9,041 9,041Capital contributions from shareholders(C) . . . . . . . . . . . . . . . . . . . . . 3,669 3,669
Total pro forma adjustments(B) 16,293 16,293
Pro forma basic and diluted weighted average common sharesoutstanding pre-stock split . . . . . . . . . . . . . . . . . . . . . . . . . . . . . . 87,919 87,919
Stock split ratio(B) . . . . . . . . . . . . . . . . . . . . . . . . . . . . . . . . . . . . . . . . 1,745 1,745
Pro forma basic and diluted weighted average common sharesoutstanding post-stock split . . . . . . . . . . . . . . . . . . . . . . . . . . . . . 153,419,255 153,419,255
Unaudited pro forma loss per share attributable to commonshareholders:
Basic . . . . . . . . . . . . . . . . . . . . . . . . . . . . . . . . . . . . . . . . . . . . . . . . . . $ 0.02 $ (0.33)Diluted . . . . . . . . . . . . . . . . . . . . . . . . . . . . . . . . . . . . . . . . . . . . . . . . . $ 0.02 $ (0.33)
25

The number of unvested RSUs excluded due to antidilution were 1,566,110 and 874,411 as of January3, 2021 and April 4, 2021, respectively.
(A) Pro forma Term Loan Facility interest expense is calculated based on a LIBOR rate of 0.8175. Formore information on the Term Loan Facility, see “Use of Proceeds”.
(B) For more information on the Related Party Notes, the RSUs where vesting is accelerated in connectionwith this offering, the Term Loan Facility, the Merger, the KK G.P. share redemption, and the pro ratadividend, see “Certain Relationships and Related Party Transactions — Related Party Notes” and“Reorganization.”
(C) For more information on the Capital contribution from shareholders that occurred subsequent to thequarter ended April 4, 2021, see Note 15 to our unaudited condensed consolidated financial statementsincluded elsewhere in this prospectus
(3) Total debt as of April 4, 2021 includes the current portion of long-term debt ($37.6 million), thenon-current portion of long-term debt, net of discount and debt issuance costs ($816.9 million) and theRelated Party Notes ($350.1 million). Total debt as of January 3, 2021 includes the current portion oflong-term debt ($41.2 million), the noncurrent portion of long-term debt, net of discount and debtissuance costs ($785.8 million) and the Related Party Notes ($344.6 million). Total debt as ofDecember 29, 2019 includes the current portion of long-term debt ($46.4 million), the non-currentportion of long-term debt, net of discount and debt issuance costs ($713.7 million) and the RelatedParty Notes ($340.2 million). Pro forma total debt as of April 4, 2021 gives effect to the repayment ofthe Related Party Notes which was repaid with a portion of the KKHI pro rata dividend from theproceeds from the Term Loan Facility and the repayment of a portion of the 2019 Credit facility -revolving credit facility for $144.1 million.
(4) The unaudited pro forma consolidated balance sheet data as of April 4, 2021 gives effect to (i) theReorganization Transactions, other than the Distribution, (ii) the $144.1 million capital contributionfrom shareholders and minority investors and the subsequent repayment of the revolving credit facilitywith the proceeds therefrom, as described in Note 15 to our unaudited condensed consolidated financialstatements included elsewhere in this prospectus, (iii) the repayment of the $14.6 million shareholdernote receivable settlement as described in Note 15 to our unaudited condensed consolidated financialstatements included elsewhere in this prospectus, (iv) the receipt of the $7.4 million tax sharingagreement receivable settlement as described in Note 11 to our unaudited condensed consolidatedfinancial statements included elsewhere in this prospectus, (v) the sale by us of 26,666,667 shares ofcommon stock in this offering at an assumed initial public offering price of $22.50 per share (themidpoint of the price range set forth on the cover of this prospectus, and after deducting estimatedunderwriting discounts and commissions and estimated offering expenses), (vi) repayment of the TermLoan Facility with a portion of the proceeds of this offering, (vii) up to $26.2 million of the netproceeds of this offering to repurchase shares of common stock from certain of our executive officersat the price to be paid by the underwriters, and (viii) approximately $20.8 million of the net proceeds ofthis offering for payment of withholding taxes with respect to the RSUs vesting or for which vesting isaccelerated in connection with this offering, as if they had occurred on April 4, 2021.
(5) See the definitions of key performance indicators under “Key Performance Indicators” above. Fordiscussion of how we utilize Non-GAAP measures, refer to “Non-GAAP Financial Measures.”
(6) Hub counts include only Hot Light Theater Shops and do not include Mini-Hot Light Theater Shops.
26

The following table presents a reconciliation of net revenue growth to organic revenue growth for theperiods presented:
Quarters Ended Fiscal Years Ended
(in thousands)April 4,
2021March 29,
2020January 3,
2021December 29,
2019December 30,
2018
Net revenues – current quarter / year . . . . . . . . . $321,809 $261,216 $1,122,036 $ 959,408 $ 795,883Net revenues – prior quarter / year . . . . . . . . . . 261,216 226,622 959,408 795,883 644,879
Net revenue growth . . . . . . . . . . . . . . . . . . . . . . 60,593 34,594 162,628 163,525 151,004Net revenue growth % . . . . . . . . . . . . . . . . . . . . 23% 15% 17% 21% 23%
Impact of acquisitions (1) . . . . . . . . . . . . . . (33,844) (33,248) (129,429) (138,203) (132,431)Impact of currency . . . . . . . . . . . . . . . . . . . (4,963) 1,699 (906) 10,939 2,054Impact of 53rd Week . . . . . . . . . . . . . . . . . — — (20,506) — —
Organic revenue growth . . . . . . . . . . . . . . . . . . . $ 21,786 $ 3,045 $ 11,788 $ 36,261 $ 20,627
Organic revenue growth % . . . . . . . . . . . . . . . . 8% 1% 1% 5% 3%
(1) Reflects revenue growth attributable to business, shops and other operations acquired and owned by usfor less than twelve months following their acquisition.
The following tables present a reconciliation of net loss to Adjusted EBITDA and net loss to Adjusted NetIncome for the periods presented:
Quarters Ended Fiscal Years Ended
(in thousands)April 4,
2021March 29,
2020January 3,
2021December 29,
2019December 30,
2018
Net loss . . . . . . . . . . . . . . . . . . . . . . . . . . . . . . . . . . $ (378) $(10,948) $ (60,940) $ (34,001) $ (12,439)Interest expense, net . . . . . . . . . . . . . . . . . . . . . . . . 8,249 8,644 34,741 38,085 27,881Interest expense – related party (1) . . . . . . . . . . . . . . 5,566 5,566 22,468 21,947 18,902Income tax expense (benefit) . . . . . . . . . . . . . . . . . . 685 (1,412) 9,112 12,577 (5,318)Depreciation and amortization expense . . . . . . . . . . 23,401 19,087 80,398 63,767 49,447Share-based compensation . . . . . . . . . . . . . . . . . . . 2,368 3,170 11,619 10,680 9,449Other non-operating (income) expense, net (2) . . . . (442) 2,548 (1,101) (609) 5,443New York City flagship Hot Light Theater Shop
opening (3) . . . . . . . . . . . . . . . . . . . . . . . . . . . . . . — 2,572 6,513 3,784 —Strategic initiatives (4) . . . . . . . . . . . . . . . . . . . . . . . — 3,613 20,517 4,059 5,342Acquisition and integration expenses (5) . . . . . . . . . 2,152 3,611 12,679 20,433 9,972Store closure expenses (6) . . . . . . . . . . . . . . . . . . . . . — — 6,269 629 3,396Restructuring and severance expenses (7) . . . . . . . . — — — 583 5,703Other (8) . . . . . . . . . . . . . . . . . . . . . . . . . . . . . . . . . . 4,802 (7) 3,159 4,450 6,469
Adjusted EBITDA . . . . . . . . . . . . . . . . . . . . . . . . . . $46,403 $ 36,444 $145,434 $146,384 $124,247
27

Quarters Ended Fiscal Years Ended
(in thousands)April 4,
2021March 29,
2020January 3,
2021December 29,
2019December 30,
2018
Net loss . . . . . . . . . . . . . . . . . . . . . . . . . . . . . . . . . . . $ (378) $(10,948) $(60,940) $(34,001) $(12,439)Interest expense – related party (1) . . . . . . . . . . . . . . 5,566 5,566 22,468 21,947 18,902Share-based compensation . . . . . . . . . . . . . . . . . . . . 2,368 3,170 11,619 10,680 9,449Other non-operating (income) expense, net (2) . . . . . (442) 2,548 (1,101) (609) 5,443New York City flagship Hot Light Theater Shop
opening (3) . . . . . . . . . . . . . . . . . . . . . . . . . . . . . . . — 2,572 6,513 3,784 —Strategic initiatives (4) . . . . . . . . . . . . . . . . . . . . . . . . — 3,613 20,517 4,059 5,342Acquisition and integration expenses (5) . . . . . . . . . 2,152 3,611 12,679 20,433 9,972Store closure expenses (6) . . . . . . . . . . . . . . . . . . . . . — — 6,269 629 3,396Restructuring and severance expenses (7) . . . . . . . . . — — — 583 5,703Other (8) . . . . . . . . . . . . . . . . . . . . . . . . . . . . . . . . . . . 4,802 (7) 3,159 4,450 6,469Amortization of acquisition related
intangibles (9) . . . . . . . . . . . . . . . . . . . . . . . . . . . . 7,449 6,380 26,328 21,318 17,367Loss on extinguishment of debt (10) . . . . . . . . . . . . . — — — 1,567 —Tax impact of adjustments (11) . . . . . . . . . . . . . . . . . (4,022) (5,394) (27,629) (19,960) (20,000)Tax specific adjustments (12) . . . . . . . . . . . . . . . . . . 131 — 22,464 4,869 —
Adjusted net income . . . . . . . . . . . . . . . . . . . . . . . . . $17,626 $ 11,111 $ 42,346 $ 39,749 $ 49,604
(1) Consists of interest expense related to the Related Party Notes.(2) Consists primarily of foreign translation gains and losses in each fiscal year. Fiscal 2018 also includes
$4.7 million of contingent consideration paid related to the Krispy Kreme Holdings Pty Ltd (“KKAustralia”) acquisition.
(3) Consists of pre-opening costs related to our New York City flagship Hot Light Theater Shop opening,including shop design, rent and additional consulting and training costs incurred and reflected inselling, general and administrative expenses.
(4) Strategic initiatives for the quarter ended March 29, 2020, and fiscal 2020 and 2019 consist mainly ofconsulting and advisory fees, personnel transition costs, and network conversion and set-up costsrelated to the evolution of our legacy wholesale business in the United States.
(5) Consists of acquisition and integration-related costs in connection with our business and franchiseacquisitions, including legal, due diligence, consulting and advisory fees incurred in connection withacquisition-related activities for the applicable period.
(6) Consists of lease termination costs, impairment charges, and loss on disposal of property, plant andequipment.
(7) Consists of severance and related benefits costs associated with our hiring of a new global managementteam.
(8) The quarter ended April 4, 2021 consists primarily of $3.5 million of consulting and advisory feesincurred in connection with the preparation for our initial public offering. Fiscal 2020 includes$1.2 million of management fees paid to JAB and $3.2 million of consulting and advisory fees incurredin connection with preparation for our initial public offering, partially offset by a $2.5 million gain onthe sale of land. Fiscal 2019 includes $3.1 million lease impairment expenses related to our Winston-Salem office location incurred in connection with our Corporate headquarters relocation to Charlotte,North Carolina. Fiscal 2018 includes $4.0 million of consulting and professional fees related to a saleleaseback transaction and other finance projects.
(9) Consists of amortization related to acquired intangible assets as reflected within depreciation andamortization in the consolidated statements of operations.
28

(10) Consists of the write-off of debt issuance costs in connection with the refinancing of the 2016 creditfacility.
(11) Tax impact of adjustments calculated applying the applicable statutory rates. The Company’s adjustedeffective tax rate is 25.2%, 41.0% and 22.8% for each of the fiscal years 2020, 2019 and 2018,respectively. The adjusted effective tax rate for the interim periods differs from the annual adjustedeffective tax rate due to the tax effect of certain discrete items recorded during the interim periods. Theadjusted effective tax rate in fiscal 2019 was higher compared to fiscal 2020 due to the recording of anuncertain tax position of $12.0 million in the fourth quarter of fiscal 2019.
(12) Fiscal 2020 and fiscal 2019 include valuation allowances of $20.5 million and $6.6 million,respectively, associated with tax attributes primarily attributable to incremental costs removed from thecalculation of Adjusted Net Income.
29

RISK FACTORS
An investment in our common stock involves a high degree of risk. You should carefully consider the risksdescribed below together with other information set forth in this prospectus before investing in our commonstock. If any of the following risks or uncertainties actually occur, our business, financial condition, prospects,results of operations and cash flow could be materially and adversely affected. In that case, the market price ofour common stock could decline and you may lose all or a part of your investment. The risks discussed below arenot the only risks we face. Additional risks or uncertainties not currently known to us, or that we currently deemimmaterial, may also have a material adverse effect on our business, financial condition, prospects, results ofoperations or cash flows. We cannot assure you that any of the events discussed in the risk factors below will notoccur.
Risks Related to Our Business and Industry
Public health outbreaks, epidemics or pandemics, including the global COVID-19 outbreak, have disruptedand may continue to disrupt, our business, and could materially affect our business, results of operations, andfinancial condition.
Health epidemics or pandemics can adversely affect consumer spending and confidence levels and supplyavailability and costs in the markets in which we and our franchisees operate all of which can affect our business,liquidity, financial condition and results of operations. In December 2019, a novel strain of coronavirus, referredto as 2019-ncov, COVID-19 coronavirus epidemic, or COVID-19, was identified. COVID-19 has since spreadglobally, including the United States where we have our executive offices and principal operations. The globalpandemic resulting from the outbreak of COVID-19 has disrupted global health, economic and marketconditions, consumer behavior and food service operations.
Governmental authorities, nationally and internationally, have recommended social distancing and haveimposed quarantine, shelter-in-place, curfew and similar isolation measures, including government orders andother restrictions on the conduct of business operations in an effort to slow the spread of COVID-19. Whilecertain regions have begun re-opening, our shops and other facilities in some of such regions may be subject tomodified hours and operations and/or reduced traffic even without government imposed restrictions. In addition,we face risks related to resurgences of COVID-19, including the emergence of new variant strains of COVID-19,in regions that have reopened, which have and may in the future necessitate renewed government restrictions.
If any of our employees or the employees of our franchisees were to contract COVID-19 or other illnesses,our operations could be significantly disrupted, since this could require us or our franchisees to quarantine someor all such employees or close and disinfect our impacted facilities. While we have enacted protections, includingthe installation of “sneeze” guards, a glove and mask policy, and conversion of aisles to “one-way” traffic, wemay nonetheless be subject to COVID-19 outbreaks in our shops and Doughnut Factories. If a significantpercentage of our workforce or the workforce of our business partners are unable to work, including because ofillness or government restrictions in connection with pandemics or disease outbreaks, our operations may benegatively impacted, potentially materially adversely affecting our business, liquidity, financial condition andresults of operations.
Operations in our and our franchisees’ shops have been and, at least in the short term, are expected tocontinue to be disrupted to varying degrees. The COVID-19 pandemic has impacted our and our franchisees’businesses globally. In the United States, we temporarily closed the lobbies of our shops in March 2020 andshifted to drive-thru, “to-go” and delivery. We also experienced delays in opening new shops, including ourNew York City flagship Hot Light Theater Shop. With a prioritization on health and safety of our KrispyKremers and Insomniac team members and customers, we were able to re-open shops under modified operationsto meet public health guidelines and evolving customer behaviors and expectations. As of January 3, 2021, all ofour shops in the United States and Canada are fully open.
30

Internationally, government-mandated lock-down periods significantly impacted our company-ownedbusinesses in the United Kingdom and Australia. In the United Kingdom, 21 shops remain closed due toCOVID-19 restrictions as of January 3, 2021, and a total of nine shops and a manufacturing facility have beenpermanently closed since March 2020 as a result of the COVID-19 pandemic. As of January 3, 2021, 75 shopsrepresenting 6.7% of our total shops internationally were closed due to COVID-19 pandemic restrictions.
In addition, our business is affected by consumer preferences and perceptions. The risk of contractingviruses has and could continue to cause employees or guests to avoid gathering in public places, which has had,and could further have, adverse effects on ours and our franchisees’ guest traffic and the ability to adequatelystaff shop locations. Even if a virus or other disease does not spread significantly within a specific area, theperceived risk of infection or health risk in such area may adversely affect our business, liquidity, financialcondition and results of operations.
Many consumer behaviors have changed during the COVID-19 pandemic as a result of mandates or ordersfrom federal, state and local authorities, and concerns about the transmission of COVID-19, including less timespent commuting or outside the home, leading to fewer shop visits and more food and beverage prepared andconsumed at home, or by delivery. These changes in behavior may continue following global vaccinedistribution, the lifting of such mandates or orders and the resumption of more normal economic and operatingconditions, possibly beyond the end of the pandemic. These changes have and could continue to negativelyimpact ours and our franchisees’ sales and customer traffic, which has and could continue to materially andadversely impact our business, liquidity, financial condition and results of operations.
In addition, we believe that our and our franchisees’ sales, customer traffic, and profitability are stronglycorrelated to consumer discretionary spending, which is influenced by general economic conditions,unemployment levels, and the availability of discretionary income all of which has been, and may continue to be,negatively impacted by the COVID-19 pandemic. In general, the food service industry’s sales are dependentupon discretionary spending by consumers, and reductions in sales at our and our franchisees’ shops wouldadversely impact our profitability.
The length of time it may take for global vaccine distribution and more normal economic and operatingconditions to resume remains uncertain and the economic recovery period could continue for a prolonged periodeven after the health risks of the pandemic subside. We expect that certain operational changes made during thepandemic, particularly with respect to enhanced health and safety measures in franchised shops, will remain inplace for an extended period (and some of these changes may be permanent changes) and could increase our andour franchisees’ costs.
The COVID-19 pandemic may also have the effect of heightening other risks disclosed in this prospectus,including, but not limited to, those related to our ability to service our debt obligations, supply chain interruptionsand/or commodity price increases, and the financial condition of our franchisees.
Changes in consumer preferences and demographic trends could negatively impact our business.
Food service businesses are often affected by changes in consumer tastes, national, regional and localeconomic conditions, discretionary spending priorities, demographic trends, traffic patterns and the type, numberand location of competing brands. For instance, if prevailing health or dietary preferences cause consumers toavoid indulgences such as doughnuts or cookies in favor of foods that are perceived as healthier, our sales wouldsuffer. In addition, the food service industry continues to be under heightened legal and legislative scrutinyrelated to menu labeling resulting from the perception that the practices of food service companies havecontributed to nutritional, caloric intake, obesity, or other health concerns of their guests. For example, if we areunable to adapt to changes in consumer preferences and trends, or if regulatory changes are implemented thatimpact any of our markets, our operating results could be negatively impacted.
31

Maintaining, extending and expanding our reputation and brand image are essential to our business success.
Our success depends on our ability to maintain our brand image, extend our products to new channels,expand our brand image with new product offerings and deliver consistent high-quality, delicious products to ourcustomers.
While we seek to maintain, extend, and expand our brand image through marketing investments, includingadvertising and consumer promotions, the majority of our marketing initiatives rely on a social-media focusedapproach to create positive impacts on both our brand value and reputation. Our success in maintaining,extending, and expanding our brand image depends on our ability to adapt to a rapidly changing mediaenvironment. We increasingly rely on social media and online dissemination of advertising campaigns. Socialand digital media increases the speed and extent that information or misinformation and opinions can be shared.Negative posts or comments about us, our brands or our products on social or digital media, whether or not valid,could seriously damage our brands and reputation. If we do not maintain, extend, and expand our brand image,then our business, financial condition and results of operations could be materially and adversely affected. Theserisks are especially pronounced in light of our reliance on our social-media presence to promote our brand andmaintain customer loyalty and engagement.
In addition, increasing regulatory or legal action against us, product recalls or other adverse publicity coulddamage our reputation and brand image, undermine our customers’ confidence and reduce long-term demand forour products, even if these actions are unfounded or not material to our operations.
The food service industry is affected by food safety issues, including food tampering or contamination.
Food safety, including the possibility of food tampering or contamination is a concern for any food servicebusiness. Any report or publicity linking us or one of our franchisees to food safety issues, including foodtampering or contamination, could adversely affect our reputation as well as our revenues and profits. Increaseduse of social media could amplify the effects of negative publicity. These risks may be increased as we introducenew products or increase distribution channels, such as our Branded Sweet Treat Line or DFD business channels.Food safety issues could also adversely affect the price and availability of affected ingredients, which couldresult in disruptions in our supply chain or lower margins for us and our franchisees. Additionally, food safetyissues could expose us to litigation, governmental investigation, recalls or fines.
The food service industry is affected by litigation, regulation and publicity concerning food quality, health andother issues, which can cause customers to avoid our products and result in liabilities.
Food service businesses can be adversely affected by litigation, by regulation and by complaints fromcustomers or government authorities resulting from food quality, illness, injury or other health concerns oroperating issues stemming from one shop or a limited number of shops, including shops operated by ourfranchisees, or as we introduce new products or increase distribution channels, such as our Branded Sweet TreatLine or DFD business channels. In addition, class action lawsuits have been filed and may continue to be filedagainst various food service businesses (including quick service restaurants) alleging, among other things, thatfood service businesses have failed to disclose the health risks associated with high-fat foods and that certainfood service business marketing practices have encouraged obesity. Adverse publicity about these allegationsmay negatively affect us and our franchisees, regardless of whether the allegations are true, by discouragingcustomers from buying our products. Because one of our competitive strengths is the taste and quality of ourdoughnuts and other indulgence products, adverse publicity or regulations relating to food quality or other similarconcerns affect us more than it would food service businesses that compete primarily on other factors. We couldalso incur significant liabilities if such a lawsuit or claim results in a decision against us or as a result of litigationcosts regardless of the result.
32

Adverse weather conditions could adversely affect our business.
Adverse weather conditions can impact guest traffic at our and our franchisees’ shops and, in more severecases such as hurricanes, tornadoes, flooding or other natural disasters (which can be worsened as a result ofclimate change), cause temporary closures, sometimes for prolonged periods, which would negatively impact ourshop sales. Changes in weather could result in construction delays, interruptions to the availability of utilities,and shortages or interruptions in the supply of food items and other supplies, which could increase our costs.
We may not be successful in implementing important strategic initiatives, which may have an adverse impacton our business.
We depend on our ability to continue to grow and evolve through various important strategic initiatives. Wehave developed a number of strategic initiatives designed to foster our growth and improve our profitability. Ourbusiness growth strategy has the following principal components: increasing trial and frequency of customervisits, growing our omni-channel network in new and existing markets, growing Insomnia and driving additionalefficiencies in and benefits from our omni-channel business model. There can be no assurance that we will beable to implement these important strategic initiatives or that these strategic initiatives will deliver on theirintended results, which could in turn adversely affect our business.
In addition to other factors listed in this risk factors section, factors that may adversely affect the successfulimplementation of these strategic initiatives include the following:
• imposition of additional taxes by jurisdictions, such as on certain types of food, beverages, ingredientsor based on number of employees;
• construction cost increases associated with new shop openings and remodeling of existing shops;delays in shop openings for reasons beyond our control, such as the delays we experienced in openingour New York City flagship Hot Light Theater Shop due to the COVID-19 pandemic, or a lack ofdesirable real estate locations available for lease at reasonable rates;
• not successfully scaling our manufacturing or supply chain infrastructure as our product offeringsincrease and as we continue to expand our omni-channel business model; and
• the deterioration in our credit ratings, which could limit the availability of financing and increase thecost of obtaining financing to fund our initiatives.
Effectively managing growth can be challenging, particularly as we expand into new markets. If we are notsuccessful in implementing our strategic initiatives, we may be required to evaluate whether certain assets,including goodwill and other intangibles, have become impaired. In the event we record an impairment charge, itcould have a material impact on our financial results.
We may not realize the anticipated benefits from past or potential future acquisitions, investments or otherstrategic transactions.
We are in the process of acquiring additional franchised shops domestically and internationally. In certaincircumstances, our existing franchisees may retain a minority stake in the franchise shops we acquire andcontinue to participate in the operation of the applicable shops. Such arrangements are entered into on acase-by-case basis. In addition, from time to time we evaluate and may complete other mergers, acquisitions,divestitures, joint ventures, strategic partnerships, minority investments or strategic transactions, including ourNovember 2019 majority-stake partnership with WKS Holdings, our April 2018 majority-stake partnership withGreat Circle Family Foods and our acquisition of all of the equity interests of Krispy Kreme Holding UK Ltd.,Krispy Kreme Mexico S. de R.L. de C.V., Krispy Kreme Holdings Pty Ltd and Krispy Kreme Doughnut JapanCo., Ltd. We expect to continue this trend, looking for strategic opportunities to acquire or partner with ourdomestic and international franchisees.
33

Past and potential future strategic transactions may involve various inherent risks, including, withoutlimitation:
• expenses, delays or difficulties in integrating acquired Krispy Kreme franchised shops, strategicpartnerships or investments into our organization, including the failure to realize expected synergiesand/or the inability to retain key personnel;
• diversion of management’s attention from other initiatives and/or day-to-day operations to effectivelyexecute our growth strategy;
• inability to generate sufficient revenue, profit, and cash flow from acquired Krispy Kreme franchisedshops, companies, strategic partnerships or investments;
• the possibility that we have acquired substantial contingent or unanticipated liabilities in connectionwith acquisitions or other strategic transactions; and
• the possibility that investments we have made may decline significantly in value, which could lead tothe potential impairment of the carrying value of goodwill associated with acquired businesses.
Past and potential future strategic transactions may not ultimately create value for us and may harm ourreputation and materially adversely affect our business, financial condition and results of operations.
We will face risks as we complete our legacy wholesale business evolution of DFD and the introduction of ourBranded Sweet Treats Line.
We are in the process of completing the evolution of our legacy wholesale business by transforming ourDFD model and introducing our new Branded Sweet Treat Line. Such efforts have entailed significant costs anduncertainties arising from, among other things, our manufacturing facilities intervention, our transition to anomni-channel business model, building and developing our information technology and logistics systems andadaption to our new corporate organization and talent. These efforts have incurred certain costs relating to,among other things:
• severance costs from payroll reductions;
• asset, equipment and inventory write-downs;
• lease termination costs;
• shop conversion costs;
• systems upgrade costs;
• contract termination costs; and
• third-party costs to help facilitate the transformation through transitional services.
In connection with the evolution of our legacy wholesale business, we have and continue to rollout our DFDbusiness channels. We have also launched our new Branded Sweet Treat Line. Successful implementation ofthese business lines relies and will continue to rely on our ability to capitalize and realize certain goals, includingidentifying retail partners, expanding the geographies we serve and developing and maintaining themanufacturing and logistical capacity to service our Branded Sweet Treat Line and DFD business channels. Inaddition, these may exacerbate or be exacerbated by other risk factors included herein, especially those related toour logistical and manufacturing capacity and ability to compete in the indulgence market.
There is no guarantee that we will achieve the benefits we anticipate or achieve the costs savings, revenuegeneration and other positive effects necessary to offset the costs and risks discussed above. In addition, ourBranded Sweet Treat Line has thus far been unprofitable and has only been deployed domestically. There is noguarantee that it will see success among consumers in international markets or ever turn a profit eitherdomestically or internationally. Any failure to recognize our expected benefits could materially and adverselyaffect our business, our results of operations and financial condition.
34

Our success depends on our ability to compete with many food service businesses.
We compete with many well-established food service companies. At the shop level, we compete with otherindulgence retailers and bakeries, specialty coffee retailers, bagel shops, quick service restaurants, delicatessens,take-out food service companies, convenience stores and supermarkets. Our Branded Sweet Treat Line competesprimarily with grocery store bakeries and packaged snack foods.
In both our shop and Branded Sweet Treat Line business channels, aggressive pricing by our competitors orthe entrance of new competitors into our markets could reduce our sales and profit margins. Moreover, many ofour competitors offer consumers a wider range of products. Many of our competitors or potential competitorshave substantially greater financial and other resources than we do which may allow them to react to changes inpricing, marketing and the quick service restaurant industry better than we can. As competitors expand theiroperations, competition may intensify. In addition, the start-up costs associated with retail indulgence and similarfood service establishments are not a significant impediment to entry into the retail indulgence business.
In addition to the above, our omni-channel business approach, especially our Insomnia brand, whichemphasizes delivery as a key component, competes with local and international indulgence brands in a highlycompetitive space. While we control and operate our e-Commerce platform, we rely on third-party food deliveryservices, including DoorDash, for last-mile delivery of our products. We are also a partner platform on suchservices, in which the end-to-end transaction with customers, including delivery of our products is conducted bythe third-party platform. Our customers may prefer other indulgence providers’ e-Commerce platforms or otherdelivery platforms and services for a variety of competitive reasons, including delivery availability, app userexperience and overall market demand for food delivery.
If we are unable to successfully compete, we may be unable to sustain or increase our revenues andprofitability as well as leverage the growth and we expect to achieve through our omni-channel business model.
A key portion of our growth strategy depends on opening new Krispy Kreme shops both domestically andinternationally.
A core part of our business strategy is expansion of our shops, DFD and e-Commerce and delivery businesschannels’ reach to new geographies, markets and customers, nationally and internationally. Our ability to effectsuch an expansion may be influenced by factors beyond our and our franchisees’ control, which may slow shopdevelopment and impair our growth strategy. Our ability to successfully open new shops and acquire directcontrol over existing franchise shops will depend on various factors, including the availability of suitable sites,the negotiation of acceptable leases or purchase terms for new locations, permitting and regulatory compliance,the ability to meet construction schedules, the financial and other capabilities of our franchisees, and generaleconomic and business conditions. We may also be limited by logistical or other operational concerns, includingan inability to source product components or logistical services. Further, certain international markets of ours areheavily reliant on our franchisees and there can be no assurance that our franchisees will successfully develop oroperate their shops in a manner consistent with our concepts and standards, or will have the business abilities oraccess to financial resources necessary to open and maintain the shops required by their agreements.
New or acquired Krispy Kreme shops may require significant expense before opening or re-opening and, onceopened, may not be profitable for some time following their opening.
Our success has been, and in the future will continue to be, significantly impacted by the timing of newKrispy Kreme shop openings (often dictated by factors outside of our control), including landlord delays,associated pre-opening costs and operating inefficiencies. We typically incur the most significant portion ofpre-opening costs associated with a given shop within the several months preceding the opening of the shop.Thereafter, our new shops take a period of time to reach target operating levels due to inefficiencies typicallyassociated with new shops, including the training of new personnel, new market learning curves, inability to hire
35

sufficient qualified staff and other factors. Likewise, upon acquisition of a formerly franchised shop, we mayincur inefficiencies as we integrate such shops into network of directly controlled shops, train or retrainpersonnel and negotiate or restructure logistical networks. We may incur additional costs in new markets,particularly if we are required to develop or negotiate new transportation or logistical networks, which mayimpact the profitability of those shops. These additional costs may be exacerbated where such new markets are incountries that we have not previously operated in. Although we have specific target operating and financialmetrics, new shops may not meet these targets or may take longer than anticipated to do so. Any new shops weopen may not be profitable or achieve operating results similar to those of our existing shops, which couldadversely affect our business, financial condition or results of operations.
Our new Branded Sweet Treat Line and DFD business channels depend on key customers and are subject torisks if such key customers reduce the amount of products they purchase from us or terminate theirrelationships with us.
Sales to retail customers through both our Branded Sweet Treat Line and DFD channels represent asubstantial portion of our revenue. The infrastructure necessary to support our Branded Sweet Treat Line andDFD business channels results in significant fixed and semi-fixed costs. Also, the loss of one of our large retailcustomers or significant financial difficulties in their businesses could adversely affect our financial conditionand results of operations.
We have several large retail customers throughout the world. However, no single retail customer accountedfor more than 10% of our total revenue in the fiscal years ended January 3, 2021, December 29, 2019 orDecember 30, 2018. These customers do not enter into long-term contracts; instead, they make purchasedecisions based on a combination of price, product quality, consumer demand and service quality. They may inthe future use more of their shelf space, including space currently used for our products, for other products,including private label products. If our sales to one or more of these customers are reduced, this reduction mayadversely affect our business.
We are the exclusive supplier of doughnut mixes or mix concentrates to all Krispy Kreme shops worldwide.We also supply other key ingredients and flavors to all domestic Krispy Kreme company-owned shops. If wehave any problems supplying these ingredients, our and our franchisees’ ability to make doughnuts could benegatively affected.
We are the exclusive supplier of doughnut mixes for many domestic and international Krispy Kreme shopsand the exclusive supplier of doughnut mix concentrate, which is blended with other ingredients to producedoughnut mixes at both domestic and international production facilities, for all Krispy Kreme shops globally. Wealso are the exclusive supplier of certain other key ingredients and flavors to all domestic company-owned shops,most domestic franchise shops and some international franchise shops. We manufacture all of our concentrates atour manufacturing facility located in Winston-Salem, North Carolina and produce doughnut mix domestically atour Winston-Salem plant and a third-party facility in Pico Rivera, California. We distribute doughnut mixes andother key ingredients and flavors using independent contract distributors for Krispy Kreme shops domesticallyand internationally.
The Pico Rivera facility produces mix for distribution to most Krispy Kreme shops west of the MississippiRiver and has the capacity to manufacture our doughnut mixes for other regions in the event of a shut-down orloss of capacity at our Winston-Salem facility. Nevertheless, an interruption of production at any manufacturingfacility could impede our ability or that of our franchisees to make doughnuts domestically. Internationally, weproduce doughnut mix at several plants and any disruption at such facilities may have regional impacts on theability of our locations and our franchisees’ locations doughnut production capabilities. In addition, since weexclusively produce doughnut mix concentrate at our Winston-Salem facility, any shutdown or disruption of suchfacility would disrupt our entire global supply chain of doughnut mix concentrate without an adequate alternativesource.
36

We generally ship our mix and concentrate internationally from a single port in Florida. While mix andconcentrate are generally supplied in amounts sufficient to provide for doughnut production on a longer-termbasis, delays in shipping or logistics chains could impact ours and our franchisees’ international operations.Events that delay shipment may be known or unknown, including events arising in connection with adverseweather events, customs and border shutdowns, trade conflicts and general trade route delays, including therecent stoppage in the Suez Canal. In addition, in the event that any of our relationships with our raw materialsuppliers terminate unexpectedly, even where we have multiple suppliers for the same ingredient, we may not beable to obtain adequate quantities of the same high-quality ingredients at competitive prices. As we continue toexpand our global footprint the above risks may be exacerbated as we encounter supply shortages, logisticalhurdles and other costs associated with operating and supplying a global network of shops.
Our profitability is sensitive to changes in the cost of raw materials.
Although we utilize forward purchase contracts and futures contracts and/or options on such contracts tomitigate the risks related to commodity price fluctuations, such contracts do not fully mitigate commodity pricerisk, particularly over the longer term. In addition, the portion of our anticipated future commodity requirementsthat is subject to such contracts varies from time to time.
Flour, shortening and sugar are our three most significant ingredients. We also purchase a substantialamount of gasoline to fuel our fleet of delivery vehicles for our DFD business and significant amounts ofpackaging materials to make, among other things, our iconic boxes for our dozens and half-dozens. The prices ofwheat and soybean oil, which are the principal components of flour and shortening respectively, and of sugar andgasoline, have been volatile in recent years. We attempt to leverage our size to achieve economies of scale inpurchasing, but there can be no assurances that we can always do so effectively. Adverse changes in commodityprices could adversely affect our profitability.
We are the only manufacturer of substantially all of our doughnut-making equipment. If we have anyproblems producing this equipment, our shops’ ability to make doughnuts could be negatively affected.
We manufacture our custom doughnut-making equipment in one facility in Winston-Salem, North Carolina.Our facility may be affected by:
• failure of our suppliers to comply with regulatory or quality requirements, or to comply with ourspecifications;
• failure of our suppliers to timely notify us of changes to the components they supply;
• contractual or other disputes with any such supplier, including with respect to compliance with productsupply and/or payment terms;
• change of ownership of a supplier through acquisition or sale of a business;
• any strike or work stoppage;
• disruptions in shipping, such as adverse weather events, customs and border shutdowns, trade conflictsand general trade route delays, including the recent stoppage in the Suez Canal;
• manufacturing limitations or other restrictions on availability or use of raw materials or componentsnecessary for the development, testing, manufacture or sale of our doughnut-making equipment; or
• a natural disaster or extraordinary event caused by fire, flood, earthquakes, environmental accidents orpandemic, all of which can be exacerbated or worsened by climate change.
Although we have limited backup sources for the production of our equipment, obtaining new equipmentquickly in the event of a loss of our Winston-Salem facility would be difficult. In such an event, we would beforced to rely on third-party manufacturers or shift production to another manufacturing facility, and we could
37

face significant delays in manufacturing and increased costs, which would jeopardize our ability to supplyequipment to new shops or new parts for the maintenance of existing equipment in established shops on a timelybasis.
We have limited suppliers for many of the product components and services that we rely on and anyinterruption in supply could impair our ability to make and deliver our signature products, adversely affectingour operating results.
We utilize a sole supplier for our glaze flavoring and glaze base. In addition, all of the cookie dough used byour Insomnia brand is supplied by a single supplier. Unless and until we can secure alternative suppliers for suchcomponents, our dependence on such supplier will subject us to the possible risks of shortages, interruptions andprice fluctuations. Any interruption in the delivery of glaze flavoring would adversely affect our ability toproduce and deliver our signature products, including our hot Original Glazed® doughnut, to our customers on atimely and competitive basis and could adversely affect our operating results.
If we experience significant increased demand, including as a result of our global expansion, or need toreplace the existing supplier, there can be no assurance that additional supplies of product components will beavailable when required on terms that are acceptable to us, or at all, or that any supplier would allocate sufficientcapacity to us in order to meet our requirements or fill our orders in a timely manner. Even if we are able to findalternative sources, we may encounter delays in production and added costs as a result of the time it takes to trainour suppliers in our methods, products and quality control standards. Delays related to supplier changes couldalso arise due to an increase in shipping times if new suppliers are located farther away from our markets or fromother participants in our supply chain. In addition, there can be no assurance that our existing supplier willcontinue to provide components that are consistent with our standards. In that event, unless we are able to obtainreplacement products in a timely manner, we risk the loss of revenue resulting from the inability to sell ourproducts and related increased administrative and shipping costs.
In addition, we rely on a limited number of providers for our U.S. warehousing and logistics for shopdelivery. As our Hub & Spoke and omni-channel business model expands, we will increasingly rely on suchproviders for logistics services, which exposes us to risks related to such providers’ ability to service our needsand the costs of such service. We have recently seen increased costs related to such service arising out of ourincreased demand for logistics needs, and the rollouts of our DFD business channels and introduction of our newBranded Sweet Treat Line as part of the evolution of our legacy wholesale business. Our inability to negotiatereasonable terms with such providers or identify an alternative provider for logistics services could reduce ourmargins in a material way. Furthermore, dealing with a limited number of providers exposes us to increased risksarising from such suppliers’ distribution networks. Increases in the price of fuel, employee strikes, organizedlabor activities, inclement weather and a variety of other known and unknown factors could limit our providers’ability to service our logistical needs. If we are unable to source alternative logistical providers, our costs maysignificantly increase and, if we are unable to pass increased distribution costs on to our customers in the form ofhigher prices for our products, our business, financial condition and results of operations could be adverselyaffected.
We rely on information technology in our operations and are making improvements to important businesssystems. Any material failure, inadequacy or interruption of that technology could adversely affect our abilityto effectively operate our business and result in financial or other loss.
We and our franchisees rely on computer systems and information technology to conduct our business andour ability to effectively manage our business depends significantly on the reliability and capacity of thesesystems. In addition, we must effectively respond to changing guest expectations and new technologicaldevelopments. Disruptions or failures of these systems could cause an interruption in our business which couldhave a material adverse effect on our results of operations and financial condition.
38

We intend to perform upgrades to two of our information technology systems in 2021 to ensure we remainon supportable versions of key software. These systems include the ERP system which handles manufacturing,finance and logistics as well as the point of sale system which enable retail sales at the shops. Implementing thesesystems is a lengthy and expensive process that may result in a diversion of resources from other initiatives andactivities. Continued execution of the project plans, or a divergence from them, may result in cost overruns,project delays or business interruptions. Business interruptions also could result from the failure of otherimportant information technology platforms we use to operate our business, including platforms hosted orotherwise provided by third parties on our behalf. Any disruptions, delays or deficiencies in the design and/orimplementation of any of these systems, or our inability to accurately predict the costs of such initiatives or ourfailure to generate revenue and corresponding profits from such activities and investments, could impact ourability to perform necessary business operations, which could adversely affect our reputation, competitiveposition, business, results of operations and financial condition.
Systems failures and resulting interruptions could adversely affect our omni-channel business strategy.
Our omni-channel approach will in large part rely on our information technology systems to operatesuccessfully, including the implementation of our delivery strategy. As we expand our DFD and deliverybusiness channels, our exposure to such risks will increase.
Our systems, which in some cases rely on third-party providers, may experience service interruptions,degradation or other performance problems because of hardware and software defects or malfunctions,distributed denial-of-service and other cyberattacks, infrastructure changes, human error, earthquakes,hurricanes, floods, fires, natural disasters, power losses, disruptions in telecommunications services, fraud,military or political conflicts, terrorist attacks, computer viruses, ransomware, malware, or other events. Oursystems also may be subject to break-ins, sabotage, theft, and intentional acts of vandalism as a result of criminalthird parties (including state-sponsored organizations with significant financial and technological resources),third parties we do business with and our and our franchisees’ employees. Our reliance on third-parties increasesour exposure to such risks as we exercise a lesser degree of control over such persons. Our business interruptioninsurance may not be sufficient to cover all of our losses that may result from interruptions in our service as aresult of systems failures and similar events. As a result, if we experience any outsized material impacts from afailure of our systems, our business, results of operations and financial condition could be materially andadversely effected.
While we endeavor to keep all systems current, within two revisions of the most current software andfirmware versions, there can be no guarantee that we can reliably update and maintain our systems. In instanceswhere we are unable to do so, the mitigating controls we put in place to reduce the risk may fail. Any such failurecould lead to e-Commerce downtime, disruptions to our information technology systems and exposevulnerabilities to cyber-criminals.
Our business could be adversely impacted by changes in the Internet and mobile device accessibility ofconsumers.
The e-Commerce and delivery aspects of our omni-channel strategy will depend on consumers ability toaccess to our branded platforms and third-party platforms via a mobile device or personal computer and theInternet. We may operate in jurisdictions with limited Internet connectivity, particularly as we expandinternationally. Internet access and access to a mobile device or personal computer are frequently provided bycompanies with significant market power that could take actions that degrade, disrupt, or increase the cost ofconsumers’ ability to access our platform. In addition, the Internet infrastructure that we, third-party platformsand our consumers rely on in any particular geographic area may be unable to support the demands placed uponit and could interfere with the speed and availability of our branded e-Commerce platforms or third-partyplatforms. Any such failure in Internet or mobile device or computer accessibility, even for a short period oftime, could adversely affect our business and results of operations.
39

If we or our franchisees or licensees are unable to protect our customers’ payment card data and otherregulated, protected or personally identifiable information, we or our franchisees could be exposed to dataloss, litigation, and liability, and our reputation could be significantly harmed.
Our business requires the collection, transmission and retention of large volumes of customer and employeedata, including credit and debit card numbers and other personally identifiable information, in variousinformation technology systems that we and our franchisees maintain, and in those maintained by third partieswith whom we contract to provide services. The integrity and protection of that guest and employee data iscritical to us. Further, our guests and employees have a high expectation that we and our service providers willadequately protect their personal information.
Further, the standards for systems currently used for transmission and approval of electronic paymenttransactions, and the technology utilized in electronic payment themselves, all of which can put electronicpayment data at risk, are determined and controlled by the payment card industry, not by us. For example, we aresubject to industry requirements such as the Payment Card Industry Data Security Standard, or PCI-DSS, as wellas certain other industry standards. Any failure to comply with these rules and/or requirements couldsignificantly harm our brand, reputation, business and results of operations. We also rely on independent serviceproviders for payment processing, including credit and debit cards. If these independent service providersbecome unwilling or unable to provide these services to us or if the cost of using these providers increases, ourbusiness could be harmed.
We are, and may increasingly become, subject to other various laws, directives, industry standards andregulations, as well as contractual obligations, relating to data privacy and security in the jurisdictions in whichwe operate. The information, security and privacy requirements imposed by governmental regulation areincreasingly demanding. In the United States, various federal and state regulators, including governmentalagencies like the Consumer Financial Protection Bureau and the Federal Trade Commission, have adopted, or areconsidering adopting, laws and regulations concerning personal information and data security and haveprioritized privacy and information security violations for enforcement actions. Certain state laws may be morestringent or broader in scope, or offer greater individual rights, with respect to personal information than federal,international or other state laws, and such laws may differ from each other, all of which may complicatecompliance efforts For example, the State of California enacted the California Consumer Privacy Act (the“CCPA”), which became effective January 2020 and requires companies that process information on Californiaconsumers to, among other things, provide new disclosures and options to consumers about data collection, useand sharing practices. The CCPA provides for civil penalties for violations, as well as a private right of action forcertain data breaches that result in the loss of personal information. Furthermore, in November 2020, Californiavoters passed the California Privacy Rights Act of 2020 (“CPRA”). Effective beginning January 1, 2023, theCPRA imposes additional obligations on companies covered by the legislation and will significantly modify theCCPA, including by expanding California residents’ rights with respect to certain sensitive personal information.The CPRA also creates a new state agency that will be vested with authority to implement and enforce the CCPAand CPRA. Additionally, on March 2, 2021, the Virginia Consumer Data Protection Act (“CDPA”) was signedinto law. The CDPA becomes effective beginning January 1, 2023, and contains provisions that requirebusinesses to conduct data protection assessments in certain circumstances, and that require opt-in consent fromconsumers to process certain sensitive personal information. Other states plan to pass data privacy laws that aresimilar to the CCPA, CPRA and CDPA, further complicating the legal landscape. In addition, laws in all 50states require businesses to provide notice to consumers whose personal information has been accessed oracquired as a result of a data breach (and, in some cases, to regulators). State laws are changing rapidly and thereis discussion in Congress of a new comprehensive federal data privacy law to which we would become subject ifit is enacted, which may add additional complexity, variation in requirements, restrictions and potential legalrisks, require additional investment of resources in compliance programs, impact strategies and the availability ofpreviously useful data and could result in increased compliance costs or changes in business practices andpolicies.
40

We are also subject to international laws, regulations and standards in many jurisdictions, which applybroadly to the collection, use, retention, security, disclosure, transfer and other processing of personalinformation. For example, the General Data Protection Regulation (“GDPR”), which was adopted by theEuropean Union effective May 2018, requires companies to meet stringent requirements regarding the handlingof personal data. In particular, the GDPR includes obligations and restrictions concerning data transparency andconsent, the overall rights of individuals to whom the personal data relates, the transfer of personal data out ofthe European Economic Area (“EEA”) or the United Kingdom, security breach notifications and the security andconfidentiality of personal data. The GDPR authorizes fines for certain violations of up to 4% of global annualrevenue or €20 million, whichever is greater. Further, the United Kingdom’s decision to leave the EuropeanUnion has created uncertainty with regard to data protection regulation in the United Kingdom. As of January 1,2021, we are also subject to the UK GDPR and UK Data Protection Act of 2018, which retains the GDPR in theUnited Kingdom’s national law. These recent developments will require us to review and amend the legalmechanisms by which we make and/or receive personal data transfers. Moreover, the GDPR confers a privateright-of-action on certain individuals and associations. Our failure to adhere to or successfully implementappropriate processes to adhere to the requirements of GDPR, CCPA and other evolving laws and regulations inthis area could expose us and our franchisees to financial penalties and legal liability. Our and our franchisees’systems may not be able to satisfy these changing requirements and guest and employee expectations, or mayrequire significant additional investments or time in order to do so.
Because the interpretation and application of laws, regulations, standards and other obligations relating todata privacy and security are still uncertain, it is possible that these laws, regulations, standards and otherobligations may be interpreted and applied in a manner that is inconsistent with our data processing practices andpolicies. If our practices are not consistent, or are viewed as not consistent, with changes in laws, regulations andstandards or new interpretations or applications of existing laws, regulations and standards, we may also becomesubject to fines, audits, inquiries, whistleblower complaints, adverse media coverage, investigations, lawsuits,loss of export privileges, severe criminal or civil sanction or other penalties. Although we endeavor to complywith our public statements and documentation, we may at times fail to do so or be alleged to have failed to do so.The publication of our privacy policies and other statements that provide promises and assurances about dataprivacy and security can subject us to potential government or legal action if they are found to be deceptive,unfair or misrepresentative of our actual practices. Any concerns about our data privacy and security practices,even if unfounded, could damage the reputation of our businesses and discourage potential users from ourproducts and services. Any of the foregoing could have an adverse effect on our business, financial condition,results of operations and prospects.
Breaches or failures of our information technology systems or other cybersecurity or data security-relatedincidents may have an adverse impact on our business, liquidity, financial condition and results of operations.
Efforts to hack or breach security measures, failures of systems or software to operate as designed orintended, viruses, operator error or inadvertent releases of data all threaten our and our franchisees’ informationsystems and records. An actual or perceived breach in the security of our information technology systems orthose of our franchisees and third-party service providers could lead to an interruption in the operation of oursystems, resulting in material adverse impacts on our business, liquidity, financial condition and results ofoperations, and could result in adverse publicity and significant damage to our brand and reputation withcustomers and third parties with whom we do business. Additionally, a significant theft, loss, disclosure,modification or misappropriation of, or access to, guests’, employees’, third parties’ or other proprietary data orother breach of our information technology systems could result in fines, legal claims or proceedings, includingregulatory investigations and actions, or liability for failure to comply with privacy and information securitylaws, which could disrupt our operations, damage our reputation and expose us to claims from guests andemployees, any of which could have a material adverse effect on our financial condition and results ofoperations.
41

The techniques and sophistication used to conduct cyber-attacks and breaches of information technologysystems, as well as the sources and targets of these attacks, may take many forms (including phishing, socialengineering, denial or degradation of service attacks, malware or ransomware), change frequently and are oftennot recognized until such attacks are launched or have been in place for a period of time. In addition, ouremployees, franchisees, contractors, or third parties with whom we do business or to whom we outsourcebusiness operations may attempt to circumvent our security measures in order to misappropriate regulated,protected, or personally identifiable information, and may purposefully or inadvertently cause a breach involvingor compromise of such information. Third parties may have the technology or know-how to breach the securityof the information collected, stored, or transmitted by us or our franchisees, and our respective security measures,as well as those of our technology vendors, may not effectively prohibit others from obtaining improper access tothis information. Advances in computer and software capabilities and encryption technology, new tools, andother developments may increase the risk of such a breach or compromise. There is no assurance that anysecurity procedures or controls that we or our third-party providers have implemented will be sufficient toprevent data-security related incidents from occurring.
We may be required to expend significant capital and other resources to protect against, respond to, andrecover from any potential, attempted or existing security breaches or failures and their consequences. As datasecurity-related threats continue to evolve, we may be required to expend significant additional resources tocontinue to modify or enhance our protective measures or to investigate and remediate any information securityvulnerabilities. We could be forced to expend significant financial and operational resources in responding to asecurity breach, including investigating and remediating any information security vulnerabilities, defendingagainst and resolving legal and regulatory claims and complying with notification obligations, all of which coulddivert resources and the attention of our management and key personnel away from our business operations andadversely affect our business, financial condition and results of operations. In addition, our remediation effortsmay not be successful and we could be unable to implement, maintain and upgrade adequate safeguards.
While we currently maintain cybersecurity insurance, such insurance may not be sufficient in type oramount to cover us against claims related to breaches, failures or other data security-related incidents, and wecannot be certain that cyber insurance will continue to be available to us on economically reasonable terms, or atall, or that any insurer will not deny coverage as to any future claim. The successful assertion of one or morelarge claims against us that exceed available insurance coverage, or the occurrence of changes in our insurancepolicies, including premium increases or the imposition of large deductible or co-insurance requirements, couldhave a material and adverse effect on our business, financial condition and results of operations. Any of theforegoing could have an adverse effect on our business, financial condition, results of operations and prospects.
Political, economic, currency and other risks associated with our international operations could adverselyaffect our and our international franchisees’ operating results.
As of April 4, 2021 and excluding Doughnut Factories, there were 1,145 Krispy Kreme shops operatedoutside of the United States and Canada, representing 67% of our total shop count. Of this total, 718 shops areowned and operated by franchisees. Our revenues from international operations and business segments areexposed to risks associated with doing business in foreign countries. Risks arising from our internationaloperations include, but are not limited to:
• differences in consumer tastes and preferences for indulgent experiences;
• recessionary or expansive trends in international markets;
• uncertainties arising from the implementation of the United Kingdom’s exit from the European Union,including any additional financial, legal, tax and trade burdens on our operations there;
• interpretation and application of laws and regulations, including tax, tariffs, labor, merchandise anti-bribery and privacy laws and regulations, including the GDPR;
42

• import or other business licensing requirements;
• the enforceability of intellectual property and contract rights;
• limitations on the repatriation of funds and foreign currency exchange restrictions due to current ornew U.S. and international regulations;
• changes in inflation rates;
• difficulty in staffing, developing and managing foreign operations and supply chain logistics, includingensuring the consistency of our product quality and service;
• local laws that make it more expensive and complex to negotiate with, retain or terminate employees;
• local regulations, health guidelines and safety protocols related to the COVID-19 pandemic;
• competition with entrenched competitors as we expand our international operations; and
• increase in anti-American sentiment and the identification of the brand as an American brand.
Royalties from our franchisees are based on a percentage of net sales (as defined in our franchiseagreements) generated by our foreign franchisees’ operations. Royalties payable to us by our internationalfranchisees are based on a conversion of local currencies to U.S. dollars using the prevailing exchange rate, andchanges in exchange rates could adversely affect our revenues. To the extent that the portion of our revenuesgenerated from international operations increases in the future, our exposure to changes in foreign political andeconomic conditions and currency fluctuations will increase.
We also are subject to governmental regulations throughout the world that impact the way we do businesswith our international franchisees and vendors. These include antitrust and tax requirements, anti-boycottregulations, import/export/customs regulations and other international trade regulations, the USA Patriot Act, theForeign Corrupt Practices Act, and applicable local law. We typically export our products, principally ourdoughnut mixes and doughnut mix concentrates, to our franchisees in markets outside the United States.Numerous government regulations apply to both the export of food products from the United States as well as theimport of food products into other countries. If one or more of the ingredients in our products are banned,alternative ingredients would need to be identified. Although we intend to be proactive in addressing any productingredient issues, such requirements may delay our ability to open shops in other countries in accordance withour desired schedule.
We are subject to franchise laws and regulations that govern our status as a franchisor and regulate someaspects of our franchise relationships. Our ability to develop new franchised shops and to enforce contractualrights against franchisees may be adversely affected by these laws and regulations, which could cause ourfranchise revenues to decline.
As a franchisor, we are subject to regulation by the Federal Trade Commission (the “FTC”) and by domesticand foreign laws regulating the offer and sale of franchises. Our failure to obtain or maintain approvals to offerfranchises would cause us to lose future franchise revenues and revenues generated through our MarketDevelopment segment. In addition, domestic or foreign laws that regulate substantive aspects of our relationshipswith franchisees may limit our ability to terminate or otherwise resolve conflicts with our franchisees.
Our international operations rely in part on our franchisees. Disputes with our franchisees, or failures by ourfranchisees to operate successfully, to develop or finance new shops or build them on suitable sites or openthem on schedule, could adversely affect our growth and our operating results.
Franchisees, which are all independent operators, primarily based in international markets and not KrispyKreme employees, contributed approximately 9.4% of our total revenues in fiscal 2020. These franchise revenuesincluded franchisee purchases of product ingredients, equipment and other supplies directly from Krispy Kreme.
43

We rely in part on these franchisees and the manner in which they operate their locations to develop and promoteour business. We occasionally have disputes with franchisees, which could materially adversely affect ourbusiness, financial condition and results of operations. We provide training and support to franchisees, but thequality of franchise shop operations may be diminished by any number of factors beyond our control and it wemay be unable to ensure proper procedures, especially with regard to ensuring the highest quality of products areoffered at our shops, will be adhered to. In addition, since most of our current franchised operations existinternationally, we may have difficulty exercising greater degrees of control than we would with our company-owned or domestic franchise shops. The failure of our franchisees to operate franchises successfully could have amaterial adverse effect on us, our reputation and our brands, and could materially adversely affect our business,financial condition and results of operations. In addition, although we do not control our franchisees and theyoperate as independent contractors, actions taken by any of our franchisees may be seen by the public as actionstaken by us, which, in turn, could adversely affect our reputation or brands.
Lack of access to financing by our franchisees on reasonable terms could adversely affect our futureoperations by limiting franchisees’ ability to open new shops or leading to additional franchisee shop closures,which would in turn reduce our Market Development segment revenue. Most development agreements specify aschedule for opening shops in the territory covered by the agreement. These schedules form the basis for ourexpectations regarding the number and timing of new Krispy Kreme shop openings. In the past, we have agreedto extend or modify development schedules for certain franchisees and may do so in the future.
Market Development segment revenues are directly related to sales by franchise shops and, accordingly, thesuccess of franchisees’ operations has a direct effect on our revenues, results of operations and cash flows.
Our franchisees could take actions that could harm our business.
Franchisees are independently owned and operated, and they are not our employees. Although we providecertain training and support to franchisees, our franchisees operate their shops as independent businesses.Consequently, the quality of franchised shop operations may be diminished by any number of factors beyond ourcontrol. Moreover, franchisees may not operate shops in a manner consistent with applicable laws andregulations or in accordance with our standards and requirements. Also, franchisees may not successfully hireand train qualified managers and other shop personnel. Although we believe we currently generally enjoy apositive relationship with our franchisees, there is no assurance that future developments, some of which may beoutside our control, may significantly harm our future relationships with existing and new franchisees. Inaddition, our image and reputation, and the image and reputation of other franchisees, may suffer materially ifour franchisees do not operate successfully, or in accordance with our standards and requirements, which couldresult in a significant decline in Krispy Kreme’s branded sales, our revenues and our profitability.
Recent healthcare legislation and other potential employment legislation could adversely affect our business.
Federal legislation regarding government-mandated health benefits and potential minimum wage legislationis expected to increase our and our domestic franchisees’ costs. In the past several years states have increasedtheir minimum wages and there is mounting pressure to increase minimum wage on a federal level as well. Inaddition, for those of our employees paid at rates set above, but related to, the applicable minimum wage, furtherincreases in the minimum wage could increase our labor costs, which may also be increased by inflationarypressures and any shortages in the labor market.
Various federal and state labor laws govern our relationships with our employees and affect operating costs.These laws include employee classifications as exempt or non-exempt, minimum wage requirements,unemployment tax rates, workers’ compensation rates, overtime, family leave, safety standards, payroll taxes,citizenship requirements and other wage and benefit requirements for employees classified as non-exempt. It isdifficult to predict the overall trend of government regulation, and we may be subject to significant and sweepingchange or reforms arising out of legislative initiatives surrounding labor laws, healthcare laws or other laws
44

affecting our labor costs. Significant additional government regulations could impose increased compliance costson us and we may be subject to litigation arising out of noncompliance with such regulations. Such risks,combined with other increases in our labor costs, could materially and adversely affect our business, financialcondition and operating results.
Risks Related to Our Organizational Structure
After the completion of this offering and the Distribution, JAB will control through its affiliates a significantamount of the voting power of the shares of our common stock eligible to vote in the election of our directorsand on other matters submitted to a vote of our stockholders, and JAB’s interests may conflict with ours oryours in the future.
Immediately following this offering and the Distribution, JAB will beneficially own approximately 38.6%of our common stock through its affiliates (or approximately 37.7% if the underwriters exercise their option topurchase additional shares of common stock in full), prior to giving effect to any purchase by JAB of shares inthis offering, and consequently will hold significant influence over the election of our directors and other matterssubmitted to a vote of our stockholders. For so long as JAB continues to beneficially own a significantpercentage of our common stock through its affiliates, JAB will be able to influence the composition of our boardof directors and the approval of actions requiring stockholder approval in ways that may conflict with theinterests of us or our other stockholders. Accordingly, for such period of time, JAB will have significantinfluence with respect to our management, business plans, and policies, including the appointment and removalof our officers. In particular, JAB may be able to cause or prevent a change of control of us or a change incomposition of our board of directors and could preclude any unsolicited acquisition of us. The concentration ofvoting power could deprive you of an opportunity to receive a premium for your shares of common stock as partof the sale of us and ultimately might affect the market price of our common stock.
If the ownership of our common stock continues to be highly concentrated, it may prevent you and otherminority stockholders from influencing significant corporate decisions and may result in conflicts of interest.
Immediately following the completion of this offering and the Distribution, JAB will beneficially ownapproximately 38.6% of our common stock through its affiliates (or approximately 37.7% if the underwritersexercise their option to purchase additional shares of common stock in full), prior to giving effect to anypurchase by JAB of shares in this offering. As a result, JAB will exercise significant influence over all mattersrequiring a stockholder vote, including: the election of directors; mergers, consolidations and acquisitions; thesale of all or substantially all of our assets and other decisions affecting our capital structure; the amendment ofour amended and restated certificate of incorporation and our amended and restated bylaws; and our winding upand dissolution. This concentration of ownership may delay, deter or prevent acts that would be favored by ourother stockholders. The interests of JAB may not always coincide with our interests or the interests of our otherstockholders. This concentration of ownership may also have the effect of delaying, preventing or deterring achange in control of us. Also, JAB may seek to cause us to take courses of action that, in its judgment, couldenhance its investment in us, but which might involve risks to our other stockholders or adversely affect us or ourother stockholders, including investors in this offering. As a result, the market price of our common stock coulddecline or stockholders might not receive a premium over the then-current market price of our common stockupon a change in control. In addition, this concentration of share ownership may adversely affect the tradingprice of our common stock because investors may perceive disadvantages in owning shares in a company withsignificant stockholders. See “Principal Stockholders” and “Description of Capital Stock – Anti-Takeover Effectsof Delaware Law and Our Organizational Documents.”
Certain provisions of Delaware Law and our amended and restated certificate of incorporation and ouramended and restated bylaws could hinder, delay or prevent a change in control of us, which could adverselyaffect the price of our common stock.
Certain provisions of Delaware Law, our amended and restated certificate of incorporation and our amendedand restated bylaws will contain provisions that could make it more difficult for a third-party to acquire us
45
without the consent of our board of directors or JAB, as the beneficial owner of a significant amount of ourcommon stock.
As a Delaware corporation, we are subject to provisions of Delaware law, including Section 203 of theDelaware General Corporation Law, as amended (the “DGCL”), which prevents some stockholders holding morethan 15% of our outstanding common stock from engaging in certain business combinations without approval ofthe holders of substantially all of our outstanding common stock.
Furthermore, immediately following this offering, JAB will control a significant amount of the voting powerof the shares of our common stock eligible to vote in the election of our directors and on other matters submittedto a vote of our stockholders through its affiliate, and JAB may be able to control the outcome of matterssubmitted to a stockholder vote.
In addition, under our amended and restated certificate of incorporation, our board of directors will have theauthority to cause the issuance of preferred stock from time to time in one or more series and to establish theterms, preferences and rights of any such series of preferred stock, all without approval of our stockholders.Nothing in our amended and restated certificate of incorporation will preclude future issuances withoutstockholder approval of the authorized but unissued shares of our common stock. These factors could have theeffect of making the replacement of incumbent directors more time consuming and difficult.
These provisions may make it difficult and expensive for a third party to pursue a tender offer, change incontrol or takeover attempt that is opposed by JAB, our management or our board of directors. Publicstockholders who might desire to participate in these types of transactions may not have an opportunity to do so,even if the transaction is favorable to stockholders. These anti-takeover provisions could substantially impede theability of public stockholders to benefit from a change in control or change our management and board ofdirectors and, as a result, may adversely affect the market price of our common stock and your ability to realizeany potential change of control premium. See “Description of Capital Stock – Anti-Takeover Effects of DelawareLaw and Our Organizational Documents.”
Risks Related to Our Intellectual Property
Our failure or inability to obtain, maintain, protect and enforce our trademarks, service marks and otherintellectual property rights could adversely affect our business, including the value of our brands.
We own certain common-law trademark rights in the United States, as well as numerous trademark andservice mark registrations in the United States and in other jurisdictions. We believe that our trademarks andother intellectual property rights are important to our success and our competitive position. Despite our efforts toobtain, maintain, protect and enforce our trademarks, service marks and other intellectual property rights, therecan be no assurance that these protections will be available in all cases, and our trademarks, service marks orother intellectual property rights could be challenged, invalidated, declared generic, circumvented, infringed orotherwise violated. For example, competitors may adopt service names similar to ours, or purchase ourtrademarks and confusingly similar terms as keywords in Internet search engine advertising programs, therebyimpeding our ability to build brand identity and possibly leading to confusion in the marketplace. The value ofour intellectual property could also diminish if others assert rights in or ownership of our trademarks, servicemarks and other intellectual property rights, or trademarks or service marks that are similar to ours. We may beunable to successfully resolve these types of conflicts to our satisfaction. In some cases, there may be trademarkor service mark owners who have prior rights to our trademarks and service marks or to similar trademarks andservice marks. In addition, there could be potential trade name, service mark or trademark infringement claimsbrought by owners of other registered trademarks or service marks, or trademarks or service marks thatincorporate variations of our trademarks or service marks. During trademark and service mark registrationproceedings, we may receive rejections of our applications by the United States Patent and Trademark Office orin other foreign jurisdictions. Additionally, opposition or cancellation proceedings may in the future be filed
46

against our trademark or service mark applications and registrations, and our trademarks and service marks maynot survive such proceedings. While we may be able to continue the use of our trademarks and service marks inthe event registration is not available, particularly in the United States, where such rights are acquired based onuse and not registration, third parties may be able to enjoin the continued use of our trademarks or service marksif such parties are able to successfully claim infringement in court. In the event that our trademarks or servicemarks are successfully challenged, we could be forced to rebrand our products, which could result in loss ofbrand recognition and could require us to devote resources towards advertising and marketing new brands. Overthe long term, if we are unable to establish name recognition based on our trademarks and service marks, then wemay not be able to compete effectively. Any claims or customer confusion related to our trademarks and servicemarks could damage our reputation and brand and substantially harm our business, liquidity, financial conditionand results of operations.
We may be required to protect our trademarks, service marks and other intellectual property rights in anincreasing number of jurisdictions, a process that is expensive and may not be successful, or which we may notpursue in every location. The laws of some foreign countries do not protect intellectual property rights to the sameextent as the laws of the United States. Accordingly, we may choose not to seek protection in certain countries, andwe will not have the benefit of protection in such countries. Moreover, any changes in, or unexpected interpretationsof, intellectual property laws in any jurisdiction may compromise our ability to obtain, maintain, protect and enforceour intellectual property rights. We have a system in place that is designed to detect potential infringement on ourtrademarks and service marks. The protective actions that we take, however, may not be sufficient, in somejurisdictions, to secure our trademark and service mark rights for some of the goods and services that we offer or toprevent imitation by others, which could adversely affect the value of our trademarks and service marks or cause usto incur litigation costs, or pay damages or licensing fees to a prior user or registrant of similar intellectual property.Moreover, policing our intellectual property rights is difficult, costly and may not always be effective.
We may become involved in lawsuits to protect or enforce our intellectual property rights, which could beexpensive, time consuming and unsuccessful.
From time to time, legal action by us may be necessary to enforce or protect our intellectual property rights,including our trade secrets, to determine the validity and scope of the intellectual property rights of others or todefend against claims of infringement, misappropriation, other violation or invalidity. Even if we are successfulin defending our claims, litigation could result in substantial costs and diversion of resources and couldnegatively affect our business, reputation, results of operations and financial condition. To the extent that weseek to enforce our rights, we could be subject to claims that an intellectual property right is invalid, otherwisenot enforceable, or is licensed to or not infringed or otherwise violated by the party against whom we arepursuing a claim. In addition, our assertion of intellectual property rights may result in the other party seeking toassert alleged intellectual property rights or assert other claims against us, which could harm our business. If weare not successful in defending such claims in litigation, we may not be able to use, sell or license a particularproduct or offering due to an injunction, or we may have to pay damages that could, in turn, harm our results ofoperations. In addition, governments may adopt regulations, or courts may render decisions, requiringcompulsory licensing of intellectual property to others, or governments may require that products meet specifiedstandards that serve to favor local companies. Our inability to enforce our intellectual property rights under thesecircumstances may harm our competitive position and our business.
Our commercial success depends on our ability to operate our business without infringing, misappropriatingor otherwise violating the intellectual property or proprietary rights of third parties. Intellectual property disputescan be costly to defend and may cause our business, operating results and financial condition to suffer. Whethermerited or not, we have faced, and may in the future face, allegations that we or parties indemnified by us, or ouror their respective products or services, have infringed, misappropriated or otherwise violated the trademarks,patents, copyrights, trade secrets or other intellectual property rights of third parties. Some third parties may beable to sustain the costs of complex litigation more effectively than we can because they have substantiallygreater resources. We may not be able to successfully settle or otherwise resolve such adversarial proceedings or
47
litigation. If we are unable to successfully settle future claims on terms acceptable to us, we may be required toengage in or to continue claims, regardless of whether such claims have merit, which can be time-consuming,divert management’s attention and financial resources and be costly to evaluate and defend. Results of any suchlitigation are difficult to predict and may require us to stop commercializing products, obtain licenses or modifyour products or trademarks while we develop non-infringing substitutes. Otherwise, we may incur substantialdamages or settlement costs, or face a temporary or permanent injunction prohibiting us from marketing orproviding the affected products. If we require a third-party license, it may not be available on reasonable terms orat all. We may also have to redesign our products and trademarks so they do not infringe, misappropriate orotherwise violate third-party intellectual property rights, which may not be possible or may require substantialmonetary expenditures and time.
Loss of our trade secret recipes could adversely affect our sales.
We derive significant competitive benefit from the fact that our doughnut recipes and formulations are tradesecrets. Although we take reasonable steps to safeguard our trade secrets, should they become known to competitors,our competitive position could suffer substantially. Furthermore, trade secrets can be difficult to protect. We seek toprotect our trade secrets and other know-how, in part, by entering into non-disclosure and confidentiality agreementswith parties who have access to them, such as our employees, corporate collaborators, outside contractors, consultants,advisors and other third parties. We cannot guarantee that we have entered into such agreements with each party thatmay have or have had access to our trade secrets or proprietary information, including our recipes and formulations.Despite these efforts, any of these parties may breach the agreements and disclose our proprietary information,including our trade secrets, and we may not be able to obtain adequate remedies for such breaches. Enforcing a claimthat a party illegally disclosed or misappropriated a trade secret is difficult, expensive, and time-consuming, and theoutcome is unpredictable. Some courts inside and outside the United States are less willing or unwilling to protect tradesecrets. In addition, others may independently discover our trade secrets and confidential information, and in suchcases, we could not assert any trade secret rights against such parties.
Although we try to ensure that our employees, consultants, advisors and independent contractors do not usethe confidential or proprietary information, trade secrets or know-how of others in their work for us, we may besubject to claims that we or these individuals have, inadvertently or otherwise, improperly used or disclosedintellectual property rights, confidential or proprietary information, trade secrets or know-how of any suchindividual’s current or former employer or other third party. Further, we may be subject to ownership disputes inthe future arising, for example, from conflicting obligations of consultants or others who are involved indeveloping our products. We may also be subject to claims that former employees, consultants, independentcontractors or other third parties have an ownership interest in our intellectual property rights. Litigation may benecessary to defend against these claims. If we fail in defending any such claims, in addition to paying monetarydamages, we may lose valuable intellectual property rights or personnel. Even if we are successful in defendingagainst such claims, litigation could result in substantial costs and be a distraction to management.
In addition, we cannot guarantee that we have entered into invention assignment agreements with each partythat may have developed intellectual property rights for us. Individuals not subject to invention assignmentagreements may make adverse ownership claims to our current and future intellectual property rights. Theassignment of intellectual property rights may not be self-executing, or the assignment agreements may beinsufficient or breached, and we may not be able to obtain adequate remedies for such breaches. We may beforced to bring claims against third parties, or defend claims that they may bring against us, to determine theownership of what we regard as our intellectual property rights. Additionally, to the extent that our employees,independent contractors or other third parties with whom we do business use intellectual property rights ownedby others in their work for us, disputes may arise as to the rights in related or resulting know-how and inventions.Any of the foregoing could have a material adverse effect on our competitive position, business, financialcondition and results of operations.
48

Our reliance on third parties, including our franchisees and other licensees, may negatively impact our abilityto protect our intellectual property.
Although we monitor and restrict third-party activities through our partnership and license agreements, thirdparties, including our franchisees and other licensees, may use, refer to, or make statements about our brands thatdo not make proper use of our trademarks, service marks or required designations, that improperly altertrademarks, service marks or branding, or that are critical of our brands or place our brands in a context that maytarnish their reputation. This may result in dilution or tarnishment of our intellectual property. It is not possiblefor us to obtain registrations for all possible variations of our branding in all territories where we operate. Thirdparties may seek to register or obtain registration for domain names and trademarks involving localizations,variations, and versions of certain branding tools, and these activities may limit our ability to obtain or use suchrights in such territories. Franchisee, licensee and other third-party noncompliance with the terms and conditionsof our partnership or license agreements may reduce the overall goodwill of our brands, whether through thefailure to meet health and safety standards (including with respect to additional sanitation protocols andguidelines in connection with the COVID-19 pandemic), engage in quality control or maintain productconsistency, or through the participation in improper or objectionable business practices.
Moreover, unauthorized third parties may conduct business using our intellectual property to take advantageof the goodwill of our brands, resulting in consumer confusion or dilution. Any reduction of our goodwill,consumer confusion, or dilution is likely to impact sales, and could materially and adversely impact our businessand operating results.
Risks Related to this Offering and Our Common Stock
An active trading market for our common stock may never develop or be sustained.
Prior to this offering, there has been no public market for our common stock. Although we intend to apply tohave our common stock approved for listing on Nasdaq, an active trading market for our common stock may notdevelop on that exchange or elsewhere or, if developed, that market may not be sustained. Accordingly, if anactive trading market for our common stock does not develop or is not maintained, the liquidity of our commonstock, your ability to sell your shares of common stock when desired and the prices that you may obtain for yourshares of common stock will be adversely affected. Additionally, upon the completion of this offering and theDistribution, JAB will beneficially own approximately 38.6% of our common stock through its affiliates (orapproximately 37.7% if the underwriters exercise their option to purchase additional shares of common stock infull), prior to giving effect to any purchase by JAB of shares in this offering, which may inhibit the developmentand maintenance of an active trading market. An inactive trading market may also impair our ability to raisecapital to continue to fund operations by selling shares and may impair our ability to acquire other companies ortechnologies by using our shares as consideration.
JAB and Olivier Goudet have indicated an interest in purchasing between $50 million and $100 million, and$5 million, respectively, of shares of common stock in this offering at a price equal to the price paid by thepublic, less the underwriting discount. Because this indication of interest is not a binding agreement orcommitment to purchase, JAB and Mr. Goudet could determine to purchase more, less or no shares in thisoffering or the underwriters could determine to sell more, less or no shares to JAB and Mr. Goudet. If JAB and/orMr. Goudet are allocated all or a portion of the shares in which they have indicated an interest in this offering ormore, and purchase any such shares, such purchase could reduce the available public float for our shares if suchentities hold these shares long term. Moreover, any shares purchased by JAB or Mr. Goudet will be subject toa180-day lock-up restriction.
The market price and trading volume of our common stock may be volatile, which could result in rapid andsubstantial losses for our stockholders.
Even if an active trading market develops, the market price of our common stock may be highly volatile andcould be subject to wide fluctuations. In addition, the trading volume in our common stock may fluctuate andcause significant price variations to occur. The initial public offering price of our common stock will be
49

determined by negotiation between us and the representatives of the underwriters based on a number of factorsand may not be indicative of prices that will prevail in the open market following the completion of this offering.If the market price of our common stock declines significantly, you may be unable to resell your shares at orabove your purchase price, if at all. The market price of our common stock may fluctuate or decline significantlyin the future. Some of the factors that could negatively affect our share price or result in fluctuations in the priceor trading volume of our common stock include:
• variations in our quarterly operating results or our operating results failing to meet the expectations ofsecurities analysts or investors in a particular period;
• changes in our earnings estimates (if provided) or differences between our actual financial andoperating results and those expected by investors and analysts;
• the contents of published research reports about us or our industry or the failure of securities analysts tocover our common stock after this offering;
• additions to, or departures of, key management personnel;
• any increased indebtedness we may incur in the future;
• announcements or actions taken by JAB as our principal stockholder;
• actions by institutional stockholders;
• litigation and governmental investigations;
• operating and stock performance of other companies that investors deem comparable to us (andchanges in their market valuations) and overall performance of the equity markets;
• speculation or reports by the press or investment community with respect to us or our industry ingeneral;
• increases in market interest rates that may lead purchasers of our shares to demand a higher yield;
• announcements by us or our competitors of significant contracts, acquisitions, dispositions, strategicrelationships, joint ventures or capital commitments;
• sales of substantial amounts of our common stock by JAB or other significant stockholders or ourinsiders, or the expectation that such sales might occur;
• volatility or economic downturns in the markets in which we, our franchisees and our customers arelocated caused by pandemics, including the COVID-19 pandemic, and related policies and restrictionsundertaken to contain the spread of such pandemics or potential pandemics; and
• general market, political and economic conditions, in the insurance industry in particular, including anysuch conditions and local conditions in the markets in which any of our customers are located.
These broad market and industry factors may decrease the market price of our common stock, regardless ofour actual operating performance. The stock market in general has from time to time experienced extreme priceand volume fluctuations, including in recent months. In addition, in the past, following periods of volatility in theoverall market and the market price of a company’s securities, securities class action litigation has often beeninstituted against these companies. This litigation, if instituted against us, could result in substantial costs and adiversion of our management’s attention and resources.
Future offerings of debt or equity securities by us may materially adversely affect the market price of ourcommon stock.
In the future, we may attempt to obtain financing or to further increase our capital resources by issuingadditional shares of our common stock or offering debt or other equity securities, including senior orsubordinated notes, debt securities convertible into equity or shares of preferred stock. In addition, we may seek
50

to expand operations in the future to other markets which we would expect to finance through a combination ofadditional issuances of equity, corporate indebtedness and/or cash from operations.
Issuing additional shares of our common stock or other equity securities or securities convertible into equitymay dilute the economic and voting rights of our existing stockholders or reduce the market price of our commonstock or both. Upon liquidation, holders of such debt securities and preferred shares, if issued, and lenders withrespect to other borrowings would receive a distribution of our available assets prior to the holders of ourcommon stock. Debt securities convertible into equity could be subject to adjustments in the conversion ratiopursuant to which certain events may increase the number of equity securities issuable upon conversion.Preferred shares, if issued, could have a preference with respect to liquidating distributions or a preference withrespect to dividend payments that could limit our ability to pay dividends to the holders of our common stock.Our decision to issue securities in any future offering will depend on market conditions and other factors beyondour control, which may adversely affect the amount, timing or nature of our future offerings. Thus, holders of ourcommon stock bear the risk that our future offerings may reduce the market price of our common stock anddilute their stockholdings in us. See “Description of Capital Stock.”
The market price of our common stock could be negatively affected by sales of substantial amounts of ourcommon stock in the public markets.
After this offering and the share repurchase, there will be 160,890,354 shares of common stock outstanding(or 164,890,354 shares outstanding if the underwriters exercise their option to purchase additional shares ofcommon stock in full). Of our issued and outstanding shares, only the 26,666,667 shares of common stock sold inthis offering (or 30,666,667 shares if the underwriters exercise the option to purchase additional shares ofcommon stock in full) will be freely transferable, except for any shares held by our “affiliates,” as that term isdefined in Rule 144 (“Rule 144”) under the Securities Act. Following the completion of this offering and theDistribution, approximately 38.6% of our outstanding common stock (or 37.7% if the underwriters exercise theiroption to purchase additional shares of common stock in full) will be held by an affiliate of JAB and can beresold into the public markets in the future in accordance with the requirements of Rule 144, subject to thelock-up agreements described below. The sale by JAB’s affiliate of a substantial number of shares after thisoffering, or a perception that such sales could occur, could significantly reduce the market price of our commonstock. See “Shares Eligible For Future Sale.”
We and our executive officers and directors and substantially all of our stockholders, including JAB, haveagreed with the underwriters that, subject to certain exceptions, for a period of 180 days after the date of thisprospectus, we and they will not directly or indirectly offer, pledge, sell, contract to sell, sell any option orcontract to purchase or otherwise dispose of any common stock or any securities convertible into or exercisableor exchangeable for common stock, or in any manner transfer all or a portion of the economic consequencesassociated with the ownership of common stock, or cause a registration statement covering any common stock tobe filed, without the prior written consent of J.P. Morgan Securities LLC and Morgan Stanley & Co. LLC. J.P.Morgan Securities LLC and Morgan Stanley & Co. LLC, in their sole discretion, may release the securitiessubject to any of the lock-up agreements with the underwriters described above, in whole or in part at any time.See “Underwriting (Conflicts of Interest).”
In addition, following the completion of this offering, we will have the Investors’ Rights Agreement withJAB, that will provide for registration rights beneficially owned by JAB and such holders following this offeringwith respect to shares of our common stock. Substantial sales of such shares could significantly reduce themarket price of our common stock. See “Certain Relationships and Related Party Transactions – Investors’Rights Agreement.”
The market price of our common stock may decline significantly when the restrictions on resale by ourexisting stockholders lapse. A decline in the price of our common stock might impede our ability to raise capitalthrough the issuance of additional common stock or other equity securities.
51

The future issuance of additional common stock in connection with our incentive plans or otherwise willdilute all other stockholdings.
After this offering, assuming the underwriters exercise their option to purchase additional shares of commonstock in full, we will have an aggregate of 127,869,580 shares of common stock authorized but unissued and notreserved for issuance under our incentive plans. We may issue all of these shares of common stock without anyaction or approval by our stockholders, subject to certain exceptions. Any common stock issued in connectionwith our incentive plans, the exercise of outstanding stock options or otherwise would dilute the percentageownership held by the investors who purchase common stock in this offering.
Investors in this offering will suffer immediate and substantial dilution.
The initial public offering price of our common stock will be substantially higher than the as adjusted nettangible book value per share issued and outstanding immediately after this offering. Therefore, if you purchaseshares of our common stock in this offering, you will experience immediate and substantial dilution of $27.03 inthe net tangible book value per share, based upon the initial public offering price of $22.50 per share (themidpoint of the estimated initial public offering price range set forth on the cover of this prospectus).
We will have broad discretion in the use of a significant part of the net proceeds from this offering and maynot use them effectively.
Our management currently intends to use the net proceeds from this offering in the manner described in“Use of Proceeds” and will have broad discretion in the application of a significant part of the net proceeds fromthis offering. The failure by our management to apply these funds effectively could affect our ability to operateand grow our business.
We may be unable to pay dividends on our common stock.
Following the closing of this offering, we intend to pay cash dividends on our common stock on a quarterlybasis, subject to the discretion of our board of directors and our compliance with applicable law, and dependingon our results of operations, capital requirements, financial condition, business prospects, contractual restrictions,restrictions imposed by applicable laws and other factors that our board of directors deems relevant. See“Dividend Policy.”
Our ability to pay dividends may also be restricted by the terms of our existing debt agreements, or anyfuture debt or preferred equity securities. Our dividend policy entails certain risks and limitations, particularlywith respect to our liquidity. By paying cash dividends rather than investing that cash in our business or repayingany outstanding debt, we risk, among other things, slowing the expansion of our business, having insufficientcash to fund our operations or make capital expenditures or limiting our ability to incur borrowings. Our board ofdirectors will periodically review the cash generated from our business and the capital expenditures required tofinance our growth plans and determine whether to modify the amount of regular dividends and/or declare anyperiodic special dividends. There can be no assurance that our board of directors will not adjust the amount ortiming of regular cash dividends or cause us to cease paying dividends altogether.
In addition, we are a holding company and do not have any material assets or operations other thanownership of equity interests of our subsidiaries. Our operations are conducted almost entirely through oursubsidiaries, and our ability to generate cash to meet our obligations or to pay dividends, if any, is highlydependent on the earnings of, and receipt of funds from, our subsidiaries through dividends or intercompanyloans. An inability of our subsidiaries to generate sufficient cash flow from operations may prevent us frommaking dividends on our common stock.
52

General Risks
The London Interbank Offered Rate calculation method may change and LIBOR is expected to be phased outafter 2021.
Interest on our 2019 Facility (as defined below), which is scheduled to mature in 2029, may be calculatedbased on the London Interbank Offered Rate (LIBOR). On July 27, 2017, the U.K.’s Financial ConductAuthority (the authority that administers LIBOR) announced that it intends to phase out LIBOR by the end of2023. It is unclear whether new methods of calculating LIBOR will be established such that it continues to existafter 2021, or if alternative rates or benchmarks will be adopted. Changes in the method of calculating LIBOR, orthe replacement of LIBOR with an alternative rate or benchmark, may adversely affect interest rates and result inhigher borrowing costs. This could materially and adversely affect our results of operations, cash flows, andliquidity. We cannot predict the effect of the potential changes to LIBOR or the establishment and use ofalternative rates or benchmarks. We may need to renegotiate our credit facility or incur other indebtedness, andchanges in the method of calculating LIBOR, or the use of an alternative rate or benchmark, may negativelyimpact the terms of such renegotiated credit facility or such other indebtedness. If changes are made to themethod of calculating LIBOR or LIBOR ceases to exist, we may need to amend certain contracts and cannotpredict what alternative rate or benchmark would be negotiated. This may result in an increase to our interestexpense.
If tax laws change or we experience adverse outcomes resulting from examination of our income tax returns,it could adversely affect our results of operations.
We are subject to federal, state and local income taxes in the United States and in foreign jurisdictions. Ourfuture effective tax rates and the value of our deferred tax assets could be adversely affected by changes in taxlaws, including impacts of the Tax Cuts and Jobs Act of Public Law No. 115-97 and the Coronavirus Aid, Relief,and Economic Security Act (“CARES Act”), the consequences of which have not yet been fully determined. Anumber of the jurisdictions we currently operate in, including the United States, as well as a number of othercountries and organizations such as the Organization for Economic Co-operation and Development, are activelyconsidering changes to existing tax laws that, if enacted, could increase our tax obligations in countries where wedo business or require us to change the manner in which we operate our business.
In addition, we are subject to the examination of our income tax returns by the Internal Revenue Service(“IRS”) and other tax authorities. Tax authorities are increasingly scrutinizing the tax positions of companies. Weregularly assess the likelihood of adverse outcomes resulting from such examinations to determine the adequacyof our provision for income taxes. Significant judgment is required in determining our worldwide provision forincome taxes. Although we believe we have made appropriate provisions for taxes in the jurisdictions in whichwe operate, changes in the tax laws or challenges from tax authorities under existing tax laws could adverselyaffect our business, financial condition and results of operations.
Our annual effective income tax rate can change materially as a result of changes in our geographic mix ofU.S. and foreign earnings and other factors, including changes in tax laws and changes made by regulatoryauthorities.
Our overall effective income tax rate is equal to our total tax expense as a percentage of total earningsbefore tax. However, income tax expense and benefits are not recognized on a global basis but rather on ajurisdictional or legal entity basis. Losses in one jurisdiction may not be used to offset profits in otherjurisdictions and may cause an increase in our tax rate. Changes in the mix of earnings (or losses) betweenjurisdictions and assumptions used in the calculation of income taxes, among other factors, could have asignificant effect on our overall effective income tax rate. Additionally, changes in tax laws and changes made byregulatory authorities could have a significant effect on our overall effective income tax rate.
53

The full realization of our deferred tax assets may be affected by a number of factors, including futureearnings and the feasibility of on-going planning strategies.
We have deferred tax assets including federal, state and foreign net operating loss carryforwards, accrualsnot yet deductible for tax purposes, tax credits and other items. We have established valuation allowances toreduce the deferred tax assets related to U.S. federal tax credits, foreign and state and local net operating losscarryforwards, as well as foreign capital loss carryforwards to an amount that is more likely than not to berealized. Our ability to utilize the deferred tax assets depends in part upon our ability to generate future taxableincome within each respective jurisdiction during the periods in which these temporary differences reverse or ourability to carryback any losses created by the deduction of these temporary differences.
Due to legal or regulatory changes, such as suspensions on the use of deferred tax assets and tax credits bycertain jurisdictions, possibly with retroactive effect, our existing deferred tax assets and tax credits could expireor otherwise be unavailable to offset future income tax liabilities. For example, California temporarily suspendedthe use of certain net operating losses and tax credits to offset revenue losses associated with the COVID-19pandemic. Other jurisdictions could also impose limitations on the use of certain deferred tax assets and taxcredits.
We expect to realize the deferred tax assets over an extended period. If we are unable to generate sufficientfuture taxable income in the United States and/or certain foreign jurisdictions, or if there is a significant changein the time period within which the underlying temporary differences become taxable or deductible, we could berequired to increase our valuation allowances against our deferred tax assets. Our effective tax rate wouldincrease if we were required to increase our valuation allowances against our deferred tax assets.
If securities or industry analysts do not publish research or reports about our business or publish negativereports, our stock price could decline.
The trading market for our common stock will be influenced by the research and reports that industry orsecurities analysts publish about us or our business. If one of more of these analysts ceases coverage of ourcompany or fails to publish reports on us regularly, we could lose visibility in the financial markets, which inturn could cause our stock price or trading volume to decline. Moreover, if one or more of the analysts who coverour company downgrades our common stock or if our reporting results do not meet their expectations, our stockprice could decline.
Our amended and restated bylaws will contain exclusive forum provisions for certain claims, which couldlimit our stockholders’ ability to obtain a favorable judicial forum for disputes with us or our directors,officers or employees.
Our amended and restated bylaws, to the fullest extent permitted by law, will provide that, unless weconsent in writing to the selection of an alternative forum, the Court of Chancery of the State of Delaware will bethe sole and exclusive forum for (i) any derivative action or proceeding brought on behalf of us; (ii) any actionasserting a claim of breach of a duty (including any fiduciary duty) owed by any of our current or formerdirectors, officers, stockholders, employees or agents to us or our stockholders; (iii) any action asserting a claimagainst us or any of our current or former directors, officers, stockholders, employees or agents arising out of orrelating to any provision of the DGCL or our amended and restated certificate of incorporation or our amendedand restated bylaws; or (iv) any action asserting a claim against us or any of our current or former directors,officers, stockholders, employees or agents governed by the internal affairs doctrine of the State of Delaware. Asdescribed below, this provision will not apply to suits brought to enforce any duty or liability created by theSecurities Act or Securities Exchange Act of 1934 (the “Exchange Act”), or rules and regulations thereunder.
Section 22 of the Securities Act creates concurrent jurisdiction for federal and state courts over all claimsbrought to enforce any duty or liability created by the Securities Act or the rules and regulations thereunder andour amended and restated bylaws will provide that the federal district courts of the United States of America will,to the fullest extent permitted by law, be the sole and exclusive forum for resolving any complaint asserting a
54

cause of action arising under the Securities Act. Our decision to adopt such a federal forum provision followed adecision by the Supreme Court of the State of Delaware holding that such provisions are facially valid underDelaware law. While there can be no assurance that federal or state courts will follow the holding of theDelaware Supreme Court or determine that our federal forum provision should be enforced in a particular case,application of our federal forum provision means that suits brought by our stockholders to enforce any duty orliability created by the Securities Act must be brought in federal court and cannot be brought in state court.
Section 27 of the Exchange Act creates exclusive federal jurisdiction over all claims brought to enforce anyduty or liability created by the Exchange Act or the rules and regulations thereunder and our amended andrestated bylaws will provide that the exclusive forum provision does not apply to suits brought to enforce anyduty or liability created by the Exchange Act. Accordingly, actions by our stockholders to enforce any duty orliability created by the Exchange Act or the rules and regulations thereunder must be brought in federal court.Our stockholders will not be deemed to have waived our compliance with the federal securities laws and theregulations promulgated thereunder.
Any person or entity purchasing or otherwise acquiring or holding any interest in any of our securities shallbe deemed to have notice of and consented to our exclusive forum provisions, including the federal forumprovision; provided, however, that stockholders will not be deemed to have waived our compliance with thefederal securities laws and the rules and regulations thereunder. Additionally, our stockholders cannot waivecompliance with the federal securities laws and the rules and regulations thereunder. These provisions may limitour stockholders’ ability to bring a claim in a judicial forum they find favorable for disputes with us or ourdirectors, officers or other employees, which may discourage lawsuits against us and our directors, officers andother employees and agents. Alternatively, if a court were to find the choice of forum provision contained in ouramended and restated bylaws to be inapplicable or unenforceable in an action, we may incur additional costsassociated with resolving such action in other jurisdictions, which could harm our business, operating results andfinancial condition.
We will incur increased costs as a result of operating as a public company, and our management will berequired to devote substantial time to new compliance initiatives and corporate governance practices. We mayfail to comply with the rules that apply to public companies, including Section 404 of the Sarbanes-Oxley Act,which could result in sanctions or other penalties that would harm our business.
As a public company, we will incur significant legal, accounting, and other expenses that we did not incur asa private company, including costs resulting from public company reporting obligations under the Securities Act,the Exchange Act, and regulations regarding corporate governance practices. The Sarbanes-Oxley Act, the Dodd-Frank Wall Street Reform and Consumer Protection Act, the rules of the SEC, the listing requirements ofNasdaq, and other applicable securities rules and regulations impose various requirements on public companies,including establishment and maintenance of effective disclosure and financial controls and corporate governancepractices. We expect that we will need to hire additional accounting, finance, and other personnel in connectionwith our becoming, and our efforts to comply with the requirements of being, a public company, and ourmanagement and other personnel will need to devote a substantial amount of time towards maintainingcompliance with these requirements. These requirements will increase our legal and financial compliance costsand will make some activities more time-consuming and costly. For example, we expect that the rules andregulations applicable to us as a public company may make it more difficult and more expensive for us to obtaindirector and officer liability insurance, which could make it more difficult for us to attract and retain qualifiedmembers of our board of directors. We are currently evaluating these rules and regulations and cannot predict orestimate the amount of additional costs we may incur or the timing of such costs. These rules and regulations areoften subject to varying interpretations, in many cases due to their lack of specificity, and, as a result, theirapplication in practice may evolve over time as new guidance is provided by regulatory and governing bodies.This could result in continuing uncertainty regarding compliance matters and higher costs necessitated byongoing revisions to disclosure and governance practices. We cannot predict or estimate the amount of additionalcosts we may incur as a result of becoming a public company or the timing of such costs. Any changes we maketo comply with these obligations may not be sufficient to allow us to satisfy our obligations as a public company
55

on a timely basis, or at all. These reporting requirements, rules and regulations, coupled with the increase inpotential litigation exposure associated with being a public company, could also make it more difficult for us toattract and retain qualified persons to serve on our board of directors or board committees or to serve asexecutive officers, or to obtain certain types of insurance, including directors’ and officers’ insurance, onacceptable terms.
Pursuant to Sarbanes-Oxley Act Section 404, we will be required to furnish a report by our management onour internal control over financial reporting beginning with our second filing of an Annual Report on Form 10-Kwith the SEC after we become a public company. In order to maintain effective internal controls, we will needadditional financial personnel, systems and resources. To achieve compliance with Sarbanes-Oxley ActSection 404 within the prescribed period, we will be engaged in a process to document and evaluate our internalcontrol over financial reporting, which is both costly and challenging. In this regard, we will need to continue todedicate internal resources, engage outside consultants, adopt a detailed work plan to assess and document theadequacy of internal control over financial reporting, continue steps to improve control processes as appropriate,validate through testing that controls are functioning as documented, and implement a continuous reporting andimprovement process for internal control over financial reporting. Despite our efforts, there is a risk that we willnot be able to conclude, within the prescribed timeframe or at all, that our internal control over financialreporting is effective as required by Sarbanes-Oxley Act Section 404. If we identify one or more materialweaknesses, it could result in an adverse reaction in the financial markets due to a loss of confidence in thereliability of our financial statements.
To date, we have not conducted a review of our internal controls for the purpose of providing the reportsrequired by these rules. During the course of our review and testing, we have in the past and may in the future,identify deficiencies and be unable to remediate them before we must provide the required reports. Furthermore,if we have a material weakness in our internal control over financial reporting, we may not detect errors on atimely basis and our financial statements may be materially misstated. We or our independent registered publicaccounting firm may not be able to conclude on an ongoing basis that we have effective internal control overfinancial reporting, which could harm our operating results, cause investors to lose confidence in our reportedfinancial information and cause the trading price of our stock to fall. In addition, as a public company we will berequired to file accurate and timely quarterly and annual reports with the SEC under the Exchange Act. Anyfailure to report our financial results on an accurate and timely basis could result in sanctions, lawsuits, delistingof our common stock from Nasdaq or other adverse consequences that would materially harm our business andreputation.
56

REORGANIZATION
Prior to the date of the registration statement of which this prospectus forms a part, our wholly owned(excluding certain management equity interests) subsidiary, Krispy Kreme Holdings, Inc. (“KKHI”), will mergewith and into the Company, with the Company being the surviving entity (the “Merger”). Following the date ofthe registration statement of which this prospectus forms a part, but prior to the completion of this offering, wewill effect a 1,745 -for-1 split of each outstanding share of our common stock (the “Stock Split”). Theoutstanding equity interests of KKHI, and outstanding management equity awards of KKHI will be exchangedfor equivalent shares and awards of the Company, respectively.
Prior to the Merger, on June 10, 2021, KKHI entered into the Term Loan Facility in an initial aggregateprincipal amount of $500.0 million which will be required to be repaid within four business days of receipt of thenet proceeds from the Company’s initial public offering. KKHI used all of the proceeds from the Term LoanFacility to pay a pro rata dividend to us and members of its management who, prior to the Merger, beneficiallyheld equity interests in KKHI of approximately $457.7 million and $42.3 million, respectively. The Companyused approximately $355.0 million of the proceeds from the dividend it received to repay the Related Party Notesin the amount of approximately $355.0 million, approximately $42.3 million to pay pro rata dividends to themanagement and directors of KKHI in the aggregate amount of approximately $42.3 million and the remainingapproximately $102.7 million to redeem certain common stock held by its sole shareholder, KK G.P in theamount of $102.7 million. The Company intends to use a portion of the net proceeds from this offering to repayall outstanding indebtedness under the Term Loan Facility. Prior to the Merger, any security interests granted byKKHI in connection with the Term Loan Facility will be terminated following the repayment of the Term LoanFacility. See “Use of Proceeds” for more information.
In addition, JAB has advised the Company that, immediately following the consummation of this offeringand the application of proceeds therefrom, it intends to distribute approximately 124.8 million shares of theCompany’s common stock, representing approximately 77.0% of the Company’s outstanding common stock, toits approximately 100 minority partners (the “Distribution” and, together with the Merger, the Stock Split and theTerm Loan Facility, the “Reorganization Transactions”). The shares of common stock to be distributed in theDistribution will be subject to a lock up agreement in favor of the Underwriters for a period ending 180 daysafter the date of this prospectus. See “Underwriting (Conflict of Interest).”
JAB will not sell any shares of the Company’s common stock in this offering or the Distribution and itseconomic ownership in the Company will not change as a result of the Distribution. Subsequent to this offeringand the Distribution, JAB will be an anchor shareholder of the Company, beneficially owning approximately38.6% of the Company’s outstanding common stock, prior to giving effect to any purchase by JAB of shares inthis offering. Following expiration of the lock up agreements, the Company’s public float is expected to beapproximately 50.8%. Following the Distribution, we will cease to be a “controlled company” within themeaning of the corporate governance standards of Nasdaq.
Additionally, substantially concurrently with the completion this offering, we will amend the 2019 Facilityin order to, among other things, provide for the pledge of the Company’s assets as security for, and the guaranteeby the Company of, the payment of the obligations under the 2019 Facility, and to make certain other customarychanges related to financial reporting requirements applicable to public companies.
Unless otherwise indicated, the information in this prospectus gives effect to the ReorganizationTransactions.
57

SPECIAL NOTE REGARDING FORWARD-LOOKING STATEMENTS
Some of the information contained in this prospectus contain forward-looking statements within themeaning of Section 27A of the Securities Act and Section 21E of the Exchange Act, that relate to our plans,objectives, estimates and goals. Statements expressing expectations regarding our future and projections relatingto products, sales, revenues, expenditures, costs and earnings are typical of such statements. Forward-lookingstatements are based on management’s beliefs, assumptions and expectations of our future economicperformance, considering the information currently available to management. These statements are notstatements of historical fact. Forward-looking statements involve risks and uncertainties that may cause ouractual results, performance or financial condition to differ materially from the expectations of future results,performance or financial condition we express or imply in any forward-looking statements. The words “believe,”“may,” “could,” “will,” “should,” “would,” “anticipate,” “estimate,” “expect,” “intend,” “objective,” “seek,”“strive” or similar words, or the negative of these words, identify forward-looking statements. The inclusion ofthis forward-looking information should not be regarded as a representation by us, the underwriters or any otherperson that the future plans, estimates or expectations contemplated by us will be achieved. Such forward-looking statements are subject to various risks and uncertainties and assumptions relating to our operations,financial results, financial condition, business, prospects, growth strategy and liquidity. Accordingly, there are, orwill be, important factors that could cause our actual results to differ materially from those indicated in thesestatements. We believe that these factors include, but are not limited to:
• the impact of pandemics, including the COVID-19 pandemic, including demand for the Company’sproducts, illness, quarantines, government actions, facility closures, shop closures or other restrictionsin connection with the COVID-19 pandemic, and the extent and duration thereof, related impact on ourability to meet customer needs and on the ability of third parties on which we rely, including ourfranchisees, suppliers, customers, contract manufacturers, distributors, to meet their obligations to us,the extent that government funding and reimbursement programs in connection with the COVID-19pandemic are available to us, and the ability to successfully implement measures to respond to suchimpacts;
• the quality of our and our franchised shop operations and changes in sales volume;
• changes in consumer preferences and demographic;
• adverse weather conditions, including those related to climate change;
• unsuccessful implementation of important strategic initiatives;
• risks arising from future acquisitions;
• our success depends on our ability to compete with many food service businesses;
• risks related to our reliance on key customers in our Branded Sweet Treat Line and DFD businesschannels;
• risks related to our inability to successfully grow nationally and internationally;
• our ability to execute on our omni-channel business strategy, including as we complete our legacywholesale business evolution as a result of the transformation to DFD and the introduction of ourBranded Sweet Treat;
• the price and availability of raw materials needed to produce our indulgence products;
• changes in customer preferences and perceptions;
• our ability to compete across all aspects of our business;
• our relationship with our customers, our key contractors and franchisees;
• risks related to our information, technology and logistics systems and those of the third parties we dobusiness with and rely upon;
• political, economic, currency and other risks associated with our international operations;
58

• our ability to implement our acquire and integrate additional franchised locations;
• risks related to the food service industry, including safety standards and standards regarding theprotection of consumer information;
• changes in labor relations or the effects of newly imposed government regulations; and
• the other risks and uncertainties described under “Risk Factors.”
All such factors are difficult to predict, contain uncertainties that may materially affect actual results andmay be beyond our control. New factors emerge from time to time, and it is not possible for management topredict all such factors or to assess the impact of each such factor on the Company. Any forward-lookingstatement speaks only as of the date on which such statement is made, and we do not undertake any obligation toupdate any forward-looking statement to reflect events or circumstances after the date on which such statement ismade except as required by the federal securities laws.
If one or more of these or other risks or uncertainties materialize, or if our underlying assumptions prove tobe incorrect, our actual results may vary materially from what we may have expressed or implied by theseforward-looking statements. We caution that you should not place undue reliance on any of our forward-lookingstatements. You should specifically consider the factors identified in this prospectus that could cause actualresults to differ before making an investment decision to purchase our common stock. Furthermore, new risksand uncertainties arise from time to time, and it is impossible for us to predict those events or how they mayaffect us.
59

USE OF PROCEEDS
We will receive net proceeds from this offering of approximately $565.0 million (or approximately$650.5 million if the underwriters exercise their option to purchase additional shares of common stock in full),after deducting underwriting discounts and commissions and estimated offering expenses payable by us, based onan assumed initial public offering price of $22.50 per share (the midpoint of the price range set forth on the coverof this prospectus).
The principal purpose of this offering is to provide us with additional capital including to allow us to reduceindebtedness, create a public market for our common stock and enable access to the public equity markets for usand our stockholders. We intend to use approximately $500.0 million of the net proceeds that we receive fromthis offering to repay all of the outstanding indebtedness under the Term Loan Facility, up to $26.2 million of thenet proceeds to repurchase shares of common stock from certain of our executive officers at the price to be paidby the underwriters and approximately $20.8 million for payment of withholding taxes with respect to the RSUsvesting or for which vesting is accelerated in connection with this offering, with the remainder, if any, to be usedfor general corporate purposes. To the extent the net proceeds are insufficient for the uses described above, anysuch remaining amounts will be paid out of cash on hand. This offering is not conditioned upon the completionof the share repurchase, but the share repurchase is conditioned upon completion of this offering.
On June 10, 2021, KKHI entered into a term loan facility by and among the lenders party thereto andJPMorgan Chase Bank, N.A., as administrative agent (the “Term Loan Facility”), in an initial aggregate principalamount of $500.0 million (less estimated financing fees and expenses of $1.5 million). On June 17, 2021, KKHIborrowed $500.0 million under the Term Loan Facility. The Term Loan Facility matures on the earlier of (i) June10, 2022 and (ii) four business days following the receipt of the net proceeds from this offering. The borrowingsunder the Term Loan Facility bear interest at a rate equal to LIBOR plus a margin of 2.60%. In addition, certainaffiliates of the underwriters have also acted as lenders in connection with the Term Loan Facility for which theyhave received, and will receive, customary fees and expenses as consideration therewith.
An affiliate of J.P. Morgan Securities LLC, an underwriter of this offering, is the administrative agent andholds a portion of the outstanding balance of our Term Loan Facility and an affiliate of Morgan Stanley & Co.LLC, an underwriter of this offering, holds a portion of the outstanding balance of our Term Loan Facility, and asa result, such affiliates will receive a portion of the net proceeds of this offering following in connection with therepayment of all of the outstanding indebtedness under our Term Loan Facility. As a result of the foregoing, eachof J.P. Morgan Securities LLC and Morgan Stanley & Co. LLC, is deemed to have a “conflict of interest” withinthe meaning of Rule 5121 of FINRA. This offering is therefore being made in compliance with FINRA Rule5121 and Wells Fargo Securities, LLC is assuming the responsibilities of acting as a “qualified independentunderwriter” in preparing this prospectus supplement and conducting due diligence. Aside from its relativeportion of the underwriting discount set forth on the cover page of this prospectus supplement, Wells FargoSecurities, LLC will not receive any fees for serving as a qualified independent underwriter in connection withthis offering. We have agreed to indemnify Wells Fargo Securities, LLC against liabilities incurred in connectionwith acting as the qualified independent underwriter, including liabilities under the Securities Act and theExchange Act. No underwriter having a conflicting interest under FINRA Rule 5121 will sell to a discretionaryaccount any security with respect to which the conflict exists, unless the member has received specific writtenapproval of the transaction from the account holder and retains documentation of the approval in its records. See“Underwriting (Conflict of Interest) — Conflict of Interest.”
A $1.00 increase (decrease) in the assumed initial public offering price per share would increase (decrease)the estimated net proceeds to us by approximately $25.3 million (or approximately $29.1 million if theunderwriters exercise their option to purchase additional shares of common stock in full), assuming that thenumber of shares of common stock sold by us, as set forth on the cover page of this prospectus, remains the sameand after deducting the underwriting discounts and commissions and estimated offering expenses payable by us.Such increase (decrease) would result in the additional (reduction of) payments with respect to tax withholdingsof approximately $1.0 million. Similarly, each increase (decrease) of 1,000,000 shares in the number of shares of
60

common stock offered by us would increase (decrease) the net proceeds to us from this offering byapproximately $21.4 million, assuming that the assumed initial public offering price remains the same, and afterdeducting the underwriting discounts and commissions and commissions and estimated offering expensespayable by us.
61

DIVIDEND POLICY
Commencing on the fiscal quarter ending October 3, 2021 and subject to legally available funds, we intendto pay quarterly cash dividends on our common stock. We expect to pay an initial quarterly cash dividend of$0.035 per share for the quarter ending October 3, 2021, which is expected to be paid in October 2021.Thereafter, we expect to pay the dividend subsequent to the close of each fiscal quarter.
Any declaration and payment of future dividends to holders of our common stock will be at the solediscretion of our board of directors and will depend on many factors, including economic conditions, ourfinancial condition and operating results, our available cash and current and anticipated cash needs, capitalrequirements, contractual, legal, tax and regulatory restrictions, including restrictive covenants contained incertain of our subsidiaries’ credit facilities, and such other factors as our board of directors may deem relevant.See “Risk Factors – Risks Relating to this Offering and our Common Stock – We may be unable to paydividends on our common stock.”
Under Delaware law, dividends may be payable only out of surplus, which is calculated as our net assetsless our liabilities and our capital, or, if we have no surplus, out of our net profits for the fiscal year in which thedividend is declared and/or the preceding fiscal year.
62

CAPITALIZATION
The following table sets forth the cash and cash equivalents and capitalization as of April 4, 2021:
• on an actual basis;
• on a pro forma basis giving effect to the Reorganization Transactions, other than the Distribution, andthe other transactions as further described in note (1) below; and
• on a pro forma as adjusted basis, after giving effect to the Reorganization Transactions (including theDistribution), the other transactions as further described in note (1) below and the sale by us of26,666,667 shares of common stock in this offering at an assumed initial public offering price of$22.50 per share (the midpoint of the price range set forth on the cover of this prospectus, and afterdeducting estimated underwriting discounts and commissions and estimated offering expenses), andafter giving effect to repayment of the Term Loan Facility, the share repurchase and the payment ofwithholding taxes with the proceeds of this offering, as if they had occurred on April 4, 2021.
The following table is derived from and should be read together with the sections of this prospectus entitled“Use of Proceeds,” “Summary Historical Consolidated Financial Information,” “Management’s Discussion andAnalysis of Financial Condition and Results of Operations” and our financial statements and accompanying notesincluded elsewhere in this prospectus.
As of April 4, 2021
Actual Pro Forma(1)Pro Forma as
Adjusted (1)(2)(3)
($ in thousands, except share numbers)Cash and cash equivalents . . . . . . . . . . . . . . . . . . . . . . . . $ 50,650 $ 61,405 $ 78,213
Debt:2019 Credit facility – revolving credit facility(4)(5) . . $ 185,000 $ 40,945 $ 40,9452019 Credit facility – term loan(5) . . . . . . . . . . . . . . . 647,500 647,500 647,500Related Party Notes(6) . . . . . . . . . . . . . . . . . . . . . . . . 350,147 — —Term Loan Facility(7) . . . . . . . . . . . . . . . . . . . . . . . . — 500,000 —Finance lease obligations . . . . . . . . . . . . . . . . . . . . . 26,979 26,979 26,979
Total debt . . . . . . . . . . . . . . . . . . . . . . . . . . . . . . . . . . . . . 1,209,626 1,215,424 715,424
Common stock, par value $0.01 per share; 100,000 sharesof common stock authorized, actual and 300,000,000shares of common stock authorized, pro forma and proforma as adjusted; 71,626 shares of common stockissued and outstanding, actual; 127,186,991 shares ofcommon stock issued and outstanding, pro forma;160,890,354 shares of common stock issued andoutstanding, pro forma as adjusted . . . . . . . . . . . . . . . . 1 1,272 1,609
Preferred stock, par value $0.01 per share; 50,000,000shares of preferred stock authorized, actual, pro formaand pro forma as adjusted; no shares of preferred stockissued and outstanding, actual, pro forma and pro formaas adjusted . . . . . . . . . . . . . . . . . . . . . . . . . . . . . . . . . . . — — —
Additional paid-in capital . . . . . . . . . . . . . . . . . . . . . . . . . 849,090 922,189 1,442,740Shareholder note receivables . . . . . . . . . . . . . . . . . . . . . . (18,228) (3,595) (3,595)Accumulated other comprehensive loss, net of tax . . . . . 1,630 1,630 1,630Retained deficit . . . . . . . . . . . . . . . . . . . . . . . . . . . . . . . . . (145,256) (146,756) (150,336)Noncontrolling interest . . . . . . . . . . . . . . . . . . . . . . . . . . . 176,166 86,186 86,186
Total stockholders’ equity . . . . . . . . . . . . . . . . . . . . 863,403 860,926 1,378,234
Total capitalization . . . . . . . . . . . . . . . . . . . . . . $2,073,029 $2,076,350 $2,093,658
63

(1) The adjustments include the effect of (i) $144.1 million capital contribution from shareholder and minorityinvestors, which was used to repay a portion of the 2019 Credit facility - revolving credit facility, (ii) $14.6million shareholder note receivable settlement as described in Note 15 to our unaudited condensedconsolidated financial statements included elsewhere in this prospectus, and (iii) $7.4 million receipt tosettle the tax sharing agreement receivable as described in Note 11 to our unaudited condensed consolidatedfinancial statements included elsewhere in this prospectus.
(2) A $1.00 increase (decrease) in the assumed initial public offering price of $22.50 per share, which is themidpoint of the estimated initial public offering price range we show on the cover of this prospectus, wouldincrease (decrease) the pro forma as adjusted amount of each of cash and cash equivalents, additionalpaid-in capital, total stockholders’ (deficit) equity and total capitalization by approximately $25.3 millioneach, assuming that the number of shares offered by us, which we show on the cover of this prospectus,remains the same and after deducting estimated underwriting discounts and commissions and estimatedoffering expenses payable by us. We may also increase or decrease the number of shares of common stockwe are offering. Each increase (decrease) of 1,000,000 common stock at the assumed initial public offeringprice of $22.50 per share, which is the midpoint of the estimated initial public offering price range we showon the cover of this prospectus, would increase (decrease) the pro forma as adjusted amount of each of cashand cash equivalents, additional paid-in capital, total stockholders’ (deficit) equity and total capitalizationby approximately $21.4 million each, after deducting estimated underwriting discounts and commissionsand estimated offering expenses payable by us.
(3) Excludes certain grants of 512,207 options to purchase shares of our common stock and 414,918 restrictedstock units to certain of our employees and directors in May 2021, prior to this offering. The estimated fairvalues of the options and RSUs granted were $29.1 million and $55.9 million, respectively. For moreinformation see Note 15 to our audited consolidated financial statements included elsewhere in thisprospectus.
(4) The 2019 Credit Facility provides for up to $300.0 million of revolving borrowing capacity.(5) Excludes the impact of debt issuance costs of $5.0 million related to the 2019 Credit Facility.(6) For more information on the Related Party Notes, see “Certain Relationships and Related Party
Transactions - Related Party Notes”(7) For more information on the Term Loan Facility, see “Reorganization.”
64

DILUTION
If you invest in our common stock in this offering, you will experience immediate and substantial dilution inthe net tangible book value per share of our common stock upon the completion of this offering.
As used in this “Dilution” section, (i) our pro forma net tangible book deficit per share is determined bydividing our pro forma net tangible book deficit (tangible assets less total liabilities) by the total number of ouroutstanding common stock that will be outstanding immediately prior to the closing of this offering but aftergiving effect to the Reorganization Transactions, other than the Distribution, as well as the other transactions asfurther described in note (1) below and (ii) our pro forma as adjusted net tangible book value per share ofcommon stock represents pro forma net tangible book value divided by the number of shares of common stockoutstanding immediately after giving effect to the Reorganization Transactions, as well as the other transactionsas further described in note (1) below and the closing of this offering.
Our pro forma net tangible book deficit as of April 4, 2021, was approximately $(1,246.6) million, orapproximately $(9.80) per share.
After giving effect to the sale of common stock in this offering at an assumed initial public offering price of$22.50 per share (the midpoint of the price range set forth on the cover page of this prospectus), and afterdeducting estimated underwriting discounts and commissions and offering expenses, our pro forma as adjustednet tangible book value as of April 4, 2021 would have been approximately $(729.3) million, or approximately$(4.53) per share. This represents an immediate increase in the net tangible book value of $5.27 per share toexisting stockholders and an immediate dilution (i.e., the difference between the offering price and the pro formaas adjusted net tangible book value after this offering) to new investors participating in this offering of $27.03per share.
The following table illustrates the per share dilution to new investors participating in this offering:
Assumed initial public offering price per share . . . . . . . . . . . . . $22.50Pro forma net tangible book deficit per share as of April 4,
2021 (1) . . . . . . . . . . . . . . . . . . . . . . . . . . . . . . . . . . . . . . . . . . $(9.80)Increase per share attributable to new investors in this
offering . . . . . . . . . . . . . . . . . . . . . . . . . . . . . . . . . . . . . . . . . . 5.27
Pro forma as adjusted net tangible book value per share (1) . . . . (4.53)
Dilution per share to new investors in this offering (2) . . . . . . . . $27.03
(1) The adjustments include the effect of (i) $144.1 million capital contribution from shareholder and minorityinvestors, which was used to repay a portion of the 2019 Credit facility - revolving credit facility, (ii) and$14.6 million shareholder note receivable settlement as described in Note 15 to our unaudited condensedconsolidated financial statements included elsewhere in this prospectus, and (iii) $7.4 million receipt tosettle the tax sharing agreement receivable settlement as described in Note 11 to our unaudited condensedconsolidated financial statements included elsewhere in this prospectus.
(2) Dilution is determined by subtracting pro forma as adjusted net tangible book value per share from theinitial public offering price paid by a new investor.
65

The following table summarizes on a pro forma as adjusted basis of 134,183,750, the total number of sharesof common stock owned by our existing stockholders immediately prior to this offering and the use of proceedstherefrom and to be owned by the new investors in this offering, the total consideration paid, and the averageprice per share paid by our existing stockholders and to be paid by the new investors in this offering at $22.50,the midpoint of the price range set forth on the cover page of this prospectus, calculated before deductingestimated discounts and commissions and offering expenses:
Shares Purchased Total Consideration Average PricePer ShareNumber Percentage Amount Percentage
Our existing stockholders . . . . . . . . . . . . . 134,183,750 83.4% $1,330,596,200 68.9% $ 9.92
New investors in this offering . . . . . . . . . . 26,666,667 16.6% $ 600,000,000 31.1% $22.50
Total . . . . . . . . . . . . . . . . . . . . . . . . . . . . . 160,850,417 100.0% $1,930,596,200 100% $12.00
A $1.00 increase (decrease) in the assumed initial public offering price of $22.50 per share, which is themidpoint of the price range set forth on the cover page of this prospectus, would increase (decrease) our proforma as adjusted net tangible book value as of April 4, 2021 by approximately $25.3 million, our pro forma asadjusted net tangible book value per share by $0.16 per share and the dilution in adjusted pro forma as adjustednet tangible book value per share to new investors in this offering by $(1.16) per share, assuming the number ofshares offered by us, as set forth on the cover page of this prospectus, remains the same and after deducting theestimated underwriting discounts and commissions and offering expenses. Similarly, an increase (decrease) of1,000,000 shares in the number of shares of common stock offered by us at the assumed initial public offeringprice of $22.50 per share, which is the midpoint of the estimated initial public offering price range we show onthe cover of this prospectus, would increase (decrease) our pro forma as adjusted net tangible book value as ofApril 4, 2021 by approximately $21.4 million, our pro forma as adjusted net tangible book value per share by$0.16 per share and, in the case of an increase, the dilution in pro forma as adjusted net tangible book value pershare to new investors in this offering by $0.16 per share, and, in the case of a decrease, the dilution in adjustedpro forma as adjusted net tangible book value per share to new investors in this offering by $0.16 per share, ineach case assuming the initial public offering price remains the same and after deducting the estimatedunderwriting discounts and commissions and offering expenses.
66

MANAGEMENT’S DISCUSSION AND ANALYSIS OF FINANCIAL CONDITION AND RESULTS OFOPERATIONS
The following discussion and analysis of our financial condition and results of operations should be readtogether with our audited consolidated financial statements and related notes included elsewhere in thisprospectus. This discussion contains forward-looking statements that involve risks and uncertainties. See “RiskFactors” and “Special Note Regarding Forward-Looking Statements” herein. Our actual results could differmaterially from the forward-looking statements included herein. Factors that could cause or contribute to suchdifferences include, but are not limited to, those identified below and those discussed in the section entitled “RiskFactors” and elsewhere in this prospectus.
Overview
Krispy Kreme is one of the most beloved and well-known sweet treat brands in the world. Over its 83-yearhistory, Krispy Kreme has developed a broad consumer base, selling 1.3 billion doughnuts across 30 countries infiscal 2020. We are an omni-channel business operating through a network of doughnut shops, partnerships withleading retailers, and a rapidly growing e-Commerce and delivery business. We believe that we have one of thelargest and most passionate consumer followings today, exemplified by the over 38 billion total mediaimpressions generated by Krispy Kreme in fiscal 2020. As an affordable indulgence enjoyed across cultures,races, and income levels, we believe that Krispy Kreme has the potential to deliver joyful experiences across theworld.
Krispy Kreme doughnuts are world-renowned for their freshness, taste and quality. Our iconic OriginalGlazed doughnut is universally recognized for its melt-in-your-mouth experience. One differentiating aspect ofthe Original Glazed® doughnut is its ability to be served hot. In our Hot Light Theater Shops, we produce freshOriginal Glazed doughnuts right in front of our guests and turn on our iconic “Hot Now” light to let the worldknow that our doughnuts are hot and ready. We dedicate ourselves to providing the freshest and most awesomedoughnut experience imaginable, with 73% of our surveyed customers, in a 2021 survey conducted by theCompany, reporting that if they could eat only one doughnut brand for the rest of their life, they would chooseKrispy Kreme.
On July 27, 2016, Krispy Kreme Doughnuts, Inc. (“KKDI”), our predecessor, was acquired by JAB Beech,Inc., an indirect controlled subsidiary of JAB, at which time KKDI’s common stock ceased trading on theNew York Stock Exchange (the “JAB Acquisition”).
Since the JAB Acquisition, we have transformed our business and re-focused our strategy to grow ourpresence and expand our consumer reach. This is exemplified by the development of our omni-channel businessmodel, which levers our Hot Light Shops to provide an experiential consumer experience and produce doughnutsfor our fresh retail, DFD, e-Commerce and delivery, ensuring that our consumers are able to access our productsin numerous ways. A critical component of this re-imagined access to consumers has been the evolution of ourlegacy wholesale business. We transitioned to our DFD business in the United States which previously consistedof longer shelf-life Original Glazed doughnuts, that we believe were not representative of the freshness andquality that we and our customers expect from the Krispy Kreme brand. Over the past few years, we have startedto fully transition to a DFD model that is enabled by our Hot Light Theater Shops and Doughnut Factories. Wehave also introduced our Branded Sweet Treat Line offered through grocery, mass merchandise and convenienceretail locations, which launched in mid-2020. We believe the transformed DFD model and new Branded SweetTreat Line provide a superior customer experience and has led to greater demand from our retail partners andhigher sales per DFD point of access.
We have also acquired and integrated a number of our formerly franchised operations, granting us moredirect control and the ability to integrate acquired locations into our Hub & Spoke network. Our acquisition of acontrolling interest in Insomnia in September 2018 additionally added a complementary rapidly growing sweettreat brand to our portfolio, presenting us with additional growth opportunities by leveraging our distributionscale and know-how.
67

As of April 4, 2021, we had approximately 1,706 Krispy Kreme and Insomnia branded shops and 7,371DFD doors for a total of 9,077 global points of access with consumers in 30 countries around the world, of which7,841 were controlled and operated by us and 1,236 were franchised. See “ – Key Factors Effecting Our Resultsand Prospects – Expanding our geographic footprint and consumer points of access by leveraging our omni-channel business model” for detail on our global points of access.
The following table presents a summary of our financial results for the periods indicated:
Quarters Ended Fiscal Years Ended
(in thousands exceptpercentages)
April 4,2021
(Q1 2021)
March 29,2020
(Q1 2020)
Q1 2021vs
Q1 2020
January 3,2021 (Fiscal
2020)
December 29,2019
(Fiscal2019)
December 30,2018
(Fiscal2018)
Fiscal2020 vsFiscal2019
Fiscal2019 vsFiscal2018
Total NetRevenues . . . . . $321,809 $261,216 23.2% $1,122,306 $959,408 $795,883 17.0% 20.5%
Net Loss . . . . . . . . (378) (10,948) -96.5% (60,940) (34,001) (12,439) -79.23% -173.34%Adjusted Net
Income(1) . . . . . . 17,626 11,111 58.6% 42,346 39,749 49,604 6.5% -19.9%Adjusted
EBITDA(1) . . . . 46,403 36,444 27.3% 145,434 146,384 124,247 -0.6% 17.8%
(1) Refer to “About this Prospectus – Non-GAAP Financial Measures” and “Prospectus Summary – SummaryHistorical Consolidated Financial Information” above for more information as to how we define andcalculate Adjusted EBITDA and Adjusted Net Income and for a reconciliation of Adjusted EBITDA andAdjusted Net Income to net loss, the most comparable GAAP measure.
Basis of Presentation
We operate and report financial information on a 52- or 53-week fiscal year ending on the Sunday closest toDecember 31. This prospectus reflects our results of operations for the 53-week period ended January 3, 2021(“fiscal 2020”) and the 52-week periods ended December 29, 2019 (“fiscal 2019”) and December 30, 2018(“fiscal 2018”), respectively. This prospectus also reflects our results of operations for the quarters ended April 4,2021 (“Q1 2021” or “the first quarter of fiscal 2021”) and March 29, 2020 (“Q1 2020” or “the first quarter offiscal 2020”). In a 52-week fiscal year, each of the Company’s quarterly periods comprises 13 weeks. Theadditional week in a 53-week fiscal year is added to the fourth fiscal quarter, resulting in a 14-week quarter.Accordingly, fiscal 2020 reflects an extra week of revenue and expenses relative to fiscal 2019 and fiscal 2018.Q1 2021 and Q1 2020 were both 13 week periods.
We conduct our business through the following three reported segments:
• U.S. and Canada: reflects all of our company-owned operations in the United States and Canada,including our Krispy Kreme and Insomnia shops, DFD and our Branded Sweet Treat Line.
• International: reflects all of our Krispy Kreme company-owned operations in the U.K. and Ireland(“U.K./Ireland”), Australia, New Zealand and Mexico.
• Market Development: reflects our franchise operations across the globe. It also includes ourcompany-owned operations in Japan, which belonged to a franchise that we acquired in December2020 (“KK Japan”). Our franchise operations include franchisee royalties and sales of doughnut mix,other ingredients, supplies and doughnut-making equipment to franchisees.
We use Adjusted EBITDA as our segment measure of profit and loss pursuant to Accounting StandardsCodification (“ASC”) Topic 280. The accounting policies used for internal management reporting at theoperating segments are consistent with those described in Note 1 to our audited consolidated financial statementsincluded elsewhere in this prospectus. Refer to Note 18 to our audited consolidated financial statements included
68

elsewhere in this prospectus for a summary of our segment results and a reconciliation between segmentAdjusted EBITDA and our consolidated net loss.
Our Omni-Channel Model
We believe our omni-channel model, enabled by our Hub & Spoke approach, allows us to maximize ourmarket opportunity while ensuring control and quality across our suite of products. We apply a tailored approachacross a variety of distinct shop formats to grow in discrete, highly attractive and diverse markets, and maintainbrand integrity and scarcity value while maximizing significant untapped consumer demand. The productioncapacity of our Hot Light Theater Shops and Doughnut Factories (“Hubs”) allow us to leverage our investmentby efficiently expanding to our consumers wherever they may be – whether in a local Fresh Shop, in a grocery orconvenience store, on their commute home or directly to their doorstep via home delivery.
Hub & Spoke
• Hot Light Theater Shops and other Hubs – Immersive and interactive experiential shops which provideunique and differentiated customer experiences while serving as local production facilities for ournetwork. These locations serve as Hubs to enable our Hub & Spoke model and expand our brand’sreach. Each shop features our famous glaze waterfalls and “Hot Now” light that communicate the joyand emotion at the core of our brand. Hot Light Theater Shops are typically destination locations, with87% of U.S. locations featuring drive-thru capability. Our flexible drive-thru model offers a convenientoff-premise experience which accounted for 46% and 64% of U.S. doughnut shop sales in fiscal 2019and 2020, respectively. We also have smaller Mini-Hot Light Theater Shops that serve hot doughnutexperiences to high foot fall, urban locations. In higher density urban environments, we also utilizeDoughnut Factories to provide fresh doughnuts to Spoke locations, which include Fresh Shops andDFD doors.
• Fresh Shops – Smaller doughnut shops and kiosks, without manufacturing capabilities, selling freshdoughnuts delivered daily from Hub locations. Fresh Shops expand our consumer-serving capacity,while maintaining quality and scarcity value.
• Delivered Fresh Daily – Krispy Kreme branded doughnut cabinets within high traffic grocery andconvenience locations, selling fresh doughnuts delivered daily from Hub locations. Through our DFDpartnerships, we are able to significantly expand our points of access so that more consumers canexperience Krispy Kreme doughnuts. These additional Spoke locations further leverage ourmanufacturing Hub locations, creating greater system efficiency. Consistent with our commitment toproduct quality, our current DFD business has been transformed materially from our legacy wholesalemodel. In 2018, we began strategically exiting unprofitable, low-volume doors and pivoting towardsdelivered-fresh-daily products offered in branded in-store cabinets. This evolution, which had anegative short-term financial impact, was largely completed in 2020 and we believe positions us forstrong and sustainable growth in DFD.
• e-Commerce and Delivery – Fresh doughnuts for pickup or delivery, ordered via our brandede-Commerce platforms or through third-party digital channels. In the United States and Canada ourbranded e-Commerce platform enables attractive opportunities like gifting and office catering, furtherfueling our momentum across key geographies. For fiscal 2020, 18% of our U.S. sales, inclusive ofInsomnia and exclusive of our Branded Sweet Treat Line and DFD, were digital and we aim to growthis significantly in the next few years, both domestically and internationally. The acquisition ofInsomnia allowed us to further develop our e-Commerce business by leveraging Insomnia’s expertiseand capabilities to accelerate Krispy Kreme’s digital opportunity.
Branded Sweet Treat Line
Our Krispy Kreme branded sweet treat line offers a delicious, quality experience free of artificial flavors.This new line of products is distributed in the United States through major grocery, mass merchandise, and
69

convenience locations, allowing us to capture the sweet snacking occasion for our customers seeking moreconvenience. Our Branded Sweet Treat Line, alongside our DFD business channel, are both the products of ourlegacy wholesale business evolution.
Significant Events and Transactions
COVID-19 Impact
The COVID-19 pandemic has, to date, impacted our business both positively and negatively. From the onsetof the COVID-19 pandemic, our first priority has been ensuring the health and safety of our employees, partnersand consumers and compliance with applicable health and safety regulations. Among other measures taken inresponse to the COVID-19 pandemic, we closed lobby dining at our open shops in March of 2020 and offeredonly pick up, take out, drive thru and contact-less delivery and implemented enhanced safety protocols, includingan additional sanitation regime, “one-way” only foot traffic, installation of “sneeze” guards and a glove and maskpolicy. During the second quarter of fiscal 2020, we began to re-open certain lobby dining, in accordance withapplicable regulatory requirements.
The COVID-19 pandemic also resulted in the temporary closure of certain Krispy Kreme shops, with themost significant temporary closures occurring internationally including the U.K./Ireland, Australia and Mexico.For example, by the end of first quarter of fiscal 2020, all of our 122 U.K./Ireland shops were closed andapproximately 40% of our international franchise shops were closed as a result of the COVID-19 pandemic withour U.K./Ireland shops remaining closed for a minimum of six weeks and the other international shop closuresspanning a variety of durations. A second wave of closures impacted some of our U.K./Ireland shops inNovember 2020, following a short period of reopening. We also permanently closed 17 company-owned shops inthe U.K./Ireland, Australia and Mexico, resulting in approximately $6.3 million in closing-related costs in fiscal2020. Almost all of these shop closures were due to impacts from the COVID-19 pandemic. Many of our FreshShop locations in shopping centers, airports or business districts around the world were heavily impacted by thepandemic even if they weren’t forced to close due to the traffic declines in those areas. In addition, the timing ofthe pandemic, and the resulting decline in tourism and increase in remote work, delayed the opening of our NewYork City flagship Hot Light Theater Shop, resulting in losses for an extended period and a headwind to ourplanned sales growth for fiscal 2020.
Conversely, our COVID-19 mitigation measures had a better than expected impact in many cases. Forexample, we accelerated the rollout of Krispy Kreme’s e-Commerce and delivery platform in the United States,which was officially launched in February 2020 after earlier pilots. Our e-Commerce and delivery sales expandedsignificantly across the globe in fiscal 2020, reflecting our efforts and shifts in consumer behavior in response tothe COVID-19 pandemic, accounting for approximately 17% of our U.S. sales, inclusive of Insomnia andexclusive of our Branded Sweet Treat Line and DFD for fiscal 2020. e-Commerce continues to be a growing partof our omni-channel business in fiscal 2021. In addition, with drive-thrus at many of our doughnut shops, wewere well positioned to provide convenient pick-up options to customers through the COVID-19 pandemic. Overthe course of the COVID-19 pandemic we saw a significant expansion of drive-thru utilization and we realizedsignificant sales increases at most drive-thru capable locations.
In our U.S. and Canada segment, sales experienced a substantial decline through March 2020 as a result ofshop closures and changes in consumer behavior, but began their recovery in April 2020, fueled by consumeradoption of digital channels and our promotions. Positive quarter-over-quarter organic revenue growth continuedin each subsequent quarter in fiscal 2020. In our International segment, sales were slower to recover, beginningwith a decline in March 2020 that lasted or recurred throughout the remainder of the year, particularly in ourEuropean markets. The most significant impact in Europe was felt in the second quarter of fiscal 2020, as ourentire U.K./Ireland market was shut for approximately six weeks, leading to substantial lost revenue and profits,and this market has not yet recovered to pre-pandemic levels.
As of the end of the first quarter of 2021, all Krispy Kreme shops in the U.S. and Canada were operationalwith approximately 68% of these shops open for lobby dining. All Insomnia shops were also operational
70

throughout the first quarter of fiscal 2021. The U.S. and Canada Krispy Kreme business benefited in the firstquarter of fiscal 2021 from strong operational execution, e-Commerce expansion, media campaigns and productinnovation. In addition to similar strong performance in these areas for Insomnia, our cookie business benefitedfrom expansion of nationwide shipping which occurred throughout the last three quarters of fiscal 2020 and hascontinued into fiscal 2021. In March 2021, we offered a free doughnut to anyone in the U.S. who received theirCOVID-19 vaccination. The promotion was highly successful in driving incremental demand and surpassed 7.6billion earned media impressions and over 5,300 media placements in the first ten of the initiative alone.
As of the end of the first quarter of 2021, approximately 96% of global shops were operational, including allshops in Mexico, Australia and New Zealand. However, some geographies remained impacted with43 international franchise shops and 34 U.K./Ireland shops still temporarily closed as of the end of the firstquarter of 2021.
We believe we emerged from the COVID-19 pandemic a stronger and more resilient company, with a morecomplete understanding of how to reach our customers effectively. This led to positive organic growth despiteshop closure disruption. While we are optimistic and believe we will continue to show such resiliency, we plan tocontinue evaluating the impact of the pandemic and responding dynamically to any new challenges it maypresent. For more information, see “Risk Factors – Risks Related to Our Business and Industry – Public healthoutbreaks, epidemics or pandemics, including the global COVID-19 outbreak, have disrupted and may continueto disrupt, our business, and could materially affect our business, results of operations, and financial condition.”
Strategic Acquisitions
Franchises
From the start of fiscal 2018 through the end of the first quarter of 2021, we have invested $465.6 million toacquire a significant number of our franchised Krispy Kreme shops, completing transactions with 24 franchiseesto acquire control of 165 shops in the United States and 304 shops internationally. In certain circumstances, ourexisting franchisees may retain a minority stake in the franchise shops we acquire and continue to participate inthe operation of the applicable shops. Such arrangements are entered into on a case-by-case basis. We believeincreasing control in our system has allowed us to more rapidly and efficiently deploy our omni-channel model.As of the end of the first quarter of 2021, our company-owned shops in the United States and Canada accountedfor approximately 84% of Krispy Kreme’s branded sales based on the sales in the final month of the quarterdefined as total product sales from company-owned and franchise shops (which excludes our sales of doughnutmix and other supplies to franchisees) in these countries. Internationally, we have generally focused on acquiringfranchise shops in our largest and most strategic growth markets, including the U.K./Ireland, Mexico andAustralia, among others, which we believe provide a strong base for future organic growth. Over one-third of allof Krispy Kreme’s global sales are generated outside of the United States.
We recognize substantially higher revenue for a company-owned shop compared to a franchise shop, fromwhich we generally earn only royalties and fees based on a percentage of sales and sales of doughnut mix andother supplies. Accordingly, we expect our franchise acquisition strategy to accelerate our total net revenuegrowth, which will be reflected in higher U.S. and Canada or International segment revenue, depending on thelocation of the acquired shops, and partially offset by lower Market Development segment revenue. In general,our franchisees in the United States and Canada purchase substantially all of their supplies from us, whereasinternationally certain supplies (for example, packaging) are typically sourced locally by franchisees.Additionally, certain of our franchise group acquisitions, particularly from some of our strongest franchiseoperators, were structured as majority-stake partnerships, with the former franchisees retaining minority stakes,resulting in increased minority interest in the profits or losses of those operations. Decisions to pursue majority-stake partnerships over full acquisitions were largely driven by considerations of operational efficiency, withsuch majority-stake partners selected based on their franchised shops’ historical performance compared to otherfranchisees.
71

Shops governed under our majority-stake partnerships perform at or above the levels of our company-ownedshops. We strategically decide to enter into majority-stake partnerships with operators who demonstrate variouscore competencies that we identify. Individual acquired shops have generally performed better in terms ofproduct sales following acquisition by us compared to their performance prior to acquisition. Such performanceimprovements are typically driven by the shops’ integration into our omni-channel model. Our majority-stakepartnerships and franchise acquisitions have contributed significantly to our growth over the last three fiscalyears and future franchise acquisitions are expected to contribute materially to our revenue growth. They havealso impacted the comparability of our results between periods. See “About this Prospectus — Non-GAAPFinancial Measures—Organic Revenue Growth” above.
Insomnia Cookies
In September 2018 we acquired a 74.7% interest in Insomnia, which operates in our U.S. and Canadasegment and has contributed significantly to our e-Commerce and delivery performance in the U.S. since itsacquisition. We consolidate the financial results of Insomnia and deduct the noncontrolling interest’s share of itsresults from operations in net income attributable to noncontrolling interest.
U.S. Legacy Wholesale Business Evolution
Our legacy wholesale business in the United States has evolved in the last few years. In fiscal 2018, webegan the transition to our DFD business by exiting unprofitable, low-volume doors. Then, in the second half of2019, we implemented a DFD model that is enabled by our Hot Light Theater Shops and Doughnut Factories.We also introduced our new Branded Sweet Treat Line, which launched in mid-2020. The new Branded SweetTreat Line was launched exclusively in Walmart in fiscal 2020 and consists of multiple varieties of DoughnutBites and Mini Crullers that provide a premium line of packaged, shelf-stable cake doughnut products givingconsumers more opportunities to enjoy our high-quality sweet treats. The one-time costs of our evolution to DFDand the introduction of our Branded Sweet Treat Line were $4.1 million and $20.5 million in fiscal 2019 andfiscal 2020, respectively, relating to consulting and advisory fees, personnel transition costs, and networkconversion and set-up costs. This evolution also resulted in declines in sales of legacy products, which offsetotherwise stronger organic revenue growth for our U.S. and Canada segment. This evolution was largelycompleted in fiscal 2020, and we believe it positions us for strong and sustainable growth in both DFD and ourBranded Sweet Treat Line.
Key Factors Affecting Our Results and Prospects
Since the JAB Acquisition, we have transformed our business and focused our strategy on growing ourrevenue and cash flows through our transformed omni-channel model aimed at attracting new consumers andincreasing the frequency with which our consumers indulge in our sweet treats. Our Hub & Spoke approach alsofacilitates the organic growth of our geographic footprint and the integration and profitability of our acquiredfranchises. We expect the success of this business model to continue driving our results and growth prospects asa result of:
Increase trial and frequency
Almost all consumers desire an occasional indulgence, and when they indulge, they want a high quality,emotionally differentiated experience. We believe we have significant runway to be part of a greater number ofshared indulgence occasions. On average, consumers visit Krispy Kreme less than three times per year, creating asignificant frequency opportunity. The success of recently launched products including filled rings and minis,seasonal favorites and flavored glazes affirms our belief that our innovations create greater opportunities forconsumers to engage with our brand. We intend to strengthen our product portfolio by centering furtherinnovation around seasonal, and societal events, and through the development of new innovation platforms todrive sustained baseline growth. Our strategy of linking product launches with relevant events has allowed us to
72

effectively increase consumption occasions while meaningfully engaging with our communities and consumers.Our gifting value proposition and Branded Sweet Treat Line’s products, which each fulfill distinct consumptionoccasions, will continue to make our brand and products more accessible and allow us to participate with greaterfrequency in small and large indulgent occasions.
Expand our omni-channel network in new and existing markets
We will continue to leverage our proven omni-channel business model to expand our global points of accessto consumers in new countries, cities and communities. From fiscal 2018 through April 4, 2021, we acquired469 franchised shops. Our footprint of company-owned and franchised shops now spans 41 states and the Districtof Columbia in the United States, Canada and 28 other countries around the world. We have additionallyidentified key international whitespace market opportunities that we plan to expand our geographic footprint to,including China, Brazil, and parts of Western Europe. Shops opened in new markets are expected to consist ofcompany-owned shops or entered via franchise operations, as we continue our plans to reduce our number offranchised shops.
The following table presents our global points of access with consumers, by segment and type, as of the endof the first quarter of 2021, first quarter of 2020, fiscal 2020, fiscal 2019 and fiscal 2018, respectively (for moreinformation on global points of access, see “About this Prospectus – Key Performance Indicators”):
Global Points of Access(1)
Quarters Ended Fiscal Years Ended
April 4,2021
March 29,2020
January 3,2021
December 29,2019
December 30,2018
U.S. and Canada:Hot Light Theater Shops . . . . . . . . . . . . . . . . 236 176 229 175 131Fresh Shops . . . . . . . . . . . . . . . . . . . . . . . . . . 59 47 47 45 25Cookie Shops . . . . . . . . . . . . . . . . . . . . . . . . 191 174 184 168 146DFD doors (2) . . . . . . . . . . . . . . . . . . . . . . . . . 4,712 2,032(4) 4,137 2,288 2,606
Total . . . . . . . . . . . . . . . . . . . . . . . . . . 5,198 2,429 4,597 2,676 2,908International:
Hot Light Theater Shops . . . . . . . . . . . . . . . . 29 27 28 27 20Fresh Shops . . . . . . . . . . . . . . . . . . . . . . . . . . 350 358 348 365 149DFD doors . . . . . . . . . . . . . . . . . . . . . . . . . . . 2,185 1,773(4) 1,986 1,849 1,730
Total . . . . . . . . . . . . . . . . . . . . . . . . . . 2,564 2,158 2,362 2,241 1,899Market Development: (3)
Hot Light Theater Shops . . . . . . . . . . . . . . . . 111 167 119 166 212Fresh Shops . . . . . . . . . . . . . . . . . . . . . . . . . . 730 706 732 693 872DFD doors (2) . . . . . . . . . . . . . . . . . . . . . . . . . 474 382 465 264 35
Total . . . . . . . . . . . . . . . . . . . . . . . . . . . 1,315 1,255 1,316 1,123 1,119
Total global (as defined) . . . . . . . . . . . . . . . . . . 9,077 5,842 8,275 6,040 5,926
Total Hot Light Theater Shops . . . . . . . . . . . . . . . 376 370 376 368 363Total Fresh Shops . . . . . . . . . . . . . . . . . . . . . . . . . 1,139 1,111 1,127 1,103 1,046Total Cookie Shops . . . . . . . . . . . . . . . . . . . . . . . . 191 174 184 168 146
Total Shops . . . . . . . . . . . . . . . . . . . . . . . . . . . . . 1,706 1,655 1,687 1,639 1,555
Total DFD Doors . . . . . . . . . . . . . . . . . . . . . . . . 7,371 4,187 6,588 4,401 4,371
Total global points of access (as defined) . . . . . 9,077 5,842 8,275 6,040 5,926
(1) Excludes Branded Sweet Treat Line distribution points and legacy wholesale business doors.
73

(2) DFD doors for both the U.S. and Canada and Market Development segments exclude legacy wholesaledoors, which have been declining consistent with our strategy to evolve our legacy wholesale business tofocus on the new DFD model and our new Branded Sweet Treat Line. As of January 3, 2021, December 29,2019, and December 30, 2018, the legacy wholesale doors were 1,508, 4,693 and 4,590 for the U.S. andCanada segment, respectively, and 187, 1,919, and 2,378 for the Market Development segment,respectively. As of April 4, 2021 there were no legacy wholesale doors remaining for the U.S. and Canadaand the Market Development segments.
(3) Includes locations in Japan, which were acquired in December 2020 and are now company-owned. As of theend of the first quarter of fiscal 2021, there were three Hot Light Theater Shops, 45 Fresh Shops and 31DFD doors in Japan operating. As of the end of fiscal 2020, there were three Hot Light Theater Shops, 40Fresh Shops and 24 DFD doors in Japan operating. All remaining points of access in the MarketDevelopment segment relate to our franchisee business.
(4) DFD doors are determined as those with sales in the last seven days at the end of each period. Due totemporary closures related to the COVID-19 pandemic there was a decline in DFD doors as of the end of thefirst quarter of fiscal 2020 compared to the end of fiscal 2019.
We believe that our opportunities for geographic expansion and increased points of access with willingbuyers are extensive and will drive sales growth, as recognition of our brand among consumers is substantiallygreater than their access to our shops and other points of sale.
Our total global points of access expanded as of the end of each fiscal year from 2018 to 2020 and for thefirst quarter of fiscal 2021. This expansion was driven by organic growth of our doughnut shops, which is asignificant driver of our revenue growth, and growth of our DFD doors in the United States as part of theevolution of our legacy DFD business. New shop growth and DFD door growth was offset by the phase out ofour legacy wholesale business which caused door reductions from 2018 to 2020 which are not included in thetable above as our legacy DFD business has been largely exited and is not part of our future business strategy.
We plan to continue adding new DFD locations, growing from our current network of over 4,700 third-partyretail locations through our U.S. and Canada segment and in over 2,100 such locations through our Internationalsegment (mainly in the U.K./Ireland and Australia), to expand the availability of our products to consumers,regardless of where they shop. Though not as accretive to sales growth as shops, we believe the strategy of DFDexpansion to reach new customers is important to the long-term penetration of our brand and products in newmarkets. We have recently commenced our DFD offering in additional international markets, including Mexico,Japan and South Africa, which we believe creates an attractive long-term incremental growth opportunity. Wealso recently launched our Branded Sweet Treat Line, providing consumers with what we believe to be a superiorline of packaged, shelf-stable products. We intend to continue to expand the distribution of our Sweet TreatLine’s products across the United States. In connection with such expansion plans we have invested in twomanufacturing sites, one third-party and one company-owned, where we produce Branded Sweet Treat Lineproducts for sale in the United States. We expect to make further capital expenditures as our Branded SweetTreat Line increases in scale, which may include investing in additional production capacity.
We believe our Hub & Spoke approach, which is designed to support gradual urban and regional growth,offers lower risk opportunities to scale our presence in both existing and new markets. To continue to expand ourglobal points of access effectively, we intend to invest in new Hubs that provide opportunity for expandeddoughnut production and distribution where the demand exists and can continue to develop through opening ofadditional points of access. We plan to open new Hot Light Theater Shops in strategic locations to fuel growthacross our other shops and distribution channels and to selectively grow our footprint in new and existinginternational markets, both through new company-owned shops and new franchises or majority-stakepartnerships. In addition to Hot light Theater Shops we believe that opening Doughnut Factories in key urbanmarkets will help scale our presence through expanding our capacity to produce doughnuts for the various pointsof access with consumers. The larger scale production and capacity of Doughnut Factories provides anopportunity to enhance supply and demand agility, realize efficiencies in labor and production expenses and seeklower rent locations for these non-customer facing production sites.
74

The average new Hot Light Theater Shop takes approximately 60 weeks from lease signing to shop opening.The construction phase typically requires 10 to 36 weeks and costs between $2.4 million and $4.3 million, withthe high end driven by differences in regional labor cost. Construction time and cost for shops supported by theHot Light Theater Shop vary by location and shop type. For example, an urban inline Fresh Shop requires six to40 weeks from signing to opening and we expect cost to build will be between $0.2 million and $1.5 million. Wework with an established network of general contractors with direct oversight from our internal constructionteam.
The following table presents our Hubs, by segment and type, as of the end of each of the first quarter of2021, the first quarter of 2020, fiscal 2020, fiscal 2019 and fiscal 2018, respectively:
Quarters Ended Fiscal Years Ended
April 4,2021
March 29,2020
January 3,2021
December 29,2019
December 30,2018
U.S. and Canada:Hot Light Theater Shops (1) . . . . . . . . . . . . . . . . . 232 175 226 174 130Doughnut Factories . . . . . . . . . . . . . . . . . . . . . . . 5 6 5 6 6
Total . . . . . . . . . . . . . . . . . . . . . . . . . . . . . . 237 181 231 180 136Hubs with Spokes (as defined) . . . . . . . . . . . . . . 113 88 113 76 53
International:Hot Light Theater Shops (1) . . . . . . . . . . . . . . . . . 27 27 27 27 18Doughnut Factories . . . . . . . . . . . . . . . . . . . . . . . 11 9 9 9 7
Total . . . . . . . . . . . . . . . . . . . . . . . . . . . . . . 38 36 36 36 25Hubs with Spokes (as defined) . . . . . . . . . . . . . . 38 36 36 36 25
Market Development:Hot Light Theater Shops (1) . . . . . . . . . . . . . . . . . 110 164 116 163 211Doughnut Factories . . . . . . . . . . . . . . . . . . . . . . . 25 25 26 26 26
Total . . . . . . . . . . . . . . . . . . . . . . . . . . . . . . 135 189 142 189 237
Total Hubs (as defined) . . . . . . . . . . . . . . . . . . . . . . 410 406 409 405 398
(1) Hub counts include only Hot Light Theater Shops and do not include Mini Theaters.
For more information about Hubs, see “About this Prospectus – Key Performance Indicators.”
We utilize certain non-GAAP financial measures to assist in measuring the utilization of assets in our Huband Spoke model. One such key key performance indicator is Fresh Revenue per Average Hub with Spokes,which is calculated using Fresh Revenue with Spokes divided by the average number of Hubs with Spokes inoperation during the period. For a description of Fresh Revenue from Hubs with Spokes, and Fresh Revenue perAverage Hub with Spokes, see “About this Prospectus — Non-GAAP Financial Measures.”
75

Average Fresh Revenue per Hub with Spokes was as follows for each of the periods below:
Fiscal Years Ended
(in thousands)January 3,
2021December 29,
2019December 30,
2018
U.S. and Canada:Revenue . . . . . . . . . . . . . . . . . . . . . . . . . . . . . . $ 782,717 $ 587,522 $ 443,563Non-Fresh Revenue (1) . . . . . . . . . . . . . . . . . . . (128,619) (112,051) (125,684)Fresh Revenue from Insomnia and Hubs
without Spokes (2) . . . . . . . . . . . . . . . . . . . . . (323,079) (271,067) (156,778)
Fresh Revenue from Hubs with Spokes . . . . . . . 331,019 204,404 161,101Fresh Revenue per Average Hub with Spokes
(millions) . . . . . . . . . . . . . . . . . . . . . . . . . . . . . . . $ 3.5 $ 3.2 $ 3.1International:
Fresh Revenue from Hubs with Spokes (3) . . . . . 230,185 223,115 185,840Fresh Revenue per Average Hub with Spokes
(millions) . . . . . . . . . . . . . . . . . . . . . . . . . . . . . . . $ 6.4 $ 8.3 $ 7.6
(1) Includes legacy wholesale business revenue and Branded Sweet Treat Line revenue.(2) Includes Insomnia revenue and Fresh Revenue generated by Hubs without Spokes.(3) Total International net revenue is equal to Fresh Revenue from Hubs with Spokes for that business segment.
Our U.S. market had undergone a transformation of our legacy wholesale business to DFD doors. As shownabove, Fresh Revenue from Hubs with Spokes equals the Fresh Revenue derived from those Hubs currentlyproducing product sold through Fresh Shops and/or DFD doors, but excluding Fresh Revenue derived from thoseHubs not currently producing product sold through Fresh Shops and/or DFD doors. In the United States andCanada there are still Hubs not currently producing products sold through Fresh Shops and/or DFD doors and aretherefore excluded from Fresh Revenue from Hubs with Spokes. Our International segment was originallyestablished where all Hubs produced product sold through Fresh Shops and/or DFD doors and are therefore allincluded in Fresh Revenue from Hubs with Spokes.
In addition, we have substantially expanded our digital sales, which accounted for approximately 10.8% and18.4% of U.S. retail sales in fiscal 2019 and 2020, respectively. For example, we are continuing to invest in ourweb- and app-based platforms and leveraging third-party last-mile logistics to expand our consumer reach. Weapplied the lessons learned from the acquisition and operation of our Insomnia brand, which had over 50% of itssales derived from e-Commerce, to accelerate our digital expansion in response to the challenges posed by theCOVID-19 pandemic, resulting in substantial organic revenue growth in our U.S. and Canada segment. We willcontinue to invest in further digital innovation and expansion and believe this channel will continue to grow inimportance.
Continue to Grow Insomnia
We intend to continue to build the presence of Insomnia’s platform in existing and new markets. We intendto leverage Insomnia’s dedicated following and expand its platform with younger consumers, growing itscommunity of “Insomniacs” who love its crave-worthy products. With a “imagine what’s possible” mindset atthe core of this brand, Insomnia plans to continue to expand its brand reach beyond college markets intoadditional major metropolitan communities, leveraging internal delivery capabilities to continue to build out itsomni-channel network. Furthermore, with 54% of Insomnia’s sales coming from e-Commerce for fiscal 2020, wewill continue to invest in expanding its digital audience and brand reach through extended delivery andnationwide shipping opportunities. We believe Insomnia’s delivery and digital capabilities keep it agile andcontinue to enable sales acceleration in the United States – as evidenced by the addition of 17 new shops in fiscal2020 and the opening of seven new shops in the first quarter of 2021.
76

Drive Additional Efficiency Benefits from Our Omni-Channel Execution
We are making focused investments in our omni-channel strategy to expand our presence efficiently whiledriving top-line growth and margin expansion. The Hub & Spoke model enables an integrated approach tooperations, which is designed to bring efficiencies in production, distribution and supervisory management whileensuring product freshness and quality are consistent with our brand promise no matter where customersexperience our doughnuts. To support the Hub & Spoke model in the United States, we are implementing newlabor management systems and processes in our shops and new delivery route optimization technology to supportour DFD logistics chain. In addition, we are launching a new demand planning system that is intended toimprove service and to deliver both waste and labor efficiencies across all of our business channels, includingproduction of our Branded Sweet Treat Line. We are also continuing to invest in our manufacturing capabilitiesto support growth of our Branded Sweet Treat Line by implementing new packing automation technology, whichis intended to significantly increase productivity through labor savings and increased capacity.
Components of Revenues and Expenses
Product sales
Product sales include revenue derived from (1) the sale of doughnuts, cookies and complementary productson-premises and to DFD and Branded Sweet Treat Line customers and (2) the sale of doughnut mix, otheringredients and supplies and doughnut-making equipment to our franchisees.
Royalties and other revenues
Royalties and other revenues are derived primarily from ongoing royalties and advertising fees charged tofranchisees, which are based on a percentage of franchisee net sales, development and initial franchise feesrelating to franchise rights and new shop openings, and other revenue, including licensing revenues from ourarrangement with Keurig for use in the manufacturing of portion packs for the Keurig brewing system.
Product and distribution costs
Product and distribution costs includes mainly raw material (principally sugar, flour, wheat, oil and theirderivatives) and production costs (including labor) related to doughnuts, cookies, other sweet treats, doughnutmix, packaging, and logistics costs related to raw materials.
Operating expenses
Operating expenses consist of expenses primarily related to company-operated shops including payroll andbenefit costs for service employees at company-operated locations, Hub & Spoke driver and delivery costs, rentand utilities, expenses associated with company operations, costs associated with procuring materials fromsuppliers and other shop-level operating cost.
Selling, general and administrative expenses
Selling, general and administrative expenses, or SG&A, include management and support personnel(including field personnel in corporate support functions), including salaries and benefits (including share-basedcompensation), marketing and advertising costs, travel, compliance, information technology and professionalfees. We expect our operating expenses to increase in future periods, particularly as we continue to expand ouroperations globally, develop new products and enhancements for existing products and as we begin to operate asa public company, including as a result of costs to comply with the rules and regulations applicable to companieslisted on a national securities exchange, costs related to compliance and reporting obligations pursuant to therules and regulations of the SEC, increased share based compensation expense related to grants of options topurchase shares of our common stock and restricted stock units to certain of our employees and directors in thesecond quarter of 2021, and increased expenses for insurance, investor relations and accounting expense.
77

Pre-opening costs
Pre-opening costs include labor, rent, utilities and other expenses that are required as part of the setup anduse of a new shop, prior to generating sales. Pre-opening costs also include costs to integrate acquired franchisesback into the company-owned model, which typically occur with the relevant shop closed over a one to three-dayperiod subsequent to acquisition. Pre-opening costs do not include expenses related to strategic planning (forexample, new site lease negotiations), which are recorded in SG&A.
Other expenses, net
Other expenses, net include asset impairment charges, shop closing costs, gain or loss on disposal of assets,and other miscellaneous expenses and income.
Depreciation and amortization expense
Depreciation and amortization expense include depreciation of fixed assets and amortization of intangibleassets which do not have indefinite lives.
Income tax expense
We utilize the liability method of accounting for income taxes. Under the liability method, deferred taxesare determined based on the temporary differences between the financial statement and tax basis of assets andliabilities using tax rates expected to be in effect during the years in which the basis differences reverse. Avaluation allowance is recorded when it is more likely than not that some of the deferred tax assets will not berealized. We recognize the effect of income tax positions only if those positions are more likely than not of beingsustained. Potential accrued interest and penalties related to unrecognized tax benefits within operations arerecognized as a component of interest expense and other expenses.
Results of Operations
The following comparisons are historical results and are not indicative of future results which could differmaterially from the historical financial information presented.
Quarter ended April 4, 2021 compared to the Quarter ended March 29, 2020
The following table presents our unaudited condensed consolidated results of operations for Q1 2021 andQ1 2020:
Quarters Ended
April 4, 2021 March 29, 2020
(in thousands except percentages) % ofRevenue
% ofRevenue
ChangeAmount Amount $ %
Net revenue . . . . . . . . . . . . . . . . . . . . . . . . . . . . . . . . .Product sales . . . . . . . . . . . . . . . . . . . . . . . . . . . . . . . . $313,585 97.4% $251,536 96.3% $62,049 24.7%Royalties and other revenues . . . . . . . . . . . . . . . . . . . 8,224 2.6% 9,680 3.7% (1,456) -15.0%
Total net revenues . . . . . . . . . . . . . . . . . . . . . . . . . . . 321,809 100.0% 261,216 100.0% 60,593 23.2%Product and distribution costs . . . . . . . . . . . . . . . . . . . 79,997 24.9% 68,148 26.1% 11,849 17.4%Operating expenses . . . . . . . . . . . . . . . . . . . . . . . . . . . 147,541 45.8% 115,779 44.3% 31,762 27.4%Selling, general and administrative expense . . . . . . . . 59,044 18.3% 49,196 18.8% 9,848 20.0%Pre-opening costs . . . . . . . . . . . . . . . . . . . . . . . . . . . . 1,391 0.4% 3,437 1.3% (2,046) -59.5%Other (income)/expenses, net . . . . . . . . . . . . . . . . . . . (3,245) -1.0% 1,171 0.4% (4,416) -377.1%Depreciation and amortization expense . . . . . . . . . . . 23,401 7.3% 19,087 7.3% 4,314 22.6%
Operating income . . . . . . . . . . . . . . . . . . . . . . . . . . . 13,680 4.3% 4,398 1.7% 9,282 211.1%
78

Quarters Ended
April 4, 2021 March 29, 2020
(in thousands except percentages) % ofRevenue
% ofRevenue
ChangeAmount Amount $ %
Interest expense, net . . . . . . . . . . . . . . . . . . . . . . . . . . 8,249 2.6% 8,644 3.3% (395) -4.6%Interest expense – related party . . . . . . . . . . . . . . . . . . 5,566 1.7% 5,566 2.1% — 0.0%Other non-operating (income)/expense, net . . . . . . . . (442) -0.1% 2,548 1.0% (2,990) -117.3%
Income/(loss) before income taxes . . . . . . . . . . . . . . 307 0.1% (12,360) -4.7% 12,667 102.5%Income tax expense/(benefit) . . . . . . . . . . . . . . . . . . . 685 0.2% (1,412) -0.5% 2,097 148.5%
Net loss . . . . . . . . . . . . . . . . . . . . . . . . . . . . . . . . . . . . (378) -0.1% (10,948) -4.2% 10,570 96.5%Net income attributable to noncontrolling interest . . . 2,683 0.8% 567 0.2% 2,116 373.2%
Net loss attributable to Krispy Kreme, Inc. . . . . . . $ (3,061) -1.0% $ (11,515) -4.4% $ 8,454 73.4%
Product sales: Product sales increased $62.0 million, or 24.7%, from Q1 2020 to Q1 2021. Approximately$34.6 million of the increase in product sales was attributable to shops acquired from franchisees.
Royalties and other revenues: Royalties and other revenues decreased $1.5 million, or 15.0%, from Q1 2020to Q1 2021, reflecting the impact of the acquisition of KK Japan in December 2020, as well as the impact ofcertain COVID-19 restrictions in key international markets where there were shop closures and reduced traffic,resulting in lower royalties.
The following table presents a further breakdown of total net revenue and organic revenue growth bysegment for the periods indicated:
(in thousands except percentages)U.S. andCanada International
MarketDevelopment
TotalCompany
Total net revenues Q1 2021 . . . . . . . . . . . . . . . $222,470 $66,506 $32,833 $321,809Total net revenues Q1 2020 . . . . . . . . . . . . . . . 170,450 60,659 30,107 261,216
Total Net Revenue Growth . . . . . . . . . . . . . . . 52,020 5,847 2,726 60,593Total Net Revenue Growth % . . . . . . . . . . . . 30.5% 9.6% 9.1% 23.2%Impact of acquisitions . . . . . . . . . . . . . . . . . . . . (31,705) — (2,139) (33,844)Impact of foreign currency translation . . . . . . . — (4,963) — (4,963)Impact of 53rd Week . . . . . . . . . . . . . . . . . . . . . — — — —
Organic Revenue Growth . . . . . . . . . . . . . . . . $ 20,315 $ 884 $ 587 $ 21,786
Organic Revenue Growth% . . . . . . . . . . . . . . 11.9% 1.5% 1.9% 8.3%
U.S. and Canada segment net revenue growth, which reflects franchise acquisitions (17 shops in the firstquarter of fiscal 2021 and 51 shops in the second half of fiscal 2020), was also driven by strong net revenuegrowth and organic revenue growth. U.S. and Canada net revenue grew $52.0 million, or approximately, 30.5%,from Q1 2020 to Q1, 2021 and U.S. and Canada organic revenue grew $20.3 million, or approximately 11.9%,from Q1 2020 to Q1 2021, driven mainly by our adaptation to changing consumer behavior in response to theCOVID-19 pandemic as well as new Krispy Kreme and Insomnia shop openings. U.S. and Canada segment netrevenue growth was also driven by the expansion of our digital and delivery channels (with delivery transactionsconsidered 82% incremental to in-shop transactions in fiscal 2020) and social media and other marketingcampaigns (such as “Acts of Joy”) that delivered over 38 billion media impressions in fiscal 2020, while onlycosting approximately $12.0 million. As COVID-19 restrictions began to ease in certain areas in the first quarterof fiscal 2021, these positive trends were amplified by the contrasting impact of shop closures and slowdown inconsumer foot traffic in response to the COVID-19 pandemic in the first quarter of fiscal 2021. In addition, thelaunch of our Branded Sweet Treat Line with Walmart in June of 2020 as well as the addition of several newcustomers in the first quarter of fiscal 2021 provided additional net revenue and organic revenue growth whichwe expect to continue to grow as we expand this business to new customers and channels. Our strategicexpansion of the DFD programs also contributed to net revenue and organic revenue growth with added points of
79

access, but was more than offset by a $26.1 million decline in revenue from our legacy wholesale business,reflecting the evolution of the DFD business and the discontinuance of certain legacy extended shelf-lifeproducts sold through that channel. Throughout 2021, we will continue to see expansion of new fresh points ofaccess, but they will be largely offset, and in many cases more than offset, by the exit of the legacy wholesalebusiness which occurred mostly through the back half of 2020.
Our International segment net revenue growth in the first quarter of fiscal 2021 reflected positive impact offoreign currency translation and 9.6% net revenue growth and 1.5% organic revenue growth. Despite ongoingCOVID-19 restrictions in place, our international markets experienced a partial rebound in the first quarter offiscal 2021, helped by our continued increase in global e-Commerce penetration as we benefited from thefavorable COVID-related shift in consumer behavior. The impact from the rebound was amplified by the impactof the COVID-19 pandemic in the first quarter of fiscal 2021, particularly in the U.K./Ireland. U.K./Ireland’sexpansion of DFD doors also contributed to the U.K./Ireland market’s partial rebound.
Our Market Development segment growth in the first quarter of fiscal 2021 from the first quarter of fiscal2020 mainly reflects the impact from the acquisition of KK Japan. The 9.1% net revenue growth and 1.9%organic revenue growth was driven by improved market conditions for international franchise locations asCOVID-19 restrictions in certain key markets began to ease.
Product and distribution costs (exclusive of depreciation and amortization): Product and distribution costsincreased $11.8 million, or 17.4%, from Q1 2020 to Q1 2021, largely in line with and attributable to the samefactors as our revenue growth.
Product and distribution costs as a percentage of revenue decreased by approximately 120 basis points from26.1% in the first quarter of fiscal 2020 to 24.9% in the first quarter of fiscal 2021. This decrease was primarilydriven by our U.S. and Canada franchise business, where the timing of certain lower margin machinery andequipment sales to franchisees in the first quarter of fiscal 2020 contributed to the higher comparative cost as apercentage of revenue.
Operating expenses: Operating expenses increased $31.8 million, or 27.4%, from Q1 2020 to Q1 2021,driven mainly by franchise acquisitions and new shop openings.
Operating expenses as a percentage of revenue increased approximately 150 basis points, from 44.3% in thefirst quarter of fiscal 2020 to 45.8% in the first quarter of fiscal 2021, driven mainly by the impact of franchiseeacquisitions, which results in additional operating expenses which are needed to run company-owned operationsversus franchises. This was particularly evident in the Market Development segment where the acquisition of KKJapan contributed to an increase of approximately $6.0 million of operating expenses. The increase in operatingexpenses as a percentage of revenue was partially offset by the COVID-19 impacts on our U.K./Ireland andInsomnia businesses in the first quarter of fiscal 2020. In the first quarter of fiscal 2020, U.K./Ireland continuedto incur fixed cost despite shutdowns; at the same time, Insomnia incurred costs amidst college shutdowns due tothe business’ historical reliance on college campuses.
Selling, general and administrative expense: Selling, general and administrative (SG&A) expensesincreased $9.8 million, or 20.0%, from Q1 2020 to Q1 2021. The increase was driven mainly by SG&A expensesincurred by franchise shops acquired subsequent to the first quarter of fiscal 2020 ($3.6 million) as well as costsrelated to the preparation for our initial public offering ($3.5 million). As a percentage of revenue, SG&Adecreased by approximately 50 basis points, from 18.8% in the first quarter of fiscal 2020 to 18.3% in the firstquarter of fiscal 2021, largely reflecting cost savings measures in response to the COVID-19 pandemic andstronger leverage of SG&A costs as net revenue continues to increase.
Pre-opening costs: Pre-opening costs decreased $2.0 million, or 59.5%, from Q1 2020 to Q1 2021,primarily driven by $2.6 million pre-opening expenses (including $1.4 million of occupancy expenses)associated with our expansion in NYC in the first quarter of fiscal 2020, including expenses incurred as weprepared for the opening of our New York City flagship Hot Light Theater Shop later in 2020.
80

Other (income)/expenses: Other income, net of $3.3 million in the first quarter of fiscal 2021 was primarilydriven by one-time COVID-related business interruption insurance proceeds of approximately $3.5 million in theU.K./Ireland in the first quarter of fiscal 2021.
Depreciation and amortization expense: Depreciation and amortization expense increased $4.3 million, or22.6%, from Q1 2020 to Q1 2021, primarily driven by the impact of acquired franchises and depreciationresulting from increased capital expenditures.
Other non-operating (income)/expense, net: Other non-operating expense, net of $2.5 million in the firstquarter of fiscal 2021 was primarily driven by an unrealized loss on a commodity derivative instrument as fuelprices fell globally.
Income tax expense/(income): Income tax expense of $0.7 million in the first quarter of fiscal 2021 wasdriven by the mix of income between the U.S. and foreign jurisdictions, as well as minor discrete itemsrecognized in the quarter.
Net income attributable to noncontrolling interest: Net income attributable to noncontrolling interest for thefirst quarter of fiscal 2021 increased $2.1 million, or 373.2%, from the first quarter of fiscal 2020, reflectingstronger earnings allocated to the shareholders of consolidated subsidiaries KKHI and Insomnia driven byimprovements in our overall company performance.
Results of Operations by Segment – quarter ended April 4, 2021 compared to quarter ended March 29, 2020
The following table presents Adjusted EBITDA by segment for the periods indicated:
Quarters Ended Change
(in thousands except percentages) April 4, 2021 March 29, 2020 $ %
Adjusted EBITDA . . . . . . . . . . . . . . . . . . . . . . . . . .U.S. and Canada . . . . . . . . . . . . . . . . . . . . . . . . . . . . . $27,563 $21,637 $5,926 27.4%International . . . . . . . . . . . . . . . . . . . . . . . . . . . . . . . . 15,348 11,193 4,155 37.1%Market Development . . . . . . . . . . . . . . . . . . . . . . . . . 10,891 10,705 186 1.7%Corporate . . . . . . . . . . . . . . . . . . . . . . . . . . . . . . . . . . (7,399) (7,091) (308) -4.3%
Total Adjusted EBITDA (1) . . . . . . . . . . . . . . . . . . . $46,403 $36,444 $9,959 27.3%
(1) Refer to “Prospectus Summary – Summary Historical Consolidated Financial Information” above for areconciliation of Adjusted EBITDA to net loss.
U.S. and Canada Adjusted EBITDA increased $5.9 million, or 27.4%, from Q1 2020 to Q1 2021, primarilydriven by the sales increase of 30.5%. Approximately $1.4 million of this growth was driven by the adverseimpacts of the COVID-19 pandemic on our U.S. and Canada segment, particularly on Insomnia, in the firstquarter of fiscal 2020 due to the early shutdown of almost all college campuses. Adjusted EBITDA margin wasessentially flat. Adjusted EBITDA profitability improved at both Krispy Kreme and Insomnia company-ownedshops, driven by strong revenue growth. EBITDA flow through from U.S. and Canada Krispy Kreme andInsomnia in the first quarter of fiscal 2021 was offset by incremental costs from our New York City market entryand Branded Sweet Treat Line (initiatives which currently have higher operational expenses compared to theprior comparative quarter that have not yet been absorbed by the sales generated).
International Adjusted EBITDA increased $4.2 million, or 37.1%, from Q1 2020 to Q1 2021, primarily due tothe U.K./Ireland one-time insurance proceeds ($3.5 million) which helped to offset continued COVID-19 impacts inour international segment, particularly the U.K./Ireland business. The increase in Adjusted EBITDA as well as theimprovement in Adjusted EBITDA profitability were further amplified by the adverse impacts of the COVID-19pandemic on our international markets, particularly in the U.K./Ireland, during the first quarter of fiscal 2020.
Market Development Adjusted EBITDA margin declined from Q1 2020 to Q1 2021 due to change in mixbetween company-owned and franchise shops resulting from the acquisition of KK Japan.
81

Fiscal 2020 compared to fiscal 2019
The following table presents our audited consolidated results of operations for fiscal 2020 and 2019:
Fiscal Years Ended Change
(in thousands except percentages) January 3, 2021 December 29, 2019
Amount% of
Revenue Amount% of
Revenue $ %
Net revenueProduct sales . . . . . . . . . . . . . . . . . . . . . . . . . . . $1,085,110 96.7% $912,805 95.1% $172,305 18.9%Royalties and other revenues . . . . . . . . . . . . . . . 36,926 3.3% 46,603 4.9% (9,677) -20.8%
Total net revenues . . . . . . . . . . . . . . . . . . . . . . 1,122,036 100.0% 959,408 100.0% 162,628 17.0%Product and distribution costs . . . . . . . . . . . . . . 310,909 27.7% 262,013 27.3% 48,896 18.7%Operating expenses . . . . . . . . . . . . . . . . . . . . . . 488,061 43.5% 390,849 40.7% 97,212 24.9%Selling, general and administrative expense . . . 216,317 19.3% 190,237 19.8% 26,080 13.7%Pre-opening costs . . . . . . . . . . . . . . . . . . . . . . . 11,583 1.0% 7,078 0.7% 4,505 63.6%Other expenses . . . . . . . . . . . . . . . . . . . . . . . . . . 10,488 0.9% 7,465 0.8% 3,023 40.5%Depreciation and amortization expense . . . . . . 80,398 7.2% 63,767 6.6% 16,631 26.1%
Operating income . . . . . . . . . . . . . . . . . . . . . . 4,280 0.4% 37,999 4.0% (33,719) -88.7%Interest expense, net . . . . . . . . . . . . . . . . . . . . . 34,741 3.1% 38,085 4.0% (3,343) -8.8%Interest expense – related party . . . . . . . . . . . . . 22,468 2.0% 21,947 2.3% 520 2.4%Other non-operating (income)/expense, net . . . (1,101) -0.1% (609) -0.1% (492) -80.8%
Loss before income taxes . . . . . . . . . . . . . . . . (51,828) -4.6% (21,424) -2.2% (30,404) -141.9%Income tax expense . . . . . . . . . . . . . . . . . . . . . . 9,112 0.8% 12,577 1.3% (3,465) -27.6%
Net loss . . . . . . . . . . . . . . . . . . . . . . . . . . . . . . . (60,940) -5.4% (34,001) -3.5% (26,939) -79.2%Net income attributable to noncontrolling
interest . . . . . . . . . . . . . . . . . . . . . . . . . . . . . . 3,361 0.3% 3,408 0.4% (47) -1.4%
Net loss attributable to Krispy Kreme,Inc. . . . . . . . . . . . . . . . . . . . . . . . . . . . . . . . . . $ (64,301) -5.7% $ (37,409) -3.9% $ (26,892) -71.9%
Product sales: Product sales increased $172.3 million, or 18.9%, from fiscal 2019 to fiscal 2020.Approximately $135.2 million of the increase in product sales was attributable to shops acquired fromfranchisees and approximately $19.4 million was driven by an additional week in fiscal 2020 compared to fiscal2019.
Royalties and other revenues: Royalties and other revenues decreased $9.7 million, or 20.8%, from fiscal2019 to fiscal 2020, reflecting the impact of franchise acquisitions, mainly in Mexico, and the COVID-19pandemic and the related shop closures and reduced traffic at numerous international franchise locations, whichresulted in lower royalties, partially offset by an increase of $1.6 million, driven by an additional week in fiscal2020 compared to fiscal 2019.
82

The following table presents a further breakdown of total net revenue and organic revenue growth bysegment for the periods indicated:
(in thousands except percentages) U.S. and Canada International Market Development Total Company
Total net revenues Fiscal 2020 . . . . . . $ 782,717 $230,185 $109,134 $1,122,036Total net revenues Fiscal 2019 . . . . . . 587,522 223,115 148,771 959,408
Total net revenue growth . . . . . . . 195,195 7,070 (39,637) 162,628Total net revenue growth % . . . . . 33.2% 3.2% -26.6% 17.0%
Impact of acquisitions . . . . . . . (121,671) (42,811) 35,053 (129,429)Impact of foreign currency
translation . . . . . . . . . . . . . . (906) (906)Impact of 53rd Week . . . . . . . . (15,615) (3,287) (1,603) (20,505)
Organic revenue growth . . . . . . . . $ 57,909 $ (39,934) $ (6,187) $ 11,789
Organic revenue growth % . . . . . . . 9.9% -17.9% -4.2% 1.2%
U.S. and Canada segment growth, which reflected franchise acquisitions (51 shops in fiscal 2020 and 58shops in fiscal 2019, of which 36 were acquired in November 2019), was also driven by strong net revenuegrowth and organic revenue growth. U.S. and Canada net revenue grew $195.2 million, or approximately 33.2%from fiscal 2019 to fiscal 2020 and U.S. and Canada organic revenue grew $57.9 million, or approximately 9.9%,from fiscal 2019 to fiscal 2020, driven mainly by new Krispy Kreme and Insomnia shop openings and ouradaptation to changing consumer behavior in response to the COVID-19 pandemic, including the expansion ofour digital and delivery channels and social media campaigns such as “Acts of Joy.” In addition, the launch ofour Branded Sweet Treat Line with Walmart in June of 2020 provided additional net revenue and organicrevenue growth which we expect to continue to grow as we expand this business to new customers and channels.These positive trends were partially offset by a $26.2 million decline in revenue from our legacy wholesalebusiness, reflecting evolution of the DFD business and the discontinuance of certain legacy extended shelf-lifeproducts sold through that channel. Organic growth was uneven during fiscal 2020, with our slowest growth inthe first fiscal quarter of 2020, reflecting the impact of shop closures and slowdown in consumer foot traffic inresponse to the COVID-19 pandemic in March, and our strongest growth was in the third fiscal quarter of 2020,reflecting a pick-up in digital and delivery channel sales and our Branded Sweet Treat Line’s product launch inJune 2020.
Our International segment growth in fiscal 2020 reflected the acquisition of 231 franchise shops in Mexicoin November 2019 with an increase in net revenue of 3.2%, but was mostly offset by our organic performance,which declined by 17.9%. The organic revenue decline was due to the impact of the COVID-19 pandemic,particularly in the U.K./Ireland, where organic product sales declined by $29.0 million year-over-year as a resultof extended government-mandated closures, including a nationwide shutdown lasting approximately six weeks inthe second fiscal quarter and select shop shutdowns in the fourth fiscal quarter in fiscal 2020. Our Internationalsegment organic revenue declined by 44% in the second fiscal quarter of 2020 compared to the first fiscal quarterof 2020 and while sales have improved gradually since, we have yet to reach pre-pandemic organic sales levels.
Our Market Development segment, which is primarily comprised of franchised shops, contracted due to thelost revenue from the acquisition of 51 and 58 U.S. franchise shops in fiscal 2020 and fiscal 2019, respectively,and 231 franchise shops in Mexico in November of 2019. The 26.6% net revenue decline and 4.2% organicrevenue decline was due to the impact of the COVID-19 pandemic and the related shop closures and reducedtraffic at numerous international franchise locations, particularly in Middle East and Asia Pacific regions, whichresulted in lower royalties and fees and decreased sales of supplies to franchisees.
Product and distribution costs (exclusive of depreciation and amortization): Product and distribution costsincreased $48.9 million, or 18.7%, from fiscal 2019 to fiscal 2020, largely in line with and attributable to thesame factors as our revenue growth.
83
Product and distribution costs as a percentage of revenue increased by approximately 40 basis points from27.3% in fiscal 2019 to 27.7% in fiscal 2020. This increase was primarily driven by the change in mix betweencompany-owned and franchise shops, as our margins for company-owned shops are substantially lower than forfranchise shops, despite contributing substantially more to our profits in dollar terms. Costs related to our legacywholesale business evolution contributed $3.5 million of the increase in product and distribution costs in fiscal2020, mainly reflecting inventory losses due to the obsolescence of discontinued products and higher productionlabor costs. Raw material costs remained relatively stable from fiscal 2019 to fiscal 2020.
Operating expenses: Operating expenses increased $97.2 million, or 24.9%, from fiscal 2019 to fiscal 2020,driven mainly by franchise acquisitions. The additional week in fiscal 2020 contributed approximately$8.7 million to the increase.
Operating expenses as a percentage of revenue increased approximately 280 basis points, from 40.7% infiscal 2019 to 43.5% in fiscal 2020, driven mainly by added sanitation and safety measures in response to theCOVID-19 pandemic ($8.2 million) and DFD evolution ($2.6 million). As a substantial portion of operatingexpenses are fixed, the impact of the COVID-19 pandemic resulting in shop closures across our Internationalsegment operations did not result in a material operating expense reduction, though we took measures across theglobe to partially offset the negative impact of the COVID-19 pandemic, including temporary staffing reductionsand rent abatements, mainly in international markets.
Selling, general and administrative expense: Selling, general and administrative (SG&A) expensesincreased $26.0 million, or 13.7%, from fiscal 2019 to fiscal 2020. The increase was driven mainly by anincrease in third-party consulting and advisory fees related to strategic initiatives in fiscal 2020, mainly ourlegacy wholesale business evolution ($5.9 million), costs related to the preparation for our initial public offering($3.2 million), the additional week in fiscal 2020 ($2.9 million) and higher spend on our digital platform. As apercentage of revenue, SG&A decreased by approximately 50 basis points, from 19.8% in fiscal 2019 to 19.3%in fiscal 2020, largely reflecting cost savings measures in response to the COVID-19 pandemic.
Pre-opening costs: Pre-opening costs increased $4.5 million, or 63.6%, from fiscal 2019 to fiscal 2020,primarily driven by a $3.7 million pre-opening rent expense associated with the opening of our New York Cityflagship Hot Light Theater Shop in fiscal 2020 and costs for conversion of acquired franchises.
Other expenses: Other expenses increased $3.0 million, or 40.5%, from fiscal 2019 to fiscal 2020, primarilydriven by higher fixed asset impairment expenses and losses on disposal of assets related to our legacy wholesalebusiness evolution and COVID-19 related shop closures.
Depreciation and amortization expense: Depreciation and amortization expense increased $16.6 million, or26.1%, from fiscal 2019 to fiscal 2020. Approximately $8.4 million and $1.0 million, respectively of the increasein depreciation and amortization expense was attributable to expenses from franchises acquired during fiscal2019 and 2020 and an additional week in fiscal 2020 compared to fiscal 2019. Excluding the impact of acquiredfranchises and the additional week in fiscal 2020, depreciation and amortization expense increased approximately$7.2 million, primarily driven by depreciation resulting from capital expenditures in fiscal 2019 and 2020.
Interest expense, net: Interest expense decreased $3.3 million, or 8.8%,, from fiscal 2019 to fiscal 2020,primarily reflecting the substantial decline in the one-month LIBOR rate in fiscal 2020. See “– Capital Resourcesand Liquidity.”
Interest expense – related party: Interest payable to our related party increased $0.4 million, or 2.4%, fromfiscal 2019 to fiscal 2020, mainly due to an additional week of interest incurred in the 53-week period of fiscal2020 compared to the 52-week period in fiscal 2019.
Income tax expense: Income tax expense decreased $3.5 million, or 27.6%, from fiscal 2019 to fiscal 2020.During fiscal 2020, income tax expense was significantly impacted by the recording of a valuation allowance
84

against state net operating loss carryforwards and federal tax credits as well as the mix of pre-tax earningsbetween different jurisdictions. During fiscal 2019, income tax expense was significantly impacted by therecording of a valuation allowance against U.S. foreign tax credits, the mix of pre-tax earnings between differentjurisdictions, and the impact of uncertain tax positions.
Net income attributable to noncontrolling interest: Net income attributable to noncontrolling interest forfiscal 2020 remained constant at $3.4 million for both fiscal 2019 and fiscal 2020, reflecting improved resultsfrom our U.S. majority-stake partnerships and Insomnia in fiscal 2020, offset by a decline in income frominternational majority-stake partnerships.
Results of Operations by Segment – fiscal 2020 compared to fiscal 2019
The following table presents Adjusted EBITDA by segment for the periods indicated:
Fiscal Years Ended Change
(in thousands except percentages) January 3, 2021December 29,
2019 $ %
Adjusted EBITDAU.S. and Canada . . . . . . . . . . . . . . . . . . . . . . . . . . $ 91,574 $ 71,620 $ 19,954 27.9%International . . . . . . . . . . . . . . . . . . . . . . . . . . . . . 44,554 53,252 (8,698) -16.3%Market Development . . . . . . . . . . . . . . . . . . . . . . 39,060 51,574 (12,514) -24.3%Corporate . . . . . . . . . . . . . . . . . . . . . . . . . . . . . . . (29,754) (30,062) 308 1.0%
Total Adjusted EBITDA (1) . . . . . . . . . . . . . . . . $145,434 $146,384 $ (950) -0.6%
(1) Refer to “Prospectus Summary – Summary Historical Consolidated Financial Information” above for areconciliation of Adjusted EBITDA to net loss.
U.S. and Canada Adjusted EBITDA increased $20.0 million, or 27.9%, from fiscal 2019 to 2020, primarilydriven by the sales increase of 33.2%. Throughout the year, improved Adjusted EBITDA profitability at bothKrispy Kreme and Insomnia company-owned shops was driven by strong revenue growth at existing locations,but partially offset by incremental operating costs, including payroll, related to the COVID-19 pandemic that arereflected within Adjusted EBITDA. Adjusted EBITDA margin was also adversely impacted by Insomnia fromthe late first quarter through the second quarter of fiscal 2020, as almost all college campuses, where a portion ofour Insomnia shops are located, shut down during that time. Incremental expenses incurred for the launch of ourBranded Sweet Treat Line during the year also had a marginally offsetting impact. We continue our efforts toimprove the manufacturing efficiency of our Branded Sweet Treat Line and expect to gain additional scale asnew customers are added in fiscal 2021.
International Adjusted EBITDA declined $8.7 million, or 16.3%, from fiscal 2019 to fiscal 2020, due towidespread impacts of the COVID-19 pandemic on our international markets, particularly in the U.K./Ireland.Additionally, substantial revenue declines were noted in our other company-owned markets, driving an overallorganic revenue decline of 18% for fiscal 2020, with Adjusted EBITDA profitability margins naturally decliningmore than revenue due to our partially fixed cost base. Our international markets were able to achieve a lower coststructure than usual, however, as they leveraged government funding and rent abatements to lower certain fixedcosts and took actions throughout the year to reduce unnecessary spending.
Market Development Adjusted EBITDA declined $12.5 million, or 24.3%, from fiscal 2019 to fiscal 2020due to both the impact of franchisee acquisitions in fiscal 2019 and 2020 as well as the impact of the COVID-19pandemic on our international franchise locations. While U.S. and Canada franchisees preformed reasonably well(largely in line with our U.S. and Canada segment), varied impacts from the COVID-19 pandemic were feltinternationally as many countries were substantially impacted by the COVID-19 pandemic and varyingregulatory responses to the pandemic.
85

Fiscal 2019 compared to fiscal 2018
The following table presents our audited consolidated results of operations for the fiscal years 2019 and2018:
Fiscal Years Ended Change
(in thousands except percentages) December 29, 2019 December 30, 2018
Amount% of
Revenue Amount% of
Revenue $ %
Net revenueProduct sales . . . . . . . . . . . . . . . . . . . . . . . . . . . . . $912,805 95.1% $748,860 94.1% $163,945 21.9%Royalties and other revenues . . . . . . . . . . . . . . . . 46,603 4.9% 47,023 5.9% (420) -0.9%
Total net revenues . . . . . . . . . . . . . . . . . . . . . . . . 959,408 100.0% 795,883 100.0% 163,525 20.5%Product and distribution costs . . . . . . . . . . . . . . . 262,013 27.3% 246,458 31.0% 15,555 6.3%Operating expenses . . . . . . . . . . . . . . . . . . . . . . . . 390,849 40.7% 295,966 37.2% 94,883 32.1%Selling, general and administrative expense . . . . 190,237 19.8% 160,932 20.2% 29,305 18.2%Pre-opening costs . . . . . . . . . . . . . . . . . . . . . . . . . 7,078 0.7% 1,903 0.2% 5,175 271.9%Other expenses . . . . . . . . . . . . . . . . . . . . . . . . . . . 7,465 0.8% 6,708 0.8% 757 11.3%Depreciation and amortization expense . . . . . . . . 63,767 6.6% 49,447 6.2% 14,320 29.0%
Operating income . . . . . . . . . . . . . . . . . . . . . . . . 37,999 4.0% 34,469 4.3% 3,530 10.2%Interest expense, net . . . . . . . . . . . . . . . . . . . . . . . 38,085 4.0% 27,881 3.5% 10,204 36.6%Interest expense—related party . . . . . . . . . . . . . . 21,947 2.3% 18,902 2.4% 3,045 16.1%Other non-operating (income)/expense, net . . . . . (609) -0.1% 5,443 0.7% (6,052) -111.2%
(Loss)/income before income taxes . . . . . . . . . . (21,424) -2.2% (17,757) -2.2% (3,667) -20.7%Income tax expense . . . . . . . . . . . . . . . . . . . . . . . 12,577 1.3% (5,318) -0.7% 17,895 336.5%
Net (loss)/income . . . . . . . . . . . . . . . . . . . . . . . . . (34,001) -3.5% (12,439) -1.6% (21,562) -173.3%Net income attributable to noncontrolling
interest . . . . . . . . . . . . . . . . . . . . . . . . . . . . . . . 3,408 0.4% 1,633 0.2% 1,775 108.7%
Net loss attributable to Krispy Kreme, Inc. . . . $ (37,409) -3.9% $ (14,072) -1.8% $ (23,337) -165.8%
Product sales: Product sales increased $163.9 million, or 21.9%, from fiscal 2018 to fiscal 2019.Approximately $136.2 million of the increase in product sales was attributable to the acquisition of Insomnia inSeptember 2018 and shops acquired from franchisees. The drivers of our $36.3 million in organic revenuegrowth are discussed below.
Royalties and other revenues: Royalties and other revenues decreased $0.4 million, or 0.9%, from fiscal2018 to fiscal 2019, reflecting the impact of franchise acquisitions, mainly in the United States.
The following table presents a breakdown of net revenue and organic revenue growth by segment for theperiods indicated:
U.S. andCanada International
MarketDevelopment Total Company
Total net revenues Fiscal 2019 . . . . . . . . . $ 587,522 $223,115 $148,771 $ 959,408Total net revenues Fiscal 2018 . . . . . . . . . 443,563 185,840 166,480 795,883
Total net revenue growth . . . . . . . . . . . . 143,959 37,275 (17,709) 163,525Total net revenue growth % . . . . . . . . . . 32.5% 20.1% -10.6% 20.5%
Impact of acquisitions . . . . . . . . . . . . (133,249) (23,825) 18,871 (138,203)Impact of foreign currency
translation . . . . . . . . . . . . . . . . . . . — 10,939 — 10,939
Organic revenue growth . . . . . . . . . . . . . $ 10,710 $ 24,389 $ 1,162 $ 36,261
Organic revenue growth % . . . . . . . . . . 2.4% 13.1% 0.7% 4.6%
86

U.S. and Canada segment growth was driven mainly by acquisitions (58 shops in fiscal 2019, 39 KrispyKreme U.S. shops and 135 Insomnia shops in fiscal 2018). Net revenue grew by $144.0 million or 32.5% andorganic revenue grew by $10.7 million, or 2.4%, from fiscal 2018 to fiscal 2019, driven by new Krispy Kremeand Insomnia shop openings and, to a lesser extent, improved sales at company-owned shops. These positiveorganic impacts were mostly offset by a $8.4 million decline in our legacy wholesale business product salesattributable to the commencement of the evolution of DFD, which began by exiting some of the lower volume,less profitable doors.
International segment growth was driven mainly by net revenue growth of $37.3 million or 20.1% andorganic revenue growth of $24.4 million, or 13.1%, from fiscal 2018 to fiscal 2019 driven by new shop openingsin the U.K./Ireland, Australia and New Zealand, increased retail traffic at our U.K./Ireland shops driven byhighly successful promotional campaigns, which drove low double-digit sales increases, the expansion of DFDsales in the U.K./Ireland due to better placement of DFD cabinets in grocery locations and the expansion of DFDsales in New Zealand with a large new customer.
Market Development segment, which is primarily comprised of franchised shops, contracted due to the lostrevenue from the acquisition of 58 U.S. franchise shops in fiscal 2019, as well as the acquisition of 29 franchiseshops in March 2018 in Australia and 231 franchise shops in November 2019 in Mexico. Net revenue decreased10.6% and organic revenue increased 1% from fiscal 2018.
Product and distribution costs (exclusive of depreciation and amortization): Product and distribution costs(exclusive of depreciation and amortization) increased $15.6 million, or 6.3%, from fiscal 2018 to fiscal 2019,largely for the same reasons as the increase in product sales described above. Product and distribution costs as apercentage of revenue declined 3.7% from fiscal 2018 to fiscal 2019, largely due to a change in sales mix due toour acquisition of Insomnia and the aforementioned decline in DFD sales in the United States and Canada inconnection with our legacy wholesale business evolution. A slight increase in prices in the United States andCanada coupled with relatively stable raw material and distribution costs also contributed to the marginimprovement.
Operating expenses: Operating expenses increased $94.9 million, or 32.1%, from fiscal 2018 to fiscal 2019,with the majority of this increase due to the acquired businesses. Operating expenses as a percentage of revenueincreased 3.5% from fiscal 2018 to fiscal 2019 largely driven by increased shop and delivery labor costs andoccupancy costs as a percentage of revenue. The increase in shop and delivery labor and occupancy costs weredriven by the acquisition of Insomnia and franchise shops. The Insomnia business requires additional deliverylabor due to a higher proportion of delivery transactions.
Selling, general and administrative expense: Selling, general and administrative (SG&A) expensesincreased $29.3 million, or 18.2%, from fiscal 2018 to fiscal 2019, with much of the increase attributable toacquisitions in fiscal 2018 and 2019. In addition, we had incremental transaction and integration expenses infiscal 2019 primarily due to higher costs associated with the acquisition and integration of Mexico. Theseincremental transaction and integration costs were largely offset by higher costs in fiscal 2018 due torestructuring, relocation and recruiting associated with reorganizing and building our leadership team.
Pre-opening costs: Pre-opening costs increased $5.2 million, or 271.9%, from fiscal 2018 to fiscal 2019,primarily driven by $2.4 million associated with the New York City flagship Hot Light Theater Shop as well asan increase in new shop openings in fiscal 2019 compared with fiscal 2018 particularly in our U.S. and Canadasegment, including a full year of new shop openings for Insomnia compared to only a few months in fiscal 2018.
Depreciation and amortization expense: Depreciation and amortization expense increased $14.3 million, or29.0%, from fiscal 2018 to fiscal 2019, primarily driven by additional depreciation and amortization associatedwith acquisitions. Depreciation expense also increased as a result of increased capital spending within theexisting business as the Company continued to grow its presence by expanding into new areas including the firstnew shop opening in Ireland in fiscal 2019.
87

Interest expense, net: Interest expense increased $10.2 million, or 36.6%, from fiscal 2018 to fiscal 2019,primarily related to the increase in the average debt outstanding resulting from funding acquisitions completed inthe back half of fiscal 2018, as well as throughout fiscal 2019. Additionally, interest expense increased resultingfrom the write off of $1.7 million of deferred financing fees in connection with the June 2019 refinancing and$3.3 million due to realized gains on interest rate swaps in fiscal 2018 which did not recur in fiscal 2019.
Interest expense – related party: Interest expense to our related party increased $3.0 million, or 16.1%, fromfiscal 2018 to fiscal 2019, primarily due to entering into an additional unsecured note with Krispy Kreme GP for$54.0 million in fiscal 2019.
Other non-operating (income)/expense, net: Other non-operating income decreased $6.1 million, or 111.2%,from fiscal 2018 to fiscal 2019. The non-operating expense incurred in fiscal 2018 primarily related to a loss oncontingent consideration associated with the Company’s acquisition of an Australia franchisee in fiscal 2018,where an additional $4.7 million payment was made due to the acquired franchise hitting certain financial targetssubsequent to the acquisition.
Income tax expense: Income tax expense increased $17.9 million, or 336.5%, from fiscal 2018 to fiscal2019. During fiscal 2019, income tax expense was significantly impacted by the recording of a valuationallowance against U.S. foreign tax credits, the mix of pre-tax earnings between different jurisdictions, and theimpact of uncertain tax positions. During fiscal 2018, income tax expense was significantly impacted by the mixof pre-tax earnings between different jurisdictions and certain acquisition-related costs.
Net income attributable to noncontrolling interest: Net income attributable to noncontrolling interest forfiscal 2019 increased $1.8 million, or 108.7%, from fiscal 2018 to fiscal 2019, primarily driven by incrementalincome generated by the acquisition of additional majority-stake partnership partners including Insomnia(approximately 75% owned) in fiscal 2018, Awesome Doughnut (70% owned) in fiscal 2018 and WKS-KrispyKreme (55% owned) in fiscal 2019.
Results of Operations by Segment – fiscal 2019 compared to fiscal 2018
The following table presents selected information about our segments’ results for fiscal 2019 and 2018:
Fiscal Years Ended Change
(in thousands except percentages)December 29,
2019December 30,
2018 $ %
Adjusted EBITDAU.S. and Canada . . . . . . . . . . . . . . . . . . . . . . . . . . . . . $ 71,620 $ 54,527 $17,093 31.3%International . . . . . . . . . . . . . . . . . . . . . . . . . . . . . . . . 53,252 41,070 12,182 29.7%Market Development . . . . . . . . . . . . . . . . . . . . . . . . . 51,574 56,271 (4,697) -8.3%Corporate . . . . . . . . . . . . . . . . . . . . . . . . . . . . . . . . . . (30,062) (27,621) (2,441) -8.8%
Total Adjusted EBITDA (1) . . . . . . . . . . . . . . . . . . . $146,384 $124,247 $22,137 17.8%
(1) Refer to “Prospectus Summary – Summary Historical Consolidated Financial Information” for areconciliation of Adjusted EBITDA to net loss.
U.S. and Canada Adjusted EBITDA increased $17.1 million, or 31.3%, from fiscal 2018 to fiscal 2019,primarily driven by the net revenue increase of 32.5%, which was largely due to acquisitions made in fiscal 2018and 2019. EBITDA as a percentage of net revenue improved due to efficiencies in the U.S. and Canada KrispyKreme business.
International Adjusted EBITDA increased $12.2 million. or 29.7%, from fiscal 2018 to fiscal 2019, duelargely to substantial organic revenue growth, particularly in the U.K./Ireland due to increased retail traffic and
88
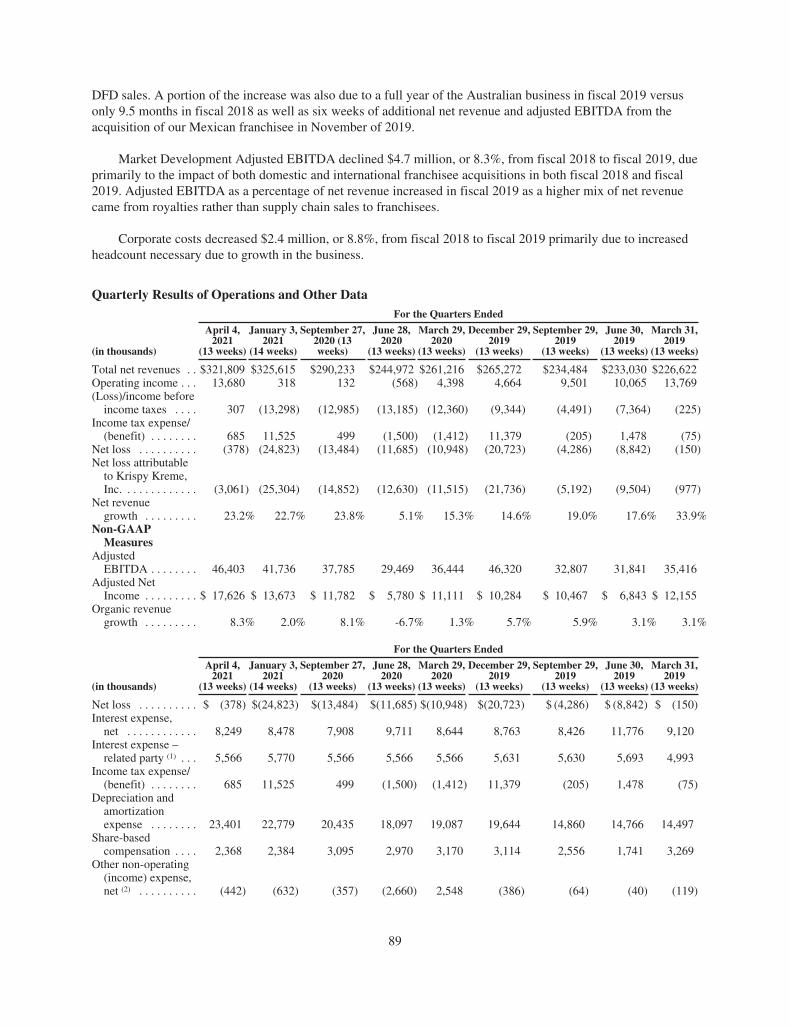
DFD sales. A portion of the increase was also due to a full year of the Australian business in fiscal 2019 versusonly 9.5 months in fiscal 2018 as well as six weeks of additional net revenue and adjusted EBITDA from theacquisition of our Mexican franchisee in November of 2019.
Market Development Adjusted EBITDA declined $4.7 million, or 8.3%, from fiscal 2018 to fiscal 2019, dueprimarily to the impact of both domestic and international franchisee acquisitions in both fiscal 2018 and fiscal2019. Adjusted EBITDA as a percentage of net revenue increased in fiscal 2019 as a higher mix of net revenuecame from royalties rather than supply chain sales to franchisees.
Corporate costs decreased $2.4 million, or 8.8%, from fiscal 2018 to fiscal 2019 primarily due to increasedheadcount necessary due to growth in the business.
Quarterly Results of Operations and Other DataFor the Quarters Ended
(in thousands)
April 4,2021
(13 weeks)
January 3,2021
(14 weeks)
September 27,2020 (13weeks)
June 28,2020
(13 weeks)
March 29,2020
(13 weeks)
December 29,2019
(13 weeks)
September 29,2019
(13 weeks)
June 30,2019
(13 weeks)
March 31,2019
(13 weeks)
Total net revenues . . $321,809 $325,615 $290,233 $244,972 $261,216 $265,272 $234,484 $233,030 $226,622Operating income . . . 13,680 318 132 (568) 4,398 4,664 9,501 10,065 13,769(Loss)/income before
income taxes . . . . 307 (13,298) (12,985) (13,185) (12,360) (9,344) (4,491) (7,364) (225)Income tax expense/
(benefit) . . . . . . . . 685 11,525 499 (1,500) (1,412) 11,379 (205) 1,478 (75)Net loss . . . . . . . . . . (378) (24,823) (13,484) (11,685) (10,948) (20,723) (4,286) (8,842) (150)Net loss attributable
to Krispy Kreme,Inc. . . . . . . . . . . . . (3,061) (25,304) (14,852) (12,630) (11,515) (21,736) (5,192) (9,504) (977)
Net revenuegrowth . . . . . . . . . 23.2% 22.7% 23.8% 5.1% 15.3% 14.6% 19.0% 17.6% 33.9%
Non-GAAPMeasures
AdjustedEBITDA . . . . . . . . 46,403 41,736 37,785 29,469 36,444 46,320 32,807 31,841 35,416
Adjusted NetIncome . . . . . . . . . $ 17,626 $ 13,673 $ 11,782 $ 5,780 $ 11,111 $ 10,284 $ 10,467 $ 6,843 $ 12,155
Organic revenuegrowth . . . . . . . . . 8.3% 2.0% 8.1% -6.7% 1.3% 5.7% 5.9% 3.1% 3.1%
For the Quarters Ended
(in thousands)
April 4,2021
(13 weeks)
January 3,2021
(14 weeks)
September 27,2020
(13 weeks)
June 28,2020
(13 weeks)
March 29,2020
(13 weeks)
December 29,2019
(13 weeks)
September 29,2019
(13 weeks)
June 30,2019
(13 weeks)
March 31,2019
(13 weeks)
Net loss . . . . . . . . . . $ (378) $(24,823) $(13,484) $(11,685) $(10,948) $(20,723) $ (4,286) $ (8,842) $ (150)Interest expense,
net . . . . . . . . . . . . 8,249 8,478 7,908 9,711 8,644 8,763 8,426 11,776 9,120Interest expense –
related party (1) . . . 5,566 5,770 5,566 5,566 5,566 5,631 5,630 5,693 4,993Income tax expense/
(benefit) . . . . . . . . 685 11,525 499 (1,500) (1,412) 11,379 (205) 1,478 (75)Depreciation and
amortizationexpense . . . . . . . . 23,401 22,779 20,435 18,097 19,087 19,644 14,860 14,766 14,497
Share-basedcompensation . . . . 2,368 2,384 3,095 2,970 3,170 3,114 2,556 1,741 3,269
Other non-operating(income) expense,net (2) . . . . . . . . . . (442) (632) (357) (2,660) 2,548 (386) (64) (40) (119)
89

For the Quarters Ended
(in thousands)
April 4,2021
(13 weeks)
January 3,2021
(14 weeks)
September 27,2020
(13 weeks)
June 28,2020
(13 weeks)
March 29,2020
(13 weeks)
December 29,2019
(13 weeks)
September 29,2019
(13 weeks)
June 30,2019
(13 weeks)
March 31,2019
(13 weeks)
New York Cityflagship Hot LightTheater Shopopening (3) . . . . . . — 84 2,190 1,667 2,572 2,003 1,576 194 11
Strategicinitiatives (4) . . . . . — 6,594 4,649 5,661 3,613 4,058 — 1 —
Acquisition andintegrationexpenses (5) . . . . . . 2,152 3,982 4,274 812 3,611 14,238 3,296 2,650 249
Store closureexpenses (6) . . . . . . — 1,425 2,058 2,786 — 629 — — —
Restructuring andseveranceexpenses (7) . . . . . . — — — — — 242 — 341 —
Other (8) . . . . . . . . . . 4,802 4,170 952 (1,956) (7) (2,272) 1,018 2,083 3,621
AdjustedEBITDA . . . $46,403 $ 41,736 $ 37,785 $ 29,469 $ 36,444 $ 46,320 $32,807 $31,841 $35,416
Net loss . . . . . . . . . . $ (378) $(24,823) $(13,484) $(11,685) $(10,948) $(20,723) $ (4,286) $ (8,842) $ (150)Interest expense –
related party (1) . . . 5,566 5,770 5,566 5,566 5,566 5,631 5,630 5,693 4,993Share-based
compensation . . . . 2,368 2,384 3,095 2,970 3,170 3,114 2,556 1,741 3,269Other non-operating
(income) expense,net (2) . . . . . . . . . . (442) (632) (357) (2,660) 2,548 (386) (64) (40) (119)
New York Cityflagship Hot LightTheater Shopopening (3) . . . . . . — 84 2,190 1,667 2,572 2,003 1,576 194 11
Strategicinitiatives (4) . . . . . — 6,594 4,649 5,661 3,613 4,058 — 1 —
Acquisition andintegrationexpenses (5) . . . . . . 2,152 3,982 4,274 812 3,611 14,238 3,296 2,650 249
Store closureexpenses (6) . . . . . . — 1,425 2,058 2,786 — 629 — — —
Restructuring andseveranceexpenses (7) . . . . . . — — — — — 242 — 341 —
Other (8) . . . . . . . . . . 4,802 4,170 952 (1,956) (7) (2,272) 1,018 2,083 3,621Amortization of
acquisition relatedintangibles (9) . . . . 7,449 7,190 6,566 6,192 6,380 6,372 5,129 4,687 5,130
Loss onextinguishment ofdebt (10) . . . . . . . . . — — — — — — — 1,567 —
Tax impact ofadjustments (11) . . . (4,022) (12,690) (5,702) (3,573) (5,394) (6,091) (4,388) (4,632) (4,489)
Tax specificadjustments (12) . . . 131 20,489 1,975 — — 3,469 — 1,400 —
Adjusted NetIncome . . . . . $17,626 $ 13,673 $ 11,782 $ 5,780 $ 11,111 $ 10,284 $10,467 $ 6,843 $12,155
(1) Consists of interest expense related to the Related Party Notes.(2) Consists primarily of foreign translation gains and losses in each fiscal year.(3) Consists of pre-opening costs related to our New York City flagship Hot Light Theater Shop opening,
including shop design, rent and additional consulting and training costs incurred and reflected inselling, general and administrative expenses.
90

(4) Fiscal 2020 and 2019 consist mainly of consulting and advisory fees, personnel transition costs, andnetwork conversion and set-up costs related to the evolution of our legacy wholesale business in theUnited States.
(5) Consists of acquisition and integration-related costs in connection with our business and franchiseacquisitions, including legal, due diligence, consulting and advisory fees incurred in connection withacquisition-related activities for the applicable period.
(6) Consists of lease termination costs, impairment charges, and loss on disposal of property, plant andequipment.
(7) Consists of severance and related benefits costs associated with our hiring of a new global managementteam.
(8) The quarter ended April 4, 2021 consists primarily of $3.5 million of consulting and advisory feesincurred in connection with the preparation for our initial public offering. Fiscal 2020 includes$1.2 million of management fees paid to JAB for the quarter ended January 3, 2021 and $2.7 and$0.5 million total for the quarters ended September 27, 2020 and January 3, 2021, respectivelyconsulting and advisory fees incurred in connection with preparation for our initial public offering,partially offset by a $2.5 million gain on the sale of land for the quarter ended June 28, 2020. Fiscal2019 includes $3.1 million ($1.8 million for the quarter ended March 31, 2019, $1.0 million for thequarter ended December 29, 2019 and the remaining for the quarters ended June 30, 2019 andSeptember 29, 2019) lease impairment expenses related to our Winston-Salem office location incurredin connection with our Corporate headquarters relocation to Charlotte, North Carolina.
(9) Consists of amortization related to acquired intangible assets as reflected within depreciation andamortization in the consolidated statements of operations.
(10) Consists of the write-off of debt issuance costs in connection with the refinancing of the 2016 creditfacility.
(11) Tax impact of adjustments calculated applying the applicable statutory rates. The Company’s adjustedeffective tax rate is 25.2%, 41.0% and 22.8% for each of the fiscal years 2020, 2019 and 2018,respectively. The adjusted effective tax rate for the interim periods differs from the annual adjustedeffective tax rate due to the tax effect of certain discrete items recorded during the interim periods. Theadjusted effective tax rate in fiscal 2019 was higher compared to fiscal 2020 due to the recording of anuncertain tax position of $12.0 million in the fourth quarter of fiscal 2019.
(12) Fiscal years 2020 and 2019 include valuation allowances of $20.5 million and $6.6 million,respectively, associated with tax attributes primarily attributable to incremental costs removed from thecalculation of Adjusted Net Income.
91

For the Quarters Ended
(in thousandsexcept percentages)
April 4,2021
(13 weeks)
January 3,2021
(14 weeks)
September 27,2020
(13 weeks)
June 28,2020
(13 weeks)
March 29,2020
(13 weeks)
December 29,2019
(13 weeks)
September 29,2019
(13 weeks)
June 30,2019
(13 weeks)
March 31,2019
(13 weeks)
Total net revenues– currentyear . . . . . . . . . $321,809 $325,615 $290,233 $244,972 $261,216 $265,272 $234,484 $233,030 $226,622
Total net revenues– prior year . . . . 261,216 265,272 234,484 233,030 226,622 231,471 197,115 198,101 169,196
Total netRevenueGrowth . . . . . . 60,593 60,343 55,749 11,942 34,594 33,801 37,369 34,929 57,426
Total NetRevenueGrowth % . . . . 23.2% 22.7% 23.8% 5.1% 15.3% 14.6% 19.0% 17.6% 33.9%
Impact ofacquisitions . . . (33,844) (32,715) (34,577) (28,889) (33,248) (21,758) (29,087) (32,511) (54,847)
Impact of foreigncurrencytranslation . . . . (4,963) (1,728) (2,117) 1,240 1,699 1,202 3,371 3,718 2,648
Impact of 53rdWeek . . . . . . . . — (20,505) — — — — — — —
Organic RevenueGrowth . . . . . . $ 21,786 $ 5,395 $ 19,055 $ (15,707) $ 3,045 $ 13,245 $ 11,653 $ 6,136 $ 5,227
Organic RevenueGrowth% . . . . 8.3% 2.0% 8.1% -6.7% 1.3% 5.7% 5.9% 3.1% 3.1%
Capital Resources and Liquidity
Our principal sources of liquidity to date have included cash from operating activities, cash on hand,amounts available under our debt facilities, and our SCF Program (as defined below). Our primary use ofliquidity is to fund the cash requirements of our business operations, including working capital needs, capitalexpenditures, acquisitions and other commitments.
Our future obligations primarily consist of our debt and lease obligations, as well as commitments underingredient and other forward purchase contracts. As of January 3, 2021, we had the following future obligations:
• An aggregate principal amount of $806.3 million outstanding under the 2019 Facility;
• An aggregate principal amount of $344.6 million outstanding under the Related Party Notes;
• Non-cancellable future minimum operating lease payments totaling $645.0 million;
• Non-cancellable future minimum finance lease payments totaling $43.7 million; and
• Purchase commitments under ingredient and other forward purchase contracts of $48.3 million.
As of April 4, 2021, our outstanding principal amount under the 2019 Facility was $832.5 million, and ouroutstanding principal amount under the Related Party Notes was $350.1 million. In addition, on April 9, 2021,we received $144.1 million in capital contributions from shareholders and other minority interests, which wasprimarily used to repay a portion of the outstanding debt balance.
Refer to Notes 7, 8, 14 and 15 to our audited consolidated financial statements included elsewhere in thisprospectus for more information.
We had cash and cash equivalents of $37.5 million as of January 3, 2021 and $50.7 million as of April 4,2021. We believe that our existing cash and cash equivalents and debt facilities, together with the proceeds ofthis offering, will be sufficient to fund our operating and capital needs for at least the next twelve months. Our
92

assessment of the period of time through which our financial resources will be adequate to support our operationsis a forward-looking statement and involves risks and uncertainties. Our actual results could vary because of, andour future capital requirements will depend on, many factors, including our growth rate, the timing and extent ofspending to acquire franchises, the growth of our presence in new markets and the expansion of our omni-channel model in existing markets. We may enter into arrangements in the future to acquire or invest incomplementary businesses, services and technologies. We have based this estimate on assumptions that mayprove to be wrong, and we could use our available capital resources sooner than we currently expect. We may berequired to seek additional equity or debt financing. In the event that additional financing is required fromoutside sources, we may not be able to raise it on terms acceptable to us or at all. If we are unable to raiseadditional capital when desired, or if we cannot expand our operations or otherwise capitalize on our businessopportunities because we lack sufficient capital, our business, results of operations and financial condition wouldbe adversely affected.
Cash Flows
We generate significant cash from operations and have substantial credit availability and capacity to fundoperating and discretionary spending such as capital expenditures and debt repayments. Our requirement forworking capital is not significant because our customers pay us in cash or on debit or credit cards at the time ofthe sale and we are able to sell many of our inventory items before payment is due to the supplier of such items.The following table and discussion present, for the periods indicated, a summary of our key cash flows fromoperating, investing and financing activities:
Quarters ended Fiscal Years Ended
(in thousands)April 4,
2021March 29,
2020January 3,
2021December 29,
2019December 30,
2018
Net cash provided by (used in) operatingactivities . . . . . . . . . . . . . . . . . . . . . . . . . . . . . . $ 40,641 $ (89) $ 28,675 $ 80,812 $ 148,337
Net cash used in investing activities . . . . . . . . . . (63,653) (22,399) (168,128) (226,606) (303,283)Net cash provided by financing activities . . . . . . 36,814 281,680 139,441 129,077 166,195
Cash Flows Provided by Operating Activities
Cash provided by operations totaled $40.6 million for the first quarter of fiscal 2021, an increase of $40.7million compared with the amount for the first quarter of fiscal 2020. Cash provided by operations increasedprimarily due to operating results producing a smaller net loss in the first fiscal quarter of 2021 due in part toimpacts on business operations during the COVID-19 pandemic in the first fiscal quarter of 2020. The increasealso reflected an improvement of approximately $26.2 million in working capital as a result of changes inreceivable and payable balances.
Cash provided by operations totaled $28.7 million for fiscal 2020, a decrease of $52.1 million comparedwith the amount for fiscal 2019. Cash provided by operations decreased primarily due to operating resultsproducing a larger net loss in fiscal 2020 due in part to impacts on business operations during the COVID-19pandemic and changes in receivable and inventory balances partially due to the launch of our Branded SweetTreat Line. In addition, fiscal 2019 included the collection of a $28.6 million related-party income tax receivablebalance.
Cash provided by operations totaled $80.8 million for fiscal 2019, a decrease of $67.5 million comparedwith the amount for fiscal 2018. The decrease was primarily due to over $100.0 million less cash generated byaccounts payable in fiscal 2019. This was due to the use of structured payables for cash generation in fiscal 2019while more traditional extensions of payment terms were used in fiscal 2018. This decrease in cash generationwas partially offset by increased cash generated from deferred income taxes in fiscal 2019 versus fiscal 2018.
93

We have undertaken broad efforts to improve our working capital position and cash generation, in part bynegotiating longer payment terms with vendors. We have an agreement with a third-party administrator whichallows participating vendors to track our payments, and if voluntarily elected by the vendor, to sell paymentobligations from us to financial institutions (the “Supply Chain Financing Program” or the “SCF Program”). Ourtypical payment terms for trade payables range to 180 days outside of the SCF Program, depending on the type ofvendors and the nature of the supplies or services. For vendors under the SCF Program, we have establishedpayable terms ranging up to, but not exceeding, 360 days. When participating vendors elect to sell one or more ofour payment obligations, our rights and obligations to settle the payables on their contractual due date are notimpacted. We have no economic or commercial interest in a vendor’s decision to enter into these agreements andthe financial institutions do not provide us with incentives such as rebates or profit sharing under the SCFProgram. We agree on commercial terms with vendors for the goods and services procured, which are consistentwith payment terms observed at other peer companies in the industry, and as the terms are not impacted by theSCF Program, such obligations are classified as trade payables.
Cash Flows Used in Investing Activities
Cash used for investing activities totaled $63.7 million for the first quarter of fiscal 2021, an increase ininvestment of $41.3 million compared with the first quarter of fiscal 2020. The increase is primarily due to $33.6million cash used for acquisitions of franchised stores in the first fiscal quarter of 2021 and an incremental $7.5million of property and equipment purchases.
Cash used for investing activities totaled $168.1 million for fiscal 2020, a decrease in investment of$58.5 million compared with fiscal 2019. The decrease is primarily due to $75.5 million less cash used foracquisitions in fiscal 2020, partially offset by an incremental $21.5 million of property and equipment purchases.
Cash used in investing activities was $226.6 million for fiscal 2019, a decrease of $76.7 million comparedwith fiscal 2018. The decrease is primarily driven by cash used for acquisitions of $340.9 million and$42.8 million of property and equipment purchases, partially offset by $79.4 million generated through a saleleaseback transaction related to company shop assets that were previously owned.
Cash Flows Provided by Financing Activities
Cash provided by financing activities totaled $36.8 million for the first quarter of fiscal 2021, a decrease of$244.9 million compared with the first quarter of fiscal 2020. The decrease was mainly driven by a $260.0million draw down on the revolving credit facility during the first quarter of fiscal 2020 which was related tocash preservation at the onset of the COVID-19 pandemic.
Cash provided by financing activities totaled $139.4 million for fiscal 2020, an increase of $10.4 millioncompared to fiscal 2019. Cash provided by financing activities primarily included increased net issuance of debtin order to fund acquisitions, as well as cash provided by working capital through structured payables programs.
Cash provided by financing activities totaled $129.1 million for fiscal 2019, a decrease of $37.1 millioncompared with fiscal 2018, primarily due to an $80.0 million capital contribution in fiscal 2018 partially offsetby additional cash generated by structured payables and less distributions to shareholders and noncontrollinginterest holders in fiscal 2019. Net cash generated by structured payables programs was $55.9 million in fiscal2019 compared to $13.8 million in fiscal 2018.
We utilize various purchase cards issued by financial institutions to facilitate purchases of goods andservices. By using the cards, we receive rebates and differing levels of discounts based on timing of repayment.The payment obligations under these purchase cards are classified as structured payables on our consolidatedbalance sheets and the associated cash flows are included in the financing section of our consolidated statementof cash flows. During fiscal 2020 and 2019, the balances under the various purchase cards increased by$67.5 million and $55.9 million, respectively, resulting in a net financing cash generation of $123.4 million overthe past two fiscal years.
94

Debt
Related Party Notes
We are party to a senior unsecured note agreement with Krispy Kreme G.P. (“KK GP”) for an aggregateprincipal amount of $283.1 million. In April 2019, we entered into an additional unsecured note with KK GP for$54.0 million (such notes together, the “Related Party Notes”), which in part funded the repayment of$78.9 million of third-party debt. The Related Party Notes will mature in series: $202.3 million in October 2027,$89.9 million in October 2028 and $44.9 million in October 2029, with an interest rate of 6.55%, 6.65% and6.75%, respectively. The interest payment is due 60 days after December 31 of each calendar year. Any overdueamount of principal and interest will bear interest payable at a rate per annum equal to the sum of (1) 2% and(2) the weighted average interest rates of the notes. The unpaid accrued interest is included in Related PartyNotes payable in the consolidated balance sheets. Additionally, the Related Party Notes include covenants thatprohibit us to subordinate the Related Party Notes to other unsecured indebtedness. As of January 3, 2021, andDecember 29, 2019, the outstanding amount of principal and interest was $344.6 million and $340.2 million,respectively. The interest expense for the fiscal years ended January 3, 2021, December 29, 2019 andDecember 30, 2018 was $22.5 million, $21.9 million and $18.9 million, respectively. As of April 4, 2021 andMarch 29, 2020, the outstanding amount of principal and interest was $350.1 million and $345.8 million,respectively. The interest expense was $5.6 million for both the first quarter of fiscal 2021 and the first quarter offiscal 2020.
The Related Party Notes will be repaid with a portion of the KKHI pro rata dividend, which will be paidfrom the proceeds from the Term Loan Facility. Therefore, we anticipate less interest expense and higher cashprovided by operating activities in future periods.
See Note 15 to our audited consolidated financial statements included elsewhere in this prospectus for moreinformation.
2019 Facility
On June 13, 2019, we entered into a new credit agreement (the “2019 Facility”). The 2019 Facility providesfor senior secured credit facilities in the form of $700.0 million in aggregate principal of term loans and$300.0 million of revolving capacity. The initial proceeds from the 2019 Facility were used to repay theoutstanding amounts under the 2016 credit facility. Borrowings under the 2019 Facility are subject to an interestrate of one-month LIBOR plus 2.25% if our Total Net Leverage Ratio (as defined in the 2019 Facility) equals orexceeds 4.00 to 1.00, 2.00% if our Total Net Leverage Ratio is less than 4.00 to 1.00 but greater than or equal to3.00 to 1.00 or 1.75% if our Total Net Leverage Ratio is less than 3.00 to 1.00, as determined under the 2019Facility. We are required to make equal installments of 1.25% of the aggregate closing date principal amount ofthe term loans on the last day of each fiscal quarter. All remaining term loan and revolving loan balances are tobe due five years from the initial closing date.
Under the terms of the 2019 Facility, we are subject to a requirement to maintain a Total Net Leverage Ratioof less than 5.50 to 1.00 as of January 3, 2021, which reduces to 5.00 to 1.00 by April 2, 2023. The Total NetLeverage Ratio under the 2019 Facility is defined as the ratio of (a) Total Indebtedness (as defined in the 2019Facility, which includes all debt and finance lease obligations) minus unrestricted cash and cash equivalents to(b) a defined calculation of adjusted EBITDA (“2019 Facility Adjusted EBITDA”) for the most recently endedTest Period (as defined in the 2019 Facility). Our Total Net Leverage Ratio was 3.98 to 1:00 as of the end offiscal 2020 and 3.83 to 1:00 as of the end of fiscal 2019. The 2019 Facility Adjusted EBITDA for purposes ofthese restrictive covenants includes incremental adjustments beyond those included in our Adjusted EBITDAnon-GAAP measure. Specifically, the 2019 Facility Adjusted EBITDA definition includes pro forma impact ofEBITDA to be received from new shop openings and acquisitions for periods not yet in operation, acquisition-related synergies and cost optimization activities and incremental add-backs for pre-opening costs and forCOVID-19 expenses and lost profits.
95

Our Total Net Leverage Ratio was 3.82:1.00 as of the end of the first quarter of 2021, 3.98:1:00 as of theend of fiscal 2020 and 3.83:1:00 as of the end of fiscal 2019.
The borrowings under the 2019 Facility are collateralized by substantially all of our assets, including ourequity interests in our subsidiaries. The 2019 Facility also contains covenants customary for facilities of its typewhich, among other things, generally limit (with certain exceptions): mergers, amalgamations, or consolidations;the incurrence of additional indebtedness (including guarantees); the incurrence of additional liens; the sale,assignment, lease, conveyance or transfer of assets; certain investments; dividends and stock redemptions orrepurchases in excess of certain amounts; transactions with affiliates; engaging in materially different lines ofbusiness; and other activities customarily restricted in such agreements. The 2019 Facility also prohibits thetransfer of cash or other assets to the parent company, whether by dividend, loan or otherwise, but provides forexceptions to enable the parent company to pay taxes, directors’ fees and operating expenses, as well asexceptions to permit dividends in respect of our common stock and stock redemptions and repurchases, to theextent permitted by the 2019 Facility.
We were in compliance with the financial and other covenants related to the 2019 Facility as of April 4, 2021,as of the date of this prospectus and expect to remain in compliance over the next 12 months. If we are unable tomeet the 2019 Facility financial or other covenants in future periods, it may negatively impact our liquidity bylimiting our ability to draw on the revolving credit facility, could result in the lenders accelerating the maturity ofsuch indebtedness and foreclosing upon the collateral pledged thereunder, and could require the replacement of the2019 Facility with new sources of financing which there is no guaranty we could secure. For additional information,refer to Note 7 to our audited consolidated financial statements included elsewhere in this prospectus.
Subsequent Events
Equity Grants
During May 2021, we granted 512,207 options to purchase our common stock and 414,918 restricted stockunits to certain of our employees and directors. The estimated fair values of the options and restricted stock unitsgranted were $29.1 million and $55.9 million, respectively. We expect to incur share-based compensationexpense for such grants beginning in the second quarter of 2021. For more information see Note 15 to ourunaudited interim consolidated financial statements included elsewhere in this prospectus.
On April 9, 2021, the Company received $144.1 million in capital contributions from shareholders and otherminority interest investors. This amount was used to repay a portion of the outstanding debt balance under the2019 Facility. This amount will be accounted for as a capital contribution in the Condensed ConsolidatedStatements of Changes in Shareholders’ Equity.
Term Loan Facility
On June 10, 2021, KKHI entered into the Term Loan Facility, in an initial aggregate principal amount of$500.0 million. On June 17, 2021, KKHI borrowed $500.0 million under the Term Loan Facility. The Term LoanFacility matures on the earlier of (i) June 10, 2022 and (ii) four business days of receipt of the net proceeds fromthis offering. The borrowings under the Term Loan Facility bear interest at a rate equal to LIBOR plus a marginof 2.60%. The Term Loan Facility contains customary covenants that prohibit us from, among other things,incurring additional indebtedness prior to the date that we have repaid the Term Loan Facility in full. TheCompany expects to pay all of its outstanding indebtedness under the Term Loan Facility using part of the netproceeds of this offering.
Critical Accounting Policies and Estimates
The financial information discussed in this “Management’s Discussion and Analysis of Financial Conditionand Results of Operations” is based upon or derived from our audited consolidated financial statements, which
96

have been prepared in conformity with U.S. GAAP. The preparation of the financial statements requires the useof judgments, estimates and assumptions that affect the reported amounts of assets, liabilities, revenues andexpenses as well as related disclosures. We consider an accounting judgment, estimate or assumption to becritical when (1) the estimate or assumption is complex in nature or requires a high degree of judgment and(2) the use of different judgments, estimates and assumptions could have a material impact on our auditedconsolidated financial statements.
On an ongoing basis, we evaluate our estimates and judgments based on historical experience and variousother factors that are believed to be reasonable under the circumstances. We review our financial reporting anddisclosure practices and accounting policies quarterly to confirm that they provide accurate and transparentinformation relative to the current economic and business environment. A summary of our significant accountingpolicies is included in Note 1 to our audited consolidated financial statements included elsewhere in thisprospectus. We believe that our critical accounting policies and estimates are:
Self-Insurance Risks and Receivables from Insurers
We are subject to workers’ compensation, vehicle and general liability claims and are self-insured for thecost of all workers’ compensation, vehicle and general liability claims up to the amount of stop-loss insurancecoverage purchased from commercial insurance carriers. We maintain accruals for the estimated cost of claims,without regard to the effects of stop-loss coverage, using actuarial methods which evaluate known open andincurred but not reported claims and consider historical loss development experience. In addition, we recordreceivables from the insurance carriers for claims amounts estimated to be recovered under the stop-lossinsurance policies when these amounts are estimable and probable of collection. We estimate such stop-lossreceivables using the same actuarial methods used to establish the related claims accruals and taking into accountthe amount of risk transferred to the carriers under the stop-loss policies. The stop-loss policies provide coveragefor claims in excess of retained self-insurance risks, which are determined on a claim-by-claim basis. If a greateramount of claims are reported, or if medical costs increase beyond our expectations, our liabilities may not besufficient, and we could recognize additional expense.
Income taxes
Our provision for income taxes, deferred tax assets and liabilities including valuation allowance requires theuse of estimates based on our management’s interpretation and application of complex tax laws and accountingguidance. We are primarily subject to income taxes in the United States. We establish reserves for uncertain taxpositions for material, known tax exposures in accordance with ASC 740 relating to deductions, transactions andother matters involving some uncertainty as to the measurement and recognition of the item. We may adjust thesereserves when our judgment changes as a result of the evaluation of new information not previously available andwill be reflected in the period in which the new information is available. While we believe that our reserves areadequate, issues raised by a tax authority may be resolved at an amount different than the related reserve andcould materially increase or decrease our income tax provision in future periods.
Goodwill and Indefinite lived intangibles
For each reporting unit, the Company assesses goodwill for impairment annually at the beginning of thefourth fiscal quarter or more frequently when impairment indicators are present. If the carrying value of thereporting unit exceeds its fair value, the Company recognizes an impairment charge for the difference up to thecarrying value of the allocated goodwill. The value is estimated under a discounted cash flow approach, whichincorporates assumptions regarding future growth rates, terminal values and discount rates. For the fiscal years2020, 2019 and 2018, there were no goodwill impairment charges. The fair value of each of our reporting units issignificantly in excess of its carrying value, and absent a sustained multi-year global decline in our business inkey markets such as the U.S. and Canada, we do not anticipate incurring significant goodwill impairment in thenext 12 months.
97

Other intangible assets primarily represent the trade names for our brands, franchise agreements (domesticand international), reacquired franchise rights, customer relationships and non-competition agreements. The tradenames have been assigned an indefinite useful life and are reviewed annually for impairment. All other intangibleassets are amortized on a straight-line basis over their estimated useful lives. Definite-lived intangible assets areassessed for impairment whenever triggering events or indicators of potential impairment occur. We did not haveany impairment charges of other intangible assets during any of the periods presented.
New Accounting Pronouncements
Refer to Note 1 to the audited consolidated financial statements included elsewhere in this prospectus for adetailed description of recent accounting pronouncements issued and adopted.
Quantitative and Qualitative Disclosures About Market Risk
Effects of Changing Prices – Inflation
We are exposed to the effects of commodity price fluctuations in the cost of ingredients of our products, ofwhich flour, sugar and shortening are the most significant. We have demonstrated an ability to manageinflationary cost increases effectively due to rapid inventory turnover, ability to adjust pricing of our products,and from time to time we may enter into forward contract for supply, purchase exchange-traded commodityfutures contracts, and options on such contracts, for raw materials which are ingredients of our products or whichare components of such ingredients, including wheat and soybean oil. We are also exposed to the effects ofcommodity price fluctuations in the cost of gasoline used by our delivery vehicles. To mitigate the risk offluctuations in the price of our gasoline purchases, we may purchase swaps, exchange-traded commodity futurescontracts and options on such contracts.
Interest Rate Risk
We are exposed to changes in interest rates on any borrowings under our debt facilities, which bear interestbased on the one-month LIBOR (with a floor of zero). Generally, interest rate changes could impact the amountof our interest paid and, therefore, our future earnings and cash flows, assuming other factors are held constant.To mitigate the impact of changes in LIBOR on interest expense for a portion of our variable rate debt, we haveentered into interest rate swaps on $505.0 million notional of our $832.5 million of outstanding debt as ofApril 4, 2021, which we account for as cash flow hedges. Based on the $327.5 million of unhedged outstandingas of April 4, 2021, a 100 basis point increase in the one-month LIBOR would result in a $3.3 million increase ininterest expense for a twelve-month period, while a 100 basis point decrease would result in the floor of zero andthus a decrease in interest expense of $0.6 million for a twelve-month period based on the daily average of theone-month LIBOR for the fiscal quarter ended April 4, 2021.
The Financial Conduct Authority in the U.K. intends to phase out LIBOR by the end of 2023. We havenegotiated terms in consideration of this discontinuation and do not expect that the discontinuation of the LIBORrate, including any legal or regulatory changes made in response to its future phase out, will have a materialimpact on our liquidity or results of operations. Refer to “Risk Factors” section within this RegistrationStatement for a discussion of risks related to the expected discontinuation of LIBOR.
Foreign Currency Risk
We are exposed to foreign currency translation risk on the operations of our subsidiaries that functionalcurrencies are other than the U.S. dollar, whose revenues accounted for approximately 23% of our total netrevenues for fiscal 2020. A substantial majority of these revenues, or approximately $230.2 million, wereattributable to subsidiaries whose functional currencies are the British pound sterling, the Australian dollar andthe Mexican peso. A 10% increase or decrease in the average fiscal 2020 exchange rate of the British pound
98

sterling, the Australian dollar and the Mexican peso against the U.S. dollar would have resulted in a decrease orincrease of approximately $23.0 million in our fiscal 2020 total net revenues.
From time to time, we engage in foreign currency exchange and credit transactions with our non-U.S.subsidiaries, which we typically hedge. To date, the impact of such transactions, including the cost of hedging,has not been material. We do not engage in foreign currency or hedging transactions for speculative purposes.
99

BUSINESS
Our Purpose
The Joy of Krispy Kreme
Krispy Kreme is one of the most beloved and well-known sweet treat brands in the world. Over its 83-yearhistory, Krispy Kreme has developed a broad consumer base, selling 1.3 billion doughnuts across 30 countries infiscal 2020. We are an omni-channel business operating through a network of doughnut shops, partnerships withleading retailers, and a rapidly growing e-Commerce and delivery business. We believe that we have one of thelargest and most passionate consumer followings today, exemplified by the over 38 billion total mediaimpressions generated by Krispy Kreme in fiscal 2020. As an affordable indulgence enjoyed across cultures,races, and income levels, we believe that Krispy Kreme has the potential to deliver joyful experiences across theworld.
Krispy Kreme doughnuts are world-renowned for their freshness, taste and quality. Our iconic OriginalGlazed doughnut is universally recognized for its melt-in-your-mouth experience. One differentiating aspect ofthe Original Glazed® doughnut is its ability to be served hot. In our Hot Light Theater Shops, we produce freshOriginal Glazed doughnuts right in front of our guests and turn on our iconic “Hot Now” light to let the worldknow that our doughnuts are hot and ready. We dedicate ourselves to providing the freshest and most awesomedoughnut experience imaginable, with 73% of our surveyed customers, in a 2021 survey conducted by theCompany, reporting that if they could eat only one doughnut brand for the rest of their life, they would chooseKrispy Kreme.
100

Sharing and gifting are important and distinct attributes of our success. More than 75% of our doughnuts are soldin sharing quantities of a dozen or half-dozen. While 64% of our doughnut sales in fiscal 2020 were from our OriginalGlazed doughnut, we also offer a wide range of fresh, high quality doughnuts and sweet treats that are unique to KrispyKreme. We believe we have a strong track record of innovation across varieties, shapes and flavors.
We believe our consumers’ passion for the Krispy Kreme experience combined with our expertise ininnovation provide us with unique opportunities to efficiently create major media-driven events. For example,our recent promotion gifting doughnuts to individuals who received a COVID-19 vaccination resulted in overseven billion earned media impressions. We also believe Krispy Kreme plays a significant role in moments of joybeyond simple individual food indulgence, including school and sports events, community celebrations, holidays,weddings, birthdays and many other occasions.
We are an omni-channel business, creating doughnut experiences via (1) our Hot Light Theater and FreshShops, (2) DFD, (3) e-Commerce and delivery and (4) our new Branded Sweet Treat Line. We have an efficientHub & Spoke model, which leverages a balance of our Hot Light Theater Shops with their famous glazewaterfalls, smaller Fresh Shops and branded cabinets within high traffic grocery and convenience locations. Oure-Commerce platform and delivery capability are significant enablers of our omni-channel growth. We alsorecently launched our Branded Sweet Treat Line, a new line of Krispy Kreme-branded packaged sweet treatsintended to extend our consumer reach with shelf-stable, high quality products available through grocery, massmerchandise, and convenience locations.
In addition to creating awesome doughnut experiences, we create “cookie magic” through Insomnia, whichspecializes in warm, delicious cookies delivered right to the doors of its Insomniacs, along with an innovativeportfolio of cookie cakes, ice cream, cookie-wiches and brownies. Since its founding in a college dorm room in2003, Insomnia has built a dedicated following across its core demographic of young consumers. Insomnia is adigital-first concept with 54% of its sales driven through e-Commerce and 50% of sales delivered off-premise infiscal 2020. By leveraging the power of each platform, both Insomnia and Krispy Kreme enjoy significant benefitsfrom their partnership. Insomnia’s strong existing digital and delivery capabilities help Krispy Kreme accelerate itse-Commerce business. Insomnia benefits from Krispy Kreme’s experience in scaling and navigating omni-channelexpansion. Targeting affordable, high quality emotional indulgence experiences is at the heart of both brands.
In recent years, we substantially invested in our business to accelerate performance and position us for long-term, sustained growth. We have invested in our omni-channel model, brand positioning, product quality andinnovation capabilities. Our legacy wholesale business has evolved by transforming our DFD business channels
101

and introducing our new Branded Sweet Treat Line. Our DFD business is enabled by our Hot Light TheaterShops and Doughnut Factories to ensure consistent and fresh quality across all channels where consumersexperience our products. We have increased control of our network by acquiring and integrating certain of ourfranchised locations in the United States and acquiring the existing businesses in the United Kingdom, Australia,Mexico and Japan. These investments have allowed us to accelerate the implementation of our strategic vision,while ensuring a consistent and engaging experience for our customers. We are present in 30 countriesrepresenting a wide diversity of markets and cultures, with over one-third of Krispy Kreme’s global salesgenerated outside of the United States and Canada, and our aided awareness in tracked markets is 94%.
Our purpose of touching and enhancing lives is reflective of how we operate on a daily basis and the lovewe have for our people, our communities and planet. The love for our people is present in our safe, inclusive anddiverse workplace and the opportunities for growth we provide to all Krispy Kremers. These values arereinforced through our initiatives and programs, for example our Diversity and Inclusion Council, EmployeeResource Groups, and unconscious bias training. We care for our communities by ensuring the highest qualityproducts as well as through our philanthropic initiatives and Acts of Joy. We show our love of the planet throughthe use of sustainable practices that limit our use of resources and have a positive impact on our planet. Thisincludes our commitment to responsible sourcing, waste and food waste reduction, more sustainable packaging,as well as several green energy initiatives currently underway. Going forward, we are committed to activelypursuing new opportunities to make a positive impact on our people, our communities and planetas well asregularly reporting on our progress, leveraging globally accepted ESG reporting frameworks.
Our strategy is built on our belief that almost all consumers desire an occasional indulgence, and that whenthey indulge, they want a high quality, emotionally differentiated experience. We believe this desire, especiallyone which is affordable to consumers, exists during good times and bad. For example, despite the challengesfaced by businesses all over the world during the COVID-19 pandemic, Krispy Kreme continued to grow,reaching the highest level of sales in our brand’s history with net revenue of $1.1 billion in fiscal 2020. Thisspeaks to the appeal and resiliency of our brand and market.
The strength of our brand, strategy and people is demonstrated by our strong financial performance:
• For fiscal 2020, we generated $1,122.0 million of net revenue, $145.4 million of Adjusted EBITDA,$42.3 million of Adjusted Net Income and $60.9 million of net loss
• From fiscal 2016 to fiscal 2020, our net revenue CAGR was 19.1%
• From fiscal 2016 to fiscal 2020, our global points of access increased from 5,720 to 8,275
557 645
796 961
1,122
2016 (2) 2017 2018 2019 2020 2016 2017 2018 2019 2020
5,7205,173
5,926 6,040
8,275
‘16-’20 CAGR: 19.1%
Net Revenue ($ million) (1) Global Points of Access (3)
(1) As described in Note 1 to our audited consolidated financial statements included elsewhere in thisprospectus, we adopted the new revenue recognition standard during the annual period beginning on
102

January 1, 2018. Prior to that time, advertising contributions and related expenditures were not included inthe consolidated statements of operations. Net revenue for fiscal 2020, 2019 and 2018 is inclusive ofadvertising contributions totaling $8.1 million, $9.3 million and $7.8 million, respectively, in accordancewith our adoption of the new revenue recognition standard. The inclusion of these impacts was responsiblefor 0.2 percentage points of the CAGR from fiscal 2016 to fiscal 2020. Other impacts to net revenue as aresult of adopting the new revenue recognition standard are deemed immaterial.
(2) The JAB Acquisition (as defined below) was completed on July 27, 2016. Fiscal 2016 net revenue, aspresented above, includes the predecessor period net revenue of $310 million for the period fromDecember 28, 2015 to July 27, 2016 and the successor period net revenue of $247 million for the periodfrom July 28, 2016 to January 1, 2017.
(3) Global points of access reflects all locations at which fresh doughnuts and cookies can be purchased. We defineglobal points of access to include all Hot Light Theater Shops, Fresh Shops, DFD doors and cookie shops, at bothcompany-owned and franchise locations (does not include new Branded Sweet Treat Line).
For a description of organic revenue growth, Adjusted EBITDA and Adjusted Net Income, see “About thisProspectus – Non-GAAP Financial Measures” and for more information on global points of access, see “Aboutthis Prospectus – Key Performance Indicators.”
Our Global Opportunity
We operate in the large, stable and steadily growing approximately $650 billion global indulgence market*, andbelieve we are well-positioned to gain share in this attractive market. While Krispy Kreme has developed 94% aidedawareness in our tracked markets, only a small fraction of the world’s population has the geographic proximity to beKrispy Kreme customers today. In addition, we believe market conditions will remain highly favorable as globalconsumers’ longstanding demand for quality indulgence continues to grow. Data indicates that nearly all consumers(97%) enjoy indulgences at least occasionally and we believe Krispy Kreme is poised to meet this growing consumerdemand and seize the opportunity to be part of a growing number of shared indulgence occasions.
Indulgence foods have proven to be recession-resistant historically, as exhibited by 4.0% category growth throughthe global financial crisis (CAGR 2007-2009) and 4.3% during the current COVID-19 pandemic (year-over-year 2019-2020). We believe people love an occasional indulgence, no matter the environment. With favorable secular trendsaround indulgence and our positioning as a shared occasion treat, we aim to continue to strengthen our position as aleader in the category and capture outsized share of this attractive market opportunity.
The Ingredients of Our Success
We believe the following competitive differentiators position us to generate significant growth as we continuetowards our goal of becoming the most loved sweet treat brand in the world.
Beloved Global Brand with Ubiquitous Appeal
We believe that Krispy Kreme is an iconic, globally recognized brand with rich history that is epitomized by ourfresh Original Glazed doughnut. We are one of the most loved sweet treat retailers in the United States and manymarkets around the world. We have an extremely loyal, energetic, and emotionally connected consumer base andleading engagement rates that are 19% greater than those of the closest peer in the global indulgence market. Webelieve that our brand love and ubiquitous appeal, as demonstrated by our strong Net Promotor Score in the UnitedStates, differentiate us from the competition. We continuously seek to understand what consumers are celebrating orexperiencing in their lives and actively engage our passionate followers to activate this emotional connection throughmemorable, sharable moments – our “Acts of Joy” – which we believe further fuel our brand love. In fiscal 2020 alone,Krispy Kreme generated over 38 billion total media impressions, up from less than two billion media impressions in2016.
103

Creating Awesome Experiences
We provide authentic indulgent experiences, delivering joy through high quality doughnuts made from ourown proprietary formulations. Our strict quality standards and uniform production systems ensure the customer’sinteraction with Krispy Kreme is consistent with our brand promise, no matter where in the world theyexperience it. We aim to create product experiences that align with seasonal and trending consumer interests andmake positive connections through simple, frequent, brand-focused offerings that encourage shared experiences.
Our experiences start with our Hot Light Theater Shops which create an immersive and interactiveenvironment to showcase our brand. When our Hot Light is on, our manufacturing process is on full display toour customers, including our iconic glaze waterfall and fresh hot-off-the-line doughnut offering. Sharing thismanufacturing process with consumers speaks to the authenticity and wholesomeness of our brand and highlightsthe fresh and high-quality nature of our products. We believe the sights, smells, sounds and taste of theexperience cannot be replicated at scale and result in a virtuous cycle of one generation introducing the next toour one-of-a-kind brand.
We utilize seasonal innovations, alongside the expansion of our core product offering, to inspire customerwonder and keep our consumers engaged with the brand and our products. Our sweet treat assortment beginswith our iconic Original Glazed doughnut inspired by our founder’s classic yeast-based recipe that serves as thecanvas for our product innovation and ideation. Using the Original Glazed doughnut as our foundation, we haveexpanded our offerings to feature everyday classic items such as our flavor glazes and “minis,” which lendthemselves well to gifting occasions such as birthdays and school activities. Our “Original Filled” rings offer thebenefits of a filled shell doughnut without the mess. Our seasonal items create unique assortments centered onholidays and events, with St. Patrick’s Day, July Fourth, Halloween, Christmas and Easter, all examples ofholidays for which we routinely innovate. We also maintain brand relevance by participating in significantcultural moments. We have made heart-shaped conversation doughnuts with edible phrases for Valentine’s Dayand offered free Original Glazed doughnuts and election stickers to anyone who voted in the 2020 U.S.presidential election. We launched filled rings tied to the 50th anniversary of the Apollo moon landing in 2019and in 2021 we celebrated the safe landing of NASA’s Perseverance on Mars with a special Mars-themeddoughnut. We strategically launch offerings tied to these historic moments to gain mind share, grow brand loveand help drive sales.
104

Creating an Emotional Connection with Our Local Communities
Acts of Joy
We believe the experiences Krispy Kreme creates drive an emotional connection with our consumers and inour local communities, resulting in a positive brand halo around Krispy Kreme. We believe a truly loved brandmust maintain cultural relevance by demonstrating an understanding of what consumers are celebrating orexperiencing in their lives. We our passionate followers and activate this emotional connection through strategicinitiatives, such as charitable giving and events. We call these memorable, sharable moments “Acts of Joy”which we believe further fuels our brand love. Recent Acts of Joy include:
• “Healthcare Mondays” – across eight Mondays in fiscal 2020, we gave unlimited doughnuts to anyhealth care worker who asked, with no purchase requirement, simply to thank them for their importantwork through the COVID-19 pandemic. This drove over 4.2 billion earned media impressions and over1,800 media placements.
• “Be Sweet Saturdays” – for every Saturday in April and May of fiscal 2020, we gave consumers a free,separately sealed and bagged, Original Glazed dozen to share with friends or neighbors they could notsee due to pandemic restrictions. This drove significant media coverage and contributed to positivesales throughout respective April and May weekends.
• “Senior Week” – we gave a free “Graduate Dozen” to all graduating high school and college seniorswho were denied their moment of walking across the stage to accept a diploma in 2020. This becamean event unto itself with four-hour lines in certain locations, generating over 2 billion earned mediaimpressions and over 2,400 media placements.
• “COVID-19 Vaccine Offer” – in March 2021, we offered a free doughnut to anyone who received aCOVID-19 vaccination. This promotion was incredibly well received and surpassed 7.6 billion earnedmedia impressions and over 5,300 media placements in the first ten days of the initiative alone.
Raise Dough for Your Cause
In addition to these initiatives, we also help community organizations raise money for their respectiveworthwhile causes through our “Raise Dough for Your Cause” platform by offering favorable doughnut pricingfor local fundraising events. Leveraging our iconic Original Glazed doughnut dozens, these events often serve asan introduction to the brand and help bring new consumers into the Krispy Kreme experience.
105

Leveraging our Omni-Channel Model to Expand Our Reach
We believe our omni-channel model, enabled by our Hub & Spoke approach, allows us to maximize ourmarket opportunity while ensuring control and quality across our suite of products. We apply a tailored approachacross a variety of distinct shop formats to grow in discrete, highly attractive and diverse markets, and maintainbrand integrity and scarcity value while capitalizing on significant untapped consumer demand. Many of ourshops offer drive-thrus, which also expand their off-premises reach. Our Hot Light Theater Shops’ productioncapacity allow us to leverage our investment by efficiently expanding to our consumers wherever they may be —whether in a local Fresh Shop, in a grocery or convenience store, on their commute home or directly to theirdoorstep via home delivery.
Hub & Spoke
• Hot Light Theater Shops and other Hubs – Immersive and interactive experiential shops which provideunique and differentiated customer experiences while serving as local production facilities for ournetwork. These locations serve as Hubs to enable our Hub & Spoke model and expand our brand’sreach. Each features our famous glaze waterfalls and “Hot Now” light that communicate the joy andemotion at the core of our brand. Hot Light Theater Shops are typically destination locations, with 87%of U.S. locations featuring drive-thru capability. Our flexible drive-thru model offers a convenientoff-premise experience which accounted for 46% and 64% of U.S. doughnut shop sales in fiscal 2019and 2020, respectively. We also have smaller Mini-Hot Light Theater Shops that serve hot doughnutexperiences to high foot fall, urban locations. In higher density urban environments, we also utilizeDoughnut Factories to provide fresh doughnuts to Spoke locations, which include Fresh Shops andDFD doors.
• Fresh Shops – Smaller doughnut shops and kiosks, without manufacturing capabilities, selling freshdoughnuts delivered daily from Hub locations. Fresh Shops expand our consumer-serving capacity,while maintaining quality and scarcity value.
• Delivered Fresh Daily – Krispy Kreme branded doughnut cabinets within high traffic grocery andconvenience locations, selling fresh doughnuts delivered daily from Hub locations. Through our DFDpartnerships, we are able to significantly expand our points of access so that more consumers canexperience Krispy Kreme doughnuts. These additional Spoke locations further leverage ourmanufacturing Hub locations, creating greater system efficiency. Consistent with our commitment toproduct quality, our current DFD business has been transformed materially from our legacy wholesalemodel. In 2018, we began strategically exiting unprofitable, low-volume doors and pivoting towardsdelivered-fresh-daily products offered in branded in-store cabinets. This evolution, which had anegative short-term financial impact, was largely completed in 2020 and we believe positions us forstrong and sustainable growth in DFD.
• e-Commerce and Delivery – Fresh doughnuts for pickup or delivery, ordered via our brandede-Commerce platforms or through third-party digital channels. In the United States and Canada ourbranded e-Commerce platform enables attractive opportunities like gifting and office catering, furtherfueling our momentum across key geographies. For fiscal 2020, 18% of our U.S. sales, inclusive ofInsomnia and exclusive of our Branded Sweet Treat Line and DFD, were digital and we aim to growthis significantly in the next few years, both domestically and internationally. The acquisition ofInsomnia allowed us to further develop our e-Commerce business by leveraging Insomnia’s expertiseand capabilities to accelerate Krispy Kreme’s digital opportunity.
106

Branded Sweet Treat Line
Our Krispy Kreme branded packaged sweet treat line offers a delicious, quality experience free of artificialflavors. This new line of products is distributed in the United States through major grocery, mass merchandise,and convenience locations, allowing us to capture the sweet snacking occasion for our customers seeking moreconvenience.
Our Fast-Growing, Digital-First Cookie Concept
Our addition of Insomnia has expanded our sweet treat platform to include a complementary brand rooted inthe belief that indulgent experiences are better enjoyed together. Insomnia delivers warm, delicious cookies rightto the doors of individuals and companies alike. Insomnia is a digital-first brand with 54% of its sales comingfrom e-Commerce channels in fiscal 2020. We own the night through incredibly craveable offerings of cookies(over 65 million sold in 2020), brownies, cookie cakes, ice cream, cookie-wiches and cold milk. In addition tosatisfying late night cravings, Insomnia delivers the cookie magic across a broad set of daytime occasions,including retail, gifting and catering. Through its 191 locations as of April 4, 2021, Insomnia is able to deliverlocally within 30 minutes while also expanding its nationwide delivery capabilities that allows it to delivernext-day to more than 95% of addresses in the United States. We continue to leverage these digital and internaldelivery capabilities while expanding Insomnia’s omni-channel presence, combining both of our strengths toimprove our overall platform.
Proven Team Creating and Leading Distinct Entrepreneurial and Collaborative Culture
Led by a team of highly experienced, passionate and committed executives, we maintain an entrepreneurialculture, which we call our “Leadership Mix.” Our “Krispy Kremers” bring our culture to life every day. Ourvalues are underpinned by a timeless aspiration to touch and enhance lives – delivering joy to our customers isfundamental to everything we do at Krispy Kreme. Giving back to our communities through fundraising andphilanthropic work is at our core and ingrained in our culture and hiring.
Our talent and culture serve as our foundation for achieving our growth strategies. We believe we haveinstilled our purpose and Leadership Mix across our system, globally. Utilizing global key performanceobjectives, we inspire our Krispy Kremers to continually improve and never settle. We believe that our cultureplays a key role in our position as one of the most loved sweet treat brands in the world.
107

Our Growth Strategies
We have made investments in our brand, our people and our infrastructure and believe we are wellpositioned to drive sustained growth as we execute on our strategy. Across our global organization, we have builta team of talented and highly engaged Krispy Kremers and Insomniac team members. Over the past several yearswe have taken increased control of the U.S. market to enable execution of our omni-channel strategy, includingaccelerating growth across our doughnut shops, DFD, e-Commerce and Branded Sweet Treat Line. Globally, wehave developed an operating model that sets the foundation for continued expansion in both existing and newgeographies. As a result, we believe we are in a position to combine a globally recognized and loyalty-inspiringbrand with a leading management team and we aim to unlock increased growth in sales and profitability throughthe following strategies:
• Increase trial and frequency;
• Expand our omni-channel network in new and existing markets;
• Continue to grow Insomnia Cookies; and
• Drive additional efficiency benefits from our omni-channel execution.
Increase trial and frequency
Almost all consumers desire an occasional indulgence, and when they indulge, they want a high quality,emotionally differentiated experience. We believe we have significant runway to be part of a greater number ofshared indulgence occasions. On average, consumers visit Krispy Kreme less than three times per year, creating asignificant frequency opportunity. The success of recently launched products including filled rings and minis,seasonal favorites and flavored glazes affirms our belief that our innovations create greater opportunities forconsumers to engage with our brand. We intend to strengthen our product portfolio by centering furtherinnovation around seasonal, and societal events, and through the development of new innovation platforms todrive sustained baseline growth. Our strategy of linking product launches with relevant events has allowed us toeffectively increase consumption occasions while meaningfully engaging with our communities and consumers.
Our marketing and innovation efforts have expanded the number of incremental consumer use cases forKrispy Kreme doughnuts. For example, our gifting value proposition makes doughnuts an ideal way to celebrateeveryday occasions like birthdays and holidays, through gifting sleeves and personalized gift messaging. Thenew Branded Sweet Treat Line creates a new opportunity in snacking or everyday “lunchbox” occasions. Ourgifting value proposition and Branded Sweet Treat Line’s products, which each fulfill distinct consumptionoccasions, will continue to make our brand and products more accessible and allow us to participate with greaterfrequency in small and large indulgent occasions, from impromptu daily gatherings with family and friends toholidays and weddings, and everything in between.
Expand our omni-channel network in new and existing markets
We believe there are opportunities to continue to grow in new and existing markets in which we currentlyoperate by further capitalizing on our strong brand awareness as we deploy our Hub & Spoke model. We apply adeliberate approach to growing these discrete, highly attractive markets and maintain our brand integrity andscarcity value while unlocking significant consumer demand.
We believe our omni-channel strategy, empowered by our Hub & Spoke model, will allow us to effectivelyseize expansion opportunities both domestically and internationally. Despite our high brand awareness, we havea limited presence in certain key U.S. markets, such as New York and Chicago and have yet to build a significantpresence in key U.S. cities, including Boston and Minneapolis. We believe this provides us ample opportunity togrow within markets in which we are already present. We have also identified similar key internationalwhitespace market opportunities such as China, Brazil, and parts of Western Europe. Our successful track record
108

of entering new diverse markets including the Philippines, South Africa, Guatemala and Saudi Arabiademonstrates our ability to effectively penetrate a broad range of market types. New markets will either consistof company-owned shops or entered via franchise operations, to be determined on a case-by-case basis.
Our dynamic omni-channel strategy allows us to efficiently tailor our model and add e-Commerce, Spokesand Branded Sweet Treat Line channels to most effectively pursue each market opportunity, leveraging ourexisting footprint and technology and innovation capabilities.
Hot Light Theater Shops: We intend to efficiently and selectively grow our physical presence in existingand underserved markets, including our international markets. Our strategy to deploy our Hub & Spoke modelincludes strategically opening new Hot Light Theater Shops to ensure we are creating scarcity value of ourexperiential format while providing sufficient market capacity to fuel growth across our other formats. Wecontinue to transform and reimagine key locations into Hot Light Theater Shops to strengthen our experientialoffering and inspire interactive brand occasions for more consumers.
Fresh Shops and DFD: Maximizing potential distribution is a key growth driver for Krispy Kreme and weintend to supplement market penetration by adding Fresh Shops and DFD locations to further expand our brandreach and ensure our products are available wherever our consumers choose to shop. Our current DFD businesshas been transformed from our legacy wholesale model and we believe positions us for strong and sustainablegrowth in DFD. Expanding through our Spoke locations allows us to leverage existing capacity in our Hublocations to drive capital efficient growth. Today, our DFD presence reaches over 4,700 doors across the UnitedStates and Canada, and 2,100 doors internationally. New listings in key markets have seen marked success,which we intend to emulate globally by leveraging our brand equity and consumer pull to continue penetratingnew doors through Fresh Shops and DFD.
e-Commerce and delivery: e-Commerce is a key driver of our growth, driven both by increased consumerconvenience and the expansion of digitally enabled value propositions. Our branded e-Commerce networkenables us to build a direct relationship with our consumers and creates a fully integrated and highly convenientexperience, whether through “click and collect” or home delivery. As consumer expectations around convenienceincrease, we have been able to meet our consumers’ needs with a highly personal digital platform. e-Commercealso enables and supports a broad range of occasions, including home delivery, gifting, in-office catering andbusiness solutions, and further activation of our fundraising program. We will continue to expand through third-party delivery aggregators as an additional way to drive penetration with new consumers. Growth ofe-Commerce and the delivery channel leverages our existing doughnut shop network, helping achieve operatingefficiencies. With the expansion of this channel, we believe we can leverage valuable consumer data to acquirenew consumers and extract higher consumer lifetime value by creating relationships with them outside of ourshops.
Branded Sweet Treat Line:
The third-party retail channel is important to the doughnut and sweet treats categories, and we intend tocontinue to drive growth across this channel by expanding our partnerships with global and regional retailcustomers and introducing new Branded Sweet Treat Line’s products to further expand our offering. We believethat our new line of nine different packaged, shelf-stable products, including a variety of Doughnut Bites andMini Crullers, are superior to alternative offerings, and combined with our strategic advantage in the market asone of the most loved sweet treats brand, present an opportunity to sell into new retailers and accelerate their sell-through velocity once they reach shelves. To support the growth of our Branded Sweet Treat Line, we haveinvested in additional third-party manufacturing facilities where we produce cake doughnuts under the guidanceof Krispy Kreme employees to ensure product quality and freshness are consistent with our brand promise andexperience.
While the initial launch of our Branded Sweet Treat Line is focused on the U.S. market, we believe anopportunity exists to deploy our Branded Sweet Treat Line internationally in the future.
109

Continue to Grow Insomnia Cookies
We intend to continue to build the presence of Insomnia’s platform in existing and new markets. We intendto leverage Insomnia’s dedicated following and expand its platform with younger consumers, growing itscommunity of “Insomniacs” who love its crave-worthy products. With a “imagine what’s possible” mindset atthe core of this brand, Insomnia plans to continue to expand its brand reach beyond college markets intoadditional major metropolitan communities, leveraging internal delivery capabilities to continue to build out itsomni-channel network. Furthermore, with 54% of Insomnia’s sales coming from e-Commerce, we will continueto invest in expanding its digital audience and brand reach through extended delivery and nationwide shippingopportunities. We believe Insomnia’s delivery and digital capabilities keep it agile and continue to enable salesacceleration in the United States – as evidenced by the addition of 17 new stores in fiscal 2020 with another 30commencing construction in 2021 despite the impact of the COVID-19 pandemic and associated restrictions. Infiscal 2020, Insomnia also demonstrated its highly effective innovation capabilities to drive deeper engagementthrough consumer-centric products like vegan cookies, mini cookies, deluxe cookies, cookie butter, lil’ and bigdippers and three layer cookie cakes.
Drive Additional Efficiency Benefits from Our Omni-Channel Execution
We are making focused investments in our omni-channel strategy to expand our presence efficiently whiledriving top-line growth and margin expansion. The Hub & Spoke model enables an integrated approach tooperations, which is designed to bring efficiencies in production, distribution and supervisory management whileensuring product freshness and quality are consistent with our brand promise no matter where customersexperience our doughnuts. To support the Hub & Spoke model in the United States, we are implementing newlabor management systems and processes in our shops and new delivery route optimization technology to supportour DFD logistics chain. In addition, we are launching a new demand planning system that is intended toimprove service and to deliver both waste and labor efficiencies across all of our business channels, includingproduction of our Branded Sweet Treat Line. We are also investing in our manufacturing capabilities to supportgrowth of our Branded Sweet Treat Line by implementing new packing automation technology, which isintended to significantly increase productivity through labor savings and increased capacity. By streamliningthese operations across our platform, we believe we can continue to deliver on our brand promise and provide joyto our consumers while continuing to drive efficiencies across our platform.
Our Offerings
We aspire to create the most awesome doughnut experience imaginable, with a constant focus on quality,freshness, and taste serving as core foundations of our business philosophy. Our doughnuts are inspired by ourfounder’s original yeast doughnut recipe, dating back to 1937. We use premium, high-quality ingredients andmake our doughnuts using our proprietary doughnut mix and doughnut-making equipment. At the heart of KrispyKreme is our signature Original Glazed doughnut which is typically sold in dozens to be enjoyed with family andfriends. Our Original Glazed also provides us with an attractive value proposition as our most popular doughnuthas a higher gross margin than the average company margin.
110

In our Hot Light Theater Shops and Doughnut Factories we produce doughnuts using a traditional process,perfected over 83 years of experience. Our doughnuts are hand-mixed in shop, before going through a proofingprocess that allows the yeast rings to rise right in front of our doughnut shop guests. The risen dough is flashfried, flipped, and dropped onto the doughnut conveyer where it progresses towards our distinctive glazewaterfall. From the glaze waterfall, the hot doughnuts come through our display curve, where as soon as they aresafe to eat they are offered up as samples to guests. The taste of a hot Original Glazed doughnut right off the lineis a distinctive part of the Krispy Kreme experience.
In addition to the Original Glazed doughnut, which is offered at every doughnut shop globally, we offer 15to 20 doughnut varieties at any one time. Our core offering includes a broad range of doughnuts includingdifferent icings (chocolate, strawberry), fillings (lemon, Kreme), and forms (shells, rings, minis). We typicallyoffer seasonal and other limited time offerings, featuring innovative recipes and ingredients designed to keep ourcustomers engaged and curious about what we might do next.
We are constantly innovating the Krispy Kreme experience to attract new consumers and drive frequency ofoccasions. We continue to innovate with new flavors, limited releases, and branded partnerships, among others,increasing the number of use cases and sharable moments. Our seasonal items create unique assortments centeredon holidays and events such as Valentine’s Day heart shaped doughnuts or our year-end Christmas assortments.Our co-branded offerings, like our Oreo glazed or our Reese’s Peanut Butter doughnuts, continue to introducenew fans to the Krispy Kreme experience.
We offer our doughnuts individually, in half-dozens or in dozens to be enjoyed and shared for a wide varietyof occasions. With each doughnut we seek to provide an affordable indulgence and shared, emotionalexperiences to consumers and communities. Whether gifted, enjoyed on-the-go, or as a group experience in oneof our Hot Light Theater Shops, our doughnuts are the irresistibly original sweet treat. Sales of doughnutscomprise approximately 93% of total domestic Krispy Kreme branded shop sales, with the balance comprisedprincipally of beverage sales.
Our beverage offerings include signature brewed coffee, hot chocolate and chillers. Taken hot or cold, ourwide variety of beverages complement a hot doughnut or are an everyday pleasure on their own.
Branded Sweet Treat Line
In fiscal 2020, we launched our new Branded Sweet Treat Line, comprised of nine different packaged, shelf-stable offerings, including a variety of Doughnut Bites and Mini Crullers. Our Branded Sweet Treat Line alignswith the Krispy Kreme brand promise and expands the sweet snacking experience at-home and on-the-go, and isavailable at a range of grocery, mass merchandise, and convenience retailers. Our Branded Sweet Treat Lineoffers a delicious, high-quality experience, and is free of artificial flavors. The offerings themselves are inspiredby products available in our doughnut shops, featuring our distinctive original glaze.
Insomnia Cookies
Insomnia specializes in delivering warm, delicious cookies and continues to grow its platform to meet theconsumers wherever, whenever and however they choose to experience it. In addition to their cookies, Insomniaoffers an innovative portfolio of sweets, including “Cookie’wiches” (ice cream sandwiches), “Big’wiches”(cookie-filled sandwiches), brownies, cookie cakes, ice cream, special catering packages, milk and more.Insomnia also offers packaged sweet treat boxes and is expanding its nationwide delivery capabilities to delivernext-day to more than 95% of addresses in the United States. With an “imagine what is possible” mentality at thecore of the brand, Insomnia continues to innovate, revolutionizing the cookie game through its Cookie Lab,where recent innovations include cookie butter, lil’ and big dippers, mini-cookies, and vegan cookies.
111

A taste of our offerings
Our Omni-Channel Model
We have created a global omni-channel approach to developing our brand, leveraging a Hub & Spoke modelto increase access and provide a full spectrum of fresh doughnut experiences, while ensuring network and capitalefficiency. We offer consumers access through a variety of channels – experiential Hot Light Theater Shops,Fresh Shops/kiosks, DFD locations, e-Commerce/delivery, and through our Branded Sweet Treat Line availablein a range of retailers. In the Hub & Spoke fresh doughnut network, Hot Light Theater Shops provide animmersive and interactive retail brand experience. We seek to maintain scarcity value given the uniqueness of theHot Light Theater Shop experience while allowing these locations to also serve as production and distributionHubs to Fresh Shops, kiosks, and DFD cabinets within the same market. In this way we are able to enhance andprotect the integrity of the brand while increasing utilization of existing assets, maximizing productionefficiency, and expanding reach within markets. We believe there is significant opportunity to extend our omni-channel model to new markets, both domestically and internationally.
Hot Light Theater Shops
Our Hot Light Theater Shops and Doughnut Factories serve as the primary Hubs to enable our Hub & Spokemodel and expand our brand reach. Through our Hot Light Theater Shops, we are able to be flexible inidentifying the best location to open these doughnut shop experiences. Hot Light Theater Shops are typicallydestination retail locations while Mini-Hot Light Theater Shops deliver hot doughnut experience to high foot fall,urban locations. Our existing shop portfolio consists of a variety of inline, end cap, and freestanding buildings,and majority of our Hot Light Theater Shops include drive-thru capability and are able to produce up to 270dozen doughnuts per hour. Our Mini-Hot Light Theater Shops are able to produce up to 110 dozen doughnuts perhour. These buildings range from under 2,900 square feet in our Mini-Hot Light Theater Shops to 3,700 squarefeet in our Hot Light Theater Shops, with an average of roughly 3,300 square feet and seating capacity forapproximately 26 guests. In higher density urban environments, we also utilize Doughnut Factories to providefresh doughnuts to Spoke locations.
112

Fresh Shops
In order to expand access and increase customer convenience, we operate Fresh Shop locations and Kioskdoughnut shops in high traffic locations like airports, malls, and dense urban environments. Fresh Shops areSpoke locations, receiving fresh doughnut deliveries from nearby Hot Light Theater Shops or Doughnut Factorylocations. While there is no production on site in our Fresh Shop locations, we maintain our strict qualitystandards through centralized production and daily delivery. This operating model allows for smaller format,lower capital investment shops, and gives us access to real estate that would be otherwise unavailable. Theseshops range from under 1,000 square feet for Kiosks to 3,000 square feet in our Fresh Shops, with an average ofroughly 600 square feet.
113

Delivered Fresh Daily (DFD)
Our Hub & Spoke approach is further enhanced by our DFD program, giving consumers expanded accessthrough Krispy Kreme branded in-store cabinets in grocery and convenience locations. Our current DFD businesshas been transformed from our legacy wholesale model. With over 7,500 DFD locations globally, wesignificantly expand our total points of access, leveraging the production assets in our Hot Light Theater Shops,and serving consumers that do not have access to our doughnut shop network. The prominent placement of ourDFD cabinets creates a greater degree of impulse purchasing and ensures that Krispy Kreme remainstop-of-mind.
We have a range of DFD cabinets and display tables that allow us to be successful in many different groceryand convenience environments. In our highest traffic locations, our full-sized DFD cabinets allow us to displayour broadest range of fresh doughnuts, along with a digital display used for marketing and promotionalcommunication. Our product offering is consistent with our doughnut shop assortment, including a regularcadence of limited time offering and seasonal doughnuts. In less trafficked environments, we offer a smallerDFD cabinet or table, featuring a pre-boxed assortment of our best-selling doughnuts. In every outlet, our DFDdoughnuts are delivered fresh, every day, to ensure that we maintain our highest standards of quality. Theconsumer price of doughnuts bought from DFD cabinets is consistent with pricing in our nearby doughnut shops.Our data shows that the DFD program does not directly compete with our doughnut shop locations, even whenthere are multiple points of access in the same trade area.
Selecting the right retail partners is key to the success of the DFD business, and we maintain a high bar forselecting the right partners, and the right individual doors within those partners. Globally, we partner with manyof the top retailers to implement in-store cabinets, including Walmart and Kroger in the United States, a largegrocery retailer in the United Kingdom and 7-Eleven and a pilot program with an Australian supermarket inAustralia. In other global markets we work to identify local retail partners that are best positioned to execute ourDFD offering—premium retailers, with high traffic, and strong overlap with our core consumer. Our data hasshown that a Krispy Kreme branded cabinet is a significant traffic driver for our retail partners, and a highlyproductive use of retail space. Our direct service model and scan-based trading make us an attractive partnerfrom the retail partner perspective, allowing us to be selective in who we choose as our DFD partners.
To execute the DFD program, our Krispy Kremers deliver doughnuts from our Hub Hot Light TheaterShops or Doughnut Factories, into our grocery and convenience partners, and merchandise doughnuts in ourbranded Krispy Kreme cabinets. Our network consists of over 500 delivery trucks that we control that completedirect store delivery. We use route mapping tools to create the optimal distribution routes for our drivers, as theymake deliveries to Spoke locations. A typical route includes a mix of Fresh Shops, kiosks, and DFD cabinetlocations, creating a highly efficient integrated network. We are constantly re-evaluating our route network andDFD doors to ensure that every route is operating at the highest possible level of efficiency and profitability.
114

e-Commerce and Delivery
The vast majority our doughnut shops (Hot Light Theater, Mini-Hot Light Theater and Fresh Shop) serve asaccess points for our e-Commerce and Delivery offering, delivering fresh doughnuts directly to customers intheir homes or offices. In the United States, the majority of our e-Commerce business comes through our“owned” e-Commerce channel, available through our website and custom mobile app, which allows us to engagedirectly with our consumers. Our branded e-Commerce capability allows us to drive a number of digitallyenabled value propositions, including gifting, catering, and fundraising. In our international markets, weprimarily fulfill our e-Commerce offering through third-party platforms. These programs expand the potentialuse cases for the Krispy Kreme brand, and increase customer frequency.
Our U.S. e-Commerce front end is a custom-developed user experience designed specifically for KrispyKreme. The experience was built leveraging capabilities provided by an OLO SaaS platform, while last miledelivery is managed by third-party partners. Nationally and internationally, we expand our e-Commerce reachthrough partnerships with third-party order aggregators, including Door Dash, Uber Eats and Deliveroo, whichfurther broadens our brand accessibility. Increasing our digital capability helps maximize profitability, establishand maintain direct consumer relationships, and collect, protect, and leverage valuable consumer data as wecontinue to expand our e-Commerce and delivery platforms. Our ownership of the customer and othertransactional data collected through our e-Commerce platform supports our omni-channel loyalty and CustomerRelationship Management (“CRM”) strategies. We use our global loyalty programs and customer databases tocommunicate directly with our customers regarding upcoming marketing promotions, as well as to offerindividualized offers and experiences.
Through our partnership with Insomnia, we have been able to leverage key learnings from Insomnia’sstrong digital and delivery capabilities to help accelerate Krispy Kreme’s e-Commerce business. Insomnia is adigital-first concept with 54% of its sales driven by e-Commerce and 50% of sales delivered off-premise in fiscal2020. The Insomnia Technology platform is largely internally developed and integrated, allowing for a seamlessInsomniac experience and efficient execution. Through its 191 locations as of April 4, 2021, Insomnia is able todeliver locally within 30 minutes while also expanding its nationwide delivery capabilities to allow them todeliver next-day to more than 95% of addresses in the United States. Insomnia’s loyalty program “CookieDough” currently has over 1.5 million users, as of April 16, 2021 with a recent launch of an expanded loyaltyprogram for dedicated users called “Cookie Magic.”
Building Our Network
Omni-channel Market Development Strategy
Product quality standards are at the heart of market development strategy. Our fresh doughnuts are madefrom scratch daily and are identical regardless of channel within our Hub & Spoke network. The same consumerexperiences us in many different need states, so we aspire to meet those needs while creating a seamless andconsistent view of our brand.
Markets are defined by shopper behavior – the ways in which people live, work, commute, shop, eat areheavily influenced by the level of urbanicity and population density in a trade area. We utilize a framework thatclassifies markets into different archetypes and defines the balance of experiential Hot Light Theater Shops,Fresh Shops, and DFD locations that optimizes for both our brand development and our capital efficiency. Wetarget and design our markets by Designated Market Area (“DMA”) on the following criteria:
• Dense Urban: Markets which typically have greater than three million people. These markets have ahigh propensity for pedestrian traffic and typically have higher real estate costs. These cities typicallyhave a Doughnut Factory or multiple Hot Light Theater Shops to support a network of Fresh Shops,kiosks, and DFD locations. Given real estate constraints, they tend to have more Mini-Hot LightTheater Shops than Hot Light shops, which allow us to access to smaller footprint, high street sites tomaximize foot traffic.
115

• Urban / Suburban: Markets which typically have greater than 500,000 people but are smaller than ourdense urban markets. These markets typically feature greater automobile traffic and therefore greaterreliance on drive-thru for convenience. Shop networks are focused on Hot Light Theater Shops andDFD with select Fresh Shop and kiosk locations.
• Suburban / Rural: Markets which typically have 250,000-500,000 people. Given lower populationdensities, these markets typically have one Hot Light Theater Shop which supports DFD routes anddelivery.
Site Selection
We believe that finding great locations for Krispy Kreme shops and developing successful Hub & Spokenetworks is critical to the success of the business. Our site selection process starts with complete mapping of themarket to understand our total potential points of access – across experiential retail, Fresh Shop, DFD, anddelivery – and develop a target trade area strategy. Our trade area strategy takes a comprehensive view at theconsumer impact, and financial considerations of the Hub & Spoke strategy, including evaluating distributioncosts, production capacity, and potential wholesale DFD partners. Before being approved, we complete a fullassessment for not only every site but also its implications and impact on the broader market network tounderstand its financial potential and required capital investment. Most sites in the portfolio are leased sites,typically negotiated to include extensions at our option. Our strategy to increase ownership and control of ourmarkets has streamlined our site selection process.
Shop Experience and Design
After securing a shop site, we commence the process of designing the Krispy Kreme doughnut shopexperience. We have developed a small portfolio of design prototypes with a goal of providing flexibility ondifferent types of real estate while maintaining consistency in our brand experience. Our design prototype hasbeen successfully validated in the market, has been well received by consumers, and has proven to be efficientfrom an operations perspective. Our internal design team works with our network of architecture partners toadapt our prototype design to the specific site, incorporate locally relevant design elements and conform tojurisdictional constraints as appropriate. When a final design is aligned, we develop a complete set ofconstruction documents along with an itemized construction budget and timeline.
Our doughnut shop experience has been re-defined over the past several years, taking inspiration from ourhistory and feedback from our consumers. Our design celebrates our industrial past while contemporizing theexperience for our guests. The shop design puts doughnuts at the center of experience, with our doughnut makingequipment visible from every angle of the shop, as well as a prominent doughnut display case. Our paper hatdispenser, again inspired by our history, invites our guests to put on a hat and immerse themselves in theexperience. Whimsical details can be found throughout, like our “Glaze for Days” neon sign, or our doughnutshaped tables designed for sharing with friends and families. Throughout the shop we create unique opportunitiesfor our guests to take photographs of themselves enjoying their Krispy Kreme experiences, including in front ofour iconic hot light. With our new shop design, we have digitized the in-shop experience with digital menuboards, and interactive in-shop elements. New shops have made the digital “click and collect” experience mucheasier for our guests, with pick-up stations prominently placed in shop, and easy access for delivery drivers. Wecontinue to evolve our drive thru experience to increase convenience and experience for our guests, includinginstallation of digital drive thru menu boards.
Global Operating Standards
We aspire to create consistent consumer experiences across every channel in which we operate. To ensurethat our guests enjoy the same Krispy Kreme experience anywhere in the world, we run our operations followinga set of global operating standards. Our Krispy Kreme employees follow these to ensure that our shops stay
116

beautiful, our doughnuts are consistently delicious, and our guests continue to return to us time after time.Established globally in 2019 and available on an in-house web portal, these operating standards cover processingand production, serving guests, shop interior and exterior, equipment, safety and risk management. Examplesrange from managing the temperature of the fryer all the way through to remembering to offer paper hats toguests with families. We assess our ongoing performance using KPIs, including customer satisfaction and NetPromoter Score, as well as in-person audits.
Branded Sweet Treat Line
Our new Branded Sweet Treat Line gives us access to a new part of the indulgence category includinggrocery snacks and packaged cake doughnuts. The new Branded Sweet Treat Line presents us an opportunity toreinvent a large and sleepy category, by bringing new innovation and driving category growth. Additionally, weare able to extend the Krispy Kreme brand beyond the limits of our Hub & Spoke network at an affordable pricepoint ranging from $3.97 to $5.49. With 4,712 doors as of April 4, 2021, we believe our network of retailpartners enables us to reach many parts of the United States and Canada, and eventually throughout much of theworld, to give our consumers access to Krispy Kreme where we may not want to open a doughnut shop.
Our products are offered through a broad range of grocery and convenience stores, distributed through anational warehouse network. To support the expansion of our Branded Sweet Treat Line, we have invested inadditional third-party manufacturing facilities where we produce cake doughnuts under the guidance of KrispyKreme employees to ensure product freshness and quality are consistent with our brand promise. We continue toadd new retailers in the United States as part of our expansion strategy.
Krispy Kreme generated considerable excitement when it launched its Branded Sweet Treat Line in over4,700 Walmart locations across the United States. Our nine products achieved top 10% of category at Walmartand represented 6% of Walmart’s sweet treats sales within six months of launch.
Global Network
Krispy Kreme is a global brand, operating in 30 countries around the world. Our brand has shown thepotential to be successful in many different cultures and economies, which we believe supports our aspiration tobecome the most loved sweet treat brand in the world. Our approach to building our global network through acombination of direct ownership and local partners accelerates growth, while balancing risk and capitalinvestment. The following table presents our global points of access as of April 4, 2021:
Global Points of Access (1)
Hot LightTheaterShops Fresh Shops DFD doors
CookieShops Total
Company-Owned (%)
U.S. and Canada . . . . . . . . . . . . . . . . . . . . . . . . . 236 59 4,712 191 5,198 100%International . . . . . . . . . . . . . . . . . . . . . . . . . . . . . 29 350 2,185 — 2,564 100%Market Development (2) . . . . . . . . . . . . . . . . . . . . 111 730 474 — 1,315 5%
Total global points of access . . . . . . . . . . . . . . . 376 1,139 7,371 191 9,077 85%
(1) Excludes Branded Sweet Treat Line distribution points and legacy wholesale business doors.(2) Includes Japanese locations, which are company-owned.
117

Net revenue per point of access can vary significantly by region and type of point of access. Total fiscal2020 U.S. and Canada net revenue of $782.7 million and International net revenue of $230.2 million consisted ofthe following revenue by channel:
2020 US & Canada SegmentNet Revenue by Channel
US & CanadaShops77%
In-shop / Drive-thru84%
e-Commerce16%
US & CanadaDFD17%
Sweet Treat Line6%
2020 International SegmentNet Revenue by Channel
In-shop / Drive-thru86%
International DFD32%
InternationalShops68%
e-Commerce14%
Net revenue for the Market Development segment consists primarily of franchisee royalties and sales ofdoughnut mix, other ingredients, supplies and doughnut-making equipment to franchisees. Beginning inDecember 2020, net revenue from our Japan company-owned operations were included, for which the vastmajority of the revenue is from sales at our doughnut shops.
United States and Canada
The U.S. and Canada continues to be our largest most developed market. Our U.S. and Canada footprintextends from coast-to-coast with over 5,000 total points of access, including 295 doughnut shops covering 41states, in addition to five Doughnut Factories and our Branded Sweet Treat Line’s national footprint. Driven byour heritage as a North Carolina brand, we continue to have an area of regional strength in the Southeast, inaddition to strong presence in many of the largest U.S. metropolitan areas including Los Angeles and SanFrancisco. In the past few years we have expanded our presence in New York City, including the addition of ourflagship Hot Light Theater Shop in Times Square. Our U.S. business has shown strong growth through acombination of marketing and innovation activity in the core, and expansion of the Hub & Spoke network. Thereremains significant opportunity for Hub & Spoke development, including a number of markets in which we areunder-penetrated (New York, Chicago, Houston, Philadelphia) and markets where we have no presence today(Boston, Minneapolis).
We believe that in many major markets there is consumer demand that supports many more points of access.In our top ten U.S. markets there is a population of approximately 100 million people being served by only 726points of access. In the next top 40 markets there is a population of approximately 123 million people beingserved by 3,026 points of access. There is an opportunity for us to expand our network of fresh access, leveragingour existing assets and growing in a highly capital efficient way. When a market is fully developed, we are ableto create a dense network of points of access, supported by a system of fully integrated routes that we believe isnot easy to replicate. The Hub & Spoke model also ensures that we are able to get the freshest possible doughnutsto every point of access.
In the United States and Canada, the majority of our system is company controlled and operated. As ofApril 4, 2021, Krispy Kreme had 26 franchise partners across the United States and Canada. Over the past twoyears, we have increased our control of the system by 31% through acquiring our franchise partners, primarily inthe highest priority geographies. As a result, our system is now 85% company-owned and 15% franchise-owned.By owning our domestic and Canadian locations, we believe we are able to more efficiently implement our omni-channel model, while ensuring consistent quality across the system. Our drive-thrus extend our shops’ reach andoffer a convenient off-premise experience and accounted for 46% and 64% of U.S. doughnut shop sales in fiscal
118

2019 and 2020 respectively. Many of our U.S. franchisees are longstanding partners, who have been a part ofKrispy Kreme for decades.
e-Commerce and delivery have been a major driver of growth in the United States since the launch of ourbranded e-Commerce platform in February of 2020. As consumers have gravitated towards the convenience ofdigital and delivery, our custom designed experience has proven to be a valuable asset. We continue to expandour e-Commerce capability in the United States, and are investing in new value propositions including gifting,catering, and fundraising.
Our DFD business in the United States and Canada is composed of over 4,700 doors as of April 4, 2021,serviced by our Hub locations across the country. Our DFD partners include a mix of traditional grocery stores,mass merchandise retailers, and convenience stores, all serviced by our Krispy Kremers. We manage a fleet ofover 500 trucks in the U.S. operating network of DFD routes, delivering doughnuts from our Hub locations to ourDFD Spokes. The expansion of our DFD network has been a major driver of growth, leveraging our existingmanufacturing Hubs.
The launch of our Branded Sweet Treat Line in the United States creates an additional avenue for growth,providing much greater access to the Krispy Kreme experience. Our national distribution through Walmart andother major retailers allows us to expand our footprint and compete in another part of the indulgence category.
Insomnia Cookies
As of April 4, 2021, Insomnia has 191 locations in 40 states nationwide, highlighting their broad reachthrough local delivery and omni-channel model. With 148 locations serving 177 college campuses currently aswell as 36 urban locations, Insomnia specializes in late night delivery of warm, delicious cookies to students,faculty, and the broader community. Similar to Krispy Kreme, Insomnia shares the belief that treats are bettershared together, and we believe that there is a significant opportunity for Insomnia to continue to expand beyondcollege campuses across the U.S. and eventually, internationally. In fiscal 2020 alone, Insomnia opened 17 newstores and hired over 2,600 new Insomniac team members across the network despite the COVID-19 pandemicand expects to accelerate growth in fiscal 2021.
With digital at its core, Insomnia operates its delivery model through an internally developed, company-owned web and mobile platform and an internal network of delivery drivers. Insomnia’s technology platform islargely internally developed and integrated, allowing for a seamless Insomniac experience and efficientexecution. The strength of the technology and operating processes allow Insomnia to deliver warm, deliciouscookies to customers’ doors locally in less than 30 minutes while also enabling expansion of its nationwidedelivery capabilities to allow next-day delivery to more than 95% of addresses in the United States.
International
Outside of the United States, we have a well-established, company-owned, omni-channel businesses in theUnited Kingdom/Ireland, Australia/New Zealand and Mexico. In these markets, the omni-channel model is wellestablished, with substantial room for continued growth. In each of these markets we have high-performingleadership teams in place to drive the business locally.
Krispy Kreme UK operates a large network of doughnut shops and DFD routes across England, Scotland,and Ireland. Our highly efficient Hub & Spoke network is fully integrated across 116 doughnut shops andapproximately 1,199 DFD doors as of April 4, 2021. We have a longstanding DFD partnership with a largegrocery retailer in the United Kingdom, with branded Krispy Kreme cabinets prominently placed in high trafficshops, as well as rapidly growing presence in Sainsbury and Asda. In Ireland, we opened a highly successful HotLight Theater Shop in fiscal 2018 and have a rapidly growing DFD business.
119

Krispy Kreme Australia has a well-developed omni channel business across the country. Well placed HotLight Theater Shops in major metropolitan areas, including Sydney and Melbourne, operate as Hubs for ournetwork of Fresh Shops. Through a partnership with 7-Eleven, Inc. we have expanded our DFD reach to over 711convenience locations as of April 4, 2021. We also recently expanded our DFD business to 25 grocery locationsin Australia. We have introduced Krispy Kreme to New Zealand in the past several years, with a high performingHot Light Theater Shop in Auckland. The New Zealand business has expanded its omni-channel businessthrough a successful partnership with BP New Zealand.
Krispy Kreme Mexico operates a network of over 229 locations across the country as of April 4, 2021, witha concentration in Mexico City. Given shopping habits in Mexico, the network is more heavily weighted to FreshShop and kiosks locations in high traffic malls and urban centers. We are currently testing a DFD program inMexico, in partnership with Oxxo in the convenience channel, and with Chedraui in grocery stores. We believethere remains significant white space for omni-channel development in Mexico, and the team is currentlybuilding a pipeline of new Hub locations to enable future growth.
In order to increase convenience and access to our products, we offer drive-thrus at certain of ourinternational locations across the United Kingdom, Australia and Mexico.
e-Commerce and delivery are also a major driver of growth in our International segment. While ourdomestic e-Commerce capabilities are focused on our Krispy Kreme branded platform, we primarily fulfillinternational delivery via third-party platforms. We continue to see e-Commerce as a key part of our successacross our global operations and expect it to continue to grow.
Market Development
We have 52 national and international franchise partners who operate 793 shops across 25 countries as ofApril 4, 2021. By partnering with strong international operators, we are able to execute our omni-channel model,while maintaining consistency and quality of our doughnuts. Our market development approach allows us tobenefit from the expertise of local operators, limits our total investment and risk, and increases the pace withwhich we can grow.
The brand and business model have proven to be successful in a broad range of cultures and economies,with limited adaptation required. Our largest partner markets include Korea, the Middle East, and Philippines. Ineach case we have a strong local franchise partner who has invested to build a strong and differentiated brandpositioning, leveraging our global brand equity. We are driving growth through the expansion of our omni-channel model, and by continued investment in our core business through marketing and innovation activation.Our team provides ongoing support to partner markets in the form of operations, training, design, and marketingand innovation. Through a process of strict controls and ongoing audits, we are able to ensure that the KrispyKreme experience in franchise partner markets remains consistent around the world.
In fiscal 2020, we acquired our franchise partner in Japan, with a network of Hot Light Theater Shops, FreshShops, and an ongoing DFD pilot. We believe there is potential for the Krispy Kreme brand in Japan, boththrough growth in the core and expansion of the omni-channel network.
We believe there is potential for continued growth of our omni-channel network into markets where we arenot yet present, including China, Brazil, and parts of Western Europe.
Franchise Partnerships
Krispy Kreme’s vision and culture extend to our franchisees globally. We believe our highly-diversified,engaged global franchisee base demonstrates the viability of the Krispy Kreme brand across numerous types ofowners and operators, limits our risk and provides a strong platform for growth. Our U.S. and international
120

franchisees pay similar types of fees, including a royalty based on a percentage of their net sales, initial franchiseand development fees per new shop, renewal fees and transfer fees. In the United States, franchise agreementsrequire our franchisees to pay us a royalty of 4.5% of their net sales. Typically, international franchisees pay us aroyalty of 6% of their net sales. Additionally, franchisees pay ongoing fees to support the brand’s marketing andother initiatives, including brand fund contributions. The development fee ranges between $12,500 and $25,000per shop in the United States and $10,000 and $25,000 per shop for international markets. The initial franchisefee ranges between $12,500 and $25,000 in the United States and $10,000 and $25,000 for international markets.These ranges are based on shop format. The initial term of domestic franchise agreements is typically 15 years. Afranchisee may elect to renew the term of a franchise agreement and, if approved, will typically pay a renewal feeupon execution of the renewal term.
Team Members and Human Capital Resources
Investing in, developing, and maintaining human capital is critical to our success. We globally employapproximately 21,000 employees as of April 1, 2021, including 16,500 at Krispy Kreme locations that we refer toas our “Krispy Kremers.” We are not a party to any collective bargaining agreement, although we haveexperienced occasional unionization initiatives. We believe our relationships with our team members generallyare good.
We depend on our Krispy Kremers to provide great customer service, to make our products in adherence toour high quality standards and to maintain the consistency of our operations and logistics chain. While wecontinue to operate in a competitive market for talent, we believe that our culture, policies, and practicescontribute to our strong relationship with our Krispy Kremers, which we feel is instrumental to our businessmodel. Our culture is best captured by our Leadership Mix, which are the dozen behaviors that guide us everyday. The Leadership Mix was developed based on the beliefs of our founder, incorporating years of learning onwhat makes Krispy Kreme such a special organization. These cultural behaviors are shared with Krispy Kremersglobally, through an internally developed Leadership Mix training program.
The Leadership Mix is what keeps our consumers at the center of everything we do and ensures that ourKrispy Kremers are empowered to do the right thing for our consumers and for the business. We pride ourselveson being an entrepreneurial and innovative team that is not afraid to take smart risks in service of creatingawesome doughnut experiences.
Consistent with our Leadership Mix ingredients, we pride ourselves on attracting a diverse team of KrispyKremers and Insomniac team members from a wide range of backgrounds. As of April 1, 2021, our U.S. KrispyKreme company-owned operations include approximately 9,100 employees, of which 97% are field-basedemployees and the remaining 3% are corporate employees. 62% of such employees are people of color and 53%of such employees are female. We believe our diverse team drives the entrepreneurial culture that is at the centerof our success.
121

The success of our business is fundamentally connected to the well-being of our Krispy Kremers.Accordingly, we are committed to their health, safety and wellness. During the ongoing COVID-19 pandemic,we have taken and continue to take extraordinary measures that we determined were in the best interest of ourKrispy Kremers and complied with government regulations.
Our Total Rewards platform provides Krispy Kremers and their families with access to a variety ofcompetitive, innovative, flexible and convenient pay, health, and wellness programs. Our total package of payand benefits is designed to support the physical, mental, and financial health of our people and includes medical,dental, vision, EAP, life insurance and retirement benefits as well as disability benefits and assistance with majorlife activities such as educational reimbursement and adoption. Many of these benefits are available to our part-time Krispy Kremers; we believe that offering select benefits to our part-time Krispy Kremers offers us acompetitive advantage in recruiting and retaining talent.
Giving back to our communities through fundraising and philanthropic work is at our core. In 1955, KrispyKreme Fundraising was created to provide a way for qualified community organizations to raise funds for theirworthwhile causes. Last year alone, we helped organizations raise approximately $37 million to support theirinitiatives. We love bringing smiles to others, especially those who need them the most.
We care about our Krispy Kremers and the communities that we serve. We believe that our continuedsuccess comes from connecting in our communities to give back and in attracting, rewarding, retaining, anddeveloping a diverse team in a culture of inclusion that values, welcomes, respects, and celebrates diversity.
Marketing and Innovation
Our marketing strategy is as unique and innovative as our brand. Krispy Kreme’s marketing strategy is toparticipate in culture through “Acts of Joy,” deliver new product experiences that align with seasonal andtrending consumer and societal interests and to create positive connections through simple, frequent, brand-focused offerings that encourage shared experiences. The tactics which support this strategy are also distinct. Inthe United States, Krispy Kreme’s paid media strategy is 100% digital with a heavy focus on social media whereour passionate consumer base engages and shares our marketing programs far and wide through their ownnetworks. Earned media is also an important part of our media mix. We create promotions and products thatattract media outlets to our brand. Through the widespread dissemination of our programs through pop culture,entertainment and news outlets we believe we are able to achieve attention disproportionately large relative toour spend in a media environment populated by brands with far larger media budgets.
We believe our marketing strategy, supported with non-traditional media tactics has proven to be a potentcombination that simultaneously drives sales while growing brand love.
Maintaining Cultural Relevance
We believe that to be a truly loved brand we must participate in culture by demonstrating an understandingof what our consumers are struggling with or celebrating in their lives. This approach has been core to ourstrategy for several years, but the impact was pronounced during the pandemic where we created a sustainedcampaign focused on conspicuous generosity that we called “Acts of Joy.” In fiscal 2020 and 2021 Krispy Kremehas executed over a dozen “Acts of Joy” bringing tens of millions of smiles to people’s faces during challengingtimes. Examples of these campaigns include “Healthcare Mondays,” “Be Sweet Saturdays,” “Senior Week,” andfree doughnuts for anyone who was vaccinated for COVID-19, all of which generated significant earned mediaimpressions and media placements.
The quantity and quality of media coverage for these events – channels included ABC News, NBC News,CBS News, all network morning shows, late night network talk-shows, MSNBC, Fox Business, The NYTimes,WSJ, Washington Post, USA Today and dozens more – enabled Krispy Kreme to give away over 30 million
122

doughnuts (and counting), increase brand love and drive the business in a difficult environment. These “Acts ofJoy” help create a relationship with consumers who will identify Krispy Kreme as a brand that stands for good inthe communities we serve and further connect by consuming our sweet treat. We believe that this builds highlyloyal, recurring consumers that also serve as brand advocates and ambassadors who serve as the foundation ofbrand growth.
We also draw inspiration from important societal events, creating a unique way for our consumers tocelebrate and engage. For example, in celebration of the recent Mars rover landing, we offered a Mars Doughnutavailable for one day only. This special offering created social “buzz” and significant consumer traffic for ourdoughnut shops. Our ability to create this connection between our consumers and our brand is what has helpedmake the Krispy Kreme brand iconic, and also helps to solidify our position in popular culture.
Furthermore, while our consumers span cultures, races and income levels, we believe they are conscious andpassionate about the brands they trust. Our consumers expect and demand a brand that aligns with their values,which are increasingly trending towards sustainability and social purpose. We believe our purpose of touchingand enhancing lives and our the love for our people, our communities and planet will position us as a strongerand more attractive consumer business.
New Product Experiences
Limited time seasonal innovation and permanent innovations used to create customer wonder and are anessential ingredient in keeping our consumers engaged with the brand and the products. Our limited timeofferings are anticipated by consumers and the media alike and generate significant social sharing amongst ourfans and media coverage. The impact of limited time seasonal offerings goes well beyond the sales of theinnovations themselves; they drive traffic and create additional sales of our core product offering
Permanent innovations are created with the intent of servicing new occasions or to better serve existingoccasions. Recent examples include ‘minis’ – which lend themselves well to gifting occasions and child-focusedoccasions like birthdays or school activities – and ‘Original Filled’ rings which offer the benefits of a filled shelldoughnut without the mess.
Social Media
Krispy Kreme has a strong brand presence across both emerging and well-established social mediaplatforms, including Facebook, Instagram, Twitter, YouTube, Tik Tok and Pinterest. Across these platforms, wehave 9.98 million followers and industry-leading engagement rates that are 19% greater than those of our closestpeer in the global indulgence market. These channels enable us to engage with our consumers on a personallevel, while spreading the global brand of Krispy Kreme, including communicating promotional activity, featuredproducts, new shop openings and highlighting core equities of the brand. Social media allows precisegeo-targeting around our shops and effective targeting of consumers likely to be interested in our messages. Weadhere to social media guidelines that embody our strategic vision and apply to both company-owned andfranchised restaurants. These guidelines will continually evolve as new technologies and social networking toolsemerge. Krispy Kreme has a strong brand presence across both emerging and well-established social mediaplatforms, including Facebook, Instagram, Twitter, YouTube, Tik Tok and Pinterest.
123

Our Consumers
We seek to bring joy to everyone. Our global reach encompasses 30 countries with over one-third of KrispyKreme’s global sales generated outside the United States. Within the United States, we serve a diverse base ofconsumers according to research from The NPD Group / CREST as of year-end 2020:
Female50%
Male50%
$100K+34%
$75-100K14%
$45-75K20%
$25-45K15%
< $25K17%
55-648%
65+4%
<1824%
18-3437%
35-5427%
Gender Income Age
Supply Chain
Sourcing and supplies
We are committed to sourcing the best ingredients available for our products. The principal ingredients tomanufacture our products include flour, shortening, and sugar which are used to formulate our proprietarydoughnut mix and concentrate at our Winston-Salem manufacturing facility. We procure the raw materials forthese products from a number of different suppliers. Although most raw materials we require are typically readilyavailable from multiple suppliers, we currently have 20 main suppliers in addition to our own mix plant.
We manufacture our doughnut mix at our mix plant in Winston-Salem, North Carolina and a third-partyfacility in Pico Rivera, California, domestically, and at several locations internationally, where we produce thedoughnut mix used to make our doughnuts across the United States and internationally. In support ofinternational markets, we produce a concentrate exclusively at our Winston-Salem facility for shippingefficiency. The concentrate is mixed with commodity ingredients in local markets to get to a finished doughnutmix. Throughout the process, the recipe for what makes a Krispy Kreme doughnut remains known only to thecompany.
At an additional facility in Winston-Salem, North Carolina, we manufacture our proprietary doughnutmaking equipment for shipment to new shops and Doughnut Factories around the world. We manufacture a rangeof doughnut making lines, with different capacities to support the needs of different shop types.
In addition, we provide other ingredients, packaging and supplies, principally to company-owned anddomestic franchise shops. Our Krispy Kreme shop level replenishments generally occur on a weekly basisworking with two national distribution partners. In addition, we serve New York City with a regional distributionpartner to best serve our needs in that market.
In the United States, we operate out of five Doughnut Factories located in Concord, North Carolina,Indianapolis, Indiana, Monroe, Ohio, New York, New York and Fort Lauderdale, Florida. Internationally, weoperate 36 Doughnut Factories, of which 23 are operated by franchisees. Each Doughnut Factory is staffed byKrispy Kremers and supports multiple business channels for Krispy Kreme. Each Doughnut Factorymanufactures on a daily basis to provide finished products depending on shop needs. In addition, they alsoprovide DFD finished products to support local and regional markets. We operate DFD routes out of eachDoughnut Factory today to ensure our DFD doughnuts are delivered fresh, every day, and maintain our higheststandards of quality and brand experience.
124

We utilize our Concord, North Carolina Doughnut Factory to also manufacture our Branded Sweet TreatLine products, including a variety of Doughnut Bites and Mini Crullers, which are shelf stable and cake-basedproducts. In addition, we also work with and oversee a co-manufacturer production facility located in Burlington,Iowa. After manufacturing, packaging, and palletizing our Branded Sweet Treat Line products, we transport theproducts to a third-party warehousing and distribution vendor. This vendor warehouses, consolidates, andprovides direct shipments to our retail partners’ supply networks.
Insomnia operates a nationwide, efficient supply chain. To support the Insomnia stores, it has third-partylogistic providers that bring ingredients and supplies to its bakeries to create their warm, delicious products.Today, Insomnia works with four distribution centers and is expanding to work with eight centers by July 2021 toprovide more efficient and cost-effective logistic solutions.
Quality control
We operate an integrated supply chain to help maintain the consistency and quality of products. Ourbusiness model is centered on ensuring consistent quality of our products. We manufacture doughnut mixes atour facility in Winston-Salem, North Carolina. Additionally, we also manufacture doughnut mix concentrates,which are blended with flour and other ingredients by contract mix manufacturers to produce finished doughnutmix. We have an agreement with an independent food company to manufacture certain doughnut mixes usingconcentrate for domestic regions outside the southeastern United States and to provide backup mix productioncapability in the event of a business disruption at the Winston-Salem facility. In-process quality checks areperformed throughout the production process, including ingredients, moisture percentage, fat percentage, sievesize, and metal checks. We provide specific instructions to franchise partners for storing and cooking ourproducts. All products are transported and stored at ambient temperature.
Competition
We compete in the fragmented indulgence industry. Our domestic and international competitors include awide range of retailers of doughnuts and other treats, coffee shops, other café and bakery concepts. We alsocompete with snacks sold through convenience stores, supermarkets, restaurants and retail stores in the UnitedStates. The number, size and strength of competitors vary by region and by category. We also compete againstretailers who sell sweet treats such as cookies, cupcakes and ice cream shops. We compete on elements such asfood quality, freshness, convenience, accessibility, customer service, price and value. We view our brandengagement, overall consumer experience and the uniqueness of our Original Glazed doughnut as importantfactors that distinguish our brand from competitors, both in the doughnut and broader indulgence categories. See“Risks Related to Our Business and Industry – Our success depends on our ability to compete with many foodservice businesses.”
Trademarks, Service Marks and Trade Names
Our doughnut shops are operated under the Krispy Kreme® trademark, and we use many federally andinternationally registered trademarks and service marks, including Original Glazed®, Hot Krispy Kreme OriginalGlazed Now®, Insomnia Cookies® and the logos associated with these marks. We have registered varioustrademarks in over 65 other countries and we generally license the use of these trademarks to our franchisees forthe operation of their doughnut shops. We have also licensed our marks for other consumer goods. We believethat our trademarks and service marks have significant value and are important to our brand. To better protect ourbrand, we have registered and maintain numerous Internet domain names.
Despite our efforts to obtain, maintain, protect and enforce our trademarks, service marks and otherintellectual property rights, there can be no assurance that these protections will be available in all cases, and ourtrademarks, service marks or other intellectual property rights could be challenged, invalidated, declared generic,circumvented, infringed or otherwise violated. Opposition or cancellation proceedings may in the future be filed
125

against our trademark or service mark applications and registrations, and our trademarks and service marks maynot survive such proceedings. Additionally, although we take reasonable steps to safeguard our trade secrets,trade secrets can be difficult to protect, and others may independently discover our trade secrets and otherconfidential information. From time to time, legal action by us may be necessary to enforce or protect ourintellectual property rights or to determine the validity and scope of the intellectual property rights of others, andwe may also be required from time to time to defend against third-party claims of infringement,misappropriation, other violation or invalidity.
For more information on the risks associated with our intellectual property, see “Risk Factors—RisksRelated to Our Intellectual Property.”
Government Regulation
Environmental regulation. We are subject to a variety of international, foreign, federal, state and localenvironmental laws and regulations governing areas such as the generation, management, storage, disposal andrelease of, and exposure to, hazardous materials and wastes; emission of materials to air, water and otherenvironmental media; greenhouse gases and climate change; and worker health and safety. Such laws andregulations, which have tended to become more stringent over time, can require significant costs for complianceand can result in significant costs related to investigation or remediation of contamination, or as a result ofviolations or noncompliance.
Local regulation. Our shops, both those in the United States and those in international markets, are subjectto licensing and regulation by a number of government authorities, which may include health, sanitation, safety,fire, building and other agencies in the countries, states or municipalities in which the shops are located.Developing new doughnut shops in particular areas could be delayed by problems in obtaining the requiredlicenses and approvals or by more stringent requirements of local government bodies with respect to zoning, landuse and environmental factors. Our agreements with our franchisees require them to comply with all applicablefederal, state and local laws and regulations, and indemnify us for costs we may incur attributable to their failureto comply.
Food product regulation. Our doughnut mixes are primarily produced at our manufacturing facility inWinston-Salem, North Carolina and by third parties with which we have contracted for the production of mix.Production at and shipments from our Winston-Salem facility and those other production facilities are subject toapplicable federal and state governmental rules and regulations. Similar state regulations may apply to productsshipped from our doughnut shops to convenience stores or grocers and mass merchants.
As is the case for other food producers, numerous other government regulations apply to our products. Forexample, the ingredient list, product weight and other aspects of our product labels are subject to state, federaland international regulation for accuracy and content. Most states periodically check products for compliance.The use of various product ingredients and packaging materials is regulated by the United States Department ofAgriculture and the Federal Food and Drug Administration. Conceivably, one or more ingredients in our productscould be banned, and substitute ingredients would then need to be identified.
International trade. We conduct business outside the United States in compliance with all foreign anddomestic laws and regulations governing international business and trade. In connection with our internationaloperations, we typically export our products, principally our doughnut mixes (or concentrates which arecombined with other ingredients sourced locally to manufacture mixes) to our company-owned and franchiseshops in markets outside the United States. Numerous government regulations apply to both the export of foodproducts from the United States as well as the import of food products into other countries. If one or more of theingredients in our products are banned, alternative ingredients would need to be identified. Although we intend tobe proactive in addressing any product ingredient issues, such requirements may delay our ability to open shopsin other countries in accordance with our desired schedule.
126

Employment regulations. We are subject to state and federal labor laws that govern our relationship withteam members, such as minimum wage requirements, overtime and working conditions and citizenshiprequirements. Many of our team members are paid at rates which are influenced by changes in the federal wageregulations. Accordingly, changes in the wage regulations could increase our labor costs. The work conditions atour facilities are regulated by the Occupational Safety and Health Administration and are subject to periodicinspections by this agency. In addition, the enactment of recent legislation and resulting new governmentregulation relating to healthcare benefits may result in additional cost increases and other effects in the future.
Franchise regulation. We must comply with regulations adopted by the FTC and with several state andforeign laws that regulate the offer and sale of franchises. The FTC’s Trade Regulation Rule on Franchising(“FTC Rule”) and certain state and foreign laws require that we furnish prospective franchisees with a franchisedisclosure document containing information prescribed by the FTC Rule and applicable state and foreign lawsand regulations. We register in domestic and foreign jurisdictions that require registration for the sale offranchises. Our domestic franchise disclosure document complies with FTC disclosure requirements, and ourinternational disclosure documents comply with applicable requirements.
We also must comply with a number of state and foreign laws that regulate some substantive aspects of thefranchisor-franchisee relationship. These laws may limit a franchisor’s ability to: terminate or not renew a franchisewithout good cause; interfere with the right of free association among franchisees; disapprove the transfer of afranchise; discriminate among franchisees with regard to charges, royalties and other fees; and place new shops nearexisting franchises. Bills intended to regulate certain aspects of franchise relationships have been introduced into theUnited States Congress on several occasions during the last decade, but none have been enacted.
Other regulations. We are subject to a variety of consumer protection and similar laws and regulations atthe federal, state and local level. Failure to comply with these laws and regulations could subject us to financialand other penalties. We have several contracts to serve United States military bases, which require compliancewith certain applicable regulations. The shops which serve these military bases are subject to health andcleanliness inspections by military authorities.
Seasonality
Our sales peak at various times throughout the year due to certain promotional events and holidaycelebrations. Additionally, our hot beverage sales generally increase during the fall and winter months while ouriced beverage sales generally increase during the spring and summer months. Quarterly results also may beaffected by the timing of the opening of new shops and the closing of existing shops. For these reasons, resultsfor any fiscal quarter are not necessarily indicative of the results that may be achieved for the full fiscal year.
Research and Development
New product innovation is important to the success of our business. We believe that the development of newKrispy Kreme doughnuts, beverages and other products attracts new consumers to our brand, increases shopsales, and allows our shops to strengthen day part offerings. One of our properties in Winston-Salem, NorthCarolina includes research and development facilities including test kitchens and doughnut producing equipmentused in developing new products and processes.
Legal Proceedings
In the ordinary course of conducting our business, we have in the past and may in the future becomeinvolved in various legal actions and other claims. We may also become involved in other judicial, regulatoryand arbitration proceedings concerning matters arising in connection with the conduct of our businesses. Some ofthese matters may involve claims of substantial amounts. These legal proceedings may be subject to manyuncertainties and there can be no assurance of the outcome of any individual proceedings. We do not presentlyanticipate any material legal proceedings that, if determined adversely to us, would have a material adverse effecton our financial position, results of operations or cash flows.
127

MANAGEMENT
Directors and Executive Officers
Set forth below are the names, ages and positions of our directors and executive officers as of the datehereof. As used in this section only, references to “we,” “us,” “our” and “Krispy Kreme” mean, subsequent toMay 28, 2021, Krispy Kreme, Inc. and, prior to May 28, 2021, Krispy Kreme Doughnuts Inc.
Name Age Position
Olivier Goudet 56 Director, Chairman of the BoardPaul Michaels 69 Director, Lead Independent DirectorDavid Bell 49 DirectorPatricia Capel 49 DirectorDavid Deno 63 DirectorOzan Dokmecioglu 49 DirectorCarl Lee, Jr. 61 DirectorDebbie Roberts 56 DirectorLubomira Rochet 44 DirectorMichelle Weese 50 DirectorHenry Yeagley 35 DirectorMichael Tattersfield 55 Director, President and Chief Executive OfficerJosh Charlesworth 46 Chief Operating Officer and Chief Financial OfficerAndrew Skehan 60 North America PresidentDavid Skena 50 Chief Marketing OfficerMatthew Spanjers 45 Chief Growth OfficerCatherine Tang 54 Chief Legal Officer and Corporate SecretaryTerri Zandhuis 52 Chief People OfficerJoey Pruitt 41 Chief Accounting Officer
Olivier Goudet, age 56, has served as Krispy Kreme’s Chairman since May 2017 and a director ofKrispy Kreme from September 2016. Mr. Goudet is currently Managing Partner and Chief Executive Officer ofJAB Holding Company, a position he has held since 2012. He serves as Chairman of the Board of JDE Peet’sN.V. and Pret A Manger. He is also a Director of Keurig Dr. Pepper, Inc., Panera Bread Company, CaribouCoffee Company / Einstein Noah, Espresso House, National Veterinary Associates, Bally and Coty Inc. Hepreviously served as Chairman of the Board of Anheuser-Busch InBev SA/NV. He is the former Executive VicePresident and Chief Financial Officer of Mars, Inc. and has served as an independent advisor to the Mars Boardof Directors. Mr. Goudet began his career at Mars, serving on the finance team of its French business and heldseveral senior executive positions at the VALEO Group, including Group Finance Director. Mr. Goudet holds adegree in Engineering from l’Ecole Centrale de Paris and graduated from the ESSEC Business School in Pariswith a major in Finance. We believe that Mr. Goudet’s extensive financial expertise and senior executiveexperience, as well as significant governance and oversight experience attained through his tenure as a director ofseveral public companies, qualifies him to serve on our board of directors.
Paul Michaels, age 69, has served as one of Krispy Kreme’s directors since May 2017. Mr. Michaels served asthe Chief Executive Officer of Mars Inc. from 2004 to January 2015. Before joining Mars, Mr. Michaels spent 15years at Johnson & Johnson in multiple consumer divisions, Since his retirement he has actively participated on thefollowing Board of Directors as an independent director. Coty Inc. from June 2015 through December 2020, DylaLLC since January 2018, Compassion First Vet Hospitals from May 2019 until December 2020, Panera Bread sinceJanuary 2021 and Keurig Dr. Pepper Inc. since July 2018. Mr. Michaels holds a BA from the University of NotreDame. We believe that Mr. Michaels’ expertise and creativity in launching, building and supporting global brandsin the consumer products industry and his extensive executive experience with complex multinational consumerproduct organizations qualifies him to serve on our board of directors.
128

David Bell, age 49, has served as one of Krispy Kreme’s directors since September 2016. Mr. Bell iscurrently a Senior Partner of JAB Holding Company, where he joined as a Partner in 2012. Prior to that, Mr. Bellheld various positions in corporate development and corporate strategy at Mars, Inc. from 2008 to 2012. Mr. Bellalso held various positions at Goldman Sachs, including serving as Vice President, from 2000 to 2008. Prior tothat, Mr. Bell served as an associate at Perseus, L.L.C. from 1996 to 1998 and Senior Auditor atPricewaterhouseCoopers LLC from 1993 to 1996. He is also currently a member of the board of directors ofPanera Bread Company and National Veterinary Associates. Mr. Bell holds a B.S. in Commerce from theUniversity of Virginia and an MBA from the Wharton School at the University of Pennsylvania. We believe thatMr. Bell’s significant financial and industry experience qualifies him to serve on our board of directors.
Patricia Capel, age 49, has served as one of Krispy Kreme’s directors since April 2021. Ms. Capel iscurrently a Partner at JAB. Prior to joining JAB in March 2021, Ms. Capel held various positions at AnheuserBusch Inbev, including serving as Business President for Andina from January 2019 to March 2021, IntegrationVice President from August 2016 to December 2018 and Vice President of Global People from 2011 to July2016. Prior to her over 25 year tenure at Anheuser Busch Inbev and Ambev, Ms. Capel held positions atPricewaterhouseCoopers LLC and Cargill Argicola SA. Ms. Capel holds a Bachelor’s degree in BusinessAdministration from Universidade de Sao Paulo, and an MBA from Business School Sao Paulo. We believe thatMs. Capel’s significant experience with global companies and expertise in the consumer products industryqualifies her to serve on our board of directors.
David Deno, age 63, has served as one of Krispy Kreme’s directors since September 2016. Mr. Denocurrently serves as Chief Executive Officer and a member of the Board of Directors of Bloomin’ Brands, Inc.(“Bloomin’ Brands”). Prior to March 2019, Mr. Deno served as the Chief Financial and Administrative Officer ofBloomin’ Brands from 2012 to 2019. Mr. Deno’s career has included more than 15 years in senior leveloperations and financial positions at PepsiCo, Inc. (PepsiCo) and YUM! Brands, Inc. (YUM! Brands) (formerlysubsidiary of PepsiCo). Mr. Deno holds an MBA from the University of Michigan and a bachelor’s degree inEconomics and Political Science from Macalester College. Mr. Deno has served as a Macalester trustee since1998. We believe that Mr. Deno’s experience working with global brands in the consumer products industry,extensive management experience and deep understanding of financial control matters qualifies him to serve onour board of directors.
Ozan Dokmecioglu, age 49, has served as one of Krispy Kreme’s directors since September 2020.Mr. Dokmecioglu currently serves as the Chief Financial Officer and President International of KeurigDr. Pepper Inc and, prior to its merger, served as the Chief Financial Officer of Keurig Green Mountain(“KGM”) beginning in May 2016. Mr. Dokmecioglu joined KGM from Kellogg Inc., where he served from 2012until 2016 in the positions of Vice President Finance, Chief Financial Officer North America and as VicePresident Finance, Chief Financial Officer Europe. Before joining Kellogg in 2012, Mr. Dokmecioglu built hiscareer in finance leadership roles in the US, Europe, and Middle East with Kraft Foods Inc., Cargill Inc. andArthur Andersen. Mr. Dokmecioglu holds a BS in Business Administration from the Middle East TechnicalUniversity in Ankara, Turkey, and a certificate in Project Investment and Appraisal Management from HarvardUniversity. We believe that Mr. Dockmecioglu’s significant operating, financial and executive experience in theconsumer products industry qualifies him to serve on our board of directors.
Carl Lee, Jr., age 61, has served as one of Krispy Kreme’s directors since September 2014. Mr. Leecurrently serves as President and Chief Executive Officer of Benestar Brands, a holding company formed to builda mid-size snack food company with a portfolio of differentiated brands. Prior to joining Benestar Brands in2017, he served as Chief Excecutive Officer of Snyder’s-Lance, Inc. from 2013 to 2017. Before joiningSnyder’s-Lance in 2013, Mr. Lee served as the CEO of Snyder’s of Hanover for five years. Mr. Lee built hiscareer in various sales and marketing positions with Frito-Lay, Inc. Mr. Lee holds a B.S. in BusinessManagement from University of South Alabama Mitchell College of Business. We believe that Mr. Lee’sextensive experience in the snack food and indulgence markets qualifies him to serve on our board of directors.
129

Debbie Roberts, age 56, has served as one of Krispy Kreme’s directors since April 2021. Ms. Roberts hasserved as the Executive Vice President, Chief Operating Officer of Panera Bread since September 2020. Beforejoining Panera, Ms. Roberts held various roles at McDonald’s Corporation since 1990. Most recently atMcDonald’s Ms. Roberts served as the President Northeast Zone from December 2014 to December 2016, andthe President East Zone from January 2016 to April 2018. Ms. Roberts holds a Bachelor of Science inAccounting from University of Illinois Urbana-Champaign. We believe that Ms. Roberts’ extensive managementexperience in the food and beverage industry and financial expertise qualifies her to serve on our board ofdirectors.
Lubomira Rochet, age 44, has served as one of Krispy Kreme’s directors since June 2021. Effective as ofJune 2021, Ms. Rochet will be a partner of JAB. Ms. Rochet is also a director of Keurig Dr Pepper, Inc. andSociete Generale. Prior to joining JAB, Ms. Rochet served as Chief Digital Officer for L’Oréal S.A. since March2014. Prior to joining L’Oréal, Ms. Rochet held various positions at Valtech Corporation, Microsoft Corporationand Sogeti, a branch of CapGemini Group. Ms. Rochet has served as an independent Director of SocieteGenerale since May 2017. Ms. Rochet graduated from École Normale Supérieure, holds a Master’s Degree ineconomics from College of Europe and a Master’s degree in Political Science from Sciences Po Paris. Webelieve that Ms. Rochet’s deep expertise in digital marketing, ecommerce, direct-to-consumer selling and the useof data, technology and innovative business models qualifies her to serve on our board of directors.
Michelle Weese, age 50, has served as one of Krispy Kreme’s directors since December 2020. Ms. Weesewill serve as the Chief Corporate Affairs Officer of Bristol Myers Squibb effective June 2021. Prior to joiningBristol Myers Squibb, from Jan 2019 to March 2021, Ms. Weese served as the General Secretary North Americaand member of the North American executive team at France-based Danone, a $30B food and beverage companyand largest certified B-Corp in the world. Prior to Danone, Ms. Weese was the Chief Executive Officer ofStratigence, LLC, a management consulting agency, from 2009 to 2019. Prior to creating Stratigence, Michellewas the Global Head of Corporate Communications for Mars, Incorporated across all Brands and businesses. Inher more than a decade at Mars, she also served as Senior Vice President of Corporate Affairs North Americaand held a seat on the North American management team across all Brands and Divisions. Ms. Weese holds aB.A. in Journalism from Georgia State University We believe that Ms. Weese’s significant management andfinance experience gained through senior leadership positions at several major corporations qualifies her to serveon our board of directors.
Henry Yeagley, age 35, has served as one of Krispy Kreme’s directors since September 2016. Mr. Yeagleyhas been at BDT & Company since July 2011. He currently serves as a Managing Director and leads the firm’sMiddle Market Group. Mr. Yeagley also currently serves as a director of Panera Bread, a position he has heldsince July 2017. Mr. Yeagley holds a BS in Finance from Penn State University, and a holds a MSc fromStanford University Graduate School of Business. We believe that Mr. Yeagley’s significant investing experienceand expertise in corporate strategy and financial analysis qualifies him to serve on our board of directors.
Michael Tattersfield, age 55, has served as our President and Chief Executive Officer since January 2017and as one of Krispy Kreme’s directors since September 2016. Prior to joining Krispy Kreme, Mr. Tattersfieldserved as the Chief Executive Officer and President of Caribou Coffee Company from August 2008 to July 2017.He served as the Chief Executive Officer of Einstein Bros. Bagels Franchise Corporation from February 2016 toJuly 2017, Chief Executive Officer of Einstein and Noah Corporation, as well as Chief Executive Officer ofManhattan Bagel Company from January 2015 to July 2017. Mr. Tattersfield holds an MBA from Harvard and aB.S. in Accounting from Indiana University. He currently serves as a member of the Board of Directors of PaneraBread.
Josh Charlesworth, age 46, has served as our Chief Financial Officer since April 2017 and our ChiefOperating Officer since May 2019. He served as our Corporate Secretary from July 2018 to August 2020. Priorto joining Krispy Kreme, Mr. Charlesworth held various leadership positions at Mars, Incorporated. He most
130

recently served as Global Chief Financial Officer of Mars Chocolate from January 2015 to April 2017.Mr. Charlesworth holds a B.Sc. in Economics from the London School of Economics and is a member of theChartered Institute of Management Accountants.
Andrew Skehan, age 60, has served as our President of North America since November 2017. Prior tojoining Krispy Kreme, Mr. Skehan held various leadership positions at Popeyes Louisiana Kitchen (“Popeyes”).He most recently served as President of North America from March 2017 to October 2017 and President ofInternational from March 2015 to March 2017. Prior to the acquisition by Restaurant Brands International,Mr. Skehan led a significant expansion of Popeyes globally. He has also served in senior leadership positions inmarketing and operations with Wendy’s, Churchill Downs Incorporated, and PepsiCo Restaurants. Mr. Skehanserved as an officer in the U.S. Navy, specializing in Surface Warfare, serving both aboard ship and on the Staffof the Commander in Chief of the Pacific Fleet. He holds an MBA from the University of Rhode Island and aB.S. from the U.S. Naval Academy.
David Skena, age 50, has served as our Chief Marketing Officer since November 2018. Prior to joiningKrispy Kreme, Mr. Skena served as Chief Marketing Officer at Ruby Tuesday from July 2015 to May 2018.Prior to Ruby Tuesday, Mr. Skena was a marketer at PepsiCo where he most recently served as Vice President ofPremium and Value Brands, including Stacy’s Pita Chips and Smartfood popcorn, among others. Prior toPepsiCo, he served in brand management at Kraft Foods, Inc. for multiple brands. Mr. Skena holds a B.A. inEconomics from Bucknell University, a Graduate Diploma in Economics from the University of East Anglia andan MBA from the Kellogg School of Management at Northwestern University.
Matthew Spanjers, age 45, has served as our Chief Growth Officer since August 2019. He served as ourChief Strategy and Development Officer from April 2017 to August 2019. Prior to joining Krispy Kreme,Mr. Spanjers served as Chief Development Officer with Caribou Coffee Company and Einstein Bros. BagelsFranchise Corporation from February 2016 to April 2017, as well as Chief Development Officer and Senior VicePresident Commercial with Caribou Coffee Company from February 2015 to April 2017. Mr. Spanjerspreviously worked with McKinsey and Company, a global management consulting firm. Mr. Spanjers holds aB.A. in English Literature from Yale University and an MBA from the Stanford Graduate School of Business.
Catherine Tang, age 54, has served as our Chief Legal Officer since July 2020 and as our CorporateSecretary since August 2020. Prior to joining Krispy Kreme, Ms. Tang held various positions with Yum! Brands,Inc. She most recently served as Vice President and Associate General Counsel of Yum! Brands from January2017 to July 2020, Chief New Business Development Officer for KFC Global from July 2015 to January 2017,and Chief Legal Officer of KFC Corporation, a subsidiary of Yum! Brands, from August 2009 to July 2015.Ms. Tang holds a J.D. from the Louis D. Brandeis School of Law at the University of Louisville and a B.A. inEconomics and Government from the University of Texas at Austin.
Terri Zandhuis, age 52, has served as our Chief People Officer since August 2017. Prior to joining KrispyKreme, Ms. Zandhuis served as Executive Vice President, Chief People Officer for AOL, a division of Verizon,from July 2015 to September 2016. She served as Vice President, Human Resources for eBay Enterprise,formerly a subsidiary of eBay, from April 2012 to June 2015. She currently serves as Vice Chair ofMake-A-Wish Central & Western North Carolina. She also serves as a member of the Board of Trustees ofCannon School, an independent private school located in Concord, North Carolina. Ms. Zandhuis holds a B.A. inOrganizational Management from the University of Michigan.
Joey Pruitt, age 41, has served as our Vice President and Chief Accounting Officer since November 2017and as Assistant Secretary since May 2018. He served as our Corporate Controller from November 2017 to June2019. Prior to joining Krispy Kreme, Mr. Pruitt served as Vice President, Corporate Controller of Snyder’sLance, Inc. from March 2017 to October 2017, Vice President, Financial Accounting and External Reportingfrom March 2016 to March 2017, and Director of External Financial Reporting from August 2011 to March2016. Mr. Pruitt began his career with PricewaterhouseCoopers, LLP in 2002, holding various roles in the
131

Assurance practice with the most recent role of Audit Senior Manager concluding in 2011. Mr. Pruitt maintains aCPA certification in the state of North Carolina and holds a Master of Science in Accountancy and B.S. inBusiness Administration from The University of North Carolina at Wilmington.
Board of Directors
In connection with this offering, we will amend and restate our certificate of incorporation and bylaws. Ouramended and restated certificate of incorporation will provide that the number of directors of our board shall beestablished from time to time by our board. Immediately after this offering, our board of directors will initially becomposed of twelve members.
Director Independence
Our board of directors has determined that Mr. Dokmecioglu, Mr. Deno, Mr. Lee, Mr. Michaels, Ms. Weeseand Mr. Yeagley are “independent directors” as defined under the listing requirements of Nasdaq. In makingthese determinations, our board of directors reviewed and discussed information provided by the directors and uswith regard to each director’s business and personal activities and relationships as they may relate to us and ourmanagement, including the beneficial ownership of our capital stock by each non-employee director and thetransactions involving them described in the section entitled “Certain Relationships and Related PartyTransactions.” In addition to determining whether each director satisfies the director independence requirementsset forth in the listing requirements of Nasdaq, in the case of members of the audit and finance committee andremuneration and nomination committee, our board of directors will also make an affirmative determination thatsuch members also satisfy separate independence requirements and current standards imposed by the SEC andNasdaq regulations for audit and finance committee members and by the SEC, Nasdaq and the IRS forremuneration and nomination committee members.
There are no family relationships among any of our directors or executive officers.
Committees of the Board of Directors
Upon the completion of this offering, we will establish the following committees of our board of directors:
Audit and Finance Committee
The audit and finance committee, among other things:
• reviews the audit plans and findings of our independent registered public accounting firm and ourinternal audit and risk review staff, as well as the results of regulatory examinations, and tracksmanagement’s corrective action plans where necessary;
• reviews our financial statements, including any significant financial items and/or changes in accountingpolicies, with our senior management and independent registered public accounting firm;
• reviews our financial risk and control procedures, compliance programs and significant tax, legal andregulatory matters;
• has the sole discretion to appoint annually our independent registered public accounting firm, evaluateits independence and performance and set clear hiring policies for employees or former employees ofthe independent registered public accounting firm; and
• reviews and approves in advance any proposed related person transactions.
The members of the audit and finance committee are Mr. Deno, Mr. Michaels and Mr. Yeagley. Mr. Deno isthe Chair of our audit and finance committee. Rule 10A-3 of the Exchange Act and the corporate governance
132

standards of Nasdaq require that our audit and finance committee have at least one independent member upon thelisting of our common stock, have a majority of independent members within 90 days of the date of thisprospectus and be composed entirely of independent members within one year of the date of this prospectus. Ourboard of directors has affirmatively determined that Mr. Deno, Mr. Michaels and Mr. Yeagley meet the definitionof “independent director” for purposes of serving on the audit and finance committee under Rule 10A-3 of theExchange Act and the corporate governance standards of Nasdaq. Our board of directors has determined thateach director appointed to the audit and finance committee is financially literate, and our board of directors hasdetermined that Mr. Deno is our audit and finance committee financial expert.
Remuneration and Nomination Committee
The remuneration and nomination committee, among other things:
• reviews, modifies and approves (or if it deems appropriate, makes recommendations to the full boardof directors regarding) our overall compensation strategy and policies;
• reviews and recommends to our board of directors the salaries, benefits and equity incentive grants,consultants, officers, directors and other individuals we compensate;
• reviews and approves corporate goals and objectives relevant to executive officer compensation,evaluates executive officer performance in light of those goals and objectives, and determinesexecutive officer compensation based on that evaluation;
• reviews and approves the terms of any employment agreements, severance arrangements, change incontrol protections and any other compensatory arrangements for our executive officers;
• oversees our compensation and employee benefit plans;
• reviews the performance of our board of directors and makes recommendations to our board ofdirectors regarding the selection of candidates, qualification and competency requirements for serviceon our board of directors and the suitability of proposed nominees as directors;
• advises our board of directors with respect to the corporate governance principles applicable to us;
• oversees the evaluation of our board of directors and management;
• reviews and approves in advance any related party transaction, other than those that are pre-approvedpursuant to pre-approval guidelines or rules established by the committee; and
• recommends guidelines or rules to cover specific categories of transactions.
The members of the remuneration and nomination committee are Ms. Capel, Mr. Lee and Mr. Michaels. Ms.Capel is the Chair of our remuneration and nomination committee. Our board of directors has affirmativelydetermined that Messrs. Lee and Michaels meet the definition of “independent director” for purposes of servingon the remuneration and nomination committee under the corporate governance standards of Nasdaq. Allmembers of our remuneration and nomination committee are “non-employee” directors as defined in Rule 16b-3(b)(3) under the Exchange Act.
Remuneration and Nomination Committee Interlocks and Insider Participation
No member of our remuneration and nomination committee is or has been one of our officers or employees,and none has any relationships with us of the type that is required to be disclosed under Item 404 of RegulationS-K. None of our executive officers serves or has served as a member of the board of directors, compensationcommittee or other board committee performing equivalent functions of any entity that has one or moreexecutive officers serving as one of our directors or on our remuneration and nomination committee.
133

Code of Business Conduct and Ethics
We will adopt a Code of Business Conduct and Ethics, which will be posted on our website, that applies toall employees and each of our directors and officers, including our principal executive officer and principalfinancial officer. The purpose of the Code of Business Conduct and Ethics will be to promote, among otherthings, honest and ethical conduct, full, fair, accurate, timely and understandable disclosure in publiccommunications and reports and documents that we file with, or submit to, the SEC, compliance with applicablegovernmental laws, rules and regulations, accountability for adherence to the code and the reporting of violationsthereof.
We will also adopt a Code of Ethics for Executive Officers that is applicable to our Chief Executive Officer,Chief Financial Officer and other executive officers. The Code of Ethics for Principal Executive and SeniorFinancial Officers will be posted on our website. We intend to post any amendments to the Code of Ethics forPrincipal Executive and Senior Financial Officers and any waivers that are required to be disclosed on ourwebsite.
134

COMPENSATION DISCUSSION AND ANALYSIS
Overview of Compensation Philosophy & Objectives
The overriding objective of our compensation programs for our Named Executive Officers (“NEOs”) is toencourage, reinforce and reward delivery of stockholder value.
Our NEOs for fiscal year 2020 are:
• Michael Tattersfield, President and Chief Executive Officer (“CEO”)
• Joshua Charlesworth, Chief Financial Officer and Chief Operating Officer
• Andrew Skehan, North America President
• Matthew Spanjers, Chief Growth Officer
• Theresa Zandhuis, Chief People Officer (“CPO”)
Elements of Compensation
NEO compensation consists of base salary, an annual cash incentive award under our annual bonusprogram, equity awards under our Long-Term Incentive Plan (“LTIP”), and our unique Executive OwnershipProgram. We also provide certain limited benefits and perquisites in line with general practice. Variable payunder our bonus program, LTIP and Executive Ownership Program has been, and will continue to be, the mostsignificant element of our NEO compensation program. The Company is reviewing its current compensationprograms for the NEOs in connection with this offering.
The 2020 executive compensation program applicable to our NEOs consisted of the following principalelements:
CompensationElement
Method forEstablishing its Value Form of Payment
Who EstablishesObjectives andParticipation
Base Salary Compensation marketanalysis fromindependentcompensation consultant
Cash Except with respect totheir own compensation,the CPO and the CEOrecommend, and theremuneration andnomination committeeapproves.
Annual Bonus Pay Collective performanceas defined by the bonusprogram metricsapplicable to each NEO
Cash Except with respect totheir own compensation,the CPO and the CEOrecommend, and theremuneration andnomination committeeapproves: (i) NEOparticipation in theannual incentiveprogram and(ii) corporate metrics.The remuneration andnomination committeedetermines performanceagainst corporatemetrics.
135

CompensationElement
Method forEstablishing its Value Form of Payment
Who EstablishesObjectives andParticipation
Long-Term Incentive Plan Compensation marketanalysis fromindependentcompensation consultant
RSUs that cliff-vest 4.5years from the date ofthe grant
Except with respect totheir own compensation,the CPO and the CEOrecommend target grantlevels for each NEO, andthe remuneration andnomination committeeapproves target grantlevels.
Executive OwnershipProgram
NEO investment incommon stock of KKHI
Matching RSUsgenerally vest 4.5-yearsfrom the date of grant.Each award is subject tothe NEO’s continuedemployment with theCompany and subject tofull or partial forfeiturein the event that theNEO does not achieveand maintain their initialinvestment in theCompany.
Except with respect totheir own compensation,the CPO and the CEOrecommend, and theremuneration andnomination committeeapproves targetinvestment levels foreach NEO.
Benefits and Perquisites Minor portion ofcompensation
Base Salary
We pay base salaries to provide executives with a secure, fixed base of cash compensation in recognition ofindividual responsibilities and job performance.
Salary levels are typically set and reviewed periodically by the remuneration and nomination committee.Any salary increases are approved by the remuneration and nomination committee after a comparative analysisof base salaries for similar positions among the market data set provided by the remuneration and nominationcommittee’s independent compensation consultant. When determining base salaries, the remuneration andnomination committee considers external market conditions in addition to total direct compensation targets andpersonal performance. The remuneration and nomination committee approved a base salary increase of $100,000solely for Mr. Tattersfield, effective as of January 1, 2021. No other NEOs received a base salary increase in2020 or 2021.
Each NEO’s base salary for fiscal year 2020 was, and for fiscal year 2021 is, as follows:
NEO2020 Base
Salary2021 Base
Salary
Michael Tattersfield . . . . . . . . . . . . . . . . . . . . . . . . . . $1,000,000 $1,100,000Joshua Charlesworth . . . . . . . . . . . . . . . . . . . . . . . . . . $ 800,000 $ 800,000Andrew Skehan . . . . . . . . . . . . . . . . . . . . . . . . . . . . . . $ 650,000 $ 650,000Matthew Spanjers . . . . . . . . . . . . . . . . . . . . . . . . . . . . $ 525,000 $ 525,000Theresa Zandhuis . . . . . . . . . . . . . . . . . . . . . . . . . . . . $ 500,000 $ 500,000
136

Annual Bonus Pay
The annual bonus program is a key component of the compensation program for our NEOs. Our bonusprogram is designed to stimulate achievement of business results by linking performance-based annual cashincentives, up to a pre-established maximum amount, to the achievement of various performance targets. Webelieve that the annual bonus program encourages, reinforces and rewards delivery of stockholder value bylinking annual cash awards with the achievement of quantifiable performance measures.
For 2020, target bonus awards for each NEO were calculated as a percentage of such NEO’s base salary andmay be multiplied by a factor ranging from zero to two (2) times such target award based on actual performanceof the Company and the individual NEO, with bonus payout at 100% based on the Company’s achievement ofthe defined financial performance criteria at the target level.
Plan Design
For 2020, our NEOs participated in either the U.S. Bonus Plan or the Consolidated Bonus Plan. The bonusperiod for each plan ran from January 1 through December 31, 2020 and was based on our performancecompared to the prior fiscal year based on three metrics: total net sales, adjusted EBITDA and Cash (measured asnet working capital). We generally define “adjusted EBITDA” as earnings before interest expense, net (includinginterest payable to related parties), income tax expense/(benefit), and depreciation and amortization, with furtheradjustments for share-based compensation, other non-operating (income)/expense, strategic initiatives,acquisition and integration expenses, store closure expenses, restructuring and severance expenses and othernon-recurring, infrequent or non-core income and cost items.
At the beginning of 2020, award targets were assigned by the remuneration and nomination committee toeach of our NEOs, and the remuneration and nomination committee specified “Unacceptable,” “Marginal,”“Acceptable,” “Good,” “Very Good,” and “Excellent” levels for each bonus metric. All NEOs are assigned to theConsolidated Bonus Plan, except for Mr. Skehan, who is assigned to the U.S. Bonus Plan. Mr. Skehan isresponsible for driving strategic growth and overall U.S. business and therefore is assigned to the U.S. Bonusplan. The U.S. Bonus is measured on the U.S. and Canada business segment performance.
Krispy Kreme 2020 Bonus Metric Category(1)
NEO
Target as% of Base
SalaryPayout
Opportunity Net SalesAdjustedEBITDA
Cash(millions)
Michael Tattersfield . . . . . . . . . . . . . . . . . . . . . . . . . . . . . 110% 23.7% 17.5% $20.3Joshua Charlesworth . . . . . . . . . . . . . . . . . . . . . . . . . . . . . 80% 23.7% 17.5% $20.3Andrew Skehan . . . . . . . . . . . . . . . . . . . . . . . . . . . . . . . . 80% 0%—200% 22% 11.8% $18.9Matthew Spanjers . . . . . . . . . . . . . . . . . . . . . . . . . . . . . . . 80% of Target 23.7% 17.5% $20.3Theresa Zandhuis . . . . . . . . . . . . . . . . . . . . . . . . . . . . . . . 70% 23.7% 17.5% $20.3
(1) All goals are based on growth over previous fiscal year. Targets included in the table above representperformance at the level of “Very Good.”
2020 Consolidated Bonus PlanMetrics 2020 Bonus Actuals(1) Performance Level
Net Sales . . . . . . . . . . . . . . . . . 17% Below UnacceptableEBITDA . . . . . . . . . . . . . . . . . -3% Below UnacceptableCash . . . . . . . . . . . . . . . . . . . . . $19.4 million Good
137

(1) Actuals are based on growth over previous fiscal year.
2020 U.S. Bonus Plan Metrics 2020 Bonus Actuals(1) Performance Level
Net Sales . . . . . . . . . . . . . . . . . 24% Very GoodEBITDA . . . . . . . . . . . . . . . . . 9% AcceptableCash . . . . . . . . . . . . . . . . . . . . . $17.7 million Good
(1) Actuals are based on growth over previous fiscal year.
Our bonus awards were calculated and paid in March 2021 after the end of the fiscal year, in a singlepayment (net of any taxes withheld). Notwithstanding our achievement levels as compared to the pre-determinedperformance targets under the Consolidated Bonus Plan, the remuneration and nomination committee approvedand awarded a payout at the “Good” rating resulting in payouts at 100% of target under the Consolidated BonusPlan following a holistic assessment of achievement and progress across the global Krispy Kreme business, andin consideration of events and impacts of the COVID-19 pandemic (as further described in the section titled“Management’s Discussion and Analysis of Financial Condition and Results of Operations – Significant Eventsand Transactions – COVID-19 Impact”). Operations in our and our franchisees’ shops have been and areexpected, at least in the short term, to continue to be disrupted to varying degrees due to the COVID-19pandemic, including disruptions related to ongoing national, state and local regulatory restrictions. In response tothe COVID-19 outbreak, in March 2020, we closed all dining rooms and temporarily shifted to a drive throughand “to-go” only operating model domestically. We had several shop opening delays, particularly in New YorkCity where local restrictions were impacting our ability to open new locations. In determining the bonus payoutlevels under the Consolidated Bonus Plan, the remuneration and nomination committee recognized that,notwithstanding these unprecedented disruptions, the executive officers have continued to manage the businessand find ways to drive growth and manage cash. Separately, the remuneration and nomination committeeapproved a payout between the “Good” and “Very good” rating under the U.S. Bonus Plan based onperformance, resulting in paying out at 128% of target under the terms of the plan.
NEOTarget as % of
Base SalaryPayout
Opportunity Total Payout ($)
Michael Tattersfield . . . . . . . . . . . . . . . . . . . . 110% 100% $1,100,000Joshua Charlesworth . . . . . . . . . . . . . . . . . . . 80% 100% $ 640,000Andrew Skehan . . . . . . . . . . . . . . . . . . . . . . . 80% 128% $ 665,600Matthew Spanjers . . . . . . . . . . . . . . . . . . . . . 80% 100% $ 420,000Theresa Zandhuis . . . . . . . . . . . . . . . . . . . . . . 70% 100% $ 350,000
Long Term Incentive Plan Equity-Based Compensation
To balance incentives to achieve short-term and long-term success, the compensation program for our NEOsincludes the grant of long-term equity-based compensation under the LTIP. We closely align the interests of ourNEOs with those of our stockholders by paying a significant portion of total compensation in the form of long-term equity-based incentives. Long-term equity-based compensation, granted in the form of time-vestingrestricted stock units (“RSUs”) and non-qualified stock options (“NSOs”), provides direct alignment between theinterests of our NEOs and stockholders. Our executive officers, including our NEOs, received a grant of RSUsand NSOs under the LTIP in 2021 with a graded vesting schedule where 60% vests on the third anniversary date,an additional 20% vests on the fourth anniversary date, and the final 20% vests on the fifth anniversary date,subject to continued employment with the Company on each vesting date to help ensure long-term retention ofkey executive talent.
138

Executive Ownership Program
We strongly believe in encouraging stock ownership by our NEOs. Therefore, in addition to the LTIP, wehave designed certain additional equity compensation programs to promote stock ownership and investment inthe Company in order to align the interests of our executives with those of our stockholders.
At the time of hire or promotion, executives are offered the opportunity to participate in our ExecutiveOwnership Program (“EOP”), with participation required for all executives at or above the Vice President level.This is generally a one-time opportunity upon achieving eligibility to participate in the EOP, althoughparticipants who experience a promotion into a higher level of the EOP program are given an opportunity toincrease their investment to the level commensurate with their new title. Executives are assigned both aminimum and maximum investment level and then make an election to purchase shares of common stock ofKKHI at the specified ownership amount. The executive will then receive a matching award of RSUs (“MatchingRSUs”) on a one-for-one basis corresponding to the number of shares elected to be purchased. These MatchingRSUs generally have a 4.5-year cliff vesting period tied to continued employment with the Company, and aresubject to forfeiture, in whole or in part, if the executive does not own and maintain his or her investment level ofour common stock through the applicable vesting date.
Each executive typically has a 1.5-year period to purchase EOP shares to meet his or her commitmentamount. At the end of the investment period, if the executive has purchased EOP shares equivalent to his or hercommitment amount and continues to hold the EOP shares for the remainder of the vesting period, the executivewill retain (and is eligible to vest in) the full number of Matching RSUs awarded. From time to time, theremuneration and nomination committee may approve the opportunity for the executives to increase theirownership levels through the EOP. These additional investments by the executives are not matched with RSUawards.
Equity Compensation Decisions in Connection with this Offering
In connection with this offering, certain RSUs issued under the LTIP and EOP and held by our NEOs willbe accelerated. In addition, we intend to use a portion of the net proceeds that we receive from this offering torepurchase shares of our common stock from certain of our NEOs at the price to be paid by the underwriters. Inconnection with the dividend paid by KKHI, our NEOs will also be eligible to receive, with respect tooutstanding RSUs, a dividend equivalent in the form of cash or additional RSUs and, with respect to outstandingstock options, the exercise price of the options will be reduced by the amount of the per share dividend. Inconnection with this offering, we are adopting a new omnibus equity incentive plan and employee stock purchaseplan, each as further described herein, which are attached as exhibits to the registration statement of which thisprospectus forms a part.
Loans to Employees
We were party to loans with certain of our employees and officers with an aggregate balance of $18.7million as of January 3, 2021. Such loans were granted in connection with the purchase of equity in certain of oursubsidiaries. Each of such loans for the executive officers have been repaid in full prior to the date of thisoffering.
Competitive Compensation
Our compensation program for our NEOs is designed to compensate them competitively to ensure that weattract and retain the right talent to deliver stockholder value. For 2020, the remuneration and nominationcommittee engaged Korn Ferry, an independent compensation consultant, to advise on the compensationpractices and competitive landscape for the compensation of our NEOs. The remuneration and nominationcommittee generally reviews and targets between the 50th percentile and 75th percentile of market pay level whenassessing executive compensation, but pay decisions are based on a more comprehensive set of considerationssuch as company performance, individual executive performance, experience, and internal equity. Theremuneration and nomination committee reviews and uses two data sources for benchmarking compensation
139

analysis. The first source is peer group proxy data which mirrors the peer group historically used to value theCompany. The company’s revenue and EBITDA are near the 25th percentile of the peer group. Thecompensation consultant then performs a regression analysis to compare our compensation practices againstthose peers. The second compensation source is Korn Ferry’s 2018 Retail Executive Compensation Database.
At the end of 2020, the remuneration and nomination committee engaged FW Cook, an independentcompensation consultant, to assist with reviewing the compensation programs for our NEOs in connection withthis offering.
Other Benefits and Perquisites
Our NEOs participate in the same benefit plans generally available to our employees. These benefit plansinclude health insurance, ancillary coverages, life insurance and disability coverage. NEOs receive the samecoverage as the rest of our employees. In addition, our CEO is eligible to receive certain car and housingallowances.
Retirement Plans
Our NEOs participate in the same 401(k) retirement plan as the rest of our employees.
Employment and Change in Control Arrangements
As a standard practice, the Company does not generally enter into employment agreements or change incontrol agreements with its executive officers. However, an exception was made for Mr. Tattersfield andMr. Charlesworth, the first two executive hires after the JAB purchase. Following the completion of this offering,the Company intends to amend each of the Tattersfield and Charlesworth employment agreements to reflect thechanges to the Company’s organizational structure in connection with the Merger, as well as to increase eachexecutive’s long-term incentive compensation target amount to 100% of base salary and to limit the severancepayable to each executive upon a termination by the company without cause or by the executive for good reasonto no more than one year of base salary.
Except with respect to their own compensation, the CEO and the CPO make recommendations to theremuneration and nomination committee and the remuneration and nomination committee approves, any and allcompensation elements. The CPO works with the remuneration and nomination committee’s independentcompensation consultant to provide comparable market data for all compensation elements that are used inmaking such recommendations to the remuneration and nomination committee.
Additionally, we do not provide tax gross ups for our NEOs except in the case of standard relocationbenefits available to employees generally. In fiscal year 2020, we did not provide any relocation benefits to anyof our NEOs.
Tax and Accounting Implications
Section 162(m) of the Code generally limits, for U.S. corporate income tax purposes, the annual taxdeductibility of compensation paid to certain current and former executive officers to $1 million. Although theCompany believes that tax deductibility of executive compensation is an important consideration, theremuneration and nomination committee in its judgement may, nevertheless, authorize compensation paymentsthat are not fully tax deductible, and/or modify compensation programs and practices without regard for taxdeductibility, when it believes that such compensation is appropriate.
140

Summary Compensation Table
The following table sets forth information regarding the compensation earned by our NEOs in fiscal year2020.
Name and Principal Position YearSalary
($)
StockAwards
($)(1)
Non-EquityIncentive PlanCompensation
($)
All OtherCompensation
($)(2) Total ($)
Michael Tattersfield, President and Chief ExecutiveOfficer . . . . . . . . . . . . . . . . . . . . . . . . . . . . . . . . . . . 2020 $1,000,000 $550,436 $1,100,000 $18,169 $2,668,605
Joshua Charlesworth, Chief Financial Officer andChief Operating Officer . . . . . . . . . . . . . . . . . . . . . . 2020 $ 800,000 $500,000 $ 640,000 $11,400 $1,951,400
Andrew Skehan, North America President . . . . . . . . . 2020 $ 650,000 $500,000 $ 665,600 $11,400 $1,827,000Matthew Spanjers, Chief Growth Officer . . . . . . . . . . 2020 $ 525,000 $500,000 $ 420,000 $11,400 $1,456,400Theresa Zandhuis, Chief People Officer . . . . . . . . . . . 2020 $ 500,000 $400,000 $ 350,000 $11,400 $1,261,400
(1) Amounts reflect the full grant-date fair value of restricted stock unit awards granted during 2020 computedin accordance with ASC Topic 718. We provide information regarding the assumptions used to calculate thevalue of all restricted stock unit awards made to executive officers in Note 12 to our audited consolidatedfinancial statements included elsewhere in this prospectus.
(2) The amounts reported in the All-Other Compensation column reflect other compensation forMr. Tattersfield that includes: $10,689 for an auto lease, home allowance of $3,214 and home incidentals of$4,267. The amounts reported for all of the other NEOs reflect the Company matching contribution underour 401(k) plan for fiscal year 2020. Mr. Tattersfield was not eligible for a matching contribution under the401(k) plan for fiscal year 2020.
Grants of Plan-Based Awards
The following table sets forth information regarding equity plan awards and non-equity incentive planawards by us to our NEOs in fiscal year 2020.
NameGrantDate(1)
Estimated Future Payouts Under Non-Equity Incentive Plan Awards
All OtherStock
Awards:Numberof Sharesof Stockor Units
(#)
GrantDate FairValue of
StockAwards(2)
Threshold($) Target ($)
Maximum($)
Michael Tattersfield . . . . . . . . . . . . . . . . 4/1/2020 — $1,100,000 $2,200,000 $550,346Joshua Charlesworth . . . . . . . . . . . . . . . . 4/1/2020 — $ 640,000 $1,280,000 $499,957Andrew Skehan . . . . . . . . . . . . . . . . . . . . 4/1/2020 — $ 520,000 $1,040,000 $499,957Matthew Spanjers . . . . . . . . . . . . . . . . . . 4/1/2020 — $ 420,000 $ 840,000 $499,957Theresa Zandhuis . . . . . . . . . . . . . . . . . . 4/1/2020 — $ 350,000 $ 700,000 $400,022
(1) Each grant of RSUs cliff vests 4.5 years from the applicable grant subject to continued employment with uson the vesting date.
(2) In accordance with SEC rules, the amounts reported in this column represent the grant date fair value ofshares underlying the RSUs, calculated in accordance with ASC 718.
141

Outstanding Equity Awards At Fiscal Year-End
The following table sets forth information regarding unvested equity awards held by each NEO as ofDecember 31, 2020. All such awards relate to shares of common stock of KKHI.
Stock Awards
Name Grant Date(1)
Number of Shares orUnits of Stock ThatHave Not Vested (#)
Market Value ofShares or Unitsof Stock That
Have NotVested (2) ($)
Michael Tattersfield . . . . . . . . . . . . . . . 11/18/2016 $20,102,0004/7/2017 $ 517,8284/7/2017 $ 1,827,4735/1/2018 $ 132,0705/1/2018 $ 1,398,5974/1/2019 $ 113,6774/1/2019 $ 1,203,2059/6/2019 $ 119,0044/1/2020 $ 590,597
Joshua Charlesworth . . . . . . . . . . . . . . 4/7/2017 $ 6,091,6104/7/2017 $ 1,015,2525/1/2018 $ 776,9424/1/2019 $ 668,4924/1/2020 $ 536,522
Andrew Skehan . . . . . . . . . . . . . . . . . . 11/16/2017 $ 3,583,2825/1/2018 $ 776,9424/1/2019 $ 668,4924/1/2020 $ 536,522
Matthew Spanjers . . . . . . . . . . . . . . . . 4/7/2017 $ 6,091,6104/7/2017 $ 609,1915/1/2018 $ 466,1654/1/2019 $ 668,4924/1/2020 $ 536,522
Theresa Zandhuis . . . . . . . . . . . . . . . . . 9/15/2017 $ 2,150,0095/1/2018 $ 466,1653/4/2019 $ 334,2964/1/2019 $ 401,0354/1/2020 $ 429,278
(1) Each grant of RSUs cliff vests 4.5 years from the applicable grant subject to continued employment with uson the vesting date.
(2) The market value of shares underlying RSUs that have not vested is calculated based on the fair marketvalue of the shares of common stock of KKHI as of December 31, 2020, which our board of directorsdetermined to be $100.51.
Options Exercised and Stock Vested
No options were exercised by our NEOs in 2020, and none of the RSUs held by our NEOs vested in 2020.
Pension Benefits
We do not maintain any defined benefit pension plans for our NEOs.
142

Nonqualified Deferred Compensation
We do not maintain any nonqualified deferred compensation plans for our NEOs.
Post-Termination Compensation
Michael Tattersfield
The Company’s employment agreement with Mr. Tattersfield is an at-will employment agreement. In theevent (i) the Company terminates Mr. Tattersfield’s employment without Cause or (ii) if he terminates hisemployment for Good Reason, in each case, he will receive a payment equal to one year of base salary plus oneadditional month for each completed year he has worked for the Company subject to a maximum period of24 months. Prior to receiving any of the severance benefits, Mr. Tattersfield must execute and not revoke arelease of claims in favor of us. In addition, Mr. Tattersfield is subject to a one-year post-terminationnon-compete.
Joshua Charlesworth
The Company’s employment agreement with Mr. Charlesworth is an at-will employment agreement. In theevent (i) the Company terminates Mr. Charlesworth’s employment without Cause or (ii) if he terminates hisemployment for Good Reason, in each case, he will receive a payment equal to one year of base salary plus oneadditional month for each completed year he has worked for the Company subject to a maximum period of24 months. Prior to receiving any of the severance benefits, Mr. Charlesworth must execute and not revoke arelease of claims in favor of us. In addition, Mr. Charlesworth is subject to a one- year post-terminationnon-compete.
Equity Treatment Upon Termination Scenarios
Termination of Employment
In the event of an executive’s termination, all unvested RSUs will immediately forfeit on the date of suchtermination, except as described below.
Double-Trigger Equity Vesting Upon a Change of Control
In the event of a change of control of the Company, all outstanding RSUs and Matching RSUs, includingthose held by our NEOs, have “double-trigger” protection, which means that no accelerated vesting ofoutstanding RSUs will occur unless both (1) a change of control occurs, and (2) the executive is involuntarilyterminated within 24 months of such change of control.
Death or Disability
In the event of an executive’s termination due to death or disability, all outstanding RSUs and MatchingRSUs become fully vested and payable.
Retirement
In the event of an executive’s retirement (generally defined as attaining the age of 60 and completing tenyears of service), outstanding RSUs and Matching RSUs vest on a pro rata basis. None of our NEOs wereretirement-eligible as of December 31, 2020.
Potential Payments Upon Termination or Change in Control
The following table shows the cash severance payments and accelerated vesting of RSUs that our NEOswould have been eligible to receive from us if their employment had been terminated or if a change in control of
143

the Company followed by an immediate termination of employment had occurred as of December 31, 2020. Allamounts are estimates only, and the actual amounts payable will vary depending on the facts and circumstancesapplicable at the time of the triggering event.
Name
DollarAmount ofPayments
UponTermination
withoutCause or for
GoodReason
Value ofStock at
Terminationdue to
Retirement
Value of Stockat
Terminationdue to Death
or Disability(1)
DollarAmount ofPayments
UponInvoluntaryTerminationFollowing aChange in
Control
Value of StockUpon
InvoluntaryTerminationFollowing aChange inControl(2)
Michael Tattersfield . . . . . . . . . . . . . . . . . . $1,466,667 $— $70,105,725 $1,466,667 $70,105,725Joshua Charlesworth . . . . . . . . . . . . . . . . . $1,000,000 $— $16,734,413 $1,000,000 $16,734,413Andrew Skehan(1) . . . . . . . . . . . . . . . . . . . . $ — $— $ 9,648,558 $ — $ 9,648,558Matthew Spanjers(1) . . . . . . . . . . . . . . . . . . $ — $— $14,463,591 $ — $14,463,591Theresa Zandhuis(1) . . . . . . . . . . . . . . . . . . $ — $— $ 7,319,641 $ — $ 7,319,641
(1) Amounts reported in this column represent the value of RSUs that would be accelerated in full in connectionwith a termination of employment due to death or disability, determined by multiplying the value of thecommon stock of KKHI of $100.51 per share on December 31, 2020 by the number of RSUs
(2) Amounts reported in this column represent the value of RSUs that would be accelerated in full connectionwith an involuntary termination of employment on or following a change in control, determined bymultiplying the value of the common stock of KKHI of $100.51 per share on December 31, 2020 by thenumber of RSUs.
Director Compensation TableThe following table sets forth information regarding director compensation during our fiscal year 2020. We
pay four primary components of compensation to our non-employee directors: an annual cash retainer,committee retainer, committee chairman retainer, and equity grants in the form of time-vesting RSUs thatgenerally cliff vest at the end of 4.5 years. Board members may from time to time receive fees for service on adhoc committees. Based on the Company’s review of its current compensation programs for non-employeedirectors in connection with this offering, the following has been approved to be applicable following theoffering on an annual basis: (i) the Chairman will be entitled receive annually $200,000 in cash and RSUs with agrant date fair market value of $255,000, (ii) the Remuneration and Nomination Committee Chair will be entitledto receive annually $70,000 in cash and RSUs with a grant date fair market value of $100,000, (iii) the AuditCommittee Chair will receive annually $75,000 in cash and RSUs with a grant date fair market value of$100,000, (iv) the Lead Independent director will receive anually $80,000 in cash and RSUs with a grant date fairmarket value of $100,000 and (v) each other non-executive director will receive annually $60,000 in cash andRSUs with a grant date fair market value of $100,000 as well as $5,000 in cash for membership on theRemuneration and Nomination Committee or Audit and Finance Committee. Each such director will also beentitled to reimbursement for all out-of-pocket expenses of such director in attending each meeting of the Boardand any committee thereof.
Retainer ($)
Annual retainer for service on the Board . . . . . . . . . . . . . . . . $ 50,000Additional annual retainers:
for Chairman . . . . . . . . . . . . . . . . . . . . . . . . . . . . . . . . . $200,000for audit and finance committee chairman . . . . . . . . . . . $ 15,000for committee members . . . . . . . . . . . . . . . . . . . . . . . . . $ 5,000for remuneration and nomination committee
chairman . . . . . . . . . . . . . . . . . . . . . . . . . . . . . . . . . . . $ 10,000Annual Equity Grant
Retainer ($)
Chairman . . . . . . . . . . . . . . . . . . . . . . . . . . . . . . . . . . . . . . . . $255,000Other Board Members . . . . . . . . . . . . . . . . . . . . . . . . . . . . . . $ 85,000
144

Name
Fees Earnedor Paid inCash ($)(1)
StockAwards
($)(2)Total
($)
Olivier Goudet $196,875 $255,000 $451,875
Fabien Simon(3) $ 26,250 $ 85,000 $111,250
David Bell $ 56,250 $ 85,000 $141,250
David Deno $ 60,938 $ 85,000 $145,938
Carl Lee $ 51,563 $ 85,000 $136,563
Paul Michaels $ 46,875 $ 85,000 $131,875
Henry Yeagley (BDTCP)(4) $ 56,250 $ 85,000 $141,250
Manuel Martinez(5) $ 56,250 $ 85,000 $141,250
Justine Tan(6) $ 25,000 $ 85,000 $110,000
Ozan Dokmecioglu(6) $ 27,500 — $ 27,500
Michelle Weese(7) $ 12,500 — $ 12,500
(1) All members of the board agreed to a 25% reduction in the second quarter of fiscal year 2020 boardretainers. The retainers for subsequent quarters were paid at normal rates.
(2) Each grant of RSUs cliff vests at the end of 4.5 years subject to continued service on the board. The dollarvalue of the RSU grants reflect the grant date fair value of restricted stock unit awards calculated inaccordance with ASC Topic 718. As of December 31, 2020, each member of the Board held the followingnumber of unvested RSUs: Mr. Goudet: 64,763; Mr. Simon: 12,310; Mr. Bell: 27,888; Mr. Deno: 33,388;Mr. Lee: 27,888; Mr. Michaels: 18,443 (plus an additional 176,187 unvested RSUs held through hisinvestment vehicle); Mr. Yeagley: 0; Mr. Martinez: 4,994; Ms. Tan: 0; Mr. Dokmecioglu: 0; and Ms.Weese: 0.
(3) Mr. Simon ceased to be on the board as of September 22, 2020.(4) The board retainer for Mr. Yeagley is paid to BDT Investments.(5) Mr. Martinez ceased to be on the board as of March 2021.(6) Each of Ms. Tan and Mr. Dokmecioglu joined the board during the third quarter of fiscal year 2020.(7) Ms. Weese joined the board during the fourth quarter of fiscal year 2020.
Krispy Kreme, Inc. 2021 Omnibus Incentive Plan
Introduction
Prior to the completion of this offering, we intend to adopt the Krispy Kreme, Inc. 2021 Omnibus IncentivePlan (the “Plan”). The purposes of the Plan will be to provide additional incentives to selected officers,employees, non-employee directors, independent contractors and consultants of the Company and its affiliates, tostrengthen their commitment, motivate them to faithfully and diligently perform their responsibilities and toattract and retain competent and dedicated persons who are essential to the success of our business and whoseefforts will impact our long-term growth and profitability. To accomplish these purposes, the Plan provides thatthe Company may grant options, stock appreciation rights, restricted stock, restricted stock units, stock bonuses,other stock-based awards, cash awards or any combination of the foregoing.
The remuneration and nomination committee will determine the specific criteria surrounding equityissuances under the Plan. The material terms of the Plan, as it is currently contemplated, are summarized below.
Summary of Expected Plan Terms
The maximum number of shares of our common stock reserved for issuance under the Plan shall be equal to4.5% of the total number of shares of our common stock outstanding on the date of the consummation of this
145

offering (the “initial share reserve”). This reserve will automatically increase on January 1 (the “EvergreenDate”) of each calendar year during the term of the Plan, in an amount equal to the lesser of (i) 1% of the totalnumber of shares of our common stock issued and outstanding on December 31 immediately preceding theapplicable Evergreen Date and (ii) a number of shares of our common stock determined by the administrator. Themaximum aggregate number of shares of common stock that may be issued in the form of ISOs shall not exceedthe initial share reserve.
Non-employee directors are not permitted to be granted awards during any calendar year with a grant datefair value that, when aggregated with such non-employee director’s cash fees with respect to such calendar year,exceed $600,000 in total value.
Shares of our common stock subject to an award under the Plan that remain unissued upon the cancellation,termination or expiration of the award will again become available for grant under the Plan. However, shares ofour common stock that are exchanged by a participant or withheld by the Company as full or partial payment ofthe exercise price or other purchase price in connection with any award under the Plan, as well as any shares ofour common stock exchanged by a participant or withheld by the Company to satisfy the tax withholdingobligations related to any award, will not be available for subsequent awards under the Plan. To the extent anaward is paid or settled in cash, the number of shares of our common stock previously subject to the award willagain be available for grant pursuant to the Plan. To the extent that an award can only be settled in cash, suchaward will not be counted against the total number of shares of our common stock available for grant under thePlan.
The Plan will be administered by the remuneration and nomination committee (the “administrator”). Theadministrator may interpret the Plan and may prescribe, amend and rescind rules and make all otherdeterminations necessary or desirable for the administration of the Plan.
The Plan permits the plan administrator to select the officers, employees, non-employee directors,independent contractors and consultants who will receive awards, to determine the terms and conditions of thoseawards, including but not limited to the exercise price or other purchase price of an award, the number of sharesof our common stock or cash or other property subject to an award, the term of an award and the vesting scheduleapplicable to an award, and to amend the terms and conditions of outstanding awards.
The administrator may make awards to participants who are not citizens or residents of the United States, or toparticipants outside the United States, on terms and conditions that are different from those specified in the Plan,as may be determined necessary or desirable by the administrator to achieve the Plan’s purposes. Consistent withthis, the administrator may, without amending the Plan, establish or modify rules, procedures and subplans asmay be necessary or advisable to comply with provisions of laws in other countries or jurisdictions in which theCompany or any of its affiliates operates or has employees.
Restricted stock units (“RSUs”) and restricted stock may be issued under the Plan. The administrator willdetermine the purchase price, vesting schedule and performance objectives, if any, applicable to the grant ofRSUs and restricted stock. If the restrictions, performance objectives or other conditions determined by theadministrator are not satisfied, the RSUs and restricted stock will be forfeited. Subject to the provisions of thePlan and the applicable individual award agreement, the administrator may provide for the lapse of restrictions ininstallments or the acceleration or waiver of restrictions (in whole or part) under certain circumstances as setforth in the applicable individual award agreement, including the attainment of certain performance related goals,a participant’s termination of employment or service, or a participant’s death or disability. The rights of RSU andrestricted stock holders upon a termination of employment or service will be set forth in individual awardagreements.
Unless the applicable award agreement provides otherwise, participants with restricted stock will generallyhave all of the rights of a stockholder during the restricted period, including the right to vote and receivedividends declared with respect to such restricted stock, provided that any dividends declared during the
146

restricted period with respect to such restricted stock will generally only become payable if the underlyingrestricted stock vests. During the restricted period, participants with RSUs will generally not have any rights of astockholder, but, if the applicable individual award agreement so provides, may be credited with dividendequivalent rights that will be paid at the time that shares of our common stock in respect of the related RSUs aredelivered to the participant.
We may issue stock options under the Plan. Options granted under the Plan may be in the form of “non-qualified stock options” or “incentive stock options” within the meaning of Section 422 of the Internal RevenueCode of 1986, as amended, as set forth in the applicable individual option award agreement. The exercise price ofall options granted under the Plan will be determined by the administrator, but, unless otherwise determined bythe administrator, in no event may the exercise price be less than 100% of the fair market value of the relatedshares of our common stock on the date of grant. The maximum term of all stock options granted under the Planwill be determined by the administrator, but may not exceed ten years. Each stock option will vest and becomeexercisable (including in the event of the optionee’s termination of employment or service) at such time andsubject to such terms and conditions as determined by the administrator in the applicable individual optionagreement.
Stock appreciation rights (“SARs”) may be granted under the Plan either alone or in conjunction with all orpart of any option granted under the Plan. A free-standing SAR granted under the Plan entitles its holder toreceive, at the time of exercise, an amount per share equal to the excess of the fair market value (at the date ofexercise) of a share of our common stock over the base price of the free-standing SAR. A SAR granted inconjunction with all or part of an option under the Plan entitles its holder to receive, at the time of exercise of theSAR and surrender of the related option, an amount per share equal to the excess of the fair market value (at thedate of exercise) of a share of our common stock over the exercise price of the related option. Each SAR will begranted with a base price that is not less than 100% of the fair market value of the related shares of our commonstock on the date of grant. The maximum term of all SARs granted under the Plan will be determined by theadministrator, but may not exceed ten years. The administrator may determine to settle the exercise of a SAR inshares of our common stock, cash, or any combination thereof.
Each free-standing SAR will vest and become exercisable (including in the event of the SAR holder’stermination of employment or service) at such time and subject to such terms and conditions as determined bythe administrator in the applicable individual free-standing SAR agreement. SARs granted in conjunction with allor part of an option will be exercisable at such times and subject to all of the terms and conditions applicable tothe related option.
Other stock-based awards, valued in whole or in part by reference to, or otherwise based on, shares of ourcommon stock (including dividend equivalents) may be granted under the Plan. Any dividend or dividendequivalent awarded under the Plan will be subject to the same restrictions, conditions and risks of forfeiture asthe underlying awards and will only become payable if the underlying awards vest. The administrator willdetermine the terms and conditions of such other stock-based awards, including the number of shares of ourcommon stock to be granted pursuant to such other stock-based awards, the manner in which such other stock-based awards will be settled (e.g., in shares of our common stock or cash or other property), and the conditions tothe vesting and payment of such other stock-based awards (including the achievement of performance criteria).
Bonuses payable in fully vested shares of our common stock and awards that are payable solely in cash mayalso be granted under the Plan.
The administrator may grant equity-based awards and incentives under the Plan that are subject to theachievement of performance objectives selected by the administrator in its sole discretion, including, withoutlimitation, one or more of the following business criteria: (i) earnings, including one or more of operatingincome, net operating income, earnings before or after taxes, earnings before or after interest, depreciation,amortization, adjusted EBITDA, economic earnings, or extraordinary or special items or book value per share
147

(which may exclude nonrecurring items); (ii) pre-tax income or after-tax income; (iii) earnings per share (basic ordiluted); (iv) operating profit; (v) revenue, revenue growth or rate of revenue growth; (vi) return on assets (grossor net), return on investment, return on capital, or return on equity; (vii) returns on sales or revenues;(viii) operating expenses; (ix) stock price appreciation; (x) cash flow, free cash flow, cash flow return oninvestment (discounted or otherwise), net cash provided by operations, or cash flow in excess of cost of capital;(xi) implementation or completion of critical projects or processes; (xii) cumulative earnings per share growth;(xiii) operating margin or profit margin; (xiv) stock price or total stockholder return; (xv) cost targets, reductionsand savings, productivity and efficiencies; (xvi) strategic business criteria, consisting of one or more objectivesbased on meeting specified market penetration, geographic business expansion, customer satisfaction, employeesatisfaction, human resources management, supervision of litigation, and information technology goals, and goalsrelating to acquisitions, divestitures, joint ventures and similar transactions, and budget comparisons;(xvii) personal professional objectives, including any of the foregoing performance goals, the implementation ofpolicies and plans, the negotiation of transactions, the development of long-term business goals, formation ofjoint ventures, research or development collaborations, and the completion of other corporate transactions; and(xviii) any combination of, or a specified increase in, any of the foregoing. Notwithstanding the foregoing, theCompany may determine whether additional or different performance goals should be enumerated in the future.The administrator will have the authority to make equitable adjustments to the business criteria, as may bedetermined by the administrator in its sole discretion.
In the event of a merger, consolidation, reclassification, recapitalization, spin-off, spin-out, repurchase,reorganization, corporate transaction or event, special or extraordinary dividend or other extraordinarydistribution (whether in the form of shares of our common stock, cash or other property), stock split, reversestock split, subdivision or consolidation, combination, exchange of shares, or other change in corporate structureaffecting the shares of our common stock, an equitable substitution or proportionate adjustment shall be made, atthe sole discretion of the administrator, in (i) the aggregate number of shares of our common stock reserved forissuance under the Plan, (ii) the kind and number of securities subject to, and the exercise price or base price of,any outstanding options and SARs granted under the Plan, (iii) the kind, number and purchase price of shares ofour common stock, or the amount of cash or amount or type of property, subject to outstanding restricted stock,RSUs, stock bonuses and other stock-based awards granted under the Plan or (iv) the performance goals andperiods applicable to award granted under the Plan. Equitable substitutions or adjustments other than those listedabove may also be made as determined by the administrator. In addition, the administrator may terminate alloutstanding awards for the payment of cash or in-kind consideration having an aggregate fair market value equalto the excess of the fair market value of the shares of our common stock, cash or other property covered by suchawards over the aggregate exercise price or base price, if any, of such awards, but if the exercise price or baseprice of any outstanding award is equal to or greater than the fair market value of the shares of our commonstock, cash or other property covered by such award, the board of directors may cancel the award without thepayment of any consideration to the participant.
Unless otherwise determined by the administrator and evidenced in an award agreement, in the event that(i) a “change in control” (as defined in the Plan) occurs and (ii) a participant’s employment or service isterminated without cause, or with good reason (to the extent applicable), within 24 months following the changein control, then (a) any unvested or unexercisable portion of any award carrying a right to exercise shall becomefully vested and exercisable, and (b) the restrictions, deferral limitations, payment conditions and forfeitureconditions applicable to an award granted under the Plan will lapse and such unvested awards will be deemedfully vested and any performance conditions imposed with respect to such awards will be deemed to be achievedat target performance levels. The completion of this offering will not be a change of control under the Plan.
Each participant will be required to make arrangements satisfactory to the administrator regarding paymentof an amount up to the maximum statutory rates in the participant’s applicable jurisdictions with respect to anyaward granted under the Plan, as determined by us. We have the right, to the extent permitted by law, to deductany such taxes from any payment of any kind otherwise due to the participant. With the approval of theadministrator, the participant may satisfy the foregoing requirement by either electing to have us withhold from
148

delivery of shares of our common stock, cash or other property, as applicable, or by delivering already ownedunrestricted shares of our common stock, in each case, having a value not exceeding the applicable taxes to bewithheld and applied to the tax obligations. We may also use any other method of obtaining the necessarypayment or proceeds, as permitted by law, to satisfy our withholding obligation with respect to any award.
The Plan provides our board of directors with the authority to amend, alter or terminate the Plan, but no suchaction may adversely affect the rights of any participant with respect to outstanding awards without theparticipant’s consent. The administrator may amend an award, prospectively or retroactively, but no suchamendment may adversely affect the rights of any participant without the participant’s consent. Stockholderapproval of any such action will be obtained if required to comply with applicable law.
No award will be granted pursuant to the Plan on or after the tenth anniversary of the effective date of thePlan (although awards granted before that time will remain outstanding in accordance with their terms).
All awards will be subject to the provisions of any clawback policy implemented by us to the extent set forthin such clawback policy, and will be further subject to such deductions and clawbacks as may be required to bemade pursuant to any law, government regulation or stock exchange listing requirement.
We intend to file with the SEC a registration statement on Form S-8 covering the shares of our commonstock issuable under the Plan.
Krispy Kreme, Inc. 2021 Employee Stock Purchase Plan
Introduction
On June 21, 2021, the Company board of directors approved the Krispy Kreme Holdings, Inc. 2021Employee Stock Purchase Plan (the “ESPP”), effective as of and contingent on the consummation of the initialpublic offering of the Company’s Common Stock, and subject to approval of Company shareholders. If the ESPPis approved by Company shareholders and the initial public offering is consummated, the Company will beauthorized to offer eligible employees the ability to purchase shares of the Company stock at a discount, subjectto various limitations. The purpose of the ESPP is to assist eligible employees in acquiring a stock ownershipinterest in the Company, to align such employees’ interests with those of our shareholders and to encourage suchemployees to remain in the employment of the Company. To accomplish such purposes, the ESPP provides thatthe Company will be authorized to offer eligible employees the ability to purchase shares of the Company’s stockwith their accumulated payroll deductions. We believe that equity offers under the ESPP will assist the Companyin recruiting and retaining highly qualified employees. The material terms of the ESPP, as it is currentlycontemplated, are summarized below.
The ESPP
The ESPP is administered by our board of directors or an authorized committee thereof comprised ofnon-employee directors (the “ESPP administrator”). The ESPP is divided into two components: the “423Component” and the “Non-423 Component.” The 423 Component is intended to qualify under Section 423 of theCode. The Non-423 Component is not intended to qualify under Section 423 of the Code and may generally beused to grant stock options to certain non-U.S. employees and other employees designated by the ESPPadministrator.
Administration
Subject to the terms and conditions of the ESPP, the ESPP administrator will have discretionary authority toadminister and interpret the ESPP and to determine the terms and conditions of the offerings of CompanyCommon Stock to be made under the ESPP. Subject to applicable laws and regulations, the ESPP administrator is
149

authorized to delegate administrative duties under the ESPP to an officer of the Company or other individual orgroup. Interpretations and constructions of the ESPP administrator of any provision of the ESPP or of any rightsthereunder will be conclusive and binding on all persons. No member of our board of directors or individualexercising administrative authority with respect to the ESPP will be liable for any action or determination madein good faith with respect to the ESPP.
Share Reserve
The initial maximum number of Company Common Stock which will be authorized for sale under the ESPPis equal to 1.5% of the total number of shares of Company Common Stock outstanding on consummation of theinitial public offering of the Company’s Common Stock.
Eligibility
Employees eligible to participate in the ESPP for a given offering generally include employees who areemployed by the Company or one of its designated subsidiaries on the first day of the offering. Unless otherwisedetermined by the ESPP administrator or required by law, employees of the Company or its designatedsubsidiaries who, as of the first day of an offering, are customarily scheduled to work less than 20 hours per weekor customarily work less than five months in a calendar year will not be eligible to participate in the offeringunder the ESPP.
Participation
Employees will enroll under the ESPP by completing an enrollment form permitting the deduction fromtheir compensation of at least 1% of their compensation but not more than 15% of their compensation during anoffering. Such payroll deductions must be expressed as a whole number percentage, and the accumulateddeductions will be credited to a notional account and applied to the purchase of shares on the exercise date of theoffering.
However, an employee will not be permitted to participate in an offering if, immediately after the option topurchase stock in the offering were granted, the employee would own (or be deemed to own through attribution)5% or more of the total combined voting power or value of all classes of stock of the Company, or of a subsidiaryor parent company of the Company. In addition, a participant may not purchase more than 5,000 shares in eachoffering or any lesser maximum number determined by the ESPP administrator. A participant may not be grantedan option that permits the participant’s rights to purchase shares of the Company common stock to accrue at arate exceeding $25,000 in fair market value of such stock (determined at the time the option is granted) under theESPP or any other employee stock purchase plan of the Company and its parent and subsidiary companies duringany calendar year. Furthermore, a participant may not sell or otherwise dispose of such shares of Common Stockpurchased by the participant upon exercise of an option for a period of at least six months following the exercisedate.
Offering
Under the ESPP, participants are offered the option to purchase shares of the Company Common Stock at adiscount during a series of successive offerings, the duration and timing of which will be determined by the ESPPadministrator. However, in no event may an offering be longer than 27 months in length.
The option price for an offering will be 85% of the closing trading price per share on the exercise date.
Unless a participant has withdrawn from participation in the ESPP before the exercise date of the applicableoffering, the participant will be deemed to have exercised the participant’s option in full as of such exercise date.Upon exercise, the participant will purchase the number of whole shares that the participant’s accumulatedpayroll deductions will buy at the option price, subject to the participation limitations listed above.
150

A participant may cancel his or her payroll deduction authorization and withdraw from the offering at anytime prior to the end of the offering. Upon withdrawal, the participant will receive a refund of the participant’snotional account balance in cash without interest. If a participant withdraws from an offering, the participant maynot later re-enroll in the same offering, but the participant may (if eligible) enroll in any later offering under theESPP. If a participant wants to increase or decrease the rate of payroll withholding, the participant may do soeffective for the next offering by submitting a new enrollment form before the offering for which such change isto be effective.
A participant may not transfer any rights under the ESPP other than by will or the laws of descent anddistribution. During a participant’s lifetime, options in the ESPP shall be exercisable only by such participant.The ESPP is unfunded, and all funds received by the Company under the ESPP may be combined with othercorporate funds and used for any corporate purpose, unless otherwise required by applicable law.
Adjustments
In the event of any stock split, reverse stock split, stock dividend, combination or reclassification of thecommon stock, spin-off, or other similar change in capitalization or event, we will proportionately adjust thenumber and class of shares approved under the ESPP, the option price for an offering and the maximum numberof shares which a participant may elect to purchase in any single offering. If the Company is liquidated ordissolved, the ESPP administrator may provide that options to purchase stock under the ESPP will convert intothe right to receive liquidation proceeds (net of the option price). In connection with a merger with or intoanother corporation, a sale of all or substantially all of our assets or common stock, or any other transaction inwhich the owners of our voting power immediately before the transaction do not hold a majority following thetransaction, the ESPP administrator may take any of the following actions, or do any combination thereof:(i) determine that each outstanding option will be assumed or an equivalent option substituted by the successorcorporation or the parent or subsidiary of the successor corporation; (ii) upon written notice to participants,provide that all outstanding options will become exercisable to the extent of accumulated payroll deductions as ofa specified date that is more than 10 days before the effective date of the applicable corporate transaction;(iii) upon written notice to participants, provide that all outstanding options will be canceled and accumulatedpayroll deductions will be returned to participants; or (iv) if the applicable transaction provides for cashpayments to the holders of the Company Common Stock, provide for cash payments to participants in amountsbased on the per-share amount of such cash payments to the shareholders.
Amendment and Termination
The ESPP administrator may amend, suspend or terminate the ESPP at any time. However, to the extentrequired by applicable laws, the ESPP administrator may not amend the ESPP without obtaining shareholderapproval within 12 months before or after the date such amendment is adopted.
Material U.S. Federal Income Tax Consequences
The following is a general summary under current law of the principal United States federal income taxconsequences related to the purchase of shares under the ESPP. This summary deals with the general federalincome tax principles that apply and is provided only for general information. Some kinds of taxes, such as state,local and foreign income taxes and federal employment taxes, are not discussed. As such, tax consequences foremployees participating in the Non-423 Component of the ESPP are not discussed. This summary is not intendedas tax advice to participants, who should consult their own tax advisors.
The 423 Component of the ESPP, and the right of participants to make purchases thereunder, is intended toqualify under the provisions of Section 423 of the Code. Under the applicable Code provisions, no income willbe taxable to a participant until the sale or other disposition of the shares purchased under the ESPP. This meansthat an eligible employee will not recognize taxable income on the date the employee is granted an option under
151
the ESPP. In addition, the employee will not recognize taxable income upon the purchase of shares. Upon a saleor disposition of shares purchased under the ESPP, the participant generally will be subject to tax in an amountthat depends upon the length of time such shares are held by the participant prior to disposing of them. If theshares are sold or disposed of more than two years from the date of grant and more than one year from the date ofpurchase, or if the participant dies while holding the shares: (i) the participant (or the participant’s estate) willrecognize compensation taxable as ordinary income measured as the lesser of (A) the excess of the fair marketvalue of the shares at the time of such sale or disposition (or death) over the purchase price or (B) an amountequal to the applicable discount from the fair market value of the shares as of the date of grant; and (ii) even ifthe participant (or the participant’s estate) recognizes ordinary income, we or our subsidiaries or affiliatesgenerally will not be entitled to a federal income tax deduction. Any additional gain will be treated as long-termcapital gain. If the shares are held for the holding periods described above but are sold for a price that is less thanthe purchase price, there is no ordinary income and the participating employee has a long-term capital loss for thedifference between the sale price and the purchase price.
If the shares are sold or otherwise disposed of before the expiration of the holding periods described aboveat a price that is more than the purchase price: (i) the participant will recognize compensation taxable as ordinaryincome generally measured as the excess of the fair market value of the shares on the date the participantpurchased the shares under the ESPP over the purchase price; and (ii) the Company will generally be entitled to atax deduction for compensation expense in the amount of ordinary income recognized by the participant. Anyadditional gain on such sale or disposition will be long-term or short-term capital gain, depending on how longthe shares were held following the date they were purchased by the participant prior to disposing of them. If theshares are sold or otherwise disposed of before the expiration of the holding periods described above but are soldat a price that is less than the purchase price, the participant will recognize ordinary income equal to the excess ofthe fair market value of the shares on the date the participant purchased the shares under the ESPP over thepurchase price (and the Company will generally be entitled to a corresponding deduction), but the participantgenerally will be able to report a capital loss equal to the difference between the sales price of the shares and thefair market value of the shares on the date the participant purchased them.
Vote Required for Approval
The approval of the ESPP Proposal requires an ordinary resolution under Delaware law, being theaffirmative vote of a majority of the ordinary shares attending virtually or by proxy and entitled to vote thereonand who vote at the special meeting. Abstentions and broker non-votes, while considered present for the purposesof establishing a quorum, will not count as votes cast at the special meeting.
Abstentions and broker non-votes, while considered present for the purposes of establishing a quorum, willnot count as votes cast at the special meeting.
152
CERTAIN RELATIONSHIPS AND RELATED PARTY TRANSACTIONS
In addition to the director and executive officer compensation arrangements discussed above in the sectionentitled “Executive Compensation,” this section describes transactions, or series of related transactions, sinceJanuary 1, 2018 to which we were a party or will be a party, in which:
• the amount involved exceeded or will exceed $120,000; and
• any of our directors, executive officers or beneficial owners of more than 5% of any class of our capitalstock (each, a “5% Holder”), or any members of the immediate family of and any entity affiliated withany such person, had or will have a direct or indirect material interest.
Existing Commercial Arrangements with JAB Related Persons
Immediately following this offering and the Distribution, JAB will beneficially own approximately 38.6%of our common stock through its affiliates (or approximately 37.7% if the underwriters exercise their option topurchase additional shares in full), prior to giving effect to any purchase by JAB of shares in this offering. Wehave negotiated certain arm’s-length commercial arrangements with certain companies that JAB has controllinginvestments in which are set forth below:
License, Distribution and Supply Agreements
We have entered into a licensing agreement, as amended, with Keurig Dr Pepper Inc. (“KDP”), an affiliateof JAB, pursuant to which KDP maintains certain licenses to the Krispy Kreme trademark for use in themanufacturing of portion packs for the Keurig brewing system (“Keurig Packs”). For the years ended January 3,2021, December 29, 2019 and December 30, 2018, royalty revenues from Keurig Packs sold through KDP were$1.9 million, $2.4 million and $2.3 million, respectively.
Tax Sharing Arrangements
We are also party to certain tax sharing arrangements, (the “Tax Matters Agreement”), entered into inDecember 2018 with JAB and certain of its affiliates. The Tax Matters Agreement governs the parties’ respectiverights, responsibilities and obligations with respect to tax liabilities and entitlement to refunds thereof, allocateresponsibility for, and cooperation in, the filings of tax refunds and provide for certain other matters relating totaxes. We had a $7.4 million and $7.4 million related party receivable from JAB as of January 3, 2021 andDecember 29, 2019, respectively. In the fiscal year ended December 29, 2019, we collected $28.6 million cashfrom the related-party income tax receivable balance outstanding as of December 30, 2018. In addition, we had a$15.3 million and $0.0 million related party payable to the other JAB affiliates party to the Tax MattersAgreement as of January 3, 2021 and December 29, 2019, respectively, offset with a $15.3 million income taxreceivable due from taxing authorities in the fiscal year ended January 3, 2021.
Related Party Notes
We are party to the Related Party Notes entered into in April 2019 with KK G.P. The Related Party Noteswill mature in series: $202.3 million in October 2027, $89.9 million in October 2028 and $44.9 million inOctober 2029, with an interest rate of 6.55%, 6.65% and 6.75%, respectively. The interest payment is due 60days after December 31 of each calendar year. Any overdue amount of principal and interest will bear interestpayable at a rate per annum equal to the sum of (1) 2% and (2) the weighted average interest rates of the notes.The unpaid accrued interest is included in Related Party Notes payable in the consolidated balance sheets.Additionally, the Related Party Notes include covenants that prohibit us from subordinating the Related PartyNotes to other unsecured indebtedness. As of January 3, 2021, and December 29, 2019, the outstanding amountof principal and interest was $344.6 million and $340.2 million, respectively. The interest expense for the fiscalyears ended January 3, 2021, December 29, 2019 and December 30, 2018 was $22.5 million, $21.9 million and$18.9 million, respectively.
153

In June 2021, the Related Party Notes were repaid in full in an aggregate amount of $355.0 million with aportion of the KKHI pro rata dividend, which was paid from the proceeds from the Term Loan Facility.Therefore, we anticipate less interest expense and higher cash provided by operating activities in future periods.
In addition, in June 2021 out of the proceeds of the KKHI pro rata dividend, $42.3 million was paid as a prorata dividend to the management and directors of KKHI and $102.7 million went to the redemption of commonstock held by KK G.P.
Capital Contributions
On April 9, 2021, the Company received $144.1 million in capital contributions from JAB and certainminority interest investors. This amount will be accounted for as a capital contribution in the CondensedConsolidated Statements of Changes in Shareholders’ Equity.
Transactions to be Entered into in Connection with this OfferingInvestors’ Rights Agreement
In connection with this offering, the Company will enter into the Investors’ Rights Agreement with JAB thatwill, among other things, (i) provide JAB and such holders with customary “demand,” “shelf” and “piggyback”registration rights with respect to shares of our common stock beneficially owned by JAB and such holdersfollowing this offering and (ii) govern certain information rights between JAB and the Company. The Investors’Rights Agreement will also provide that the Company will pay certain expenses relating to such registrations andindemnify the registration rights holders against (or make contributions in respect of) certain liabilities whichmay arise under the Securities Act. The registration rights granted pursuant to the Investors’ Rights Agreementmay be assigned by JAB to any person or entity who subsequently obtains registrable securities from JAB or anyof its affiliates.
Term Loan FacilityOn June 10, 2021, KKHI entered into the Term Loan Facility in an initial aggregate principal amount of
$500.0 million which will be required to be repaid within four business days of receipt of the net proceeds fromthe Company’s initial public offering. KKHI used all of the proceeds from the Term Loan Facility in June 2021to pay a pro rata dividend to us and members of its management who, prior to the Merger, beneficially heldequity interests in KKHI in an aggregate amount of approximately $457.7 million and $42.3 million,respectively. The Company used approximately $355.0 million of the proceeds from the dividend it received torepay the Related Party Notes and the remaining approximately $102.7 million of the proceeds from suchdividend to redeem certain common stock held by its sole shareholder, KK G.P. The Company intends to use aportion of the net proceeds from this offering to repay the outstanding indebtedness under the Term LoanFacility.
Financial Advisory AgreementIn September 2019, we entered into a service agreement, replacing a previous agreement, with BDT &
Company, LLC (“BDT”), a minority investor in KKI, to provide strategic, financial and structural advice to ourwholly-owned subsidiary, Krispy Kreme Doughnut Corporation (“KKDC”) in connection with KKDC’sacquisition strategy. For the years ended January 3, 2021, December 29, 2019 and December 30, 2018 the costsof BDT’s services provided to Krispy Kreme Doughnut Corporation pursuant to such agreements were$1.8 million, $0.0 million and $1.6 million, respectively.
In June 2021, we entered into a service agreement with BDT to provide advisory services to KKDC,including strategic, financial and structural advice in connection with this offering. The advisory fees payableunder this agreement are expected to be between $4.5 million and $7.0 million, plus expenses not to exceed$100,000. The agreement was deemed effective as of August 1, 2020 and will terminate upon the consummationof this offering.
Loans to EmployeesPrior to this offering, we were party to certain loans entered into between November 2016 and
October 2020, by and between ourselves and certain of our employees and officers, which held an aggregate
154

balance of $18.7 million and $17.2 million as of January 3, 2021 and December 29, 2019, respectively. Suchloans were granted in connection with the purchase of equity in certain of our subsidiaries. The loans held by ourexecutive officers, comprising an aggregate of $14.6 million of the outstanding balance, were repaid in full onMay 14, 2021.
Repurchase Agreements with Management
On June 21, 2021, we entered into repurchase agreements with certain of our executive officers pursuant towhich we agreed to purchase, using a portion of the net proceeds of this offering, up to $26.2 million aggregateamount of our common stock at the price to be paid by the underwriters in this offering at (or approximately 1.2million shares) assuming an initial public offering price of $22.50 per share (the midpoint of the price range setforth on the cover of this prospectus). The repurchase of shares resulting in aggregate proceeds of $26.2 million,at a price per share equal to the price paid by the underwriters in this offering (or approximately 1.2 millionshares) based on a price to the public at the midpoint of the price range on the cover in this prospectus. Thenumber of shares to be repurchased pursuant to each agreement is tied to a fixed aggregate proceeds and based onthe price paid by the underwriters to the Company in the IPO, with a maximum number of shares under eachagreement equal to the number of RSUs vesting or for which vesting has been accelerated for such individual.The shares to be repurchased will be comprised of shares issuable pursuant to outstanding RSUs that will vest orfor which vesting will be accelerated in connection with the completion of this offering. Such repurchases will beconsummated immediately following this offering.
Directed Share Program
At our request, the underwriters have reserved for sale at the initial public offering price per share up to5.0% of the shares of common stock offered by this prospectus for sale, to some of our directors, officers,employees, distributors, dealers, business associates and related persons. If purchased by our directors andofficers, the shares will be subject to a 180-day lock-up restriction.
Policies and Procedures for Related Person Transactions
Prior to the completion of this offering, our board of directors will adopt a written statement of policyregarding transactions with related persons (the “Related Person Policy”). Our Related Person Policy requiresthat a “related person” (as defined in paragraph (a) of Item 404 of Regulation S-K) must disclose to our ChiefLegal Officer any “related person transaction” (defined as any transaction that is anticipated to be reportable byus under Item 404(a) of Regulation S-K in which we were or are to be a participant and the amount involvedexceeds $120,000 and in which any related person had or will have a direct or indirect material interest) and allmaterial facts with respect thereto. Our Chief Legal Officer will then communicate that information to our auditand finance committee, or chair thereof. No related person transaction will be executed without the approval orratification of our board of directors or a duly authorized committee of our board of directors. It is our policy thatdirectors interested in a related person transaction will recuse themselves from any vote on a related persontransaction in which they have an interest.
Indemnification of Directors and Officers
Our amended and restated bylaws will provide that we will indemnify our directors and officers to thefullest extent permitted by the DGCL. In addition, our amended and restated certificate of incorporation willprovide that our directors will not be liable for monetary damages for breach of fiduciary duty to the fullestextent permitted by the DGCL.
155

PRINCIPAL STOCKHOLDERS
The following table sets forth information with respect to the beneficial ownership of our common stockimmediately prior to and following the completion of this offering and the use of proceeds therefrom and theDistribution by:
• each person known by us to beneficially own more than 5% of our common stock;
• each of our directors;
• each of our NEOs; and
• all of our executive officers and directors as a group.
For further information regarding material transactions between us and the principal stockholders,see “Certain Relationships and Related Party Transactions.”
The number of shares of common stock outstanding before this offering and the corresponding percentageof beneficial ownership are based on the number of shares of common stock outstanding as of June 21, 2021before the offering. The table below excludes any purchases that may be made through our directed shareprogram or otherwise in this offering. See “Underwriting (Conflict of Interest)—Directed Share Program.” Thenumber of shares of common stock outstanding after this offering and the corresponding percentage of beneficialownership are based on the number of shares of common stock issued and outstanding as of June 21, 2021, aftergiving effect to the offering and the use of proceeds therefrom (based on the midpoint of the initial publicoffering price range set forth on the cover of this prospectus and assuming no exercise of the underwriters’ optionto purchase additional shares).
The number of shares beneficially owned by each stockholder is determined under rules issued by the SECand includes voting or investment power with respect to securities. Under these rules, beneficial ownershipincludes any shares as to which the individual or entity has sole or shared voting power or investment power. Incomputing the number of shares beneficially owned by an individual or entity and the percentage ownership ofthat person, shares of common stock subject to equity awards or other rights held by such person that arecurrently exercisable or will become exercisable or will become settled in shares, in each case within 60 daysafter June 21, 2021 are considered outstanding, although these shares are not considered outstanding for purposesof computing the percentage ownership of any other person. Each of the stockholders listed has sole voting andinvestment power with respect to the shares beneficially owned by the stockholder unless noted otherwise,subject to community property laws where applicable. Except as otherwise noted below, the address for eachperson or entity listed in the table is c/o Krispy Kreme, Inc., 2116 Hawkins Street, Charlotte, North Carolina28203.
Beneficial OwnershipBefore the Offering
and Distribution
Shares to beRepurchasedwith Proceedsof the Offering
Beneficial OwnershipAfter the Offering and
the Distribution
Name of Beneficial OwnerShares of
Common Stock %Shares of
Common Stock %Shares of
Common Stock %
5% StockholdersKK G.P. (1)(2) . . . . . . . . . . . . . . . . . . . . . . . . . . . 124,812,190 93.0 — — — —JAB Indulgence B.V.(3) . . . . . . . . . . . . . . . . . . — — — — 62,142,733 38.6BDT & Company, LLC(4) . . . . . . . . . . . . . . . . . — — — — 14,032,549 8.7NEOs and DirectorsOlivier Goudet(5) . . . . . . . . . . . . . . . . . . . . . . . . 529,149 * — — 529,149 *Paul Michaels . . . . . . . . . . . . . . . . . . . . . . . . . . 512,053 * — — 512,053 *David Bell . . . . . . . . . . . . . . . . . . . . . . . . . . . . 25,126 * — — 25,126 *Patricia Capel . . . . . . . . . . . . . . . . . . . . . . . . . . — — — — — —Ozan Dokmecioglu . . . . . . . . . . . . . . . . . . . . . 136,820 * — — 136,820 *Dave Deno . . . . . . . . . . . . . . . . . . . . . . . . . . . . 44,004 * — — 44,004 *Carl E. Lee, Jr. . . . . . . . . . . . . . . . . . . . . . . . . . 198,018 * — — 198,018 *Debbie Roberts . . . . . . . . . . . . . . . . . . . . . . . . . — — — — — —Lubomira Rochet . . . . . . . . . . . . . . . . . . . . . . . — — — — — —
156
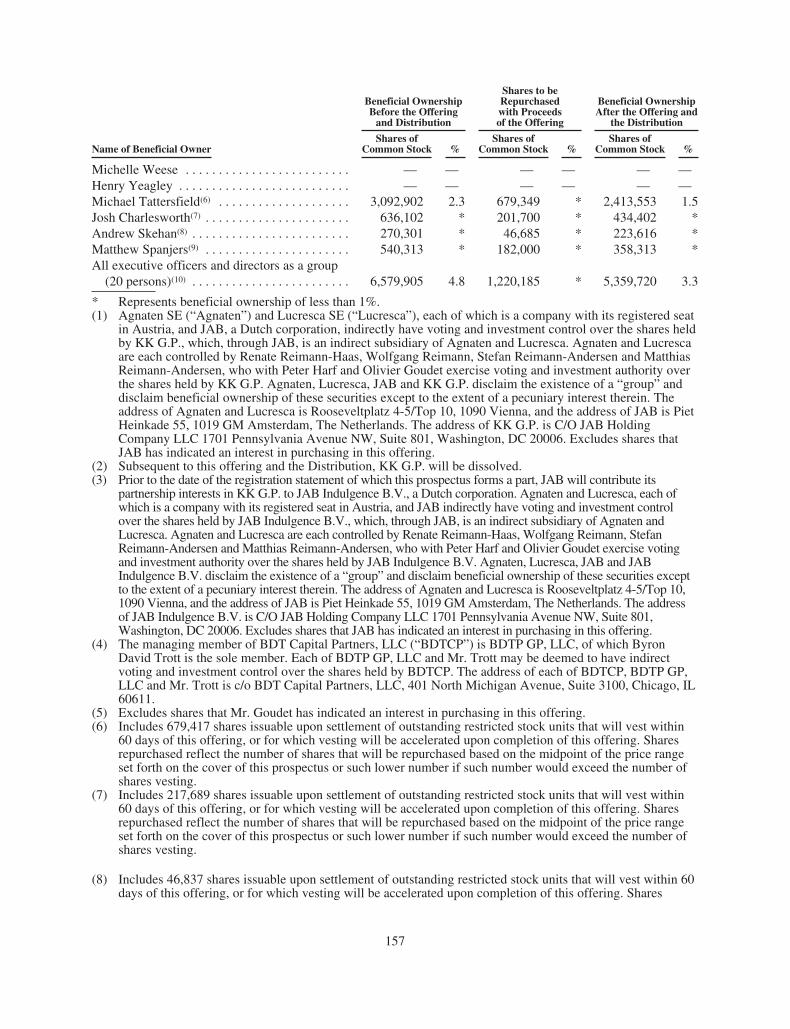
Beneficial OwnershipBefore the Offering
and Distribution
Shares to beRepurchasedwith Proceedsof the Offering
Beneficial OwnershipAfter the Offering and
the Distribution
Name of Beneficial OwnerShares of
Common Stock %Shares of
Common Stock %Shares of
Common Stock %
Michelle Weese . . . . . . . . . . . . . . . . . . . . . . . . . — — — — — —Henry Yeagley . . . . . . . . . . . . . . . . . . . . . . . . . . — — — — — —Michael Tattersfield(6) . . . . . . . . . . . . . . . . . . . . 3,092,902 2.3 679,349 * 2,413,553 1.5Josh Charlesworth(7) . . . . . . . . . . . . . . . . . . . . . . 636,102 * 201,700 * 434,402 *Andrew Skehan(8) . . . . . . . . . . . . . . . . . . . . . . . . 270,301 * 46,685 * 223,616 *Matthew Spanjers(9) . . . . . . . . . . . . . . . . . . . . . . 540,313 * 182,000 * 358,313 *All executive officers and directors as a group
(20 persons)(10) . . . . . . . . . . . . . . . . . . . . . . . . 6,579,905 4.8 1,220,185 * 5,359,720 3.3
* Represents beneficial ownership of less than 1%.(1) Agnaten SE (“Agnaten”) and Lucresca SE (“Lucresca”), each of which is a company with its registered seat
in Austria, and JAB, a Dutch corporation, indirectly have voting and investment control over the shares heldby KK G.P., which, through JAB, is an indirect subsidiary of Agnaten and Lucresca. Agnaten and Lucrescaare each controlled by Renate Reimann-Haas, Wolfgang Reimann, Stefan Reimann-Andersen and MatthiasReimann-Andersen, who with Peter Harf and Olivier Goudet exercise voting and investment authority overthe shares held by KK G.P. Agnaten, Lucresca, JAB and KK G.P. disclaim the existence of a “group” anddisclaim beneficial ownership of these securities except to the extent of a pecuniary interest therein. Theaddress of Agnaten and Lucresca is Rooseveltplatz 4-5/Top 10, 1090 Vienna, and the address of JAB is PietHeinkade 55, 1019 GM Amsterdam, The Netherlands. The address of KK G.P. is C/O JAB HoldingCompany LLC 1701 Pennsylvania Avenue NW, Suite 801, Washington, DC 20006. Excludes shares thatJAB has indicated an interest in purchasing in this offering.
(2) Subsequent to this offering and the Distribution, KK G.P. will be dissolved.(3) Prior to the date of the registration statement of which this prospectus forms a part, JAB will contribute its
partnership interests in KK G.P. to JAB Indulgence B.V., a Dutch corporation. Agnaten and Lucresca, each ofwhich is a company with its registered seat in Austria, and JAB indirectly have voting and investment controlover the shares held by JAB Indulgence B.V., which, through JAB, is an indirect subsidiary of Agnaten andLucresca. Agnaten and Lucresca are each controlled by Renate Reimann-Haas, Wolfgang Reimann, StefanReimann-Andersen and Matthias Reimann-Andersen, who with Peter Harf and Olivier Goudet exercise votingand investment authority over the shares held by JAB Indulgence B.V. Agnaten, Lucresca, JAB and JABIndulgence B.V. disclaim the existence of a “group” and disclaim beneficial ownership of these securities exceptto the extent of a pecuniary interest therein. The address of Agnaten and Lucresca is Rooseveltplatz 4-5/Top 10,1090 Vienna, and the address of JAB is Piet Heinkade 55, 1019 GM Amsterdam, The Netherlands. The addressof JAB Indulgence B.V. is C/O JAB Holding Company LLC 1701 Pennsylvania Avenue NW, Suite 801,Washington, DC 20006. Excludes shares that JAB has indicated an interest in purchasing in this offering.
(4) The managing member of BDT Capital Partners, LLC (“BDTCP”) is BDTP GP, LLC, of which ByronDavid Trott is the sole member. Each of BDTP GP, LLC and Mr. Trott may be deemed to have indirectvoting and investment control over the shares held by BDTCP. The address of each of BDTCP, BDTP GP,LLC and Mr. Trott is c/o BDT Capital Partners, LLC, 401 North Michigan Avenue, Suite 3100, Chicago, IL60611.
(5) Excludes shares that Mr. Goudet has indicated an interest in purchasing in this offering.(6) Includes 679,417 shares issuable upon settlement of outstanding restricted stock units that will vest within
60 days of this offering, or for which vesting will be accelerated upon completion of this offering. Sharesrepurchased reflect the number of shares that will be repurchased based on the midpoint of the price rangeset forth on the cover of this prospectus or such lower number if such number would exceed the number ofshares vesting.
(7) Includes 217,689 shares issuable upon settlement of outstanding restricted stock units that will vest within60 days of this offering, or for which vesting will be accelerated upon completion of this offering. Sharesrepurchased reflect the number of shares that will be repurchased based on the midpoint of the price rangeset forth on the cover of this prospectus or such lower number if such number would exceed the number ofshares vesting.
(8) Includes 46,837 shares issuable upon settlement of outstanding restricted stock units that will vest within 60days of this offering, or for which vesting will be accelerated upon completion of this offering. Shares
157

repurchased reflect the number of shares that will be repurchased based on the midpoint of the price rangeset forth on the cover of this prospectus or such lower number if such number would exceed the number ofshares vesting.
(9) Includes 206,944 shares issuable upon settlement of outstanding restricted stock units that will vest within60 days of this offering, or for which vesting will be accelerated upon completion of this offering. Sharesrepurchased reflect the number of shares that will be repurchased based on the midpoint of the price rangeset forth on the cover of this prospectus or such lower number if such number would exceed the number ofshares vesting.
(10) Includes an aggregate of 1,260,122 shares issuable upon settlement of outstanding restricted stock units thatwill vest within 60 days of this offering, or for which vesting will be accelerated upon completion of thisoffering, consisting of 679,417 shares attributable to Mr. Tattersfield, 217,689 shares attributable toMr. Charlesworth, 46,837 shares attributable to Mr. Skehan, 206,944 shares attributable to Mr. Spanjers,36,453 shares attributable to David Skena, 36,344 shares attributable to Catherine Tang and 36,438 sharesattributable to Terri Zandhuis. Shares repurchased reflect the number of shares that will be repurchasedbased on the midpoint of the price range set forth on the cover of this prospectus or such lower number ifsuch number would exceed the number of shares vesting.
158

DESCRIPTION OF CAPITAL STOCK
The following description of our capital stock gives effect to this offering and is qualified in its entirety byreference to our organizational documents, the forms of which will be filed as exhibits to the registrationstatement of which this prospectus forms a part, and by applicable law.
Upon completion of the Stock Split and this offering, our authorized capital stock will consist of300,000,000 shares of common stock, par value $0.01 per share, and 50,000,000 shares of preferred stock, parvalue $0.01 per share. Immediately following the completion of this offering and the use of proceeds therefrom,we will have 160,890,354 shares of common stock outstanding. There will be no shares of preferred stockoutstanding immediately following the completion of this offering. Unless our board of directors determinesotherwise, we will issue all shares of our capital stock in uncertificated form.
Common Stock
Holders of our common stock are entitled to one vote for each share held of record on all matters submittedto a vote of stockholders. Generally, all matters to be voted on by stockholders must be approved by a majority ofthe votes entitled to be cast by all holders of shares of common stock present in person or represented by proxy.Except as otherwise provided by law, amendments to the amended and restated certificate of incorporation mustbe approved by a majority or, in some cases, a super-majority of the voting power of all shares of common stock.
Holders of our common stock will be entitled to receive dividends when and if declared by our board ofdirectors out of funds legally available therefor, subject to any statutory or contractual restrictions on thepayment of dividends and to any restrictions on the payment of dividends imposed by the terms of anyoutstanding preferred stock.
Upon our liquidation, dissolution or winding up and after payment in full of all amounts required to be paidto creditors and to the holders of preferred stock having liquidation preferences, if any, the holders of shares ofour common stock will be entitled to receive pro rata our remaining assets available for distribution.
Holders of our common stock do not have preemptive, subscription, redemption or conversion rights. Thecommon stock will not be subject to further calls or assessment by us. There will be no redemption or sinkingfund provisions applicable to the common stock. All shares of our common stock that will be outstanding at thetime of the completion of the offering will be fully paid and non-assessable.
Preferred Stock
Our amended and restated certificate of incorporation will authorize our board of directors to establish oneor more series of preferred stock (including convertible preferred stock).
Unless required by law or by any stock exchange, the authorized shares of preferred stock will be availablefor issuance without further action by you. Our board of directors may determine, with respect to any series ofpreferred stock, the terms and rights of that series, including:
• the designation of the series;
• the number of shares of the series, which our board of directors may, except where otherwise providedin the preferred stock designation, increase or decrease, but not below the number of shares thenoutstanding;
• the dividend rights, conversion rights, redemption privileges and liquidation preferences of the series;
• whether the shares of the series will be convertible into shares of any other class or series, or any othersecurity, of our Company or any other entity, and, if so, the specification of the other class or series or
159

other security, the conversion price or prices or rate or rates, any rate adjustments, the date or dates asof which the shares will be convertible and all other terms and conditions upon which the conversionmay be made;
• restrictions on the issuance of shares of the same series or of any other class or series; and
• the voting rights, if any, of the holders of the series.
We may issue a series of preferred stock that could, depending on the terms of the series, impede ordiscourage a takeover attempt or other transaction that a stockholder might consider to be in its best interests,including a takeover attempt that might result in a premium over the market price for holders of shares ofcommon stock.
Investors’ Rights Agreement
For a description of the Investors’ Rights Agreement that we will have with JAB following the completionof this offering, see “Certain Relationships and Related Party Transactions—Investors’ Rights Agreement.”
Anti-Takeover Effects of Delaware Law and Our Organizational Documents
The following is a summary of certain provisions of our amended and restated certificate of incorporationand bylaws that may be deemed to have an anti-takeover effect and may delay, deter or prevent a tender offer ortakeover attempt that a stockholder might consider to be in its best interests, including those attempts that mightresult in a premium over the market price for holders of shares of common stock.
Authorized but Unissued Shares
The authorized but unissued shares of our common stock and our preferred stock will be available for futureissuance without obtaining stockholder approval. These additional shares may be utilized for a variety ofcorporate purposes, including future public offerings to raise additional capital, corporate acquisitions andemployee benefit plans. The existence of authorized but unissued shares of our common stock and preferredstock could render more difficult or discourage an attempt to obtain control over us by means of a proxy contest,tender offer, merger or otherwise.
Certain Anti-takeover Provisions of Delaware Law
We will be subject to the provisions of Section 203 of the DGCL, regulating corporate takeovers uponcompletion of this offering. This statute prevents certain Delaware corporations, under certain circumstances,from engaging in a “business combination” with:
• a stockholder who owns 15% or more of our outstanding voting stock (otherwise known as an“interested stockholder”);
• an affiliate of an interested stockholder; or
• an associate of an interested stockholder for three years following the date that the stockholder becamean interested stockholder.
A “business combination” includes a merger or sale of more than 10% of our assets. However, the aboveprovisions of Section 203 of the DGCL do not apply if:
• our board of directors approves the transaction that made the stockholder an “interested stockholder”prior to the date of the transaction;
• after the completion of the transaction that resulted in the stockholder becoming an interestedstockholder, that stockholder owned at least 85% of our voting stock outstanding at the time thetransaction commenced, other than statutorily excluded shares of common stock; or
160

• on or subsequent to the date of the transaction, the business combination is approved by our board ofdirectors and authorized at a meeting of our stockholders, and not by written consent, by an affirmativevote of at least two-thirds of the outstanding voting stock not owned by the interested stockholder.
Choice of Forum
Our amended and restated bylaws will provide that the Court of Chancery of the State of Delaware is thesole and exclusive forum for: (i) any derivative action or proceeding brought on behalf of us; (ii) any actionasserting a claim of breach of a duty (including any fiduciary duty) owed by any of our current or formerdirectors, officers, stockholders, employees or agents to us or our stockholders; (iii) any action asserting a claimagainst us or any of our current or former directors, officers, stockholders, employees or agents arising out of orrelating to any provision of the DGCL or our amended and restated certificate of incorporation or our amendedand restated bylaws; or (iv) any action asserting a claim against us or any of our current or former directors,officers, stockholders, employees or agents governed by the internal affairs doctrine of the State of Delaware.Our amended and restated bylaws will also provide that the federal district courts of the United States of Americawill, to the fullest extent permitted by law, be the sole and exclusive forum for resolving any complaint assertinga cause of action arising under the Securities Act.
Moreover, Section 27 of the Exchange Act creates exclusive federal jurisdiction over all claims brought toenforce any duty or liability created by the Exchange Act or the rules and regulations thereunder and ouramended and restated bylaws will provide that the exclusive forum provision does not apply to suits brought toenforce any duty or liability created by the Exchange Act. Accordingly, actions by our stockholders to enforceany duty or liability created by the Exchange Act or the rules and regulations thereunder must be brought infederal court.
Our amended and restated bylaws will also provide that any person or entity purchasing or otherwiseacquiring any interest in shares of our common stock will be deemed to have notice of and to have consented tothe foregoing provisions; provided, however, that stockholders will not be deemed to have waived ourcompliance with the federal securities laws and the rules and regulations thereunder. We recognize that the forumselection clause in our amended and restated bylaws may impose additional litigation costs on stockholders inpursuing any such claims, particularly if the stockholders do not reside in or near the State of Delaware.Additionally, the forum selection clause in our amended and restated bylaws may limit our stockholders’ abilityto bring a claim in a forum that they find favorable for disputes with us or our directors, officers, employees oragents, which may discourage such lawsuits against us and our directors, officers, employees and agents eventhough an action, if successful, might benefit our stockholders. The Court of Chancery of the State of Delawaremay also reach different judgments or results than would other courts, including courts where a stockholderconsidering an action may be located or would otherwise choose to bring the action, and such judgments may bemore or less favorable to us than our stockholders.
For more information on the risks associated with our choice of forum provision, see “Risk Factors —General Risks — Our amended and restated bylaws will contain exclusive forum provisions for certain claims,which could limit our stockholders’ ability to obtain a favorable judicial forum for disputes with us or ourdirectors, officers or employees.”
Limitations on Liability and Indemnification of Directors and Officers
Our amended and restated certificate of incorporation provides that our directors will not be personallyliable to us or our stockholders for monetary damages for any breach of fiduciary duty as a director, except to theextent such exemption from liability or limitation is not permitted under the DGCL, as may be amended.
Our amended and restated bylaws provide that we must indemnify our directors and officers to the fullestextent permitted by law. We are also expressly authorized to advance certain expenses (including attorneys’ fees)
161

to our directors and officers and carry directors’ and officers’ insurance providing indemnification for ourdirectors and officers for some liabilities. We believe that these indemnification provisions and insurance areuseful to attract and retain qualified directors and executive officers.
Prior to completion of this offering, we intend to enter into separate indemnification agreements with eachof our directors and executive officers. Each indemnification agreement will provide, among other things, forindemnification to the fullest extent permitted by law and our amended and restated certificate of incorporationagainst any and all expenses and liabilities, including judgments, fines, penalties and amounts paid in settlementof any claim with our approval and counsel fees and disbursements and any liabilities incurred as a result ofacting on our behalf (as a fiduciary or otherwise) in connection with an employee benefit plan. Theindemnification agreements will provide for the advancement or payment of all expenses to the indemnitee andfor reimbursement to us if it is found that such indemnitee is not entitled to such indemnification underapplicable law and our bylaw. These provisions and agreements may have the practical effect in some cases ofeliminating our stockholders’ ability to collect monetary damages from our directors and executive officers.
Insofar as indemnification for liabilities arising under the Securities Act may be permitted to directors,officers or persons controlling the registrant pursuant to the foregoing provisions, we have been informed that, inthe opinion of the SEC, such indemnification is against public policy as expressed in the Securities Act and istherefore unenforceable.
162

SHARES ELIGIBLE FOR FUTURE SALE
Following the JAB Acquisition and prior to this offering, there has been no public market for our commonstock, and we cannot predict the effect, if any, that sales of shares or availability of any shares for sale will haveon the market price of our common stock prevailing from time to time. Sales of substantial amounts of commonstock (including shares issued on the exercise of options, warrants or convertible securities, if any) or theperception that such sales could occur, could adversely affect the market price of our common stock and ourability to raise additional capital through a future sale of securities.
Upon the completion of this offering and the share repurchase, we will have 160,890,354 shares of commonstock issued and outstanding (or 164,890,354 shares if the underwriters exercise their option to purchase additionalshares of common stock in full). All of the shares of our common stock sold in this offering will be freely tradablewithout restriction or further registration under the Securities Act unless such shares are purchased by “affiliates” asthat term is defined in Rule 144. Upon the completion of this offering, the share repurchase and the Distribution,approximately 38.6% of our outstanding common stock (or approximately 37.7% if the underwriters exercise theoption to purchase additional shares of common stock in full) will be held by an affiliate of JAB. These shares andall remaining shares that will be outstanding upon completion of this offering (other than the shares of commonstock sold in this offering) will be “restricted securities” as that phrase is defined in Rule 144. Subject to certaincontractual restrictions, including the lock-up agreements described below, holders of restricted shares will beentitled to sell those shares in the public market if they qualify for an exemption from registration under Rule 144 orany other applicable exemption under the Securities Act. Subject to the lock-up agreements described below and theprovisions of Rules 144 and 701, additional shares will be available for sale as set forth below.
Lock-Up Agreements
See “Underwriting (Conflict of Interest)” for a description of the lock-up agreements applicable to ourshares.
Rule 144
In general, under Rule 144, a person (or persons whose shares are aggregated) who is not deemed to havebeen an affiliate of ours at any time during the three months preceding a sale, and who has beneficially ownedrestricted securities within the meaning of Rule 144 for at least six months (including any period of consecutiveownership of preceding non-affiliated holders) would be entitled to sell those shares, subject only to theavailability of current public information about us. A non-affiliated person who has beneficially owned restrictedsecurities within the meaning of Rule 144 for at least one year would be entitled to sell those shares withoutregard to the provisions of Rule 144.
81,535,002 shares of our common stock outstanding after this offering will be “restricted securities” as thatterm is defined in Rule 144 of the Securities Act and we expect that substantially all of these restricted securitieswill be subject to lock-up agreements. A person (or persons whose shares are aggregated) who is deemed to be anaffiliate of ours and who has beneficially owned restricted securities for at least six months would be entitled to sella number of shares within any three-month period that does not exceed the greater of: (1) 1% of the number ofshares of our common stock outstanding, which will equal approximately 1,608,904 shares immediately after thisoffering and the share repurchase; and (2) the average weekly trading volume of our common stock on Nasdaqduring the four calendar weeks preceding the filing of a notice on Form 144 with respect to the sale. Such sales arealso subject to certain manner of sale provisions, notice requirements and the availability of current publicinformation about us.
Rule 701
In general, under Rule 701 of the Securities Act, most of our employees, consultants or advisors whopurchased shares from us in connection with a qualified compensatory stock plan or other written agreement areeligible to resell those shares 90 days after the date of this prospectus in reliance on Rule 144, but withoutcompliance with the holding period or certain other restrictions contained in Rule 144.
163

Registration Statements on Form S-8
We intend to file one or more registration statements on Form S-8 under the Securities Act to register allshares of our common stock subject to outstanding stock options and the shares of stock subject to issuance underour equity incentive plan. Any such Form S-8 registration statement will automatically become effective uponfiling. Accordingly shares registered under such registration statements will be available for sale in the openmarket. We expect that the initial registration statement on Form S-8 will cover 7,240,066 shares.
Investors’ Rights Agreement
Following the completion of this offering, we will have the Investors’ Rights Agreement with JAB entitlingJAB to certain registration rights with respect to shares of our common stock beneficially owned by JAB andsuch holders following this offering. For a description of the Investors’ Rights Agreement, see “CertainRelationships and Related Party Transactions—Investors’ Rights Agreement.” After giving to the sharerepurchase and the Distribution, these shares will represent 38.6% of our outstanding common stock uponcompletion of this offering (or approximately 37.7% if the underwriters exercise the option to purchaseadditional shares of common stock in full), prior to giving effect to any purchase by JAB of shares in thisoffering.
164

MATERIAL U.S. FEDERAL INCOME AND ESTATE TAX CONSIDERATIONSFOR NON-U.S. HOLDERS
The following discussion is a summary of material U.S. federal income and estate tax consequencesgenerally applicable to Non-U.S. Holders (as defined herein) of common stock that hold such shares as capitalassets (generally, for investment). This summary is based upon the U.S. Internal Revenue Code of 1986, asamended (the “Code”), existing and proposed Treasury regulations, IRS rulings and pronouncements and judicialdecisions in effect as of the date hereof, all of which are subject to change (possibly on a retroactive basis) ordiffering interpretations. No ruling from the IRS has been, or will be, sought with respect to the tax consequencesdiscussed herein, and there can be no assurance that the IRS will not take a position contrary to the taxconsequences discussed below or that any position taken by the IRS would not be sustained.
For purposes of this discussion, the term “Non-U.S. Holder” means a beneficial owner of shares of commonstock that is not for U.S. federal income tax purposes any of the following:
• an individual who is a citizen or resident of the United States;
• a corporation or other entity taxable as a corporation created in or organized under the laws of theUnited States, any state thereof or the District of Columbia;
• an estate, the income of which is subject to U.S. federal income taxation regardless of its source; or
• a trust (i) if a court within the United States is able to exercise primary supervision over theadministration of such trust and one or more U.S. persons have the authority to control all substantialdecisions of such trust or (ii) that has a valid election in effect under applicable U.S. Treasuryregulations to be treated as a U.S. person.
If a partnership or other pass-through entity holds common stock, the tax treatment of a partner in thepartnership will generally depend upon the status of the partner or member and the activities of the partnership orother entity. Accordingly, partnerships or other pass-through entities that hold common stock and partners ormembers in these partnerships or other entities should consult their tax advisors regarding the U.S. federalincome and other tax consequences of the purchase, ownership and disposition of common stock.
This summary does not address the potential application of the alternative minimum tax, the Medicare taxon net investment income or any other tax considerations applicable to a Non-U.S. Holder’s specific facts andcircumstances and, except with respect to the U.S. federal estate tax consequences discussed below, does notconsider any other U.S. federal tax consequences or the state, local or non-U.S. tax consequences of aninvestment in common stock. It also does not apply to Non-U.S. Holders subject to special tax treatment underthe U.S. federal income tax laws, including, without limitation: U.S. expatriates and former citizens or long-termresidents of the United States; persons holding our common stock as part of a straddle, or other risk reductionstrategy or as part of a conversion transaction or other integrated investment; banks, insurance companies, andother financial institutions; brokers, dealers, or traders in securities; “controlled foreign corporations,” “passiveforeign investment companies,” or corporations that accumulate earnings to avoid U.S. federal income tax;tax-exempt organizations or governmental organizations; persons deemed to sell our common stock under theconstructive sale provisions of the Code; persons who hold or receive our common stock pursuant to the exerciseof any employee stock option or otherwise as compensation; tax-qualified retirement plans; “qualified foreignpension funds” as defined in Section 897(l)(2) of the Code and entities all of the interests of which are held byqualified foreign pension funds; and persons subject to special tax accounting rules as a result of any item ofgross income with respect to our common stock being taken into account in an applicable financial statement.
This discussion is not tax advice. The discussion included herein is only a summary. Accordingly, we urgeyou to consult your tax advisor with respect to your U.S. federal, state, local, non-U.S. income, and other taxconsequences in light of your particular situation with respect to holding and disposing of our common stock.
165

Dividends
Distributions on shares of our common stock will constitute dividends for U.S. federal income tax purposesto the extent paid from our current or accumulated earnings and profits, as determined under U.S. federal incometax principles. To the extent that the amount of any distribution exceeds our current and accumulated earningsand profits for a taxable year, as determined under U.S. federal income tax principles, the distribution will first betreated as a tax-free return of capital, causing a reduction in the adjusted basis of the shares of common stock(thereby increasing the amount of gain, or decreasing the amount of loss, to be recognized on a subsequentdisposition of our common stock), and the balance in excess of adjusted basis will be taxed as gain recognized ona sale or exchange. See discussion below under “Dispositions.”
Subject to the discussions below under “Information Reporting and Backup Withholding” and “ForeignAccount Tax Compliance Act,” any dividend paid to a Non-U.S. Holder with respect to our common stock willgenerally be subject to withholding tax at a 30% rate (or such lower rate specified by an applicable income taxtreaty). Generally, a Non-U.S. Holder must certify as to its status, and to any right to reduced withholding underan applicable income tax treaty, on a properly completed IRS Form W-8BEN or IRS Form W-8BEN-E in orderto obtain the benefit of such right.
A dividend paid to a Non-U.S. Holder that is effectively connected with the holder’s conduct of a trade orbusiness within the United States (and, if required by an applicable income tax treaty, is attributable to a U.S.permanent establishment or fixed base of the Non-U.S. Holder) is not subject to withholding if the Non-U.S.Holder provides an IRS Form W-8ECI certifying that the dividend is so connected. Instead, such dividend issubject to U.S. federal income tax on a net basis at regular graduated rates applicable to U.S. persons generallyand, for corporate Non-U.S. Holders, may also be subject to a 30% “branch profits tax” unless the Non-U.S.Holder qualifies for a lower rate under an applicable U.S. income tax treaty.
Non-U.S. Holders should consult their tax advisors regarding any applicable income tax treaty.
Dispositions
Subject to the discussions below under “Information Reporting and Backup Withholding” and “ForeignAccount Tax Compliance Act,” any gain realized by a Non-U.S. Holder on a sale, exchange or other dispositionof common stock will generally not be subject to U.S. federal income or withholding tax unless:
• the gain is effectively connected with the Non-U.S. Holder’s conduct of a trade or business in theUnited States and, if required by an applicable income tax treaty, is attributable to a permanentestablishment or fixed base maintained by the Non-U.S. Holder in the United States;
• the Non-U.S. Holder is an individual who is present in the United States for 183 or more days in the taxyear of the disposition and meets certain other conditions; or
• we are or have been a “U.S. real property holding corporation” (“USRPHC”) under Section 897 of theCode at any time within the five-year period preceding the disposition or the Non-U.S. Holder’sholding period, whichever period is shorter, and our common stock has ceased to be regularly traded onan established securities market prior to the beginning of the calendar year in which the sale ordisposition occurs.
If you are a Non-U.S. Holder described in the first bullet immediately above, you will be required to payU.S. federal income tax on the net gain derived from the disposition under regular graduated rates (or such lowerrate specified by an applicable income tax treaty) as if you were a U.S. person as defined by the Code. Inaddition, a corporate Non-U.S. Holder described in the first bullet immediately above also may be subject to thebranch profits tax at a 30% rate (or such lower rate specified by an applicable income tax treaty). If you are anindividual Non-U.S. Holder described in the second bullet above, you will be required to pay a flat 30% U.S.federal income tax (or such lower rate specified by an applicable income tax treaty) on the gain derived from thedisposition, which gain may be offset by U.S.-source capital losses for the year.
166

Generally, a corporation is a “U.S. real property holding corporation” if the fair market value of its U.S. realproperty interests equals or exceeds 50% of the sum of the fair market value of its worldwide real propertyinterests and its other assets used or held for use in a trade or business (all as determined for U.S. federal incometax purposes). We believe that we are not currently and will not become a USRPHC for U.S. federal income taxpurposes, and the remainder of this discussion assumes this is the case. However, because the determination ofwhether we are a USRPHC depends on the fair market value of our U.S. real property relative to the fair marketvalue of our other business assets, there can be no assurance that we will not become a USRPHC in the future.Even if we become a USRPHC, however, as long as our common stock is regularly traded on an establishedsecurities market, such common stock will be treated as U.S. real property interests only if you actually orconstructively hold more than 5% of such regularly traded common stock at any time during the shorter of thefive-year period preceding your disposition of, or your holding period for, our common stock. No assurance canbe provided that our common stock will be regularly traded on an established securities market at all times forpurposes of the rules described above.
Non-U.S. Holders should consult their tax advisors regarding any applicable income tax or other treaties thatmay provide for different rules.
Information Reporting and Backup Withholding
A Non-U.S. Holder will generally be required to comply with certain certification procedures to establishthat it is not a U.S. person in order to avoid backup withholding with respect to dividends or the proceeds of adisposition of our common stock. In addition, we are required to annually report to the IRS and the Non-U.S.Holder the amount of any distributions paid to the Non-U.S. Holder, regardless of whether we actually withheldany tax. Copies of the information returns reporting such distributions and the amount withheld, if any, may alsobe made available to the tax authorities in the country in which the Non-U.S. Holder resides under the provisionsof an applicable income tax treaty. Backup withholding is not an additional tax and any amounts withheld underthe backup withholding rules will generally be allowed as a refund or credit against the Non-U.S. Holder’s U.S.federal income tax liability; provided that certain required information is furnished on a timely basis to the IRS.
U.S. Federal Estate Taxes
Common stock owned or treated as owned by an individual Non-U.S. Holder at the time of death will beincluded in the individual’s gross estate for U.S. federal estate tax purposes, and may be subject to U.S. federalestate tax, unless an applicable estate tax treaty provides otherwise. The terms “resident” and “nonresident” aredefined differently for U.S. federal estate tax purposes than for U.S. federal income tax purposes. Non-U.S.Holders should consult their tax advisors regarding the U.S. federal estate tax consequences of the ownership ordisposition of our common stock.
Foreign Account Tax Compliance Act
Under Sections 1471 through 1474 of the Code (commonly referred to as the Foreign Account TaxCompliance Act (“FATCA”)), withholding at a rate of 30% generally will be required on dividends in respect of,and (subject to the proposed Treasury regulations discussed below) gross proceeds from the sale of, commonstock held by or through certain foreign financial institutions (including investment funds), unless suchinstitution (i) enters into an agreement with the Treasury to report, on an annual basis, information with respect toshares in, and accounts maintained by, the institution held by certain U.S. persons and by certain non-U.S.entities that are wholly or partially owned by U.S. persons and to withhold on certain payments, or (ii) if requiredunder an intergovernmental agreement between the United States and an applicable foreign country reports suchinformation to its local tax authority, which will exchange such information with the U.S. authorities. Anintergovernmental agreement between the United States and an applicable foreign country, or other guidance,may modify these requirements. Accordingly, the entity through which common stock is held will affect thedetermination of whether such withholding is required. Similarly, dividends in respect of, and (subject to the
167

proposed Treasury regulations discussed below) gross proceeds from the sale of, common stock held by aninvestor that is a non-financial non-U.S. entity that does not qualify under certain exemptions will be subject towithholding at a rate of 30%, unless such entity either (i) certifies to us that such entity does not have any“substantial U.S. owners” or (ii) provides certain information regarding the entity’s “substantial U.S. owners,”which we, or the applicable withholding agent, will in turn provide to the Secretary of the Treasury. If a dividendpayment is both subject to withholding under FATCA and subject to the withholding tax discussed above under“Dividends,” the withholding under FATCA may be credited against, and therefore reduce, such otherwithholding tax. We will not pay any additional amounts to holders in respect of any amounts withheld.
Under proposed U.S. Treasury regulations promulgated by the Treasury Department on December 13, 2018,this withholding tax will not apply to the gross proceeds from the sale or disposition of our common stock.Taxpayers may rely on the proposed Treasury regulations until final Treasury regulations are promulgated.Non-U.S. Holders should consult their tax advisors regarding these requirements.
168

UNDERWRITING (CONFLICT OF INTEREST)
We are offering the shares of common stock described in this prospectus through a number of underwriters.J.P. Morgan Securities LLC and Morgan Stanley & Co. LLC are acting as joint book-running managers of theoffering and as representatives of the underwriters. We have entered into an underwriting agreement with theunderwriters. Subject to the terms and conditions of the underwriting agreement, we have agreed to sell to theunderwriters, and each underwriter has severally agreed to purchase, at the public offering price less theunderwriting discounts and commissions set forth on the cover page of this prospectus, the number of shares ofcommon stock listed next to its name in the following table:
NameNumber of
Shares
J.P. Morgan Securities LLC . . . . . . . . . . . . . . . . . . . . . . . .Morgan Stanley & Co. LLC . . . . . . . . . . . . . . . . . . . . . . . .BofA Securities, Inc. . . . . . . . . . . . . . . . . . . . . . . . . . . . . . .Citigroup Global Markets Inc. . . . . . . . . . . . . . . . . . . . . . .BNP Paribas Securities Corp. . . . . . . . . . . . . . . . . . . . . . . .Deutsche Bank Securities Inc. . . . . . . . . . . . . . . . . . . . . . . .Evercore Group L.L.C. . . . . . . . . . . . . . . . . . . . . . . . . . . . .Goldman Sachs & Co. LLC . . . . . . . . . . . . . . . . . . . . . . . .HSBC Securities (USA) Inc. . . . . . . . . . . . . . . . . . . . . . . . .Truist Securities, Inc. . . . . . . . . . . . . . . . . . . . . . . . . . . . . .Wells Fargo Securities, LLC . . . . . . . . . . . . . . . . . . . . . . . .Capital One Securities, Inc. . . . . . . . . . . . . . . . . . . . . . . . . .C.L. King & Associates, Inc. . . . . . . . . . . . . . . . . . . . . . . .Credit Agricole Securities (USA) Inc. . . . . . . . . . . . . . . . .Mischler Financial Group, Inc. . . . . . . . . . . . . . . . . . . . . . .MUFG Securities Americas Inc. . . . . . . . . . . . . . . . . . . . . .Samuel A. Ramirez & Company, Inc. . . . . . . . . . . . . . . . . .Santander Investment Securities Inc. . . . . . . . . . . . . . . . . .Siebert Williams Shank & Co., LLC . . . . . . . . . . . . . . . . . .
Total . . . . . . . . . . . . . . . . . . . . . . . . . . . . . . . . . . . . . . . . . . 26,666,667
The underwriters are committed to purchase all of the shares of common stock offered by us if theypurchase any shares. The underwriting agreement also provides that if an underwriter defaults, the purchasecommitments of non-defaulting underwriters may also be increased or the offering may be terminated.
The underwriters propose to offer the shares of common stock directly to the public at the initial publicoffering price set forth on the cover page of this prospectus and to certain dealers at that price less a concessionnot in excess of $ per share. After the initial offering of the shares to the public, if all of the shares ofcommon stock are not sold at the initial public offering price, the underwriters may change the offering price andthe other selling terms. Sales of any shares made outside of the United States may be made by affiliates of theunderwriters.
The underwriters have an option to buy up to 4,000,000 additional shares of common stock from us to coversales of shares by the underwriters which exceed the number of shares specified in the table above. Theunderwriters have 30 days from the date of this prospectus to exercise this option to purchase additional shares. Ifany shares are purchased with this option to purchase additional shares, the underwriters will purchase shares inapproximately the same proportion as shown in the table above. If any additional shares of common stock arepurchased, the underwriters will offer the additional shares on the same terms as those on which the shares arebeing offered.
169

The underwriting fee is equal to the public offering price per share of common stock less the amount paid bythe underwriters to us per share of common stock. The underwriting fee is $ per share. The followingtable shows the per share and total underwriting discounts and commissions to be paid by us to the underwritersassuming both no exercise and full exercise of the underwriters’ option to purchase additional shares from us.
Paid by Us TotalNo
ExerciseFull
ExerciseNo
ExerciseFull
Exercise
Per Share . . . . . . . . . . . . . . . . . . . . . . . . . . . . . . . . . . . . . . . . . . . . . . $ $ $ $Total . . . . . . . . . . . . . . . . . . . . . . . . . . . . . . . . . . . . . . . . . . . . . .
We estimate that the total expenses of this offering, including registration, filing and listing fees, printingfees and legal and accounting expenses, but excluding the underwriting discounts and commissions, will beapproximately $5 million. We have also agreed to reimburse the underwriters for expenses relating to theclearance of this offering with the Financial Industry Regulatory Authority, Inc. in an amount up to $40,000 andexpenses incurred in connection with the directed share program. The underwriters have agreed to reimburse theCompany for certain expenses in connection with the offering.
A prospectus in electronic format may be made available on the websites maintained by one or moreunderwriters, or selling group members, if any, participating in the offering. The underwriters may agree toallocate a number of shares to underwriters and selling group members for sale to their online brokerage accountholders. Internet distributions will be allocated by the representatives to underwriters and selling group membersthat may make internet distributions on the same basis as other allocations.
JAB and Olivier Goudet have indicated an interest in purchasing between $50 million and $100 million, and$5 million, respectively, in shares of common stock in this offering at a price equal to the price paid by thepublic, less the underwriting discount. Because this indication of interest is not a binding agreement orcommitment to purchase, JAB and Mr. Goudet could determine to purchase more, less or no shares in thisoffering or the underwriters could determine to sell more, less or no shares to JAB and Mr. Goudet.
We have agreed that we will not (i) offer, pledge, sell, contract to sell, sell any option or contract topurchase, purchase any option or contract to sell, grant any option, right or warrant to purchase, lend or otherwisetransfer or dispose of, directly or indirectly, or submit to, or file with, the SEC a registration statement under theSecurities Act relating to, any shares of our common stock or securities convertible into or exercisable orexchangeable for any shares of our common stock, or publicly disclose the intention to make any offer, sale,pledge, loan, disposition or filing, or (ii) enter into any swap or other arrangement that transfers all or a portion ofthe economic consequences associated with the ownership of any shares of common stock or any such othersecurities or publicly disclose an intention to enter into any swap or such arrangement (regardless of whether anyof these transactions are to be settled by the delivery of shares of common stock or such other securities, in cashor otherwise), in each case without the prior written consent of J.P. Morgan Securities LLC and MorganStanley & Co. LLC for a period of 180 days after the date of this prospectus.
The restrictions on our actions, as described above, will not apply to certain transactions, including:
a) the sale of shares of our common stock to the underwriters pursuant to the underwriting agreement;
b) the issuance of shares of common stock upon the exercise or settlement (including any “net” or“cashless” exercises or settlements) of options, restricted stock units, warrants or similar securities orthe conversion of a security, in each case, outstanding on the date of this prospectus and as described inthis prospectus;
170

c) the filing of any Registration Statement on Form S-8, or any amendment thereto, to register commonstock issuable upon the exercise of awards granted pursuant to the terms of any employee equityincentive plan described in this prospectus;
d) the issuance of any shares of common stock, or securities convertible into, exchangeable for or thatrepresent the right to receive shares of common stock pursuant to our incentive plans (including, for theavoidance of doubt, the Krispy Kreme, Inc. 2021 Omnibus Incentive Plan and ESPP and any long-termincentive awards) that are in effect as of the date of this prospectus and as described in this prospectus;
e) facilitating the establishment of a trading plan on behalf of a shareholder, officer or director of theCompany pursuant to Rule 10b5-1 under the Exchange Act for the transfer of shares of common stock,provided that such plan (i) shall not provide for the transfer of common stock during the restrictedperiod and (ii) shall be subject to additional restrictions relating to public announcements and filingsduring the restricted period; and
f) the issuance of shares of common stock or securities convertible into, exchangeable for or thatrepresent the right to receive shares of common stock in connection with (i) the acquisition by theCompany or any of its subsidiaries of the assets of another person or entity or pursuant to an employeebenefit plan assumed by the Company in connection with such acquisition, and the issuance of anysuch securities pursuant to any such agreement, or (ii) the Company’s joint ventures, commercialrelationships and other strategic transactions, provided that (x) the aggregate number of such shares ofcommon stock shall not exceed 5% of the total number of shares of capital stock outstandingimmediately following this offering and (y) the (1) Company shall cause each recipient of such sharesto execute and deliver to the underwriters, on or prior to the issuance of such shares, a lock-upagreement on the same terms as described above, and (2) the Company shall enter stop transferinstructions with the Company’s transfer agent and registrar on such shares until the expiration of therestricted period.
Our directors and executive officers and substantially all of our stockholders (such persons, the “lock-upparties”) have entered into lock-up agreements with the underwriters prior to the commencement of this offeringpursuant to which each lock-up party, with certain exceptions, for a period of 180 days after the date of thisprospectus (such period, the “restricted period”), may not (and may not cause any of their direct or indirectaffiliates to), without the prior written consent of J.P. Morgan Securities LLC and Morgan Stanley & Co. LLC,(1) offer, pledge, sell, contract to sell, sell any option or contract to purchase, purchase any option or contract tosell any option, grant any option, right or warrant to purchase, lend or otherwise transfer or dispose of, directly orindirectly, any shares of our common stock or any securities convertible into or exercisable or exchangeable forour common stock (including, without limitation, common stock or such other securities which may be deemedto be beneficially owned by such lock-up parties in accordance with the rules and regulations of the SEC andsecurities which may be issued upon exercise of a stock option or warrant) (collectively with the common stock,the “lock-up securities”), (2) enter into any hedging, swap or other agreement or transaction any hedging or othertransactions or arrangements (including, without limitation, any short sale or the purchase or sale of, or entryinto, any put or call option, or combination thereof, forward, swap or any other derivative transaction orinstrument, however described or defined) designed or intended, or which could reasonably be expected to leadto or result in, a sale or disposition or transfer (by any person or entity, whether or not a signatory to suchagreement) of any economic consequences of ownership, in whole or in part, directly or indirectly, of any lock-up securities, whether any such transaction or arrangement (or instrument provided for thereunder) would besettled by delivery of lock-up securities, in cash or otherwise, (3) make any demand for, or exercise any rightwith respect to, the registration of any lock-up securities, or (4) publicly disclose the intention to do any of theforegoing.
171

The restrictions described in the immediately preceding paragraph and contained in the lock-up agreementsbetween the underwriters and the lock-up parties will not apply, subject in certain cases to various conditions, tocertain transactions, including:
(a) the transfer the lock-up party’s lock-up securities
(i) as a bona fide gift or gifts, charitable contribution or for bona fide estate planning purposes;
(ii) by will, testamentary document or intestate succession;
(iii) to any trust for the direct or indirect benefit of the lock-up party or the immediate family of suchlock-up party, or if the lock-up party is a trust, to a trustor or beneficiary of the trust or to theestate of a beneficiary of such trust;
(iv) to a partnership, limited liability company or other entity of which the lock-up party and theimmediate family of the lock-up party are the legal and beneficial owner of all of the outstandingequity securities or similar interests;
(v) to a nominee or custodian of a person or entity to whom a disposition or transfer would bepermissible under clauses (i) through (iv) above;
(vi) if the lock-up party is a corporation, partnership, limited liability company, trust or otherbusiness entity, (A) to another corporation, partnership, limited liability company, trust or otherbusiness entity that is an affiliate (as defined in Rule 405 promulgated under the Securities Act)of the lock-up party, or to any investment fund or other entity controlling, controlled by,managing or managed by or under common control with the lock-up party or affiliates of thelock-up party (including, for the avoidance of doubt, where the lock-up party is a partnership, toits general partner or a successor partnership or fund, or any other funds managed by suchpartnership), or (B) as part of a distribution to members or shareholders of the lock-up party,which distribution need not be pro rata;
(vii) by operation of law, such as pursuant to a qualified domestic order, divorce settlement, divorcedecree or separation agreement;
(viii) to the Company from an employee of the Company upon death, disability or termination ofemployment, in each case, of such employee;
(ix) as part of a sale of the lock-up party’s lock-up securities acquired in open market transactions onor after the completion of this offering (including, for avoidance of doubt, any lock-up securitiesacquired in this offering);
(x) to the Company in connection with the vesting, settlement, or exercise of restricted stock units,options, warrants or other rights to purchase shares of common stock (including, in each case, byway of “net” or “cashless” exercise), including for the payment of exercise price and tax andremittance payments due as a result of the vesting, settlement, or exercise of such restricted stockunits, options, warrants or rights; provided that any such shares of common stock received shallbe subject to the terms of the lock-up agreement, and provided, further that any such restrictedstock units, options, warrants or rights are held by the lock-up party pursuant to an agreement orequity award granted under a stock incentive plan or other equity award plan, as each suchagreement or plan is described in this prospectus; or
(xi) pursuant to a bona fide third-party tender offer, merger, consolidation or other similar transactionthat is approved by the board of directors of the Company and made to all holders of theCompany’s capital stock involving a “change of control” (as defined in the lock-up agreement);provided that in the event that such tender offer, merger, consolidation or other similartransaction is not completed, the lock-up party’s lock-up securities shall remain subject to theprovisions of the lock-up agreement;
172

provided that, with respect to the immediately preceding paragraph:
(A) in the case of any transfer or distribution pursuant to clauses (i), (ii), (iii), (iv), (v) and (vi),such transfer shall not involve a disposition for value;
(B) in the case of any transfer or distribution pursuant to clauses (i), (ii), (iii), (iv), (v) and (vi),each donee, devisee, transferee or distributee, as applicable, shall execute and deliver to therepresentatives of the underwriters a lock-up letter in the form of the lock-up agreement as set forth inthe underwriting agreement;
(C) in the case of any transfer or distribution pursuant to clauses (i), (ii), (iii), (iv), (v), (vi), (ix)and (x) (except for (1) any such transfer or distribution pursuant to clause (vi) as described in thisprospectus and (2) any such transfer pursuant to clause (x) that is consummated during the periodbeginning on the first day of the restricted period and ending at the close of business 30 days after thedate of this prospectus), in each case, no filing by any party (donor, donee, devisee, transferor,transferee, distributer or distributee) under the Exchange Act, or other public announcement shall berequired or shall be made voluntarily during the restricted period in connection with such transfer ordistribution (other than a filing on a Form 5 made after the expiration of the restricted period referred toabove); and
(D) in the case of any action, transfer or distribution pursuant to clauses (vii) and (viii), anytransfer or distribution pursuant to clause (a)(vi) that is described in this prospectus and any transferpursuant to clause (x) following the 30th business day after the date of this prospectus, in each case, itshall be a condition to such action, transfer or distribution that no public filing, report or announcementshall be voluntarily made and if any filing under Section 16(a) of the Exchange Act, or shall be legallyrequired during the Restricted Period, such filing, report or announcement shall clearly indicate in thefootnotes thereto the nature and conditions of such transfer;
(b) the exercise outstanding options, settle restricted stock units or other equity awards or exercisewarrants pursuant to plans as described in this prospectus; provided that any lock-up securities receivedupon such exercise, vesting or settlement shall be subject to the terms of the lock-up agreement;
(c) to convert outstanding preferred stock, warrants to acquire preferred stock or convertible securities intoshares of common stock or warrants to acquire shares of common stock (as each such security isdescribed in this prospectus); provided further that any such shares of common stock or warrantsreceived upon such conversion shall be subject to the terms of the lock-up agreement, and providedfurther that any filing under Section 16(a) of the Exchange Act required to be filed in connection withany conversion pursuant to this clause (c) clearly indicate in the footnotes thereto the nature andconditions of such conversion;
(d) to establish trading plans pursuant to Rule 10b5-1 under the Exchange Act for the transfer of shares oflock-up securities; provided that (1) such plans do not provide for the transfer of common stock duringthe restricted period and (2) to the extent that a public announcement or filing under the Exchange Act,if any, is required or voluntarily made in connection with this clause (d), such announcement or filingshall include a statement to the effect that no transfer of lock-up securities may be made under suchplan during the restricted period in contravention of the lock-up agreement;
(e) to sell the securities to be sold by the lock-up party pursuant to the terms of the underwritingagreement;
(f) the transfer of the lock-up party’s lock-up securities to the Company in connection with the terminationof the lock-up party’s employment with the Company or pursuant to contractual arrangements underwhich the Company has the option to repurchase such lock-up securities; provided that any filing underSection 16(a) of the Exchange Act required to be filed in connection with this clause (f) clearly indicatein the footnotes thereto that the filing relates to the termination of the lock-up party’s employment; and
(g) (i) sales to the Company of shares of common stock to be funded by the Company with net proceeds ofthis offering as described in this prospectus, and (ii) transfers or sales to the Company in connectionwith the vesting, settlement, or exercise of restricted stock units, options, warrants or other rights to
173

purchase shares of common stock (including, in each case, by way of “net” or “cashless” exercise),including for the payment of exercise price and tax and remittance payments due as a result of thevesting, settlement, or exercise of such restricted stock units, options, warrants or rights, provided thatany such shares of common stock received upon such exercise, vesting or settlement shall (A) besubject to the terms of lock-up agreement and (B) constitute securities to be sold to the Company underclause (i), and provided further that any such restricted stock units, options, warrants or rights are heldby the lock-up party pursuant to an agreement or equity award granted under a stock incentive plan orother equity award plan, each such agreement or plan shall be described in this prospectus; provided,further, that, any sale or transfer pursuant to this clause (g) no public filing, report or announcementshall be voluntarily made and if any filing under Section 16(a) of the Exchange Act, or shall be legallyrequired during the Restricted Period, such filing, report or announcement shall clearly indicate in thefootnotes thereto the nature and conditions of such transfer.
Any shares that may be purchased in the offering by a director or officer or by JAB will be subject to therestrictions described above.
J.P. Morgan Securities LLC and Morgan Stanley & Co. LLC, in their sole discretion, may release thesecurities subject to any of the lock-up agreements with the underwriters described above, in whole or in part atany time. In addition, all distributees will sign lock-up agreements following the Distribution. Subsequent to thisoffering and the Distribution, JAB will be an anchor shareholder of the Company, beneficially owningapproximately 38.6% of the Company’s outstanding common stock, prior to giving effect to any purchase byJAB of shares in this offering.
We have agreed to indemnify the underwriters against certain liabilities, including liabilities under theSecurities Act.
We will apply to have our common stock approved for listing/quotation on Nasdaq under the symbol“DNUT.”
In connection with this offering, the underwriters may engage in stabilizing transactions, which involvesmaking bids for, purchasing and selling shares of common stock in the open market for the purpose of preventingor retarding a decline in the market price of the common stock while this offering is in progress. These stabilizingtransactions may include making short sales of common stock, which involves the sale by the underwriters of agreater number of shares of common stock than they are required to purchase in this offering, and purchasingshares of common stock on the open market to cover positions created by short sales. Short sales may be“covered” shorts, which are short positions in an amount not greater than the underwriters’ option to purchaseadditional shares referred to above, or may be “naked” shorts, which are short positions in excess of that amount.The underwriters may close out any covered short position either by exercising their option to purchaseadditional shares, in whole or in part, or by purchasing shares in the open market. In making this determination,the underwriters will consider, among other things, the price of shares available for purchase in the open marketcompared to the price at which the underwriters may purchase shares through the option to purchase additionalshares. A naked short position is more likely to be created if the underwriters are concerned that there may bedownward pressure on the price of the common stock in the open market that could adversely affect investorswho purchase in this offering. To the extent that the underwriters create a naked short position, they willpurchase shares in the open market to cover the position.
The underwriters have advised us that, pursuant to Regulation M of the Securities Act, they may also engagein other activities that stabilize, maintain or otherwise affect the price of the common stock, including theimposition of penalty bids. This means that if the representatives of the underwriters purchase common stock inthe open market in stabilizing transactions or to cover short sales, the representatives can require the underwritersthat sold those shares as part of this offering to repay the underwriting discount received by them.
These activities may have the effect of raising or maintaining the market price of the common stock orpreventing or retarding a decline in the market price of the common stock, and, as a result, the price of thecommon stock may be higher than the price that otherwise might exist in the open market. If the underwriters
174

commence these activities, they may discontinue them at any time. The underwriters may carry out thesetransactions on Nasdaq, in the over-the-counter market or otherwise.
Prior to this offering, there has been no public market for our common stock. The initial public offeringprice will be determined by negotiations between us and the representatives of the underwriters. In determiningthe initial public offering price, we and the representatives of the underwriters expect to consider a number offactors including:
• the information set forth in this prospectus and otherwise available to the representatives;
• our prospects and the history and prospects for the industry in which we compete;
• an assessment of our management;
• our prospects for future earnings;
• the general condition of the securities markets at the time of this offering;
• the recent market prices of, and demand for, publicly traded common stock of generally comparablecompanies; and
• other factors deemed relevant by the underwriters and us.
Neither we nor the underwriters can assure investors that an active trading market will develop for ourcommon stock, or that the shares will trade in the public market at or above the initial public offering price.
Directed Share Program
At our request, the underwriters have reserved for sale, at the initial public offering price, up to 5.0% of theshares offered by this prospectus for sale to some of our directors, officers, employees distributors, dealers,business associates and related persons. If these persons purchase reserved shares it will reduce the number ofshares available for sale to the general public. Any reserved shares that are not so purchased will be offered bythe underwriters to the general public on the same terms as the other shares offered by this prospectus. We haveagreed to indemnify the underwriters against certain liabilities and expenses, including liabilities under theSecurities Act, in connection with the sale of such reserved shares. If purchased by our directors and officers, theshares will be subject to a 180-day lock-up restriction. The directed share program will be arranged throughMorgan Stanley & Co. LLC.
Conflict of Interest
Each of (i) JPMorgan Chase Bank, N.A., an affiliate of J.P. Morgan Securities LLC, an underwriter of thisoffering, is the administrative agent and holds a portion of the outstanding balance of our Term Loan Facility and(ii) Morgan Stanley Senior Funding, Inc., an affiliate of Morgan Stanley & Co. LLC, an underwriter of thisoffering, holds a portion of the outstanding balance of our Term Loan Facility, and as a result, each ofJ.P. Morgan Securities LLC and Morgan Stanley & Co. LLC, will receive at least 5.0% of the net proceeds fromthis offering in connection with the refinancing contemplated herein. See “Use of Proceeds.” Therefore, each ofJ.P. Morgan Securities LLC and Morgan Stanley & Co. LLC, is deemed to have a “conflict of interest” within themeaning of Rule 5121 of FINRA.
Accordingly, this offering is being conducted in accordance with FINRA Rule 5121. FINRA Rule 5121prohibits each of J.P. Morgan Securities LLC and Morgan Stanley & Co. LLC from making sales to discretionaryaccounts without the prior written approval of the account holder and requires that a “qualified independentunderwriter,” as defined in FINRA Rule 5121, participate in the preparation of the registration statement andexercise its usual standards of due diligence with respect thereto. Wells Fargo Securities, LLC is acting as the“qualified independent underwriter” for this offering and is undertaking the legal responsibilities and liabilities of
175

an underwriter under the Securities Act, which specifically include those inherent in Section 11 thereunder. Wehave agreed to indemnify Wells Fargo Securities, LLC against certain liabilities incurred in connection withacting as a “qualified independent underwriter,” including liabilities under the Securities Act. Wells FargoSecurities, LLC will not receive any additional fees for serving as qualified independent underwriter inconnection with this offering. In addition, no underwriter with a conflict of interest will confirm sales to anyaccount over which it exercises discretionary authority without the specific prior written approval of the accountholder.
Other Relationships
Certain of the underwriters and their affiliates have provided in the past to us and our affiliates, and mayprovide from time to time in the future certain commercial banking, financial advisory, investment banking andother services for us and such affiliates in the ordinary course of their business, for which they have received andmay continue to receive customary fees and commissions. In addition, from time to time, certain of theunderwriters and their affiliates may effect transactions for their own account or the account of customers, andhold on behalf of themselves or their customers, long or short positions in our debt or equity securities or loans,and may do so in the future. In addition, certain affiliates of the underwriters have also acted as lenders inconnection with our 2019 Credit Facility, for which they have received, and will receive, customary fees andexpenses as consideration therewith.
Selling Restrictions
Other than in the United States, no action has been taken by us or the underwriters that would permit apublic offering of the securities offered by this prospectus in any jurisdiction where action for that purpose isrequired. The securities offered by this prospectus may not be offered or sold, directly or indirectly, nor may thisprospectus or any other offering material or advertisements in connection with the offer and sale of any suchsecurities be distributed or published in any jurisdiction, except under circumstances that will result incompliance with the applicable rules and regulations of that jurisdiction. Persons into whose possession thisprospectus comes are advised to inform themselves about and to observe any restrictions relating to the offeringand the distribution of this prospectus. This prospectus does not constitute an offer to sell or a solicitation of anoffer to buy any securities offered by this prospectus in any jurisdiction in which such an offer or a solicitation isunlawful.
Notice to Prospective Investors in the European Economic Area
In relation to each Member State of the European Economic Area (each a “Relevant State”), no shares havebeen offered or will be offered pursuant to the offering to the public in that Relevant State prior to the publicationof a prospectus in relation to the shares which has been approved by the competent authority in that RelevantState or, where appropriate, approved in another Relevant State and notified to the competent authority in thatRelevant State, all in accordance with the Prospectus Regulation, except that offers of shares may be made to thepublic in that Relevant State at any time under the following exemptions under the Prospectus Regulation:
(a) to any legal entity which is a qualified investor as defined under the Prospectus Regulation;
(b) to fewer than 150 natural or legal persons (other than qualified investors as defined under theProspectus Regulation), subject to obtaining the prior consent of the underwriters; or
(c) in any other circumstances falling within Article 1(4) of the Prospectus Regulation;
provided that no such offer of shares shall require us or any underwriter to publish a prospectus pursuant toArticle 3 of the Prospectus Regulation or supplement a prospectus pursuant to Article 23 of the ProspectusRegulation and each person who initially acquires any shares or to whom any offer is made will be deemed tohave represented, acknowledged and agreed to and with each of the underwriters and the Company that it is a
176

“qualified investor” within the meaning of Article 2(e) of the Prospectus Regulation. In the case of any sharesbeing offered to a financial intermediary as that term is used in the Prospectus Regulation, each such financialintermediary will be deemed to have represented, acknowledged and agreed that the shares acquired by it in theoffer have not been acquired on a nondiscretionary basis on behalf of, nor have they been acquired with a view totheir offer or resale to, persons in circumstances which may give rise to an offer of any shares to the public otherthan their offer or resale in a Relevant State to qualified investors as so defined or in circumstances in which theprior consent of the underwriters have been obtained to each such proposed offer or resale.
For the purposes of this provision, the expression an “offer to the public” in relation to shares in anyRelevant State means the communication in any form and by any means of sufficient information on the terms ofthe offer and any shares to be offered so as to enable an investor to decide to purchase or subscribe for anyshares, and the expression “Prospectus Regulation” means Regulation (EU) 2017/1129.
We have not authorized and do not authorize the making of any offer of shares through any financialintermediary on their behalf, other than offers made by the underwriters with a view to the final placement of theshares in this document. Accordingly, no purchaser of the shares, other than the underwriters, is authorized tomake any further offer of the shares on behalf of us or the underwriters.
Notice to Prospective Investors in the United Kingdom
In relation to the United Kingdom, no shares of common stock have been offered or will be offered pursuantto this offering to the public in the United Kingdom prior to the publication of a prospectus in relation to theshares that either (i) has been approved by the Financial Conduct Authority, or (ii) is to be treated as if it hadbeen approved by the Financial Conduct Authority in accordance with the transitional provision in Regulation 74of the Prospectus (Amendment etc.) (EU Exit) Regulations 2019, except that offers of shares may be made to thepublic in the United Kingdom at any time under the following exemptions under the UK Prospectus Regulation:
• to any legal entity which is a qualified investor as defined in Article 2 of the UK ProspectusRegulation;
• to fewer than 150 natural or legal persons (other than qualified investors as defined in Article 2 of theUK Prospectus Regulation); or
• in any other circumstances falling within section 86 of the Financial Services and Markets Act 2000(“FSMA”);
provided that no such offer of shares shall require the Company or any representative to publish a prospectuspursuant to section 85 of the FSMA or supplement a prospectus pursuant to Article 23 of the UK ProspectusRegulation.
For the purposes of this provision, the expression an “offer to the public” in relation to any shares in anyrelevant state means the communication in any form and by any means of sufficient information on the terms ofthe offer and any shares to be offered so as to enable an investor to decide to purchase or subscribe for anyshares, and the expression “UK Prospectus Regulation” means Regulation (EU) 2017/1129 as it forms part ofdomestic law by virtue of the European Union (Withdrawal) Act 2018.
We have not authorized and do not authorize the making of any offer of shares through any financialintermediary on their behalf, other than offers made by the underwriters with a view to the final placement of theshares as contemplated in this prospectus. Accordingly, no purchaser of the shares, other than the underwriters, isauthorized to make any further offer of the shares on behalf of us or the underwriters.
In addition, in the United Kingdom, this document is being distributed only to, and is directed only at, andany offer subsequently made may only be directed at persons who are “qualified investors” (as defined inArticle 2 of the UK Prospectus Regulation) (i) who have professional experience in matters relating to
177

investments falling within Article 19(5) of the Financial Services and Markets Act 2000 (Financial Promotion)Order 2005, as amended, or the Order, and/or (ii) who are high net worth companies (or persons to whom it mayotherwise be lawfully communicated) falling within Article 49(2)(a) to (d) of the Order (all such persons togetherbeing referred to as “relevant persons”) or otherwise in circumstances which have not resulted and will not resultin an offer to the public of the shares in the United Kingdom within the meaning of the FSMA.
Any person in the United Kingdom that is not a relevant person should not act or rely on the informationincluded in this document or use it as basis for taking any action. In the United Kingdom, any investment orinvestment activity that this document relates to may be made or taken exclusively by relevant persons.
Notice to Prospective Investors in Canada
The shares may be sold only to purchasers purchasing, or deemed to be purchasing, as principal that areaccredited investors, as defined in National Instrument 45-106 Prospectus Exemptions or subsection 73.3(1) ofthe Securities Act (Ontario), and are permitted clients, as defined in National Instrument 31-103 RegistrationRequirements, Exemptions and Ongoing Registrant Obligations. Any resale of the shares must be made inaccordance with an exemption from, or in a transaction not subject to, the prospectus requirements of applicablesecurities laws.
Securities legislation in certain provinces or territories of Canada may provide a purchaser with remedies forrescission or damages if this prospectus (including any amendment thereto) contains a misrepresentation;provided that the remedies for rescission or damages are exercised by the purchaser within the time limitprescribed by the securities legislation of the purchaser’s province or territory. The purchaser should refer to anyapplicable provisions of the securities legislation of the purchaser’s province or territory for particulars of theserights or consult with a legal advisor.
Pursuant to section 3A.3 of National Instrument 33-105 Underwriting Conflicts (NI 33-105), theunderwriters are not required to comply with the disclosure requirements of NI 33-105 regarding underwriterconflicts of interest in connection with this offering.
Notice to Prospective Investors in Switzerland
The shares may not be publicly offered in Switzerland and will not be listed on the SIX Swiss Exchange(SIX) or on any other stock exchange or regulated trading facility in Switzerland. This document does notconstitute a prospectus within the meaning of, and has been prepared without regard to the disclosure standardsfor issuance prospectuses under art. 652a or art. 1156 of the Swiss Code of Obligations or the disclosurestandards for listing prospectuses under art. 27 ff. of the SIX Listing Rules or the listing rules of any other stockexchange or regulated trading facility in Switzerland. Neither this document nor any other offering or marketingmaterial relating to the shares or the offering may be publicly distributed or otherwise made publicly available inSwitzerland.
Neither this document nor any other offering or marketing material relating to the offering, the company, theshares have been or will be filed with or approved by any Swiss regulatory authority. In particular, this documentwill not be filed with, and the offer of shares will not be supervised by, the Swiss Financial Market SupervisoryAuthority FINMA (FINMA), and the offer of shares has not been and will not be authorized under the SwissFederal Act on Collective Investment Schemes (CISA). The investor protection afforded to acquirers of interestsin collective investment schemes under the CISA does not extend to acquirers of shares.
Notice to Prospective Investors in the Dubai International Financial Centre (the “DIFC”)
This document relates to an Exempt Offer in accordance with and as defined by the Markets Rules 2012 ofthe Dubai Financial Services Authority (DFSA). This document is intended for distribution only to persons of a
178

type specified in the Markets Rules 2012 of the DFSA. It must not be delivered to, or relied on by, any otherperson. The DFSA has no responsibility for reviewing or verifying any documents in connection with ExemptOffers. The DFSA has not approved this prospectus supplement nor taken steps to verify the information set forthherein and has no responsibility for this document. The securities to which this document relates may be illiquidand/or subject to restrictions on their resale. Prospective purchasers of the securities offered should conduct theirown due diligence on the securities. If you do not understand the contents of this document you should consult anauthorized financial advisor.
In relation to its use in the DIFC, this document is strictly private and confidential and is being distributed toa limited number of investors and must not be provided to any person other than the original recipient, and maynot be reproduced or used for any other purpose. The interests in the securities may not be offered or solddirectly or indirectly to the public in the DIFC.
Notice to Prospective Investors in the United Arab Emirates
The shares have not been, and are not being, publicly offered, sold, promoted or advertised in the UnitedArab Emirates (including the Dubai International Financial Centre) other than in compliance with the laws of theUnited Arab Emirates (and the Dubai International Financial Centre) governing the issue, offering and sale ofsecurities. Further, this prospectus does not constitute a public offer of securities in the United Arab Emirates(including the Dubai International Financial Centre) and is not intended to be a public offer. This prospectus hasnot been approved by or filed with the Central Bank of the United Arab Emirates, the Securities andCommodities Authority or the Dubai Financial Services Authority.
Notice to Prospective Investors in Australia
This prospectus:
• does not constitute a disclosure document or a prospectus under Chapter 6D.2 of the CorporationsAct 2001 (Cth) (the Corporations Act);
• has not been, and will not be, lodged with the Australian Securities and Investments Commission(ASIC), as a disclosure document for the purposes of the Corporations Act and does not purport toinclude the information required of a disclosure document for the purposes of the Corporations Act;and
• may only be provided in Australia to select investors who are able to demonstrate that they fall withinone or more of the categories of investors, available under section 708 of the Corporations Act (ExemptInvestors).
The shares may not be directly or indirectly offered for subscription or purchased or sold, and no invitationsto subscribe for or buy the shares may be issued, and no draft or definitive offering memorandum, advertisementor other offering material relating to any shares may be distributed in Australia, except where disclosure toinvestors is not required under Chapter 6D of the Corporations Act or is otherwise in compliance with allapplicable Australian laws and regulations. By submitting an application for the shares, you represent andwarrant to us that you are an Exempt Investor.
As any offer of shares under this document will be made without disclosure in Australia under Chapter 6D.2of the Corporations Act, the offer of those securities for resale in Australia within twelve months may, undersection 707 of the Corporations Act, require disclosure to investors under Chapter 6D.2 if none of the exemptionsin section 708 applies to that resale. By applying for the shares you undertake to us that you will not, for a periodof twelve months from the date of issue of the shares, offer, transfer, assign or otherwise alienate those shares toinvestors in Australia except in circumstances where disclosure to investors is not required under Chapter 6D.2of the Corporations Act or where a compliant disclosure document is prepared and lodged with ASIC.
179

Notice to Prospective Investors in Japan
The shares have not been and will not be registered pursuant to Article 4, Paragraph 1 of the FinancialInstruments and Exchange Act. Accordingly, none of the shares nor any interest therein may be offered or sold,directly or indirectly, in Japan or to, or for the benefit of, any “resident” of Japan (which term as used hereinmeans any person resident in Japan, including any corporation or other entity organized under the laws of Japan),or to others for re-offering or resale, directly or indirectly, in Japan or to or for the benefit of a resident of Japan,except pursuant to an exemption from the registration requirements of, and otherwise in compliance with, theFinancial Instruments and Exchange Act and any other applicable laws, regulations and ministerial guidelines ofJapan in effect at the relevant time.
Notice to Prospective Investors in Hong Kong
The shares have not been offered or sold and will not be offered or sold in Hong Kong, by means of anydocument, other than (i) to “professional investors” as defined in the Securities and Futures Ordinance (Cap. 571of the Laws of Hong Kong), or the SFO, of Hong Kong and any rules made thereunder; or (ii) in othercircumstances which do not result in the document being a “prospectus” as defined in the Companies (WindingUp and Miscellaneous Provisions) Ordinance (Cap. 32) of Hong Kong, or the CO, or which do not constitute anoffer to the public within the meaning of the CO. No advertisement, invitation or document relating to the shareshas been or may be issued or has been or may be in the possession of any person for the purposes of issue,whether in Hong Kong or elsewhere, which is directed at, or the contents of which are likely to be accessed orread by, the public of Hong Kong (except if permitted to do so under the securities laws of Hong Kong) otherthan with respect to shares which are or are intended to be disposed of only to persons outside Hong Kong oronly to “professional investors” as defined in the SFO and any rules made thereunder.
Notice to Prospective Investors in Singapore
Each underwriter has acknowledged that this prospectus has not been registered as a prospectus with theMonetary Authority of Singapore. Accordingly, each underwriter has represented and agreed that it has notoffered or sold any shares or caused the shares to be made the subject of an invitation for subscription orpurchase and will not offer or sell any shares or cause the shares to be made the subject of an invitation forsubscription or purchase, and has not circulated or distributed, nor will it circulate or distribute, this prospectus orany other document or material in connection with the offer or sale, or invitation for subscription or purchase, ofthe shares, whether directly or indirectly, to any person in Singapore other than:
(i) to an institutional investor (as defined in Section 4A of the Securities and Futures Act (Chapter 289) ofSingapore, as modified or amended from time to time, or the SFA) pursuant to Section 274 of the SFA;
(ii) to a relevant person (as defined in Section 275(2) of the SFA) pursuant to Section 275(1) of the SFA,or any person pursuant to Section 275(1A) of the SFA, and in accordance with the conditions specifiedin Section 275 of the SFA; or
(iii) otherwise pursuant to, and in accordance with the conditions of, any other applicable provision of theSFA.
Where the shares are subscribed or purchased under Section 275 of the SFA by a relevant person which is:
(i) a corporation (which is not an accredited investor (as defined in Section 4A of the SFA)) the solebusiness of which is to hold investments and the entire share capital of which is owned by one or moreindividuals, each of whom is an accredited investor; or
(ii) a trust (where the trustee is not an accredited investor) whose sole purpose is to hold investments andeach beneficiary of the trust is an individual who is an accredited investor,
180

securities or securities-based derivatives contracts (each term as defined in Section 2(1) of the SFA) of thatcorporation or the beneficiaries’ rights and interest (howsoever described) in that trust shall not be transferredwithin six months after that corporation or that trust has acquired the shares pursuant to an offer made underSection 275 of the SFA except:
(a) to an institutional investor or to a relevant person, or to any person arising from an offer referred to inSection 275(1A) or Section 276(4)(i)(B) of the SFA;
(b) where no consideration is or will be given for the transfer;
(c) where the transfer is by operation of law;
(d) as specified in Section 276(7) of the SFA; or
(e) as specified in Regulation 37A of the Securities and Futures (Offers of Investments) (Securities andSecurities-based Derivatives Contracts) Regulations 2018.
Singapore SFA Product Classification—In connection with Section 309B of the SFA and the CMPRegulations 2018, unless otherwise specified before an offer of the shares, the company has determined, andhereby notifies all relevant persons (as defined in Section 309A(1) of the SFA), that the shares are “prescribedcapital markets products” (as defined in the CMP Regulations 2018) and Excluded Investment Products (asdefined in MAS Notice SFA 04-N12: Notice on the Sale of Investment Products and MASNotice FAA-N16: Notice on Recommendations on Investment Products).
Notice to Prospective Investors in Bermuda
Shares may be offered or sold in Bermuda only in compliance with the provisions of the InvestmentBusiness Act of 2003 of Bermuda which regulates the sale of securities in Bermuda. Additionally,non-Bermudian persons (including companies) may not carry on or engage in any trade or business in Bermudaunless such persons are permitted to do so under applicable Bermuda legislation.
Notice to Prospective Investors in Saudi Arabia
This document may not be distributed in the Kingdom of Saudi Arabia except to such persons as arepermitted under the Offers of Securities Regulations as issued by the board of the Saudi Arabian Capital MarketAuthority, or CMA, pursuant to resolution number 2-11-2004 dated 4 October 2004 as amended by resolutionnumber 1-28-2008, as amended. The CMA does not make any representation as to the accuracy or completenessof this document and expressly disclaims any liability whatsoever for any loss arising from, or incurred inreliance upon, any part of this document. Prospective purchasers of the securities offered hereby should conducttheir own due diligence on the accuracy of the information relating to the securities. If you do not understand thecontents of this document, you should consult an authorized financial adviser.
Notice to Prospective Investors in the British Virgin Islands
The shares are not being, and may not be offered to the public or to any person in the British Virgin Islandsfor purchase or subscription by or on behalf of the company. The shares may be offered to companiesincorporated under the BVI Business Companies Act, 2004 (British Virgin Islands), or BVI Companies, but onlywhere the offer will be made to, and received by, the relevant BVI Company entirely outside of the British VirginIslands.
Notice to Prospective Investors in China
This prospectus will not be circulated or distributed in the PRC and the shares will not be offered or sold,and will not be offered or sold to any person for re-offering or resale directly or indirectly to any residents of thePRC except pursuant to any applicable laws and regulations of the PRC. Neither this prospectus nor any
181

advertisement or other offering material may be distributed or published in the PRC, except under circumstancesthat will result in compliance with applicable laws and regulations.
Notice to Prospective Investors in Korea
The shares have not been and will not be registered under the Financial Investments Services and CapitalMarkets Act of Korea and the decrees and regulations thereunder, or the FSCMA, and the shares have been andwill be offered in Korea as a private placement under the FSCMA. None of the shares may be offered, sold ordelivered directly or indirectly, or offered or sold to any person for re-offering or resale, directly or indirectly, inKorea or to any resident of Korea except pursuant to the applicable laws and regulations of Korea, including theFSCMA and the Foreign Exchange Transaction Law of Korea and the decrees and regulations thereunder, or theFETL. The shares have not been listed on any of the securities exchanges in the world, including, withoutlimitation, the Korea Exchange in Korea. Furthermore, the purchaser of the shares shall comply with allapplicable regulatory requirements (including but not limited to requirements under the FETL) in connectionwith the purchase of the shares. By the purchase of the shares, the relevant holder thereof will be deemed torepresent and warrant that if it is in Korea or is a resident of Korea, it purchased the shares pursuant to theapplicable laws and regulations of Korea.
Notice to Prospective Investors in Malaysia
No prospectus or other offering material or document in connection with the offer and sale of the shares hasbeen or will be registered with the Securities Commission of Malaysia, or Commission, for the Commission’sapproval pursuant to the Capital Markets and Services Act 2007. Accordingly, this prospectus and any otherdocument or material in connection with the offer or sale, or invitation for subscription or purchase, of the sharesmay not be circulated or distributed, nor may the shares be offered or sold, or be made the subject of an invitationfor subscription or purchase, whether directly or indirectly, to persons in Malaysia other than (i) a closed endfund approved by the Commission; (ii) a holder of a Capital Markets Services License; (iii) a person whoacquires the shares, as principal, if the offer is on terms that the shares may only be acquired at a consideration ofnot less than RM250,000 (or its equivalent in foreign currencies) for each transaction; (iv) an individual whosetotal net personal assets or total net joint assets with his or her spouse exceeds RM3 million (or its equivalent inforeign currencies), excluding the value of the primary residence of the individual; (v) an individual who has agross annual income exceeding RM300,000 (or its equivalent in foreign currencies) per annum in the precedingtwelve months; (vi) an individual who, jointly with his or her spouse, has a gross annual income of RM400,000(or its equivalent in foreign currencies), per annum in the preceding twelve months; (vii) a corporation with totalnet assets exceeding RM10 million (or its equivalent in a foreign currencies) based on the last audited accounts;(viii) a partnership with total net assets exceeding RM10 million (or its equivalent in foreign currencies); (ix) abank licensee or insurance licensee as defined in the Labuan Financial Services and Securities Act 2010; (x) anIslamic bank licensee or takaful licensee as defined in the Labuan Financial Services and Securities Act 2010;and (xi) any other person as may be specified by the Commission; provided that, in the each of the precedingcategories (i) to (xi), the distribution of the shares is made by a holder of a Capital Markets Services License whocarries on the business of dealing in securities. The distribution in Malaysia of this prospectus is subject toMalaysian laws. This prospectus does not constitute and may not be used for the purpose of public offering or anissue, offer for subscription or purchase, invitation to subscribe for or purchase any securities requiring theregistration of a prospectus with the Commission under the Capital Markets and Services Act 2007.
Notice to Prospective Investors in Taiwan
The shares have not been and will not be registered with the Financial Supervisory Commission of Taiwanpursuant to relevant securities laws and regulations and may not be sold, issued or offered within Taiwan througha public offering or in circumstances which constitutes an offer within the meaning of the Securitiesand Exchange Act of Taiwan that requires a registration or approval of the Financial Supervisory Commission ofTaiwan. No person or entity in Taiwan has been authorized to offer, sell, give advice regarding or otherwiseintermediate the offering and sale of the shares in Taiwan.
182

Notice to Prospective Investors in South Africa
Due to restrictions under the securities laws of South Africa, no “offer to the public” (as such term is definedin the South African Companies Act, No. 71 of 2008 (as amended or re-enacted), or the South AfricanCompanies Act) is being made in connection with the issue of the shares in South Africa. Accordingly, thisdocument does not, nor is it intended to, constitute a “registered prospectus” (as that term is defined in the SouthAfrican Companies Act) prepared and registered under the South African Companies Act and has not beenapproved by, and/or filed with, the South African Companies and Intellectual Property Commission or any otherregulatory authority in South Africa. The shares are not offered, and the offer shall not be transferred, sold,renounced or delivered, in South Africa or to a person with an address in South Africa, unless one or other of thefollowing exemptions stipulated in section 96 (1) applies:
Section 96 (1) (a) the offer, transfer, sale, renunciation or delivery is to:
(i) persons whose ordinary business, or part of whose ordinary business, is to deal insecurities, as principal or agent,
(ii) the South African Public Investment Corporation,
(iii) persons or entities regulated by the Reserve Bank of South Africa,
(iv) authorized financial service providers under South African law,
(v) financial institutions recognized as such under South African law,
(vi) a wholly owned subsidiary of any person or entity contemplated in (c), (d) or (e), actingas agent in the capacity of an authorized portfolio manager for a pension fund, or asmanager for a collective investment scheme (in each case duly registered as such underSouth African law), or
any combination of the person in (i) to (vi); or
Section 96 (1) (b) the total contemplated acquisition cost of the securities, for any single addressee acting asprincipal is equal to or greater than ZAR1,000,000 or such higher amount as may bepromulgated by notice in the Government Gazette of South Africa pursuant to section96(2)(a) of the South African Companies Act.
Information made available in this prospectus should not be considered as “advice” as defined in the SouthAfrican Financial Advisory and Intermediary Services Act, 2002.
183

LEGAL MATTERS
Certain legal matters will be passed upon for us by Skadden, Arps, Slate, Meagher & Flom LLP, New York,New York. Certain tax matters will be passed upon for us by McDermott, Will & Emery LLP, New York, NewYork. Certain legal matters will be passed upon for the underwriters by Davis Polk & Wardwell LLP, New York,New York.
EXPERTS
The audited consolidated financial statements of Krispy Kreme, Inc. included in this prospectus andelsewhere in the registration statement have been so included in reliance upon the report of Grant Thornton LLP,independent registered public accountants, upon the authority of said firm as experts in accounting and auditing.
184

WHERE YOU CAN FIND ADDITIONAL INFORMATION
We have filed a registration statement on Form S-1 with the SEC with respect to the registration of thecommon stock offered for sale with this prospectus. This prospectus does not contain all of the information setforth in the registration statement and the exhibits to the registration statement. For further information about us,the common stock we are offering by this prospectus and related matters, you should review the registrationstatement, including the exhibits filed as a part of the registration statement. Statements contained in thisprospectus about the contents of any contract or any other document that is filed as an exhibit to the registrationstatement are not necessarily complete, and we refer you to the full text of the contract or other document filed asan exhibit to the registration statement.
As a result of this offering, we will become subject to the information and periodic reporting requirementsof the Securities Act, and, in accordance with such requirements, will file periodic reports, proxy statements andother information with the SEC. These periodic reports, proxy statements and other information will be availablefor inspection and copying at the SEC’s website. We also maintain a website at www.krispykreme.com at which,following the completion of this offering, you may access our SEC filings free of charge as soon as reasonablypracticable after they are electronically filed with, or furnished to, the SEC. The information contained in, or thatcan be accessed through, our website is not incorporated by reference in, and is not part of, this prospectus. Weintend to furnish our stockholders with annual reports containing combined financial statements audited by ourindependent registered accounting firm.
185

Krispy Kreme, Inc.Index to Consolidated Financial Statements
Contents Page
Audited Consolidated Financial Statements:Report of Independent Registered Public Accounting Firm . . . . . . . . . . . . . . . . . . . . . . . . . . . . . . . . . . . . . . F-2Consolidated Statements of Operations for the years ended January 3, 2021, December 29, 2019 and
December 30, 2018 . . . . . . . . . . . . . . . . . . . . . . . . . . . . . . . . . . . . . . . . . . . . . . . . . . . . . . . . . . . . . . . . . . . F-4Consolidated Statements of Comprehensive Income (Loss) for the years ended January 3, 2021,
December 29, 2019 and December 30, 2018 . . . . . . . . . . . . . . . . . . . . . . . . . . . . . . . . . . . . . . . . . . . . . . . . F-5Consolidated Balance Sheets as of January 3, 2021 and December 29, 2019 . . . . . . . . . . . . . . . . . . . . . . . . F-6Consolidated Statements of Changes in Shareholders’ Equity for the years ended January 3, 2021,
December 29, 2019 and December 30, 2018 . . . . . . . . . . . . . . . . . . . . . . . . . . . . . . . . . . . . . . . . . . . . . . . . F-7Consolidated Statements of Cash Flows for the years ended January 3, 2021, December 29, 2019 and
December 30, 2018 . . . . . . . . . . . . . . . . . . . . . . . . . . . . . . . . . . . . . . . . . . . . . . . . . . . . . . . . . . . . . . . . . . . F-8Notes to Consolidated Financial Statements . . . . . . . . . . . . . . . . . . . . . . . . . . . . . . . . . . . . . . . . . . . . . . . . . . F-10Schedule I - Condensed Financial Information (Parent Company Information):Condensed Statements of Operations and Comprehensive Loss (Parent Company Only) . . . . . . . . . . . . . . . F-56Condensed Balance Sheets (Parent Company Only) . . . . . . . . . . . . . . . . . . . . . . . . . . . . . . . . . . . . . . . . . . . . F-57Condensed Statements of Cash Flows (Parent Company Only) . . . . . . . . . . . . . . . . . . . . . . . . . . . . . . . . . . . F-58Notes to the Condensed Financial Statements (Parent Company Only) . . . . . . . . . . . . . . . . . . . . . . . . . . . . . F-59Condensed Consolidated Financial Statements (Unaudited)Condensed Consolidated Financial StatementsCondensed Consolidated Statements of Operations for the quarters ended April 4, 2021 and
March 29, 2020 . . . . . . . . . . . . . . . . . . . . . . . . . . . . . . . . . . . . . . . . . . . . . . . . . . . . . . . . . . . . . . . . . . . . . . F-60Condensed Consolidated Statements of Comprehensive Income (Loss) for the quarters ended
April 4, 2021 and March 29, 2020 . . . . . . . . . . . . . . . . . . . . . . . . . . . . . . . . . . . . . . . . . . . . . . . . . . . . . . . . F-61Condensed Consolidated Balance Sheets as of April 4, 2021 and March 29, 2020 . . . . . . . . . . . . . . . . . . . . F-62Condensed Consolidated Statements of Changes in Shareholders’ Equity for the quarters ended
April 4, 2021 and March 29, 2020 . . . . . . . . . . . . . . . . . . . . . . . . . . . . . . . . . . . . . . . . . . . . . . . . . . . . . . . . F-63Condensed Consolidated Statements of Cash Flows for the quarters ended April 4, 2021 and
March 29, 2020 . . . . . . . . . . . . . . . . . . . . . . . . . . . . . . . . . . . . . . . . . . . . . . . . . . . . . . . . . . . . . . . . . . . . . . F-65Notes to Condensed Consolidated Financial Statements . . . . . . . . . . . . . . . . . . . . . . . . . . . . . . . . . . . . . . . . F-67

REPORT OF INDEPENDENT REGISTERED PUBLIC ACCOUNTING FIRM
Board of Directors and ShareholdersKrispy Kreme, Inc. (formerly known as Krispy Kreme HoldCo, Inc.)
Opinion on the financial statements
We have audited the accompanying consolidated balance sheets of Krispy Kreme, Inc. (formerly known asKrispy Kreme HoldCo, Inc.) (a Delaware corporation) and subsidiaries (the “Company”) as of January 3, 2021and December 29, 2019, the related consolidated statements of operations, comprehensive income (loss), changesin shareholders’ equity, and cash flows for each of the three years ended January 3, 2021, December 29, 2019and December 30, 2018, and the related notes and financial statement schedule I (collectively referred to as the“financial statements”). In our opinion, the consolidated financial statements present fairly, in all materialrespects, the financial position of the Company as of January 3, 2021 and December 29, 2019, and the results ofits operations and its cash flows for each of the three years ended January 3, 2021, December 29, 2019 andDecember 30, 2018, in conformity with accounting principles generally accepted in the United States ofAmerica.
Basis for opinion
These financial statements are the responsibility of the Company’s management. Our responsibility is to expressan opinion on the Company’s financial statements based on our audits. We are a public accounting firmregistered with the Public Company Accounting Oversight Board (United States) (“PCAOB”) and are required tobe independent with respect to the Company in accordance with U.S. federal securities laws and the applicablerules and regulations of the Securities and Exchange Commission and the PCAOB.
We conducted our audits in accordance with the standards of the PCAOB. Those standards require that we planand perform the audit to obtain reasonable assurance about whether the financial statements are free of materialmisstatement, whether due to error or fraud. The Company is not required to have, nor were we engaged toperform, an audit of its internal control over financial reporting. As part of our audits we are required to obtain anunderstanding of internal control over financial reporting but not for the purpose of expressing an opinion on theeffectiveness of the Company’s internal control over financial reporting. Accordingly, we express no suchopinion.
Our audits included performing procedures to assess the risks of material misstatement of the financialstatements, whether due to error or fraud, and performing procedures that respond to those risks. Such proceduresinclude examining, on a test basis, evidence regarding the amounts and disclosures in the financial statements.Our audits also included evaluating the accounting principles used and significant estimates made bymanagement, as well as evaluating the overall presentation of the financial statements. We believe that our auditsprovide a reasonable basis for our opinion.
Critical audit matter
The critical audit matter communicated below is a matter arising from the current period audit of the financialstatements that was communicated or required to be communicated to the audit committee and that: (1) relates toaccounts or disclosures that are material to the financial statements and (2) involved our especially challenging,subjective, or complex judgments. The communication of critical audit matters does not alter in any way ouropinion on the financial statements, taken as a whole, and we are not, by communicating the critical audit matterbelow, providing a separate opinion on the critical audit matter or on the accounts or disclosures to which itrelates.

Goodwill Impairment Assessment
As described in Note 6 to the consolidated financial statements, for each reporting unit, the Company assessesgoodwill for impairment annually at the beginning of the fourth quarter or more frequently when impairmentindicators are present. Management estimates the fair values of the goodwill reporting units using a combinationof the income and market approaches. We identified the estimation of the fair values of the reporting units as acritical audit matter.
The principle considerations for our determination that the estimation of the fair values of the reporting units is acritical audit matter is that there was high estimation uncertainty due to significant judgement with respect toassumptions used to project the future cash flows, including revenue growth rates, earnings, and capitalexpenditures, discount rate, guideline public companies and market multiples. Given the subjective nature andjudgement applied by management, auditing these estimates required a high degree of auditor judgement and anincreased extent of effort including the use of specialists.
Our audit procedures related to the estimation of the fair value of the reporting units included the following,among others.
• Utilized an internal valuation specialist to evaluate:
• The methodologies used and whether they were acceptable for the underlying assets or operationsand applied correctly by performing independent calculations
• The calculation of the risk-adjusted discount rates by recalculating the weighted average cost ofcapital
• The guideline public companies and transactions utilized by the Company by examining financialmetrics of the comparable public companies and transactions within the industry, and consideringmarket participant guidance and perspective
• We evaluated the reasonableness of management’s forecasts of revenues, earnings and capitalexpenditures by assessing the historical accuracy of management’s estimates and the reasonableness ofassumptions used by management, including analyzing the sensitivity of changes in significantassumptions and the resulting impact to the estimated fair values.
/s/ GRANT THORNTON LLP
We have served as the Company’s auditor since 2017.
Denver, ColoradoApril 23, 2021 (except Note 6a and Note 18, as to which the date is May 28, 2021)

Krispy Kreme, Inc. (formerly known as Krispy Kreme HoldCo, Inc.)Consolidated Statements of Operations
(In thousands, except per share amounts and number of shares)
Fiscal Years Ended
January 3,2021
(53 weeks)
December 29,2019
(52 weeks)
December 30,2018
(52 weeks)
Net revenueProduct sales . . . . . . . . . . . . . . . . . . . . . . . . . . . . . . . . . . . . . . . . . . . . . . $1,085,110 $912,805 $748,860Royalties and other revenues . . . . . . . . . . . . . . . . . . . . . . . . . . . . . . . . . . 36,926 46,603 47,023
Total net revenues . . . . . . . . . . . . . . . . . . . . . . . . . . . . . . . . . . . . . . . . . 1,122,036 959,408 795,883Product and distribution costs . . . . . . . . . . . . . . . . . . . . . . . . . . . . . . . . . 310,909 262,013 246,458Operating expenses . . . . . . . . . . . . . . . . . . . . . . . . . . . . . . . . . . . . . . . . . 488,061 390,849 295,966Selling, general and administrative expense . . . . . . . . . . . . . . . . . . . . . . 216,317 190,237 160,932Pre-opening costs . . . . . . . . . . . . . . . . . . . . . . . . . . . . . . . . . . . . . . . . . . . 11,583 7,078 1,903Other expenses, net . . . . . . . . . . . . . . . . . . . . . . . . . . . . . . . . . . . . . . . . . 10,488 7,465 6,708Depreciation and amortization expense . . . . . . . . . . . . . . . . . . . . . . . . . . 80,398 63,767 49,447
Operating income . . . . . . . . . . . . . . . . . . . . . . . . . . . . . . . . . . . . . . . . . . 4,280 37,999 34,469Interest expense, net . . . . . . . . . . . . . . . . . . . . . . . . . . . . . . . . . . . . . . . . . 34,741 38,085 27,881Interest expense – related party . . . . . . . . . . . . . . . . . . . . . . . . . . . . . . . . 22,468 21,947 18,902Other non-operating (income)/expense, net . . . . . . . . . . . . . . . . . . . . . . . (1,101) (609) 5,443
Loss before income taxes . . . . . . . . . . . . . . . . . . . . . . . . . . . . . . . . . . . . (51,828) (21,424) (17,757)Income tax expense/(benefit) . . . . . . . . . . . . . . . . . . . . . . . . . . . . . . . . . . 9,112 12,577 (5,318)
Net loss . . . . . . . . . . . . . . . . . . . . . . . . . . . . . . . . . . . . . . . . . . . . . . . . . . (60,940) (34,001) (12,439)Net income attributable to noncontrolling interest . . . . . . . . . . . . . . . . . 3,361 3,408 1,633
Net loss attributable to Krispy Kreme, Inc. $ (64,301) $ (37,409) $ (14,072)
Net loss per share:Common stock - Basic . . . . . . . . . . . . . . . . . . . . . . . . . . . . . . . . . . . . . . . $ (904.39) $ (518.40) $ (173.52)Common stock - Diluted . . . . . . . . . . . . . . . . . . . . . . . . . . . . . . . . . . . . . (904.53) $ (519.30) (173.85)Weighted average shares outstanding:Basic . . . . . . . . . . . . . . . . . . . . . . . . . . . . . . . . . . . . . . . . . . . . . . . . . . . . . 71,626 71,626 71,626Diluted . . . . . . . . . . . . . . . . . . . . . . . . . . . . . . . . . . . . . . . . . . . . . . . . . . . 71,626 71,626 71,626
See accompanying notes to Consolidated Financial Statements.
F-4

Krispy Kreme, Inc. (formerly known as Krispy Kreme HoldCo, Inc.)Consolidated Statements of Comprehensive Income (Loss)
(In thousands)
Fiscal Years Ended
January 3,2021
(53 weeks)
December 29,2019
(52 weeks)
December 30,2018
(52 weeks)
Net loss . . . . . . . . . . . . . . . . . . . . . . . . . . . . . . . . . . . . . . . . . . . . . . . . . . . . $(60,940) $(34,001) $(12,439)
Other comprehensive income:Foreign currency translation adjustment, net of income tax benefit/
(expense) of $0.0 million, ($0.8) million and $6.9 million . . . . . . . 19,426 6,940 (20,764)Unrealized loss on cash flow hedges, net of income tax benefit of
$4.8 million, $2.1 million and $1.2 million . . . . . . . . . . . . . . . . . . (14,430) (6,446) (3,734)Unrealized loss on employee benefit plans, net of income tax
benefit/(expense) of $0.0 million, $0.0 million and $0.0million . . . . . . . . . . . . . . . . . . . . . . . . . . . . . . . . . . . . . . . . . . . . . . . (106) — —
Total other comprehensive income/(loss) . . . . . . . . . . . . . . . . . . . . 4,890 494 (24,498)
Comprehensive loss . . . . . . . . . . . . . . . . . . . . . . . . . . . . . . . . . . . . . . . . . . (56,050) (33,507) (36,937)
Net income attributable to noncontrolling interest . . . . . . . . . . . . . . . 3,361 3,408 1,633Currency translation adjustment income/(loss) attributable to
noncontrolling interest . . . . . . . . . . . . . . . . . . . . . . . . . . . . . . . . . . . 547 — (688)
Total comprehensive income attributable to noncontrollinginterest . . . . . . . . . . . . . . . . . . . . . . . . . . . . . . . . . . . . . . . . . . . . . . 3,908 3,408 945
Comprehensive loss attributable to Krispy Kreme, Inc. $(59,958) $(36,915) $(37,882)
See accompanying notes to Consolidated Financial Statements.
F-5

Krispy Kreme, Inc. (formerly known as Krispy Kreme HoldCo, Inc.)Consolidated Balance Sheets
(In thousands, except per share amounts and number of shares)
As of
January 3,2021
December 29,2019
ASSETSCurrent Assets:Cash and cash equivalents . . . . . . . . . . . . . . . . . . . . . . . . . . . . . . . . . . . . . . . . . . . . . . . $ 37,460 $ 35,373Marketable securities . . . . . . . . . . . . . . . . . . . . . . . . . . . . . . . . . . . . . . . . . . . . . . . . . . . 1,048 2,022Restricted cash . . . . . . . . . . . . . . . . . . . . . . . . . . . . . . . . . . . . . . . . . . . . . . . . . . . . . . . . 23 77Accounts receivable, net . . . . . . . . . . . . . . . . . . . . . . . . . . . . . . . . . . . . . . . . . . . . . . . . . 74,351 48,353Inventories . . . . . . . . . . . . . . . . . . . . . . . . . . . . . . . . . . . . . . . . . . . . . . . . . . . . . . . . . . . 38,519 22,563Prepaid expense and other current assets . . . . . . . . . . . . . . . . . . . . . . . . . . . . . . . . . . . . 12,692 9,486
Total current assets . . . . . . . . . . . . . . . . . . . . . . . . . . . . . . . . . . . . . . . . . . . . . . . 164,093 117,874Property and equipment, net . . . . . . . . . . . . . . . . . . . . . . . . . . . . . . . . . . . . . . . . . . . . . . 395,255 323,581Goodwill . . . . . . . . . . . . . . . . . . . . . . . . . . . . . . . . . . . . . . . . . . . . . . . . . . . . . . . . . . . . . 1,086,546 1,049,675Other intangible assets, net . . . . . . . . . . . . . . . . . . . . . . . . . . . . . . . . . . . . . . . . . . . . . . . 998,014 984,866Operating lease right of use asset, net . . . . . . . . . . . . . . . . . . . . . . . . . . . . . . . . . . . . . . 399,688 385,153Other assets . . . . . . . . . . . . . . . . . . . . . . . . . . . . . . . . . . . . . . . . . . . . . . . . . . . . . . . . . . . 17,399 13,477
Total assets . . . . . . . . . . . . . . . . . . . . . . . . . . . . . . . . . . . . . . . . . . . . . . . . . . . . . . $3,060,995 $2,874,626
LIABILITIES AND SHAREHOLDERS’ EQUITYCurrent Liabilities:Current portion of long-term debt . . . . . . . . . . . . . . . . . . . . . . . . . . . . . . . . . . . . . . . . . $ 41,245 $ 46,361Current operating lease liabilities . . . . . . . . . . . . . . . . . . . . . . . . . . . . . . . . . . . . . . . . . . 45,675 46,943Accounts payable . . . . . . . . . . . . . . . . . . . . . . . . . . . . . . . . . . . . . . . . . . . . . . . . . . . . . . 148,645 138,751Accrued liabilities . . . . . . . . . . . . . . . . . . . . . . . . . . . . . . . . . . . . . . . . . . . . . . . . . . . . . . 124,951 80,562Structured payables . . . . . . . . . . . . . . . . . . . . . . . . . . . . . . . . . . . . . . . . . . . . . . . . . . . . . 137,319 69,883
Total current liabilities . . . . . . . . . . . . . . . . . . . . . . . . . . . . . . . . . . . . . . . . . . . . . 497,835 382,500Long-term debt, less current portion . . . . . . . . . . . . . . . . . . . . . . . . . . . . . . . . . . . . . . . 785,810 713,722Related party notes payable . . . . . . . . . . . . . . . . . . . . . . . . . . . . . . . . . . . . . . . . . . . . . . 344,581 340,195Noncurrent operating lease liabilities . . . . . . . . . . . . . . . . . . . . . . . . . . . . . . . . . . . . . . . 376,099 354,876Deferred income taxes, net . . . . . . . . . . . . . . . . . . . . . . . . . . . . . . . . . . . . . . . . . . . . . . . 144,866 152,710Other long-term obligations and deferred credits . . . . . . . . . . . . . . . . . . . . . . . . . . . . . . 63,445 47,206
Total liabilities . . . . . . . . . . . . . . . . . . . . . . . . . . . . . . . . . . . . . . . . . . . . . . . . . . . . 2,212,636 1,991,209Commitments and contingenciesShareholders’ Equity:Common stock, $0.01 par value; 100,000 shares authorized; 71,626 shares issued and
outstanding as of January 3, 2021 and December 29, 2019 . . . . . . . . . . . . . . . . . . . . 1 1Additional paid-in capital . . . . . . . . . . . . . . . . . . . . . . . . . . . . . . . . . . . . . . . . . . . . . . . . 846,748 835,482Shareholder note receivable . . . . . . . . . . . . . . . . . . . . . . . . . . . . . . . . . . . . . . . . . . . . . . (18,660) (17,232)Accumulated other comprehensive loss, net of income tax . . . . . . . . . . . . . . . . . . . . . . (1,208) (5,551)Retained deficit . . . . . . . . . . . . . . . . . . . . . . . . . . . . . . . . . . . . . . . . . . . . . . . . . . . . . . . . (142,197) (77,880)
Total shareholders’ equity attributable to Krispy Kreme, Inc. . . . . . . . . . . . 684,684 734,820Noncontrolling interest . . . . . . . . . . . . . . . . . . . . . . . . . . . . . . . . . . . . . . . . . . . . . . . . . . 163,675 148,597
Total shareholders’ equity . . . . . . . . . . . . . . . . . . . . . . . . . . . . . . . . . . . . . . . . . . 848,359 883,417
Total liabilities and shareholders’ equity . . . . . . . . . . . . . . . . . . . . . . . . . . . . . . $3,060,995 $2,874,626
See accompanying notes to Consolidated Financial Statements.
F-6

Kri
spy
Kre
me,
Inc.
(for
mer
lykn
own
asK
risp
yK
rem
eH
oldC
o,In
c.)
Con
solid
ated
Stat
emen
tsof
Cha
nges
inSh
areh
olde
rs’
Equ
ity
(In
thou
sand
s,ex
cept
num
ber
ofsh
ares
)C
omm
onSt
ock
Add
itio
nal
Pai
d-in
Cap
ital
Shar
ehol
der
Not
eR
ecei
vabl
e
Acc
umul
ated
Oth
erC
ompr
ehen
sive
Inco
me/
(Los
s)
Ret
aine
d(D
efic
it)
Ear
ning
sN
onco
ntro
lling
Inte
rest
Tot
alSh
ares
Out
stan
ding
Am
ount
For
eign
curr
ency
tran
slat
ion
adju
stm
ent
Unr
ealiz
edlo
sson
cash
flow
hedg
es
Unr
ealiz
edlo
sson
empl
oyee
bene
fit
plan
s
Bal
ance
atD
ecem
ber
31,2
017
....
....
....
....
....
.71
,626
$1
$732
,309
$(17
,078
)$
18,4
53$
—$
—$
(23,
629)
$69
,870
$779
,926
Net
(los
s)/in
com
efo
rth
efi
scal
year
ende
dD
ecem
ber
30,
2018
....
....
....
....
....
....
....
....
....
....
——
——
——
(14,
072)
1,63
3(1
2,43
9)O
ther
com
preh
ensi
velo
ssfo
rth
efi
scal
year
ende
dD
ecem
ber
30,2
018
befo
rere
clas
sifi
catio
ns..
....
....
——
—(2
0,76
4)(4
,729
)—
——
(25,
493)
Rec
lass
ific
atio
nfr
omA
OC
I..
....
....
....
....
....
..—
——
—99
5—
——
995
Cap
italc
ontr
ibut
ion
bysh
areh
olde
rs..
....
....
....
...
—80
,000
——
——
——
80,0
00Sh
are-
base
dco
mpe
nsat
ion
....
....
....
....
....
....
.—
9,13
429
——
——
—9,
163
Purc
hase
ofsh
ares
byno
ncon
trol
ling
inte
rest
....
....
..—
—(2
,163
)—
——
—8,
052
5,88
9N
onco
ntro
lling
inte
rest
ofac
quir
eden
tity
....
....
....
.—
——
——
——
60,1
8960
,189
Dis
trib
utio
nto
shar
ehol
ders
....
....
....
....
....
....
——
——
——
(29,
750)
(89)
(29,
839)
Dis
trib
utio
nto
nonc
ontr
ollin
gin
tere
st..
....
....
....
..—
—2,
060
——
——
(8,3
90)
(6,3
30)
Oth
er..
....
....
....
....
....
....
....
....
....
....
——
(339
)—
——
(158
)—
(497
)
Bal
ance
atD
ecem
ber
30,2
018
71,6
26$
1$8
21,4
43$(
17,4
91)
$(2
,311
)$
(3,7
34)
$—
$(6
7,60
9)$1
31,2
65$8
61,5
64C
hang
ein
acco
untin
gst
anda
rd..
....
....
....
....
....
——
——
——
29,7
671,
711
31,4
78N
et(l
oss)
/inco
me
for
the
fisc
alye
aren
ded
Dec
embe
r29
,20
19..
....
....
....
....
....
....
....
....
....
..—
——
——
—(3
7,40
9)3,
408
(34,
001)
Oth
erco
mpr
ehen
sive
inco
me/
(los
s)fo
rth
efi
scal
year
ende
dD
ecem
ber
29,
2019
befo
rere
clas
sifi
catio
ns..
....
....
....
....
....
.6,
940
(8,2
20)
——
—(1
,280
)R
ecla
ssif
icat
ion
from
AO
CI
....
....
....
....
....
....
——
——
1,77
4—
——
1,77
4Sh
are-
base
dco
mpe
nsat
ion
....
....
....
....
....
....
.—
10,6
75—
——
——
6110
,736
Purc
hase
ofsh
ares
byno
ncon
trol
ling
inte
rest
....
....
..—
—(1
,646
)—
——
—17
,267
15,6
21N
onco
ntro
lling
inte
rest
ofac
quir
eden
tity
....
....
....
.—
——
——
——
16,0
1016
,010
Dis
trib
utio
nto
shar
ehol
ders
....
....
....
....
....
....
——
——
——
(2,6
29)
—(2
,629
)D
istr
ibut
ion
tono
ncon
trol
ling
inte
rest
....
....
....
....
——
2,26
9—
——
—(2
1,12
5)(1
8,85
6)N
on-c
ash
cont
ribu
tion
for
tax
shar
ing
arra
ngem
ents
with
rela
ted
part
ies
....
....
....
....
....
....
....
....
.—
3,41
2—
——
——
—3,
412
Oth
er..
....
....
....
....
....
....
....
....
....
....
—(4
8)(3
64)
——
——
—(4
12)
Bal
ance
atD
ecem
ber
29,2
019
71,6
26$
1$8
35,4
82$(
17,2
32)
$4,
629
$(10
,180
)$
—$
(77,
880)
$148
,597
$883
,417
Net
(los
s)/in
com
efo
rth
efi
scal
year
ende
dJa
nuar
y3,
2021
....
....
....
....
....
....
....
....
....
....
——
——
——
(64,
301)
3,36
1(6
0,94
0)O
ther
com
preh
ensi
vein
com
e/(l
oss)
for
the
fisc
alye
aren
ded
Janu
ary
3,20
21be
fore
recl
assi
fica
tions
....
....
....
....
....
...
——
—18
,879
(22,
063)
(106
)—
547
(2,7
43)
Rec
lass
ific
atio
nfr
omA
OC
I..
....
....
....
....
....
..—
——
—7,
633
——
—7,
633
Shar
e-ba
sed
com
pens
atio
n..
....
....
....
....
....
...
—11
,601
——
——
——
11,6
01Pu
rcha
seof
shar
esby
nonc
ontr
ollin
gin
tere
st..
....
....
——
(1,4
67)
——
——
22,8
5321
,386
Dis
trib
utio
nto
shar
ehol
ders
....
....
....
....
....
....
—(3
9)—
——
—(3
)—
(42)
Dis
trib
utio
nto
nonc
ontr
ollin
gin
tere
st..
....
....
....
..—
—29
4—
——
—(1
1,68
3)(1
1,38
9)O
ther
....
....
....
....
....
....
....
....
....
....
..—
(296
)(2
55)
——
—(1
3)—
(564
)
Bal
ance
atJa
nuar
y3,
2021
71,6
26$
1$8
46,7
48$(
18,6
60)
$23
,508
$(24
,610
)$(
106)
$(14
2,19
7)$1
63,6
75$8
48,3
59
See
acco
mpa
nyin
gno
tes
toC
onso
lida
ted
Fin
anci
alSt
atem
ents
F-7

Krispy Kreme, Inc. (formerly known as Krispy Kreme HoldCo, Inc.)Consolidated Statements of Cash Flows
(In thousands)
Fiscal Years Ended
January 3,2021
(53 weeks)
December 29,2019
(52 weeks)
December 30,2018
(52 weeks)
CASH FLOWS FROM OPERATING ACTIVITIES:Net loss . . . . . . . . . . . . . . . . . . . . . . . . . . . . . . . . . . . . . . . . . . . . . . . . . . . . . . . . . . . . . . . . . . . . . . . $ (60,940) $ (34,001) $ (12,439)Adjustments to reconcile net loss to net cash provided by operating activities:
Depreciation and amortization expense . . . . . . . . . . . . . . . . . . . . . . . . . . . . . . . . . . . . . . . . . . 80,398 63,767 49,447Deferred income taxes . . . . . . . . . . . . . . . . . . . . . . . . . . . . . . . . . . . . . . . . . . . . . . . . . . . . . . . (36) 8,422 (17,907)Loss on extinguishment of debt . . . . . . . . . . . . . . . . . . . . . . . . . . . . . . . . . . . . . . . . . . . . . . . . — 1,567 —Impairment and lease termination charges . . . . . . . . . . . . . . . . . . . . . . . . . . . . . . . . . . . . . . . . 4,701 3,081 2,755Loss on disposal of property and equipment . . . . . . . . . . . . . . . . . . . . . . . . . . . . . . . . . . . . . . 2,771 585 166Share-based compensation . . . . . . . . . . . . . . . . . . . . . . . . . . . . . . . . . . . . . . . . . . . . . . . . . . . . 11,601 10,741 9,449Change in accounts and notes receivable allowances . . . . . . . . . . . . . . . . . . . . . . . . . . . . . . . . 1,047 365 33Inventory write-off . . . . . . . . . . . . . . . . . . . . . . . . . . . . . . . . . . . . . . . . . . . . . . . . . . . . . . . . . . 726 231 426(Gain)/loss on contingent consideration related to a business combination . . . . . . . . . . . . . . . (1,521) (499) 4,728Payment of contingent consideration in excess of acquisition date fair value . . . . . . . . . . . . . — (4,229) —Collection of related party income tax receivable . . . . . . . . . . . . . . . . . . . . . . . . . . . . . . . . . . — 28,593 —Other . . . . . . . . . . . . . . . . . . . . . . . . . . . . . . . . . . . . . . . . . . . . . . . . . . . . . . . . . . . . . . . . . . . . . 410 4,703 9,075Change in assets and liabilities, excluding business acquisitions and foreign currency
translation adjustments:Accounts and notes receivable . . . . . . . . . . . . . . . . . . . . . . . . . . . . . . . . . . . . . . . . . . . . . (11,942) (1,258) (1,103)Inventories . . . . . . . . . . . . . . . . . . . . . . . . . . . . . . . . . . . . . . . . . . . . . . . . . . . . . . . . . . . . (15,353) (3,217) 3,877Other current and non-current assets . . . . . . . . . . . . . . . . . . . . . . . . . . . . . . . . . . . . . . . . 434 (5,603) 2,603Deferred rent . . . . . . . . . . . . . . . . . . . . . . . . . . . . . . . . . . . . . . . . . . . . . . . . . . . . . . . . . . . — — 2,658Operating lease assets and liabilities . . . . . . . . . . . . . . . . . . . . . . . . . . . . . . . . . . . . . . . . . (1,575) 3,500 —Accounts payable and accrued liabilities . . . . . . . . . . . . . . . . . . . . . . . . . . . . . . . . . . . . . 12,906 (10,153) 90,792Other long-term obligations and deferred credits . . . . . . . . . . . . . . . . . . . . . . . . . . . . . . . 5,048 14,217 3,777
Net cash provided by operating activities . . . . . . . . . . . . . . . . . . . . . . . . . . . 28,675 80,812 148,337
CASH FLOWS FROM INVESTING ACTIVITIES:Purchase of property and equipment . . . . . . . . . . . . . . . . . . . . . . . . . . . . . . . . . . . . . . . . . . . . . . . . (97,826) (76,373) (42,836)Proceeds from disposals of assets . . . . . . . . . . . . . . . . . . . . . . . . . . . . . . . . . . . . . . . . . . . . . . . . . . . 2,837 — 1,548Proceeds from sale and leaseback transactions . . . . . . . . . . . . . . . . . . . . . . . . . . . . . . . . . . . . . . . . . — — 79,366Acquisition of shops and franchise rights from franchisees, net of cash acquired . . . . . . . . . . . . . . (74,890) (150,373) (200,844)Acquisition of Insomnia Cookies, net of cash acquired . . . . . . . . . . . . . . . . . . . . . . . . . . . . . . . . . . — — (140,042)Principal payments received from loans to franchisees . . . . . . . . . . . . . . . . . . . . . . . . . . . . . . . . . . 684 645 —Purchases of held-to-maturity debt securities . . . . . . . . . . . . . . . . . . . . . . . . . . . . . . . . . . . . . . . . . . (57) (776) (576)Maturities of held-to-maturity debt securities . . . . . . . . . . . . . . . . . . . . . . . . . . . . . . . . . . . . . . . . . . 1,124 271 101
Net cash used for investing activities . . . . . . . . . . . . . . . . . . . . . . . . . . . . . . . (168,128) (226,606) (303,283)
CASH FLOWS FROM FINANCING ACTIVITIES:Proceeds from the issuance of debt . . . . . . . . . . . . . . . . . . . . . . . . . . . . . . . . . . . . . . . . . . . . . . . . . . 288,097 804,002 255,337Repayment of long-term debt and lease obligations . . . . . . . . . . . . . . . . . . . . . . . . . . . . . . . . . . . . . (225,541) (714,617) (150,826)Payment of financing costs . . . . . . . . . . . . . . . . . . . . . . . . . . . . . . . . . . . . . . . . . . . . . . . . . . . . . . . . — (5,665) (1,886)Proceeds from structured payables . . . . . . . . . . . . . . . . . . . . . . . . . . . . . . . . . . . . . . . . . . . . . . . . . . 292,756 124,666 34,382Payments on structured payables . . . . . . . . . . . . . . . . . . . . . . . . . . . . . . . . . . . . . . . . . . . . . . . . . . . (225,320) (68,757) (20,532)Payment of contingent consideration related to a business combination . . . . . . . . . . . . . . . . . . . . . (506) (4,646) —Capital contribution by shareholders . . . . . . . . . . . . . . . . . . . . . . . . . . . . . . . . . . . . . . . . . . . . . . . . — — 80,000Proceeds from sale of noncontrolling interest in subsidiary . . . . . . . . . . . . . . . . . . . . . . . . . . . . . . . 21,386 15,625 5,889Distribution to shareholders . . . . . . . . . . . . . . . . . . . . . . . . . . . . . . . . . . . . . . . . . . . . . . . . . . . . . . . (42) (2,629) (29,839)Distribution to noncontrolling interest . . . . . . . . . . . . . . . . . . . . . . . . . . . . . . . . . . . . . . . . . . . . . . . (11,389) (18,902) (6,330)
Net cash provided by financing activities . . . . . . . . . . . . . . . . . . . . . . . . . . . 139,441 129,077 166,195
Effect of exchange rate changes on cash, cash equivalents and restricted cash . . . . . . . . . . . . . . . . 2,045 (941) 410Net increase/(decrease) in cash, cash equivalents and restricted cash . . . . . . . . . . . . . . . . . . . . . . . 2,033 (17,658) 11,659Cash, cash equivalents and restricted cash at beginning of the fiscal year . . . . . . . . . . . . . . . . . . . . 35,450 53,108 41,449
Cash, cash equivalents and restricted cash at end of the fiscal year . . . . . . . . . . . . . . . . . . . . . $ 37,483 $ 35,450 $ 53,108
Supplemental schedule of non-cash investing and financing activities:Accrual for property and equipment . . . . . . . . . . . . . . . . . . . . . . . . . . . . . . . . . . . . . . . . . 10,182 10,489 697Stock issuance under shareholder notes . . . . . . . . . . . . . . . . . . . . . . . . . . . . . . . . . . . . . . 1,535 1,856 2,163Contingent consideration incurred for acquisition of Krispy Kreme Mexico . . . . . . . . . — 14,021 —Contingent consideration incurred for acquisition of shops and franchise rights from
domestic franchisees . . . . . . . . . . . . . . . . . . . . . . . . . . . . . . . . . . . . . . . . . . . . . . . . . . . — 506 —Contingent consideration incurred for acquisition of Krispy Kreme Australia . . . . . . . . — — 4,646
Reconciliation of cash, cash equivalents and restricted cash at end of fiscal year:Cash and cash equivalents . . . . . . . . . . . . . . . . . . . . . . . . . . . . . . . . . . . . . . . . . . . . . . . . $ 37,460 $ 35,373 $ 52,880Restricted cash . . . . . . . . . . . . . . . . . . . . . . . . . . . . . . . . . . . . . . . . . . . . . . . . . . . . . . . . . 23 77 228
Total cash, cash equivalents and restricted cash . . . . . . . . . . . . . . . . . . . . . $ 37,483 $ 35,450 $ 53,108
See accompanying notes to Consolidated Financial Statements.
F-8

Krispy Kreme, Inc. (formerly known as Krispy Kreme HoldCo, Inc.)Index for Notes to Consolidated Financial Statements
Page
Note 1 Description of Business and Summary of Significant Accounting Policies F–10Note 2 Acquisitions F–21Note 3 Accounts Receivable, net F–29Note 4 Inventories F–29Note 5 Property and Equipment, net F–30Note 6 Goodwill and Other Intangible Assets F–30Note 7 Long-term Debt F–32Note 8 Leases F–34Note 9 Fair Value Measurements F–37Note 10 Derivative Instruments F–37Note 11 Employee Benefit Plans F–40Note 12 Share-based Compensation F–41Note 13 Income Taxes F–43Note 14 Commitments and Contingencies F–47Note 15 Related Party Transactions F–49Note 16 Revenue Recognition F–50Note 17 Net Loss per Share F–51Note 18 Segment Reporting F–52Note 19 Subsequent Events F–55
F-9

Krispy Kreme, Inc. (formerly known as Krispy Kreme HoldCo, Inc.)Notes to Consolidated Financial Statements
(Dollars in thousands, unless otherwise specified)
Note 1 —Description of Business and Summary of Significant Accounting Policies
Description of Business
Krispy Kreme, Inc. (formerly known as Krispy Kreme HoldCo, Inc.) (“Krispy Kreme”) and its subsidiaries(collectively, the “Company”) operates through its omni-channel business model to provide an experientialconsumer experience and produce doughnuts for fresh retail, Delivered Fresh Daily (“DFD”), e-Commerce anddelivery and Krispy Kreme branded sweet treats (“Branded Sweet Treat Line”) distribution channels, ensuringthat consumers are able to access products in numerous ways.
As of January 3, 2021, the Company had 1,687 Krispy Kreme and Insomnia Cookies branded shops in 30countries around the world, of which 879 were controlled and operated by the Company and 808 werefranchised. The ownership and location of those shops is as follows:
KrispyKreme
Domestic
KrispyKreme
International
InsomniaCookieShops Total
Company Shops . . . . . . . . . . . . . . . . . . . . . . . 276 419 184 879Franchise Shops . . . . . . . . . . . . . . . . . . . . . . . 93 715 — 808
Total . . . . . . . . . . . . . . . . . . . . . . . . . . . . . . . . 369 1,134 184 1,687
Basis of Presentation and Consolidation
The Company operates and reports financial information on a 52 or 53-week year with the fiscal year endingon the Sunday closest to December 31. The data periods contained within fiscal years 2020, 2019 and 2018reflect the results of operations for the 53-week period ended January 3, 2021 and the 52-week periods endedDecember 29, 2019 and December 30, 2018.
The accompanying Consolidated Financial Statements include the accounts of Krispy Kreme andsubsidiaries and have been prepared in accordance with accounting principles generally accepted in the UnitedStates of America (“GAAP”). All significant intercompany balances and transactions among Krispy Kreme andsubsidiaries have been eliminated in consolidation. Investments in entities over which the Company has theability to exercise significant influence but which it does not control and whose financial statements are nototherwise required to be consolidated, are accounted for using the equity method.
Noncontrolling interest in the Company’s Consolidated Financial Statements represents the interest insubsidiaries held by joint venture partners and employee shareholders. The joint venture partners holdnoncontrolling interests in the Company’s consolidated subsidiaries, Awesome Doughnut, LLC (“AwesomeDoughnut”) and W.K.S Krispy Kreme, LLC (“WKS Krispy Kreme”). Employee shareholders holdnoncontrolling interests in the consolidated subsidiaries Krispy Kreme Holdings Inc. (“KKHI”), Krispy KremeHolding UK Ltd. (“KKUK”), Krispy Kreme Holdings Pty Ltd (“KK Australia”), Krispy Kreme Mexico S. deR.L. de C.V. (“KK Mexico”) and Insomnia Cookies Holdings, LLC (“Insomnia Cookies”). Since the Companyconsolidates the financial statements of these subsidiaries, the noncontrolling owners’ share of each subsidiary’snet assets and results of operations are deducted and reported as a noncontrolling interest on the ConsolidatedBalance Sheets and as net income attributable to noncontrolling interest in the Consolidated Statements ofOperations and comprehensive income attributable to noncontrolling interest in the Consolidated Statements ofComprehensive Income.
F-10

Use of Estimates
The preparation of financial statements in conformity with U.S. GAAP requires management to makeestimates and assumptions that affect the reported amounts of assets and liabilities and disclosure of contingentassets and liabilities as of the date of the financial statements and the reported amounts of revenues and expensesduring the reporting period. Actual results could differ from those estimates under different assumptions orconditions.
Revenue Recognition
Revenue is recognized in accordance with Accounting Standards Codification (“ASC”) 606, Revenue fromContracts with Customers. Revenue is recognized when control of promised goods or services is transferred to acustomer in an amount that reflects the consideration expected to be received for those goods or services.
Product sales
Product sales include revenue derived from (1) the sale of doughnuts, cookies and complementary productsto on-premise, Branded Sweet Treat Line and DFD customers and (2) the sale of doughnut mix, other ingredientsand supplies and doughnut-making equipment to franchisees. Revenue is recognized at the time of delivery foron-premise sales and sales to franchisees. For Branded Sweet Treat Line and DFD sales, revenue is recognizedeither at the time of delivery, net of provisions for estimated product returns or, with respect to those BrandedSweet Treat Line customers that take title to products purchased from the Company at the time those products aresold by the Branded Sweet Treat Line customer to consumers, simultaneously with such consumer purchases.Control transfers to customers at the time of delivery. Revenues from Branded Sweet Treat Line customers andfrom the sale of doughnut mix, other ingredients and supplies and doughnut-making equipment to franchiseesinclude any applicable shipping and handling costs invoiced to the customer and the expense of such shippingand handling costs is included in Operating expenses. The Company recorded shipping revenue of approximately$15.2 million, $6.5 million and $2.8 million in the fiscal years ended January 3, 2021, December 29, 2019 andDecember 30, 2018, respectively.
Franchise revenue
Franchise revenue included in Royalties and other revenues is derived from development and initialfranchise fees relating to new shop openings and ongoing royalties charged to franchisees based on their sales.The Company sells individual franchises domestically and internationally, as well as development agreementsthat grant the right to develop shops in designated areas. Generally, the franchise license granted for eachindividual shop within an arrangement represents a single performance obligation. The franchise agreements anddevelopment agreements typically require the franchisee to pay initial nonrefundable franchise fees (i.e. initialservices such as training and assisting with shop set-up) prior to opening. The franchises also pay a royalty on amonthly basis based upon a percentage of franchisee gross sales. Royalties are recognized in income asunderlying franchisee sales occur. The initial term of domestic franchise agreements is typically 15 years. TheCompany recognizes the initial nonrefundable fees over the term of the franchise agreements on an outputmethod based on time elapsed, corresponding with the customer’s right to use the franchise for the term of theagreement. A franchisee may elect to renew the term of a franchise agreement and, if approved, will typicallypay a renewal fee upon execution of the renewal term.
Franchise-related advertising fund revenue
Franchise-related advertising fund revenue included in Other revenues is derived from domestic andinternational franchise agreements that typically require the franchisee to pay advertising fees on a continuousmonthly basis based on a percentage of franchisee net sales, which are recognized based on fees earned eachperiod. Total advertising fund revenue for the fiscal years ended January 3, 2021, December 29, 2019 andDecember 30, 2018 is $8.1 million, $9.3 million and $7.8 million, respectively.
F-11

Gift card sales
The Company and its franchisees sell gift cards that are redeemable for products in the company-owned orfranchise shops. The Company manages the gift card program and collects all funds from the activation of giftcards and reimburses franchisees for the redemption of gift cards in their shops. Deferred revenue forunredeemed gift cards is included in Accrued liabilities in the Consolidated Balance Sheets. As of January 3,2021 and December 29, 2019, the gross amount of deferred revenue recognized for unredeemed gift cards was$18.0 million and $15.1 million, respectively. Gift cards sold do not have an expiration date or service feescharged. The likelihood of redemption may be determined to be remote for certain cards due to long periods ofinactivity. In these circumstances, the Company recognizes revenue from unredeemed gift cards (“breakagerevenue”) within Product sales if they are not subject to unclaimed property laws. The Company estimatesbreakage for the portfolio of gift cards and recognizes it based on the estimated pattern of gift card use. As ofJanuary 3, 2021 and December 29, 2019, deferred revenue, net of breakage revenue recognized, was $10.4million and $9.3 million, respectively.
Gift card costs incurred to fulfill obligations under a contract are capitalized when such costs generate orenhance resources to be used in satisfying future performance obligations and the costs are deemed recoverable.Judgement is used in determining whether certain contract costs can be capitalized. These costs are capitalizedand amortized on a systematic basis to match the timing of revenue recognition, depending on when the gift cardis used. This amortization expense is recorded in operating expense in the Company’s Consolidated Statement ofOperations. From time to time, management will review the capitalized costs for impairment. As of January 3,2021 and December 19, 2019, the capitalized gift card costs were $1.7 million and $1.8 million, respectively.
Customer loyalty program
Customers can participate in spend-based loyalty programs. Customers who join the loyalty programs willreceive a credit or point for each purchase of eligible product. After accumulating a certain number of credits orpoints, the customers can redeem their credits or points for a free product. The Company defers revenue based onan estimated selling price of the free product earned by the customer and establishes a corresponding liability indeferred revenue. As of January 3, 2021 and December 29, 2019, the deferred revenue related to loyaltyprograms is $3.6 million and $2.2 million, respectively.
Revenue-based taxes
The Company reports revenue net of any revenue-based taxes assessed by governmental authorities that areimposed on and concurrent with specific revenue-producing transactions. The primary revenue-based taxes aresales tax and value-added tax (“VAT”).
Operating Expenses
Operating expenses consist of expenses primarily related to company-operated shops including payroll andbenefit costs for service employees at company-operated locations, rent and utilities, expenses associated withcompany operations, costs associated with procuring materials from suppliers and other shop-level operatingcosts.
Marketing Expenses
Costs associated with marketing the products, including advertising and other brand promotional activities,are expensed as incurred, and were approximately $34.0 million, $28.8 million and $23.0 million in the fiscalyears ended January 3, 2021, December 29, 2019 and December 30, 2018, respectively.
Cash and Cash Equivalents and Restricted Cash
Cash equivalents consist of demand deposits in banks and short-term, highly liquid debt instruments withoriginal maturities of three months or less.
F-12

All credit and debit card transactions that are processed in less than five days are classified as cash and cashequivalents. The amounts due from banks for these transactions totaled $9.6 million as of January 3, 2021 and$4.3 million as of December 29, 2019.
Restricted cash consists of funds related to the employee benefit plan.
Marketable Securities
Marketable securities consist of debt instruments that are being held to maturity longer than three monthsbut less than one year. Their fair value approximates their carrying value on the Consolidated Balance Sheets.
Account Receivable, Net of Allowance for Expected Credit Losses
Accounts receivable relate primarily to payments due for sale of products, franchise fees, royalties,advertising fees and licensing fees. The Company maintains allowances for expected credit losses related to itsaccounts receivable, including receivables from franchisees, in amounts which the Company believes aresufficient to provide for losses estimated to be sustained on realization of these receivables. Such estimatesinherently involve uncertainties and assessments of the outcome of future events, and changes in facts andcircumstances may result in adjustments to the allowance for expected credit losses. The Company hadallowance for expected credit losses of $1.4 million and $0.7 million as of January 3, 2021 and December 29,2019, respectively.
Concentration of Credit Risk
Financial instruments that subject the Company to credit risk consist principally of receivables from SweetTreat Line and DFD customers and franchisees and guarantees of certain franchisee leases. Branded Sweet TreatLine and DFD receivables are primarily from grocer/mass merchants and convenience stores. For the fiscal yearsended January 3, 2021, December 29, 2019 and December 30, 2018, no customer accounted for more than 10%of revenue or a significant amount of receivables that would result in a concentration.
Management also evaluates the recoverability of receivables from the franchisees and maintain allowancesfor expected credit losses which management believes are sufficient to provide for losses which may be sustainedon realization of these receivables. In addition, management evaluates the likelihood of potential payments by theCompany under lease guarantees and records estimated liabilities for payments the managements considerprobable.
Inventories
Inventories, which consist of raw materials, work in progress, finished goods and purchased merchandise,are recorded at the lower of cost and net realizable value with cost determined using the first-in, first-out method.Raw materials inventory also includes doughnut equipment spare parts. Finished goods and purchasedmerchandise are net of reserves for excess or obsolete finished goods.
Prepaid Expense and Other Current Assets
Prepaid expense and other current assets consist primarily of prepaid assets of $11.3 million and $8.1million, related to service contracts and insurance premiums, as of January 3, 2021 and December 29, 2019,respectively.
Property and Equipment, net
Property and equipment are recorded at cost. Depreciation of property and equipment is provided using thestraight-line method over the estimated useful lives of the respective assets.
F-13

The lives used in computing depreciation are as follows:
Buildings . . . . . . . . . . . . . . . . . . . . . . . . . . . . . . . . . . . . . 20 to 35 yearsMachinery and equipment . . . . . . . . . . . . . . . . . . . . . . . 3 to 15 yearsComputer software . . . . . . . . . . . . . . . . . . . . . . . . . . . . . 2 to 7 years
Leasehold improvements are amortized over the shorter of the estimated useful life of the asset or the leaseterm.
The Company assesses long-lived fixed asset groups for potential impairment whenever events or changesin circumstances indicate that their carrying amount may not be recoverable. If the carrying amount of the assetsexceeds the sum of the undiscounted cash flows, the Company records an impairment charge in an amount equalto the excess of the carrying value of the assets over their estimated fair value.
Impairment charges related to the Company’s long-lived assets were $0.3 million, $0.5 million and $2.3million for the fiscal years ended January 3, 2021, December 29, 2019 and December 30, 2018, respectively.Such charges related to underperforming shops, including refranchised shops, shops closed or likely to be closedand shops which management believes will not generate sufficient future cash flows to enable the Company torecover the carrying value of the shops’ assets, but which management has not yet decided to close. The impairedshop assets include real properties, the fair values of which were estimated based on independent appraisals or, inthe case of any properties which the Company is negotiating to sell, based on its negotiations with unrelatedthird-party buyers; leasehold improvements, which are typically abandoned when the leased properties revert tothe lessor; and doughnut-making and other equipment the fair values of which were estimated based on thereplacement cost of the equipment, after considering refurbishment and transportation costs. The impairmentcharges are included within Other operating expenses on the Consolidated Statements of Operations.
Leases
Effective December 31, 2018, the first day of fiscal year 2019, the Company implemented AccountingStandards Update (“ASU”) 2016-02 (“the new standard”), Leases, which amended authoritative guidance onleases and is codified in ASC 842, Leases. The amended guidance requires lessees to recognize most leases ontheir balance sheets as right-of-use assets along with corresponding lease liabilities. The new standard requireslessees to apply a dual approach, classifying leases as either finance or operating leases based on the principle ofwhether or not the lease is effectively a financed purchase by the lessee. This classification determines whetherlease expense is recognized based on an effective interest method or on a straight-line basis over the term of thelease. The new standard also requires increased disclosures to help financial statement users better understand theamount, timing and uncertainty of cash flows arising from leases. The FASB’s authoritative guidance providescompanies with the option to apply this ASU to new and existing leases within the scope of the guidance as ofthe beginning of the period of adoption. The Company elected this transition method of applying the new leasestandard and has recognized right-of-use assets, lease liabilities and any cumulative-effect adjustments to theopening balance of retained earnings as of December 31, 2018. Prior period amounts were not adjusted and willcontinue to be reported under the accounting standards in effect for those periods.
The adoption of the new standard had a material impact to the balance sheet due to the capitalization ofright-of-use assets and lease liabilities associated with the current operating leases in which the Company is thelessee. The adoption of the new standard resulted in the recording of additional lease assets and lease liabilities(net of prior period reported capital leases) of $280.0 million and $291.0 million at the date of adoption,respectively. The adoption of the new standard had a material impact on the Consolidated Statements of Changesin Shareholders’ Equity due to the recognition of a deferred gain on a sale-leaseback transaction completed inMarch 2018 and the recognition of a previously unrecognized portion of an impairment to a right-of-use asset atthe date of adoption. There was also a $4.1 million deferred tax benefit in the Consolidated Statements ofChanges in Shareholders’ Equity as a result of the adoption. The adoption of the new standard did not have amaterial impact on the Consolidated Statements of Operations nor the Consolidated Statements of Cash Flows.
F-14

The cumulative effect of the changes made to the Company’s Consolidated Balance Sheets as ofDecember 31, 2018 for the adoption of ASC 842 was as follows:
December 30,2018 (as
reported)ASC 842
Adjustments
December 31,2018 (as
adjusted)
AccountOperating lease right of use asset, net . . . . . . . . $ — $270,170 $270,170Property and equipment, net . . . . . . . . . . . . . . . . 227,102 10,085 237,187Other intangible assets, net . . . . . . . . . . . . . . . . . 920,265 (7,305) 912,960Current portion of long-term debt . . . . . . . . . . . 38,126 1,168 39,294Current operating lease liabilities . . . . . . . . . . . . — 24,088 24,088Accrued liabilities . . . . . . . . . . . . . . . . . . . . . . . . 82,281 (2,967) 79,314Noncurrent operating lease liabilities . . . . . . . . . — 258,152 258,152Long-term debt, less current portion . . . . . . . . . 592,684 7,152 599,836Other long-term obligations and deferred
credits . . . . . . . . . . . . . . . . . . . . . . . . . . . . . . . 76,576 (54,378) 22,198Deferred income taxes, net . . . . . . . . . . . . . . . . . 128,360 8,257 136,617Noncontrolling interest . . . . . . . . . . . . . . . . . . . . 131,265 1,711 132,976Retained (deficit) earnings . . . . . . . . . . . . . . . . . $ (67,609) $ 29,767 $ (37,842)
Upon the adoption of the new standard on December 31, 2018, the Company elected the package ofpractical expedients provided under the guidance. The practical expedient package applies to leases commencedprior to the adoption of the new standard and permits companies not to reassess whether existing or expiredcontracts are or contain a lease, the lease classification and any initial direct costs for any existing leases. TheCompany has elected to not separate the lease and non-lease components within the contract. Therefore, all fixedpayments associated with the lease are included in the right-of-use asset and the lease liability. These costs oftenrelate to the payments for a proportionate share of real estate taxes, insurance, common area maintenance andother operating costs in addition to a base rent. Any variable payments related to the lease are recorded as leaseexpense when and as incurred. The Company has elected this practical expedient for its real estate, vehicles andequipment leases. The Company did not elect the hindsight practical expedient. The Company has elected theshort-term lease expedient. A short-term lease is a lease that, as of the commencement date, has a lease term of12 months or less and does not include an option to purchase the underlying asset that the lessee is reasonablycertain to exercise. For such leases, the Company will not apply the recognition requirements of Topic 842 andinstead will recognize the lease payments as lease cost on a straight-line basis over the lease term. Additionally,the Company elected the practical expedient under ASU No. 2018-01, which allows an entity to not reassesswhether any existing land easements are or contain leases.
Lease termination costs represent the estimated fair value of liabilities related to unexpired leases, afterreduction by the amount of accrued rent expense, if any, related to the leases, and are recorded when the leasecontracts are terminated or, if earlier, the date on which the Company ceases use of the leased property. The fairvalues of these liabilities were estimated as the excess, if any, of the contractual payments required under theunexpired leases over the current market lease rates for the properties, discounted at a credit-adjusted risk-freerate over the remaining term of the leases. The provision for lease termination costs also includes adjustments toliabilities recorded in prior periods arising from changes in estimated sublease rentals and from settlements withlandlords.
Goodwill and Other Intangible Assets
Goodwill represents the excess of the purchase price over the fair value of identifiable net assets acquired ina business combination. For each reporting unit, the Company assesses goodwill for impairment annually at thebeginning of the fourth quarter or more frequently when impairment indicators are present. If the carrying valueof the reporting unit exceeds its fair value, the Company recognizes an impairment charge for the difference upto the carrying value of the allocated goodwill. The value is estimated under a discounted cash flow approach,
F-15

which incorporates assumptions regarding future growth rates, terminal values and discount rates. For the fiscalyears ended January 3, 2021, December 29, 2019 and December 30, 2018, there were no goodwill impairmentcharges.
In fiscal year 2019, the Company changed the date of the annual impairment test from December 1 to thebeginning of the fourth quarter. There has not been a lapse of more than 12 months between assessment dates andthe change was not made with the intent of accelerating or delaying an impairment charge.
Other intangible assets primarily represent the trade names for the Company’s brands, franchise agreements(domestic and international), reacquired franchise rights, customer relationships and non-competitionagreements. The trade names have been assigned an indefinite useful life and are reviewed annually forimpairment. All other intangible assets are amortized on a straight-line basis over their estimated useful lives.Definite-lived intangible assets are assessed for impairment whenever triggering events or indicators of potentialimpairment occur. The Company did not have any impairment charges of other intangible assets during any ofthe periods presented.
Accrued Liabilities
Accrued liabilities include accrued compensation, accrued legal fees, accrued utilities, accrued marketingand other accrued liabilities. As of January 3, 2021 and December 29, 2019, accrued compensation and benefitsincluded in the Accrued liabilities balance was $34.1 million and $22.0 million, respectively.
Supply Chain Financing Program
The Company has undertaken broad efforts to improve its working capital, in part by negotiating longerpayment terms with vendors. The Company has an agreement with a third-party administrator which allowsparticipating suppliers to track payments from the Company, and if voluntarily elected by the supplier, to sellpayment obligations from the Company to financial institutions (the “Supply Chain Financing Program” or the“SCF Program”). When participating suppliers elect to sell one or more of the Company’s payment obligations,the rights and obligations of the Company to settle its payables on their contractual due date are not impacted.The Company has no economic or commercial interest in a supplier’s decision to enter into these agreements andthe financial institutions do not provide incentives such as rebates or profit sharing to the Company under theSCF Program. The Company and suppliers agree on commercial terms for the goods and services procured,which are consistent with payment terms observed at other peer companies in the industry. The Company’sobligations to its suppliers, including amounts due, are not impacted by the SCF Program and thus remainclassified as trade payables.
Cards Program
The Company utilizes various purchase cards issued by financial institutions to facilitate purchases of goodsand services. By using the cards, the Company receives rebates and differing levels of discounts based on timingof repayment. The payment obligations under these purchased cards are classified as Structured payables on theConsolidated Balance Sheets and constitute the entire Structured payables’ balance. The associated cash flowsare included in the financing section of the Consolidated Statements of Cash Flows.
Share-based Compensation
The Company measures and recognizes compensation expense for share-based payment awards based onthe fair value of each award at its grant date and recognizes expense over the related service period on a straight-line basis necessary for each award to vest. The Company accounts for forfeitures of share-based compensationawards as they occur. Compensation expense is included in Selling, general and administrative expenses in theConsolidated Statements of Operations.
F-16

Fair Value
The accounting standards for fair value measurements define fair value as the price that would be receivedfor an asset or paid to transfer a liability in the principal or most advantageous market for the asset or liability inan orderly transaction between market participants at the measurement date. The accounting standards for fairvalue measurements establish a three-level fair value hierarchy that prioritizes the inputs used to measure fairvalue. This hierarchy requires entities to maximize the use of observable inputs and minimize the use ofunobservable inputs. The three levels of inputs used to measure fair value are as follows:
• Level 1—Quoted prices in active markets that are accessible as of the measurement date for identicalassets or liabilities.
• Level 2—Observable inputs other than quoted prices included within Level 1, such as quoted prices forsimilar assets and liabilities in active markets; quoted prices for identical or similar assets and liabilitiesin markets that are not active; or other inputs that are observable or can be corroborated by observablemarket data.
• Level 3—Unobservable inputs that are supported by little or no market activity and that are significantto the fair value measurement of the assets or liabilities. These include certain pricing models,discounted cash flow methodologies and similar techniques that use significant unobservable inputs.
The Company’s financial instruments not measured at fair value on a recurring basis include cash and cashequivalents, receivables, accounts payable and accrued liabilities and are reflected in the Consolidated FinancialStatements at cost which approximates fair value for these items due to their short-term nature. Managementbelieves the fair value determination of these short-term financial instruments is a Level 1 measure. TheCompany’s other assets and liabilities measured at fair value on a non-recurring basis include long-lived assets,right-of-use assets, goodwill and other indefinite-live intangible assets, if determined to be impaired. Refer toProperty and Equipment, net policy section in Note 1 to the Consolidated Financial Statements, for informationabout impairment charges on long-lived assets. The fair values of assets evaluated for impairment weredetermined using an income-based approach and are classified as Level 3 measures within the fair valuehierarchy.
Derivative Financial Instruments and Derivative Commodity Instruments
Management reflects derivative financial instruments, which typically consist of interest rate derivatives,foreign currency derivatives and fuel commodity derivatives in the Consolidated Balance Sheets at their fairvalue. Prior to April 30, 2018, changes in the fair value of the interest rate derivatives were reflected in income asthe Company did not apply hedge accounting to those derivatives. For interest rate derivatives enteredsubsequent to April 30, 2018, changes in the fair value of the interest rate derivatives are reflected in othercomprehensive income as the Company applies cash flow hedge accounting to those derivatives. Consistent withthe classification of interest paid, cash flows from interest rate derivatives are classified as operating on theConsolidated Statements of Cash Flows. The changes in the fair values of the foreign currency and fuelcommodity derivatives are reflected in income as the Company does not apply hedge accounting to thosederivatives.
Self-Insurance Risks and Receivables from Insurers
The Company is subject to workers’ compensation, vehicle and general liability claims. The Company isself-insured for the cost of workers’ compensation, vehicle and general liability claims up to the amount of stop-loss insurance coverage purchased by the Company from commercial insurance carriers. The Company maintainsaccruals for the estimated cost of claims, without regard to the effects of stop-loss coverage, using actuarialmethods which evaluate known open and incurred but not reported claims and consider historical lossdevelopment experience. As of January 3, 2021 and December 29, 2019, the Company had approximately $14.4million and $11.2 million, respectively, reserved for such programs. The liability recorded for assessments has
F-17

not been discounted. In addition, the Company records receivables from the insurance carriers for claimsamounts estimated to be recovered under the stop-loss insurance policies when these amounts are estimable andprobable of collection. The Company estimates such stop-loss receivables using the same actuarial methods usedto establish the related claims accruals, and taking into account the amount of risk transferred to the carriersunder the stop-loss policies. The stop-loss policies provide coverage for claims in excess of retained self-insurance risks, which are determined on a claim-by-claim basis. Inclusive of the receivables from the stop-lossinsurance policies, the Company’s limited liability balance was $7.7 million and $7.1 million as of January 3,2021 and December 29, 2019, respectively.
Preferred Stock
The Company has 1,000 shares of authorized preferred stock with one cent par value per share. There wereno shares of preferred stock issued or outstanding as of January 3, 2021 and December 29, 2019.
Earnings (Loss) per Share (EPS)
The Company discloses two calculations of earnings (loss) per share (“EPS”): basic EPS and diluted EPS.The numerator in calculating common stock basic and diluted EPS is net income (loss) attributable to theCompany. The denominator in calculating common stock basic EPS is the weighted average shares outstanding.The denominator in calculating common stock diluted EPS includes the additional dilutive effect of unvestedrestricted stock units (“RSUs”) when the effect is not antidilutive. Refer to Note 17, Net Loss per Share, to theConsolidated Financial Statements for further discussion.
Recent Accounting Pronouncements
Recently Adopted
Accounting Standards Adopted at the Beginning of Fiscal Year 2020
In June 2016, the FASB issued ASU 2016-13, Financial Instruments—Credit Losses (Topic 326):Measurement of Credit Losses on Financial Instruments. This ASU enables financial statement users to obtainmore decision-useful information about the expected credit losses on financial instruments and othercommitments to extend credit held by a reporting entity as of each reporting date. This ASU replaces the incurredloss impairment methodology in current GAAP with a methodology that reflects expected credit losses andrequires consideration of a broader range of reasonable and supportable information to inform credit lossestimates. It is effective for fiscal years beginning after December 15, 2019, including interim periods withinthose fiscal years. The adoption of this standards did not materially impact the financial statements presentedherein.
Accounting Standards Adopted at the Beginning of Fiscal Year 2019
In February 2018, the FASB issued ASU 2018-02, Income Statement—Reporting Comprehensive Income(Topic 220): Reclassification of Certain Tax Effects from Accumulated Other Comprehensive Income. Theguidance permits entities to reclassify the stranded income tax effects resulting from the Tax Cuts and Jobs Act,enacted in December 2017, (“Tax Act”) from accumulated other comprehensive income to retained earnings. Theguidance is effective for fiscal years beginning after December 15, 2018 and interim periods within those fiscalyears. The guidance may be applied in the period of adoption or retrospectively to each period in which the effectof the change related to the Tax Act was recognized. The adoption of this standard did not have a material impacton the Company’s financial statements.
In January 2017, the FASB issued ASU 2017-04, Intangibles—Goodwill and Other (Topic 350): Simplifyingthe Test for Goodwill Impairment. ASU 2017-04 simplifies the measurement of goodwill by eliminating therequirement to calculate the implied fair value of goodwill (step 2 of the current impairment test) to measurethe goodwill impairment charge. Instead, entities will record impairment charges based on the excess of a
F-18
reporting unit’s carrying amount over its fair value. It is effective for annual and interim periods beginning afterDecember 15, 2019. Early adoption is permitted for interim or annual goodwill impairment test performed with ameasurement date after January 1, 2017. The adoption of this standard did not have a material impact on theCompany’s financial statements.
In February 2016, the FASB issued ASU 2016-02, Leases (Topic 842), which supersedes the existing leaseguidance under current U.S. GAAP. ASU 2016-02 is based on the principle that entities should recognize assetsand liabilities arising from leases. Under the new standard, a lessee will recognize on its balance sheet a leaseliability and a right-of-use (“ROU”) asset for all leases, including operating leases, with a term greater than 12months. The new standard will also distinguish leases as either finance leases or operating leases. This distinctionwill affect how leases are measured and presented in the income statement and statement of cash flows. The newstandard is effective for fiscal years beginning after December 15, 2018, and interim periods within those annualperiods. Early adoption is permitted. Upon adoption, lessees and lessors are required to recognize and measureleases at the beginning of the earliest period presented using a modified retrospective approach. Refer to theLeases policy section in Note 1 to the Consolidated Financial Statements for more information about theCompany’s adoption of this standard.
Accounting Standards Adopted at the Beginning of Fiscal Year 2018
In August 2018, the FASB issued ASU 2018-15, Intangibles—Goodwill and Other—Internal-Use Software(Subtopic 350-40): Customer’s Accounting for Implementation Costs Incurred in a Cloud ComputingArrangement That Is a Service Contract. This ASU aligns the requirements for capitalizing implementation costsincurred in a hosting arrangement that is a service contract with the requirements for capitalizing implementationcosts incurred to develop or obtain internal-use software (and hosting arrangements that include an internal-usesoftware license). For privately held companies, ASU 2018-15 is effective for annual reporting periods beginningafter December 15, 2020, and interim periods within annual periods beginning after December 15, 2021. Earlyadoption is permitted. The Company adopted the guidance in ASU 2018-15 as of the beginning of fiscal year2018 and applies the new guidance prospectively to costs incurred in fiscal year 2018 and thereafter. In fiscalyear 2018, the Company capitalized $3.0 million of cloud-based software costs, of which $0.5 million has beenamortized as of the end of the fiscal year.
In August 2017, the FASB issued ASU 2017-12, Derivatives and Hedging (Topic 815): TargetedImprovements to Accounting for Hedging Activities. This ASU amends and simplifies the hedge accountingmodel in ASC 815, Derivatives and Hedging. The ASU enables entities to better portray the economics of theirrisk management activities in the financial statements and enhance the transparency and understandability ofhedge results. The guidance requires the presentation of all items that affect earnings in the same incomestatement line as the hedged item and is effective for fiscal years beginning after December 15, 2018 and interimperiods within those fiscal years with early adoption permitted. The adoption of this standard did not materiallyimpact the financial statements presented herein.
In January 2017, the FASB issued ASU No. 2017-01, Business Combinations (Topic 805): Clarifying theDefinition of a Business. This ASU changes the definition of a business to assist companies in evaluating when aset of transferred assets and activities constitutes a business. The guidance is effective for annual periodsbeginning after December 15, 2017, including interim periods within those periods. The adoption of this standarddid not have a material impact on the Company’s financial statements.
In October 2016, the FASB issued ASU 2016-16, Income Taxes (Topic 740): Intra-Entity Transfers ofAssets Other Than Inventory. This ASU is intended to improve the accounting for the income tax consequencesof intra-entity transfers of assets other than inventory. The updated guidance indicates that an entity shouldrecognize the income tax consequences of an intra-entity transfer of an asset other than inventory when thetransfer occurs instead of when the asset has been sold to an outside party. The updated guidance is effective forfiscal years beginning after December 15, 2017, including interim periods within those fiscal years, and early
F-19

adoption is permitted. The amendments are to be applied on a modified retrospective basis through a cumulative-effect adjustment directly to retained earnings as of the beginning of the period of the adoption. The adoption ofthis standard did not have a material impact on the Company’s financial statements.
In August 2016, the FASB issued ASU 2016-15, Statement of Cash Flows (Topic 231): Classification ofCertain Cash Receipts and Cash Payments, which provides guidance on eight specific cash flow classificationissues. ASU 2016-15 is effective for fiscal years beginning after December 15, 2017, and interim periods withinthose fiscal years. Early adoption is permitted. Under ASU 2016-15, contingent consideration payments that weremade to the seller related to the Company acquisition of KK Australia were classified as cash outflows forfinancing and operating activities, because they were not made “soon after” the acquisition.
In November 2016, the FASB issued ASU 2016-18, Statement of Cash Flows (Topic 230): Restricted Cash.This ASU requires that a statement of cash flows explain the change during the period in the total of cash, cashequivalents and amounts generally described as restricted cash. As a result, restricted cash should be includedwith cash and cash equivalents in the beginning-of-period and end-of-period amounts shown on the statement ofcash flows. The new standard also requires companies to disclose the nature of the restriction on restricted cash.The Company adopted the new standard in fiscal year 2018 and revised the prior period in accordance with thisASU.
In March 2016, the FASB issued ASU 2016-09, Compensation – Stock Compensation (Topic 718):Improvements to Employee Share-Based Payment Accounting. This ASU is intended to simplify several aspectsof accounting for share-based payment transactions, including the income tax consequences, classification ofawards as either equity or liabilities and classification on the statement of cash flows. The updated guidance iseffective for annual reporting periods beginning after December 15, 2017. The Company adopted the newstandard at the beginning of fiscal year 2018. The adoption of this standard did not materially impact thefinancial statements presented herein.
In January 2016, the FASB issued ASU 2016-01, Financial Instruments – Overall (Subtopic 825-10):Recognition and Measurement of Financial Assets and Financial Liabilities, which addresses certain aspects ofrecognition, measurement, presentation and disclosure of financial instruments. The guidance is effective forfiscal years beginning after December 15, 2017, including interim periods within those fiscal years. TheCompany adopted this guidance at the beginning of fiscal year 2018. The adoption of this guidance did notmaterially impact the financial statements presented herein.
In May 2014, the FASB issued ASU 2014-09, Revenue from Contracts with Customers (Topic 606), asamended, which provides for a single five-step model to be applied to all revenue from contracts with customers.The guidance also requires improved disclosures to help users of the financial statements better understand thenature, amount, timing and uncertainty of revenue that is recognized. The standard allows for either a fullretrospective or modified retrospective transition method. In April 2016, the FASB issued ASU 2016-08 toclarify the implementation of ASU 2014-09. The guidance in ASU 2014-09 is effective for annual reportingperiods beginning after December 15, 2018, and interim reporting periods within annual reporting periodsbeginning after December 15, 2019. Early adoption is permitted beginning after December 15, 2016, includinginterim reporting periods within that reporting period. The Company adopted the standard for its fiscal year 2018.The Company applied the modified retrospective method of adoption, recording the cumulative effect ofapplying the new standard to its retained earnings as of January 1, 2018, without restatement of prior periods.Refer to Note 16, Revenue Recognition, to the Consolidated Financial Statements for more information about theCompany’s adoption of this standard.
Not Yet Adopted
In March 2020, the FASB issued ASU 2020-04, Reference Rate Reform (Topic 848): Facilitation of theEffects of Reference Rate Reform on Financial Reporting, which provides companies with optional guidance to
F-20

ease the potential accounting burden associated with transitioning away from reference rates that are expected tobe discontinued. It is effective for all entities as of March 12, 2020 through December 31, 2022. A company mayelect to apply the amendments for contract modifications by as of any date from the beginning of an interimperiod that includes or is subsequent to March 12, 2020, or prospectively from a date within an interim periodthat includes or is subsequent to March 12, 2020, up to the date that the financial statements are available to beissued. The Company is currently evaluating the effect of the new guidance on its Consolidated FinancialStatements and related disclosures.
In December 2019, the FASB issued ASU 2019-12, Income Taxes (Topic 740) Simplifying the Accountingfor Income Taxes. ASU 2019-12 simplifies the accounting for income taxes by removing certain exceptions inTopic 740 and clarifying and amending existing guidance. It is effective for annual and interim periods beginningafter December 15, 2020, and interim periods within those fiscal years. Early adoption is permitted. There areseveral adoption methods for different amendments in this ASU, including retrospective method for amendmentsrelated to separate financial statements of legal entities that are not subject to tax, modified retrospective methodfor amendments related to changes in ownership of foreign equity method investments or subsidiaries, eitherretrospective or modified retrospective method for amendments related to franchise taxes that are partially basedon income and prospective method for all other amendments. The Company is currently evaluating the impact ofadoption to the financial statements and expect the adoption will not have a material impact on the Company’sfinancial statements.
There are other new accounting pronouncements issued by the FASB that the Company has adopted or willadopt, as applicable, and the Company does not believe any of these accounting pronouncements have had, orwill have, a material impact on its Consolidated Financial Statements or disclosures.
Note 2—Acquisitions
The Company strategically acquires companies in order to increase its footprint and sell products thatdiversify its existing offerings. These acquisitions are accounted for as business combinations using theacquisition method, whereby the purchase price is allocated to the assets acquired and liabilities assumed, basedon their estimated fair values as of the date of the acquisition.
Transaction-related expenses as a result of these acquisitions, which exclude costs incurred to integrate theacquired entities, were recorded within Operating income in the Statements of Operations (primarily Selling,general and administrative expenses) during the fiscal year such costs were incurred.
Goodwill recognized for these acquisitions represents the intangible assets that do not qualify for separaterecognition and primarily includes the acquired customer base, the acquired workforce including shop partners inthe region that have strong relationships with these customers and the existing geographic retail and onlinepresence.
2020 Acquisitions
Acquisition of KK Japan
On December 8, 2020, the Company acquired all equity interests in Krispy Kreme Doughnut Japan Co., Ltd.(“KK Japan”). KK Japan holds the franchise and development rights of the Krispy Kreme brand for the territoryof Japan. KK Japan manufactures and distributes doughnuts through 44 shops and through wholesale channels.
Acquisition-date fair value of consideration transferred was $3.8 million, consisting of settlement of pre-existing relationships, including the write-off of deferred revenue of ($0.1) million and the disposal of thefranchise intangible asset related to the KK Japan franchisee recorded by the Company in connection with theacquisition by JAB Holding Company (“the Merger”). The net book value of the franchise intangible asset was$3.9 million as of the date of the acquisition of KK Japan.
F-21

The Company calculated an excess of estimated fair values of net assets acquired over the acquisitionconsideration paid, resulting in a bargain purchase gain of $0.7 million. The bargain purchase gain, which isprimarily the result of favorable purchase terms due to KK Japan’s historical net losses from operations, wasrecorded within Other income in the Statements of Operations for the fiscal year 2020.
Acquisition of Other Krispy Kreme Shops in 2020
In 2020, the Company acquired the business and operating assets of an additional eight franchisees,collectively consisting of 51 Krispy Kreme shops in the United States. The Company paid total consideration of$89.9 million, consisting of $80.4 million cash and $9.5 million settlement of amounts related to pre-existingrelationships, to acquire substantially all of the shops’ assets. The settlement of pre-existing relationshipsincluded in the purchase consideration includes the write-off of accounts and notes receivable, net of deferredrevenue, of $2.6 million. It also includes the disposal of the franchise intangible asset related to the eightfranchisees recorded by the Company at the time of the Merger. The net book value of the franchise intangibleasset was a cumulative $6.9 million as of the dates of acquisition of the franchisees.
The following table summarizes the preliminary fair values of assets acquired and liabilities assumed as ofthe date of acquisition for the 2020 acquisitions as well as the acquired businesses’ impact on consolidatedresults in the year of acquisition.
KK JapanOther
KK Shops
Total PurchasePrice Allocationfor Acquisitions
Assets acquired:Cash, cash equivalents and restricted cash . . . . $ 5,340 $ 112 $ 5,452Marketable securities . . . . . . . . . . . . . . . . . . . . — — —Receivables . . . . . . . . . . . . . . . . . . . . . . . . . . . 3,322 — 3,322Inventory . . . . . . . . . . . . . . . . . . . . . . . . . . . . . 354 779 1,133Other current assets . . . . . . . . . . . . . . . . . . . . . 469 23 492Property and equipment . . . . . . . . . . . . . . . . . . 1,029 16,585 17,614Other intangible assets . . . . . . . . . . . . . . . . . . . — 48,011 48,011Operating lease right of use asset . . . . . . . . . . . 12,260 38,096 50,356Other assets . . . . . . . . . . . . . . . . . . . . . . . . . . . 3,975 3,781 7,756
Total identified assets acquired . . . . . . . 26,749 107,387 134,136
Liabilities assumed:Accounts payable . . . . . . . . . . . . . . . . . . . . . . . (2,522) — (2,522)Accrued liabilities . . . . . . . . . . . . . . . . . . . . . . (3,049) (1,656) (4,705)Current operating lease liabilities . . . . . . . . . . (4,430) (2,968) (7,398)Noncurrent operating lease liabilities . . . . . . . (7,861) (35,128) (42,989)Deferred income taxes, net . . . . . . . . . . . . . . . . (1,966) — (1,966)Other long-term obligations and deferred
credits . . . . . . . . . . . . . . . . . . . . . . . . . . . . . . (2,468) — (2,468)
Total liabilities assumed . . . . . . . . . . . . (22,296) (39,752) (62,048)
Goodwill . . . . . . . . . . . . . . . . . . . . . . . . . . . . . . — 22,329 22,329Noncontrolling interest . . . . . . . . . . . . . . . . . . . — — —Bargain purchase gain . . . . . . . . . . . . . . . . . . . (688) — (688)
Purchase consideration, net . . . . . . . . . . $ 3,765 $ 89,964 $ 93,729
Transaction costs (approx.) . . . . . . . . . . . . . . . $ 3,192 $ 4,636 $ 7,828Reportable segment(s) . . . . . . . . . . . . . . . . . . .
Market DevelopmentUS andCanada
F-22

The results of operations of the aforementioned acquired shops were consolidated by the Company from thedate of acquisition and include $38.5 million of total revenue and $0.3 million of net income attributable to theCompany for fiscal year 2020. The amounts do not reflect adjustments for franchise royalties and relatedexpenses that the Company could have generated as revenue and expenses from the acquired franchisees duringthe fiscal year had the transaction not been completed.
2019 Acquisitions
Acquisition of KK Mexico
On November 19, 2019, the Company acquired all equity interests in KK Mexico. KK Mexico holds thefranchise and development rights of the Krispy Kreme brand for the territory of Mexico. KK Mexicomanufactures and distributes doughnuts through 231 shops and through wholesale channels. Acquisition-date fairvalue of consideration transferred was $76.8 million, consisting of cash of $70.4 million, fair value of contingentconsideration of $14.0 million and settlement of pre-existing relationships (net of debt pushed down) of ($7.6)million.
The purchase agreement for KK Mexico included potential earnout payments of up to $12.5 million basedon EBITDA results for the fiscal year 2019 and up to $12.5 million for revenue results for the fiscal year 2020.The Company included the fair value of these contingent payments in the purchase consideration. Based on theEBITDA results for fiscal year 2019, the Company paid the full $12.5 million of contingent consideration relatedto the fiscal year 2019, which was included as a cash outflow from investing activities in the Company’sConsolidated Statements of Cash Flows for the fiscal year 2019. Based on the revenue results for the fiscal year2020, the Company made no earnout payment related to this fiscal year and recognized a gain of $1.5 million inits Consolidated Statements of Operations for the fiscal year 2020.
The settlement of pre-existing relationships included in the purchase consideration includes the write-off ofdeferred revenue of ($0.5) million and the establishment of push-down debt of ($10.7) million. It also includesthe disposal of the franchise intangible asset related to the KK Mexico franchisee recorded by the Company atthe time of the Merger. The net book value of the franchise intangible asset was $3.6 million as of the date of theacquisition of KK Mexico.
Other intangible assets consist of reacquired franchise rights with an estimated useful life equal to theweighted average remaining franchise agreement term. None of the goodwill nor the reacquired franchise rightsare deductible as goodwill for income tax purposes.
Within the measurement period, there were cumulative adjustments to goodwill of $1.2 million related tovaluation adjustments on accounts receivable, property and equipment, operating lease right of use assets, otherassets, accounts payable and deferred income taxes, net.
Acquisition of WKS Krispy Kreme
On November 18, 2019, the Company entered into a joint venture with W.K.S. Holdings Corporation(“WKS Holdings”) whereby the Company holds a 55% membership interest in WKS Krispy Kreme and WKSHoldings holds the remaining 45% membership interest. The Company paid total consideration of $19.6 millionto acquire the interest in the joint venture, consisting of cash of $46.2 million, fair value of contingentconsideration of $0.5 million and settlement of pre-existing relationships (net of debt pushed down) of ($27.1)million. WKS Holdings, a Krispy Kreme franchisee formerly operating under the name Hot Glaze Enchantment,contributed the assets of 30 Krispy Kreme shops in various states in the Western U.S. to the joint venture.
The contingent consideration arrangement required the Company to pay Hot Glaze Enchantment based onthe fluctuation in fair value of rental payments associated with a Krispy Kreme shop in Layton, UT whereupon
F-23

lease renegotiation was ongoing as of the acquisition date. The payment was to be on or before the earlier of (a.)April 30, 2021 or (b.) within 30 days following execution of the new lease agreement. Based on the results of thelease renegotiation a payment of $0.5 million was made to Hot Glaze Enchantment in 2020 to settle thecontingent consideration liability. The Company has not recognized any expense associated with this contingentconsideration in its Consolidated Statements of Operations for the fiscal year 2020.
The settlement of pre-existing relationships included in the purchase consideration includes the write-off ofaccounts and notes receivable, net of deferred revenue, of ($0.1) million and the establishment of push-down debtof ($33.0) million. It also includes the disposal of the franchise intangible asset related to the Westward Dough,LLC (which contributed six shops into the WKS Krispy Kreme joint venture) and Hot Glaze Enchantmentfranchisees recorded by the Company at the time of the Merger. The net book value of the franchise intangibleasset was $6.0 million as of the date of acquisition of WKS Krispy Kreme.
Other intangible assets consist of reacquired franchise rights with an estimated useful life equal to theweighted average remaining franchise agreement term. A total of $49.2 million of goodwill and reacquiredfranchise rights are expected to be deductible as goodwill for U.S. income tax purposes.
The fair value of the 45% noncontrolling interest in WKS Krispy Kreme was estimated to be $16.0 million.The fair value estimate was based on a total value of the equity in WKS Krispy Kreme derived from theconsideration paid by the Company for its equity interests.
Within the measurement period, there were cumulative adjustments to goodwill of $1.1 million related tovaluation adjustments on property and equipment, other intangible assets and accounts payable.
Acquisition of Other Krispy Kreme Shops in 2019
In 2019, the Company acquired the business and operating assets of an additional three franchisees,collectively consisting of 22 Krispy Kreme shops in the United States. The Company paid total consideration of$26.6 million, consisting of $23.2 million cash and $3.4 million settlement of amounts related to pre-existingrelationships, to acquire substantially all of the shops’ assets. The settlement of pre-existing relationshipsincluded in the purchase consideration includes the write-off of accounts and notes receivable, net of deferredrevenue, of $0.2 million. It also includes the disposal of the franchise intangible asset related to the threefranchisees recorded by the Company as of the time of the Merger. The net book value of the franchise intangibleasset was a cumulative $3.2 million at the dates of acquisition of the franchisees.
Within the measurement period, there was an adjustment to goodwill of $0.1 million related to anadjustment to accrued liabilities.
F-24

The following table summarizes the fair values of the assets acquired and liabilities assumed as of the dateof acquisition for the 2019 acquisitions as well as the acquired businesses’ impact on consolidated results in theyear of acquisition. This table incorporates certain measurement period adjustments during the fiscal year 2019.
KK Mexico WKS
OtherKK
Shops
Total PurchasePrice Allocationfor Acquisitions
Assets acquired:Cash, cash equivalents and restricted cash . . . . . . . . . $ 856 $ 2,356 $ 44 $ 3,256Marketable securities . . . . . . . . . . . . . . . . . . . . . . . . . . 1 19 — 20Receivables . . . . . . . . . . . . . . . . . . . . . . . . . . . . . . . . . 4,242 115 334 4,691Inventory . . . . . . . . . . . . . . . . . . . . . . . . . . . . . . . . . . . 1,470 566 171 2,207Other current assets . . . . . . . . . . . . . . . . . . . . . . . . . . . 412 237 83 732Property and equipment . . . . . . . . . . . . . . . . . . . . . . . . 14,383 19,213 5,758 39,354Other intangible assets . . . . . . . . . . . . . . . . . . . . . . . . . 52,779 26,400 16,049 95,228Operating lease right of use asset . . . . . . . . . . . . . . . . 6,723 42,208 11,397 60,328Other assets . . . . . . . . . . . . . . . . . . . . . . . . . . . . . . . . . 1,649 51 559 2,259
Total identified assets acquired . . . . . . . . . . . . 82,515 91,165 34,395 208,075
Liabilities assumed:Accounts payable . . . . . . . . . . . . . . . . . . . . . . . . . . . . . (6,002) (1,702) (565) (8,269)Accrued liabilities . . . . . . . . . . . . . . . . . . . . . . . . . . . . (5,564) (6,370) (2,167) (14,101)Note payable . . . . . . . . . . . . . . . . . . . . . . . . . . . . . . . . (10,706) (33,000) — (43,706)Noncurrent operating lease liabilities . . . . . . . . . . . . . (2,846) (38,121) (9,726) (50,693)Deferred income taxes, net . . . . . . . . . . . . . . . . . . . . . (16,576) — — (16,576)Other long-term obligations and deferred credits . . . . (271) — (950) (1,221)
Total liabilities assumed . . . . . . . . . . . . . . . . . . (41,965) (79,193) (13,408) (134,566)
Goodwill . . . . . . . . . . . . . . . . . . . . . . . . . . . . . . . . . . . 36,223 23,606 5,625 65,454Noncontrolling interest . . . . . . . . . . . . . . . . . . . . . . . . — (16,010) — (16,010)
Purchase consideration, net . . . . . . . . . . . . . . . $ 76,773 $ 19,568 $ 26,612 $ 122,953
Transaction costs in 2020 (approx.) . . . . . . . . . . . . . . . $ 1,734 $ 540 $ 114 $ 2,388Transaction costs in 2019 (approx.) . . . . . . . . . . . . . . . 7,447 3,053 2,336 12,836
Total transaction costs (approx.) . . . . . . . . . . . $ 9,181 $ 3,593 $ 2,450 $ 15,224
Reportable segment(s) . . . . . . . . . . . . . . . . . . . . . . . . .International
US andCanada
US andCanada
The results of operations of the aforementioned acquired shops were consolidated by the Company from thedate of acquisition and include $31.7 million of total revenue and $3.7 million of net income attributable to theCompany for fiscal year 2019. The amounts do not reflect adjustments for franchise royalties and relatedexpenses that the Company could have generated as revenue and expenses from the acquired franchisees duringthe fiscal year had the transaction not been completed.
2018 Acquisitions
Acquisition of KK Australia
On March 18, 2018, the Company acquired all equity interests in KK Australia. KK Australia holds thefranchise and development rights of the Krispy Kreme brand for the majority of the territory of Australia and allof New Zealand. KK Australia manufactures and distributes doughnuts through 29 shops and through wholesalechannels. Acquisition-date fair value of consideration transferred was $123.0 million, consisting of cash of$118.3 million and fair value of contingent consideration of $4.7 million.
F-25

The contingent consideration arrangement required the Company to pay the seller if EBITDA of KKAustralia for the fiscal year 2018 exceeded a certain target. The contingent consideration was capped at12.5 million Australian dollars, which is equivalent to $8.8 million using the exchange rate on December 31,2018. Based on the performance of KK Australia for the fiscal year 2018, the Company paid the full 12.5 millionAustralian dollars of contingent consideration. As a result, the Company recognized $4.7 million of additionalexpense associated with this contingent consideration in Other non-operating (income)/expense, net in itsConsolidated Statements of Operations for the fiscal year ended December 30, 2018.
The settlement of pre-existing relationships included in the purchase consideration includes the disposal ofthe franchise intangible asset related to the KK Australia franchisee recorded at time of the Merger. The net bookvalue of the franchise intangible asset was $3.8 million as of the date of acquisition of the franchisee. Disposal ofthe intangible asset resulted in $3.8 million of additional goodwill.
Other intangible assets acquired consisted primarily of reacquired franchise rights with an estimated usefullife equal to the weighted average remaining franchise agreement term. The goodwill of $75.5 million isexpected to be deductible for U.S. income tax purposes.
In connection with the acquisition, a former director of the seller was appointed Chief Executive Officer ofKK Australia, purchased 2.60% of the shares in KK Australia and was granted restricted stock rights for anadditional 1.91% of shares. Restricted stock rights will vest in full after the employment period of 4.5 years. TheCompany recognized compensation expense, separately from the business combination, of $0.5 million for therestricted stock grant in Selling, general and administrative expenses for the fiscal year 2018.
Awesome Doughnut Joint Venture
On April 30, 2018, the Company entered into a joint venture with Great Circle Family Foods LLC (“GreatCircle”) whereby the Company holds a 70% membership interest in Awesome Doughnut and Great Circle holdsthe remaining 30% membership interest. The Company paid total consideration of $59.3 million to acquire theinterest in the joint venture, consisting of $57.4 million cash and $1.9 million cancellation of pre-existingreceivable from Great Circle. Great Circle, a Krispy Kreme franchisee, contributed substantially all assets of 17Krispy Kreme shops in southern California to the joint venture.
The settlement of pre-existing relationships included in the purchase consideration includes the disposal ofthe franchise intangible asset related to the Awesome Doughnut franchisee recorded at time of the Merger. Thenet book value of the franchise intangible asset was $5.1 million as of the date of acquisition of the franchisee.Disposal of the intangible asset resulted in $5.1 million of additional goodwill.
Other intangible assets acquired consisted primarily of reacquired franchise rights with an estimated usefullife equal to the weighted average remaining franchise agreement term. A total of $72.2 million of goodwill andreacquired franchise rights are expected to be deductible as goodwill for U.S. income tax purposes.
The fair value of the 30% noncontrolling interest in Awesome Doughnut was estimated to be $25.4 million.The fair value estimate was based on a total value of the equity in Awesome Doughnut derived from theconsideration paid by the Company for its equity interests.
Acquisition of Insomnia Cookies
On September 16, 2018, the Company acquired a 74.7% interest in Insomnia Cookies for approximately$139.5 million in cash. As of the acquisition date, Insomnia Cookies had 135 cookie shops in the United States.
Other intangible assets acquired consisted of the Insomnia Cookies brand, which has an indefinite usefullife. Goodwill is expected to be deductible for U.S. income tax purposes.
F-26

The fair value of the 25.3% noncontrolling interest in Insomnia Cookies was estimated to be $34.8 millionusing the income approach. As Insomnia Cookies was a private company, the fair value measurement was basedon significant inputs unobservable in the market and thus represents a Level 3 measurement as defined in ASC820, Fair Value Measurements. The fair value estimate was based on a total value of the equity in InsomniaCookies derived from the consideration paid by the Company for its equity interests.
At the acquisition date, Insomnia Cookies was a party to a class action lawsuit alleging violations ofminimum wage laws, overtime laws and attendant recordkeeping requirements. The estimated contingent liabilityfor the class action lawsuit was determined to be approximately $2.0 million as of the acquisition date. Thecontingent liability for the class action lawsuit was settled for $1.5 million during 2020.
Acquisition of Other Krispy Kreme Shops in 2018
In 2018, the Company acquired the business and operating assets of five franchisees, collectively consistingof 22 Krispy Kreme shops in the United States. The Company paid total consideration of $28.5 million,consisting of $26.9 million cash and $1.6 million settlement of pre-existing relationships, to acquire substantiallyall of the shops’ assets.
F-27

The following table summarizes the fair values of the assets acquired and liabilities assumed as of the dateof acquisition for the 2018 acquisitions as well as the acquired businesses’ impact on consolidated results in theyear of acquisition. This table incorporates certain measurement period adjustments during the fiscal year 2019,which did not have a significant impact on the Company’s Consolidated Statements of Operations, balancessheets or cash flows.
KK Australia
AwesomeDoughnut
Joint VentureInsomniaCookies
Other KKShops
Total PurchasePrice Allocationfor Acquisitions
Assets acquired:Cash, cash equivalents and restricted
cash . . . . . . . . . . . . . . . . . . . . . . . . . . . . . $ 5,189 $ 132 $ 1,233 $ — $ 6,554Marketable securities . . . . . . . . . . . . . . . . . 1,164 — — — 1,164Receivables . . . . . . . . . . . . . . . . . . . . . . . . . 542 27 232 — 801Inventory . . . . . . . . . . . . . . . . . . . . . . . . . . . 1,714 206 2,346 1,022 5,288Other current assets . . . . . . . . . . . . . . . . . . . 363 223 506 354 1,446Property and equipment . . . . . . . . . . . . . . . 28,973 12,313 22,364 10,568 74,218Other intangible assets . . . . . . . . . . . . . . . . 29,225 53,750 104,500 15,453 202,928Other assets . . . . . . . . . . . . . . . . . . . . . . . . . — 68 672 — 740
Total identified assets acquired . . . . 67,170 66,719 131,853 27,397 293,139
Liabilities assumed: —Accounts payable . . . . . . . . . . . . . . . . . . . . (3,794) (274) (5,866) — (9,934)Accrued liabilities . . . . . . . . . . . . . . . . . . . . (6,425) (850) (3,933) — (11,208)Deferred income taxes, net . . . . . . . . . . . . . (6,617) — — — (6,617)Long-term debt, less current portion . . . . . . (2,692) — (2,692)Other long-term obligations and deferred
credits . . . . . . . . . . . . . . . . . . . . . . . . . . . (2,895) (730) — (227) (3,852)
Total liabilities assumed . . . . . . . . . . (19,731) (1,854) (12,491) (227) (34,303)
Goodwill . . . . . . . . . . . . . . . . . . . . . . . . . . . 75,529 19,904 54,851 2,315 152,599Noncontrolling interest . . . . . . . . . . . . . . . . — (25,431) (34,758) — (60,189)Bargain purchase gain . . . . . . . . . . . . . . . . . — — — (980) (980)
Purchase consideration, net . . . . . . . . . . . $ 122,968 $ 59,338 $139,455 $ 28,505 $350,266
Transaction costs in 2018 (approx.) . . . . . . 2,841 1,235 3,952 865 8,893
Reportable segment(s) . . . . . . . . . . . . . . . .International
US andCanada
US andCanada
US andCanada
The results of operations of the aforementioned acquired shops were consolidated by the Company from thedate of acquisition and include $153.2 million of total revenue and $10.0 million of net income attributable to theCompany for fiscal year 2018. The amounts do not reflect adjustments for franchise royalties and relatedexpenses that the Company could have generated as revenue and expenses from the acquired franchisees duringthe fiscal year had the transaction not been completed.
F-28

Supplemental unaudited pro forma information
The following unaudited pro forma information presents estimated combined results of the Company as ifthe 2020 acquisitions had occurred on December 31, 2018, the 2019 acquisitions had occurred on January 1,2018 and the 2018 acquisitions had occurred on January 2, 2017:
Fiscal Years Ended
January 3, 2021 December 29, 2019 December 30, 2018
Revenue . . . . . . . . . . . . . . . . . . . . . . $1,151,041 $1,083,747 $975,717Loss before income taxes . . . . . . . . . $ (48,788) $ (5,989) $ (5,214)
The amounts in the supplemental pro forma earnings for the fiscal years presented above reflect adjustmentsfor transaction costs, franchise royalties and related expenses, and amortization that would have been chargedassuming the same fair value adjustments to acquired intangibles. The acquisitions of “Other Krispy KremeShops” are not material to the Company’s financial statements, and therefore, the supplemental pro formafinancial information related to these acquisitions is not included herein. These supplemental pro forma resultsare unaudited and are not necessarily indicative of results of operations that would have occurred had theacquisitions actually closed in the prior period. The pro forma results are also not indicative of results ofoperations for any future period.
Note 3—Accounts Receivable, net
The components of Accounts receivable, net are as follows:
January 3, 2021 December 29, 2019
Trade receivables, net . . . . . . . . . . . . . . . . . . . $39,624 $34,202Other receivables, net . . . . . . . . . . . . . . . . . . . 26,887 6,250Receivables from related parties, net . . . . . . . . 7,840 7,901
Total Accounts receivable, net . . . . . . . $74,351 $48,353
As of January 3, 2021, Other receivables, net includes accrued income taxes receivable of $15.9 million,value-added tax receivables of $5.0 million and miscellaneous receivables of $6.0 million. As of December 29,2019, Other receivables, net includes accrued income taxed receivable of $0.9 million, value-added taxreceivables of $2.4 million and miscellaneous receivables of $3.0 million.
Receivables from related parties, net includes the following (refer to Note 15, Related Party Transactions, tothe Consolidated Financial Statements for further information):
January 3, 2021 December 29, 2019
Income tax receivable from related party . . . . $7,424 $7,424Receivables from equity method investee . . . . 416 477
Receivables from related parties, net . . $7,840 $7,901
Note 4—Inventories
The components of Inventories are as follows:
January 3, 2021 December 29, 2019
Raw materials . . . . . . . . . . . . . . . . . . . . . . . . . $16,263 $14,173Work in progress . . . . . . . . . . . . . . . . . . . . . . . 871 82Finished goods and purchased merchandise . . 21,385 8,308
Total Inventories . . . . . . . . . . . . . . . . . . $38,519 $22,563
F-29

Note 5—Property and Equipment, net
Property and equipment, net consist of the following:
January 3, 2021 December 29, 2019
Land . . . . . . . . . . . . . . . . . . . . . . . . . . . . . . . . . $ 13,187 $ 13,005Buildings . . . . . . . . . . . . . . . . . . . . . . . . . . . . . 141,853 108,216Leasehold improvements . . . . . . . . . . . . . . . . . 158,145 111,456Machinery and equipment . . . . . . . . . . . . . . . . 217,566 150,646Computer software . . . . . . . . . . . . . . . . . . . . . 34,580 21,290Construction and projects in progress . . . . . . . 43,769 45,819
Property and equipment, gross . . . . . . . . 609,100 450,432Less: accumulated depreciation . . . . . . . . . . . . (213,845) (126,851)
Total Property and equipment, net . . . $ 395,255 $ 323,581
Computer software includes $4.2 million and $0.6 million of costs to develop, code, test and licensesoftware under hosting arrangements as of January 3, 2021 and December 29, 2019, respectively. Software underhosting arrangements consists primarily of solutions that empower the Company’s customer-facing website andmobile application. Depreciation expense was $51.5 million, $40.0 million and $32.1 million in the fiscal yearsended January 3, 2021, December 29, 2019 and December 30, 2018, respectively.
Note 6—Goodwill and Other Intangible Assets
6A—Goodwill
Changes in the carrying amount of goodwill by reportable segment are as follows:
US & Canada InternationalMarket
Development Total
Balance as of December 30, 2018 . . . . . . $484,550 $225,122 $270,671 $ 980,343Acquisitions . . . . . . . . . . . . . . . . . . . . 86,656 47,720 (71,347) 63,029Measurement period adjustments
related to 2018 acquisitions . . . . . . 1,580 — — 1,580Foreign currency impact . . . . . . . . . . — 4,723 — 4,723
Balance as of December 29, 2019 . . . . . . 572,786 277,565 199,324 1,049,675Acquisitions . . . . . . . . . . . . . . . . . . . . 68,683 — (46,354) 22,329Measurement period adjustments
related to 2019 . . . . . . . . . . . . . . . .acquisitions . . . . . . . . . . . . . . . . . . . . . 1,235 1,190 — 2,425Foreign currency impact . . . . . . . . . . — 12,117 — 12,117
Balance as of January 3, 2021 . . . . . . . . . $642,704 $290,872 $152,970 $1,086,546
Acquisitions of franchises result in a reclassification of goodwill between segments.
F-30

6B—Other intangible assets
Other intangible assets consist of the following:
January 3, 2021 December 29, 2019
GrossCarryingAmount
AccumulatedAmortization
NetAmount
GrossCarryingAmount
AccumulatedAmortization
NetAmount
Intangible assets with indefinitelives
Trade name . . . . . . . . . . . . . . . . . . $ 657,900 $ — $657,900 $ 657,900 $ — $657,900Intangible assets with definite
livesFranchise agreements . . . . . . . . . . 36,254 (7,519) 28,735 49,582 (7,853) 41,729Customer relationships . . . . . . . . . 15,000 (3,819) 11,181 15,000 (2,954) 12,046Reacquired franchise rights . . . . . 358,095 (59,432) 298,663 305,563 (36,127) 269,436Non-competition and non-
solicitation agreements . . . . . . . — — — 100 (61) 39Website development costs . . . . . 6,500 (4,965) 1,535 6,500 (2,784) 3,716
Total intangible assets withdefinite lives . . . . . . . . . . . . . . . 415,849 (75,735) 340,114 376,745 (49,779) 326,966
Total intangible assets . . . . . . . . $1,073,749 $(75,735) $998,014 $1,034,645 $(49,779) $984,866
Amortization expense related to intangible assets included in Depreciation and amortization expense was$26.3 million, $21.3 million and $17.4 million for the fiscal years ended January 3, 2021, December 29, 2019and December 30, 2018, respectively.
Estimated future amortization expense as of January 3, 2021 is as follows:
Fiscal yearEstimated
amortization expense
2021 . . . . . . . . . . . . . . . . . . . . . . . . . . . . . . . . . . . . . $ 28,2462022 . . . . . . . . . . . . . . . . . . . . . . . . . . . . . . . . . . . . . 26,7112023 . . . . . . . . . . . . . . . . . . . . . . . . . . . . . . . . . . . . . 26,7112024 . . . . . . . . . . . . . . . . . . . . . . . . . . . . . . . . . . . . . 26,8642025 . . . . . . . . . . . . . . . . . . . . . . . . . . . . . . . . . . . . . 26,711Thereafter . . . . . . . . . . . . . . . . . . . . . . . . . . . . . . . . 204,871
Total . . . . . . . . . . . . . . . . . . . . . . . . . . . . . . . . $340,114
The aforementioned estimates do not reflect the impact of future foreign exchange rate changes.
F-31

Note 7—Long-Term Debt
The Company’s long-term debt obligations consists of the following:
Fiscal Years Ended
January 3, 2021 December 29, 2019
2019 Credit facility—term loan . . . . . . . . . . . . . . . . . . . . $656,250 $700,0002019 Credit facility—revolving credit facility . . . . . . . . 150,000 40,000Less: Debt issuance costs . . . . . . . . . . . . . . . . . . . . . . . . (5,419) (7,005)Financing obligations . . . . . . . . . . . . . . . . . . . . . . . . . . . 26,224 27,088
Total long-term debt . . . . . . . . . . . . . . . . . . . . . . . . . . . 827,055 760,083Less: current portion of long-term debt . . . . . . . . . . . . . . (41,245) (46,361)
Long-term debt, less current portion . . . . . . . . . . . . . . $785,810 $713,722
2016 & 2019 Secured Credit Facilities
The Company entered into a $500.0 million senior secured credit facility (collectively, the “prior facility”)that provided for a term loan with a principal amount of $350.0 million and a $150.0 million senior securedrevolving credit facility, which had the following amendments: (1) add $65.0 million in borrowings on the termloan and $15.0 million in borrowing capacity on the revolving credit facility (2) add $125.0 million inborrowings on the term loan and (3) add $50.0 million in borrowings on the term loan.
In June 2019, the Company refinanced its prior facility. This resulted in the repayment of the outstandingterm loan and revolving credit facility. The Company incurred a $1.6 million loss on extinguishment, relatedprimarily to the write-off of debt issuance costs as part of the refinancing of the prior facility, included in Interestexpense, net in the Consolidated Statements of Operations. Upon completion of this extinguishment, theCompany entered into a $1.0 billion senior secured credit facility that provided for a term loan with a principalamount of $700.0 million and a $300.0 million senior secured revolving credit facility (collectively, the “2019Facility”). The 2019 Facility is secured by a first priority lien on substantially all of the Company’s personalproperty assets, certain real properties and all of the Company’s domestic wholly-owned subsidiaries. TheCompany capitalized $10.9 million of debt issuance costs related to the 2019 Facility, $8.0 million of which isrelated to the term loan and $2.9 million related to the revolving credit facility.
After consideration of outstanding borrowings and letters of credit secured by the 2019 Facility, theCompany had $150.0 million and $260.0 million of available borrowing capacity under the revolving creditfacility as of January 3, 2021 and December 29, 2019, respectively.
The 2019 Facility provides for quarterly scheduled principal payments on the term loan and repayment of alloutstanding balances on the term loan and revolving credit facility at maturity, June 13, 2024. Further, theCompany may be required to prepay additional amounts annually upon the occurrence of a prepayment event asdefined in the 2019 Facility. Because the amounts of any such future repayments are not currently determinable,they are excluded from the long-term debt maturities schedule below.
Interest on borrowings under the 2019 Facility is payable either at the London Interbank Offered Rate(“LIBOR”) rounded up to the next 1/16% of 1% or the Alternate Base Rate (which is the greatest of the primerate, the Federal Funds rate plus 0.50%, or the one-month LIBOR rate plus 1.00%), in each case plus theApplicable Rate. The Applicable Rate for LIBOR loans ranges from 1.75% to 2.25%, and for Base Rate loansranges from 0.75% to 1.25%, in each case depending on the Company’s leverage ratio. All borrowingsoutstanding under the 2019 Facility as of January 3, 2021 and December 29, 2019 were LIBOR loans. TheApplicable Rate was 2.00% and 2.00% for the fiscal years ended January 3, 2021 and December 29, 2019,respectively, and the LIBOR rate was 0.19 % and 1.75% for the fiscal years ended January 3, 2021 andDecember 29, 2019, respectively, under the 2019 Facility. As of January 3, 2021 and December 29, 2019, $505.0
F-32

million out of the $656.3 million term loan balance and $455.0 million out of the $700.0 million term loanbalance, respectively, was hedged. The effective interest rate on the term loan was approximately 3.67% and4.11% for the fiscal years ended January 3, 2021 and December 29, 2019, respectively. Refer to Note 10,Derivative Instruments, to the Consolidated Financial Statements for further discussion of the interest rate swaparrangements.
The 2019 Facility allows the Company to obtain letters of credit without applying those amounts against theusage of the senior secured revolving credit facility. The Company is required to pay a fee equal to theApplicable Rate for LIBOR-based loans on the outstanding amount of letters of credit plus a fronting fee to theissuing bank. Commitment fees on the unused portion of the senior secured revolving credit facility range from0.25% to 0.375%, based on the Company’s leverage ratio. At January 3, 2021, December 29, 2019 andDecember 30, 2018, the fee on the unused portion of the senior secured revolving credit facility was 0.25%,0.25% and 0.38%, respectively, included in Interest expense in the Consolidated Statements of Operations.
Restrictions and Covenants
The 2019 Facility requires the Company to meet a maximum leverage ratio financial test. The leverage ratiois required to be not greater than 6.00 to 1.00 initially, reducing in steps throughout the term of the 2019 Facilityultimately to 5.00 to 1.00. The leverage ratio under the 2019 Facility was required to be below 5.50 to 1.00 and6.00 to 1.00 as of January 3, 2021 and December 29, 2019, respectively and is calculated using Net Debt andAdjusted EBITDA as defined in the 2019 Facility.
The 2019 Facility also contains covenants which, among other things, generally limit (with certainexceptions): mergers, amalgamations or consolidations; the incurrence of additional indebtedness (includingguarantees); the incurrence of additional liens; the sale, assignment, lease, conveyance or transfer of assets;certain investments; dividends and stock redemptions or repurchases in excess of certain amounts; transactionswith affiliates; engaging in materially different lines of business; and other activities customarily restricted insuch agreements. The 2019 Facility also prohibits the transfer of cash or other assets to the parent company,whether by dividend, loan or otherwise, but provides for exceptions to enable the parent company to pay taxes,directors’ fees and operating expenses, as well as exceptions to permit dividends in respect of the Company’scommon stock and stock redemptions and repurchases, to the extent permitted by the 2019 Facility. Substantiallyall of the net assets of the Company’s consolidated subsidiaries were restricted as of January 29, 2021. As ofJanuary 3, 2021 and December 29, 2019, the Company was in compliance with the financial and other covenantsrelated to the 2019 Facility.
The 2019 Facility also contains customary events of default including, but not limited to, payment defaults,breaches of representations and warranties, covenant defaults, non-loan party indebtedness in excess of $35.0million, certain events of bankruptcy and insolvency, judgment defaults in excess of $35.0 million and theoccurrence of a change of control.
Borrowings and issuances of letters of credit under the 2019 Facility are subject to the satisfaction of usualand customary conditions, including the accuracy of representations and warranties and the absence of defaults.
The aggregate maturities of the 2019 Facility for each of the following five years by fiscal year are asfollows:
Fiscal year Principal Amount
2021 . . . . . . . . . . . . . . . . . . . . . . . . . . . . . . . . . . . . . . . $ 35,0002022 . . . . . . . . . . . . . . . . . . . . . . . . . . . . . . . . . . . . . . . 35,0002023 . . . . . . . . . . . . . . . . . . . . . . . . . . . . . . . . . . . . . . . 35,0002024 . . . . . . . . . . . . . . . . . . . . . . . . . . . . . . . . . . . . . . . 701,2502025 . . . . . . . . . . . . . . . . . . . . . . . . . . . . . . . . . . . . . . . —
F-33

Cash Payments of Interest
Interest paid, inclusive of debt issuance costs, totaled $33.5 million, $40.1 million and $29.9 million in thefiscal years ended January 3, 2021, December 29, 2019 and December 30, 2018, respectively.
Financing Obligations
The Company has long-term financing obligations primarily in the form of lease obligations (related to bothCompany-operated and franchised restaurants). Refer to Note 8, Leases, to the Consolidated Financial Statementsfor additional discussion of the financing obligations.
Note 8—Leases
The Company has various lease agreements related to real estate, vehicles and equipment. Its operatingleases include real estate (buildings and ground), vehicles and equipment. Operating lease right-of-use assets andoperating lease liabilities are recognized based on the present value of the future lease payments over the term.The operating lease right-of-use asset also includes accrued lease expense resulting from the straight-lineaccounting under prior accounting methods, which is now being amortized over the remaining life of the lease.
The Company is the lessee on a number of ground leases and multiple building leases, which were classifiedas operating leases under ASC 840. As the Company elected the package of practical expedients, the Companywas not required to reassess the classification of these existing leases and as such, these leases continue to beaccounted for as operating leases. In the event the Company modifies the existing leases, or enters into newground or building leases in the future, such leases may be classified as finance leases.
The Company’s finance leases relate primarily to vehicles and equipment. The lease payments are largelyfixed in nature. The Company is generally obligated for the cost of property taxes, insurance and common areamaintenance relating to its leases, which are variable in nature. The Company determines the variable paymentsbased on invoiced amounts from Lessors. The Company has elected to not apply the recognition requirements toleases of twelve months or less. These leases will be expensed on a straight-line basis, and no operating leaseliability will be recorded. In March 2018, the Company entered into a sale-leaseback transaction whereby theCompany disposed of fixed assets with a net book value of $38.6 million and received proceeds of $77.4 million,net of expenses. In October 2018, the Company entered into another sale-leaseback transaction whereby theCompany disposed of fixed assets with a net book value of $1.4 million and received proceeds of $2.0 million,net of expenses. The gains on sale were previously deferred and were being recognized ratably over the term of20 years for each leaseback under ASC 840. The gains on sale were recognized in the Consolidated Statements ofChanges in Shareholders’ Equity upon the adoption of ASC 842.
The Company included the following amounts related to operating and finance assets and liabilities withinthe Consolidated Balance Sheets:
As of
January 3, 2021 December 29, 2019
Assets ClassificationOperating lease . . . . . . . . . . . . . Operating lease right of use asset, net $399,688 $385,153Finance lease . . . . . . . . . . . . . . . Property and equipment, net 23,556 22,166
Total leased assets . . . . . . . . . . $423,244 $407,319
LiabilitiesCurrentOperating lease . . . . . . . . . . . . . Current operating lease liabilities $ 45,675 $ 46,943Finance lease . . . . . . . . . . . . . . . Current portion of long-term debt 6,245 2,611NoncurrentOperating lease . . . . . . . . . . . . . Noncurrent operating lease liabilities 376,099 354,876Finance lease . . . . . . . . . . . . . . . Long-term debt, less current portion 19,979 24,477
Total leased liabilities . . . . . . . $447,998 $428,907
F-34

The Company has long-term contractual obligations primarily in the form of lease obligations related toCompany-operated restaurants and franchised restaurants. Interest expense associated with the finance leaseobligations is computed using the incremental borrowing rate at the time the lease is entered into and is based onthe amount of the outstanding lease obligation.
The weighted-average remaining lease term and weighted-average discount rate for operating and financeleases were as follows:
As of
January 3, 2021 December 29, 2019
Weighted average remaining lease term (inyears)
Operating lease . . . . . . . . . . . . . . . . . . . . . . . . 11.1 14.3Finance lease . . . . . . . . . . . . . . . . . . . . . . . . . . 12.0 15.6Weighted average discount rateOperating lease . . . . . . . . . . . . . . . . . . . . . . . . 6.94% 7.20%Finance lease . . . . . . . . . . . . . . . . . . . . . . . . . . 7.13% 7.30%
Lease costs were as follows:
For Fiscal Years Ended
January 3, 2021 December 29, 2019
Lease cost ClassificationOperating lease cost . . . . . . . . . Selling, general and administrative expense $ 3,127 $ 2,816Operating lease cost . . . . . . . . . Operating expenses 70,855 45,732Short-term lease cost . . . . . . . . . Operating expenses 2,867 1,850Variable lease costs . . . . . . . . . . Operating expenses 9,195 13,161Sublease income . . . . . . . . . . . . Royalties and other revenues (506) (480)Finance lease cost:Amortization of right-of-use
assets . . . . . . . . . . . . . . . . . . . Depreciation and amortization expense 2,587 2,469Interest on lease liabilities . . . . . Interest expense, net $ 2,040 $ 1,915
Supplemental disclosures of cash flow information related to leases were as follows:
For Fiscal Years Ended
January 3, 2021 December 29, 2019
Other informationCash paid for amounts included in the measurement of lease
liabilities:Operating cash flows from operating leases . . . . . . . . . . . . . . . . . . $78,465 $ 59,227Operating cash flows from finance leases . . . . . . . . . . . . . . . . . . . . 1,781 1,914Financing cash flows from finance leases . . . . . . . . . . . . . . . . . . . . 3,694 1,290Right-of-use assets obtained in exchange for new lease liabilities:Operating leases . . . . . . . . . . . . . . . . . . . . . . . . . . . . . . . . . . . . . . . . 74,979 135,163Finance leases . . . . . . . . . . . . . . . . . . . . . . . . . . . . . . . . . . . . . . . . . $ 7,500 $ 5,062
A majority of the leases include options to extend the lease. If the Company is reasonably certain to exercisean option to extend a lease, the extension period is included as part of the right-of-use asset and the lease liability.Some of the leases include an option to early terminate the lease. Leases with an early termination optiongenerally involve a termination payment. For the twelve months ending January 3, 2021 and December 29, 2019,the Company recorded lease termination costs of $4.4 million and $2.6 million, respectively. Correspondingly,
F-35

the right-of-use assets were reduced by $4.4 million and $2.6 million, respectively. For the twelve months endingDecember 30, 2018, lease termination costs represent the estimated fair value of liabilities related to unexpiredleases, after reduction by the amount of accrued rent expense, if any, related to the leases, and are recorded whenthe lease contracts are terminated or, if earlier, the date on which the Company cease use of the leased property.The fair values of these liabilities were estimated as the excess, if any, of the contractual payments requiredunder the unexpired leases over the current market lease rates for the properties, discounted at a credit-adjustedrisk-free rate over the remaining term of the leases. The provision for termination costs were $0.4 million for thetwelve months ending December 30, 2018. Correspondingly, the lease termination costs were $0.4 million forfiscal year 2018.
The Company’s leases do not contain restrictions or covenants that restrict the Company from incurringother financial obligations. The Company also does not provide any residual value guarantees for the leases orhave any significant leases that have yet to be commenced.
At the inception of the contract, management determines if the contract is or contains a lease. A contract isor contains a lease if it conveys the right to control the use of an identified asset for a period of time in exchangefor consideration. The incremental borrowing rate (“IBR”) reflects a fully secured rate based on the credit ratingtaking into consideration the repayment timing of the lease and any impacts due to the economic environment inwhich the lease operates. The estimate of the incremental borrowing rate reflects considerations such as marketrates for the outstanding debt, interpolations of rates for leases with terms that differ from the outstanding debt,and market rates for debt of companies with similar credit ratings.
Future lease commitments to be paid by the Company as of January 3, 2021 were as follows:
Fiscal year Operating Leases Finance Leases
2021 . . . . . . . . . . . . . . . . . . . . . . . . . . . . . . . . . . $ 73,109 $ 4,1462022 . . . . . . . . . . . . . . . . . . . . . . . . . . . . . . . . . . 66,429 3,3672023 . . . . . . . . . . . . . . . . . . . . . . . . . . . . . . . . . . 55,984 2,7782024 . . . . . . . . . . . . . . . . . . . . . . . . . . . . . . . . . . 53,198 2,5082025 . . . . . . . . . . . . . . . . . . . . . . . . . . . . . . . . . . 48,040 2,479Thereafter . . . . . . . . . . . . . . . . . . . . . . . . . . . . . . 348,283 28,467
Total lease payments . . . . . . . . . . . . . . . . . . . . . 645,043 43,745Less: interest . . . . . . . . . . . . . . . . . . . . . . . . . . . . (223,269) (17,521)
Present value of lease liabilities . . . . . . . . . . . . $ 421,774 $ 26,224
Rent expense, net of rental income, totaled $42.6 million for the fiscal year ended December 30, 2018 underASC 840. Such rent expense includes rents under non-cancelable operating leases as well as sundry short-termrentals.
F-36

Note 9—Fair Value Measurements
The following table presents assets and liabilities that are measured at fair value on a recurring basis as ofJanuary 3, 2021 and December 29, 2019:
January 3, 2021
Level 1 Level 2 Level 3
Assets:401(k) mirror plan assets . . . . . . . . . . . . . . . . . . . . . . . . . . . . . $237 $ — $—Foreign currency derivative . . . . . . . . . . . . . . . . . . . . . . . . . . . — 131 —Commodity derivatives . . . . . . . . . . . . . . . . . . . . . . . . . . . . . . — 420 —
$237 $ 551 $—
Liabilities:Interest rate derivative . . . . . . . . . . . . . . . . . . . . . . . . . . . . . . . — 32,813 —
$— $32,813 $—
December 29, 2019
Level 1 Level 2 Level 3
Assets:401(k) mirror plan assets . . . . . . . . . . . . . . . . . . . . . . . . . . . . . $319 $ — $—Foreign currency derivative . . . . . . . . . . . . . . . . . . . . . . . . . . . — 152 —Commodity derivatives . . . . . . . . . . . . . . . . . . . . . . . . . . . . . . — 153 —
$319 $ 305 $—
Liabilities:Interest rate derivative . . . . . . . . . . . . . . . . . . . . . . . . . . . . . . . — 13,573 —
$— $13,573 $—
There were no transfers of financial assets or liabilities among the levels within the fair value hierarchyduring the fiscal years ended January 3, 2021 and December 29, 2019. The Company’s derivatives are valuedusing discounted cash flow analyses that incorporate observable market parameters, such as interest rate yieldcurves and currency rates.
Note 10—Derivative Instruments
The Company is exposed to certain risks relating to its ongoing business operations. Management evaluatesvarious strategies in managing its exposure to market-based risks, such as entering into transactions to manage itsexposure to commodity price risk and floating interest rates. The Company does not hold or issue derivativeinstruments for trading purposes. The Company is exposed to credit-related losses in the event of non-performance by the counterparties to its derivative instruments. The Company mitigates this risk ofnonperformance by dealing with highly rated counterparties.
Commodity Price Risk
The Company is exposed to the effects of commodity price fluctuations in the cost of ingredients of itsproducts, of which flour, sugar and shortening are the most significant. In order to bring greater stability to thecost of ingredients, from time to time the Company may forward contract for supply, purchases exchange-tradedcommodity futures contracts and options on such contracts, for raw materials which are ingredients of itsproducts or which are components of such ingredients, including wheat and soybean oil. The Company is alsoexposed to the effects of commodity price fluctuations in the cost of gasoline used by its delivery vehicles. To
F-37

mitigate the risk of fluctuations in the price of its gasoline purchases, the Company may purchase swaps,exchange-traded commodity futures contracts and options on such contracts. The difference between the cost, ifany, and the fair value of commodity derivatives is reflected in earnings because the Company has not designatedany of these instruments as hedges. Gains and losses on these contracts are intended to offset losses and gains onthe hedged transactions in an effort to reduce the earnings volatility resulting from fluctuating commodity prices.The settlement of commodity derivative contracts is reported in the Consolidated Statements of Cash Flows as acash flow from operating activities. As of January 3, 2021 and December 29, 2019 the total notional amount ofcommodity derivatives was 3.0 million and 0.8 million gallons of gasoline, respectively. They were scheduled tomature between January 1, 2021 and December 1, 2022 and December 31, 2019 and December 31, 2020,respectively. As of January 3, 2021 and December 29, 2019, the Company has recorded an asset of $0.4 and $0.2million, respectively, related to the fair market values of its commodity derivatives.
Interest Rate Risk
The Company is exposed to market risk from increases in interest rates on any borrowings outstandingunder its Debt Facility. In November 2016, the Company entered into various interest rate swap agreements(“original interest rate swap”) with a notional amount totaling $300.0 million that would have matured in July2021. Under the original interest rate swap agreements, the Company made payments based on a fixed rate of1.18% and in exchange received payments at a variable rate based on the one-month LIBOR. In April 2018, theCompany novated these interest swap agreements and realized a gain of $10.2 million, of which $7.0 million hadbeen unrealized as of December 31, 2017. Prior to the novation, none of the outstanding interest rate swaps hadbeen designated as hedges. The Company recorded gains of $3.2 million and $1.7 million during the fiscal yearsended December 30, 2018 and December 31, 2017, respectively, which were included as a component of interestexpense.
In May 2018, following the novation of its original interest rate swap, the Company entered into a newinterest rate swap (“May 2018 swap agreement”). The May 2018 interest rate swap agreements had a notionalamount of $300.0 million and were to mature in July 2021. Under the novated swap agreements, the Companyhad fixed the variable portion of the interest rate on a portion of the Debt Facility and was required to makepayments based on a fixed rate of 2.70% and in exchange would receive payments at a variable rate based on theone-month LIBOR. In November 2018, the Company entered into a new interest swap agreement with anaggregate notional amount of $155.0 million (“November 2018 swap agreements”). Under the November 2018swap agreements, the Company made payments based on a fixed rate of 2.92% and in exchange receivedpayments at a variable rate based on the one-month LIBOR. The November 2018 swap agreements were tomature in November 2023, corresponding with an expected extension of the Debt Facility.
In June 2019, following its debt modification (modification to the “2019 Debt Facility”), the Companyeffectively cancelled its swap agreements on $300.0 million of the $455.0 million hedged notional and enteredinto new agreements with the same counterparties (the “June 2019 swap agreement”). The only differencesbetween these new agreements and the prior versions included an extension of the maturity term of the swapsfrom 2023 to 2024, and the locking in of a new payment rate on the fixed leg of the swaps (1.99%), through the2024 maturity.
In February 2020, the Company effectively cancelled its swap agreements on the other $155.0 millionhedged notional and entered into new agreements with the same counterparties (the “February 2020 swapagreement”). The only differences between these new agreements and the prior versions included an extension ofthe maturity term of the swaps from 2023 to 2024, and the locking in of a new payment rate on the fixed leg ofthe swaps (2.72%), through the 2024 maturity. At the same time, the Company also entered into a new interestrate swap agreement with a notional amount of $50.0 million and a maturity date in June 2024. Under this swapagreement, the Company had fixed the variable portion of the interest rate on a portion of the Debt Facility andwas required to make payments based on a fixed rate of 0.95% and in exchange would receive payments at avariable rate based on the one-month LIBOR
F-38

The net effect of the interest rate swap arrangements will be to fix the interest rate on the term loan underthe 2019 Debt Facility up to the notional amount outstanding at the rates payable under the swap agreements plusthe Applicable Rate (as defined by the 2019 Debt Facility). Management has designated the 2018, the June 2019and the February 2020 swap agreements as cash flow hedges and recognized the changes in the fair value ofthese swaps in other comprehensive income. As of January 3, 2021 and December 29, 2019, the Company hasrecorded liabilities of $32.8 million and $13.6 million, respectively, related to the fair market values of itsinterest rate derivatives. The cash flows associated with the interest rate swaps are reflected in the operatingactivities in the Consolidated Statements of Cash Flows, which is consistent with the classification as operatingactivities of the interest payments on the term loan.
All of the interest rate swap derivatives have certain early termination triggers caused by an event of defaultor termination. The events of default include failure to make payments when due, failure to give notice of atermination event, failure to comply with or perform obligations under the agreements, bankruptcy or insolvencyand defaults under other agreements (cross-default provisions).
Foreign Currency Exchange Rate Risk
The Company is exposed to foreign currency risk primarily from its investments in consolidated subsidiariesthat operate in the United Kingdom, Ireland, Australia, New Zealand, Mexico and Japan. In order to mitigateforeign exchange fluctuations, the Company enters into foreign exchange forward contracts. Management has notdesignated these forward contracts as hedges. As of January 3, 2021 and December 29, 2019, the total notionalamount of foreign exchange derivatives was $26.7 million and $13.0 million, respectively. They were scheduledto mature in January 2021 and January 2020, respectively. As of January 3, 2021 and December 29, 2019, theCompany has recorded an asset of $0.1 million and $0.2 million, respectively, related to the fair market values ofits foreign exchange derivatives.
Quantitative Summary of Derivative Positions and Their Effect on Results of Operations
The following tables present the fair values of derivative instruments included in the Consolidated BalanceSheets as of January 3, 2021 and December 29, 2019, for derivatives not designated as hedging instruments andderivatives designed as hedging instruments, respectively. The Company only has cash flow hedges that aredesignated as hedging instruments.
Derivatives Fair Value
Derivatives Not Designated as HedgingInstruments
January 3,2021
December 29,2019 Balance Sheet Location
Foreign currency derivatives . . . . . $ 131 $ 152 Prepaid expense and other current assetsCommodity derivatives . . . . . . . . . 420 153 Prepaid expense and other current assets
$ 551 $ 305
Derivatives Fair Value
Derivatives Designated as HedgingInstruments
January 3,2021
December 29,2019 Balance Sheet Location
Interest rate derivatives . . . . . . . . . $10,235 $ 678 Accrued liabilitiesInterest rate derivatives . . . . . . . . . 22,578 12,895 Other long-term obligations and deferred credits
$32,813 $13,573
F-39

The effect of derivative instruments on the Consolidated Statements of Operations for the fiscal years endedJanuary 3, 2021, December 29, 2019 and December 30, 2018:
Amount of Derivative Gain (Loss)Recognized in Income in Fiscal Years
Ended
Derivatives Designated as HedgingInstruments
January 3,2021
December 29,2019
December 30,2018
Location of Derivative Gain (Loss)Recognized in Income
Loss on interest rate derivatives . . . . $(7,633) $(1,774) $(995) Interest expense, net
$(7,633) $(1,774) $(995)
Amount of Derivative Gain (Loss)Recognized in Income in Fiscal Years
Ended
Derivatives Not Designated as HedgingInstruments
January 3,2021
December 29,2019
December 30,2018
Location of Derivative Gain (Loss)Recognized in Income
Gain on interest rate derivatives . . . . $— $ — $ 3,250 Interest expense, netLoss on foreign currency . . . . . . . . . (21) (248) (1,727) Other non-operating expense/
(income), netGain on commodity derivatives . . . . 267 153 — Other non-operating expense/
(income), net
$246 $ (95) $ 1,523
Note 11—Employee Benefit Plans
Defined contribution plans
The Company has a 401(k) savings plan (the “401(k) Plan”) to which eligible employees may contribute upto 100% of their salary and bonus on a tax deferred basis, subject to statutory limitations. The Company currentlymatches 100% of the first 3% and 50% of the next 2% of compensation contributed by each employee to the401(k) Plan.
The Company operates defined contribution plans in the UK and Republic of Ireland (“KKUK and IrelandContribution Plans”), to which eligible employees may contribute up to 100% of their salary, subject to statutorylimitations. The Company currently matches contributions at a rate of 3% of pensionable earnings. The KKUKand Ireland Contribution Plans are pension plans under which the Company pays fixed contributions into aseparate entity. The Company has no legal or constructive obligations to pay further contributions if the funddoes not hold sufficient assets to pay all employees the benefits relating to employee service in the current andprior periods. The Company has no further payment obligations once the contributions have been paid. Thecontributions are recognized as employee benefit expense when they are due. Prepaid contributions arerecognized as an asset to the extent that a cash refund or a reduction in the future payments is available.
The Company’s Insomnia Cookies subsidiary sponsors a 401(k) plan (the “Insomnia Cookies ContributionPlan”) which allows all its eligible employees to elect to defer up to 100% of their annual compensation not toexceed statutory limits. The Insomnia Cookies Contribution Plan provides for discretionary matchingcontributions, which may not exceed 2% of the employee’s overall compensation.
KK Australia operates a defined contribution retirement benefit plan for its employees in Australia (the“Australia Plan”) and in New Zealand (the “New Zealand Plan”). The Company contributes 9.5% of employeecompensation to the Australia Plan and matches employee contributions of up to 3% of compensation to the NewZealand Plan.
Total contribution plan expense for defined contribution plans is $4.9 million, $4.6 million and $3.5 millionfor the fiscal years ended January 3, 2021, December 29, 2019 and December 30, 2018, respectively.
F-40

Other employee benefit plans
The Company has a Nonqualified Deferred Compensation Plan (the “401(k) Mirror Plan”) designed toenable officers of the Company whose contributions to the 401(k) Plan are limited by certain statutory limitationsto have the same opportunity to defer compensation as is available to other employees of the Company under thequalified 401(k) savings plan. The investments are not a legally separate fund of assets and are subject to theclaims of the Company’s general creditors. Such investments are included in Other assets in the ConsolidatedBalance Sheets. The corresponding liability to participants is included in Other long-term obligations anddeferred credits in the Consolidated Balance Sheets. The balance in the asset and corresponding liability accountwas $0.2 million and $0.3 million as of January 3, 2021 and December 29, 2019, respectively.
KK Mexico operates defined benefit plans for its employees related to seniority premium (the “MexicoSeniority Premium Plan”) and termination indemnity (the “Mexico Termination Indemnity Plan”). The MexicoSeniority Premium Plan provides eligible employees a defined benefit of 12 days of salary per full year ofservice, and the Mexico Termination Indemnity Plan provides eligible employees a defined benefit of up to threemonths of base salary. Net periodic benefit cost for these plans totalled less than $0.1 million for the fiscal yearsended January 3, 2021 and December 29, 2019, respectively.
Note 12—Share-based Compensation
The Company and certain of its subsidiaries issue time-vested restricted stock units (“RSUs”) under theirrespective executive ownership plans and long-term incentive plans. The time-vested RSUs are awarded toeligible employees and non-employee directors and entitle the grantee to receive shares of common stock at theend of a vesting period. The RSUs vest in 54 months from the date of grant and include a minimum holdingperiod of six months before the shareholder may redeem the shares. Throughout the vesting period and theholding period, shareholders are subject to the market risk on the value of their shares.
The U.S. employees and directors are granted RSUs held by KKHI. The U.K. employees receive RSUs heldby KKUK. The Insomnia Cookies employees receive RSUs held by Insomnia. The Australia employees receiveRSUs held by KK Australia. The Mexico employees receive RSUs held by KK Mexico.
F-41
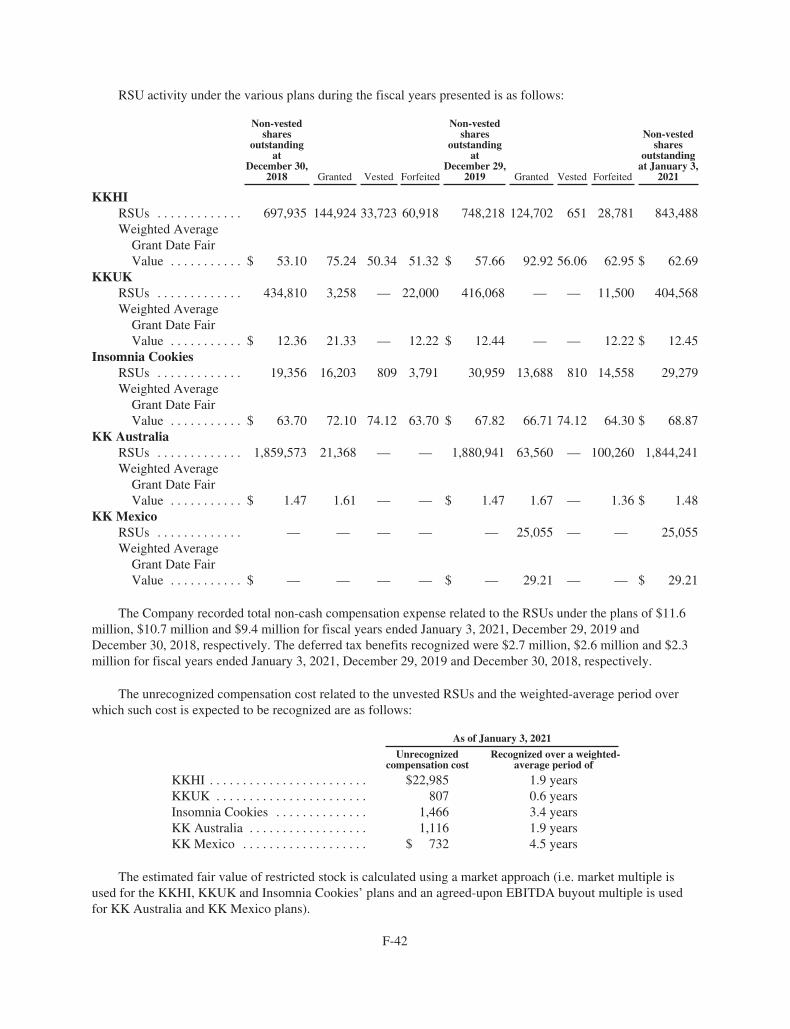
RSU activity under the various plans during the fiscal years presented is as follows:
Non-vestedshares
outstandingat
December 30,2018 Granted Vested Forfeited
Non-vestedshares
outstandingat
December 29,2019 Granted Vested Forfeited
Non-vestedshares
outstandingat January 3,
2021
KKHIRSUs . . . . . . . . . . . . . 697,935 144,924 33,723 60,918 748,218 124,702 651 28,781 843,488Weighted Average
Grant Date FairValue . . . . . . . . . . . $ 53.10 75.24 50.34 51.32 $ 57.66 92.92 56.06 62.95 $ 62.69
KKUKRSUs . . . . . . . . . . . . . 434,810 3,258 — 22,000 416,068 — — 11,500 404,568Weighted Average
Grant Date FairValue . . . . . . . . . . . $ 12.36 21.33 — 12.22 $ 12.44 — — 12.22 $ 12.45
Insomnia CookiesRSUs . . . . . . . . . . . . . 19,356 16,203 809 3,791 30,959 13,688 810 14,558 29,279Weighted Average
Grant Date FairValue . . . . . . . . . . . $ 63.70 72.10 74.12 63.70 $ 67.82 66.71 74.12 64.30 $ 68.87
KK AustraliaRSUs . . . . . . . . . . . . . 1,859,573 21,368 — — 1,880,941 63,560 — 100,260 1,844,241Weighted Average
Grant Date FairValue . . . . . . . . . . . $ 1.47 1.61 — — $ 1.47 1.67 — 1.36 $ 1.48
KK MexicoRSUs . . . . . . . . . . . . . — — — — — 25,055 — — 25,055Weighted Average
Grant Date FairValue . . . . . . . . . . . $ — — — — $ — 29.21 — — $ 29.21
The Company recorded total non-cash compensation expense related to the RSUs under the plans of $11.6million, $10.7 million and $9.4 million for fiscal years ended January 3, 2021, December 29, 2019 andDecember 30, 2018, respectively. The deferred tax benefits recognized were $2.7 million, $2.6 million and $2.3million for fiscal years ended January 3, 2021, December 29, 2019 and December 30, 2018, respectively.
The unrecognized compensation cost related to the unvested RSUs and the weighted-average period overwhich such cost is expected to be recognized are as follows:
As of January 3, 2021
Unrecognizedcompensation cost
Recognized over a weighted-average period of
KKHI . . . . . . . . . . . . . . . . . . . . . . . . $22,985 1.9 yearsKKUK . . . . . . . . . . . . . . . . . . . . . . . 807 0.6 yearsInsomnia Cookies . . . . . . . . . . . . . . 1,466 3.4 yearsKK Australia . . . . . . . . . . . . . . . . . . 1,116 1.9 yearsKK Mexico . . . . . . . . . . . . . . . . . . . $ 732 4.5 years
The estimated fair value of restricted stock is calculated using a market approach (i.e. market multiple isused for the KKHI, KKUK and Insomnia Cookies’ plans and an agreed-upon EBITDA buyout multiple is usedfor KK Australia and KK Mexico plans).
F-42

The total grant date fair values of shares vested under the KKHI plan were $0.0 million, $1.7 million and$0.0 million for fiscal years ended January 3, 2021, December 29, 2019 and December 30, 2018, respectively.The total fair values of shares vested under the Insomnia Cookies’ plan were $0.1 million and $0.1 million forfiscal years ended January 3, 2021 and December 29, 2019; no shares vested in 2018. No shares under theKKUK, KK Australia and KK Mexico vested during the three fiscal years presented.
Note 13—Income Taxes
Income (loss) before income taxes consisted of:
Fiscal Years Ended
January 3, 2021 December 29, 2019 December 30, 2018
United States . . . . . . . . . . . . . $(47,080) $(34,836) $(27,067)International . . . . . . . . . . . . . (4,748) 13,412 9,310
Total . . . . . . . . . . . . . . . . . . . $(51,828) $(21,424) $(17,757)
The components of the provision for income taxes are as follows:
Fiscal Years Ended
January 3, 2021 December 29, 2019 December 30, 2018
Current:Federal . . . . . . . . . . . . . . $ — $ 2,209 $ —State . . . . . . . . . . . . . . . . 156 (396) 243International . . . . . . . . . 8,992 2,342 12,346
Total Current . . . 9,148 4,155 12,589
Deferred:Federal . . . . . . . . . . . . . . (8,844) 10,117 (11,938)State . . . . . . . . . . . . . . . . 13,472 (743) (3,143)International . . . . . . . . . (4,664) (952) (2,826)
Total Deferred . . . (36) 8,422 (17,907)
Income tax expense . . . . . . . $ 9,112 $12,577 $ (5,318)
A reconciliation of the statutory U.S. federal income tax rate and the Company’s effective tax rate is asfollows:
Fiscal Years Ended
January 3,2021
December 29,2019
December 30,2018
Statutory Federal Rate . . . . . . . . . . . . . . . . . . . . . . 21.0% 21.0% 21.0%State Income Taxes, net of federal Benefit . . . . . . 4.1 0.8 7.9Foreign operations . . . . . . . . . . . . . . . . . . . . . . . . . (10.7) 6.0 (42.6)Credit for foreign income taxes . . . . . . . . . . . . . . . — 6.3 42.6Change in valuation allowance . . . . . . . . . . . . . . . (34.9) (31.0) —Noncontrolling Interest . . . . . . . . . . . . . . . . . . . . . 2.6 (3.3) (2.0)Impact of uncertain tax positions . . . . . . . . . . . . . (1.3) (55.8) (0.6)Other permanent differences . . . . . . . . . . . . . . . . . 1.3 3.0 0.5Transaction Costs . . . . . . . . . . . . . . . . . . . . . . . . . (0.8) (10.0) (2.7)Deferred Adjustments . . . . . . . . . . . . . . . . . . . . . . (0.9) (10.2) —Other . . . . . . . . . . . . . . . . . . . . . . . . . . . . . . . . . . . 2.0 14.5 5.8
Effective tax rate . . . . . . . . . . . . . . . . . . . . . . . . . (17.6)% (58.7)% 29.9%
F-43

The Company establishes valuation allowances for deferred income tax assets in accordance with GAAP,which provides that such valuation allowances shall be established unless realization of the income tax benefits ismore likely than not.
The Company recognizes deferred income tax assets and liabilities based upon its expectation of the futuretax consequences of temporary differences between the income tax and financial reporting bases of assets andliabilities. Deferred tax liabilities generally represent tax expense recognized for which payment has beendeferred, or expenses which have been deducted in the Company’s tax returns, but which have not yet beenrecognized as an expense in the financial statements. Deferred tax assets generally represent tax deductions orcredits that will be reflected in future tax returns for which the Company has already recorded a tax benefit in theConsolidated Financial Statements.
The Company continues to assert permanent reinvestment with respect to its initial basis differences ofinternational affiliates but does not assert indefinite reinvestment on the earnings of the foreign subsidiaries.Accordingly, no deferred taxes have been provided for with regard to the Company’s initial basis difference ininternational affiliates. Due to the complexities of tax law in the respective jurisdictions, it is not practical toestimate the tax liability that might be incurred if such earnings were remitted to the US. The Company has notestablished a deferred tax liability for the earnings of the foreign subsidiaries as any distributions made fromthose jurisdictions are expected to be made in a tax neutral manner.
The tax effects of temporary differences are as follows:
As of
January 3,2021
December 29,2019
Deferred income tax assetsIntangible assets . . . . . . . . . . . . . . . . . . . . . . . . . . . . . . $ 1,884 $ 2,083Accrued compensation . . . . . . . . . . . . . . . . . . . . . . . . . 3,302 2,215Insurance accruals . . . . . . . . . . . . . . . . . . . . . . . . . . . . . 2,040 2,118Share-based compensation . . . . . . . . . . . . . . . . . . . . . . 7,676 5,018Deferred revenue . . . . . . . . . . . . . . . . . . . . . . . . . . . . . . 1,903 1,273Acquisition costs . . . . . . . . . . . . . . . . . . . . . . . . . . . . . . 1,091 299Subsidiary investments . . . . . . . . . . . . . . . . . . . . . . . . . — 880Disallowed interest expense . . . . . . . . . . . . . . . . . . . . . 9,660 9,916Lease liability . . . . . . . . . . . . . . . . . . . . . . . . . . . . . . . . 91,828 82,898Foreign net operating loss carryforward . . . . . . . . . . . . 574 1,163Foreign capital loss carryforwards . . . . . . . . . . . . . . . . 23,067 15,923Federal net operating loss carryforward . . . . . . . . . . . . 22,976 —Federal tax credits . . . . . . . . . . . . . . . . . . . . . . . . . . . . . 12,320 9,205State net operating loss and credit carryforwards . . . . . 9,082 9,578Unrealized gain/loss . . . . . . . . . . . . . . . . . . . . . . . . . . . 8,203 3,889Other . . . . . . . . . . . . . . . . . . . . . . . . . . . . . . . . . . . . . . . 11,243 8,078
Gross deferred income tax assets . . . . . . . . . . . . . 206,849 154,536Valuation allowance . . . . . . . . . . . . . . . . . . . (40,502) (25,852)
Deferred income tax assets, net ofvaluation allowance . . . . . . . . . . . . . 166,347 128,684
F-44

As of
January 3,2021
December 29,2019
Deferred income tax liabilitiesIntangibles . . . . . . . . . . . . . . . . . . . . . . . . . . . . . . . . . . (150,818) (157,327)Subsidiary investments . . . . . . . . . . . . . . . . . . . . . . . . (5,359) —Property and equipment . . . . . . . . . . . . . . . . . . . . . . . . (19,104) (4,841)Foreign reacquired franchise rights . . . . . . . . . . . . . . . (44,236) (37,763)Right of use asset . . . . . . . . . . . . . . . . . . . . . . . . . . . . . (85,764) (80,101)Other . . . . . . . . . . . . . . . . . . . . . . . . . . . . . . . . . . . . . . (5,840) (1,362)
Gross deferred income tax liabilities . . . . . . . . . . (311,121) (281,394)
Net deferred income tax liabilities . . . . . . . . . . . . . . . . . . $(144,774) $(152,710)
The presentation of deferred income taxes on the Consolidated Balance Sheets is as follows:
As of
January 3,2021
December 29,2019
Included in:Other assets . . . . . . . . . . . . . . . . . . . . . . . . . . . . . . . . . $ 92 $ —Deferred income taxes, net . . . . . . . . . . . . . . . . . . . . . . (144,866) (152,710)
Net deferred income tax liabilities . . . . . . . . . . $(144,774) $(152,710)
The changes in the valuation allowance on deferred income tax assets are summarized as follows:
As of
January 3,2021
December 29,2019
Balance at beginning of year . . . . . . . . . . . . . . . . . . . . . $25,852 $ 2,533KKUK valuation allowance change . . . . . . . . . . . . . . . . (209) (12)Increase in valuation allowance on state net operating
losses . . . . . . . . . . . . . . . . . . . . . . . . . . . . . . . . . . . . . 11,786 —Foreign tax credit valuation allowance . . . . . . . . . . . . . 2,220 6,644Increase in valuation allowance on other credits . . . . . . 853 —KKMX valuation allowance . . . . . . . . . . . . . . . . . . . . . — 16,687
Balance at end of year . . . . . . . . . . . . . . . . . . . . . $40,502 $25,852
The valuation allowances of $40.5 million and $25.9 million as of January 3, 2021 and December 29, 2019respectively, represent the portion of its deferred tax assets the Company estimated would not be realized in thefuture. Of the $40.5 million as of January 3, 2021, $16.7 million is for KK Mexico losses and capital losscarryforwards that are not expected to generate taxable income sufficient to utilize the losses, and $12.0 millionis for U.S. foreign tax credits and general business credits for which sufficient taxable income is not expected tobe generated. In addition, as of January 3, 2021, after analyzing the positive and negative evidence associatedwith the Company’s state NOLs and the Company’s associated state profile, a valuation allowance of $11.8million was recorded associated with the respective U.S. state and local NOLs.
Realization of net deferred tax assets generally is dependent on generation of taxable income in futureperiods. While the Company believes its forecast of future taxable income is reasonable, actual results willinevitably vary from management’s forecasts. Such variances could result in adjustments to the valuationallowance on deferred tax assets in future periods, and such adjustments could be material to the financialstatements.
F-45

As of January 3, 2021, the Company had NOL carryforwards of approximately $243.0 million for U.S. statetax purposes and $109.4 million for U.S. federal tax purposes. As of December 29, 2019, the Company had NOLcarryforwards of approximately $214.8 million for U.S. state tax purposes and none for U.S. federal taxpurposes. U.S. federal NOL carryforwards are eligible to be carried forward indefinitely. A portion of theCompany’s U.S. state tax carryforwards will begin to expire in the current year. As provided above, as ofJanuary 3, 2021, the Company recorded a valuation allowance against the entire balance of state net operatingloss carryforwards based on management’s determination that it is more likely than not that the tax benefitsrelated to these assets will not be utilized. As of January 3, 2021 and December 29, 2019 the Company hadforeign NOL carryforwards of approximately $2.4 million and $4.5 million, respectively. As of December 29,2019, $1.3 million of NOL carryforwards have no expiration, and the remaining have a 10-year carryover. As ofDecember 29, 2019, the Company had foreign capital loss carryforwards of $53.0 million. The losscarryforwards have a 10-year carryover period.
As of January 3, 2021, the Company had various tax credit carryforwards of $12.0 million for U.S. federalpurposes and zero for U.S. state purposes. As of December 29, 2019, the Company had various tax creditcarryforwards of $9.0 million for U.S. federal purposes and zero for U.S. state purposes. If not utilized, thecredits can be carried forward between 10 and 20 years. If certain substantial changes in the entity’s ownershipoccur, there would be an annual limitation on the amount of the NOLs and credits that can be utilized.
On March 27, 2020, the Coronavirus Aid, Relief and Economic Security Act (“CARES Act”) was enactedto provide economic relief to those impacted by the COVID-19 pandemic. .The CARES Act made various taxlaw changes including among other things (i) modifications to the federal NOL carryback rules, (ii) increased thelimitation under IRC Section 163(j) for 2019 and 2020 to permit additional expensing of interest, and(iii) enacted a technical correction so that qualified improvement property can be immediately expensed underIRC Section 168(k). The Company was able to take additional deductions as a result of the CARES Act, resultingin additional NOLs for the fiscal years ended January 3, 2021 and December 29, 2019. The Company was alsoable to defer $8.3 million social security taxes to future years.
The Company files income tax returns in the U.S. federal jurisdiction and various U.S. state and foreignjurisdictions. For U.S. federal tax purposes, tax years prior to the year ended December 31, 2016 are closed forassessment purposes; however, tax years in which a NOL was generated will remain open for examination untilthe statute of limitations will close on tax years utilizing NOL carry forwards to reduce the tax due. Generally,the statute of limitations will close on tax years utilizing NOL carryforwards three years subsequent to theutilization of NOLs. For state purposes, the statute of limitations remains open in a similar manner for stateswhere the Company generated NOLs.
Income tax payments, net of refunds, were $9.3 million and $9.3 million in the fiscal years ended January 3,2021 and December 29, 2019, respectively.
The following table presents a reconciliation of the beginning and ending amounts of unrecognized taxbenefits:
As of
January 3,2021
December 29,2019
Unrecognized tax benefits at beginning of year . . . . . . . . . . $17,342 $ 2,981Increases related to positions taken in the current year . . . . 18 8Increases (decreases) related to positions taken in prior
years . . . . . . . . . . . . . . . . . . . . . . . . . . . . . . . . . . . . . . . . . (19) 14,382Lapsing of statutes of limitations . . . . . . . . . . . . . . . . . . . . . — (29)
Unrecognized tax benefits at end of year . . . . . . . . . . . . . $17,341 $17,342
F-46

Approximately all of the aggregate $17.3 million and $17.3 million of unrecognized income tax benefits asof January 3, 2021 and December 29, 2019, respectively, would, if recognized, impact the annual effective taxrate. The Company does not believe that changes in its uncertain tax benefits will result in a material impactduring the next twelve months.
The Company’s policy is to recognize interest and penalties related to income tax issues as components ofincome tax expense. The Company’s Consolidated Balance Sheets reflect approximately $1.9 million and $1.3million of accrued interest and penalties as of January 3, 2021 and December 29, 2019, respectively. Interest andpenalties were not material during the years presented in the Company’s Consolidated Statements of Operations.
Note 14—Commitments and Contingencies
Except as disclosed below, the Company currently is not a party to any material legal proceedings.
Pending Litigation
K2 Asia litigation
On April 7, 2009, a Cayman Islands corporation, K2 Asia Ventures and its owners filed a lawsuit in ForsythCounty, North Carolina Superior Court against the Company, the Company’s franchisee in the Philippines andother persons associated with the franchisee. The suit alleges that the Company and the other defendantsconspired to deprive the plaintiffs of claimed “exclusive rights” to negotiate franchise and developmentagreements with prospective franchisees in the Philippines and sought at least $3.0 million. The Companybelieves that these allegations lack merit and continues to vigorously defend against the lawsuit. On July 26,2013, the Superior Court dismissed the Philippines-based defendants for lack of personal jurisdiction and theplaintiffs appealed that decision. On January 22, 2015, the North Carolina Supreme Court denied the plaintiffs’request to review the case. The Company moved for summary judgment on May 7, 2015, on the basis that theremaining plaintiff was not the real party in interest. On November 13, 2018, the Superior Court entered an ordergranting the motion and dismissing the action pursuant to Rules 17(a) and 41(b). This dismissal was withoutprejudice to the real party in interest commencing a new action for the same claims within six months, which didnot occur. The plaintiff filed a notice of appeal from that order to the North Carolina Court of Appeals onDecember 13, 2018. The Court of Appeals on September 1, 2020 affirmed the trial court’s November 13, 2018Order dismissing the action. On September 16, 2020, the plaintiff filed a petition for rehearing en banc, which theCourt of Appeals denied on October 16, 2020. On November 2, 2020, the plaintiff filed with the North CarolinaSupreme Court a petition for discretionary review. The Company filed a response to this petition onNovember 16, 2020. The Company is awaiting a decision from the Court. The Company does not believe it isprobable that a loss has been incurred with respect to this matter, and accordingly no liability related to it hasbeen reflected in the accompanying financial statements.
Insomnia Cookies litigation related to employee wages
Insomnia Cookies was a party to a class action lawsuit alleging violations of minimum wage laws, overtimelaws and attendant recordkeeping requirements. The complaint alleged that Insomnia Cookies did not (i) properlyreimburse delivery employees for personal expenses incurred while making deliveries, (ii) properly notifydelivery employees regarding tip credits and (iii) calculate overtime pay correctly. Insomnia Cookies settled withplaintiff for approximately $1.5 million during the fiscal year ended January 3, 2021 which was previouslyaccrued at $2.0 million as of December 29, 2019.
Insomnia Cookies is also currently a party to a class action lawsuit alleging violations of unfair competition,unpaid minimum wages, unpaid overtime, meal and rest period violations and unpaid premiums, failure toreimburse for business expenses, untimely paid wages, and violation of the California Private Attorneys GeneralAct. Insomnia Cookies is vigorously defending these claims. At this time, the Company is unable to predict theoutcome of these lawsuits, the potential loss or range of loss, if any, associated with the resolution of theselawsuits or any potential effect they may have on the Company or its operations.
F-47

TSW Food, LLC litigation
On November 13, 2020, TSW Foods, LLC (“TSW”), a reseller of certain Krispy Kreme packaged products,filed a demand for arbitration and statement of claim alleging Anticipatory Repudiation of the Master ResellerAgreement, Breach of the Master Reseller Agreement, and Breach of the Implied Covenant of Good Faith andFair Dealing. On December 12, 2020, the Company filed its answering statement denying all of TSW’sclaims. On February 8, 2021, the Company filed its counterclaim against TSW alleging Breach of MasterReseller Agreement, Breach of Trade Secret Agreement, and Breach of Good Faith and Fair Dealing. OnMarch 5, 2021, TSW filed its answering statement denying all of the Company’s claims. The Company intendsto vigorously defend against TSW’s claims and prosecute its counterclaims. At this time, the Company is unableto predict the outcome of this matter, the potential loss or range of loss, if any, associated with the resolution ofthis matter or any potential effect it may have on the Company or its operations.
Other Legal Matters
The Company also is engaged in various legal proceedings arising in the normal course of business. TheCompany maintains insurance policies against certain kinds of such claims and suits, including insurance policiesfor workers’ compensation and personal injury, all of which are subject to deductibles. While the ultimateoutcome of these matters could differ from management’s expectations, management currently does not believetheir resolution will have a material adverse effect on the Company’s Consolidated Financial Statements.
Purchase Commitments
The Company is exposed to the effects of commodity price fluctuations on the cost of ingredients for itsproducts, of which flour, shortening and sugar are the most significant. In order to secure adequate supplies ofproducts and bring greater stability to the cost of ingredients, the Company routinely enters into forwardpurchase contracts with suppliers under which it commits to purchase agreed-upon quantities of ingredients atagreed-upon prices at specified future dates. Typically, the aggregate outstanding purchase commitment at anypoint in time will range from one month to several years of anticipated ingredients purchases, depending on theingredient. In addition, from time to time the Company enters into contracts for the future delivery of equipmentpurchased for resale and components of doughnut-making equipment manufactured by the Company. As ofJanuary 3, 2021 and December 29, 2019, the Company had approximately $48.3 million and $66.5 million,respectively, of commitments under ingredient and other forward purchase contracts. These ingredient and otherforward purchase contracts are for physical delivery in quantities expected to be used over a reasonable period inthe normal course of business. These agreements often meet the definition of a derivative. However, theCompany does not measure its forward purchase commitments at fair value as the amounts under contract meetthe physical delivery criteria in the normal purchase exception under ASC 815. While the Company has multiplesuppliers for most of the ingredients, the termination of the Company’s relationships with vendors with whom ithas forward purchase agreements or those vendors’ inability to honor the purchase commitments, couldadversely affect the Company’s results of operations and cash flows.
Other Commitments and Contingencies
The Company has guaranteed certain franchisee lease obligations, usually in connection with subleasing orassigning leases in connection with refranchising transactions. The remaining outstanding guarantee as of fiscalyear ended January 3, 2021 expires in October 2021. The aggregate liability recorded for such obligations was$0.0 million and $0.1 million as of January 3, 2021 and December 29, 2019, respectively, and is included inAccrued liabilities.
One of the Company’s primary banks issued letters of credit on its behalf totaling $14.0 million and$12.2 million as of January 3, 2021 and December 29, 2019, respectively, substantially all of which secure theCompany’s reimbursement obligations to insurers under its self-insurance arrangements.
F-48

Note 15—Related Party Transactions
As of January 3, 2021 and December 29, 2019, the Company had an equity ownership in two franchisees,KremeWorks USA, LLC (20% ownership) and KremeWorks Canada, L.P. (25% ownership), with an aggregatecarrying value of $0.9 million and $1.0 million as of January 3, 2021 and December 29, 2019, respectively.Revenues from sales of ingredients and equipment to these franchisees were $6.6 million, $5.2 million and$5.0 million for the fiscal years ended January 3, 2021, December 29, 2019 and December 30, 2018,respectively. Royalty revenue from these franchisees of $1.2 million, $1.2 million and $1.1 million in each of thefiscal years ended January 3, 2021, December 29, 2019 and December 30, 2018, respectively. Trade receivablesfrom these franchisees are included in Accounts receivable, net on the balance sheet. These transactions wereconducted pursuant to franchise agreements, the terms of which are substantially the same as the agreements withunaffiliated franchisees. Refer to Note 3, Accounts Receivable, net, to the Consolidated Financial Statements formore information.
In connection with tax sharing arrangements with JAB and other JAB portfolio companies, the Companyhad a $7.4 million related party receivable from JAB as of January 3, 2021 and December 29, 2019, respectively.In the fiscal year ended December 29, 2019, the Company collected $28.6 million cash from the related-partyincome tax receivable balance outstanding as of December 30, 2018. In addition, the Company had a $15.3million and $0.0 million related party payable to the other JAB portfolio companies as of January 3, 2021 andDecember 29, 2019, respectively, offset with a $15.3 million income tax receivable due from taxing authorities.
The Company is party to a senior unsecured note agreement (the “original agreement”) with Krispy KremeG.P. (“KK GP”). In the original agreement, which was outstanding prior to fiscal year ended December 30, 2018,the aggregate principal amount was $283.1 million. In April 2019, the Company entered into an additionalunsecured note with KK GP for $54.0 million (the “additional agreement”), which in part funded the repaymentof $78.9 million of third-party debt. The notes under both agreements will mature in series: $202.3 million inOctober 2027, $89.9 million in October 2028 and $44.9 million in October 2029, with an interest rate of 6.55%,6.65% and 6.75%, respectively. Under both agreements, the interest payment is due 60 days after December 31of each calendar year. Any overdue amount of principal and interest will bear interest payable at a rate per annumequal to the sum of (1) two percent and (2) the weighted average interest rates of the notes. The unpaid accruedinterest is included in Related party notes payable in the Consolidated Balance Sheets. Additionally, theagreements include covenants that prohibit the Company to subordinate the notes to other unsecuredindebtedness. As of January 3, 2021, and December 29, 2019, the outstanding amount of principal and interestwas $344.6 million and $340.2 million, respectively. The interest expense for the fiscal years ended January 3,2021, December 29, 2019 and December 30, 2018 was $22.5 million, $21.9 million and $18.9 million,respectively.
The Company granted loans to employees of KKHI, KKUK, KK Australia, KK Mexico and InsomniaCookies for the purchase of shares in those subsidiaries. The loan balance was $18.7 million and $17.2 million asof January 3, 2021 and December 29, 2019, respectively, and it is presented as a reduction from Shareholders’equity on the Consolidated Balance Sheet.
F-49

Note 16—Revenue Recognition
Disaggregation of Revenue
Revenues are disaggregated as follows:
Fiscal Years Ended
January 3,2021
December 29,2019
December 30,2018
Company shops, Branded Sweet Treat Line andDFD . . . . . . . . . . . . . . . . . . . . . . . . . . . . . . . . $1,014,790 $788,607 $618,310
Mix and equipment revenue fromfranchisees . . . . . . . . . . . . . . . . . . . . . . . . . . . 70,320 124,198 130,550
Franchise royalties, and other . . . . . . . . . . . . . . 36,926 46,603 47,023
$1,122,036 $959,408 $795,883
Other revenues include advertising fund contributions, rental income, development and franchise fees andlicensing royalties from Keurig related to Krispy Kreme brands coffee sales.
Contract Balances
Deferred revenue subject to ASC 606 and related receivables are as follows:
January 3,2021
December 29,2019 Balance Sheet Classification
Trade receivables, net of allowances of$1,437 and $739, respectively . . . . . . . . . $39,624 $34,202 Accounts receivables, net
Deferred revenueCurrent . . . . . . . . . . . . . . . . . . . . . . . . . 16,045 13,622 Accrued liabilitiesNon-current . . . . . . . . . . . . . . . . . . . . . 2,838 3,377 Other long-term obligations and deferred
credits
$18,883 $16,999
Trade receivables at the end of each fiscal year relate primarily to payments due for royalties, franchise fees,advertising fees, sale of products and licensing fees. Deferred revenue primarily represents the Company’sremaining performance obligations under gift cards and franchise and development agreements for whichconsideration has been received or is receivable and is generally recognized on a straight-line basis over theremaining term of the related agreement. The noncurrent portion of deferred revenue primarily relates to theremaining performance obligations in the franchise and development agreements. Of the deferred revenuebalances as of December 29, 2019, $7.8 million was recognized as revenue in the fiscal year ended January 3,2021. Of the deferred revenue balance as of December 30, 2018, $4.9 million was recognized as revenue in fiscalthe year ended December 29, 2019.
F-50

Transaction price allocated to remaining performance obligations
Estimated revenue expected to be recognized in the future related to performance obligations that are eitherunsatisfied or partially satisfied as of January 3, 2021 is as follows:
Fiscal year
2021 . . . . . . . . . . . . . . . . . . . . . . . . . . . . . . . . . . . . . . . . . . . . . $10,3532022 . . . . . . . . . . . . . . . . . . . . . . . . . . . . . . . . . . . . . . . . . . . . . 4,1642023 . . . . . . . . . . . . . . . . . . . . . . . . . . . . . . . . . . . . . . . . . . . . . 7692024 . . . . . . . . . . . . . . . . . . . . . . . . . . . . . . . . . . . . . . . . . . . . . 7692025 . . . . . . . . . . . . . . . . . . . . . . . . . . . . . . . . . . . . . . . . . . . . . 769Thereafter . . . . . . . . . . . . . . . . . . . . . . . . . . . . . . . . . . . . . . . . . 2,059
$18,883
The estimated revenue in the table above relates to gift cards, customer loyalty programs and franchise feespaid upfront which are recognized over the life of the franchise agreement. The estimated revenue does notcontemplate future issuances of gift cards or benefits to be earned by members of customer loyalty programs.The estimated revenue also does not contemplate future franchise renewals or new franchise agreements forshops for which a franchise agreement or development agreement does not exist as of January 3, 2021. TheCompany has applied the sales-based royalty exemption which permits exclusion of variable consideration in theform of sales-based royalties from the disclosure of remaining performance obligations in the table above.
Note 17—Net Loss per Share
The following table presents the calculations of basic and diluted EPS:
Fiscal Years Ended
(In thousands, except share and per share amounts)January 3,
2021December 29.
2019December 30,
2018
Net loss attributable to Krispy Kreme, Inc. . . . . . . $(64,301) $(37,409) $(14,072)Adjustment to net loss attributable to
common stockholders . . . . . . . . . . . . (477) 278 1,643
Net loss attributable to common shareholders —Basic . . . . . . . . . . . . . . . . . . . . . . . . . . . . . . . . . $(64,778) $(37,131) $(12,429)
Additional income attributed tononcontrolling interest due tosubsidiary potential commonshares . . . . . . . . . . . . . . . . . . . . . . . . . (10) (64) (23)
Net loss attributable to common shareholders —Diluted . . . . . . . . . . . . . . . . . . . . . . . . . . . . . . . . $(64,788) $(37,195) $(12,452)
Basic and Diluted weighted average commonshares outstanding . . . . . . . . . . . . . . . . . . . . . . . 71,626 71,626 71,626
Loss per share attributable to commonshareholders:
Basic . . . . . . . . . . . . . . . . . . . . . . . . . . . . . . . $(904.39) $(518.40) $(173.52)Diluted . . . . . . . . . . . . . . . . . . . . . . . . . . . . . . $(904.53) $(519.30) $(173.85)
Potential dilutive shares consist of unvested RSUs, calculated using the treasury stock method. Thecalculation of dilutive shares outstanding excludes certain unvested RSUs granted under certain subsidiaries’executive ownership plans and long-term incentive plans, because their inclusion would have been antidilutive.Refer to Note 12, Share-based Compensation, to the Consolidated Financial Statements for further informationabout the plans.
F-51

The following table summarizes the number of unvested RSUs excluded due to antidilution:
Fiscal Years Ended
January 3,2021
December 29.2019
December 30,2018
KKHI . . . . . . . . . . . . . . . . . . . . . . . . . . . . . . . . . . . 843,488 748,218 697,935KKUK . . . . . . . . . . . . . . . . . . . . . . . . . . . . . . . . . . 416,068 438,068 434,810Insomnia Cookies . . . . . . . . . . . . . . . . . . . . . . . . . — 809 19,552
Note 18—Segment Reporting
The Company conducts business through the following three reportable segments:
• U.S. and Canada: reflects all company-owned operations in the United States and Canada, includingKrispy Kreme and Insomnia-branded shops and Branded Sweet Treat Line operations.
• International: reflects all Krispy Kreme’s company-owned operations in the United Kingdom, Ireland,Australia, New Zealand and Mexico.
• Market Development: reflects franchise operations across the globe. It also includes 44 company-owned shops in Japan, which belonged to a franchise acquired in December 2020. Franchise operationsinclude franchisee royalties and sales of doughnut mix, other ingredients, supplies and doughnut-making equipment to franchisees.
Unallocated corporate costs are excluded from the Company’s measurement of segment performance. Thesecosts include general corporate expenses.
Segment information is identified and prepared on the same basis that the CEO, the Company’s ChiefOperating Decision Maker (CODM), evaluates financial results, allocates resources and makes key operatingdecisions. The CODM allocates resources and assesses performance based on geography and line of business,which represents the Company’s operating segments. The operating segments within the U.S. and Canada andInternational reportable segments have been evaluated and combined into reportable segments because they havemet the similar economic characteristics and qualitative aggregation criteria set forth in the relevant accountingguidance.
The primary financial measures used by the CODM to evaluate the performance of its operating segmentsare net revenues and segment adjusted EBITDA. The following tables reconcile segment results to consolidatedresults reported in accordance with U.S. GAAP. The accounting policies used for internal management reportingat the operating segments are consistent with those described in Note 1, Business and Summary of AccountingPolicies. The Company manages its assets on a total company basis and the CODM does not review assetinformation by segment when assessing performance or allocating resources. Consequently, the Company doesnot report total assets by reportable segment.
F-52

The reportable segment results are as follows:
Fiscal Years Ended
January 3,2021
December29, 2019
December30, 2018
Net revenues:U.S. and Canada . . . . . . . . . . . . . . . . . . . . . . . . . . . . $ 782,717 $587,522 $443,563International . . . . . . . . . . . . . . . . . . . . . . . . . . . . . . . 230,185 223,115 185,840Market Development . . . . . . . . . . . . . . . . . . . . . . . . . 109,134 148,771 166,480
Total net revenues . . . . . . . . . . . . . . . . . . . . . . $1,122,036 $959,408 $795,883
Fiscal Years Ended
January 3,2021
December29, 2019
December30, 2018
Depreciation and AmortizationU.S. and Canada . . . . . . . . . . . . . . . . . . . . . . . . . . . . $ 43,056 $ 30,610 $ 21,011International . . . . . . . . . . . . . . . . . . . . . . . . . . . . . . . 30,438 25,188 21,152Market Development . . . . . . . . . . . . . . . . . . . . . . . . . 2,304 3,464 3,854Corporate . . . . . . . . . . . . . . . . . . . . . . . . . . . . . . . . . . 4,600 4,505 3,430
Total Depreciation and Amortization . . . . . . $ 80,398 $ 63,767 $ 49,447
Fiscal Years Ended
January 3,2021
December 29,2019
December 30,2018
Segment adjusted EBITDA:U.S. and Canada . . . . . . . . . . . . . . . . . . . . . . . . . . $ 98,555 $ 75,815 $ 55,915International . . . . . . . . . . . . . . . . . . . . . . . . . . . . . 45,022 53,663 43,735Market Development . . . . . . . . . . . . . . . . . . . . . . 39,067 51,615 56,271Corporate . . . . . . . . . . . . . . . . . . . . . . . . . . . . . . . . (29,754) (30,062) (27,621)
152,890 151,031 128,300Interest expense, net . . . . . . . . . . . . . . . . . . . . . . . 34,741 38,085 27,881Interest expense—related party . . . . . . . . . . . . . . 22,468 21,947 18,902Income tax expense . . . . . . . . . . . . . . . . . . . . . . . . 9,112 12,577 (5,318)Depreciation and amortization expense . . . . . . . . 80,398 63,767 49,447Other non-operating (income)/expense, net . . . . . (1,101) (609) 5,443Share-based compensation . . . . . . . . . . . . . . . . . . 11,619 10,680 9,449Pre-opening costs and related expenses (1) . . . . . . 13,969 8,431 4,053Strategic initiatives (2) . . . . . . . . . . . . . . . . . . . . . . 20,517 4,059 5,342Acquisition and integration expenses (3) . . . . . . . . 12,679 20,433 9,972Store closure expenses (4) . . . . . . . . . . . . . . . . . . . 6,269 629 3,396Restructuring and severance expenses (5) . . . . . . . — 583 5,703
Other (6) . . . . . . . . . . . . . . . . . . . . . . . . . . . . . 3,159 4,450 6,469
Net income (loss) . . . . . . . . . . . . . . . . . $ (60,940) $ (34,001) $ (12,439)
(1) Consists of pre-opening costs as reflected within the consolidated statement of operations and additionalincremental related costs. Pre-opening costs, which include rent, labor and marketing expenses incurredprior to opening a new shop, were $11.6 million, $7.0 million and $1.9 million in fiscal 2020, 2019 and2018, respectively. Additional incremental related costs of $2.4 million and $1.4 million in fiscal 2020 and2019, respectively, related to the Company’s New York City flagship Hot Light Theater Shop opening and
F-53
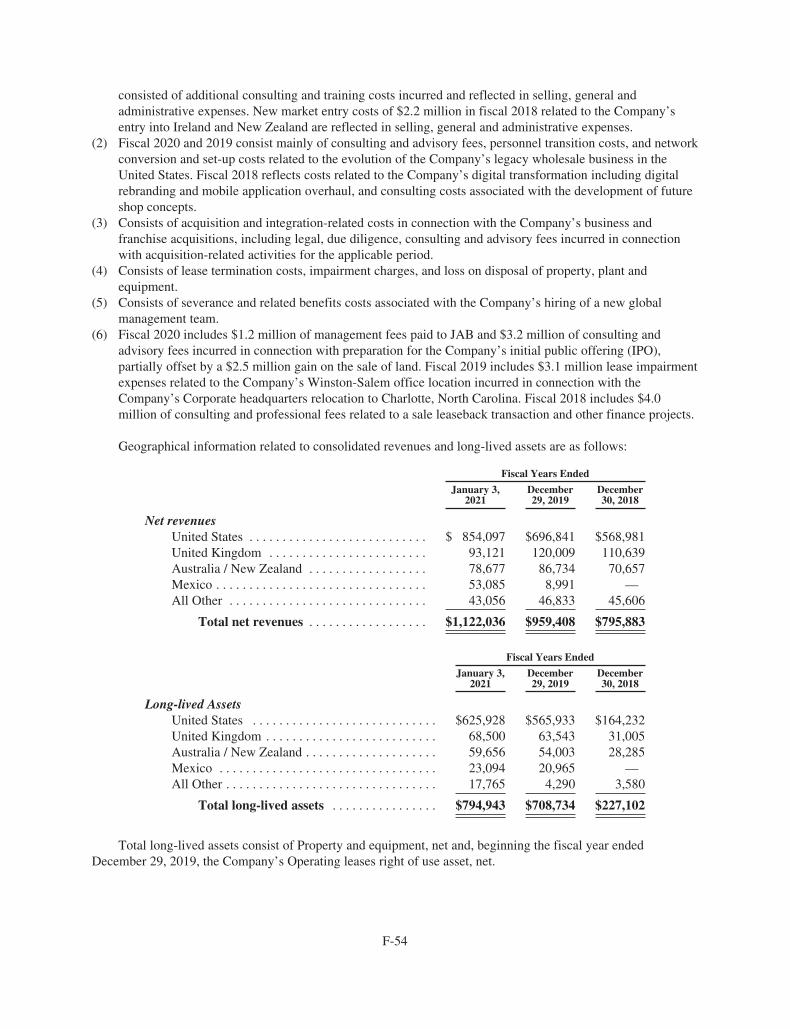
consisted of additional consulting and training costs incurred and reflected in selling, general andadministrative expenses. New market entry costs of $2.2 million in fiscal 2018 related to the Company’sentry into Ireland and New Zealand are reflected in selling, general and administrative expenses.
(2) Fiscal 2020 and 2019 consist mainly of consulting and advisory fees, personnel transition costs, and networkconversion and set-up costs related to the evolution of the Company’s legacy wholesale business in theUnited States. Fiscal 2018 reflects costs related to the Company’s digital transformation including digitalrebranding and mobile application overhaul, and consulting costs associated with the development of futureshop concepts.
(3) Consists of acquisition and integration-related costs in connection with the Company’s business andfranchise acquisitions, including legal, due diligence, consulting and advisory fees incurred in connectionwith acquisition-related activities for the applicable period.
(4) Consists of lease termination costs, impairment charges, and loss on disposal of property, plant andequipment.
(5) Consists of severance and related benefits costs associated with the Company’s hiring of a new globalmanagement team.
(6) Fiscal 2020 includes $1.2 million of management fees paid to JAB and $3.2 million of consulting andadvisory fees incurred in connection with preparation for the Company’s initial public offering (IPO),partially offset by a $2.5 million gain on the sale of land. Fiscal 2019 includes $3.1 million lease impairmentexpenses related to the Company’s Winston-Salem office location incurred in connection with theCompany’s Corporate headquarters relocation to Charlotte, North Carolina. Fiscal 2018 includes $4.0million of consulting and professional fees related to a sale leaseback transaction and other finance projects.
Geographical information related to consolidated revenues and long-lived assets are as follows:
Fiscal Years Ended
January 3,2021
December29, 2019
December30, 2018
Net revenuesUnited States . . . . . . . . . . . . . . . . . . . . . . . . . . . $ 854,097 $696,841 $568,981United Kingdom . . . . . . . . . . . . . . . . . . . . . . . . 93,121 120,009 110,639Australia / New Zealand . . . . . . . . . . . . . . . . . . 78,677 86,734 70,657Mexico . . . . . . . . . . . . . . . . . . . . . . . . . . . . . . . . 53,085 8,991 —All Other . . . . . . . . . . . . . . . . . . . . . . . . . . . . . . 43,056 46,833 45,606
Total net revenues . . . . . . . . . . . . . . . . . . $1,122,036 $959,408 $795,883
Fiscal Years Ended
January 3,2021
December29, 2019
December30, 2018
Long-lived AssetsUnited States . . . . . . . . . . . . . . . . . . . . . . . . . . . . $625,928 $565,933 $164,232United Kingdom . . . . . . . . . . . . . . . . . . . . . . . . . . 68,500 63,543 31,005Australia / New Zealand . . . . . . . . . . . . . . . . . . . . 59,656 54,003 28,285Mexico . . . . . . . . . . . . . . . . . . . . . . . . . . . . . . . . . 23,094 20,965 —All Other . . . . . . . . . . . . . . . . . . . . . . . . . . . . . . . . 17,765 4,290 3,580
Total long-lived assets . . . . . . . . . . . . . . . . $794,943 $708,734 $227,102
Total long-lived assets consist of Property and equipment, net and, beginning the fiscal year endedDecember 29, 2019, the Company’s Operating leases right of use asset, net.
F-54

Note 19—Subsequent Events
The Company evaluated subsequent events and transactions for potential recognition or disclosure in theConsolidated Financial Statements through April 23, 2021, the date the Consolidated Financial Statements wereavailable to be issued. All subsequent events requiring recognition and disclosure have been incorporated intothese financial statements.
On January 19, 2021 the Company completed the acquisition of 11 franchise shops in South Florida for totalconsideration of approximately $19.7 million, consisting of approximately $17.0 million in cash andapproximately $2.7 million related to settlement of pre-existing relationships. The acquisition will be accountedfor as a business combination.
On March 8, 2021 the Company completed the acquisition of 7 franchise shops in California for totalconsideration of approximately $18.3 million, consisting of approximately $16.6 million in cash andapproximately $1.7 million related to settlement of pre-existing relationships. The acquisition will be accountedfor as a business combination.
On April 2, 2021, KKHI received $10.9 million in capital contributions from employee shareholders andother minority interest investors. On April 9, 2021, the Company received an additional $144.1 million in capitalcontributions from shareholders and other minority interest investors. These amounts will be accounted for ascapital contributions in the Consolidated Statements of Changes in Shareholders’ Equity.
F-55

Krispy Kreme, Inc. (formerly known as Krispy Kreme HoldCo, Inc.)Schedule I—Condensed Financial Information
Parent Company OnlyStatements of Operations and Comprehensive Loss
(in thousands USD)
Fiscal Years Ended
January 3,2021
(53 weeks)
December 29,2019
(52 weeks)
December 30,2018
(52 weeks)
Interest expense—related party . . . . . . . . . . . . . . . . . . . . . . . . . . . . . . . . . . 22,468 21,947 18,902Other non-operating expense . . . . . . . . . . . . . . . . . . . . . . . . . . . . . . . . . . . . — — 32
Loss before income taxes and equity in net loss/(income) ofsubsidiaries . . . . . . . . . . . . . . . . . . . . . . . . . . . . . . . . . . . . . . . . . . . . . . . (22,468) (21,947) (18,934)
Income tax expense/(benefit) . . . . . . . . . . . . . . . . . . . . . . . . . . . . . . . . . . . (4,356) 6,964 (4,208)Equity in net loss/(income) of subsidiaries . . . . . . . . . . . . . . . . . . . . . . . . . 46,189 8,498 (654)
Net loss . . . . . . . . . . . . . . . . . . . . . . . . . . . . . . . . . . . . . . . . . . . . . . . . . . . . (64,301) (37,409) (14,072)Other comprehensive income/(loss), net of tax . . . . . . . . . . . . . . . . . . . . . . 4,343 494 (23,810)
Comprehensive loss . . . . . . . . . . . . . . . . . . . . . . . . . . . . . . . . . . . . . . . . . . $(59,958) $(36,915) $(37,882)
See accompanying notes to Condensed Financial Statements.
F-56

Krispy Kreme, Inc. (formerly known as Krispy Kreme HoldCo, Inc.)Schedule I—Condensed Financial Information
Parent Company OnlyBalance Sheets
(In thousands, except per share amounts and number of shares)
As of
January 3,2021
December 29,2019
ASSETSCurrent Assets:Cash and cash equivalents . . . . . . . . . . . . . . . . . . . . . . . . . . . . . . . . . . . . . . . . . . . . . . . $ 1,578 $ 352Accounts receivable, net . . . . . . . . . . . . . . . . . . . . . . . . . . . . . . . . . . . . . . . . . . . . . . . . . 15,308 871
Total current assets . . . . . . . . . . . . . . . . . . . . . . . . . . . . . . . . . . . . . . . . . . . . . . . 16,886 1,223Investments in subsidiaries . . . . . . . . . . . . . . . . . . . . . . . . . . . . . . . . . . . . . . . . . . . . . . . 1,026,222 1,075,715Deferred income taxes, net . . . . . . . . . . . . . . . . . . . . . . . . . . . . . . . . . . . . . . . . . . . . . . . 17,475 12,240Other assets . . . . . . . . . . . . . . . . . . . . . . . . . . . . . . . . . . . . . . . . . . . . . . . . . . . . . . . . . . . — 341
Total assets . . . . . . . . . . . . . . . . . . . . . . . . . . . . . . . . . . . . . . . . . . . . . . . . . . . . . . $1,060,583 $1,089,519
LIABILITIES AND SHAREHOLDERS’ EQUITYCurrent Liabilities:Accrued liabilities . . . . . . . . . . . . . . . . . . . . . . . . . . . . . . . . . . . . . . . . . . . . . . . . . . . . . . $ 15,342 $ —
Total current liabilities . . . . . . . . . . . . . . . . . . . . . . . . . . . . . . . . . . . . . . . . . . . . . 15,342 —Related party notes payable . . . . . . . . . . . . . . . . . . . . . . . . . . . . . . . . . . . . . . . . . . . . . . 344,581 340,195Other long-term obligations and deferred credits . . . . . . . . . . . . . . . . . . . . . . . . . . . . . . 15,976 14,504
Total liabilities . . . . . . . . . . . . . . . . . . . . . . . . . . . . . . . . . . . . . . . . . . . . . . . . . . . . 375,899 354,699Commitments and contingenciesShareholders’ Equity:Common stock, $0.01 par value; 100,000 shares authorized; 71,626 shares issued and
outstanding as of January 3, 2021 and December 29, 2019 . . . . . . . . . . . . . . . . . . . . 1 1Additional paid-in capital . . . . . . . . . . . . . . . . . . . . . . . . . . . . . . . . . . . . . . . . . . . . . . . . 846,748 835,482Shareholder note receivable . . . . . . . . . . . . . . . . . . . . . . . . . . . . . . . . . . . . . . . . . . . . . . (18,660) (17,232)Accumulated other comprehensive loss, net of income tax . . . . . . . . . . . . . . . . . . . . . . (1,208) (5,551)Retained deficit . . . . . . . . . . . . . . . . . . . . . . . . . . . . . . . . . . . . . . . . . . . . . . . . . . . . . . . . (142,197) (77,880)
Total shareholders’ equity . . . . . . . . . . . . . . . . . . . . . . . . . . . . . . . . . . . . . . . . . . 684,684 734,820
Total liabilities and shareholders’ equity . . . . . . . . . . . . . . . . . . . . . . . . . . . . . . $1,060,583 $1,089,519
See accompanying notes to Condensed Financial Statements.
F-57

Krispy Kreme, Inc. (formerly known as Krispy Kreme HoldCo, Inc.)Schedule I—Condensed Financial Information
Parent Company OnlyStatements of Cash Flows
(In thousands)
Fiscal Years Ended
January 3,2021
(53 weeks)
December 29,2019
(52 weeks)
December 30,2018
(52 weeks)
CASH FLOWS FROM OPERATING ACTIVITIES:Net loss . . . . . . . . . . . . . . . . . . . . . . . . . . . . . . . . . . . . . . . . . . . . . . . . . . . . $(64,301) $(37,409) $(14,072)Adjustments to reconcile net loss to net cash (used for)/provided by
operating activities:Equity in net loss/(income) of subsidiaries . . . . . . . . . . . . . . . . . . . . . 46,189 8,498 (654)Deferred income taxes . . . . . . . . . . . . . . . . . . . . . . . . . . . . . . . . . . . . (5,235) (8,032) (4,208)Other . . . . . . . . . . . . . . . . . . . . . . . . . . . . . . . . . . . . . . . . . . . . . . . . . . (255) 3,355 —Change in assets and liabilities: . . . . . . . . . . . . . . . . . . . . . . . . . . . . .
Current and non-current assets . . . . . . . . . . . . . . . . . . . . . . . . . . (14,096) (1,212) —Current and non-current liabilities . . . . . . . . . . . . . . . . . . . . . . . 21,200 (177) 29,669
Net cash (used for)/provided by operating activities . . . (16,498) (34,977) 10,735
CASH FLOWS FROM INVESTING ACTIVITIES:Distributions from subsidiaries . . . . . . . . . . . . . . . . . . . . . . . . . . . . . . . . . . 20,660 45,231 —Investments in subsidiaries, net . . . . . . . . . . . . . . . . . . . . . . . . . . . . . . . . . (2,936) 2,296 (2)
Net cash provided by/(used for) investing activities . . . 17,724 47,527 (2)
CASH FLOWS FROM FINANCING ACTIVITIES:Proceeds from the issuance of debt . . . . . . . . . . . . . . . . . . . . . . . . . . . . . . . — 54,002 —Repayment of long-term debt and lease obligations . . . . . . . . . . . . . . . . . . — (78,891) —
Net cash used for financing activities . . . . . . . . . . . . . . . — (24,889) —
Net increase/(decrease) in cash, cash equivalents and restricted cash . . . . 1,226 (12,339) 10,733Cash, cash equivalents and restricted cash at beginning of the quarter . . . 352 12,691 1,958
Cash, cash equivalents and restricted cash at end of the quarter . . . . $ 1,578 $ 352 $ 12,691
See accompanying notes to Condensed Financial Statements.
F-58

Notes to Condensed Parent Company Financial Statements
Basis of Presentation
All operating activities of Krispy Kreme, Inc. (formerly known as Krispy Kreme HoldCo, Inc.) (“KrispyKreme” or “Parent Company”) are conducted by the subsidiaries, primarily the wholly owned subsidiary andoperating company Krispy Kreme Doughnuts, Inc. (“KKDI”). The 2019 Senior Secured Credit Facility of KKDIcontains provisions whereby KKDI has restrictions on the ability to pay dividends, loans or advances to KrispyKreme. Accordingly, these condensed financial statements have been presented on a “parent-only” basis, usingthe same accounting principles and policies described in the notes to the consolidated financial statements.
Under a parent-only presentation, Krispy Kreme’s investment in its consolidated subsidiaries is presentedunder the equity method of accounting and is stated at cost plus equity in undistributed earnings of subsidiariesand less distributions. The Parent Company’s share of net loss or income of its subsidiaries is included in theCondensed Statements of Operations and Comprehensive Loss using the equity method. These parent-onlyfinancial statements should be read in conjunction with Krispy Kreme’s audited Consolidated FinancialStatements included elsewhere herein.
As of January 3, 2021, the Parent Company has no major commitments and contingencies and is not aguarantor of indebtedness for any of its subsidiaries. The Parent Company received cash distributions from itssubsidiary, KKDI, of $20.7 million and $45.2 million for the fiscal years ended January 3, 2021 andDecember 29, 2019, respectively, which were generated primarily through KKDI operating and financingactivities for each respective year.
The Parent Company had $15.3 million and $0.9 million of income tax receivable from taxing authorities asof January 3, 2021 and December 29, 2019, respectively. In connection with tax sharing arrangements withrelated parties under common control prior to the fiscal year ended December 30, 2018 as described in theconsolidated financial statements, the Parent Company had $15.3 million and $0.0 million related party payableto the other JAB portfolio companies as of January 3, 2021 and December 29, 2019, respectively, offset with a$15.3 million income tax receivable. Additionally, the Parent Company had deferred income tax assets of $17.5million and $12.2 million as of January 3, 2021 and December 29, 2019, respectively. The Parent Company had$15.9 million and $15.0 million of unrecognized income tax benefits as of January 3, 2021 and December 29,2019, respectively, included in Other long-term obligations and deferred credits on the Condensed BalanceSheets and, if recognized, would impact the annual effective tax rate. The Parent Company does not believe thatchanges in its uncertain tax benefits will result in a material impact during the next twelve months.
F-59

Krispy Kreme, Inc.Condensed Consolidated Statements of Operations (Unaudited)(In thousands, except per share amounts and number of shares)
Quarters Ended
April 4,2021
(13 weeks)
March 29,2020
(13 weeks)
Net revenueProduct sales . . . . . . . . . . . . . . . . . . . . . . . . . . . . . . . . . . . . . . . . . . . . . . . . . . . . . . . . . . . . . $313,585 $251,536Royalties and other revenues . . . . . . . . . . . . . . . . . . . . . . . . . . . . . . . . . . . . . . . . . . . . . . . . . 8,224 9,680
Total net revenues . . . . . . . . . . . . . . . . . . . . . . . . . . . . . . . . . . . . . . . . . . . . . . . . . . . . . . . . 321,809 261,216Product and distribution costs . . . . . . . . . . . . . . . . . . . . . . . . . . . . . . . . . . . . . . . . . . . . . . . . 79,997 68,148Operating expenses . . . . . . . . . . . . . . . . . . . . . . . . . . . . . . . . . . . . . . . . . . . . . . . . . . . . . . . . 147,541 115,779Selling, general and administrative expense . . . . . . . . . . . . . . . . . . . . . . . . . . . . . . . . . . . . . 59,044 49,196Pre-opening costs . . . . . . . . . . . . . . . . . . . . . . . . . . . . . . . . . . . . . . . . . . . . . . . . . . . . . . . . . 1,391 3,437Other (income)/expenses, net . . . . . . . . . . . . . . . . . . . . . . . . . . . . . . . . . . . . . . . . . . . . . . . . (3,245) 1,171Depreciation and amortization expense . . . . . . . . . . . . . . . . . . . . . . . . . . . . . . . . . . . . . . . . 23,401 19,087
Operating income . . . . . . . . . . . . . . . . . . . . . . . . . . . . . . . . . . . . . . . . . . . . . . . . . . . . . . . . 13,680 4,398Interest expense, net . . . . . . . . . . . . . . . . . . . . . . . . . . . . . . . . . . . . . . . . . . . . . . . . . . . . . . . 8,249 8,644Interest expense — related party . . . . . . . . . . . . . . . . . . . . . . . . . . . . . . . . . . . . . . . . . . . . . . 5,566 5,566Other non-operating (income)/expense, net . . . . . . . . . . . . . . . . . . . . . . . . . . . . . . . . . . . . . (442) 2,548
Income/(loss) before income taxes . . . . . . . . . . . . . . . . . . . . . . . . . . . . . . . . . . . . . . . . . . . 307 (12,360)Income tax expense/(benefit) . . . . . . . . . . . . . . . . . . . . . . . . . . . . . . . . . . . . . . . . . . . . . . . . 685 (1,412)
Net loss . . . . . . . . . . . . . . . . . . . . . . . . . . . . . . . . . . . . . . . . . . . . . . . . . . . . . . . . . . . . . . . . . (378) (10,948)Net income attributable to noncontrolling interest . . . . . . . . . . . . . . . . . . . . . . . . . . . . . . . . 2,683 567
Net loss attributable to Krispy Kreme, Inc. . . . . . . . . . . . . . . . . . . . . . . . . . . . . . . . . . . . $ (3,061) $ (11,515)
Net loss per share:Common stock — Basic . . . . . . . . . . . . . . . . . . . . . . . . . . . . . . . . . . . . . . . . . . . . . . . . . . . . $ (44.71) $ (159.29)Common stock — Diluted . . . . . . . . . . . . . . . . . . . . . . . . . . . . . . . . . . . . . . . . . . . . . . . . . . . $ (45.89) $ (159.39)Weighted average shares outstanding:Basic . . . . . . . . . . . . . . . . . . . . . . . . . . . . . . . . . . . . . . . . . . . . . . . . . . . . . . . . . . . . . . . . . . . 71,626 71,626Diluted . . . . . . . . . . . . . . . . . . . . . . . . . . . . . . . . . . . . . . . . . . . . . . . . . . . . . . . . . . . . . . . . . . 71,626 71,626
See accompanying notes to Condensed Consolidated Financial Statements.
F-60

Krispy Kreme, Inc.Condensed Consolidated Statements of Comprehensive Income (Loss) (Unaudited)
(In thousands)
Quarters Ended
April 4,2021
(13 weeks)
March 29,2020
(13 weeks)
Net loss . . . . . . . . . . . . . . . . . . . . . . . . . . . . . . . . . . . . . . . . . . . . . . . . . . . . . . . . . . . . . . . . . . $ (378) $(10,948)
Other comprehensive income:Foreign currency translation adjustment, net of income tax benefit/(expense) of
$0.0 million and $0.0 million . . . . . . . . . . . . . . . . . . . . . . . . . . . . . . . . . . . . . . . . . . . (2,264) (46,423)Unrealized income/(loss) on cash flow hedges, net of income tax benefit/(expense) of
($1.7) million and $5.1 million . . . . . . . . . . . . . . . . . . . . . . . . . . . . . . . . . . . . . . . . . . 5,102 (15,435)Unrealized income/(loss) on employee benefit plans, net of income tax benefit/
(expense) of $0.0 million and $0.0 million . . . . . . . . . . . . . . . . . . . . . . . . . . . . . . . . — —
Total other comprehensive income/(loss) . . . . . . . . . . . . . . . . . . . . . . . . . . . . . . . . . . 2,838 (61,858)
Comprehensive income/(loss) . . . . . . . . . . . . . . . . . . . . . . . . . . . . . . . . . . . . . . . . . . . . . . . 2,460 (72,806)
Net income attributable to noncontrolling interest . . . . . . . . . . . . . . . . . . . . . . . . . . . . . 2,683 567
Total comprehensive income attributable to noncontrolling interest . . . . . . . . . . . 2,683 567
Comprehensive loss attributable to Krispy Kreme, Inc. . . . . . . . . . . . . . . . . . . . . . . . . . $ (223) $(73,373)
See accompanying notes to Condensed Consolidated Financial Statements.
F-61

Krispy Kreme, Inc.Condensed Consolidated Balance Sheets(In thousands, except number of shares)
As of
(Unaudited)April 4,
2021January 3,
2021
ASSETSCurrent Assets:Cash and cash equivalents . . . . . . . . . . . . . . . . . . . . . . . . . . . . . . . . . . . . . . . . . . . . . . . . $ 50,650 $ 37,460Marketable securities . . . . . . . . . . . . . . . . . . . . . . . . . . . . . . . . . . . . . . . . . . . . . . . . . . . 858 1,048Restricted cash . . . . . . . . . . . . . . . . . . . . . . . . . . . . . . . . . . . . . . . . . . . . . . . . . . . . . . . . . 128 23Accounts receivable, net . . . . . . . . . . . . . . . . . . . . . . . . . . . . . . . . . . . . . . . . . . . . . . . . . 66,966 74,351Inventories . . . . . . . . . . . . . . . . . . . . . . . . . . . . . . . . . . . . . . . . . . . . . . . . . . . . . . . . . . . . 37,962 38,519Prepaid expense and other current assets . . . . . . . . . . . . . . . . . . . . . . . . . . . . . . . . . . . . 14,453 12,692
Total current assets . . . . . . . . . . . . . . . . . . . . . . . . . . . . . . . . . . . . . . . . . . . . . . . . 171,017 164,093Property and equipment, net . . . . . . . . . . . . . . . . . . . . . . . . . . . . . . . . . . . . . . . . . . . . . . 411,106 395,255Goodwill . . . . . . . . . . . . . . . . . . . . . . . . . . . . . . . . . . . . . . . . . . . . . . . . . . . . . . . . . . . . . 1,096,269 1,086,546Other intangible assets, net . . . . . . . . . . . . . . . . . . . . . . . . . . . . . . . . . . . . . . . . . . . . . . . 1,011,234 998,014Operating lease right of use asset, net . . . . . . . . . . . . . . . . . . . . . . . . . . . . . . . . . . . . . . . 409,485 399,688Other assets . . . . . . . . . . . . . . . . . . . . . . . . . . . . . . . . . . . . . . . . . . . . . . . . . . . . . . . . . . . 17,620 17,399
Total assets . . . . . . . . . . . . . . . . . . . . . . . . . . . . . . . . . . . . . . . . . . . . . . . . . . . . . . . $3,116,731 $3,060,995
LIABILITIES AND SHAREHOLDERS’ EQUITYCurrent Liabilities:Current portion of long-term debt . . . . . . . . . . . . . . . . . . . . . . . . . . . . . . . . . . . . . . . . . . $ 37,581 $ 41,245Current operating lease liabilities . . . . . . . . . . . . . . . . . . . . . . . . . . . . . . . . . . . . . . . . . . 46,500 45,675Accounts payable . . . . . . . . . . . . . . . . . . . . . . . . . . . . . . . . . . . . . . . . . . . . . . . . . . . . . . 159,841 148,645Accrued liabilities . . . . . . . . . . . . . . . . . . . . . . . . . . . . . . . . . . . . . . . . . . . . . . . . . . . . . . 117,546 124,951Structured payables . . . . . . . . . . . . . . . . . . . . . . . . . . . . . . . . . . . . . . . . . . . . . . . . . . . . . 138,451 137,319
Total current liabilities . . . . . . . . . . . . . . . . . . . . . . . . . . . . . . . . . . . . . . . . . . . . . 499,919 497,835Long-term debt, less current portion . . . . . . . . . . . . . . . . . . . . . . . . . . . . . . . . . . . . . . . . 816,876 785,810Related party notes payable . . . . . . . . . . . . . . . . . . . . . . . . . . . . . . . . . . . . . . . . . . . . . . . 350,147 344,581Noncurrent operating lease liabilities . . . . . . . . . . . . . . . . . . . . . . . . . . . . . . . . . . . . . . . 385,207 376,099Deferred income taxes, net . . . . . . . . . . . . . . . . . . . . . . . . . . . . . . . . . . . . . . . . . . . . . . . 144,452 144,866Other long-term obligations and deferred credits . . . . . . . . . . . . . . . . . . . . . . . . . . . . . . 56,727 63,445
Total liabilities . . . . . . . . . . . . . . . . . . . . . . . . . . . . . . . . . . . . . . . . . . . . . . . . . . . . 2,253,328 2,212,636Commitments and contingenciesShareholders’ Equity:Common stock, $0.01 par value; 100,000 shares authorized; 71,626 shares issued and
outstanding as of April 4, 2021 and January 3, 2021 . . . . . . . . . . . . . . . . . . . . . . . . . 1 1Additional paid-in capital . . . . . . . . . . . . . . . . . . . . . . . . . . . . . . . . . . . . . . . . . . . . . . . . 849,090 846,748Shareholder note receivable . . . . . . . . . . . . . . . . . . . . . . . . . . . . . . . . . . . . . . . . . . . . . . (18,228) (18,660)Accumulated other comprehensive income/(loss), net of income tax . . . . . . . . . . . . . . 1,630 (1,208)Retained deficit . . . . . . . . . . . . . . . . . . . . . . . . . . . . . . . . . . . . . . . . . . . . . . . . . . . . . . . . (145,256) (142,197)
Total shareholders’ equity attributable to Krispy Kreme, Inc. . . . . . . . . . . . . 687,237 684,684Noncontrolling interest . . . . . . . . . . . . . . . . . . . . . . . . . . . . . . . . . . . . . . . . . . . . . . . . . . 176,166 163,675
Total shareholders’ equity . . . . . . . . . . . . . . . . . . . . . . . . . . . . . . . . . . . . . . . . . . 863,403 848,359
Total liabilities and shareholders’ equity . . . . . . . . . . . . . . . . . . . . . . . . . . . . . . $3,116,731 $3,060,995
See accompanying notes to Condensed Consolidated Financial Statements.
F-62

Kri
spy
Kre
me,
Inc.
Con
dens
edC
onso
lidat
edSt
atem
ents
ofC
hang
esin
Shar
ehol
ders
’E
quit
y(U
naud
ited
)(I
nth
ousa
nds,
exce
ptnu
mbe
rof
shar
es)
Com
mon
Stoc
k
Add
itio
nal
Pai
d-in
Cap
ital
Shar
ehol
der
Not
eR
ecei
vabl
e
Acc
umul
ated
Oth
erC
ompr
ehen
sive
Inco
me/
(Los
s)
Ret
aine
d(D
efic
it)
Ear
ning
sN
onco
ntro
lling
Inte
rest
Tot
alSh
ares
Out
stan
ding
Am
ount
For
eign
curr
ency
tran
slat
ion
adju
stm
ent
Unr
ealiz
edlo
sson
cash
flow
hedg
es
Unr
ealiz
edlo
sson
empl
oyee
bene
fitp
lans
Bal
ance
atJa
nuar
y3,
2021
....
....
...
71,6
26$
1$8
46,7
48$(
18,6
60)
$23,
508
$(24
,610
)$(
106)
$(14
2,19
7)$1
63,6
75$8
48,3
59N
et(l
oss)
/inco
me
for
the
quar
ter
ende
dA
pril
4,20
21..
....
....
....
....
....
——
——
——
(3,0
61)
2,68
3(3
78)
Oth
erco
mpr
ehen
sive
(los
s)/in
com
efo
rth
equ
arte
ren
ded
Apr
il4,
2021
befo
rere
clas
sifi
catio
ns..
....
....
....
....
.—
——
(2,2
64)
2,57
2—
——
308
Rec
lass
ific
atio
nfr
omA
OC
I..
....
....
..—
——
—2,
530
——
—2,
530
Shar
e-ba
sed
com
pens
atio
n..
....
....
...
—2,
368
——
——
——
2,36
8Pu
rcha
seof
shar
esby
nonc
ontr
ollin
gin
tere
st..
....
....
....
....
....
....
——
139
——
——
12,0
4812
,187
Dis
trib
utio
nto
shar
ehol
ders
....
....
....
——
——
——
——
—D
istr
ibut
ion
tono
ncon
trol
ling
inte
rest
....
——
363
——
——
(2,2
39)
(1,8
76)
Oth
er..
....
....
....
....
....
....
....
—(2
6)(7
0)—
——
2(1
)(9
5)
Bal
ance
atA
pril
4,20
21..
....
....
....
71,6
26$
1$8
49,0
90$(
18,2
28)
$21,
244
$(19
,508
)$(
106)
$(14
5,25
6)$1
76,1
66$8
63,4
03
See
acco
mpa
nyin
gno
tes
toC
onde
nsed
Con
soli
date
dF
inan
cial
Stat
emen
ts
F-63

Kri
spy
Kre
me,
Inc.
Con
dens
edC
onso
lidat
edSt
atem
ents
ofC
hang
esin
Shar
ehol
ders
’E
quit
y(U
naud
ited
)(I
nth
ousa
nds,
exce
ptnu
mbe
rof
shar
es)
Com
mon
Stoc
k
Add
itio
nal
Pai
d-in
Cap
ital
Shar
ehol
der
Not
eR
ecei
vabl
e
Acc
umul
ated
Oth
erC
ompr
ehen
sive
Inco
me/
(Los
s)
Ret
aine
d(D
efic
it)
Ear
ning
sN
onco
ntro
lling
Inte
rest
Tot
alSh
ares
Out
stan
ding
Am
ount
For
eign
curr
ency
tran
slat
ion
adju
stm
ent
Unr
ealiz
edlo
sson
cash
flow
hedg
es
Unr
ealiz
edlo
sson
empl
oyee
bene
fit
plan
s
Bal
ance
atD
ecem
ber
29,2
019
....
....
.71
,626
$1
$835
,482
$(17
,232
)$
4,62
9$(
10,1
80)
$—$(
77,8
80)
$148
,597
$883
,417
Net
(los
s)/in
com
efo
rth
equ
arte
ren
ded
Mar
ch29
,202
0..
....
....
....
....
..—
——
——
——
(11,
515)
567
(10,
948)
Oth
erco
mpr
ehen
sive
(los
s)/in
com
efo
rth
equ
arte
ren
ded
Mar
ch29
,202
0be
fore
recl
assi
fica
tions
....
....
....
....
...
——
——
(46,
423)
(16,
130)
——
—(6
2,55
3)R
ecla
ssif
icat
ion
from
AO
CI
....
....
....
——
——
—69
5—
——
695
Shar
e-ba
sed
com
pens
atio
n..
....
....
...
——
3,16
7—
——
——
—3,
167
Purc
hase
ofsh
ares
byno
ncon
trol
ling
inte
rest
....
....
....
....
....
....
..—
——
——
——
—17
,562
17,5
62D
istr
ibut
ion
tosh
areh
olde
rs..
....
....
..—
—(1
5)—
——
——
—(1
5)D
istr
ibut
ion
tono
ncon
trol
ling
inte
rest
....
——
——
——
——
(2,5
06)
(2,5
06)
Oth
er..
....
....
....
....
....
....
....
——
—(7
6)—
——
—(1
)(7
7)
Bal
ance
atM
arch
29,2
020
....
....
....
71,6
26$
1$8
38,6
34$(
17,3
08)
$(41
,794
)$(
25,6
15)
$—$(
89,3
95)
$164
,219
$828
,742
See
acco
mpa
nyin
gno
tes
toC
onde
nsed
Con
soli
date
dF
inan
cial
Stat
emen
ts
F-64

Krispy Kreme, Inc.Condensed Consolidated Statements of Cash Flows (Unaudited)
(In thousands)
Quarters Ended
April 4,2021 (13weeks)
March 29,2020 (13weeks)
CASH FLOWS FROM OPERATING ACTIVITIES:Net loss . . . . . . . . . . . . . . . . . . . . . . . . . . . . . . . . . . . . . . . . . . . . . . . . . . . . . . . . . . . . . . . . . . $ (378) $ (10,948)Adjustments to reconcile net loss to net cash provided by operating activities:
Depreciation and amortization expense . . . . . . . . . . . . . . . . . . . . . . . . . . . . . . . . . . . . . 23,401 19,087Deferred income taxes . . . . . . . . . . . . . . . . . . . . . . . . . . . . . . . . . . . . . . . . . . . . . . . . . . 593 (2,653)Impairment and lease termination charges . . . . . . . . . . . . . . . . . . . . . . . . . . . . . . . . . . 1,151 —Loss on disposal of property and equipment . . . . . . . . . . . . . . . . . . . . . . . . . . . . . . . . . 116 —Share-based compensation . . . . . . . . . . . . . . . . . . . . . . . . . . . . . . . . . . . . . . . . . . . . . . . 2,368 3,167Change in accounts and notes receivable allowances . . . . . . . . . . . . . . . . . . . . . . . . . . 180 112Inventory write-off . . . . . . . . . . . . . . . . . . . . . . . . . . . . . . . . . . . . . . . . . . . . . . . . . . . . . 870 —Other . . . . . . . . . . . . . . . . . . . . . . . . . . . . . . . . . . . . . . . . . . . . . . . . . . . . . . . . . . . . . . . (2,798) 2,250Change in operating assets and liabilities, excluding business acquisitions and
foreign currency translation adjustments: . . . . . . . . . . . . . . . . . . . . . . . . . . . . . . . . . 15,138 (11,104)
Net cash provided by/(used for) operating activities . . . . . . . . . . . . . . . . . . . . . . . . . . . . 40,641 (89)
CASH FLOWS FROM INVESTING ACTIVITIES:Purchase of property and equipment . . . . . . . . . . . . . . . . . . . . . . . . . . . . . . . . . . . . . . . (30,297) (22,775)Proceeds from disposals of assets . . . . . . . . . . . . . . . . . . . . . . . . . . . . . . . . . . . . . . . . . 43 —Acquisition of shops and franchise rights from franchisees, net of cash acquired . . . . (33,568) 212Principal payments received from loans to franchisees . . . . . . . . . . . . . . . . . . . . . . . . . — 145Purchases of held-to-maturity debt securities . . . . . . . . . . . . . . . . . . . . . . . . . . . . . . . . — (55)Maturities of held-to-maturity debt securities . . . . . . . . . . . . . . . . . . . . . . . . . . . . . . . . 169 74
Net cash used for investing activities . . . . . . . . . . . . . . . . . . . . . . . . . . . . . . . . . . . . . . . . . (63,653) (22,399)
CASH FLOWS FROM FINANCING ACTIVITIES:Proceeds from the issuance of debt . . . . . . . . . . . . . . . . . . . . . . . . . . . . . . . . . . . . . . . . 40,000 260,000Repayment of long-term debt and lease obligations . . . . . . . . . . . . . . . . . . . . . . . . . . . (14,629) (9,833)Proceeds from structured payables . . . . . . . . . . . . . . . . . . . . . . . . . . . . . . . . . . . . . . . . 65,550 66,095Payments on structured payables . . . . . . . . . . . . . . . . . . . . . . . . . . . . . . . . . . . . . . . . . . (64,418) (49,623)Proceeds from sale of noncontrolling interest in subsidiary . . . . . . . . . . . . . . . . . . . . . 12,187 17,562Distribution to shareholders . . . . . . . . . . . . . . . . . . . . . . . . . . . . . . . . . . . . . . . . . . . . . . — (15)Distribution to noncontrolling interest . . . . . . . . . . . . . . . . . . . . . . . . . . . . . . . . . . . . . . (1,876) (2,506)
Net cash provided by financing activities . . . . . . . . . . . . . . . . . . . . . . . . . . . . . . . . . . . . . 36,814 281,680
Effect of exchange rate changes on cash, cash equivalents and restricted cash . . . . . . . . . . (507) (739)Net increase/(decrease) in cash, cash equivalents and restricted cash . . . . . . . . . . . . . . . . . . 13,295 258,453Cash, cash equivalents and restricted cash at beginning of the fiscal year . . . . . . . . . . . . . . 37,483 35,450
Cash, cash equivalents and restricted cash at end of the fiscal year . . . . . . . . . . . . . . . . $ 50,778 $293,903
Supplemental schedule of non-cash investing and financing activities:Accrual for property and equipment . . . . . . . . . . . . . . . . . . . . . . . . . . . . . . . . . . . . . . . $ 1,123 $ 2,753Stock issuance under shareholder notes . . . . . . . . . . . . . . . . . . . . . . . . . . . . . . . . . . . . . 446 —
Reconciliation of cash, cash equivalents and restricted cash at end of fiscal year:Cash and cash equivalents . . . . . . . . . . . . . . . . . . . . . . . . . . . . . . . . . . . . . . . . . . . . . . . $ 50,650 $293,711Restricted cash . . . . . . . . . . . . . . . . . . . . . . . . . . . . . . . . . . . . . . . . . . . . . . . . . . . . . . . . 128 192
Total cash, cash equivalents and restricted cash . . . . . . . . . . . . . . . . . . . . . . . . . . . $ 50,778 $293,903
See accompanying notes to Condensed Consolidated Financial Statements.
F-65

Krispy Kreme, Inc.Index for Notes to Condensed Consolidated Financial Statements
Page
Note 1 Description of Business and Summary of Significant Accounting Policies . . . . . . . . . . . . . . . . . . F–67Note 2 Acquisitions . . . . . . . . . . . . . . . . . . . . . . . . . . . . . . . . . . . . . . . . . . . . . . . . . . . . . . . . . . . . . . . . . . . F–68Note 3 Inventories . . . . . . . . . . . . . . . . . . . . . . . . . . . . . . . . . . . . . . . . . . . . . . . . . . . . . . . . . . . . . . . . . . . . F–69Note 4 Goodwill and Other Intangible Assets . . . . . . . . . . . . . . . . . . . . . . . . . . . . . . . . . . . . . . . . . . . . . . . F–70Note 5 Leases . . . . . . . . . . . . . . . . . . . . . . . . . . . . . . . . . . . . . . . . . . . . . . . . . . . . . . . . . . . . . . . . . . . . . . . . F–71Note 6 Fair Value Measurements . . . . . . . . . . . . . . . . . . . . . . . . . . . . . . . . . . . . . . . . . . . . . . . . . . . . . . . . F–72Note 7 Derivative Instruments . . . . . . . . . . . . . . . . . . . . . . . . . . . . . . . . . . . . . . . . . . . . . . . . . . . . . . . . . . . F–72Note 8 Share-based Compensation . . . . . . . . . . . . . . . . . . . . . . . . . . . . . . . . . . . . . . . . . . . . . . . . . . . . . . . F–74Note 9 Income Taxes . . . . . . . . . . . . . . . . . . . . . . . . . . . . . . . . . . . . . . . . . . . . . . . . . . . . . . . . . . . . . . . . . . F–75Note 10 Commitments and Contingencies . . . . . . . . . . . . . . . . . . . . . . . . . . . . . . . . . . . . . . . . . . . . . . . . . . F–75Note 11 Related Party Transactions . . . . . . . . . . . . . . . . . . . . . . . . . . . . . . . . . . . . . . . . . . . . . . . . . . . . . . . F–76Note 12 Revenue Recognition . . . . . . . . . . . . . . . . . . . . . . . . . . . . . . . . . . . . . . . . . . . . . . . . . . . . . . . . . . . . F–77Note 13 Net Loss per Share . . . . . . . . . . . . . . . . . . . . . . . . . . . . . . . . . . . . . . . . . . . . . . . . . . . . . . . . . . . . . . F–77Note 14 Segment Reporting . . . . . . . . . . . . . . . . . . . . . . . . . . . . . . . . . . . . . . . . . . . . . . . . . . . . . . . . . . . . . F–78Note 15 Subsequent Events . . . . . . . . . . . . . . . . . . . . . . . . . . . . . . . . . . . . . . . . . . . . . . . . . . . . . . . . . . . . . . F–79
F-66

Krispy Kreme, Inc.Notes to Condensed Consolidated Financial Statements (Unaudited)
(Dollars in thousands, unless otherwise specified)
Note 1 — Description of Business and Summary of Significant Accounting Policies
Description of Business
Krispy Kreme, Inc. (“KKI”) and its subsidiaries (collectively, the “Company”) operates through its omni-channelbusiness model to provide an experiential consumer experience and produce doughnuts for fresh retail, DeliveredFresh Daily (“DFD”), e-Commerce and delivery and Krispy Kreme branded sweet treats (“Branded Sweet TreatLine”) distribution channels, ensuring that consumers are able to access products in numerous ways.
The Company has three reportable operating segments: 1) U.S. and Canada, which includes all Krispy Kreme’scompany-owned operations in the U.S. and Canada, Insomnia-branded retail shops and consumer packagedgoods operations; 2) International, which includes all Krispy Kreme’s company-owned operations in the UnitedKingdom, Ireland, Australia, New Zealand and Mexico; and 3) Market Development, which includes franchiseoperations across the globe, as well as Krispy Kreme company-owned shops in Japan. Unallocated corporatecosts are excluded from the Company’s measurement of segment performance.
Basis of Presentation and Consolidation
The Company operates and reports financial information on a 52 or 53-week year with the fiscal year ending onthe Sunday closest to December 31. The data periods contained within fiscal years 2020 and 2021 reflect theresults of operations for the 53-week period ended January 3, 2021 and the 52-week period ended January 2,2022, respectively. The quarters ended April 4, 2021 and March 29, 2020 were both 13-week periods. OnMay 10, 2021, Krispy Kreme HoldCo, Inc. changed its name to Krispy Kreme, Inc.
The unaudited Condensed Consolidated Financial Statements include the accounts of KKI and subsidiaries andhave been prepared in accordance with accounting principles generally accepted in the United States of America(“U.S. GAAP”) for interim financial information and pursuant to the rules and regulations of the Securities andExchange Commission. Accordingly, these interim financial statements do not include all information andfootnotes required under U.S. GAAP for complete financial statements. In the opinion of management, theaccompanying unaudited Condensed Consolidated Financial Statements contain all adjustments, consisting ofonly normal recurring adjustments, necessary for a fair statement of results of operations, balance sheet, cashflows, and shareholders’ equity for the periods presented. All significant intercompany balances and transactionsamong KKI and subsidiaries have been eliminated in consolidation. Investments in entities over which theCompany has the ability to exercise significant influence but which it does not control and whose financialstatements are not otherwise required to be consolidated, are accounted for using the equity method.
These condensed consolidated interim financial statements should be read in conjunction with the ConsolidatedFinancial Statements and notes thereto as of and for the year ended January 3, 2021, included elsewhere in thisprospectus. The Condensed Consolidated Balance Sheet as of January 3, 2021 was derived from audited annualfinancial statements but does not contain all of the footnote disclosures from the annual financial statements. Theresults of operations for the quarter ended April 4, 2021 are not necessarily indicative of the results of operationsthat may be achieved for the entire fiscal year ending January 2, 2022.
Noncontrolling interest in the Company’s Condensed Consolidated Financial Statements represents the interest insubsidiaries held by joint venture partners and employee shareholders. The joint venture partners holdnoncontrolling interests in the Company’s consolidated subsidiaries, Awesome Doughnut, LLC (“AwesomeDoughnut”) and W.K.S Krispy Kreme, LLC (“WKS Krispy Kreme”). Employee shareholders holdnoncontrolling interests in the consolidated subsidiaries Krispy Kreme Holdings Inc. (“KKHI”), Krispy KremeHolding UK Ltd. (“KKUK”), Krispy Kreme Holdings Pty Ltd (“KK Australia”), Krispy Kreme Mexico S. de
F-67

R.L. de C.V. (“KK Mexico”) and Insomnia Cookies Holdings, LLC (“Insomnia Cookies”). Since the Companyconsolidates the financial statements of these subsidiaries, the noncontrolling owners’ share of each subsidiary’snet assets and results of operations are deducted and reported as a noncontrolling interest on the CondensedConsolidated Balance Sheets and as net income attributable to noncontrolling interest in the CondensedConsolidated Statements of Operations and comprehensive income attributable to noncontrolling interest in theCondensed Consolidated Statements of Comprehensive Income.
Summary of Significant Accounting Policies
The Company’s significant accounting policies are described in Note 1, “Description of Business and Summaryof Significant Accounting Policies,” to the Consolidated Financial Statements for the year ended January 3, 2021.There have been no material changes to the significant accounting policies during the quarter ended April 4,2021.
Recent Accounting Pronouncements
In December 2019, the Financial Accounting Standards Board (“FASB”) issued Accounting Standards Update(“ASU”) 2019-12, Income Taxes (Topic 740) Simplifying the Accounting for Income Taxes. ASU 2019-12simplifies the accounting for income taxes by removing certain exceptions in Topic 740 and clarifying andamending existing guidance. The Company adopted ASU 2019-12 at the beginning of fiscal year 2021, and theadoption had no material impact to the Company’s Condensed Consolidated Financial Statements.
In March 2020, the FASB issued ASU 2020-04, Reference Rate Reform (Topic 848): Facilitation of the Effects ofReference Rate Reform on Financial Reporting, which provides companies with optional guidance to ease thepotential accounting burden associated with transitioning away from reference rates that are expected to bediscontinued. It is effective for all entities as of March 12, 2020 through December 31, 2022. A company mayelect to apply the amendments for contract modifications by as of any date from the beginning of an interimperiod that includes or is subsequent to March 12, 2020, or prospectively from a date within an interim periodthat includes or is subsequent to March 12, 2020, up to the date that the financial statements are available to beissued. The Company is currently evaluating the effect of the new guidance on its Condensed ConsolidatedFinancial Statements and related disclosures.
Note 2 — Acquisitions
2021 Acquisitions
Acquisitions of Krispy Kreme Shops in 2021
In the quarter ended April 4, 2021, the Company acquired the business and operating assets of an additional twofranchisees, collectively consisting of 17 Krispy Kreme shops in the United States. The Company paid totalconsideration of $38.1 million, consisting of $33.6 million cash, $1.2 million consideration payable to the sellerswithin 12 months of the respective acquisition dates, and $3.3 million settlement of amounts related topre-existing relationships, to acquire substantially all of the shops’ assets. Consideration payable of $1.2 millionwas withheld to cover indemnification claims that could arise after closing. Absent any claims, these amounts arepayable within 12 months of the respective acquisition dates.
The settlement of pre-existing relationships included in the purchase consideration includes the write-off ofaccounts and notes receivable, net of deferred revenue, of $0.6 million. It also includes the disposal of thefranchise intangible asset related to the two franchisees recorded at time of the acquisition of Krispy KremeDoughnuts by JAB Holding Company. The net book value of the franchise intangible asset was a cumulative$2.7 million at the dates of acquisition of the franchisees. The Company accounted for the transactions asbusiness combinations.
F-68

The following table summarizes the preliminary fair values of assets acquired and liabilities assumed as of thedate of acquisition for the acquisitions above.
KK U.S. Shops
Assets acquired:Cash, cash equivalents and restricted cash . . . . . . . . $ 40Other current assets . . . . . . . . . . . . . . . . . . . . . . . . . 511Property and equipment, net . . . . . . . . . . . . . . . . . . . 3,829Other intangible assets . . . . . . . . . . . . . . . . . . . . . . . 23,906Operating lease right of use asset . . . . . . . . . . . . . . . 19,292Other assets . . . . . . . . . . . . . . . . . . . . . . . . . . . . . . . . 115
Total identified assets acquired . . . . . . . . . . . 47,693
Liabilities assumed:Accrued liabilities . . . . . . . . . . . . . . . . . . . . . . . . . . . (334)Current operating lease liabilities . . . . . . . . . . . . . . . (2,093)Noncurrent operating lease liabilities . . . . . . . . . . . . (17,199)
Total liabilities assumed . . . . . . . . . . . . . . . . . (19,626)Goodwill . . . . . . . . . . . . . . . . . . . . . . . . . . . . . . . . . . 9,999
Purchase consideration, net . . . . . . . . . . . . . . $ 38,066
Transaction costs in 2021 (approx.) . . . . . . . . . . . . . $ 1,192Transaction costs in 2020 (approx.) . . . . . . . . . . . . . 184Reportable segment(s) . . . . . . . . . . . . . . . . . . . . . . . U.S. and Canada
During the measurement period, the Company will continue to obtain information to assist in determining the fairvalue of net assets acquired, which may differ materially from these preliminary estimates. Measurement periodadjustments, if applicable, will be applied in the reporting period in which the adjustment amounts aredetermined.
2020 Acquisitions
In the second half of fiscal year 2020, the Company acquired all equity interests in Krispy Kreme DoughnutJapan Co., Ltd. (“KK Japan”) and the business and operating assets of an additional eight franchisees in theUnited States. The valuation for the acquisitions requires significant estimates and assumptions. The estimatesare inherently uncertain and subject to revision as additional information is obtained during the measurementperiod for the acquisitions. Measurement period changes for the 2020 acquisitions did not have a material impactto the Condensed Consolidated Financial Statements for the quarter ended April 4, 2021.
Note 3 — Inventories
The components of Inventories are as follows:
April 4, 2021 January 3, 2021
Raw materials . . . . . . . . . . . . . . . . . . . . . . . . . . . . . $15,380 $16,263Work in progress . . . . . . . . . . . . . . . . . . . . . . . . . . . 570 871Finished goods and purchased merchandise . . . . . . 22,012 21,385
Total Inventories . . . . . . . . . . . . . . . . . . . . . . $37,962 $38,519
F-69

Note 4 — Goodwill and Other Intangible Assets
Goodwill
Changes in the carrying amount of goodwill by reportable segment are as follows:
U.S and Canada InternationalMarket
Development Total
Balance as of January 3, 2021 . . . . . . . . . . . . . . . . . . . $642,704 $290,872 $152,970 $1,086,546Acquisitions . . . . . . . . . . . . . . . . . . . . . . . . . . . . . . 27,523 — (17,524) 9,999Measurement periods adjustments related to fiscal
year 2020 acquisitions . . . . . . . . . . . . . . . . . . . . 186 — — 186Foreign currency impact . . . . . . . . . . . . . . . . . . . . . — (462) — (462)
Balance as of April 4, 2021 . . . . . . . . . . . . . . . . . . . . . . $670,413 $290,410 $135,446 $1,096,269
Acquisitions of franchises result in a reclassification of goodwill between segments.
Other intangible assets
Other intangible assets consist of the following:
April 4, 2021 January 3, 2021
GrossCarryingAmount
AccumulatedAmortization Net Amount
GrossCarryingAmount
AccumulatedAmortization Net Amount
Intangible assets withindefinite lives
Trade name . . . . . . . . . . . . . . . . $ 657,900 $ — $ 657,900 $ 657,900 $ — $657,900Intangible assets with definite
livesFranchise agreements . . . . . . . . 32,961 (7,305) 25,656 36,254 (7,519) 28,735Customer relationships . . . . . . 15,000 (4,035) 10,965 15,000 (3,819) 11,181Reacquired franchise rights . . . 381,590 (65,870) 315,720 358,095 (59,432) 298,663Website development costs . . . 6,500 (5,507) 993 6,500 (4,965) 1,535
Total intangible assets withdefinite lives . . . . . . . . . . . . 436,051 (82,717) 353,334 415,849 (75,735) 340,114
Total intangible assets . . . . . . $1,093,951 $(82,717) $1,011,234 $1,073,749 $(75,735) $998,014
Amortization expense related to intangible assets included in depreciation and amortization expense was$7.4 million and $6.4 million for the quarters ended April 4, 2021 and March 29, 2020, respectively.
F-70

Note 5 — Leases
The Company included the following amounts related to operating and finance assets and liabilities within theCondensed Consolidated Balance Sheets:
As of
April 4, 2021 January 3, 2021
Assets ClassificationOperating lease . . . . . . . . . . . . . . . . . Operating lease right of use asset, net $409,485 $399,688Finance lease . . . . . . . . . . . . . . . . . . . Property and equipment, net 25,019 23,556
Total leased assets . . . . . . . . . . . . . . $434,504 $423,244
LiabilitiesCurrentOperating lease . . . . . . . . . . . . . . . . . Current operating lease liabilities $ 46,500 $ 45,675Finance lease . . . . . . . . . . . . . . . . . . . Current portion of long-term debt 2,581 6,245NoncurrentOperating lease . . . . . . . . . . . . . . . . . Noncurrent operating lease liabilities 385,207 376,099Finance lease . . . . . . . . . . . . . . . . . . . Long-term debt, less current portion 24,398 19,979
Total leased liabilities . . . . . . . . . . . $458,686 $447,998
Lease costs were as follows:
For Quarters Ended
April 4, 2021 March 29, 2020
Lease cost ClassificationOperating lease cost . . . . . . . . . . . . . . Selling, general and administrative expense $ 710 $ 819Operating lease cost . . . . . . . . . . . . . . Operating expenses 20,338 17,489Short-term lease cost . . . . . . . . . . . . . Operating expenses 772 632Variable lease costs . . . . . . . . . . . . . . Operating expenses 3,079 3,213Sublease income . . . . . . . . . . . . . . . . . Royalties and other revenues (80) (109)Finance lease cost:Amortization of right-of-use assets . . Depreciation and amortization expense 798 1,000Interest on lease liabilities . . . . . . . . . Interest expense, net $ 593 $ 226
Supplemental disclosures of cash flow information related to leases were as follows:
For Quarters Ended
April 4, 2021 March 29, 2020
Other informationCash paid for amounts included in the measurement
of lease liabilities:Operating cash flows from operating leases . . . . . . $22,196 $19,116Operating cash flows from finance leases . . . . . . . . 512 489Financing cash flows from finance leases . . . . . . . . 879 1,083Right-of-use assets obtained in exchange for new
lease liabilities:Operating leases . . . . . . . . . . . . . . . . . . . . . . . . . . . . 26,275 4,177Finance leases . . . . . . . . . . . . . . . . . . . . . . . . . . . . . . $ 1,788 $ 6,686
The Company did not terminate any leases for the quarters ended April 4, 2021 and March 29, 2020.
F-71

Note 6 — Fair Value Measurements
The following table presents assets and liabilities that are measured at fair value on a recurring basis as ofApril 4, 2021 and January 3, 2021:
April 4, 2021
Level 1 Level 2 Level 3
Assets:401(k) mirror plan assets . . . . . . . . . . . . . . . . . . . . . . . . . . . . . $242 $ — $—Commodity derivatives . . . . . . . . . . . . . . . . . . . . . . . . . . . . . . — 1,413 —
$242 $ 1,413 $—
Liabilities:Foreign currency derivative . . . . . . . . . . . . . . . . . . . . . . . . . . . — 423 —Interest rate derivative . . . . . . . . . . . . . . . . . . . . . . . . . . . . . . . — 26,010 —
$— $26,433 $—
January 3, 2021
Level 1 Level 2 Level 3
Assets:401(k) mirror plan assets . . . . . . . . . . . . . . . . . . . . . . . . . . . . . $237 $ — $—Foreign currency derivative . . . . . . . . . . . . . . . . . . . . . . . . . . . — 131 —Commodity derivatives . . . . . . . . . . . . . . . . . . . . . . . . . . . . . . — 420 —
$237 $ 551 $—
Liabilities:Interest rate derivative . . . . . . . . . . . . . . . . . . . . . . . . . . . . . . . — 32,813 —
$— $32,813 $—
There were no transfers of financial assets or liabilities among the levels within the fair value hierarchy duringthe quarter ended April 4, 2021 and fiscal year ended January 3, 2021.
Note 7 — Derivative Instruments
Commodity Price Risk
The Company uses forward and option currency contracts as well as purchase swaps to protect against the effectsof commodity price fluctuations in the cost of ingredients of its products, of which flour, sugar and shortening arethe most significant, and cost of gasoline used by its delivery vehicles. Management has not designated theseforward contracts as hedges. As of April 4, 2021 and January 3, 2021, the total notional amount of commodityderivatives was 2.6 million and 3.0 million gallons of gasoline, respectively. They were scheduled to maturebetween April 5, 2021 and December 1, 2022 and January 4, 2021 and December 1, 2022, respectively. As ofApril 4, 2021 and January 3, 2021, the Company has recorded an asset of $1.4 million and $0.4 million,respectively, related to the fair market values of its commodity derivatives.
Interest Rate Risk
The Company is exposed to interest rate risk related to its borrowing obligations. From time to time, theCompany enters into interest rate swap arrangement to manage the risk. Management has designated the swapagreements as cash flow hedges and recognized the changes in the fair value of these swaps in othercomprehensive income. As of April 4, 2021 and January 3, 2021, the Company has recorded liabilities of$26.0 million and $32.8 million, respectively, related to the fair market values of its interest rate derivatives. The
F-72

cash flows associated with the interest rate swaps are reflected in the operating activities in the CondensedConsolidated Statements of Cash Flows, which is consistent with the classification as operating activities of theinterest payments on the term loan.
Foreign Currency Exchange Rate Risk
The Company is exposed to foreign currency risk primarily from its investments in consolidated subsidiaries thatoperate in the United Kingdom, Ireland, Australia, New Zealand, Mexico and Japan. In order to mitigate foreignexchange fluctuations, the Company enters into foreign exchange forward contracts. Management has notdesignated these forward contracts as hedges. As of April 4, 2021 and January 3, 2021, the total notional amountof foreign exchange derivatives was $30.4 million and $26.7 million, respectively. They were scheduled tomature in April 2021 and January 2021, respectively. The Company recorded a liability of $0.4 million and anasset of $0.1 million as of April 4, 2021 and January 3, 2021, respectively, related to the fair market values of itsforeign exchange derivatives.
Quantitative Summary of Derivative Positions and Their Effect on Results of Operations
The following tables present the fair values of derivative instruments included in the Condensed ConsolidatedBalance Sheets as of April 4, 2021 and January 3, 2021, for derivatives not designated as hedging instrumentsand derivatives designated as hedging instruments, respectively. The Company only has cash flow hedges thatare designated as hedging instruments.
Derivatives Fair Value
Derivatives Not Designated as HedgingInstruments
April 4,2021
January 3,2021 Balance Sheet Location
Foreign currency derivatives . . . . . . . $ — $ 131 Prepaid expense and other current assetsCommodity derivatives . . . . . . . . . . . . 1,413 420 Prepaid expense and other current assets
$ 1,413 $ 551
Foreign currency derivatives . . . . . . . $ 423 $ — Accrued liabilities
$ 423 $ —
Derivatives Fair Value
Derivatives Designated as HedgingInstruments
April 4,2021
January 3,2021 Balance Sheet Location
Interest rate derivatives . . . . . . . . . . . . $ 9,787 $10,235 Accrued liabilitiesInterest rate derivatives . . . . . . . . . . . . 16,223 22,578 Other long-term obligations and deferred credits
$26,010 $32,813
The effect of derivative instruments on the Condensed Consolidated Statements of Operations for the quartersended April 4, 2021 and March 29, 2020 is as follows:
Amount of Derivative Gain (Loss)Recognized in Income for the
Quarters Ended
Derivatives Designated as Hedging Instruments April 4, 2021 March 29, 2020Location of Derivative Gain (Loss)
Recognized in Income
Loss on interest rate derivatives . . . . . . . . . . . . . $(2,530) $ (695) Interest expense, net
$(2,530) $ (695)
F-73

Amount of Derivative Gain (Loss)Recognized in Income for the
Quarters Ended
Derivatives Not Designated as Hedging Instruments April 4, 2021 March 29, 2020Location of Derivative Gain (Loss)
Recognized in Income
(Loss)/gain on foreign currency . . . . . . . . . . . . .$ (611) $ 480
Other non-operatingexpense/(income), net
Gain/(loss) on commodity derivatives . . . . . . . .993 (2,293)
Other non-operatingexpense/(income), net
$ 382 $(1,813)
Note 8 — Share-based Compensation
Restricted stock unit (“RSU”) activity under the Company’s various plans during the periods presented is asfollows:
Non-vestedshares
outstanding atJanuary 3,
2021 Granted Vested Forfeited
Non-vestedshares
outstanding atApril 4,
2021
KKHIRSUs . . . . . . . . . . . . . . . . . . . . . . . . . . . . . . . . . . . 843,488 87,511 27,274 29,306 874,419Weighted Average Grant Date Fair Value . . . . . . $ 62.69 100.42 49.50 70.12 $ 66.63
KKUKRSUs . . . . . . . . . . . . . . . . . . . . . . . . . . . . . . . . . . . 404,568 — — — 404,568Weighted Average Grant Date Fair Value . . . . . . $ 12.45 — — — $ 12.45
Insomnia CookiesRSUs . . . . . . . . . . . . . . . . . . . . . . . . . . . . . . . . . . . 29,279 15,173 — 1,908 42,544Weighted Average Grant Date Fair Value . . . . . . $ 68.87 97.77 — 69.98 $ 79.12
KK AustraliaRSUs . . . . . . . . . . . . . . . . . . . . . . . . . . . . . . . . . . . 1,844,241 78,534 — — 1,922,775Weighted Average Grant Date Fair Value . . . . . . $ 1.48 1.45 — — $ 1.48
KK MexicoRSUs . . . . . . . . . . . . . . . . . . . . . . . . . . . . . . . . . . . 25,055 167 — — 25,222Weighted Average Grant Date Fair Value . . . . . . $ 29.21 28.69 — — $ 29.21
The Company recorded total non-cash compensation expense related to RSUs under the plans of $2.4 million and$3.2 million for the quarters ended April 4, 2021 and March 29, 2020, respectively.
The unrecognized compensation cost related to the unvested RSUs and the weighted-average period over whichsuch cost is expected to be recognized are as follows:
As of April 4, 2021
Unrecognizedcompensation
cost
Recognized over aweighted-average
period of
KKHI . . . . . . . . . . . . . . . . . . . . . . . . . . . . . . . . . . $27,913 2.1 yearsKKUK . . . . . . . . . . . . . . . . . . . . . . . . . . . . . . . . . 590 0.4 yearsInsomnia Cookies . . . . . . . . . . . . . . . . . . . . . . . . 2,771 3.7 yearsKK Australia . . . . . . . . . . . . . . . . . . . . . . . . . . . . 1,061 1.8 yearsKK Mexico . . . . . . . . . . . . . . . . . . . . . . . . . . . . . $ 684 4.2 years
The estimated fair value of restricted stock is calculated using a market approach (i.e. market multiple is used forthe KKHI, KKUK and Insomnia Cookies’ plans and an agreed-upon EBITDA buyout multiple is used for KKAustralia and KK Mexico plans).
F-74

Note 9 — Income Taxes
For interim tax reporting, the Company estimates a worldwide annual effective tax rate and applies that rate tothe year-to-date ordinary income/(loss). The tax effects of significant unusual or infrequently occurring items areexcluded from the estimated annual effective tax rate calculation and recognized in the interim period in whichthey occur.
The Company’s effective income tax rates for the quarters ended April 4, 2021 and March 29, 2020 were223.13% and 11.42%, respectively. The Company’s effective income tax rate for the quarter ended April 4, 2021was unusual given an insignificant discrete item and pre-tax income that was close to break-even during theperiod. The Company’s effective income tax rates were also impacted by the mix of income and taxesattributable to foreign jurisdictions.
Note 10 — Commitments and Contingencies
Except as disclosed below, the Company currently is not a party to any material legal proceedings.
Pending Litigation
K2 Asia litigation
On April 7, 2009, a Cayman Islands corporation, K2 Asia Ventures and its owners filed a lawsuit in ForsythCounty, North Carolina Superior Court against the Company, the Company’s franchisee in the Philippines andother persons associated with the franchisee. The suit alleges that the Company and the other defendantsconspired to deprive the plaintiffs of claimed “exclusive rights” to negotiate franchise and developmentagreements with prospective franchisees in the Philippines and sought at least $3.0 million. The Companybelieves that these allegations lack merit and continues to vigorously defend against the lawsuit. After the NorthCarolina Court of Appeals denied the plaintiff’s petition for rehearing en banc, the plaintiff filed with the NorthCarolina Supreme Court a petition for discretionary review on November 2, 2020. The Company filed a responseto this petition on November 16, 2020. The Company is awaiting a decision from the Court. The Company doesnot believe it is probable that a loss has been incurred with respect to this matter, and accordingly no liabilityrelated to it has been reflected in the accompanying financial statements.
Insomnia Cookies litigation related to employee wages
Insomnia Cookies was a party to a class action lawsuit alleging violations of minimum wage laws, overtime lawsand attendant recordkeeping requirements. The complaint alleged that Insomnia Cookies did not (i) properlyreimburse delivery employees for personal expenses incurred while making deliveries, (ii) properly notifydelivery employees regarding tip credits and (iii) calculate overtime pay correctly. Insomnia Cookies settled withplaintiff for approximately $1.5 million during the year ended January 3, 2021 which was previously accrued at$2.0 million as of December 29, 2019.
Insomnia Cookies is currently a party to a class action lawsuit alleging violations of unfair competition, unpaidminimum wages, unpaid overtime, meal and rest period violations and unpaid premiums, failure to reimburse forbusiness expenses, untimely paid wages, and violation of the California Private Attorneys General Act. InsomniaCookies vigorously disputes these claims. On March 11, 2021, the parties participated in a mediation and reacheda class wide settlement and release of claims in principle for $0.4 million. The parties have executed amemorandum of understanding memorializing the key settlement terms and are in the process of finalizing longform settlement documents and seeking preliminary court approval of the settlement.
TSW Food, LLC litigation
On November 13, 2020, TSW Foods, LLC (“TSW”), a reseller of certain Krispy Kreme packaged products, fileda demand for arbitration and statement of claim alleging Anticipatory Repudiation of the Master Reseller
F-75

Agreement, Breach of the Master Reseller Agreement, and Breach of the Implied Covenant of Good Faith andFair Dealing. On December 12, 2020, the Company filed its answering statement denying all of TSW’s claims.On February 8, 2021, the Company filed its counterclaim against TSW alleging Breach of Master ResellerAgreement, Breach of Trade Secret Agreement, and Breach of Good Faith and Fair Dealing. On March 5, 2021,TSW filed its answering statement denying all of the Company’s claims. The Company intends to vigorouslydefend against TSW’s claims and prosecute its counterclaims. At this time the Company is unable to predict theoutcome of this matter, the potential loss or range of loss, if any, associated with the resolution of this matter orany potential effect it may have on the Company or its operations.
Other Legal Matters
The Company also is engaged in various legal proceedings arising in the normal course of business. TheCompany maintains insurance policies against certain kinds of such claims and suits, including insurance policiesfor workers’ compensation and personal injury, all of which are subject to deductibles. While the ultimateoutcome of these matters could differ from management’s expectations, management currently does not believetheir resolution will have a material adverse effect on the Company’s Condensed Consolidated FinancialStatements.
Other Commitments and Contingencies
One of the Company’s primary banks issued letters of credit on its behalf totaling $13.5 million and$14.0 million as of April 4, 2021 and January 3, 2021, respectively, substantially all of which secure theCompany’s reimbursement obligations to insurers under its self-insurance arrangements.
Note 11 — Related Party Transactions
As of April 4, 2021 and January 3, 2021, the Company had an equity ownership in two franchisees, KremeWorksUSA, LLC (20% ownership) and KremeWorks Canada, L.P. (25% ownership), with an aggregate carrying valueof $0.8 million and $0.9 million as of April 4, 2021 and January 3, 2021, respectively. Revenues from sales ofingredients and equipment to these franchisees were $1.8 million and $1.7 million for the quarters ended April 4,2021 and March 29, 2020, respectively. Royalty revenue from these franchisees was $0.3 million for bothquarters ended April 4, 2021 and March 29, 2020. Trade receivables from these franchisees are included inAccounts receivable, net on the Condensed Consolidated Balance Sheets, which were $0.5 million and$0.4 million as of April 4, 2021 and January 3, 2021, respectively.
Keurig Dr Pepper Inc. (KDP), an affiliated company of JAB, licenses the Krispy Kreme trademark for theCompany in the manufacturing of portion packs for the Keurig brewing system. KDP also sells beverageconcentrates and packaged beverages to Krispy Kreme for resale through Krispy Kreme’s shops. Licensingrevenue from KDP was $0.5 million for both quarters ended April 4, 2021 and March 29, 2020.
The Company had service agreements with BDT Capital Partners, LLC (BDT), a minority investor in KKI, toprovide advisory services to the Company, including valuation services related to certain acquisitions. TheCompany recognized expenses of $0.6 million and $0.5 million related to the service agreements with BDT forthe quarters ended April 4, 2021 and March 29, 2020, respectively.
In connection with tax sharing arrangements with JAB and other JAB portfolio companies, the Company had a$7.4 million related party receivable from JAB as of both April 4, 2021 and January 3, 2021. In addition, theCompany had a $15.3 million related party payable to the other JAB portfolio companies as of both April 4, 2021and January 3, 2021, offset by a $15.3 million income tax receivable due from taxing authorities, respectively.
The Company is party to a senior unsecured note agreement (the “original agreement”) with Krispy Kreme G.P.(“KK GP”). In the original agreement, which was outstanding prior to fiscal year ended December 30, 2018, the
F-76

aggregate principal amount was $283.1 million. In April 2019, the Company entered into an additional unsecurednote with KK GP for $54.0 million (the “additional agreement”). As of April 4, 2021, and January 3, 2021, theoutstanding amount of principal and interest was $350.1 million and $344.6 million, respectively. The interestexpense was $5.6 million for both quarters ended April 4, 2021 and March 29, 2020.
The Company granted loans to employees of KKHI, KKUK, KK Australia, KK Mexico and Insomnia Cookiesfor the purchase of shares in those subsidiaries. The loan balance was $18.2 million and $18.7 million as ofApril 4, 2021 and January 3, 2021, respectively, and it is presented as a reduction from Shareholders’ equity onthe Condensed Consolidated Balance Sheet. Each of such loans have been repaid in full as of May 14, 2021.
Note 12 — Revenue Recognition
Disaggregation of Revenue
Revenues are disaggregated as follows:Quarters Ended
April 4,2021
March 29,2020
Company shops, Branded Sweet Treat Line and DFD . . . $300,495 $230,614Mix and equipment revenue from franchisees . . . . . . . . . 13,090 20,922Franchise royalties, and other . . . . . . . . . . . . . . . . . . . . . . 8,224 9,680
$321,809 $261,216
Other revenues include advertising fund contributions, rental income, development and franchise fees andlicensing royalties from Keurig related to Krispy Kreme brands coffee sales.
Contract Balances
Deferred revenue subject to Accounting Standards Codification Topic 606, Revenue from Contracts withCustomers, and related receivables are as follows:
April 4,2021
January 3,2021 Balance Sheet Classification
Trade receivables, net of allowances of$1,073 and $1,437, respectively . . . . $32,423 $39,624 Accounts receivables, net
Deferred revenueCurrent . . . . . . . . . . . . . . . . . . . . . . 15,927 16,045 Accrued liabilitiesNon-current . . . . . . . . . . . . . . . . . . 2,812 2,838 Other long-term obligations and deferred credits
$18,739 $18,883
Note 13 — Net Loss per Share
The following table presents the calculations of basic and diluted EPS:Quarters Ended
(In thousands, except share and per share amounts)April 4,
2021March 29,
2020
Net loss attributable to Krispy Kreme, Inc. . . . . . . . . . . . . . . . . . . . . . $ (3,061) $(11,515)Adjustment to net loss attributable to common shareholders . . . (141) 106
Net loss attributable to common shareholders - Basic . . . . . . . . . . . . . $ (3,202) $(11,409)Additional income attributed to noncontrolling interest due to
subsidiary potential common shares . . . . . . . . . . . . . . . . . . . . (85) (8)Net loss attributable to common shareholders - Diluted . . . . . . . . . . . $ (3,287) $(11,417)Basic and Diluted weighted average common shares outstanding . . . 71,626 71,626Loss per share attributable to common shareholders: . . . . . . . . . .
Basic . . . . . . . . . . . . . . . . . . . . . . . . . . . . . . . . . . . . . . . . . . . . . . . $ (44.71) $(159.29)Diluted . . . . . . . . . . . . . . . . . . . . . . . . . . . . . . . . . . . . . . . . . . . . . $ (45.89) $(159.39)
F-77

Potential dilutive shares consist of unvested RSUs, calculated using the treasury stock method. The calculation ofdilutive shares outstanding excludes certain unvested RSUs granted under certain subsidiaries’ executive ownershipplans and long-term incentive plans, because their inclusion would have been antidilutive. Refer to Note 8, Share-based Compensation, to the Condensed Consolidated Financial Statements for further information about the plans.
The following table summarizes the number of unvested RSUs excluded due to antidilution:
Quarters Ended
April 4,2021
March 29,2020
KKHI . . . . . . . . . . . . . . . . . . . . . . . . . . . . . . . . . . . . . . . . . — 773,863KKUK . . . . . . . . . . . . . . . . . . . . . . . . . . . . . . . . . . . . . . . . 3,258 416,068Insomnia Cookies . . . . . . . . . . . . . . . . . . . . . . . . . . . . . . . — 28,280KK Australia . . . . . . . . . . . . . . . . . . . . . . . . . . . . . . . . . . . 1,922,775 —KK Mexico . . . . . . . . . . . . . . . . . . . . . . . . . . . . . . . . . . . . 25,222 —
Note 14 — Segment Reporting
The Company conducts business through the three reportable segments: U.S. and Canada, International, andMarket Development. Unallocated corporate costs are excluded from the Company’s measurement of segmentperformance. These costs include general corporate expenses.
The reportable segment results are as follows:
Quarters Ended
April 4,2021
March 29,2020
Net revenues:U.S. and Canada . . . . . . . . . . . . . . . . . . . . . . . . . . . . . . . . $222,470 $170,450International . . . . . . . . . . . . . . . . . . . . . . . . . . . . . . . . . . . 66,506 60,659Market Development . . . . . . . . . . . . . . . . . . . . . . . . . . . . . 32,833 30,107
Total net revenues . . . . . . . . . . . . . . . . . . . . . . . . . . $321,809 $261,216
Quarters Ended
April 4,2021
March 29,2020
Segment adjusted EBITDA:U.S. and Canada . . . . . . . . . . . . . . . . . . . . . . . . . . . . . . . . . . $28,731 $ 22,860International . . . . . . . . . . . . . . . . . . . . . . . . . . . . . . . . . . . . . 15,571 11,268Market Development . . . . . . . . . . . . . . . . . . . . . . . . . . . . . . 10,891 10,712Corporate . . . . . . . . . . . . . . . . . . . . . . . . . . . . . . . . . . . . . . . (7,399) (7,091)
47,794 37,749Interest expense, net . . . . . . . . . . . . . . . . . . . . . . . . . . . . . . . 8,249 8,644Interest expense — related party . . . . . . . . . . . . . . . . . . . . . 5,566 5,566Income tax expense/(benefit) . . . . . . . . . . . . . . . . . . . . . . . . 685 (1,412)Depreciation and amortization expense . . . . . . . . . . . . . . . . 23,401 19,087Share-based compensation . . . . . . . . . . . . . . . . . . . . . . . . . . 2,368 3,170Other non-operating (income)/expense, net . . . . . . . . . . . . . (442) 2,548Pre-opening costs and related expenses(1) . . . . . . . . . . . . . . 1,391 3,877Strategic initiatives(2) . . . . . . . . . . . . . . . . . . . . . . . . . . . . . . — 3,613Acquisition and integration expenses(3) . . . . . . . . . . . . . . . . 2,152 3,611
Other(4) . . . . . . . . . . . . . . . . . . . . . . . . . . . . . . . . . . . . . 4,802 (7)
Net income (loss) . . . . . . . . . . . . . . . . . . . . . . . . . . . . $ (378) $(10,948)
F-78

1. Consists of pre-opening costs as reflected within the Condensed Consolidated Statement of Operations andadditional incremental related costs. Pre-opening costs, which include rent, labor and marketing expensesincurred prior to opening a new shop, were $1.4 million and $3.4 million for the quarters ended April 4,2021 and March 29, 2020, respectively. Additional incremental related costs of $0.5 million for the quarterended March 29, 2020 related to the Company’s New York City flagship Hot Light Theater Shop openingand consisted of additional consulting and training costs incurred and reflected in selling, general andadministrative expenses.
2. The quarter ended March 29, 2020 consists mainly of consulting and advisory fees, personnel transitioncosts, and network conversion and set-up costs related to the transformation of the Company’s legacywholesale business in the United States. This transformation was completed by the end of fiscal year 2020.
3. Consists of acquisition and integration-related costs in connection with the Company’s business andfranchise acquisitions, including legal, due diligence, consulting and advisory fees incurred in connectionwith acquisition-related activities for the applicable period.
4. The quarter ended April 4, 2021 consists primarily of $3.5 million of consulting and advisory fees incurredin connection with preparation for the Company’s initial public offering.
Note 15 — Subsequent Events
The Company evaluated subsequent events and transactions for potential recognition or disclosure in theCondensed Consolidated Financial Statements through May 28, 2021, the date the Condensed ConsolidatedFinancial Statements were available to be issued. All subsequent events requiring recognition and disclosurehave been incorporated into these financial statements.
On April 9, 2021, the Company received $144.1 million in capital contributions from shareholders and otherminority interest investors. This amount was used to to repay a portion of the outstanding debt balance under the2019 Facility and will be accounted for as a capital contribution in the Condensed Consolidated Statements ofChanges in Shareholders’ Equity.
During May 2021, the Company granted stock options and RSUs to certain employees and members of the Boardof Directors of KKHI. The estimated fair values of the stock options and RSUs were $29.1 million and$55.9 million, respectively.
Subsequent to the quarter ended April 4, 2021, the Company settled $14.6 million of the loans to employees ofKKHI for the purchase of shares. Refer to Note 11, Related Party Transactions, to the Condensed ConsolidatedFinancial Statement for discussion of the loans.
F-79

Through and including , 2021 (the 25th day after the date of this prospectus), all dealers effectingtransactions in these securities, whether or not participating in this offering, may be required to deliver aprospectus. This is in addition to a dealer’s obligation to deliver a prospectus when acting as anunderwriter and with respect to an unsold allotment or subscription.
26,666,667 Shares
Krispy Kreme, Inc.Common Stock
PRELIMINARY PROSPECTUS
J.P. Morgan Morgan Stanley
BofA Securities Citigroup
BNP PARIBAS Deutsche Bank Securities Evercore ISI
Goldman Sachs & Co. LLC HSBC Truist Securities Wells Fargo Securities
Capital One Securities C.L. King & Associates Credit Agricole CIB
Mischler Financial Group, Inc. MUFG Ramirez & Co., Inc.
Santander Investment Securities Inc. Siebert Williams Shank
, 2021