Embed Size (px)
Citation preview

14 August 2017
KRISENERGY LTD Company Registration No: 231666 (Incorporated in the Cayman Islands)
Unaudited Second Quarter & Six Months ended 30 June 2017
Financial Statements Announcement

2 2017 Second Quarter Report
The following announcement may contain forward-looking statements by KrisEnergy Ltd.
(the “Company”) relating to financial trends for future periods.
Some of the statements in this presentation, which are not historical facts, are statements of
future expectations with respect to, among others, the financial condition, results of
operation and business, and the related plans and objectives of the Company. These
forward-looking statements are based on the Company’s current views, intentions, plans,
expectations, assumptions and beliefs about future events and are subject to risks,
uncertainties and other factors, many of which are outside our control. Important factors that
could cause actual results to differ materially from the expectations expressed or implied in
the forward-looking statements include known and unknown risks and uncertainties. As
actual results could differ materially from the Company’s current views, intentions, plans,
expectations, assumptions and beliefs about the future, such forward-looking statements are
not and should not be construed as a representation, forecast or projection of future
performance of the Company. It should be noted that our actual performance may vary
significantly from such statements. No undue reliance should be placed on forward-looking
statements and the Company does not undertake to revise forward-looking statements to
reflect future events or circumstances.
3 2017 Second Quarter Report
To Our Shareholders
We witnessed an increase in oil prices in the first half of 2017, however prevailing
uncertainty and price volatility continue to pose challenges to our ongoing operations and
investment decisions. Our average realised oil sales price in each of the first two quarters of
2017 was above US$46.00 per barrel (“bbl”), the highest levels since the third quarter 2015.
We remain focused on our revised business plan and continued alignment on the Gulf of
Thailand as our core area, and through the successful execution of our proposed asset farm-
out and divestment transactions, we believe we will be on firmer ground to achieve our
development goals going forward.
We have continued to maintain a disciplined and controlled grip on cash and cost
management while maximising efficiencies, which is evident in our continued reduction in
general and administrative expenses in the first half of the year. Operating expenses in the
second quarter increased significantly quarter-on-quarter and versus a year ago. This was
essentially due to timing differences between production and lifting of the barrels, where
production costs are recognised only at the time of lifting (one cargo of Wassana crude oil
was lifted in the first quarter of 2017 versus two cargos in the second quarter).
Our farm-out/divestment process continues. Although the completion in April of our farm-out
of Block A Aceh resulted in a non-cash impairment charge in the second quarter, the
transaction significantly reduces our capital expenditure and risk profile in the project, which
we intend to partially fund via asset-based financing. As a result, we expect to free up capital
for our core focus area where we believe we will be able to create higher value in a shorter
timeframe.
At the half-year mark, our actual cash capital expenditure totaled US$35.1 million versus the
forecast provided in February 2017 for an annual budget of US$121.5 million. We have
revised and reduced our 2017 capital expenditure forecast to US$110.3 million, although this
investment profile will depend on the declaration of final investment decision and award of
development contracts with respect to Cambodia Block A.
For the first seven months of this year, the Group recorded 907,655 man-hours with zero
loss time injuries. Cost efficiency measures have not affected our health and safety record.
Production in the first half of 2017 was down year-on-year largely due to a natural decline in
the Wassana oil field in G10/48 in the Gulf of Thailand. We intend to address this with an
infill horizontal drilling program in the second half of 2017. New infill wells in the Nong Yao oil
field in the adjacent G11/48 concession were completed and put on stream in July and have
revived production to above 10,000 barrels of oil per day (“bopd”).
We continue to believe in the further potential of the G10/48 licence area and we plan to drill
an appraisal well in the Wassana satellite development area north of the main Wassana field
as well as an exploration well to the south of the Wassana production area, sharing the rig
which will be used for the Wassana infill drilling program.
Chief Executive Officer’s Report to Shareholders

4 2017 Second Quarter Report
At the non-operated B8/32 and B9A oil and gas producing complex, three wells were drilled
in the first half of 2017, where production has exceeded expectations by 5.0% to 10.0% each
month so far this year. We were also pleased by the approval earlier this year by the Thai
authorities for the extension of the B8/32 production licence until 2030.
In Bangladesh, the Bangora-6 development well was completed and put on stream in
January and our production remains stable at a little under 100 million cubic feet per day
(“mmcfd”).
While we prepare to commence drilling in G10/48, we are also refocused on the Apsara oil
development in Cambodia, where the Royal Government of Cambodia has approved the
signing of the petroleum agreement for 23 August 2017. This is a major step forward in the
development of the Apsara oil field and establishing Cambodia as an oil-producing nation.
Overall, we are making progress in all areas but we remain cautious given the continuing uncertainties regarding the oil markets and the impact on our cash flow. For and on behalf of the Board of Directors Jeffrey S. MacDonald Interim Chief Executive Officer 14 August 2017
5 2017 Second Quarter Report
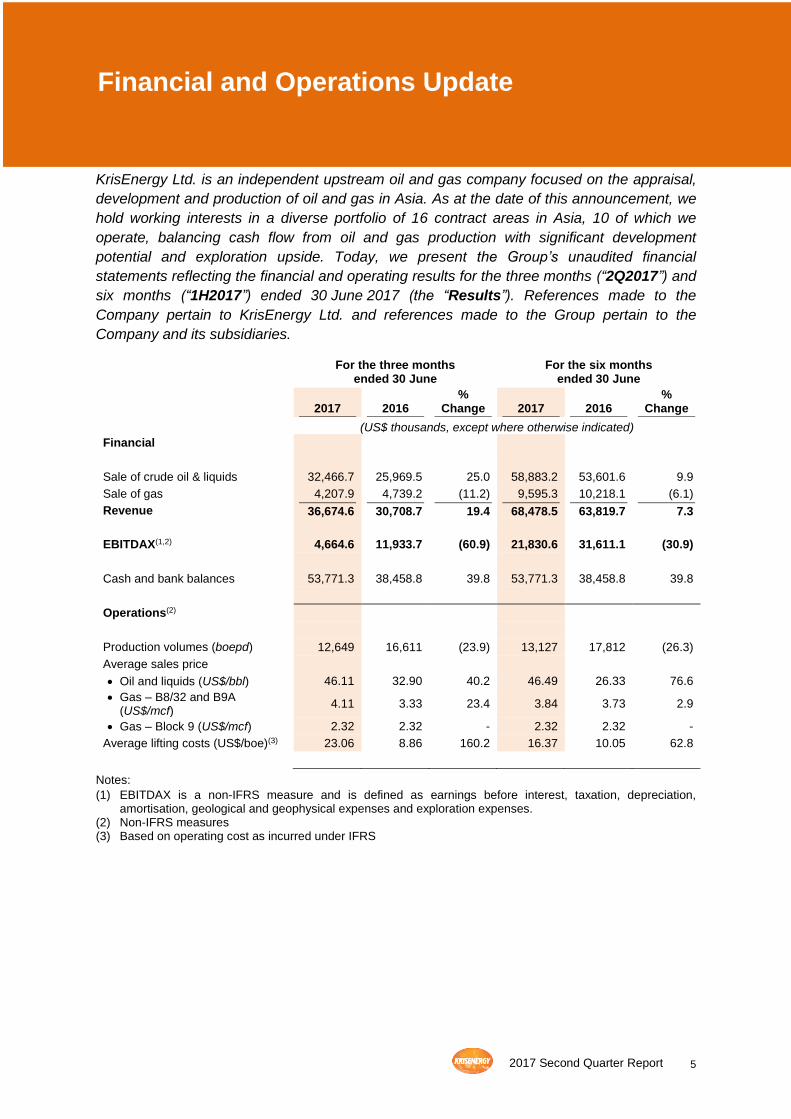
KrisEnergy Ltd. is an independent upstream oil and gas company focused on the appraisal,
development and production of oil and gas in Asia. As at the date of this announcement, we
hold working interests in a diverse portfolio of 16 contract areas in Asia, 10 of which we
operate, balancing cash flow from oil and gas production with significant development
potential and exploration upside. Today, we present the Group’s unaudited financial
statements reflecting the financial and operating results for the three months (“2Q2017”) and
six months (“1H2017”) ended 30 June 2017 (the “Results”). References made to the
Company pertain to KrisEnergy Ltd. and references made to the Group pertain to the
Company and its subsidiaries.
For the three months ended 30 June
For the six months ended 30 June
2017 2016 %
Change 2017 2016 %
Change
(US$ thousands, except where otherwise indicated)
Financial
Sale of crude oil & liquids 32,466.7 25,969.5 25.0 58,883.2 53,601.6 9.9
Sale of gas 4,207.9 4,739.2 (11.2) 9,595.3 10,218.1 (6.1)
Revenue 36,674.6 30,708.7 19.4 68,478.5 63,819.7 7.3
EBITDAX(1,2) 4,664.6 11,933.7 (60.9) 21,830.6 31,611.1 (30.9)
Cash and bank balances 53,771.3 38,458.8 39.8 53,771.3 38,458.8 39.8
Operations(2)
Production volumes (boepd) 12,649 16,611 (23.9) 13,127 17,812 (26.3)
Average sales price
• Oil and liquids (US$/bbl) 46.11 32.90 40.2 46.49 26.33 76.6
• Gas – B8/32 and B9A (US$/mcf)
4.11 3.33 23.4 3.84 3.73 2.9
• Gas – Block 9 (US$/mcf) 2.32 2.32 - 2.32 2.32 -
Average lifting costs (US$/boe)(3) 23.06 8.86 160.2 16.37 10.05 62.8
Notes:
(1) EBITDAX is a non-IFRS measure and is defined as earnings before interest, taxation, depreciation, amortisation, geological and geophysical expenses and exploration expenses.
(2) Non-IFRS measures (3) Based on operating cost as incurred under IFRS
Financial and Operations Update
6 2017 Second Quarter Report
First Half 2017 Financial Update
In line with the ongoing financial restructuring, the Group remains focused on the implementation and execution of the farm-out and divestment of certain assets within the Group’s portfolio. In addition, the Group continues to execute on strategies to manage liquidity through maximising operational efficiencies and ongoing cost cutting initiatives.
• Working interest production in 1H2017 averaged 13,127 barrels of oil equivalent per day (“boepd”), down 26.3% from the same period last year (1H2016: 17,812 boepd), primarily as a result of lower production from the Wassana oil field in the Gulf of Thailand where the Group holds an 89.0% working interest.
• Revenue for 1H2017 increased 7.3% to US$68.5 million (1H2016: US$63.8 million) on the back of higher average realised selling prices for both crude oil and natural gas, despite lower sales volumes. The average realised oil and liquids sales price in 1H2017 increased 76.6% to US$46.49/bbl (1H2016: US$26.33/bbl). The average realised gas price achieved from the Gulf of Thailand fields, B8/32 & B9A, in 1H2017 was US$3.84 per thousand cubic feet (“mcf”), 2.9% higher than the same period last year (1H2016: US$3.73/mcf) due to a price adjustment in the second quarter of 2017, when the realised gas price averaged $4.11/mcf. The gas price achieved at the Bangora gas field in Bangladesh was stable at US$2.32/mcf.
• Operating costs increased to US$38.9 million in 1H2017 (1H2016: US$32.6 million). Lower production, predominantly from the Wassana oil field, resulted in higher average lifting costs, which increased to US$16.37 per barrel of oil equivalent (“boe”) (1H2016: US$9.57/boe). The Group’s operating costs for each of its assets are largely fixed costs in nature, however, in line with our accounting policies, operating costs incurred during the production period are only recognised at the point of lifting, thereby giving rise to timing differences between the fixed operating expenditure and the recognition of such expenses.
• Depreciation, depletion and amortisation (“DD&A”) charges declined 40.4% to US$30.2 million in 1H2017 (1H2016: US$50.7 million) as a result of decreased production and lower asset carrying value due to impairment charges the Group booked in 2016.
• Corporate general and administrative expenses in 1H2017 decreased 26.1% to US$3.7 million (1H2016: US$5.0 million) primarily as a result of ongoing cost cutting measures implemented across the Group.
• EBITDAX in 1H2017 amounted to US$21.8 million (1H2016: US$31.6 million). The year-on-year decrease was primarily attributed to the recognition in 1H2016 of a US$10.6 million gain from the sale of one of the Group’s subsidiaries.
• Net loss after tax in 1H2017 was US$26.1 million compared to a net loss of US$45.2 million in 1H2016. The primary factors which contributed to the 1H2017 net loss were higher operating expenditure; increased finance costs (with a large component comprised of non-cash charges in relation to the expenses recognition of the 2022 Notes and 2023 Notes bond accretion discount and the increase in
7 2017 Second Quarter Report
decommissioning provisions for producing assets in Thailand); a write-off related to the relinquishment of the Kutai production sharing contract (“PSC”) of US$6.2 million; and the unaudited impairment of our working interest in the Block A Aceh PSC, following the completion of the farm-out to PT Medco E&P Melaka (“Medco”) in April 2017, which amounted to US$52.3 million. The charges incurred during 1H2017 were partially offset by a US$73.9 million fair value non-cash gain on the exchange of the 2022 Notes and 2023 Notes.
• Material non-cash charges to the profit and loss statement in 1H2017 amounted to US$37.0 million, comprising: (i) net fair value gain of US$73.9 million on the exchange to the 2022 Notes and 2023 Notes, (ii) US$52.3 million related to the unaudited impairment of Block A Aceh, (iii) US$30.2 million in DD&A charges, (iv) US$12.7 million related to the accretion of the bond discount of the zero coupon notes, 2022 Notes and 2023 Notes, (v) US$9.5 million in charges related to the financial restructuring, and (vi) a US$6.2 million write-off related to the relinquishment of the Kutai PSC.
• The Group’s cash and cash equivalents amounted to US$45.5 million. Total unused sources of liquidity as at 30 June 2017, including unutilised amounts of the revolving credit facility (“RCF”) due 30 June 2018 of US$15.0 million, was US$60.5 million. As at 30 June 2017, the RCF utilised of US$133.3 million was classified as non-current liabilities as the Company and DBS Bank Ltd (“DBS”) have been working together, in line with the Group’s overall financial restructuring, to extend the current maturity of the RCF beyond 30 June 2018.
• As at 30 June 2017, total debt amounted to US$383.7 million and the Group’s gearing was 58.5%.

8 2017 Second Quarter Report
First Half 2017 Operational Update The Group remains focused on allocating funds to activities which will generate near-term production and maximise operational efficiencies. Production and Development
• Average gross production at the Wassana oil field in the G10/48 concession was 4,650 bopd in 1H2017 and the group’s average working interest production in the period was 4,139 bopd. Work commenced to install liquid handling facilities on the mobile offshore production unit to debottleneck the water separation process and increase capacity. The field underwent a three-day scheduled shut-in in July 2017 for commissioning of the equipment.
• Average gross production at the Nong Yao oil field in G11/48 concession was 8,087 bopd in 1H2017 and the group’s average working interest production was approximately 1,820 bopd. Following completion of six infill wells in June 2017, the Atwood Orca jack-up rig was demobilised. Three new producing wells were brought on stream at the end of the first half 2017 and three additional wells were cased ready to produce at a later date.
• In 1H2017, three infill wells were drilled in the B8/32 & B9A oil and gas complex in the Gulf of Thailand compared to 14 wells drills in the same period in 2016. Gross production at the oil and gas producing complex in the first six months of the year was 27,217 bopd of oils and liquids and 120.5 mmcfd of gas. Average working interest production for the period was 2,192 boepd.
• At the Bangora field in the Block 9 PSC, production rates were stable in 1H2017 with gross output of gas averaging 97.8 mmcfd and 285 barrels per day of condensate. The group’s average working production in 1H2017 was 4,977 boepd.
• Pursuant to the Group entering into farm-out agreement with Medco on 9 November 2016, the Group received the necessary governmental approvals in April 2017. The Group now holds a 15.0% working interest in the Block A Aceh PSC.
For activities and developments since 30 June 2017, see paragraph 10 of these Results entitled Recent Developments.
9 2017 Second Quarter Report
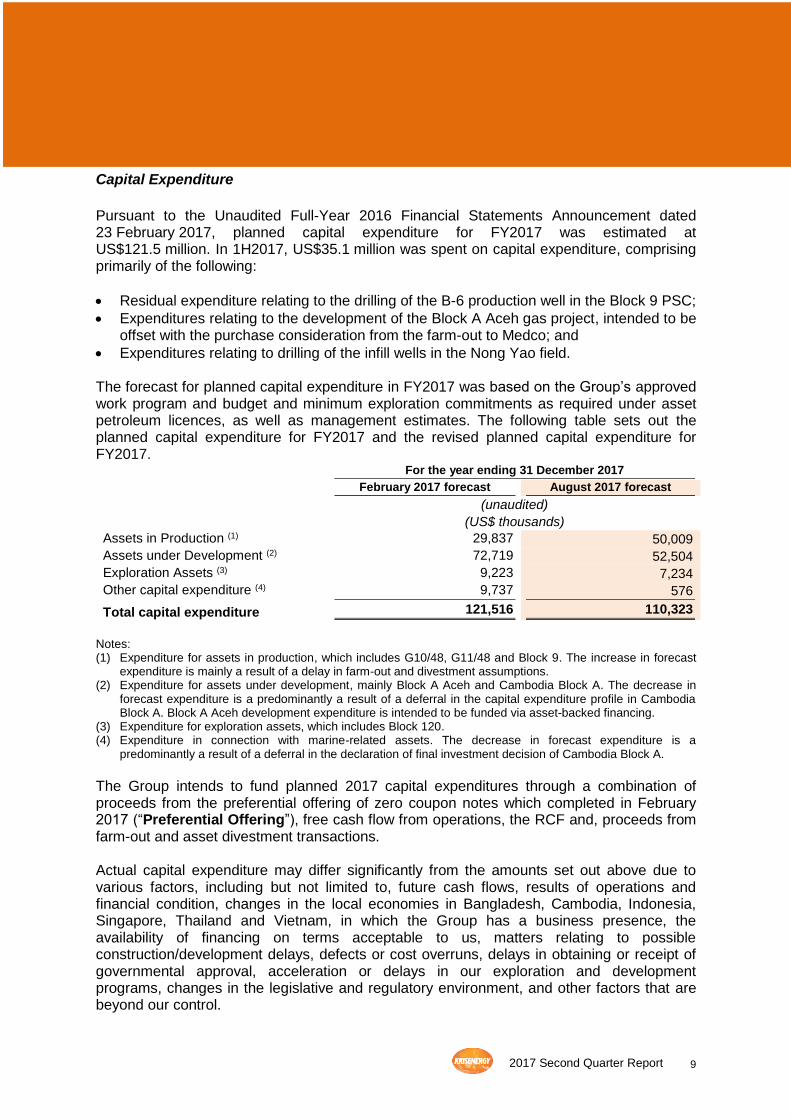
Capital Expenditure
Pursuant to the Unaudited Full-Year 2016 Financial Statements Announcement dated 23 February 2017, planned capital expenditure for FY2017 was estimated at US$121.5 million. In 1H2017, US$35.1 million was spent on capital expenditure, comprising primarily of the following:
• Residual expenditure relating to the drilling of the B-6 production well in the Block 9 PSC;
• Expenditures relating to the development of the Block A Aceh gas project, intended to be offset with the purchase consideration from the farm-out to Medco; and
• Expenditures relating to drilling of the infill wells in the Nong Yao field. The forecast for planned capital expenditure in FY2017 was based on the Group’s approved work program and budget and minimum exploration commitments as required under asset petroleum licences, as well as management estimates. The following table sets out the planned capital expenditure for FY2017 and the revised planned capital expenditure for FY2017.
For the year ending 31 December 2017
February 2017 forecast August 2017 forecast
(unaudited)
(US$ thousands)
Assets in Production (1) 29,837 50,009
Assets under Development (2) 72,719 52,504
Exploration Assets (3) 9,223 7,234
Other capital expenditure (4) 9,737 576
Total capital expenditure 121,516 110,323
Notes: (1) Expenditure for assets in production, which includes G10/48, G11/48 and Block 9. The increase in forecast
expenditure is mainly a result of a delay in farm-out and divestment assumptions. (2) Expenditure for assets under development, mainly Block A Aceh and Cambodia Block A. The decrease in
forecast expenditure is a predominantly a result of a deferral in the capital expenditure profile in Cambodia Block A. Block A Aceh development expenditure is intended to be funded via asset-backed financing.
(3) Expenditure for exploration assets, which includes Block 120. (4) Expenditure in connection with marine-related assets. The decrease in forecast expenditure is a
predominantly a result of a deferral in the declaration of final investment decision of Cambodia Block A.
The Group intends to fund planned 2017 capital expenditures through a combination of proceeds from the preferential offering of zero coupon notes which completed in February 2017 (“Preferential Offering”), free cash flow from operations, the RCF and, proceeds from farm-out and asset divestment transactions. Actual capital expenditure may differ significantly from the amounts set out above due to various factors, including but not limited to, future cash flows, results of operations and financial condition, changes in the local economies in Bangladesh, Cambodia, Indonesia, Singapore, Thailand and Vietnam, in which the Group has a business presence, the availability of financing on terms acceptable to us, matters relating to possible construction/development delays, defects or cost overruns, delays in obtaining or receipt of governmental approval, acceleration or delays in our exploration and development programs, changes in the legislative and regulatory environment, and other factors that are beyond our control.

10
2017 Second Quarter Report
Figures for the period ended 30 June 2017 have not been audited.
PART I – INFORMATION REQUIRED FOR ANNOUNCEMENTS OF QUARTERLY (Q1, Q2
& Q3), HALF-YEAR AND FULL-YEAR RESULTS
1 (a)(i) An income statement (for the group) together with a comparative statement for
the corresponding period of the immediately preceding financial year
For the three months
ended 30 June For the six months
ended 30 June
2017 2016 2017 2016
(unaudited)
(US$ thousands)
Sales of crude oil 32,466.7 25,969.5 58,883.2 53,601.6
Sales of gas 4,207.9 4,739.2 9,595.3 10,218.1
Revenue 36,674.6 30,708.7 68,478.5 63,819.7
Cost of sales:
Operating costs (26,540.0) (13,396.9) (38,980.1) (32,593.1)
Thai petroleum royalties paid (2,851.5) (2,516.2) (5,508.9) (5,235.4)
Depreciation, depletion and amortisation
(14,871.6) (22,749.2) (30,214.4) (50,725.1)
Gross loss (7,588.5) (7,953.6) (6,134.9) (24,733.9)
Other income 1,239.0 1,116.1 6,889.9 13,080.6
General and administrative expenses (5,845.0) (8,489.8) (12,871.7) (16,095.1)
Other operating (expenses)/income (57,189.9) 213.8 20,330.7 285.6
Finance income 70.6 61.7 157.7 109.2
Finance costs (11,269.0) (9,775.0) (31,841.1) (17,139.2)
Loss before tax (80,582.8) (24,826.8) (23,469.4) (44,492.8)
Tax expense (1,238.9) (348.3) (2,629.5) (751.3)
Loss for the period (81,821.7) (25,175.1) (26,098.9) (45,244.1)
Other comprehensive income:
Items that may be reclassified subsequently to profit or loss
Exchange differences on translation of foreign operations
(7.2) (36.0) (33.3) (59.2)
Total comprehensive income for the period
(81,828.9) (25,211.1) (26,132.2) (45,303.3)
Loss for the period attributable to:
Owners of the Company (81,821.7) (25,175.1) (26,098.9) (43,461.0)
Non-controlling interests - - - (1,783.1)
(81,821.7) (25,175.1) (26,098.9) (45,244.1)
Total comprehensive income for the period attributable to:
Owners of the Company (81,828.9) (25,211.1) (26,132.2) (43,520.2)
Non-controlling interests - - - (1,783.1)
(81,828.9) (25,211.1) (26,132.2) (45,303.3)
Financial Statements Announcement Second Quarter and Six Months ended 30 June 2017

11 2017 Second Quarter Report
For the three months
ended 30 June For the six months
ended 30 June
2017 2016 2017 2016
(unaudited)
(US$ thousands) Loss per share attributable to owners of the Company
(cents per share)
Basic (5.5) (1.7) (1.7) (2.9)
Diluted (5.5) (1.7) (1.7) (2.9)
Extraordinary items
There were no extraordinary items during the period.
EBITDAX Computation
For the three months
ended 30 June For the six months
ended 30 June
2017 2016 2017 2016
(unaudited)
(US$ thousands)
Adjusted loss before tax (80,582.8) (24,826.8) (23,469.4) (44,492.8)
Add:
Finance costs 11,269.0 9,775.0 31,841.1 17,139.2
Depreciation, depletion and amortisation
14,936.6 22,918.3 30,373.2 51,085.4
Impairment losses 52,266.5 - 52,266.5 -
Net fair value gain on financial instruments
(1,331.6) (213.8) (78,852.3) (285.6)
Write-off of joint operations receivables
6,160.0 - 6,160.0 -
EBITDA 2,717.7 7,652.7 18,319.1 23,446.2
Geological and geophysical expenses 1,851.8 4,281.0 3,416.4 8,164.9
Exploration expenses 95.1 - 95.1 -
EBITDAX 4,664.6 11,933.7 21,830.6 31,611.1
EBITDAX and EBITDA are supplemental measures of our performance that are not required by, or presented in accordance with IFRS. EBITDAX and EBITDA are not measurements of financial performance or liquidity under IFRS and should not be considered as an alternative to net income, operating income or any other performance measures derived in accordance with IFRS or as an alternative to cash flow from operating activities as a measure of liquidity. Adjusted profit/loss before tax deducts SRB taxes from the calculation of EBITDAX and EBITDA. In addition, EBITDAX and EBITDA are not standardised terms, hence, a direct comparison between companies using such terms may not be possible.
1 (b)(i) A balance sheet (for the issuer and group), together with a comparative
statement as at the end of the immediately preceding financial year
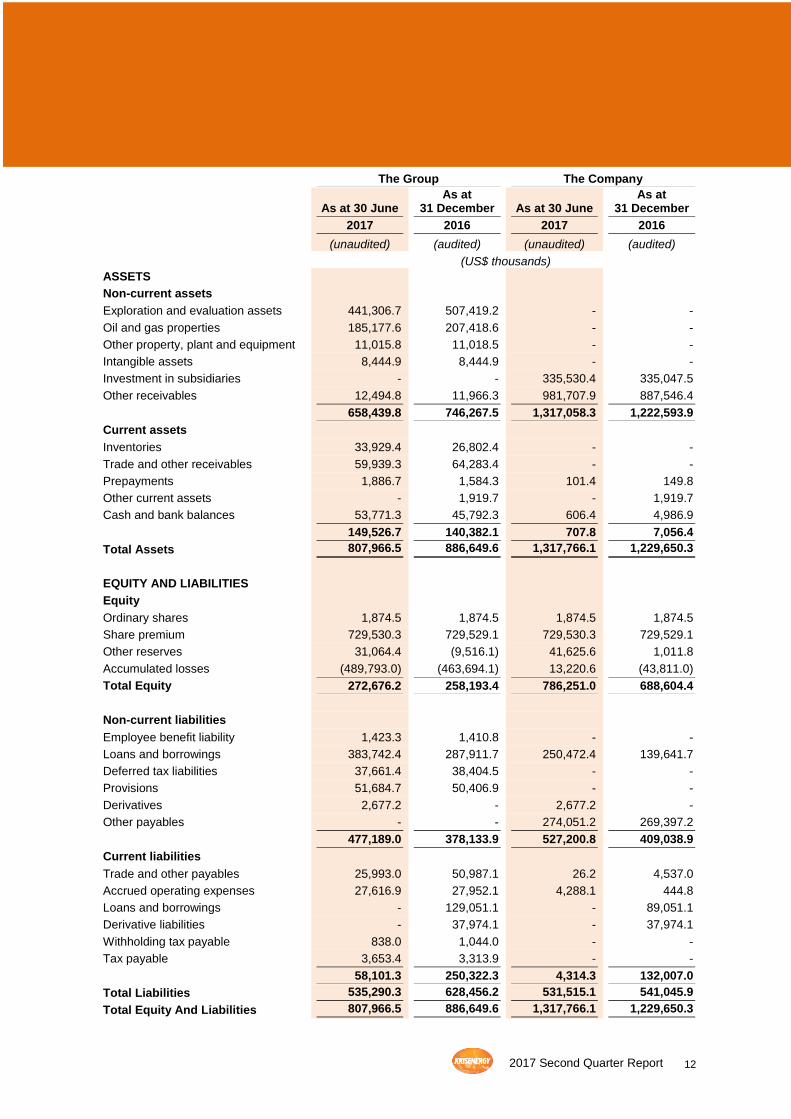
12 2017 Second Quarter Report
The Group The Company
As at 30 June As at
31 December As at 30 June As at
31 December
2017 2016 2017 2016
(unaudited) (audited) (unaudited) (audited)
(US$ thousands)
ASSETS
Non-current assets
Exploration and evaluation assets 441,306.7 507,419.2 - -
Oil and gas properties 185,177.6 207,418.6 - -
Other property, plant and equipment 11,015.8 11,018.5 - -
Intangible assets 8,444.9 8,444.9 - -
Investment in subsidiaries - - 335,530.4 335,047.5
Other receivables 12,494.8 11,966.3 981,707.9 887,546.4
658,439.8 746,267.5 1,317,058.3 1,222,593.9
Current assets
Inventories 33,929.4 26,802.4 - -
Trade and other receivables 59,939.3 64,283.4 - -
Prepayments 1,886.7 1,584.3 101.4 149.8
Other current assets - 1,919.7 - 1,919.7
Cash and bank balances 53,771.3 45,792.3 606.4 4,986.9
149,526.7 140,382.1 707.8 7,056.4
Total Assets 807,966.5 886,649.6 1,317,766.1 1,229,650.3
EQUITY AND LIABILITIES
Equity
Ordinary shares 1,874.5 1,874.5 1,874.5 1,874.5
Share premium 729,530.3 729,529.1 729,530.3 729,529.1
Other reserves 31,064.4 (9,516.1) 41,625.6 1,011.8
Accumulated losses (489,793.0) (463,694.1) 13,220.6 (43,811.0)
Total Equity 272,676.2 258,193.4 786,251.0 688,604.4
Non-current liabilities
Employee benefit liability 1,423.3 1,410.8 - -
Loans and borrowings 383,742.4 287,911.7 250,472.4 139,641.7
Deferred tax liabilities 37,661.4 38,404.5 - -
Provisions 51,684.7 50,406.9 - -
Derivatives 2,677.2 - 2,677.2 -
Other payables - - 274,051.2 269,397.2
477,189.0 378,133.9 527,200.8 409,038.9
Current liabilities
Trade and other payables 25,993.0 50,987.1 26.2 4,537.0
Accrued operating expenses 27,616.9 27,952.1 4,288.1 444.8
Loans and borrowings - 129,051.1 - 89,051.1
Derivative liabilities - 37,974.1 - 37,974.1
Withholding tax payable 838.0 1,044.0 - -
Tax payable 3,653.4 3,313.9 - -
58,101.3 250,322.3 4,314.3 132,007.0
Total Liabilities 535,290.3 628,456.2 531,515.1 541,045.9
Total Equity And Liabilities 807,966.5 886,649.6 1,317,766.1 1,229,650.3
13 2017 Second Quarter Report
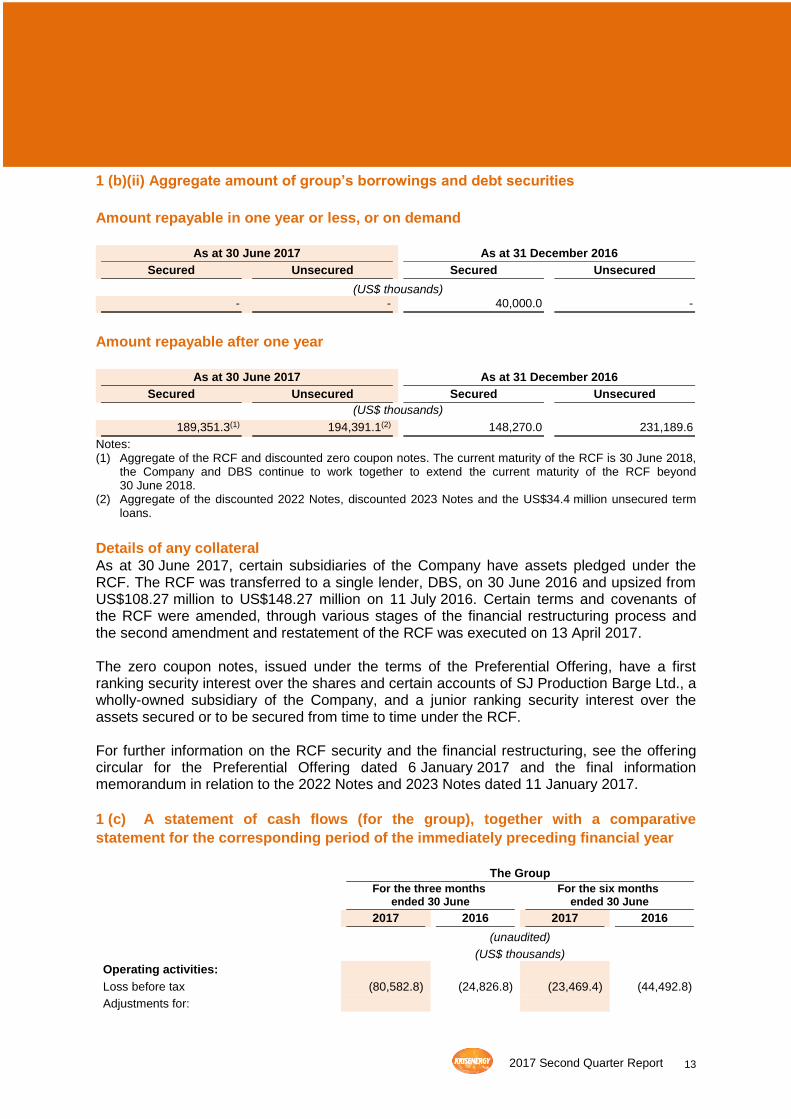
1 (b)(ii) Aggregate amount of group’s borrowings and debt securities
Amount repayable in one year or less, or on demand
As at 30 June 2017 As at 31 December 2016
Secured Unsecured Secured Unsecured
(US$ thousands)
- - 40,000.0 -
Amount repayable after one year
As at 30 June 2017 As at 31 December 2016
Secured Unsecured Secured Unsecured
(US$ thousands)
189,351.3(1) 194,391.1(2) 148,270.0 231,189.6
Notes:
(1) Aggregate of the RCF and discounted zero coupon notes. The current maturity of the RCF is 30 June 2018, the Company and DBS continue to work together to extend the current maturity of the RCF beyond 30 June 2018.
(2) Aggregate of the discounted 2022 Notes, discounted 2023 Notes and the US$34.4 million unsecured term loans.
Details of any collateral
As at 30 June 2017, certain subsidiaries of the Company have assets pledged under the RCF. The RCF was transferred to a single lender, DBS, on 30 June 2016 and upsized from US$108.27 million to US$148.27 million on 11 July 2016. Certain terms and covenants of the RCF were amended, through various stages of the financial restructuring process and the second amendment and restatement of the RCF was executed on 13 April 2017. The zero coupon notes, issued under the terms of the Preferential Offering, have a first ranking security interest over the shares and certain accounts of SJ Production Barge Ltd., a wholly-owned subsidiary of the Company, and a junior ranking security interest over the assets secured or to be secured from time to time under the RCF. For further information on the RCF security and the financial restructuring, see the offering circular for the Preferential Offering dated 6 January 2017 and the final information memorandum in relation to the 2022 Notes and 2023 Notes dated 11 January 2017.
1 (c) A statement of cash flows (for the group), together with a comparative
statement for the corresponding period of the immediately preceding financial year
The Group
For the three months ended 30 June
For the six months ended 30 June
2017 2016 2017 2016
(unaudited)
(US$ thousands)
Operating activities:
Loss before tax (80,582.8) (24,826.8) (23,469.4) (44,492.8)
Adjustments for:

14 2017 Second Quarter Report
The Group
For the three months ended 30 June
For the six months ended 30 June
2017 2016 2017 2016
(unaudited)
(US$ thousands)
Depreciation, depletion and amortisation 14,871.6 22,749.2 30,214.4 50,725.1
Depreciation of property, plant and equipment
65.0 169.1 158.8 360.3
Employee defined benefits 12.6 (255.0) 12.6 (808.1)
Equity-settled transactions with employees 159.3 519.8 313.5 1,023.3
Gain on sale of subsidiary - - - (10,607.1)
Impairment loss on exploration and evaluation assets
52,266.5 - 52,266.5 -
Net fair value gain on financial instruments (1,331.6) (213.8) (78,852.3) (285.6)
Write-off of joint operations receivables 6,160.0 - 6,160.0 -
Finance cost 5,690.3 9,198.6 17,893.2 15,970.8
Unwinding of discount on bonds 4,939.8 - 12,670.1 -
Unwinding of discount on decommissioning provisions
638.9 576.4 1,277.8 1,168.4
Interest income (70.6) (61.7) (157.7) (109.2)
Operating cash flows before changes in working capital
2,819.0 7,885.8 18,487.5 12,945.1
Decrease/(increase) in inventories 2,561.9 (8,462.4) (7,126.9) (13,883.2)
Decrease in other current assets - - 1,919.7 -
(Increase)/decrease in trade and other receivables
(1,000.5) 4,999.7 (388.7) (14,645.7)
(Decrease)/increase in trade and other payables
(18,902.0) (20,434.1) (7,996.2) 31,156.5
Cash flows (used in)/from operations (14,521.6) (16,011.0) 4,895.4 15,572.7
Interest received 70.6 61.7 157.7 109.2
Interest paid (1,869.2) (5,300.2) (4,949.9) (8,511.7)
Tax paid (3,307.6) (1,202.2) (3,307.6) (1,202.2)
Net cash flows (used in)/from operating activities
(19,627.8) (22,451.7) (3,204.4) 5,968.0
Investing activities:
Addition to exploration and evaluation assets
(8,780.2) (8,030.1) (29,662.9) (14,346.3)
Farm-out of exploration and evaluation assets
22,105.5 - 22,105.5 -
Addition to oil and gas properties (6,471.5) (1,186.9) (7,973.4) (8,870.5)
Proceeds from sale of subsidiary - - - 821.6
Purchase of other plant, property and equipment
(26.0) - (26.0) (3.3)
Subsequent expenditure on assets refurbishment
(72.5) (97.4) (129.6) (214.9)
Net cash flows from/(used in) investing activities
6,755.3 (9,314.4) (15,686.4) (22,613.4)
Financing activities:
Payment of bond interest (767.2) (3,218.4) (4,691.6) (7,454.3)
Proceeds from bank borrowings 10,000.0 8,270.0 18,000.0 33,270.0
15 2017 Second Quarter Report
The Group
For the three months ended 30 June
For the six months ended 30 June
2017 2016 2017 2016
(unaudited)
(US$ thousands)
Repayment of bank borrowings - - (73,000.0) -
Proceeds from issuance of bonds - - 94,404.1 -
Proceeds from warrants exercised - - 0.9 -
Financial restructuring expense (544.7) - (7,809.8) -
Increase in short-term deposits - (8,270.0) - (8,270.0)
Decrease in cash collateralised - 1,500.0 - 1,500.0
Net cash flows from/(used in) financing activities
8,688.1 (1,718.4) 26,903.6 19,045.7
Net (decrease)/increase in cash and cash equivalents
(4,184.4) (33,484.5) 8,012.8 2,400.3
Cash and cash equivalents at beginning of the period
49,687.2 63,712.7 37,522.3 27,851.6
Net effect of exchange rate changes (1.5) (39.4) (33.8) (63.1)
Cash and cash equivalents at end of the period
45,501.3 30,188.8 45,501.3 30,188.8
Add: restricted cash 8,270.0 8,270.0 8,270.0 8,270.0
Cash and bank balances at end of the period
53,771.3 38,458.8 53,771.3 38,458.8
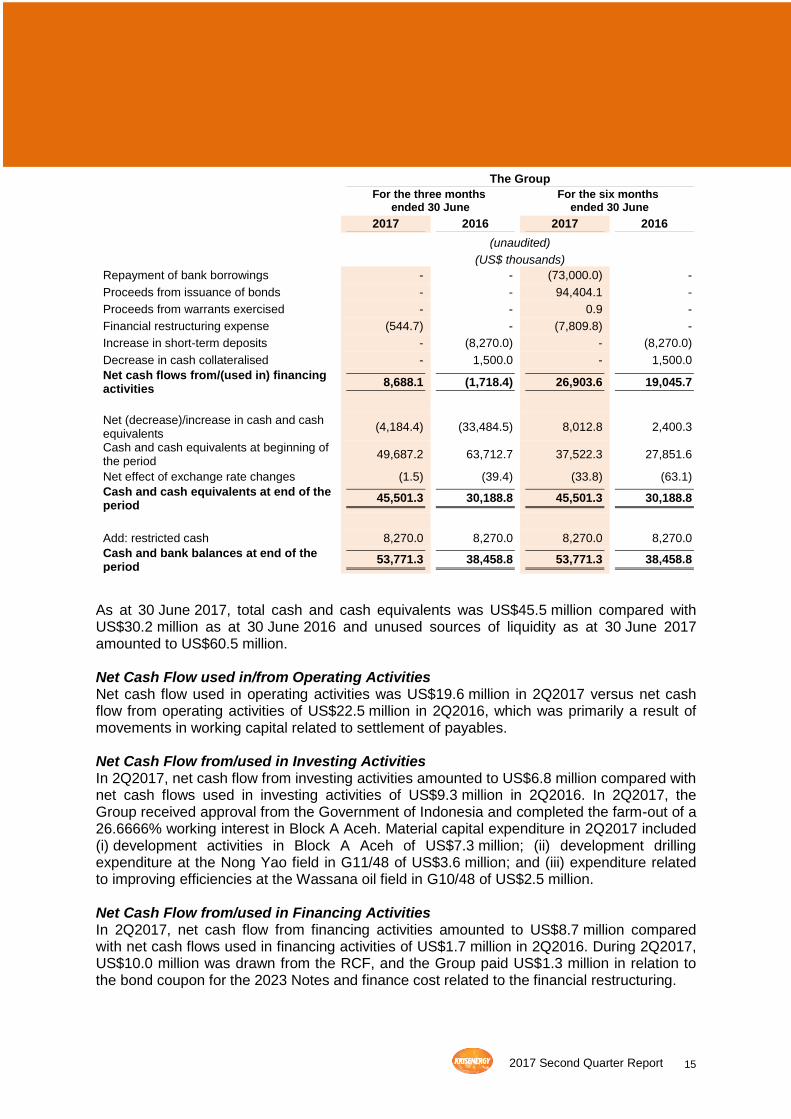
As at 30 June 2017, total cash and cash equivalents was US$45.5 million compared with US$30.2 million as at 30 June 2016 and unused sources of liquidity as at 30 June 2017 amounted to US$60.5 million. Net Cash Flow used in/from Operating Activities Net cash flow used in operating activities was US$19.6 million in 2Q2017 versus net cash flow from operating activities of US$22.5 million in 2Q2016, which was primarily a result of movements in working capital related to settlement of payables. Net Cash Flow from/used in Investing Activities In 2Q2017, net cash flow from investing activities amounted to US$6.8 million compared with net cash flows used in investing activities of US$9.3 million in 2Q2016. In 2Q2017, the Group received approval from the Government of Indonesia and completed the farm-out of a 26.6666% working interest in Block A Aceh. Material capital expenditure in 2Q2017 included (i) development activities in Block A Aceh of US$7.3 million; (ii) development drilling expenditure at the Nong Yao field in G11/48 of US$3.6 million; and (iii) expenditure related to improving efficiencies at the Wassana oil field in G10/48 of US$2.5 million. Net Cash Flow from/used in Financing Activities In 2Q2017, net cash flow from financing activities amounted to US$8.7 million compared with net cash flows used in financing activities of US$1.7 million in 2Q2016. During 2Q2017, US$10.0 million was drawn from the RCF, and the Group paid US$1.3 million in relation to the bond coupon for the 2023 Notes and finance cost related to the financial restructuring.
16 2017 Second Quarter Report
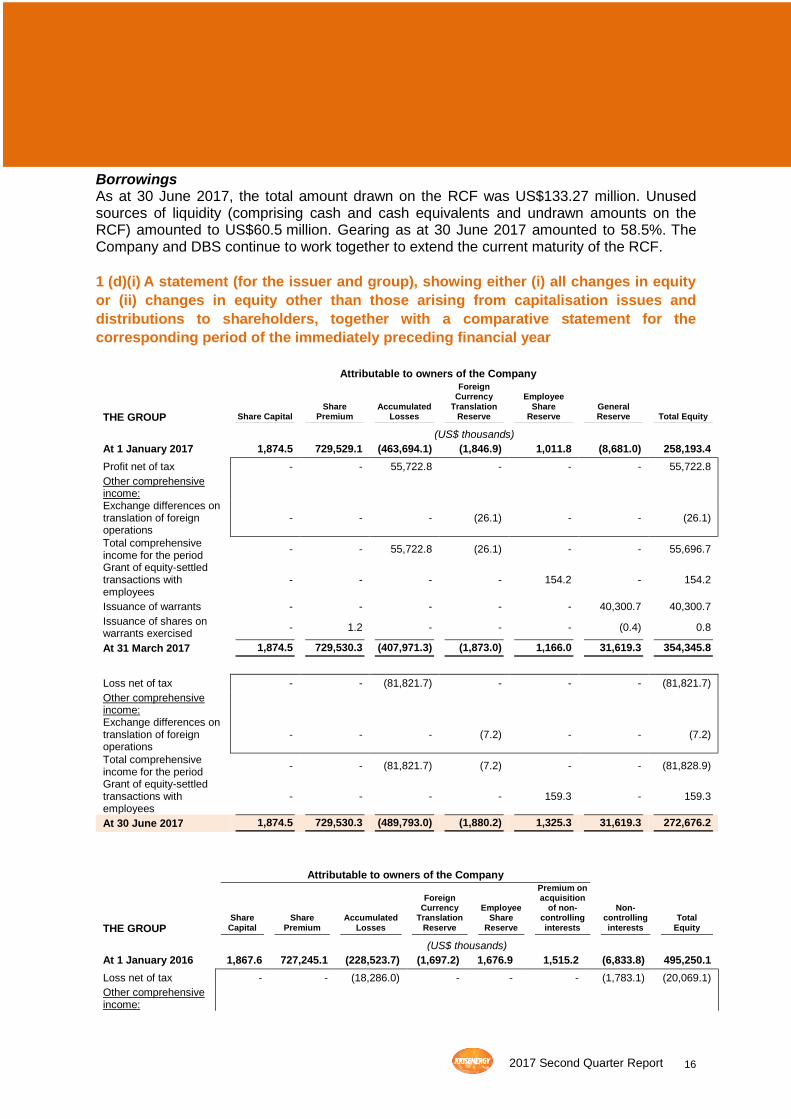
Borrowings As at 30 June 2017, the total amount drawn on the RCF was US$133.27 million. Unused sources of liquidity (comprising cash and cash equivalents and undrawn amounts on the RCF) amounted to US$60.5 million. Gearing as at 30 June 2017 amounted to 58.5%. The Company and DBS continue to work together to extend the current maturity of the RCF.
1 (d)(i) A statement (for the issuer and group), showing either (i) all changes in equity
or (ii) changes in equity other than those arising from capitalisation issues and
distributions to shareholders, together with a comparative statement for the
corresponding period of the immediately preceding financial year
Attributable to owners of the Company
THE GROUP Share Capital Share
Premium Accumulated
Losses
Foreign Currency
Translation Reserve
Employee Share
Reserve General Reserve Total Equity
(US$ thousands)
At 1 January 2017 1,874.5 729,529.1 (463,694.1) (1,846.9) 1,011.8 (8,681.0) 258,193.4
Profit net of tax - - 55,722.8 - - - 55,722.8
Other comprehensive income:
Exchange differences on translation of foreign operations
- - - (26.1) - - (26.1)
Total comprehensive income for the period
- - 55,722.8 (26.1) - - 55,696.7
Grant of equity-settled transactions with employees
- - - - 154.2 - 154.2
Issuance of warrants - - - - - 40,300.7 40,300.7
Issuance of shares on warrants exercised
- 1.2 - - - (0.4) 0.8
At 31 March 2017 1,874.5 729,530.3 (407,971.3) (1,873.0) 1,166.0 31,619.3 354,345.8
Loss net of tax - - (81,821.7) - - - (81,821.7)
Other comprehensive income:
Exchange differences on translation of foreign operations
- - - (7.2) - - (7.2)
Total comprehensive income for the period
- - (81,821.7) (7.2) - - (81,828.9)
Grant of equity-settled transactions with employees
- - - - 159.3 - 159.3
At 30 June 2017 1,874.5 729,530.3 (489,793.0) (1,880.2) 1,325.3 31,619.3 272,676.2
Attributable to owners of the Company
THE GROUP Share Capital
Share Premium
Accumulated Losses
Foreign Currency
Translation Reserve
Employee Share
Reserve
Premium on acquisition
of non-controlling interests
Non-controlling interests
Total Equity
(US$ thousands)
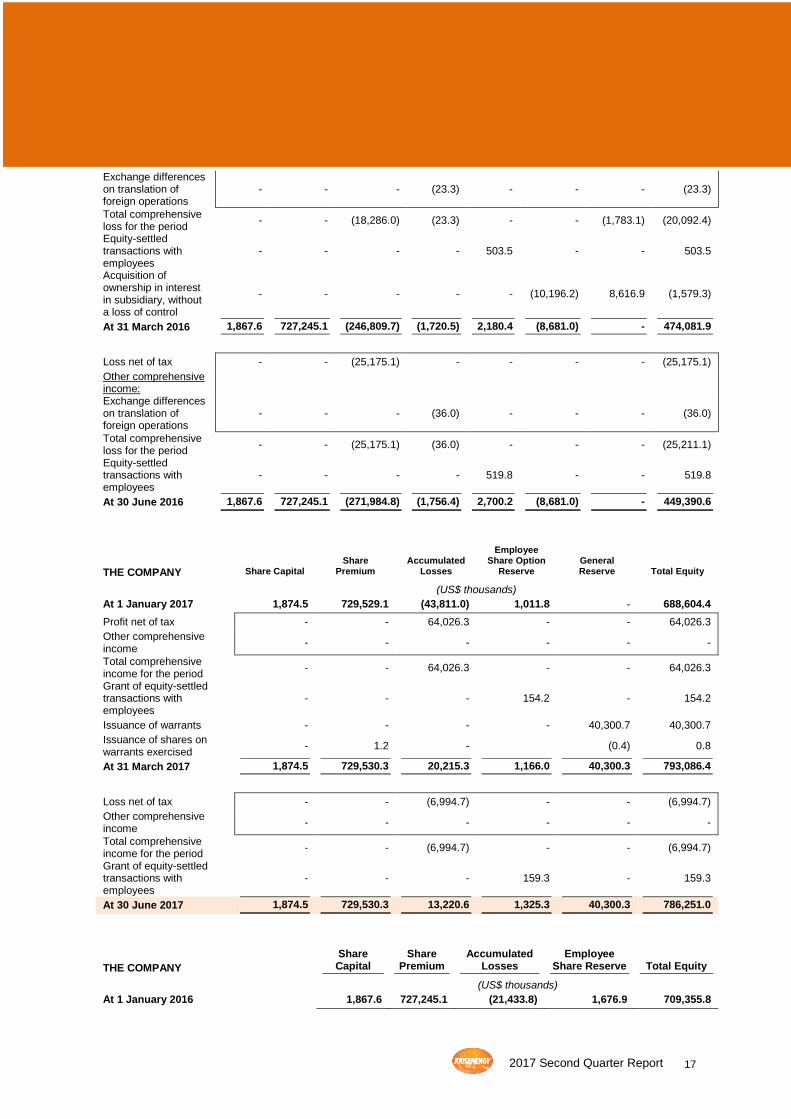
At 1 January 2016 1,867.6 727,245.1 (228,523.7) (1,697.2) 1,676.9 1,515.2 (6,833.8) 495,250.1
Loss net of tax - - (18,286.0) - - - (1,783.1) (20,069.1)
Other comprehensive income:
17 2017 Second Quarter Report
Exchange differences on translation of foreign operations
- - - (23.3) - - - (23.3)
Total comprehensive loss for the period
- - (18,286.0) (23.3) - - (1,783.1) (20,092.4)
Equity-settled transactions with employees
- - - - 503.5 - - 503.5
Acquisition of ownership in interest in subsidiary, without a loss of control
- - - - - (10,196.2) 8,616.9 (1,579.3)
At 31 March 2016 1,867.6 727,245.1 (246,809.7) (1,720.5) 2,180.4 (8,681.0) - 474,081.9
Loss net of tax - - (25,175.1) - - - - (25,175.1)
Other comprehensive income:
Exchange differences on translation of foreign operations
- - - (36.0) - - - (36.0)
Total comprehensive loss for the period
- - (25,175.1) (36.0) - - - (25,211.1)
Equity-settled transactions with employees
- - - - 519.8 - - 519.8
At 30 June 2016 1,867.6 727,245.1 (271,984.8) (1,756.4) 2,700.2 (8,681.0) - 449,390.6
THE COMPANY Share Capital Share
Premium Accumulated
Losses
Employee Share Option
Reserve General Reserve Total Equity
(US$ thousands)
At 1 January 2017 1,874.5 729,529.1 (43,811.0) 1,011.8 - 688,604.4
Profit net of tax - - 64,026.3 - - 64,026.3
Other comprehensive income
- - - - - -
Total comprehensive income for the period
- - 64,026.3 - - 64,026.3
Grant of equity-settled transactions with employees
- - - 154.2 - 154.2
Issuance of warrants - - - - 40,300.7 40,300.7
Issuance of shares on warrants exercised
- 1.2 - (0.4) 0.8
At 31 March 2017 1,874.5 729,530.3 20,215.3 1,166.0 40,300.3 793,086.4
Loss net of tax - - (6,994.7) - - (6,994.7)
Other comprehensive income
- - - - - -
Total comprehensive income for the period
- - (6,994.7) - - (6,994.7)
Grant of equity-settled transactions with employees
- - - 159.3 - 159.3
At 30 June 2017 1,874.5 729,530.3 13,220.6 1,325.3 40,300.3 786,251.0
THE COMPANY
Share Capital
Share Premium
Accumulated Losses
Employee Share Reserve Total Equity
(US$ thousands)
At 1 January 2016 1,867.6 727,245.1 (21,433.8) 1,676.9 709,355.8

18 2017 Second Quarter Report
Loss net of tax - - (5,308.7) - (5,308.7)
Other comprehensive income - - - - -
Total comprehensive loss for the period - - (5,308.7) - (5,308.7)
Equity-settled transactions with employees - - - 503.5 503.5
At 31 March 2016 1,867.6 727,245.1 (26,742.5) 2,180.4 704,550.6
Loss net of tax - - (4,534.7) - (4,534.7)
Other comprehensive income - - - - -
Total comprehensive loss for the period - - (4,534.7) - (4,534.7)
Equity-settled transactions with employees - - - 519.8 519.8
At 30 June 2016 1,867.6 727,245.1 (31,277.2) 2,700.2 700,535.7
1 (d)(ii) Details of any changes in the company’s share capital arising from rights
issue, bonus issue, share buy-backs, exercise of share options or warrants,
conversion of other issues of equity securities, issue of shares for cash or as
consideration for acquisition or for any other purpose since the end of the previous
period reported on. State also the number of shares that may be issued on conversion
of all the outstanding convertibles, as well as the number of shares held as treasury
shares, if any, against the total number of issued shares excluding treasury shares of
the issuer, as at the end of the current financial period reported on and as the end of
the corresponding period of the immediately preceding financial year
The Company did not hold any treasury shares as at 30 June 2017 (30 June 2016: Nil). KrisEnergy Employee Share Option Scheme (“KrisEnergy ESOS”) The KrisEnergy ESOS was implemented and adopted during the Company’s initial public offering (“IPO”). The duration of the KrisEnergy ESOS is 10 years commencing from 10 July 2013. As at 30 June 2017, there were no outstanding options under the KrisEnergy ESOS. KrisEnergy Performance Share Plan (“KrisEnergy PSP”) The KrisEnergy PSP was implemented and adopted during the IPO. The duration of the KrisEnergy PSP is 10 years commencing from 10 July 2013. The awards granted under the KrisEnergy PSP are as follows:
• As disclosed and further described in the Prospectus dated 12 July 2013, under the management shareholders-awards (“MS-Awards”) granted pursuant to the KrisEnergy PSP during the IPO, up to 3.0% of the issued ordinary shares in the capital of the Company (“Shares”) may be vested upon the satisfaction of the conditions of the MS-Awards.
• On 13 November 2013, awards comprising 5,429,689 Shares were granted to employees, including 963,624 Shares to the Executive Directors.
• On 25 June 2014, awards comprising 1,713,111 Shares were granted to employees, including 963,624 Shares to the Executive Directors.
19 2017 Second Quarter Report
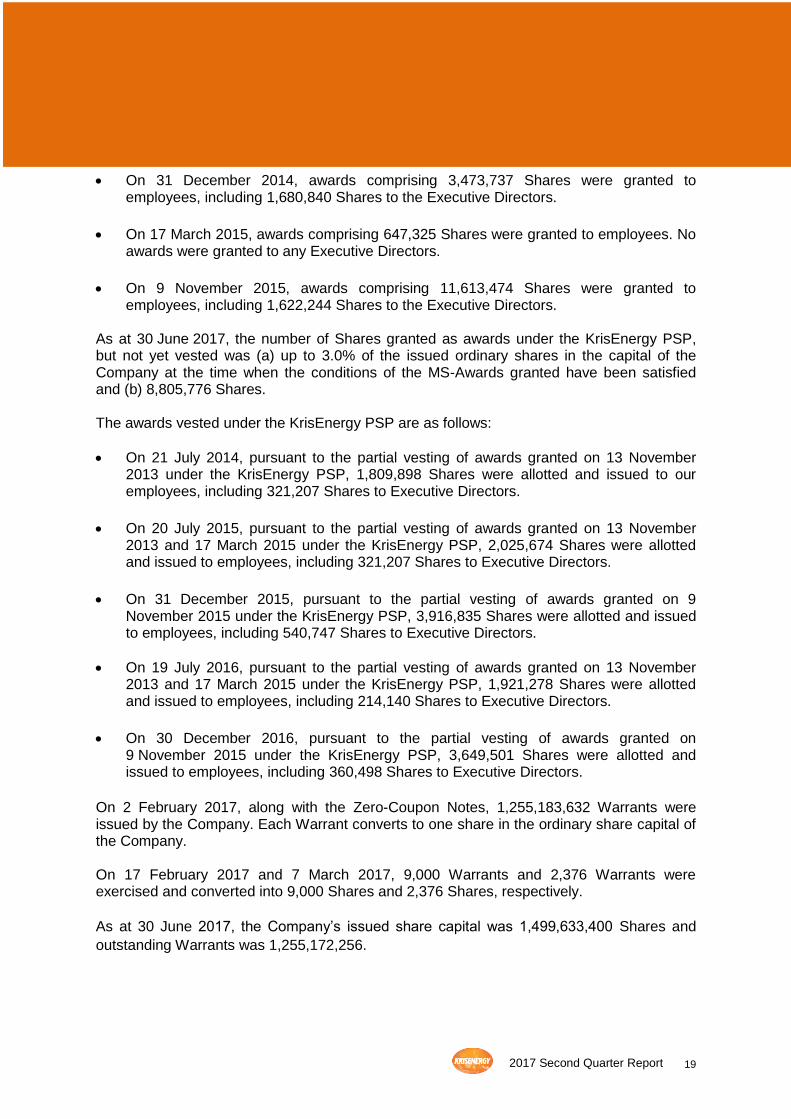
• On 31 December 2014, awards comprising 3,473,737 Shares were granted to employees, including 1,680,840 Shares to the Executive Directors.
• On 17 March 2015, awards comprising 647,325 Shares were granted to employees. No awards were granted to any Executive Directors.
• On 9 November 2015, awards comprising 11,613,474 Shares were granted to employees, including 1,622,244 Shares to the Executive Directors.
As at 30 June 2017, the number of Shares granted as awards under the KrisEnergy PSP, but not yet vested was (a) up to 3.0% of the issued ordinary shares in the capital of the Company at the time when the conditions of the MS-Awards granted have been satisfied and (b) 8,805,776 Shares. The awards vested under the KrisEnergy PSP are as follows:
• On 21 July 2014, pursuant to the partial vesting of awards granted on 13 November 2013 under the KrisEnergy PSP, 1,809,898 Shares were allotted and issued to our employees, including 321,207 Shares to Executive Directors.
• On 20 July 2015, pursuant to the partial vesting of awards granted on 13 November 2013 and 17 March 2015 under the KrisEnergy PSP, 2,025,674 Shares were allotted and issued to employees, including 321,207 Shares to Executive Directors.
• On 31 December 2015, pursuant to the partial vesting of awards granted on 9 November 2015 under the KrisEnergy PSP, 3,916,835 Shares were allotted and issued to employees, including 540,747 Shares to Executive Directors.
• On 19 July 2016, pursuant to the partial vesting of awards granted on 13 November 2013 and 17 March 2015 under the KrisEnergy PSP, 1,921,278 Shares were allotted and issued to employees, including 214,140 Shares to Executive Directors.
• On 30 December 2016, pursuant to the partial vesting of awards granted on 9 November 2015 under the KrisEnergy PSP, 3,649,501 Shares were allotted and issued to employees, including 360,498 Shares to Executive Directors.
On 2 February 2017, along with the Zero-Coupon Notes, 1,255,183,632 Warrants were issued by the Company. Each Warrant converts to one share in the ordinary share capital of the Company. On 17 February 2017 and 7 March 2017, 9,000 Warrants and 2,376 Warrants were exercised and converted into 9,000 Shares and 2,376 Shares, respectively.
As at 30 June 2017, the Company’s issued share capital was 1,499,633,400 Shares and
outstanding Warrants was 1,255,172,256.

20 2017 Second Quarter Report
1 (d)(iii) To show the total number of issued shares excluding treasury shares as at
the end of the current financial period and as at end of the immediately preceding
year
SHARE CAPITAL As at 30 June 2017 As at 31 December 2016
(unaudited) No. of shares US$ No. of shares US$ Issued and fully paid ordinary shares
At 1 January 1,499,622,024 1,874,528 1,494,051,245 1,867,564
Vesting of equity-settled transactions with employees on 19 July 2016
- - 1,921,278 2,402
Vesting of equity-settled transactions with employees on 30 December 2016
- - 3,649,501 4,562
Warrants exercised on 17 February 2017
9,000 11 - -
Warrants exercised on 7 March 2017 2,376 3 - -
At reporting date 1,499,633,400 1,874,542 1,499,622,024 1,874,528
SHARE PREMIUM As at 30 June 2017 As at 31 December 2016
(unaudited) US$
At 1 January 729,529,098 727,245,039
Vesting of equity-settled transactions with employees on 19 July 2016
- 1,412,187
Vesting of equity-settled transactions with employees on 30 December 2016
- 871,872
Warrants exercised on 17 February 2017
978 -
Warrants exercised on 7 March 2017 259 -
At reporting date 729,530,336 729,529,098
1 (d)(iv) A statement showing all sales, transfers, disposal, cancellation and/or use of
treasury shares as at end of the current financial period reported on.
There were no sales, transfer, disposal, cancellation and/or use of treasury shares as at 30 June 2017 (30 June 2016: Nil).
2. Whether the figures have been audited, or reviewed and in accordance with which
standard (e.g. the Singapore Standard on Auditing 910 (Engagements to Review
Financial Statements), or an equivalent standard) The financial statements have not been audited or reviewed by the Group’s external auditors.
3. Where the figures have been audited or reviewed, the auditor’s report (including
any qualifications or emphasis of matter) Not applicable.
21 2017 Second Quarter Report
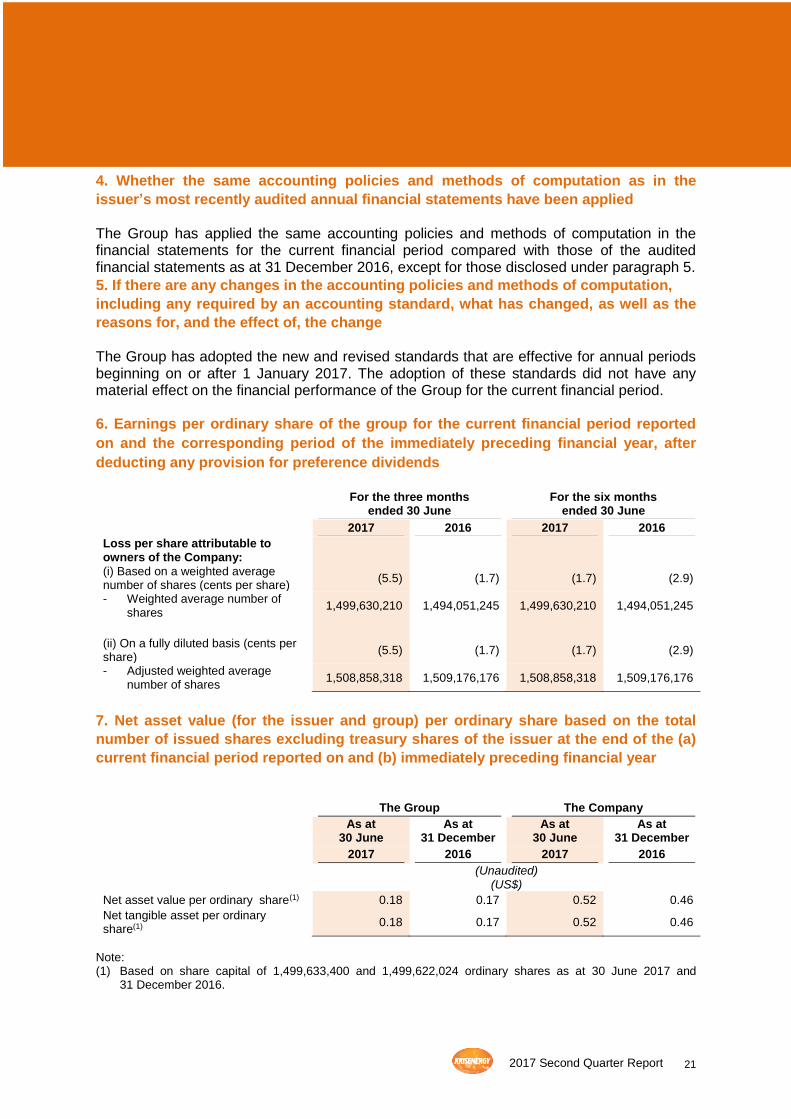
4. Whether the same accounting policies and methods of computation as in the
issuer’s most recently audited annual financial statements have been applied The Group has applied the same accounting policies and methods of computation in the financial statements for the current financial period compared with those of the audited financial statements as at 31 December 2016, except for those disclosed under paragraph 5.
5. If there are any changes in the accounting policies and methods of computation,
including any required by an accounting standard, what has changed, as well as the
reasons for, and the effect of, the change
The Group has adopted the new and revised standards that are effective for annual periods beginning on or after 1 January 2017. The adoption of these standards did not have any material effect on the financial performance of the Group for the current financial period. 6. Earnings per ordinary share of the group for the current financial period reported
on and the corresponding period of the immediately preceding financial year, after
deducting any provision for preference dividends
For the three months
ended 30 June For the six months
ended 30 June
2017 2016 2017 2016
Loss per share attributable to owners of the Company:
(i) Based on a weighted average number of shares (cents per share)
(5.5) (1.7) (1.7) (2.9)
- Weighted average number of shares
1,499,630,210 1,494,051,245 1,499,630,210 1,494,051,245
(ii) On a fully diluted basis (cents per share)
(5.5) (1.7) (1.7) (2.9)
- Adjusted weighted average number of shares
1,508,858,318 1,509,176,176 1,508,858,318 1,509,176,176
7. Net asset value (for the issuer and group) per ordinary share based on the total
number of issued shares excluding treasury shares of the issuer at the end of the (a)
current financial period reported on and (b) immediately preceding financial year
The Group The Company
As at 30 June
As at 31 December
As at 30 June
As at 31 December
2017 2016 2017 2016
(Unaudited) (US$)
Net asset value per ordinary share(1) 0.18 0.17 0.52 0.46
Net tangible asset per ordinary share(1)
0.18 0.17 0.52 0.46
Note:
(1) Based on share capital of 1,499,633,400 and 1,499,622,024 ordinary shares as at 30 June 2017 and 31 December 2016.

22 2017 Second Quarter Report
8. A review of the performance of the group, to the extent necessary for a reasonable
understanding of the group’s business. It must include a discussion of (a) any
significant factors that affected the turnover, costs, and earnings of the group for the
current financial period reported on, including (where applicable) seasonable or
cyclical factors and (b) any material factors that affected the cash flow, working
capital, assets or liabilities of the group during the current financial period reported
on
The following table sets forth a selected summary of our income statement and non-IFRS financial data for the three months and six months ended 30 June 2017.
For the three months
ended 30 June For the six months
ended 30 June
2017 2016 2017 2016
(unaudited)
(US$ thousands)
Sales of crude oil 32,466.7 25,969.5 58,883.2 53,601.6
Sales of gas 4,207.9 4,739.2 9,595.3 10,218.1
Revenue 36,674.6 30,708.7 68,478.5 63,819.7
Cost of sales:
Operating costs (26,540.0) (13,396.9) (38,890.1) (32,593.1)
Thai petroleum royalties paid (2,851.5) (2,516.2) (5,508.9) (5,235.4)
Depreciation, depletion and amortisation
(14,871.6) (22,749.2) (30,214.4) (50,725.1)
Gross loss (7,588.5) (7,953.6) (6,134.9) (24,733.9)
Other income 1,239.0 1,116.1 6,889.9 13,080.6
General and administrative expenses (5,845.0) (8,489.8) (12,871.7) (16,095.1)
Other operating (expenses)/income (57,189.9) 213.8 20,330.7 285.6
Finance income 70.6 61.7 157.7 109.2
Finance costs (11,269.0) (9,775.0) (31,841.1) (17,139.2)
Loss before tax (80,582.8) (24,826.8) (23,469.4) (44,492.8)
Tax expense (1,238.9) (348.3) (2,629.5) (751.3)
Loss for the period (81,821.7) (25,175.1) (26,098.9) (45,244.1)
Loss for the period attributable to:
Owners of the Company (81,821.7) (25,175.1) (26,098.9) (43,461.0)
Non-controlling interests - - - (1,783.1)
(81,821.7) (25,175.1) (26,098.9) (45,244.1)
For the three months ended 30 June
For the six months ended 30 June
2017 2016 2017 2016
(unaudited)
(US$ thousands)
Revenue 36,674.6 30,708.7 68,478.5 63,819.7
Adjusted operating costs (26,540.0) (13,396.9) (38,890.1) (32,593.1)

23 2017 Second Quarter Report
For the three months ended 30 June
For the six months ended 30 June
2017 2016 2017 2016
(unaudited)
(US$ thousands)
Thai petroleum royalties paid (2,851.5) (2,516.2) (5,508.9) (5,235.4)
Gross profit before depreciation, depletion and amortisation
7,283.1 14,795.6 24,079.5 25,991.2
Corporate general and administrative expenses
(2,618.5) (2,861.9) (3,687.3) (4,987.2)
Gain on restructuring of the 2017 Notes to 2022 Notes and the 2018 Notes to 2023 Notes
- - 1,438.4 -
Gain on sale of subsidiary - - - 10,607.1
EBITDAX 4,664.6 11,933.7 21,830.6 31,611.1
Geological and geophysical expenses
(1,851.8)
(4,281.0)
(3,416.4)
(8,164.9)
Exploration expenses (95.1) - (95.1) -
EBITDA 2,717.7 7,652.7 18,319.1 23,446.2
Revenue Working interest production in 2Q2017 averaged 12,649 boepd, a 23.9% decrease from the same period last year (2Q2016: 16,611 boepd), mainly due to lower production from the Wassana oil field in the Gulf of Thailand where the Group holds an 89.0% working interest.
Revenue for 2Q2017 amounted to US$36.7 million (2Q2016: US$30.7 million), as a result of higher average realised selling price for both crude oil and natural gas, despite the decrease in sales volume. The average realised oil and liquids sales price in 2Q2017 increased 40.2% to US$46.11/bbl (2Q2016: US$32.90/bbl). The average realised gas price achieved at B8/32 & B9A in 2Q2017 was US$4.11/mcf, 23.4% higher than a year ago (2Q2016: US$3.33/mcf) due to a price adjustment in the second quarter of 2017.
For the three months ended 30 June
For the six months ended 30 June
2017 2016 2017 2016
Production volumes
Oil and liquids (bopd) 6,864 10,571 7,304 11,684
Gas (mmcfd) 34.7 36.2 34.9 36.8
Total (boepd) 12,649 16,611 13,127 17,812
Average sales price
Oils and liquids (US$/bbl) 46.11 32.90 46.49 26.33
Gas – B8/32 and B9A (US$/mcf) 4.11 3.33 3.84 3.73
Gas – Block 9 (US$/mcf) 2.31 2.32 2.31 2.32
Cost of Sales In line with higher revenue, operating costs increased to US$26.5 million in 2Q2017 (2Q2016: US$13.4 million). The decline in production, predominantly from the Wassana oil field, resulted in the higher average lifting cost of US$23.06/boe (2Q2016: US$8.86/boe). The Group’s operating costs for each of its assets are largely fixed costs in nature however, in line with our accounting policies, operating costs incurred during the production period are

24 2017 Second Quarter Report
only recognised at the point of lifting, thereby giving rise to timing differences between the fixed operating expenditure and the recognition of such expenses. In 2Q2017, DD&A charges were halved to US$14.9 million (2Q2016: US$22.7 million) as a result of decreased production and lower asset carrying value due to the impairment charges the Group recognised in 2016.
For the three months ended 30 June
For the six months ended 30 June
2017 2016 2017 2016
Average lifting cost
Oil, liquids and gas (US$/boe) 23.06 8.86 16.37 10.05
Operating costs (US$’000) 26,540.0 13,396.9 38,890.1 31,012.7
Total production (boe) 1,151,074 1,511,605 2,375,951 3,241,840
Other income Other income was US$1.2 million in 2Q2017 compared with US$1.1 million in 2Q2016. The 11.0% increase was mainly due to higher timewrite income and joint operator overhead charges. General and administrative expenses General and administrative expenses decreased to US$5.8 million in 2Q2017 (2Q2016: US$8.5 million) due to lower general and administrative expenses incurred at the Company’s Thailand office. Other operating expenses/income Other operating expenses amounted to US$57.2 million in 2Q2017 as compared to an income of US$0.2 million in 2Q2016. In 2Q2017, the Group recognised a unaudited impairment charge of US$52.3 million in relation to the working interest in the Block A Aceh PSC, following the completion of the farm-out transaction; and wrote off US$6.2 million of joint operation receivables related to the relinquishment of the Kutai PSC. These expenses were partially offset by the net gain on fair value adjustment of derivatives amounting to US$1.3 million in 2Q2017 (2Q2016: US$0.2 million). Finance income Finance income was higher year-on-year due to higher average bank balances in 2Q2017. Finance costs Finance costs amounted to US$11.3 million in 2Q2017 (2Q2016: US$9.8 million), as a result of non-cash accretion of bond discount in relation to the 2022 Notes, 2023 Notes and the zero coupon notes amounting to US$4.9 million; and interest expenses on the 2022 Notes, 2023 Notes and RCF amounting to US$7.6 million. Loss before tax The loss before tax in 2Q2017 of US$80.6 million (2Q2016: US$24.8 million) was mainly attributable to the unaudited impairment of our working interest in the Block A Aceh PSC, following the completion of the farm-out to Medco in April, amounting to US$52.3 million.
25 2017 Second Quarter Report
Tax expense Tax expense amounted to US$1.2 million in 2Q2017 (2Q2016: US$0.3 million) due to higher provision of tax expense in line with higher revenue. Loss for the period The net loss for the period was US$81.8 million in 2Q2017 (2Q2016: US$25.2 million) as a result of the above mentioned factors.
9. Where a forecast, or a prospect statement, has been previously disclosed to
shareholders, any variance between it and the actual results
No forecast or prospect statement was previously provided.
10. A commentary at the date of the announcement of the significant trends and
competitive conditions of the industry in which the group operates and any known
factors or events that may affect the group in the next reporting period and the next
12 months
There remains a great deal of uncertainty and volatility relating to global commodity markets and the impact on the upstream oil and gas sector. The Company therefore continues to take all available measures to reduce its cost base and curtail discretionary expenditure for the foreseeable future.
Recent Developments
• On 19 July 2017, pursuant to final vesting of awards granted on 17 March 2015 under the KrisEnergy PSP, 205,154 Shares were allotted and issued to our employees. Our issued share capital increased to 1,499,838,554.
• Drilling has commenced of the first development well at the Julu Rayeu field location in
Block A Aceh. This gas accumulation will be utilised to fuel infield facilities.
• The Royal Government of Cambodia has approved the signing of the petroleum agreement for Cambodia Block A on 23 August 2017.
11. Dividend
(a) Any dividend declared for the current financial period reported on
None.
(b) Any dividend declared for the corresponding period of the immediately preceding financial year
None.
(c) Date payable
Not applicable.

26 2017 Second Quarter Report
(d) Books closure date
Not applicable. 12. If no dividend has been declared / recommended, a statement to that effect
No dividend has been declared or recommended for the three months ended 30 June 2017.
13. If the group has obtained a general mandate from shareholders for Interested
Person Transactions (“IPTs”), the aggregate value of such transactions as required
under Rule 920(1)(a)(ii). If no IPT mandate has been obtained, a statement to that
effect
There were no interested person transactions during the financial period under review.
As at 30 June 2017, the Group did not have any general IPT mandate from shareholders for interested person transactions that is to be disclosed under Rule 920(1)(a)(ii).
14. Disclosure of the status on the use of proceeds from the Preferential Offering
Pursuant to the Preferential Offering, on 2 February 2017, the Company received net proceeds from the issue of the Zero-Coupon Notes of S$135.3 million (US$95.8 million) after deducting for related expenses of approximately S$2.7 million (US$2.0 million). The following table sets out the use of the Preferential Offering net proceeds as at the date of these Results.
Allocation of Preferential
Offering Proceeds(1)
Preferential Offering Proceeds
utilised as at 23 April 2017
Preferential Offering Proceeds
utilised as at 24 July 2017
Balance of Preferential
Offering Proceeds
(US$ million)
Capital expenditures (relating to the Group’s existing assets) 41.2 34.3 41.2(2) -
Repay Bridge Upsize 48.0 48.0 48.0 -
General working capital 6.6 6.6 6.6 -
Total 95.8 88.9 95.8 -
Notes:
(1) Estimated net proceeds from the Preferential Offering disclosed in the Offering Memorandum dated
6 January 2017 were US$94.8 million and the actual net proceeds received by the Company were
US$95.8 million.
(2) Mostly related to expenditure at G10/48.
As at the date of these Results, net proceeds of the Preferential Offering have been fully utilised.

27 2017 Second Quarter Report
CONFIRMATION BY THE BOARD OF DIRECTORS
Pursuant to SGX Listing Rule 705(5), we, Tan Ek Kia and Jeffrey S. MacDonald, being two directors of KrisEnergy Ltd. (the “Company”), do hereby confirm on behalf of the directors of the Company that, to the best of their knowledge, nothing has come to the attention of the board of directors of the Company which may render the financial results for the second quarter and six months ended 30 June 2017 to be false or misleading in any material aspect. On behalf of the board of directors.
Tan Ek Kia Jeffrey S. MacDonald Non-Executive Chairman Executive Director &
Interim Chief Executive Officer
Singapore, 14 August 2017