Embed Size (px)
DESCRIPTION
KR_ammonia Synthesis Section 22.7
Citation preview

1018 KEMAND RIEGEL'S HANDBOOK OF INDUSTRIAL CHEMISTRY AND BIOTECHNOLOGV
N a t u r a l gas, naphtha c
Hydro treat ing
C V I 3 * m & n u _ _ _ - rn reforming
- r e f o r m i n g -
L a, 5 Air 1 m reforming 0
Fuel oil, coal I
P a r t i a l oxidation
'2' and '0s c
Puri f icat ion removal
I b
Clsus p l a n t
' 2 t s
Ammonia synthesis
1 I
Ammonia
Alternative process steps for generation and purification of synthesis gas. (Courtesy of Wilev- VCH. Bakemeier, H., Huberich,T., et al.: "Ammonia" in Ullrnann's Encyclopedia of Industrial Chemistry, 5th Ed., Vol. A 2, VCH Verlagsgesellschaft, Weinheirn 1985, pp. 143-242.
If sulfur is present as H,S or COS, it is a poison for many catalysts and will partly or completely inhibit the catalyst activity.46 Carbon monoxide (CO) and carbon dioxide (CO,) can poison the ammonia synthesis cat- alyst so both of these compounds must be removed.53
After the sulfur is removed, most tradi- tional ammonia processes have employed the purification steps that are shown in Figs. 22.4 and 22.6. However, ammonia plants have been built that use hydrogen purification via PSA, membrane separation with polymeric membranes, and cryogenic separation. PSA achieves the greatest product purities (about 99.999% pure hydrogen), but it is capital- intensive. Polymeric membranes are the least capital-intensive, but they achieve the lowest
purity (about 96 to 98%). In 1998 PSA was considered the standard process for high- purity hydrogen recovery from raw synthesis gas. It has replaced the traditional steps of the shift conversion of carbon monoxide followed by carbon dioxide removal by absorption and then final purification by methanation. Characteristics of these three purification technologies are outlined in Table 22.
Purification with PSA and Polymeric Membranes. The PSA process is based on the selective adsorption of gaseous com- pounds on a fixed bed of solid adsorbent in a series of identical adsorption beds. The adsorbent is an active carbon or a carbon- molecular sieve. Each bed undergoes a
Previous Page

SYNTHETIC NITROGEN PRODUCTS 1019
TABLE 22.10
Characteristic Membrane Absorption Cryogenics
Hydrogen Recovery Technology C h a r a c t e r i ~ t i c s ~ ~ 3 ~ ~
Hydrogen purity (%) < 95 99.9+ 95-99 Hydrogen recovery (%) < 90 75-90 90-98 Hydrogen product pressure < Feed pressure Feed pressure Variable Byproducts available No No Yes Feed pressure (psig) 250 to 1800 250 to 500
repetitive cycle of adsorption and regenera- tion ~ t e p s . ’ ~ ’ , ’ ~ ~ PSA provides the hydrogen at about the same pressure as the feed, but recoveries are typically lower than from other technol~gies.”~
The first purification plant that used PSA was developed by Union Carbide Corporation (UCC) and was built at the Yokkaichi Plant of Mitsubishi Petrochemical Industries in 1971 .4 The process is now licensed by UOP, and more than 400 units were operating world- wide in 1992.l
The HYSEC Process was developed by Mitsubishi Kakoki K. and Kansai Coke & Chemicals. It has basically the same PSA unit as the UCC Process. After the main PSA beds, trace amounts of remaining oxygen are removed by a deoxo catalytic converter fol- lowed by a zeolitic deh~midif ier .~
The LO-FIN (Last Out - First In) includes a unique gas-retaining vessel that preserves the concentration gradient in one stream before using it to repressurize another bed. This process was jointly developed by Toyo Engineering and Essex C~rpora t ion .~
The Sumitomo-BF PSA process uses car- bon molecular sieves (CMS) as the selective adsorbent .4
Monsanto and Ube (Japan) developed membrane processes for purification of hydrogen gas mixtures. This process is based on the selective diffusion of hydrogen through semi-permeable membranes in the form of hollow fibers. The Monsanto PRISMa separator process (owned by Air Products as of 2004) uses a polysulfone fiber whereas Ube uses an aromatic polyimide fiber.46
Conventional polymeric hydrogen separa- tion membranes yield hydrogen at low
pressure. Air Products has demonstrated a carbon membrane on an alumina support that removes hydrocarbons from hydrogedhydro- carbon mixtures and leaves the hydrogen at high pressure.40
For ultra-high-purity hydrogen (up to 99.9999% pure), high-pressure gas passes over heated palladium membranes. Johnson Matthey is believed to be the leading supplier of these membranes. In 1996, Generex (Tryon, NC) licensed newly developed palla- dium membrane technology from Los Alamos National Laboratories. In 1998 Wah Chang, an Allegheny Teledyne Company, purchased all patents and rights to the hydrogen metal membrane technology that Bend Research developed.40
US Patent 6,183,542 was issued in 2001 for a palladium membrane process. This process provides an apparatus that can handle high flow rates of gas while using a minimal amount of hydrogen-permeable material.
Proton Energy Systems (Rocky Hill, CT) received US Patent 6,168,705 in 2001 for an electrochemical gas purifier system that can purify and simultaneously compress hydrogen from a dirty gas stream without relying on moving parts. Final hydrogen gas pressures can exceed 2000 psig.
The companies that supply PSA and membrane separation systems are listed in Reference 40.
Carbon Monoxide Shift. The water gas shift conversion or the carbon monoxide shift reaction is one of the traditional purification steps that are found in many ammonia plants. The CO must be removed because it acts as a poison to the catalyst that is used in ammonia synthesis.

1020 KENTAND RIEGEL‘S HANDBOOK OF INDUSTRIAL CHEMISTRY AND BIOTECHNOLOGY
The carbon monoxide shift removes most of the CO from the synthesis gas and also pro- duces more hydrogen.
or if CO, is present, any of these compounds will be a poison for many catalysts and will partly or completely inhibit catalyst activity.
CO + H,O $ H, + CO, Homogenous Water Gas Reaction (Water Gas Shift)
AH = - 10 kcal/mol or 42 kJ/mol (22-2a)
The “shift” from CO to CO, occurs in two steps. In the high temperature shift (HTS) conversion, the synthesis gas is passed through a bed of iron oxidelchromium oxide catalyst at around 400°C. The CO content of the gas is reduced to about 3 percent (on a dry gas basis). Additional details about the HTS step are given in References 53 and 70.
The gas from the HTS is cooled to increase the conversion, and then it is passed through the low temperature shift (LTS) converter. The LTS converter is filled with copper oxidelzinc oxide-based catalyst and operates at about 200-220°C. The residual CO content is about 0.2 to 0.4 percent (on a dry gas basis).s3
In some plants the two shift reactions are combined in a medium temperature shift con- version. When the feed gas is not desulfur- ized, the CO conversion is called sour gas shift and a sulfur-resistant catalyst is USed.62,63,73,83,94, 166
Removal of Suljiur Compounds and Carbon If sulfur is present as H,S or COS Dioxide.
The point at which sulfur removal is employed depends on the synthesis gas process that is used. Table 22.1 1 lists many of the processes that are a ~ a i l a b l e . ~ ~
The Amine Guard is a corrosion inhibitor that was developed by Union Carbide. It is added to the MEA solvent and allows MEA concentration to be increased. The higher MEA concentration leads to a lower circula- tion flow rate and a lower energy demand dur- ing r egene ra t i~n .~~
As shown in Figs. 22.4, 22.6, and 22.8, the CO, removal step is normally after the shift conversion step. The process gas from the LTS converter contains mainly hydrogen, nitrogen, CO,, and excess process steam. The gas is cooled and most of the excess steam is condensed before it enters the CO, removal system. This condensate normally contains 1500 to 2000 ppm of ammonia and 800 to 1200 ppm of methanol. Therefore it should be stripped or recycled.
The heat that is released during the cool- ing/condensation can be used: to regenerate CO, scrubbing solution, to drive an absorption
TABLE 22.11 from Synthesis Gas
Process Name Key Chemical(s)
Processes for Removal of Carbon Dioxide and Sulfur Compounds
The Alkazid process: The AMDEA process The Benfield process The Carsol process The Catacarb process The Fluor Solvent process The Giammarco-Vetrocoke process The Hi Pure process The Purisol process from Lurgi The Rectisol process The Selexol process The Shell Sulfinol process Pressurized washing
Alkali salts of amino acids (N-Methylaminopropionic acid) Activated Methyl Diethanolamine Hot potassium carbonate Potassium carbonate Hot potassium carbonate Propylene carbonate Potassium carbonate with arsenite Two-stage hot potassium carbonate washing N-Methyl-2-Pyrrolidone (NMP) Low temperature methanol Dimethyl ethers of polyethylene glycol Di-isopropanolamine dissolved in sulfolane and water Monoethanolamine (MEA) or diglycolamine

SYNTHETIC NITROGEN PRODUCTS 1021
refrigeration unit, or to preheat boiler feedwa- ter. The amount of heat released depends on the process steam to carbon ratio (see Tables 22.8 and 22.9). If all this low-level heat is used for CO, removal or absorption refrigera- tion, then high-level heat has to be used for the feedwater system. An energy-efficient process should therefore have a CO, removal system with a low heat demand.53
The CO, is removed in either a chemical, a hybrid, or a physical absorption process. Residual CO, contents are usually in the range of 50 to 1000 ppmv, depending on the type and design of the removal unit. The phys- ical absorption processes may be designed for zero heat consumption. But for comparison with the chemical processes, the mechanical energy requirements have to be ~ o n s i d e r e d . ~ ~
Alkazid Process
The Alkazid process removes sulfur com- pounds from gas streams. All the sulfur com- pounds are first catalytically hydrogenated to hydrogen sulfide (H2S) using a cobalt/molyb- dena catalyst. The H,S is then absorbed in an aqueous solution of a potassium salt of either methylamino propionic acid (“Alkazid M”), or dimethylamino acetic acid (“Alkazid DIK’). This solution is heated to regenerate the hydrogen sulfide as a concentrate. This concentrate is then treated by the Claus process to recover the sulfur.’
aMDEA Process
The aMDEA (Activated Methyl Diethanola- mine) process removes CO,, H,S, and trace sulfur compounds from natural gas and syn- gas via a pressurized wash with activated diethanolamine. This process was developed by BASF and in 2002 it was used in more than 140 plants.’
Benfield Process
The Benfield (Benson and Field) process removes carbon dioxide, H,S, and other acid gases from industrial gas streams by scrub- bing with hot aqueous potassium carbonate
that contains activators. The chemical reac- tions are: 1,46
K2C03 + C 0 2 + H2O 2 KHC03 (22-13)
K2C03 + H2S @ KHS + KHC03 (22-14)
Process details are given in References 65 and 88. The process was invented in 1952 and is now licensed by UOP. More than 700 plants were operating in 2000.’
Catacarb Process
The Catacarb (Catalyzed Removal of Carbon Dioxide) process removes carbon dioxide and hydrogen sulfide from gas streams by adsorp- tion in a hot potassium carbonate solution that contains a proprietary catalyst. The process was developed and licensed by Eickmeyer and Associates based on work at the U.S. Bureau of Mines in the 1950s. More than 100 plants were operating in 1997.’
Fluor Solvent Process
The Fluor Solvent Process removes CO, from natural gas and various industrial gas streams by dissolving the CO, in a propylene carbon- ate solvent.’ Additional details are given in References 67 and 68. The process was invented in 1958 by the Fluor Corporation and can be licensed from Fluor Daniel. By 1985, 13 plants were operating.’
G i a m m a r co - Ve t roc o ke Process
Two processes are known by the Giammarco- Vetrocoke name. Both processes use an aque- ous solution of sodium or potassium carbonate and arsenite to absorb acid gases. Some varia- tions of the process use glycine instead of arsenite to activate the potassium carbonate solution. In one process, the solution is used to extract carbon dioxide from natural gas or syn- thesis gas. In the other, hydrogen sulfide is extracted from coke-oven or synthesis gas and yields elemental sulfur from a complex sequence of reactions. In 1992, more than 200 plants were operating. 1,66

1022 KENTAND RIEGEL'S HANDBOOK OF INDUSTRIAL CHEMISTRY AND BIOTECHNOLOGY
Hi Pure Process
The Hi Pure process is a variation of the Benfield process. It uses two stages of scrub- bing by hot potassium carbonate solution to reduce the CO, content of gases to very low levels.
Purisol Process
The Purisol process removes H,S from gases by selective absorption in N-methyl-2- pyrrolidone (NMP). It was developed and licensed by Lurgi, particularly for desulfur- izing waste gases from IGCC (Integrated Gasification Combined Cycle) coal gasifica- tion plants. However the technology might be applied to some synthesis gas processes. In 1996, seven Purisol units were either in oper- ation or under construction.'
Rectisol Process
The Rectisol process was originally devel- oped to remove sulfur and acid gas com- pounds from gas mixtures that are produced from the partial oxidation of hydrocarbons. It is based on pressurized washing with low- temperature methanol, which results in the physical absorption of the sulfur compounds in the methanol. The process was originally developed in 1951 by Lurgi for the SASOL coal gasification plant in South Africa. The process was further developed by Linde and is now offered for licensing by both companies for the removal of CO,, H,S, HCN, C6H6 (benzene), and gum-forming hydrocarbons from syngas and fuel gas. In 2003, over 70 units were in operation or under construc- tion. I
Selexol Process
The Selexol process removes acid gases from hydrocarbon gas streams by selective absorp- tion in polyethylene glycol dimethyl ether (DMPEG). It absorbs H,S, CO,, COS, and mercaptans. The process has been used to remove carbon dioxide from syngas, natural gas, and coal gas. The process was developed by Allied Chemical in the 1960s and is now
offered for license by UOP. Over 55 units were operating in 2002.'
Shell Sulfinol Process
The Shell Sulfinol process removes H,S, CO,, COS, and organic sulfur compounds from natural gas by scrubbing with di- isopropanolamine dissolved in a mixture of sulfolane (C,H,SO,) and water. It was devel- oped in the 1960s by Shell. In 1997, over 200 commercial units were operating or under construction.
Pressure Washing w i t h Monoethanolamine (MEA)
In this process, a 15 to 30 percent solution of MEA in water is used to absorb the CO, under pressure. The solution is then regener- ated by heating it in a stripper to release the CO,. This process is characterized by good CO, absorption properties at low pressure. However high regeneration energy consump- tion limits its use.
If the Amine Guard corrosion inhibitor is used, the MEA concentration in the circulat- ing solution can be increased to 30 percent from a normal 20 percent. Hence, the circu- lating rate can be decreased by 33 percent and the heat requirements are decreased by 43 percent.69 The Amine Guard technology is licensed by UP0.200
Retrofits of CO, Removal System
In a CO, removal system that uses wet scrub- bing, the existing towers are the major limit to more capacity because they are expensive to replace. In an amine system, absorption increases as amine concentration increases. But a higher amine concentration requires (1) more filtration to clean the solution and (2) the addition of corrosion inhibitors. Another option is to change from monoethanolamine (MEA) to methyl diethanolamine (MDEA).86
In a potassium carbonate system, different additives can be used to increase the CO, absorption rate. In any wet scrubbing system, a change from random to structured packing

SYNTHETIC NITROGEN PRODUCTS 1023
can lead to higher solvent circulation rates and improved mass transfer.86
per pass and reduced purge flow result in a more efficient process.53 The KBR Purifier is an example of this process.81 Fifteen KBR Purifier plants have -been built since 1966. These plants range in capacity from 680 to 1750 tonnes per day, and as of 200 1 all fifteen
Final Purification of Synthesis Gas
Before the synthesis gas enters the ammonia synthesis loop, essentially all of the oxygen compounds must be completely removed to (1) avoid poisoning the ammonia synthesis catalyst and (2) keep CO, from forming car- bamates and ammonium carbonate in the syn- thesis loop. It is also advantageous to remove the inert gases (methane, argon, etc.) to achieve a higher synthesis conversion per pass.74
Methanation. In a steam reforming process that includes CO shift conversion and CO, removal, the synthesis gas still contains 0.1 to 0.2 mole percent CO and 100 to 1000 ppmv of CO,. The following reactions are the simplest method for eliminating these small concentrations of oxygen compounds.
plants are still operating.81
Dehydration. If the makeup gas to the ammonia synthesis loop is absolutely free of catalyst poisons, such as H,O and CO,, it can flow directly to the ammonia synthesis con- verter. This leads to the most favorable arrangement from a minimum energy point of view. This can be accomplished by allowing the gas that leaves the methanation step to pass through beds of molecular sieves to remove water and C0,,74
Liquid Nitrogen Wash. In many partial oxidation syngas processes, liquid nitrogen scrubbing is used to remove the carbon monoxide that remains after the shift
CO + 3 H2 8 H,O + CH4 AH = -49.27 kcal/mol or 206 kJ/mol (22-1 1)
C 0 2 + 4 H2 8 2 H 2 0 + CH, Methanation
AH = -39.44 kcal/mol or 165 kJ/mol (22-12)
The normal methanation operating temper- ature is 250°C to 3OO0C, and a large excess of hydrogen is present. The equilibrium lies far to the right side of the above reactions so the CO and CO, impurities can be reduced to about 5 ppm.'O Additional catalyst and process details are given in References 74,75, 77, and 78.
Cryogenic Purification. In the cryogenic purifier all the methane and the excess nitro- gen are removed from the synthesis gas as well as a part of the argon. The cooling is pro- duced by depressurization and no external refrigeration is needed. The purified syngas is then practically free of all impurities, except for a small amount of argon. The cryogenic unit also receives the purge from the ammonia synthesis section and delivers an off-gas for fuel. The combination of higher conversion
conversion step. The CO content may be as high as 3 to 5 percent in plants that have only a HTS conversion. The liquid nitrogen wash (1) delivers a gas to the ammonia syn- thesis loop that is free of all impurities (including inert gases) and (2) adds all or part of the nitrogen that is required for ammonia synthesis. The nitrogen is obtained from the air-separation plant that provides the oxygen for the partial oxidation process (see Fig. 22.6)',.
Adjust Hydrogen to Nitrogen Ratio. The optimum ammonia synthesis reaction rate depends on several factors including pressure, temperature, H,-to-N, molar ratio, and cata- lyst activity. Therefore the H,-to-N, molar ratio is adjusted to suit the requirements in ammonia synthesis. This adjustment occurs before the compression step.

1024 KENTAND RIEGEL‘S HANDBOOK OF INDUSTRIAL CHEMISTRY AND BIOTECHNOLOGY
Compression
Ammonia synthesis is normally carried out at a pressure that is higher than that for syn- thesis gas preparation. Therefore the purified synthesis gas to the ammonia synthesis loop must be compressed to a higher pressure.74
Due to several major developments in ammonia process technology, ammonia plants with 1000 to 1500 tonne per day capacities have became the industry stan- dard for new plant construction. In 2001 plants as large as 2000 tonnes per day have become common. These plants have much lower production costs than the earlier gen- eration of smaller plants mainly because steam-driven, centrifugal compressors are used rather than electrically driven, recipro- cating compressor^.^^. 74
AMMONIA SYNTHESIS
The ammonia synthesis reaction is:74
N, + 3 H,$2NH3
AH298 = -45.72 kJ/mol or 11.04 kcal/mol
(22-1 5)
The reaction normally takes place on an iron catalyst. The reaction pressure is in the range of 100 to 250 bar, and temperatures are in the range of 350°C to 550°C. At the usual commercial converter operating con- ditions, the conversion achieved per pass is 20 to 30 percent.53 In most commercial ammonia plants, the Haber recycle loop process is still used to give substantially complete conversion of the synthesis gas. In this process the ammonia is separated from the recycle gas by cooling and condensation. Next the unconverted synthesis gas is sup- plemented with fresh makeup gas, and returned as feed to the ammonia synthesis ~onverter . ’~
Synthesis loop arrangements differ with respect to (1) the points in the loop at which the makeup gas is delivered, (2) where the ammonia is taken out, and (3) where the purge gas is taken (see Fig. 22.9). The best arrangement is shown in Fig. 22.9A. After the gas leaves the ammonia synthesis
converter, ammonia is condensedh-emoved by cooling and the recycle gas is returned to the recycle compressor. This represents the most favorable arrangement from a mini- mum energy point of view. It results in the lowest ammonia content at the entrance to the converter and the highest ammonia con- centration for c~ndensation.’~ The advan- tages and disadvantages of the other arrangements in Fig. 22.9 are described in Reference 74.
Conventional reforming with methanation as the final purification step produces a syn- thesis gas that contains inerts (CH, and argon) in quantities that do not dissolve in the condensed ammonia. Most of the inerts are removed by taking a purge stream out of the synthesis loop. The size of this purge stream controls the level of inerts in the loop at about 10 to 15 percent. The purge gas is scrubbed with water to remove ammonia and then it can be used as fuel or sent to hydrogen recovery. The best point at which to take the loop purge is discussed in Reference 53.
Reaction Rate
Knowledge of the macrokinetics is impor- tant for solving the industrial problem of designing ammonia synthesis reactors, for determining the optimal operating condi- tions, and for computer control of ammonia plants. Some of the considerations are: high pressure promotes a high rate of ammonia formation, high ammonia concentration in the synthesis gas (recycle gas) restricts ammonia formation (see Fig. 22. lo), the rate of formation initially increases with rising temperature but then goes through a maximum as the system approaches ther- modynamic equilibrium (see Fig. 22.1 l), and with lower temperatures, the maximum rate shifts to a lower hydrogen-nitrogen ratio (see Fig. 22.12).74
In 2001 Hyprotech and Synetix announced an ammonia plant simulation that can be used for modeling, online monitoring, and opti- mization of the plant. The simulation includes Synetix reactor models, customized thermo-

Makeup g a s i n
0.20
M a k e u p g a s
----I-
- 30MPa KMI 1.5-3mm
I I + &
A) Synthesis Loop for Pure and Dry Makeup Gas
B) Product recovery After Recycle Compression
C) Product Recovery Before Recycle Compression (Four-Nozzle Compressor Design)
Condensation D) Two Stages of Product
Purge gas - @
M a k e u p g a s 7- b
P u r g e g a s - I c
NH3 a) Ammonia Converter with
b) Ammonia Recovery by
c) Ammonia Recovery by
Heat Exchangers
Chilling and Condensation
Condensation a t Ambient Temperature
d) Synthesis Gas Compressor e) Recycle Compressor
Fig. 22.9. Schematic flow diagrams of typical ammonia synthesis loops.74 (Courtesy of Wiley-VCH. Bakemeier, H., Huberich,T, et al.: "Ammonia" in Ullmann's Encyclopedia of Industrial Chemistry, 5th Ed., Vol. A 2, VCH Verlagsgesellschaft, Weinheim 1985, pp. 143-242.
3x10- I
m Y - 5 4 1
W. 2 10- C .- & " a W
a
\ 30MPa
KMI 1.5-3mm lnerts =1O0A HiN, = 3:l
Temp. =L0OoC
1 5 10 NH, cone,% -
Fig. 22.10. Reaction rate for NH, synthesis. Dependence on the ammonia concentration at vari- ous pressures. (Courtesy of Wiley-VCH. Bakemeier, H., Huberich, T, et. al.: "Ammonia" in Ullmann's En- cyclopedia of Industrial Chemistry, 5th Ed., Vol. A 2, VCH Verlagsgesellschaft,Weinheim 1985, pp. 143-242.

1026 KENTAND RIEGEL'S HANDBOOK OF INDUSTRIAL CHEMISTRY AND BIOTECHNOLOGY
6
5
L
& 1 : c v1 C
2 1
2 0
L 5
W
rn &
v1 v) W
c
.- E L
y 1 3
2
1
0
~ ' ~ 1 0 ~
n 2 2 0 b a r
1:l H,/N, I I I I I I I
3 0 0 320 3LO 3 6 0 3 8 0 LOO L 2 0
140 bar
300 320 3LO 360 380 LOO 6 2 0 o c -
Fig. 22.12. Arnonia synthesis rate constant dependence on hydrogen-nitrogen ratio. (Courtesy of Wiley-VCH. Bakemeier, H., Huberich, T., et. al.: "Ammonia" in Ullmann's Encyclopedia of Industrial Chemistry, 5th Ed., Vol. A 2, VCH Verlagsgesellschaft, Weinheim 1985, pp. 143-242.
dynamic data, and information to simulate the performance of a range of catalysts. The reac- tor models in the simulation include primary and secondary reformers, high-temperature shift converter, low-temperature shift con- verter, methanator, and ammonia synthesis converter.80
Catalysts
When ammonia is made from natural gas using the steam reforming process, several reaction stages are needed and catalysts are key to the economic operation of each stage. The chemistry of the process and the basic materials that make up the catalysts are shown in Fig. 22.1 3.70
For a given operating pressure and a desired production rate, the catalyst determines (1) the operating temperature range, (2) recycle gas flow, and ( 3 ) refrigeration requirements. It also indirectly influences the makeup gas purity requirement^.^^
Industrial catalysts for ammonia synthesis must satisfy the following requirements: (1) high catalyst activity at the lowest possible reaction temperatures, (2) the highest possi- ble insensitivity to oxygen- and chlorine- containing catalyst poisons, ( 3 ) long life, and (4) mechanical strength.
The choice of particle size and shape of commercial ammonia catalysts is determined mainly by the catalyst performance and the pressure drop. From the standpoint of space-

0 I-
I i
I I
1028 KENTAND RIEGEL'S HANDBOOK OF INDUSTRIAL CHEMISTRY AND BIOTECHNOLOGY
time yield it is desirable to use the finest pos- sible particle, which is about 1-2 mm,74
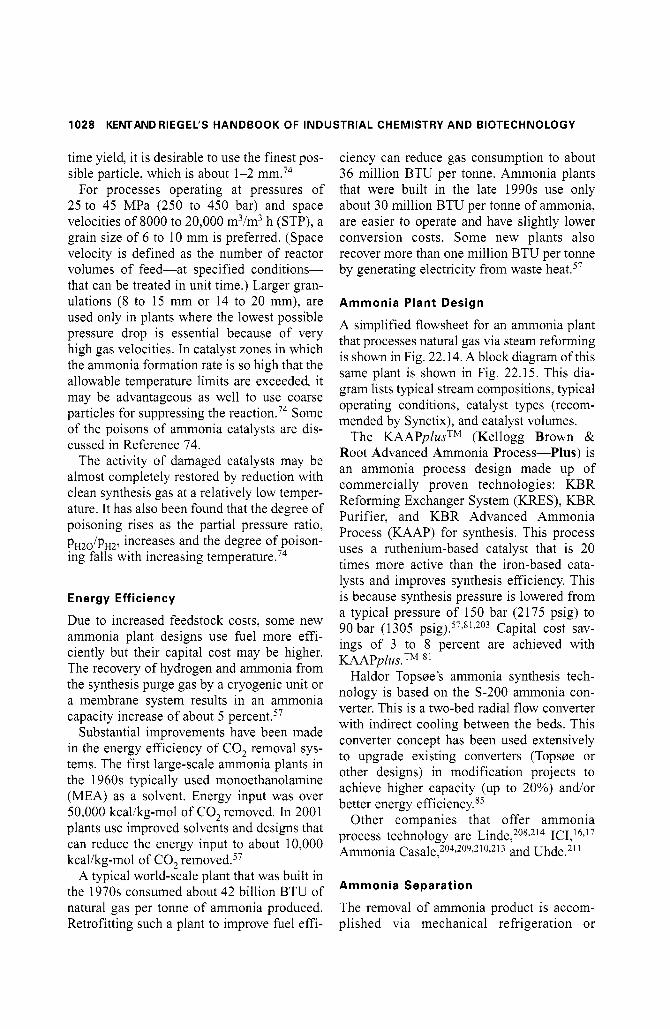
For processes operating at pressures of 25 to 45 MPa (250 to 450 bar) and space velocities of 8000 to 20,000 m3/m3 h (STP), a grain size of 6 to 10 mm is preferred. (Space velocity is defined as the number of reactor volumes of feed-at specified conditions- that can be treated in unit time.) Larger gran- ulations (8 to 15 mm or 14 to 20 mm), are used only in plants where the lowest possible pressure drop is essential because of very high gas velocities. In catalyst zones in which the ammonia formation rate is so high that the allowable temperature limits are exceeded it may be advantageous as well to use coarse particles for suppressing the reaction.74 Some of the poisons of ammonia catalysts are dis- cussed in Reference 74.
The activity of damaged catalysts may be almost completely restored by reduction with clean synthesis gas at a relatively low temper- ature. It has also been found that the degree of poisoning rises as the partial pressure ratio, pH20/pH2, increases and the degree of poison- ing falls with increasing t e m p e r a t ~ r e . ~ ~
Energy Efficiency
Due to increased feedstock costs, some new ammonia plant designs use fuel more effi- ciently but their capital cost may be higher. The recovery of hydrogen and ammonia from the synthesis purge gas by a cryogenic unit or a membrane system results in an ammonia capacity increase of about 5 percent.57
Substantial improvements have been made in the energy efficiency of CO, removal sys- tems. The first large-scale ammonia plants in the 1960s typically used monoethanolamine (MEA) as a solvent. Energy input was over 50,000 kcalikg-mol of CO, removed. In 2001 plants use improved solvents and designs that can reduce the energy input to about 10,000 kcal/kg-mol of CO, removed.57
A typical world-scale plant that was built in the 1970s consumed about 42 billion BTU of natural gas per tonne of ammonia produced. Retrofitting such a plant to improve fuel effi-
ciency can reduce gas consumption to about 36 million BTU per tonne. Ammonia plants that were built in the late 1990s use only about 30 million BTU per tonne of ammonia, are easier to operate and have slightly lower conversion costs. Some new plants also recover more than one million BTU per tonne by generating electricity from waste heat.57
Ammonia Plant Design
A simplified flowsheet for an ammonia plant that processes natural gas via steam reforming is shown in Fig. 22.14. A block diagram of this same plant is shown in Fig. 22.15. This dia- gram lists typical stream compositions, typical operating conditions, catalyst types (recom- mended by Synetix), and catalyst volumes.
The KAAPplusTM (Kellogg Brown & Root Advanced Ammonia Process-Plus) is an ammonia process design made up of commercially proven technologies: KBR Reforming Exchanger System (KRES), KBR Purifier, and KBR Advanced Ammonia Process (KAAP) for synthesis. This process uses a ruthenium-based catalyst that is 20 times more active than the iron-based cata- lysts and improves synthesis efficiency. This is because synthesis pressure is lowered from a typical pressure of 150 bar (2175 psig) to 90 bar (1305 psig).57,s1,203 Capital cost sav- ings of 3 to 8 percent are achieved with KAAPplus. TM s l
Haldor Topsere's ammonia synthesis tech- nology is based on the S-200 ammonia con- verter. This is a two-bed radial flow converter with indirect cooling between the beds. This converter concept has been used extensively to upgrade existing converters (Topsere or other designs) in modification projects to achieve higher capacity (up to 20%) and/or better energy e f f i ~ i e n c y . ~ ~
Other companies that offer ammonia process technology are Linde,208,214 ICI,'6,'7 Ammonia Casa1e,204,209,210,213 and Uhde.,l
Ammonia Separation
The removal of ammonia product is accom- plished via mechanical refrigeration or

SY
NT
HE
TIC
NIT
RO
GE
N P
RO
DU
CT
S
1029
c
C
0
Lo .- .- E Q
Q
Y r
m
>
Q
0
.- L
o_

1030 K
EN
TAN
D R
IEG
EL'S
HA
ND
BO
OK
OF IN
DU
ST
RIA
L C
HE
MIS
TRY
AN
D B
IOTE
CH
NO
LOG
Y
L
E 2 m
.- U Y
- x m
ui N
mi
iia
r
N .-

SYNTHETIC NITROGEN PRODUCTS 1031
absorption/distillation. The choice is made by examining the fixed and operating costs. Typically, refrigeration is more economical at synthesis pressures of 100 atm (1470 psia) or more. At lower pressures absorptionidistilla- tion is usually favored.212
Ammonia Synthesis
If the synthesis gas contains traces of carbon oxides, ammonium carbamate will form upon mixing with the ammonia in the recirculating gas from the synthesis loop. The carbamate will clog and/or corrode downstream equip- ment. To avoid this condition, the carbon oxide levels in fresh makeup gas should be less than 5 ppm.88
Many ammonia synthesis converters are subject to nitriding and hydrogen embrittle- ment. The internal catalyst baskets are made of SS 321 material.gs The nitriding effect is more pronounced in low-alloy steels above 450°C. Austinic steels with a high-nickel content offer considerably more resistance. Alloys of the Cr-Ni-Mo type are usually used for the gas side. Atomic hydrogen is absorbed in the metal by diffusion. The subsequent reaction with carbon in the steel results in blistering and cracking from decarburizations8.
Large Capacity Ammonia Plants
In 2002 the design and construction of ammonia plants with capacities of 3000 tonnes per day or more were underway. These large capacity plants will be at least 50 per- cent larger than the largest plants that were operating in 2002. The benefit of bigger plants is to realize economy of scale. Doubling the size of a single-train plant has the potential to reduce the capital-related cost of production by about 20 percent.215
The companies that are developing large capacity plants are KBR,215 Haldor
Uhde,215,218 plus Lurgi and Ammonia C a ~ a l e . ~ ~ ]
Ammonia Production Costs
Ammonia production costs are very depend- ent on feedstock cost, which is normally
natural gas. Natural gas prices can vary sig- nificantly from region to region and by the cycles in the world energy market. Typical ammonia production costs are listed in Reference 57. The natural gas cost makes up 70 percent to over 85 percent of the cash pro- duction costs as the natural gas cost varies from $2.00 per million BTU up to $6.00 per million BTU. In general the ammonia cash production costs in $ per tonne are a factor of 40 to 50 times the natural gas price in US dol- lars per million BTU.
USES OF AMMONIA
Anhydrous ammonia was produced in about 80 countries in 2001. About 85 percent is used for nitrogen fertilizer production, including about 4 percent that is directly applied to the field^.^^,'^^. In the United States the distribu- tion of ammonia use differs slightly from the worldwide uses. In the United States only 80 percent of the ammonia is used to make fer- tilizers. Chemical intermediates account for 19 percent of the ammonia use and the remaining 1 percent is used in pulp and paper, metals, and refrigeration application^.^'
Chemical Production and Other Uses
The uses of ammonia are in:
Acrylonitrile. Acrylonitrile (ACRN) is used in the production of acrylic fibers and various resins. ACRN is produced by the catalytic oxidation of propylene and ammonia. About 0.48 tonnes of ammonia are needed to make one tonne of ACRN.57 Caprolactam. Caprolactam is used prin- cipally in the production of nylon-6 fibers. In the production of caprolactam, ammonia is used to maintain a reaction pH of 7 in one step, and in another step it is used to neutralize sulfuric acid. Both of these steps result in the production of a low-grade ammonium sulfate fertilizer. In the classical process 5 kg of (NH,),SO, are produced per kilogram of caprolactam. In 1992 about 33 percent of

1032 KENTAND RIEGEL‘S HANDBOOK OF INDUSTRIAL CHEMISTRY AND BIOTECHNOLOGY
the worldwide caprolactam capacity was based on DSM’s caprolactam process that only produces 1.8 kg of (NH,),SO, per kilogram of c a ~ r o l a c t a m . ~ ~ Miscellaneous Amines and Nitriles. A small but significant amount of ammonia is consumed in the production of various amines and nit rile^.^^ Metallurgy. In this application ammonia is cracked to produce a “dissociated ammo- nia” that consists of 75 percent hydrogen and 25 percent nitrogen. Dissociated ammonia is used in a number of metal treatment p r o ~ e s e s . ~ ~ Refrigeration. Anhydrous ammonia is used as a refrigerant in industrial, closed- circuit refrigeration systems. Ammonia’s high latent heat, low vapor density, chem- ical stability, and low iron corrosivity promote its use. Ammonia is used in large industrial systems (rather than halo- carbon refrigerants) because ammonia absorbs about six times as much heat per unit weight and energy costs of operation are substantially lower.57 Pulp and Paper: In the production of ammonia-based sulfite pulp, the amount of ammonia used per ton of pulp varies from mill to mill. The industry average is 125 pounds of ammonia per ton of sulfite pulp. Ammonia is also used for stack gas scrubbing and wastewater Phosphate Ore Flotation. A small amount of ammonia is used as a modify- ing reagent in the froth flotation of phos- phate ores. Household Cleaners. Household ammo- nia, liquid window cleaners, liquid all- purpose cleaners, and various other household cleaning products constitute this small market for ammonia. Ammonia is also used to make surfactants that go into liquid dishwashing detergent^.^^ Air Pollution Control. A number of processes use ammonia for scrubbing sulfur oxides (SO,) and/or nitrogen oxides (NO,) from industrial and electri- cal power plant stack gases.57 Uranium Concentrate Production. Ammonia is used to precipitate the final
uranium concentrate salt (yellowcake) prior to drying or calcination. It is gener- ally economically preferred over sodium hydroxide or hydrogen peroxide.57 Water Purqication. Ammonia is com- bined with chlorine to purify some municipal and industrial water supplies.57 Waste Treatment. Small amounts of ammonia are added when needed as the nitrogen source for the bacteria in indus- trial and municipal biological waste treat- ment systems. Other industrial plants use minor amounts of ammonia to neutralize acid in plant wastes.57 Duplicating Processes. Ammonia is used as a process chemical in photographic copy machines. Fabric Treatment. Permanent-press, 100 percent cotton fabrics are produced via a licensed process involving mercerization in a bath of liquid anhydrous ammonia. This Sanfor-Set process was commercial- ized in 1975.57 Semiconductor Industry. High purity ammonia (99.99995%) is used in gallium nitride (GaN) manufacturing processes to provide high brightness blue and white LEDs (light emitting diodes), in high- performance optoelectronics (such as liq- uid crystal displays and flat panel displays), and in high-power electronic devices (such as lasers and laser diodes).
DISTRIBUTION AND STORAGE
Am m o n i a Toxicity
Ammonia is a strong local irritant, and the primary target organ is the pulmonary sys- tem. Ammonia or ammonium hydroxide can penetrate the cornea rapidly and lead to dam- age of the iris, cataract, and glaucoma. Oral ingestion of aqueous ammonia can corrode the mucous membranes of the oral cavity and constrictions of the esophagus may result.74
Ammonia is not considered to be carcino- genic nor is it mutagenic. The effects of differ- ent ammonia concentrations are summarized in Table 22.12.74
SYNTHETIC NITROGEN PRODUCTS 1033
TABLE 22.12 Ammonia Concentrations
Health Effects of Different
Ammonia Concentration (Ppm) Health EffecP
5 Threshold detection limit 50 Easily perceived 50-72 No significant impairment to
100
200 Headache and nausea 2 5 0-5 00 700 Immediate onset of burning
1000 Immediate coughing
aThe TLV has been set at 25 pprn (17 mg/m3) as an 8 hour time-weighted average (TWA) with a short-term exposure limit (STEL) of 35 pprn (24 mg/m3).
respiration Irritation to nose and throat Burning sensation in eyes
Rapid heart beating
sensations in the eyes
Ammonia Quality
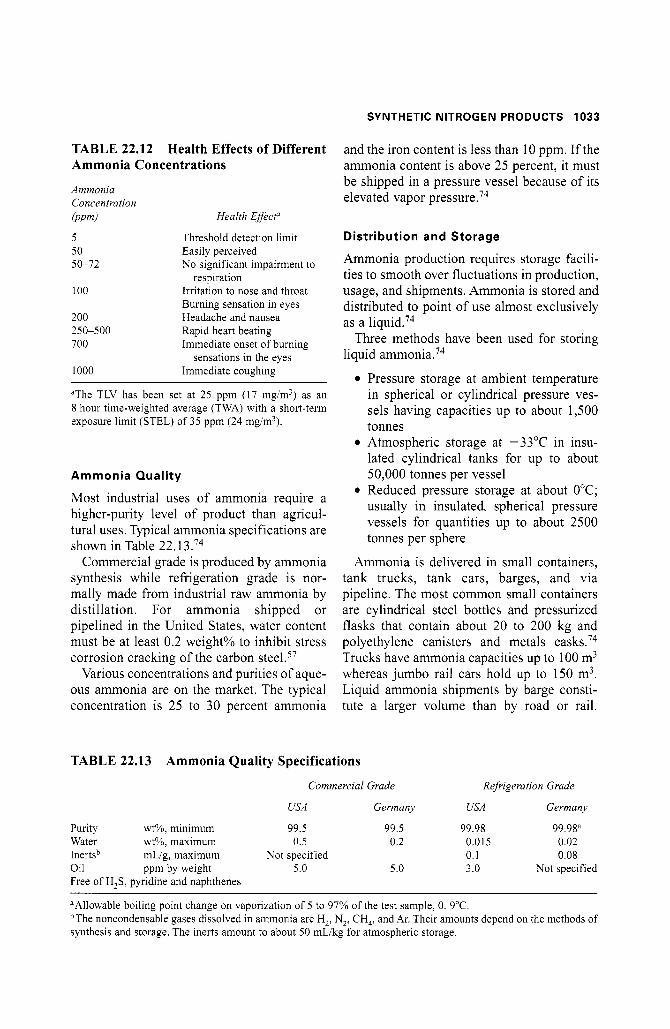
Most industrial uses of ammonia require a higher-purity level of product than agricul- tural uses. Typical ammonia specifications are shown in Table 22.13.74
Commercial grade is produced by ammonia synthesis while refrigeration grade is nor- mally made from industrial raw ammonia by distillation. For ammonia shipped or pipelined in the United States, water content must be at least 0.2 weight% to inhibit stress corrosion cracking of the carbon
Various concentrations and purities of aque- ous ammonia are on the market. The typical concentration is 25 to 30 percent ammonia
and the iron content is less than 10 ppm. If the ammonia content is above 25 percent, it must be shipped in a pressure vessel because of its elevated vapor pressure.74
Distribution and Storage
Ammonia production requires storage facili- ties to smooth over fluctuations in production, usage, and shipments. Ammonia is stored and distributed to point of use almost exclusively as a l i q ~ i d . ’ ~
Three methods have been used for storing liquid ammonia.74
Pressure storage at ambient temperature in spherical or cylindrical pressure ves- sels having capacities up to about 1,500 tonnes Atmospheric storage at -33°C in insu- lated cylindrical tanks for up to about 50,000 tonnes per vessel Reduced pressure storage at about 0°C; usually in insulated spherical pressure vessels for quantities up to about 2500 tonnes per sphere
Ammonia is delivered in small containers, tank trucks, tank cars, barges, and via pipeline. The most common small containers are cylindrical steel bottles and pressurized flasks that contain about 20 to 200 kg and polyethylene canisters and metals casks.74 Trucks have ammonia capacities up to 100 m3 whereas jumbo rail cars hold up to 150 m3. Liquid ammonia shipments by barge consti- tute a larger volume than by road or rail.
TABLE 22.13 Ammonia Quality Specifications
Commercial Grade Refrigeration Grade
USA Germany USA Germany
Purity wt%, minimum 99.5 99.5 99.98 99.98a Water wt%, maximum 0.5 0.2 0.0 15 0.02 Inertsb mLig, maximum Not specified 0.1 0.08 Oil ppm by weight 5.0 5.0 3.0 Not specified Free of H,S, pyridine and naphthenes
aAllowable boiling point change on vaporization of 5 to 97% of the test sample, 0. 9°C. bThe noncondensable gases dissolved in ammonia are H,, N,, CH,, and Ar. Their amounts depend on the methods of synthesis and storage. The inerts amount to about 50 mLikg for atmospheric storage.

1034 KENTAND RIEGEL‘S HANDBOOK OF INDUSTRIAL CHEMISTRY AND BIOTECHNOLOGY
Additional guidelines about ammonia ship- ments are given in References 57 and 74.
Several ammonia pipeline systems were built in the United States in the 1960s. Their construction resulted from the construction of large plants near the sources of natural gas and from developing a large market for liquid anhydrous ammonia in direct fertilization. Pipelines are the lowest cost method to move ammonia over the long distances between the producers along the Gulf Coast and the con- sumers in the upper Midwest. Some pipelines are up to 3000 kilometers long and up to 10 in. in diameter.74
An integrated pipeline system has not been developed in Europe. Only a few pipelines with lengths of less than 50 kilometers have been installed. However in the former Soviet Union a 2424-km-long pipeline is in use.74
Ammonia Price
Direct sales by basic producers are generally at wholesale prices. Basic producers also sell to distributors and jobbers for resale to end users buying smaller quantities. Distributors of ammonia to industrial end users have their own storage facilities, packaging plants, and distribution networks. They are able to supply end users that buy in less than truckload quan- tities (a minimum of 1000 to 2000 pounds or 450 to 910 kilograms) or in cylinders or bot- t l e ~ . ~ ’
Another important aspect of the ammonia business is seasonality. The major end use for anhydrous ammonia is as a direct application fertilizer. The application season, particularly in Canada and the northern United States, is limited and significant storage capability is needed. As a result, it is normal to expect a plant to produce a downstream nitrogen prod- uct (such as urea) that is easier to store and handle and does not have such a limited appli- cation season. Industrial markets are normally non~easonal.~’
Long-term fixed-price contracts are not considered workable due to the volatility in the market and the uncertainty regarding future natural gas prices. The normal long- term contract simply guarantees continuity of
supply and calls for prices to be negotiated every three to six months.57 Historical prices are listed in Reference 57.
NITRIC ACID
Nitric acid is a strongly acidic, corrosive liquid that is produced by the oxidation of ammonia and subsequent reaction of the oxidation prod- ucts with water. Pure nitric acid is colorless. The characteristic yellow-brown color gener- ally associated with concentrated solutions is due to dissolved nitrogen d i ~ x i d e . ~ ’
Nitric acid is an active compound and its salts are found in all fertile soils. The alchemists obtained nitric acid by heating alum and copper sulfate with nitrate in a retort. Owing to its powerful corrosive action, they named it aqua fortis or “strong water”.’
Being a powerful oxidizing agent, nitric acid reacts violently with many organic mate- rials and the reactions may be explosive. As a general rule, oxidizing reactions occur prima- rily with the concentrated acid and favor the formation of nitrogen dioxide (NO,). The acidic properties tend to dominate the dilute acid and this results in the preferential forma- tion of nitrogen oxide (NO).53
Nitric acid reacts with all metals except the precious metal series and certain alloys. Although chromium, iron and aluminum readily dissolve in dilute nitric acid, the con- centrated acid forms a metal oxide layer that protects the metal from further oxidation.53
Physical Properties
Pure anhydrous nitric acid (100%) is a color- less liquid that solidifies at 4 1.6”C to form white crystals. It boils at 84.1”C. When it boils in light, a partial decomposition occurs with the formation of NO, via the following reaction.
HNO, H,O + 2 NO, + ‘/2 0, (22-15)
Anhydrous nitric acid should be stored below 0°C to avoid decomposition. The nitrogen dioxide remains dissolved in the nitric acid and creates a yellow color at room

SYNTHETIC NITROGEN PRODUCTS 1035
temperature and a red color at higher temper- atures. The pure acid tends to give off white fumes when exposed to air, however, acid with dissolved nitrogen dioxide gives off red- dish-brown vapors which leads to the com- mon name "red hming acid".53
Nitric acid is miscible with water and distil- lation results in an azeotrope with a concen- tration of 68.4 percent HNO, and a boiling temperature of 121.9"C at atmospheric pres- sure. Two solid hydrates are known the mono- hydrate (HNO *H,O) and the trihydrate (HN0,*3H,0).53
Nitrogen oxides are soluble in nitric acid, and this property influences all the physical characteristics that depend on the concentra- tion of the oxides. This mainly includes the
vapor pressure above the liquid and the boil- ing temperature as well as the color. "Red Fuming Nitric Acid" is a term that, according to Sax B Dangerous Properties of Industrial Materials applies to nitric acid that contains more than 17 percent NO, and has a density of more than 1.48 g i ~ m . , , ~ ~ White fuming nitric acid usually contains 90 to 99 percent by weight HNO,, from 0 to 2 percent by weight dissolved NO,, and up to 10 percent by weight water.
The TLV for nitric acid has been set at 2 ppm as an 8-hour time-weighted average (TWA) with a short-term exposure limit (STEL) of 4 ppm.
Some properties of nitric acid are given in Tables 22.14 and 22.15.
TABLE 22.14 Physical Properties of Nitric Acid solution^^*-^^
Densiv Freezing Boiling Specific heat Partial press. wt. % (at 20" Cj, point, point, (at 20°C) (at 20°C) Pab
HNO, g/cm3 "C "C J/(rKj a HNO, H20 0.0
10.0 20.0 30.0 40.0 50.0 60.0 70.0 80.0 90.0
100.0
0.99823 0 100.0 1.0543 -7 101.2 1.1150 -17 103.4 1.1800 -36 107.0 1.2463 -30 112.0 1.3100 -20 116.4 1.3667 -22 120.4 1.4134 -41 121.6 1.452 1 -39 116.6 1.4826 - 60 102.0 1.5129 - 42 86.0
4.19 3.73 3.39 3.18 3.01 2.85 2.64 2.43 2.22 1.97 1.76
2333 - 2266 - 2026 - 1760 - 1440 27 1053
120 653 387 347
1400 120 3600 27 6000 0
-
Viscosity Thermal @ 20°C) conduct.
mPav @ 20'Cj (=cPj W/(m*K)<
1 .o 0.61 1.1 0.57 1.2 0.54 1.4 0.50 1.6 0.47 1.9 0.43 2.0 0.40 2.0 0.36 1.9 0.35 1.4 0.3 1 0.9 0.28
aTo convert J/ (g*K) to cal/(g*"C), divide by 4.184. bTo convert Pa to atm, divide by 1.013 X lo5. cTo convert W (m*K) to Btu (h*ft*"F), divide by 1,7307.
TABLE 22.15 Thermodynamic Properties of Nitric Acid and Its Hydrates95
HNO, HNO ,*H,O HN0,-3H2O
Nitric acid, wt.% 100.0 77.77 53.83 Freezing point, C -41.59 -37.62 - 18.47 Heat of formation (at 25°C). kJ/mola - 173.35 -472.07 -888.45 Free energy of formation (at 25°C). kJ/mola -79.97 -329.29 -8 10.99 Entropy (at 25 C), kJ/(mol*K)a 155.71 2 17.00 347.17 Heat of fusion, kJ/mola 10.48 17.52 29.12 Heat of vaporization (at 20°C), kJ/mola - - 39.48
aTo convert J to cal, divide by 4.184.

1036 KENTAND RIEGEL'S HANDBOOK OF INDUSTRIAL CHEMISTRY AND BIOTECHNOLOGY
Processes
The Birdeland-Eyde or Arc process made nitric acid by passing air through an electric arc, forming nitric oxide, oxidizing NO with air, and absorbing the resulting oxides of nitrogen in water. The reactions are:
N2 + 0 2 + 2 N 0
2 N 0 + 0 2 +2NO2
2 NO2 + H2O + HNO2 + HNO,
3 HNO2 + HNO, + 2 NO + H2O
(22- 16)
(22-1 7)
(22-18)
(22-19)
The process was operated in Norway from 1905 to 1930, and it was first used in the United States in 1917.' It used hydroelectric power but was made obsolete by the ammonia oxidation process.
The Ostwald process is the basis for the modern processes that make nitric acid by the catalytic oxidation of ammonia. It was dis- covered in 1900 by Wilhelm Ostwald, a German physical chemist. The process was used by Germany during World War I to make explosives after the Allied blockade cut off the supply of nitrites from Chile and other places.96
Some of the processes that have been based on the Ostwald process are:
The CNA (Concentrated Nitric Acid) process is a general name for processes that make nitric acid more concentrated than the 70 percent made in conventional processes. The CONIA process makes nitric acid simultaneously at two different concen- trations. The DSN (Direct Strong Nitric) process is a general name for processes that concentrate nitric acid from the 50 to 70 percent range up to the 98 percent range. The HOKO process also makes nitric acid simultaneously at two different con- centrations. The Hycon process makes nitric acid at arange of concentrations. It was devel- oped in 1968 and patented (U.S. Patent 3,542,5 10) by the Chemical Construction Corporation.
The SABAR (Strong Acid By Azeotropic Rectification) process makes nitric acid by the atmospheric oxidation of ammo- nia. Davy McKee developed the process and built plants based on this technology from 1974 to 1986.
Chemistv. In the Ostwald process ammo- nia is catalytically oxidized. The key steps in the process are: (1) oxidation of ammonia to nitric oxide (NO), (2) oxidation of NO to nitrogen dioxide (NO,), and (3) absorption of NO, in water to produce nitric acid. Overall, the principal reactions may be summarized as fOllOWS.9~~97
Ammonia reacts with air on platinum/ rhodium alloy catalysts in the oxidation sec- tion of nitric acid plants.
4 N H 3 + 5 O 2 + 4 N O + 6 H 2 O AH298 = -54 kcal/mol (-226 kJ/mol)
(22-20)
Simultaneously N,O, N,, and H,O are formed in side reactions according to Equations 21 and 22.
4 NH3 + 3 0 2 + 2 N2 + 6 H2O AH298 = -75.8 kcal/mol (-317 kJ/mol)
(22-21)
4 NH, + 4 0 2 + 2 N2O + 6 H2O (22-22)
Some of the process energy recovery options are discussed in Reference 97. The yield of nitric oxide in Equation 22-20 depends on pressure and temperature as indi- cated in Table 22.16.97
TABLE 22.16 Effect of Reaction Pressure and Temperature on Nitric Oxide Yield
(bar) PC) (%I Pressure Temperature Nitric OxideYield
Below 1.7 810 to 850 97 1.7 to 6.5 850 to 900 96 Above 6.5 900 to 940 95
Source; Reproduced by permission of European Fertilizer Manufacturers Association.

SYNTHETIC NITROGEN PRODUCTS 1037
TABLE 22.17 Effect of Reactor Residence Time on Nitric Oxide Yield
Reactor Residence Nitric Oxide Yield, Time, Seconds Percent NH, Oxidized
0.28 0.11 0.061 0.023
82.1 85.7 90.2 91.8
The space velocity in the ammonia oxida- tion reactor should be kept high to maximize yield and avoid decomposition of ammonia in the feed gas. Another potential yield loss is shown in Equation 22-23.
4 NH, + 3 NO, -+ ’/2 N, + 6 H,O (22-23)
The effect of reactor residence time on nitric oxide yield is shown in Table 22.17.98
NO is oxidized to NO, as the combustion gases are cooled, but some side reactions (such as 22-24 and 22-25) may also occur.
AH,,, = - 13.6 kcal/mol(-57 kJ/mol) 2 N 0 + 0 2 + 2 N O ,
(22-17) (22-24) 4 N 0 -+ 2N2O + 0 2
2 N 0 2 2 N204 AH,,, = -6.8 kcal/mol(-28.6 kJ/mol)
For the reaction in Equation 22-17, second- ary air is added to the gas mixture obtained from the ammonia oxidation to increase the oxygen content to such a level that the waste gas leaving the plant has an oxygen content between 2 and 4 percent by volume. The rate of reaction is proportional to pressure cubed (see Reaction 22-26), and the volume or size of equipment needed to oxidize the nitric oxide is inversely proportional to pressure cubed:
(22-25)
d(PNO)/dt = - k (pN0)2(p02) (22-26)
The Absorption Reaction (22-27) is exother- mic and continuous cooling is required within the absorber.
3 NOz + H20 +NO + 2 HNO, AH298 = -6.8 kcal/mol(-28.6 kJ/mol)
(22-27)
The nitric acid produced in the absorber con- tains dissolved nitrogen oxides and is then bleached by the secondary air.
The overall reaction is:
NH, + 202 + HNO, + H2O AH = -98.7 kcal/mol (22-28)
Several process variations are described in Reference 9 1.
Catalysts. The catalyst typically consists of several woven or knitted wire gauze sheets with a composition of about 90 percent plat- inum, 5 percent rhodium, and 5 percent palla- dium. The primary functions of rhodium are to add mechanical strength to the gauze and to improve yield. The palladium is present to replace a portion of the more expensive rhodium.91 Figure 22.16 shows that conver- sion efficiency does not improve if more than 5 percent rhodium is present in the ~a ta1ys t . l~~
Catalyst life depends on several variables. High-pressure oxidation operations (which also operate at higher temperatures, per Table 22.16) require more frequent catalyst regener- ation. The presence of trace amounts of iron, calcium, MoS, (lubricants), and phosphorus in the ammonia feed has been shown to shorten catalyst life. Deposits of iron oxides tend to catalyze the conversion of ammonia and oxygen to nitrogen and water, rather than to nitric oxide. These effects, as well as poor ammonia-air mixing and poor gas distribu- tion across the catalyst, may reduce the yield by up to 10 p e r ~ e n t . ~ * , ~ ’
Some weight loss due to catalyst erosion and vaporization occurs and is more pro- nounced at the higher converter temperatures that are employed in the higher-pressure processes. Lost catalyst is usually recovered by “getter” systems that use palladium alloy gauzes and recover 60 to 80 percent of the lost catalyst. The “getter” gauze is placed as close to the platinum catalyst pack as possible so that the catalyst components can be recovered while they are in the vapor form. Although pure palladium is the most effective “getter”, it becomes too brittle so a palladium alloy is used. Additional catalyst is recovered during periodic cleaning of the ammonia oxidation

1038 KENTAND RIEGEL'S HANDBOOK OF INDUSTRIAL CHEMISTRY AND BIOTECHNOLOGY
900 c
I I I I I I I i I
Q 1 2 3 4 5 6 7 8 9 10 % Rll in Pt-Rh m o y
Fig. 22.16. Effect of rhodium content on catalyst efficiency.
reactor and during cleaning of downstream heat exchanger^.^'.^^
When the catalyst pack no longer provides the desired reaction rates or product composi- tion, new sheets of catalyst may be added to the old sheets. Or the old sheets may be replaced by a set of new sheets, and the old sheets sent back to the supplier to be rehr- bished. If any catalyst that is lost from the gauze is trapped in the downstream filter or recovered during equipment cleaning, it is also returned to be reproce~sed.~'
U.S. Patent 6,073,467 was issued in 2000 for a three-dimensional, knitted, noble metal gauze for nitric acid production. This catalyst design claims to provide elevated product yields and longer catalyst service life with the small noble metal losses.
Operating Pressure. All nitric acid plants are based on the same basic chemical operations: oxidation of ammonia with air to give nitric oxide, oxidation of the nitric oxide to nitrogen dioxide, and absorption in water to give a solution of nitric acid. The efficiency of the first step is favored by low pressure whereas that of the second step is favored by high pressure. Therefore both single-pressure and dual-pressure nitric plants are ~ p e r a t i n g . ~ ~
In the single-pressure plant, the oxidation and absorption steps take place at essentially the same pressure. In dual-pressure plants, absorption takes place at a higher pressure than the oxidation stage. The oxidation and absorption steps can be classified as:97 low pressure (below 1.7 bar), medium pressure

SYNTHETIC NITROGEN PRODUCTS 1039
(between 1.7 and 6.5 bar), and high pressure (between 6.5 and 13 bar).
The main unit operations in nitric acid plants are:y7 ammonia evaporation, ammonia filtration, air filtration, air compression, airiammonia mixing, catalytic reaction of ammonia and air, energy recovery by steam generation andor gas reheating, gas cooling, dual pressure only+NOx compression, absorption with nitric acid production, and tail gas energy recovery.
Most new plants built in the 1990s have a dual-pressure design. Ammonia oxidation is operated at a medium pressure and absorption is operated at a high pressure. High-pressure systems offer the advantage of lower capital costs (as much as 30% lower than some lower-pressure processes) and are preferred in the United States for this reason. Relative dis- advantages are higher catalyst loss and lower ammonia conversion. Lower-pressure oxida- tion designs have the best efficiencies in ammonia conversion and catalyst conserva- tion. These plants have been preferred in Europe and other areas where ammonia has been relatively expensive and where allowable payout times have been longer.y1
The single-pressure design (see Fig. 22.17) is generally used in smaller plants or in larger plants where minimization of capital is a crit- ical design consideration. Ammonia oxidation and absorption of NO, occur at the same rel- ative pressure. This reduces the complexity and capital cost compared to the dual-pressure plant. However, efficiency may be lower in both the front and back ends of the plant. Single-pressure plants can be designed to operate at low to medium pressure to favor the ammonia oxidation reaction, at high pressure to favor the absorption reactions, or at any operating pressure in between.yy
The dual-pressure design (see Fig. 22.18) is generally use in larger plants, or in mid-size plants where higher utilityiraw material costs dictate a minimization of operating expense. Ammonia oxidation occurs at low or medium pressure. The result is an increase in effi- ciency of the ammonia oxidation reaction and lower catalyst loss. Absorption of NO, occurs at high pressure to maximize the
partial pressure of the gas reactants. A nitrous gas compressor boosts the pressure from the front end of the process (ammonia oxidation) to the back end (absorption).y'
In Table 22.18 the raw material and utility consumption figures are given for both single- and dual-pressure processes.9y
One type of NOx abatement system, the DCN (Destruction by Catalysis of NOx) reac- tor is shown in Figure 22.19.y9
Concentration of Nitric Acid. Most pro- duction of concentrated nitric acids (i.e., greater than the azeotrope of 68.4%) is based on weak acid hydration via extractive distilla- tion with a drying agent. Common drying agents are sulfuric acid and magnesium nitrate.y1, 220
A process exists that can directly produce concentrated nitric acid from dehydrated and concentrated nitrogen dioxide, weak acid, and oxygen. Generally the process operates at high pressure and follows these chemical reactions:y
2 NO, N,O, (22-25)
N,O, + H,O + '/2 0, + 2 HNO, (22-28)
Few U.S. plants employ this method for pro- duction of concentrated acid. Most produc- tion of concentrated HNO, (i.e., concentrations above the azeotrope) is based on weak-acid dehydration via distillation with a drying agent. The most common dehydra- tors have been concentrated sulfuric acid and magnesium nitrite.y1
An example of the dehydration process is the Kvaerner Chemetics process that uses concentrated sulphuric acid to eliminate the azeotrope and enable colorless, strong nitric acid up to 99 percent to be distilled from the mixed acids. The residual acid leaving the bottom of the processing tower is approxi- mately 70 percent sulphuric acid.lO'
Alternative methods of integrated concen- tration have been developed that do not require separate dehydrating agents. These processes differ from the direct process in that weak acid reacts with concentrated nitrogen dioxide to produce an acid that is sufficiently

1040 K
ENTA
ND
RIE
GE
L'S H
AN
DB
OO
K OF IN
DU
ST
RIA
L C
HE
MIS
TR
Y A
ND
BIO
TEC
HN
OLO
GY
ui Y
E u) 5.
v)
0
c m In c
Y
r" C
0
u) In
.- .- E a, Q
5.
n 6
.- U

SY
NTH
ETIC
NIT
RO
GE
N P
RO
DU
CTS
1041
0
m
v)
C
0
c
E m 2 2 a
v)
Next Page