Embed Size (px)
Citation preview

KRACHI NCHUMURU DISTRICT

ii
Copyright © 2014 Ghana Statistical Service

iii
PREFACE AND ACKNOWLEDGEMENT
No meaningful developmental activity can be undertaken without taking into account the
characteristics of the population for whom the activity is targeted. The size of the population
and its spatial distribution, growth and change over time, in addition to its socio-economic
characteristics are all important in development planning.
A population census is the most important source of data on the size, composition, growth
and distribution of a country’s population at the national and sub-national levels. Data from
the 2010 Population and Housing Census (PHC) will serve as reference for equitable
distribution of national resources and government services, including the allocation of
government funds among various regions, districts and other sub-national populations to
education, health and other social services.
The Ghana Statistical Service (GSS) is delighted to provide data users, especially the
Metropolitan, Municipal and District Assemblies, with district-level analytical reports based
on the 2010 PHC data to facilitate their planning and decision-making.
The District Analytical Report for the Krachi Nchumuru District is one of the 216 district
census reports aimed at making data available to planners and decision makers at the district
level. In addition to presenting the district profile, the report discusses the social and
economic dimensions of demographic variables and their implications for policy formulation,
planning and interventions. The conclusions and recommendations drawn from the district
report are expected to serve as a basis for improving the quality of life of Ghanaians through
evidence-based decision-making, monitoring and evaluation of developmental goals and
intervention programmes.
For ease of accessibility to the census data, the district report and other census reports
produced by the GSS will be disseminated widely in both print and electronic formats. The
report will also be posted on the GSS website: www.statsghana.gov.gh.
The GSS wishes to express its profound gratitude to the Government of Ghana for providing
the required resources for the conduct of the 2010 PHC. While appreciating the contribution
of our Development Partners (DPs) towards the successful implementation of the Census, we
wish to specifically acknowledge the Department for Foreign Affairs, Trade and
Development (DFATD) formerly the Canadian International Development Agency (CIDA)
and the Danish International Development Agency (DANIDA) for providing resources for
the preparation of all the 216 district reports. Our gratitude also goes to the Metropolitan,
Municipal and District Assemblies, the Ministry of Local Government, Consultant Guides,
Consultant Editors, Project Steering Committee members and their respective institutions for
their invaluable support during the report writing exercise. Finally, we wish to thank all the
report writers, including the GSS staff who contributed to the preparation of the reports, for
their dedication and diligence in ensuring the timely and successful completion of the district
census reports.
Dr. Philomena Nyarko
Government Statistician

iv
TABLE OF CONTENTS
PREFACE AND ACKNOWLEDGEMENT ....................................................................... iii
LIST OF TABLES .................................................................................................................. vi
LIST OF FIGURES ............................................................................................................... vii
ACRONYMS AND ABBREVIATIONS ............................................................................ viii
EXECUTIVE SUMMARY .................................................................................................... ix
CHAPTER ONE: INTRODUCTION ................................................................................... 1 1.1 Background ................................................................................................................ 1
1.2 Physical Features ....................................................................................................... 1
1.3 Political Administration ............................................................................................. 3
1.4 Social and Cultural Structure ..................................................................................... 3
1.5 Economy .................................................................................................................... 5
1.6 Census Methodology, Concepts and Definitions ....................................................... 5
1.7 Organization of the Report....................................................................................... 15
CHAPTER TWO: DEMOGRAPHIC CHARACTERISTICS ......................................... 16 2.1 Introduction .............................................................................................................. 16
2.2 Population Size and Distribution ............................................................................. 16
2.3 Fertility, Mortality and Migration ............................................................................ 18
CHAPTER THREE: SOCIAL CHARACTERISTICS .................................................... 23 3.1 Introduction .............................................................................................................. 23
3.2 Household Size, Composition and Structure ........................................................... 23
3.3 Marital Status ........................................................................................................... 25
3.4 Nationality................................................................................................................ 29
3.5 Religious Affiliation ................................................................................................ 29
3.6 Literacy and Education ............................................................................................ 30
CHAPTER FOUR: ECONOMIC CHARACTERISTICS ............................................... 33 4.1 Introduction .............................................................................................................. 33
4.2 Economic Activity Status ........................................................................................ 33
4.3 Occupation ............................................................................................................... 35
4.4 Industry .................................................................................................................... 36
4.5 Employment Status .................................................................................................. 37
4.6 Employment Sector .................................................................................................. 38
CHAPTER FIVE: INFORMATION COMMUNICATIONS TECHNOLOGY ............ 39 5.1 Introduction .............................................................................................................. 39
5.2 Ownership of Mobile Phones................................................................................... 39
5.3 Use of Internet.......................................................................................................... 39
5.4 Household Ownership of Desktop or Laptop Computers ........................................ 40
CHAPTER SIX: DISABILITY ........................................................................................... 41 6.1 Introduction .............................................................................................................. 41
6.2 Population with Disability ....................................................................................... 41
6.3 Types of Disability ................................................................................................... 41
6.4 Distribution by Type of Locality ............................................................................. 41
6.5 Disability and activity status .................................................................................... 42
6.6 Disability by Educational Level Attainment............................................................ 43

v
CHAPTER SEVEN: AGRICULTURAL ACTIVITIES ................................................... 45 7.1 Introduction .............................................................................................................. 45
7.2 Households in Agriculture ....................................................................................... 45
7.3 Types of farming Activities ..................................................................................... 45
7.4 Types of livestock and other animals reared............................................................ 46
CHAPTER EIGHT: HOUSING CONDITIONS ............................................................... 48 8.1 Introduction .............................................................................................................. 48
8.2 Housing stock........................................................................................................... 48
8.3 Type of Dwelling, Holding and Tenancy Arrangements ......................................... 48
8.4 Construction Materials ............................................................................................. 50
8.5 Room Occupancy ..................................................................................................... 51
8.6 Access to Utilities and Household Facilities ........................................................... 52
8.7 Main Source of Water for Drinking and for Other Domestic Use ........................... 54
8.8 Bathing and Toilet Facilities .................................................................................... 56
8.9 Method of Waste Disposal ....................................................................................... 57
CHAPTER NINE: SUMMARY OF FINDINGS AND POLICY
RECOMMENDATIONS ..................................................................... 58 9.1 Introduction .............................................................................................................. 58
9.2 Summary of findings................................................................................................ 58
9.3 Policy Recommendation .......................................................................................... 63
REFERENCES ....................................................................................................................... 67
APPENDICES ........................................................................................................................ 68
LIST OF CONTRIBUTORS ................................................................................................ 74

vi
LIST OF TABLES
Table 2.1: Population by Age, sex and type of locality .......................................................... 17
Table 2.2: Reported total fertility rate, general fertility rate and crude birth rate ................... 19
Table 2.3: Female population 12 years and older by age, children ever born, children
surviving and sex of child ...................................................................................... 20
Table 2.4: Total population, deaths in households and crude death rate ................................ 21
Table 2.5: Birthplace by duration of residence of migrants .................................................... 22
Table 3.1: Household size by type of locality ......................................................................... 23
Table 3.2: Household composition by sex .............................................................................. 24
Table 3.3: Household structure by sex .................................................................................... 24
Table 3.4: Persons 12 years and older by sex, age-group and marital status .......................... 25
Table 3.5: Persons 12 years and older by sex, marital status and level of education ............. 27
Table 3.6: Persons 12 years and older by sex and economic activity status ........................... 28
Table 3.7: Population by nationality and sex .......................................................................... 29
Table 3.8: Population by religion and sex .............................................................................. 29
Table 3.9: Population 11 years and older by sex, age and literacy status ............................... 30
Table 3.10:Population 3 years and older by level of education, school attendance and sex ... 32
Table 4.1: Population 15 years and older by activity status and sex ...................................... 34
Table 4.2: Economic activity status of population 15 years and older by sex, and age ......... 35
Table 4.3: Employed population 15 years and older by occupation and sex .......................... 36
Table 4.4: Employed population 15 years and older by industry and sex .............................. 37
Table 4.5: Employed population 15 years and older by employment status and sex ............. 38
Table 4.6: Employed population 15 years and older by employment sector and sex ............. 38
Table 5.1: Population 12 years and older by mobile phone ownership, internet facility
usage and sex ......................................................................................................... 39
Table 5.2: Households heads by sex, ownership of desktop/laptop computers ...................... 40
Table 6.1: Population by type of locality, disability type and sex .......................................... 42
Table 6.2: Persons 15 years and older with disability by economic activity status and sex ... 43
Table 6.3: Population 3 years and older by sex, disability type and level of education ......... 44
Table 7.1: Households by agricultural activities and locality ................................................. 46
Table 7.2: Distribution of livestock, other animals and keepers............................................. 47
Table 8.1: Stock of houses and households by type of locality .............................................. 48
Table 8.2: Type of occupied dwelling unit by sex of household head and type of locality ... 49
Table 8.3: Ownership status of dwelling by sex of household head and type of locality ....... 49
Table 8.4: Main construction material for outer wall of dwelling unit by type of locality .... 50
Table 8.5: Main construction materials for the floor of dwelling unit by type of locality ..... 51
Table 8.6: Main construction material for roofing of dwelling unit by type of locality ......... 51
Table 8.7: Household size and number of sleeping rooms occupied in dwelling unit ........... 52
Table 8.8: Main source of lighting of dwelling unit by type of locality ................................. 53
Table 8.9: Main source of cooking fuel by type of locality .................................................... 53
Table 8.10:Cooking space used household by type of locality ................................................ 54
Table 8.11:Main source of water of dwelling unit for drinking and other domestic purposes 55

vii
Table 8.12:Bathing facility and toilet facilities used by household ......................................... 56
Table 8.13:Method of rubbish and liquid waste disposal by households ................................ 57
Table A1: Household Composition by type of locality .......................................................... 68
Table A2: Population 3 years and older by sex, disability type and level of education ......... 69
Table A3: Distribution of households engaged in tree growing or crop farming by type
of crop and population engaged ............................................................................. 70
Table A4: Population by sex, number of households and houses in the 20 largest
communities ........................................................................................................... 72
Table A5: Population by age group in the 20 largest communities ........................................ 73
LIST OF FIGURES
Figure 1.1: Map of Krachi Nchumuru District ......................................................................... 2
Figure 2.1: Population pyramid .............................................................................................. 18
Figure 2.2: Age-Specific death rate (ASDR), 2010 ................................................................ 20

viii
ACRONYMS AND ABBREVIATIONS
ASFR : Age Specific Fertility Rate
CBR : Crude Birth Rate
CEPS : Customs Excise and Preventive Service
CIDA : Canadian International Development Agency
DANIDA : Danish International Development Agency
DFID : Department for International Development
DPs : Development Partners
ECOWAS : Economic Community of West African States
EU : European Union
GFR : General Fertility Rate
GSGDA : Ghana Shared Growth and Development Agenda
GSS : Ghana Statistical Service
HND : Higher National Diploma
ICT : Information and Communications Technology
JHS : Junior High School
JSS : Junior Secondary School
KVIP : Kumasi Ventilated-Improved Pit
LI : Legislative Instrument
MSE : Micro and Small Scale Enterprise
MTN : Mobile Telecommunication Networks
NDPC : National Development Planning Commission
NGOs : Non-Governmental Organisations
PDA : Personal Digital Assistant
PHC : Population and Housing Census
PWDs : People Living with Disabilities
SHS : Senior High School
SSS : Senior Secondary School
TFR : Total Fertility Rate
UN : United Nations
UNFPA : United Nations Population Fund
WC : Water Closet

ix
EXECUTIVE SUMMARY
Introduction
The District census report is the first of its kind since the first post-independence census was
conducted in 1960. The report provides basic information about the District. It gives a brief
background of the District, describing its physical features, political and administrative
structure, socio-cultural structure and economy. Using data from the 2010 Population and
Housing Census (2010 PHC), the report discusses the population characteristics of the District ,
fertility, mortality, migration, marital status, literacy and education, economic activity status,
occupation, employment; Information Communication Technology (ICT), disability,
agricultural activities and housing conditions of the District . The key findings of the analysis
are as follows (references are to the relevant sections of the report):
Population size, structure and composition
The population of Krachi Nchumuru District, according to the 2010 Population and Housing
Census, is 72,688, representing 3.4 percent of the region’s total population. Males constitute
50.4 percent and females 49.6 percent. The District has a rural population of 79.5 percent and a
sex ratio of 101.7. The population of the District is youthful (45.0%) depicting a broad base
population pyramid which tapers off with a small number of elderly persons (6.0%). The total
age dependency ratio for the District is 97.1, the age dependency ratio for males is higher
(100.6) than that of females (93.7).
Fertility, mortality and migration
The Total Fertility Rate for the District is 3.8. The General Fertility Rate is 110.8 births per
1000 women aged 15-49 years. The Crude Birth Rate (CBR) is 25.1 per 1000 population. The
crude death rate for the District is 6.3 per 1000. Migrants living in the District but were born in
another region forms (41.3%) while 50.0 percent were born elsewhere in the Volta Region. For
migrants born in another region, those born in Northern region constitute the highest (21.4%).
Household size, composition and structure
The District has a household population of 72,009 with a total number of 12,333 households.
The average household size in the District is 5.9 persons per household. Children constitute
52.2 percent of the household composition.
Marital status
Forty eight percent of the population aged 12 years and older are married and 40.6 have never
married. By age 25-29 years, 74.3 percent of females are married compared to 44.4 percent of
males. At age 65 and above, widowed females account for as high as 56.7 percent while
widowed males account for 34.4 percent. Among the married, 74.5 percent have no education
while about 29.3 percent of the never married have never been to school. Eighty eight percent
of the married population are employed, 0.8 percent are unemployed and 11.6 percent are
economically not active. A greater proportion of those who have never married (57.4%) are
economically not active.

x
Nationality
The proportion of Ghanaians by birth in the District is 90.4 percent. Those who have
naturalised constitute 3.9 percent and the non-Ghanaian population in the District is 4.6
percent.
Literacy and education
Of the population 11 years and above, 45.2 percent are literate and 54.8 percent are non-
literate. The proportion of literate males is higher (58.4%) than that of females (41.6%). Four
out of ten people (46.7%) indicated they could read and write both English and Ghanaian
languages.
Economic Activity Status
Seventy three percent of the population aged 15 years and older are economically active
while 27.1 percent are economically not active. Of the economically active population, 98.6
percent are employed while 1.4 percent are unemployed. For those who are economically not
active, a larger percentage of them are students (49.4%) and 25.5 % perform household
duties.
Occupation
Of the employed population, 79.3 percent are engaged as skilled agricultural, forestry and
fishery workers, 8.6 percent as service and sales workers and 6.9 percent are craft and related
trades workers.
Employment status and sector
Of the population 15 years and older 72.2 percent are self-employed without employee(s) and
3.4 percent are employees. The private informal sector is the largest employer in the District,
employing 97.0 percent of the population.
Information Communication Technology
Of the population 12 years and above, 19.6 percent have mobile phones. Males who own
mobile phones constitute 26.2 percent as compared to 13.0 percent of females. Only one
percent of the population 12 years and older use internet facilities and have fixed telephone
lines.
Disability
About 3.5 percent of the District’s total population has one form of disability or the other.
The proportion of the female population with disability is (3.4%) compare to males (3.5%).
The types of disability in the District include sight, hearing, speech, physical, intellect, and
emotion. Persons with sight disability recorded the highest of 42.2 percent. About 6.8 percent
of the population with disability are in the urban localities. Of the population with disability,
65.8 percent have never been to school.
Agriculture
Households engaged in agriculture in the District stand at 81.8 percent. In the rural localities,
80.6 percent households and urban (81.8%) are agricultural households. Crop farming
(95.5%) is predominant in the District while poultry (chicken) is the dominant animal reared
in the District.

xi
Housing
The housing stock of the District is 11,743 representing 4.7 percent of the total number of
houses in the Volta Region. The average number of persons per house is 6.2.
Type, tenancy arrangement and ownership of dwelling units
Almost half (47.5%) of all dwelling units in the District are separate houses and 31.2 percent
are compound houses. Ownership by household member accounts for 48.8 percent of the
dwelling units in the District.
Material for construction of outer wall, floor and roof
The main construction material for outer walls of dwelling units in the District is mud
brick/earth (78.0%). Cement/concrete (71.4%) and metal sheet (66.8%) account for the main
materials used in the construction of floors and as roofing material for dwelling units in the
District.
Room occupancy
One room constitutes the highest percentage (86.8%) of sleeping rooms occupied by
households in housing units in the District. About 2.4 percent of households with 10 or more
members occupy single rooms.
Utilities and household facilities
The three sources of lighting in dwelling units in the District are electricity (mains) (43.1%),
kerosene lamp (41.6%) and flashlight/torch (13.7%). The main source of fuel for cooking for
most households in the District is wood (84.1%). The proportion for rural (86.5%) is higher
than that of urban (75.3%). Bore-hole/pump/tube accounts for the highest (32.1%) of
drinking water for households in the District.
Fifteen percent of the population in the District has no toilet facility and therefore resort to
the use of bush and field while the use of public toilet stand at 44.4 percent. Four out of ten
(48.0%) of households in the District own bathroom for their exclusive use.
Waste disposal
Public dump (container) (36.2%) and public dump (open space) (30.6%) are the two main
methods of solid waste disposal used by households in the District. House to house waste
collection accounts for only 4.6 percent. For liquid waste disposal, throwing waste onto
compound (42.6%) and thrown onto the street/outside (31.7%) are the two most common
methods used by households in the District.

1
CHAPTER ONE
INTRODUCTION
1.1 Background
This chapter gives transitory information on the physical features, political and administrative
structure, cultural and social structure and the economy of the Krachi Nchumuru District. The
historical development of the Krachi Nchumuru District started within the Krachi West
District. The District was carved out of Krachi West District. In 2012, following the passing
of the Legislative Instrument (L.I. 2084), Krachi Nchumuru District was established and
inaugurated on the 28th
of June, 2012 at Chinderi, its capital.
1.2 Physical Features
1.2.1 Location and Size
The District is located at the North Western corner of the Volta Region of Ghana and lies
between Latitude 70
4” N and 80 25’ N Longitude 0
0 25’ W and 0
0 20’ E. It is bounded to the
south east by Krachi West, Krachi East Districts to the east, Sene District to the south west
and Kpandia District to the north. This location places the District at a strategic position. The
District can therefore take advantage of its strategic location to attract investments from both
Southern and Northern Ghana. Being strategically located in the transitional zone, the
District’s closeness to the Brong-Ahafo and Northern Regions makes it a potential avenue for
wealth creation through greater internal trade and positive socio-cultural exchanges between
the Districts in these regions. The District has a total land area of 1,194.90 sq km.
1.2.2 Climate
The District has a tropical climate and has a mean maximum temperature of 300c usually
recorded in March while mean minimum temperature of 25.50c is usually recorded in August.
The District experiences alternating wet and dry seasons each year. The South-eastern part of
the District experiences a double maxima rainfall. It occurs between May to June and
October to November. The Northern portion, however, experiences single maxima over the
period July to September which peaks in August. The mean annual rainfall for the District is
1,300mm. The dry season starts from November to March. Relative humidity is high in the
rainy season, about (85%) and very low in the dry season (25%). The climate of the District
is suitable for the growing of various crops such as yam, shea butter etc. However, the
influence of the long dry hamarttan has damaging effects on the environment and farm
outputs.
1.2.3 Vegetation
The District lies in the Transitional Vegetation Savannah woodland zone characterised by
short scattered drought resistant trees that get burnt by bushfires or scorched by the sun
during the long dry hamarttan season. Human interference with ecology is insignificant
resulting in near semi-arid conditions. The most common economic fruit trees are the
sheanut, dawadawa, and baobab. Fringing vegetation can also be found along the major rivers
that drain the District. This vegetation type is however gradually being degraded because of
overdependence on it for daily livelihood activities such as bush burning, charcoal burning
and farming as well as lumbering.

2
Figure 1.1: Map of Krachi Nchumuru District
Source: Ghana Statistical Service, GIS

3
1.2.4 Relief and drainage
The District is part of the North Western Savanna zone of the Volta region which is
characterized by almost flat relief with slopes ranging between 85m and 300m above sea
level. The District is endowed with a number of rivers and streams, the most important of
which is the Dakar, the Volta Lake and Oti River which form the boundary between the
District and the Krachi East District. Other water bodies found in the District include
numerous intermittent streams located in most parts of the District. The relief and drainage
systems favour the development of fish farming, cultivation of rice and dry season
vegetables. These water bodies constitute important resources for the people as most of them
depend on them for household use, fishing and transportation.
1.3 Political Administration
The Krachi Nchumuru District is autonomous with regards to planning, budgeting and
implementation of projects. The political administration is made up of twenty five (25)
Assembly Members including the Honourable District Chief Executive and Member of
Parliament, seventeen (17) elected members and six (6) government appointees. The Member
of Parliament is a non-voting member of the General Assembly. There is only one
constituency in the District which is Krachi Nchumuru Constituency. The assembly
comprises of two area councils namely: Nchumuru Area Council and Borae Area council
located at Chinderi and Borae respectively. The District has 17 electoral areas and 119 unit
committees. The General Assembly has both Deliberative and executive functions presided
over by the Presiding Member who is elected by at least Two-thirds of the members of the
General Assembly from among themselves. The Assembly works through its Executive
Committee with seven members and the District Chief Executive as its chairman. The
Executive Committee operates through the following sub committees: Executive Committee,
Budget Committee, Development Planning Sub-committee, Works sub-committee, Finance
and Administration sub-committee, Justice and Security Sub-committee, Social Services Sub-
committee and Women and Children Sub-committee.
1.4 Social and Cultural Structure
Culture is the way of life of a people and has far reaching implications for the development of
a district. It consists of the traditional set-up, ethnicity, traditional knowledge and values.
1.4.1 Traditional set-up
The traditional set-up of the area is constituted in a divisional manner. It consists of the
divisional chiefs at Akaniem, Banda, Borae, Bejamse and Grubi; followed by Chiefs of major
communities and lastly Odikros in minor settlements and their subjects in that order. This
structure has created a peaceful and united atmosphere among the people of the area.
1.4.2 Ethnicity
The aboriginal ethnic group in the District is the Nchumurus. There is a large settler
population made up of mostly Konkombas, Tongu and Hausa speaking people.
1.4.3 Traditional knowledge, values, attitudes, practices and religion
The indigenous people, who are the Nchumurus cherish traditional values, attitudes and
practices. Some of the values of the people are celebration of annual Yam Festival, traditional
marriage rites and adherence to sacred days when nobody is expected to go farming and

4
fishing. Besides, norms such as respect for the elderly, hard work, friendliness and humility
are ingrained in the people.
1.4.4 Festival
The festival celebrated by the people in the District is the yam festival. This major
celebration attracts foreigners and brings people from all over the country to their traditional
homes. This serves as a way of generating additional revenue for the District. Through the
festival, potential investors are exposed to the available resources in the District which could
serve as a platform for investment. Further, the celebrations could be used to raise funds to
support major development efforts in the District.
1.4.5 Religion
The inhabitants of the District are very religious and are affiliated to one form of religion or
the other. These include Christianity, Islam, Traditional and those who do not belong to any
religion at all. Christianity is the major religion in the District constituting more than half
(56.6%) of the population, with Traditional African religion and Islam constituting 20.5
percent and 10.5 percent respectively. Other affiliations constitute 0.8 percent. High religious
tolerance among the various religious groups has partly contributed to the existence of peace
in the District.
1.4.6 Telecommunication
Communication in the District is developing steadily, with the presence of MTN, Airtel, and
Vodafone networks. The presence of these telecommunication companies has generated
employment opportunities for people in the District.
1.4.7 Electricity
About half (43.1%) of households are connected to the national electricity grid. These
communities that are connected are mostly found on the main trunk roads within the District.
Very few households (0.1%) have solar lights.
1.4.8 Health
The District has two systems of health service delivery – the modern and the traditional
systems. These systems play complementary roles in delivery of health services. The
orthodox system has both private and public health service providers. Health is one of the
important sectors in the District. The District has no Government Hospital, five Health
Centres, two Mission Clinics, nine Maternal and Child Health/ Family Planning (MCH/FP)
clinics.
Traditional healers and Traditional Birth Attendants (TBAs) play an immense role in the
health delivery system in the District. The Traditional Medical system offers treatment for
about 74% of the population especially those in the rural areas. Specialized areas of
treatment include: bone setting, snake bites, stomach upsets, and general conditions of ill
health. Mode of treatment include: consultations of spirits to diagnose condition and identify
appropriate herbs, administering of drugs prepared from herbs and sometimes prepare special
talisman to patients.
1.4.9 Water and Sanitation
The main sources of water for the people in the District include the Oti River, Volta Lake,
Dams, boreholes, and seasonal streams. Only Chinderi, Banda, and Borae have mechanized

5
water system. There are no sewage systems for disposing liquid waste as such; most of the
people resort to throwing their liquid waste around the surroundings of their houses and in
gullies created by the erosion.
1.4.10 Tourism
The District has quite a number of potential tourist attractions. The most outstanding tourist
attraction is River Oti and the Volta Lake, one of Ghana’s largest and famous water bodies
which can be used commercially for surfing or boat-cruising.
1.5 Economy
1.5.1 Structure of the local economy
Majority of the people in the District are engaged in agriculture with the commercial and
industrial sectors least developed. Agriculture is the lifeblood of the Districts economy with
crops such as yam, cassava, maize, rice, and groundnut mainly cultivated. Fishing is an
important agricultural activity in the District because of the presence of the Oti River and its
tributaries and the Volta Lake. People leaving in settlements around it do a lot of intensive
fishing. Various types of fresh water fish is normally harvested in the rivers. Some of the
fish types include; tilapia, mud fish, among others. There are very few small scale agro-based
processing industries in the District. The bulk of agricultural produce is sold unprocessed.
Most of the farmers sell their produce in the major markets of Dambai and in Accra and some
also sell to middlemen and most of the time women from the big cities of Accra, Kumasi, and
Cape Coast.
1.5.2 Market infrastructure
There are a number of markets in the District and these are located in Borae, Banda, Boafori,
Aknaiem and Kaparae. These market centres serve as major sources of internally generated
revenue to the District Assembly.
1.6 Census Methodology, Concepts and Definitions
1.6.1 Introduction
Ghana Statistical Service (GSS) was guided by the principle of international comparability
and the need to obtain accurate information in the 2010 Population and Housing Census
(2010 PHC). The Census was, therefore, conducted using all the essential features of a
modern census as contained in the United Nations Principles and Recommendations for
countries taking part in the 2010 Round of Population and Housing Censuses.
Experience from previous post independence censuses of Ghana (1960, 1970, 1984 and 2000)
was taken into consideration in developing the methodologies for conducting the 2010 PHC.
The primary objective of the 2010 PHC was to provide information on the number,
distribution and social, economic and demographic characteristics of the population of Ghana
necessary to facilitate the socio-economic development of the country.
1.6.2 Pre-enumeration activities
Development of census project document and work plans
A large scale statistical operation, such as the 2010 Population and Housing Census required
meticulous planning for its successful implementation. A working group of the Ghana
Statistical Service prepared the census project document with the assistance of two

6
consultants. The document contains the rationale and objectives of the census, census
organization, a work plan as well as a budget. The project document was launched in
November 2008 as part of the Ghana Statistics Development Plan (GSDP) and reviewed in
November 2009.
Census secretariat and committees
A well-structured management and supervisory framework that outlines the responsibilities
of the various stakeholders is essential for the effective implementation of a population and
housing census. To implement the 2010 PHC, a National Census Secretariat was set up in
January 2008 and comprised professional and technical staff of GSS as well as staff of other
Ministries, Departments and Agencies (MDAs) seconded to GSS. The Census Secretariat was
primarily responsible for the day-to-day planning and implementation of the census activities.
The Secretariat had seven units, namely; census administration, cartography, recruitment and
training, publicity and education, field operations and logistics management, data processing,
and data analysis and dissemination.
The Census Secretariat was initially headed by an acting Census Coordinator engaged by the
United Nations Population Fund (UNFPA) in 2008 to support GSS in the planning of the
Census. In 2009, the Census Secretariat was re-organised with the Government Statistician
as the National Chief Census Officer and overall Coordinator, assisted by a Census
Management Team and a Census Coordinating Team. The Census Management Team had
oversight responsibility for the implementation of the Census. It also had the responsibility of
taking critical decisions on the census in consultation with other national committees. The
Census Coordinating Team, on the other hand, was responsible for the day-to-day
implementation of the Census programme.
A number of census committees were also set up at both national and sub-national levels to
provide guidance and assistance with respect to resource mobilization and technical advice.
At the national level, the committees were the National Census Steering Committee (NCSC),
the National Census Technical Advisory Committee (NCTAC) and the National Census
Publicity and Education Committee (NCPEC). At the regional and district levels, the
committees were the Regional Census Implementation Committee and the District Census
Implementation Committee, respectively.
The Regional and District Census Implementation Committees were inter-sectoral in their
composition. Members of the Committees were mainly from decentralized departments with
the Regional and District Coordinating Directors chairing the Regional Census
Implementation Committee and District Census Implementation Committee, respectively.
The Committees contributed to the planning of district, community and locality level
activities in areas of publicity and field operations. They supported the Regional and District
Census Officers in the recruitment and training of field personnel (enumerators and
supervisors), as well as mobilizing logistical support for the census.
Selection of Census topics
The topics selected for the 2010 Population and Housing Census were based on
recommendations contained in the UN Principles and Recommendations for 2010 Round of
Population and Housing Censuses and the African Addendum to that document as well as the
needs of data users. All the core topics recommended at the global level, i.e., geographical
and internal migration characteristics, international migration, household characteristics,
demographic and social characteristics such as age, date of birth, sex, and marital status,

7
fertility and mortality, educational and economic characteristics, issues relating to disability
and housing conditions and amenities were included in the census.
Some topics that were not considered core by the UN recommendations but which were
found to be of great interest and importance to Ghana and were, therefore, included in the
2010 PHC are religion, ethnicity, employment sector and place of work, agricultural activity,
as well as housing topics, such as, type of dwelling, materials for outer wall, floor and roof,
tenure/holding arrangement, number of sleeping rooms, cooking fuel, cooking space and
Information Communication Technology (ICT).
Census mapping
A timely and well implemented census mapping is pivotal to the success of any population
and housing census. Mapping delineates the country into enumeration areas to facilitate
smooth enumeration of the population. The updating of the 2000 Census Enumeration Area
(EA) maps started in the last quarter of 2007 with the acquisition of topographic sheets of all
indices from the Survey and Mapping Division of the Lands Commission. In addition, digital
sheets were also procured for the Geographical Information System Unit.
The Cartography Unit of the Census Secretariat collaborated with the Survey and Mapping
Division of the Lands Commission and the Centre for Remote Sensing and Geographic
Information Services (CERSGIS) of the Department of Geography and Resource
Development, University of Ghana, to determine the viability of migrating from analog to
digital mapping for the 2010 PHC, as recommended in the 2000 PHC Administrative Report.
Field cartographic work started in March 2008 and was completed in February 2010.
Development of questionnaire and manuals
For effective data collection, there is the need to design appropriate documents to solicit the
required information from respondents. GSS consulted widely with main data users in the
process of the questionnaire development. Data users including MDAs, research institutions,
civil society organizations and development partners were given the opportunity to indicate
the type of questions they wanted to be included in the census questionnaire.
Documents developed for the census included the questionnaire and manuals, and field
operation documents. The field operation documents included Enumerator’s Visitation
Record Book, Supervisor’s Record Book, and other operational control forms. These record
books served as operational and quality control tools to assist enumerators and supervisors to
control and monitor their field duties respectively.
Pre-tests and trial census
It is internationally recognized that an essential element in census planning is the pre-testing
of the questionnaire and related instructions. The objective of the pre-test is to test the
questionnaire, the definition of its concepts and the instructions for filling out the
questionnaire.
The census questionnaire was pre-tested twice in the course of its development. The first pre-
test was carried out in March 2009 to find out the suitability of the questions and the
instructions provided. It also tested the adequacy and completeness of the responses and how
respondents understood the questions. The second pre-test was done in 10 selected
enumeration areas in August, 2009. The objective of the second pre-test was to examine the
sequence of the questions, test the new questions, such as, date of birth and migration, and

8
assess how the introduction of ‘date of birth’ could help to reduce ‘age heaping’. With regard
to questions on fertility, the pre-tests sought to find out the difference, if any, between proxy
responses and responses by the respondents themselves. Both pre-tests were carried in the
Greater Accra Region. Experience from the pre-tests was used to improve the final census
questionnaire.
A trial census which is a dress rehearsal of all the activities and procedures that are planned
for the main census was carried out in October/November 2009. These included recruitment
and training, distribution of census materials, administration of the questionnaire and other
census forms, enumeration of the various categories of the population (household,
institutional and floating population), and data processing. The trial census was held in six
selected districts across the country namely; Saboba (Northern Region), Chereponi (Northern
Region), Sene (Brong Ahafo Region), Bia (Western Region), Awutu Senya (Central Region),
and Osu Klottey Sub-Metro (Greater Accra Region). A number of factors were considered in
selecting the trial census districts. These included: administrative boundary issues, ecological
zone, and accessibility, enumeration of floating population/outdoor-sleepers, fast growing
areas, institutional population, and enumeration areas with scattered settlements.
The trial census provided GSS with an opportunity to assess its plans and procedures as well
as the state of preparedness for the conduct of the 2010 PHC. The common errors found
during editing of the completed questionnaires resulted in modifications to the census
questionnaire, enumerator manuals and other documents. The results of the trial census
assisted GSS to arrive at technically sound decisions on the ideal number of persons per
questionnaire, number of persons in the household roster, migration questions, placement of
the mortality question, serial numbering of houses/housing structures and method of
collection of information on community facilities. Lessons learnt from the trial census also
guided the planning of the recruitment process, the procedures for training of census field
staff and the publicity and education interventions.
1.6.3 Census Enumeration
Method of enumeration and field work
All post- independence censuses (1960, 1970, 1984, and 2000) conducted in Ghana used the
de facto method of enumeration where people are enumerated at where they were on census
night and not where they usually reside. The same method was adopted for the 2010 PHC.
The de facto count is preferred because it provides a simple and straight forward way of
counting the population since it is based on a physical fact of presence and can hardly be
misinterpreted. It is thought that the method also minimizes the risks of under-enumeration
and over enumeration. The canvasser method, which involves trained field personnel visiting
houses and households identified in their respective enumeration areas, was adopted for the
2010 PHC.
The main census enumeration involved the canvassing of all categories of the population by
trained enumerators, using questionnaires prepared and tested during the pre-enumeration
phase. Specific arrangements were made for the coverage of special population groups, such
as the homeless and the floating population. The fieldwork began on 21st September 2010
with the identification of EA boundaries, listing of structures, enumeration of institutional
population and floating population.
The week preceding the Census Night was used by field personnel to list houses and other
structures in their enumeration areas. Enumerators were also mobilized to enumerate

9
residents/inmates of institutions, such as, schools and prisons. They returned to the
institutions during the enumeration period to reconcile the information they obtained from
individuals and also to cross out names of those who were absent from the institutions on
Census Night. Out-door sleepers (floating population) were also enumerated on the Census
Night.
Enumeration of the household population started on Monday, 27th
September, 2010.
Enumerators visited houses, compounds and structures in their enumeration areas and started
enumerating all households including visitors who spent the Census Night in the households.
Enumeration was carried out in the order in which houses/structures were listed and where
the members of the household were absent, the enumerator left a call-back-card indicating
when he/she would come back to enumerate the household. The enumeration process took off
smoothly with enumerators poised on completing their assignments on schedule since many
of them were teachers and had to return to school. However, many enumerators ran short of
questionnaires after a few days’ work.
Enumeration resumed in all districts when the questionnaire shortage was resolved and by
17th
October, 2010, enumeration was completed in most districts. Enumerators who had
finished their work were mobilized to assist in the enumeration of localities that were yet to
be enumerated in some regional capitals and other fast growing areas. Flooded areas and
other inaccessible localities were also enumerated after the end of the official enumeration
period. Because some enumeration areas in fast growing cities and towns, such as, Accra
Metropolitan Area, Kumasi, Kasoa and Techiman were not properly demarcated and some
were characterized by large EAs, some enumerators were unable to complete their assigned
tasks within the stipulated time.
1.6.4 Post enumeration survey
In line with United Nations recommendations, GSS conducted a Post Enumeration Survey
(PES) in April, 2011 to check content and coverage error. The PES was also to serve as an
important tool in providing feedback regarding operational matters such as concepts and
procedures in order to help improve future census operations. The PES field work was
carried out for 21 days in April 2011 and was closely monitored and supervised to ensure
quality output. The main findings of the PES were that:
97.0 percent of all household residents who were in the country on Census Night (26th
September, 2010) were enumerated.
1.3 percent of the population was erroneously included in the census.
Regional differentials are observed. Upper East region recorded the highest coverage
rate of 98.2 percent while the Volta region had the lowest coverage rate of 95.7
percent.
Males (3.3%) were more likely than females (2.8%) to be omitted in the census. The
coverage rate for males was 96.7 percent and the coverage rate for females was 97.2
percent. Also, the coverage rates (94.1%) for those within the 20-29 and 30-39 age
groups are relatively lower compared to the coverage rates of the other age groups.
There was a high rate of agreement between the 2010 PHC data and the PES data for
sex (98.8%), marital status (94.6%), relationship to head of household (90.5%) and
age (83.0%).

10
1.6.5 Release and dissemination of results
The provisional results of the census were released in February 2011 and the final results in
May 2012. A National Analytical report, six thematic reports, a Census Atlas, 10 Regional
Reports and a report on Demographic, Social, Economic and Housing were prepared and
disseminated in 2013
1.6.6 Concepts and definitions
Introduction
The 2010 Population and Housing Census of Ghana followed the essential concepts and
definitions of a modern Population and Housing Census as recommended by the United
Nations (UN). It is important that the concepts, definitions and recommendations are adhered
to since they form the basis upon which Ghana could compare her data with that of other
countries.
The concepts and definitions in this report cover all sections of the 2010 Population and
Housing Census questionnaires (PHC1A and PHC1B). The sections were: geographical
location of the population, Household and Non-household population, Literacy and
Education, Emigration, Demographic and Economic Characteristics, Disability, Information
and Communication Technology (ICT), Fertility, Mortality, Agricultural Activity and
Housing Conditions.
The concepts and definitions are provided to facilitate understanding and use of the data
presented in this report. Users are therefore advised to use the results of the census within the
context of these concepts and definitions.
Region
There were ten (10) administrative regions in Ghana during the 2010 Population and Housing
Census as they were in 1984 and 2000.
District
In 1988, Ghana changed from the local authority system of administration to the District
assembly system. In that year, the then existing 140 local authorities were demarcated into
110 districts. In 2004, 28 new districts were created; this increased the number of districts in
the country to 138. In 2008, 32 additional districts were created bringing the total number of
districts to 170. The 2010 Population and Housing Census was conducted in these 170
administrative districts (these are made-up of 164 districts/municipals and 6 metropolitan
areas). In 2012, 46 new districts were created to bring the total number of districts to 216.
There was urgent need for data for the 46 newly created districts for planning and decision-
making. To meet this demand, the 2010 Census data was re-programmed into 216 districts
after carrying out additional fieldwork and consultations with stakeholders in the Districts
affected by the creation of the new districts.
Locality
A locality was defined as a distinct population cluster (also designated as inhabited place,
populated centre, settlement) which has a NAME or LOCALLY RECOGNISED STATUS. It
included fishing hamlets, mining camps, ranches, farms, market towns, villages, towns, cities
and many other types of population clusters, which meet the above criteria. There were two
main types of localities, rural and urban. As in previous censuses, the classification of
localities into ‘urban’ and ‘rural’ was based on population size. Localities with 5,000 or more

11
persons were classified as urban while localities with less than 5,000 persons were classified
as rural.
Population
The 2010 Census was a “de facto” count and each person present in Ghana, irrespective of
nationality, was enumerated at the place where he/she spent the midnight of 26th September
2010.
Household
A household was defined as a person or a group of persons, who lived together in the same
house or compound and shared the same house-keeping arrangements. In general, a
household consisted of a man, his wife, children and some other relatives or a house help who
may be living with them. However, it is important to remember that members of a household
are not necessarily related (by blood or marriage) because non-relatives (e.g. house helps)
may form part of a household.
Head of Household
The household head was defined as a male or female member of the household recognised as
such by the other household members. The head of household is generally the person who has
economic and social responsibility for the household. All relationships are defined with
reference to the head.
Household and non-household population
Household population comprised of all persons who spent the census night in a household
setting. All persons who did not spend the census night in a household setting (except
otherwise stated) were classified as non-household population. Persons who spent census
night in any of the under listed institutions and locations were classified as non-household
population:
(a) Educational Institutions
(b) Children's and Old People’s Homes
(c) Hospitals and Healing Centres
(d) Hotels
(e) Prisons
(f) Service Barracks
(g) Soldiers on field exercise
(h) Floating Population: The following are examples of persons in this category:
i. All persons who slept in lorry parks, markets, in front of stores and offices, public
bathrooms, petrol filling stations, railway stations, verandas, pavements, and all
such places which are not houses or compounds.
ii. Hunting and fishing camps.
iii. Beggars and vagrants (mentally sick or otherwise).

12
Age
The age of every person was recorded in completed years disregarding fractions of days and
months. For those persons who did not know their birthdays, the enumerator estimated their
ages using a list of district, regional and national historical events.
Nationality
Nationality is defined as the country to which a person belongs. A distinction is made
between Ghanaians and other nationals. Ghanaian nationals are grouped into Ghanaian by
birth, Ghanaian with dual nationality and Ghanaian by naturalization. Other nationals are
grouped into ECOWAS nationals, Africans other than ECOWAS nationals, and non-
Africans.
Ethnicity
Ethnicity refers to the ethnic group that a person belonged to. This information is collected
only from Ghanaians by birth and Ghanaians with dual nationality. The classification of
ethnic groups in Ghana is that officially provided by the Bureau of Ghana Languages and
which has been in use since the 1960 census.
Birthplace
The birthplace of a person refers to the locality of usual residence of the mother at the time of
birth. If after delivery a mother stayed outside her locality of usual residence for six months
or more or had the intention of staying in the new place for six or more months, then the
actual town/village of physical birth becomes the birthplace of the child.
Duration of residence
Duration of residence refers to the number of years a person has lived in a particular place.
This question is only asked of persons not born in the place where enumeration took place.
Breaks in duration of residence lasting less than 12 months are disregarded. The duration of
residence of persons who made multiple movements of one (1) year or more is assumed to be
the number of years lived in the locality (town or village) since the last movement.
Religion
Religion refers to the individual’s religious affiliation as reported by the respondent,
irrespective of the religion of the household head or the head’s spouse or the name of the
person. No attempt was made to find out if respondents actually practiced the faith they
professed.
Marital status
Marital status refers to the respondent’s marital status as at Census Night. The question on
marital status was asked only of persons 12 years and older. The selection of the age limit of
12 years was based on the average age at menarche and also on the practice in some parts of
the country where girls as young as 12 years old could be given in marriage.
Literacy
The question on literacy referred to the respondent's ability to read and write in any language.
A person was considered literate if he/she could read and write a simple statement with
understanding. The question on literacy was asked only of persons 11 years and older.

13
Education
School Attendance
Data was collected on school attendance for all persons three (3) years and older. School
attendance refers to whether a person has ever attended, was currently attending or has never
attended school. In the census, school meant an educational institution where a person
received at least four hours of formal education.
Although the lower age limit of formal education is six years for primary one, eligibility for
the school attendance question was lowered to three years because pre-school education has
become an important phenomenon in the country.
Level of Education
Level of education refers to the highest level of formal school that a person ever attended or
was attending. This information was obtained for persons 3 years and older.
Activity status
Activity status refers to economic or non-economic activity of respondents during the 7 days
preceding census night. Information on type of activity was collected on persons 5 years and
older. A person was regarded as economically active if he/she:
a. Worked for pay or profit or family gain for at least 1 hour within the 7 days preceding
Census Night. This included persons who were in paid employment or self-
employment or contributing family workers.
b. Did not work, but had jobs to return to.
c. Were unemployed.
The economically not active were persons who did not work and were not seeking for work.
They were classified by reasons for not being economically active. Economically not active
persons included homemakers, students, retired persons, the disabled and persons who were
unable to work due to their age or ill-health.
Occupation
This referred to the type of work the person was engaged in at the establishment where he/she
worked. This was asked only of persons 5 years and older who worked 7 days before the
census night, and those who did not work but had a job to return to as well as those
unemployed who had worked before. All persons who worked during the 7 days before the
census night were classified by the kind of work they were engaged in. The emphasis was on
the work the person did during the reference period and not what he/she was trained to do.
For those who did not work but had a job to return to, their occupation was the job they
would go back to after the period of absence. Also, for persons who had worked before and
were seeking for work and available for work, their occupation was on the last work they did
before becoming unemployed. If a person was engaged in more than one occupation, only the
main one was considered.
Industry
Industry referred to the type of product produced or service rendered at the respondent’s work
place. Information was collected only on the main product produced or service rendered in
the establishment during the reference period.

14
Employment status
Employment status refers to the status of a person in the establishment where he/she currently
works or previously worked. Eight employment status categories were provided: employee,
self-employed without employees, self-employed with employees, casual worker,
contributing family worker, apprentice, domestic employee (house help). Persons who could
not be classified under any of the above categories were classified as “other”.
Employment sector
This refers to the sector in which a person worked. The employment sectors covered in the
census were public, private formal, private informal, semi-public/parastatal, NGOs and
international organizations.
Disability
Persons with disability were defined as those who were unable to or were restricted in the
performance of specific tasks/activities due to loss of function of some part of the body as a
result of impairment or malformation. Information was collected on persons with visual/sight
impairment, hearing impairment, mental retardation, emotional or behavioural disorders and
other physical challenges.
Information Communication Technology (ICT)
ICT questions were asked for both individuals and households. Persons having mobile
phones refer to respondents 12 years and older who owned mobile phones (irrespective of the
number of mobile phones owned by each person). Persons using internet facility refers to
those who had access to internet facility at home, internet cafe, on mobile phone or other
mobile device. Internet access is assumed to be not only via computer, but also by mobile
phones, PDA, game machine and digital television.
Households having Personal Computers/Laptops refer to households who own
desktops/laptop computers. The fixed telephone line refers to a telephone line connecting a
customer’s terminal equipment (e.g. telephone set, facsimile machine) to the public switch
telephone network.
Fertility
Two types of fertility data were collected: lifetime fertility and current fertility. Lifetime
fertility refers to the total number of live births that females 12 years and older had ever had
during their life time. Current fertility refers to the number of live births that females 12-54
years old had in the 12 months preceding the Census Night.
Mortality
Mortality refers to all deaths that occurred in the household during the 12 months preceding
the Census Night. The report presents information on deaths due to accidents, violence,
homicide and suicide. In addition, data were collected on pregnancy-related deaths of
females 12-54 years.
Agriculture
The census sought information on household members who are engaged in agricultural
activities, including the cultivation of crops or tree planting, rearing of livestock or breeding
of fish for sale or family consumption. Information was also collected on their farms, types of
crops and number and type of livestock.

15
Housing conditions and facilities
The UN recommended definition of a house as “a structurally separate and independent place
of abode such that a person or group of persons can isolate themselves from the hazards of
climate such as storms and the sun’’ was adopted. The definition, therefore, covered any type
of shelter used as living quarters, such as separate houses, semi-detached houses,
flats/apartments, compound houses, huts, tents, kiosks and containers.
Living quarters or dwelling units refer to a specific area or space occupied by a particular
household and therefore need not necessarily be the same as the house of which the dwelling
unit may be a part.
Information collected on housing conditions included the type of dwelling unit, main
construction materials for walls, floor and roof, holding/tenure arrangement, ownership type,
type of lighting, source of water supply and toilet facilities. Data was also collected on
method of disposal of solid and liquid waste.
1.7 Organization of the Report
The report consists of nine chapters. Chapter one provides basic information about the
District. It gives a brief background of the District, describing its physical features, political
and administrative structure, social and cultural structure, economy and the methodology and
concepts used in the report. Chapter two discusses the population size, composition and age
structure. It further discusses the migratory pattern in the District as well as fertility and
mortality.
In chapter three, the focus is on household size, composition and headship as well as the
marital characteristics and nationality of the inhabitants of the District. The chapter also
discusses the religious affiliations and the educational statuses of the members of the District.
Chapter four focuses on economic characteristics such as economic activity status,
occupation, industries and the employment status and sectors that the people are employed.
Information Communication Technology (ICT) is discussed in chapter five. It analyses
mobile phone ownership, internet use and ownership of desktop/laptop computers while
chapter six is devoted to Persons living with disabilities (PWDs) and their socio-demographic
characteristics. Chapter seven concentrates on the agricultural activities of the households,
describing the types of farming activities, livestock rearing and numbers of livestock reared.
In chapter eight, housing conditions such as housing stock, type of dwelling and construction
materials, room occupancy, holding and tenancy, lighting and cooking facilities, bathing and
toilet facilities, waste disposal and source of water for drinking or for other domestic use in
the District are discussed and analyzed in detail. The final chapter, Chapter nine presents the
summary of findings and conclusions. It also discusses the policy implications of the findings
for the District.

16
CHAPTER TWO
DEMOGRAPHIC CHARACTERISTICS
2.1 Introduction
This chapter looks at the demographic characteristics within the Krachi Nchumuru District
using the 2010 population and housing census (PHC) data. It describes the population size
which is really critical for development planning. The chapter also examines the age sex
distribution as well as the fertility and mortality rates of the District.
2.2 Population Size and Distribution
2.2.1 Age–sex structure
The size of a population is considered a critical determinant in respect of the development of
every country and Ghana for that matter; hence managing a sizeable and productive
population will enhance effective and sustainable socio-economic development. Table 2.1
show the population size of the District by age, sex and type of locality (urban/rural). It show
a total district population of 72,688 for both sexes and all ages with more males (36,649) than
females (36,039). The District has a relatively rural population (57,760) than urban
population of 14,928 and a sex ratio of 101.7.
It is not surprising however, to notice from Table 2.1 that there are more females than males
between the ages of 20-44 years and 60-69 years in the District. Reasons for the former being
more is that males move out of the District in search of greener pastures and more females
are brought in through marriage. It is also said that the difference in the latter age range (60-
69) is because more men die than women after 60years because of the nature (risk) of their
jobs. The District has a dependency ratio is 97.1 for every 100 working age population. The
dependency ratio is even higher in the urban areas 99.8 than in the rural areas 96.5.
2.2.2 Sex ratio
The sex ratio of a population measures the number of males to females in the population, the
balance of the sexes being 100. Table 2.1 indicates that the District has a sex ratio of 101.7
males to 100 females. Contrary to the expectation of a declining sex ratio with increasing age,
the observed sex ratios seems to rather increase from age group 0-4 to 15-19 from 104.9 to
119.3 and then declines from age group 20-24 to 40-44 and afterwards fluctuates through the
other age groups. This could possibly be due to age misreporting at the early ages.

17
Table 2.1: Population by Age, sex and type of locality
Age group
Sex
Sex
ratio
Type of locality
Both Sexes
Male
Female
Urban
Rural
Number Percent Number Percent Number Percent Number Percent Number Percent All Ages 72,688 100.0
36,649 100.0
36,039 100.0
101.7
14,928 100.0
57,760 100.0
0 – 4 12,190 16.8
6,240 17.0
5,950 16.5
104.9
2,398 16.1
9,792 17.0
5 – 9 10,893 15.0
5,629 15.4
5,264 14.6
106.9
2,271 15.2
8,622 14.9
10 – 14 9,578 13.2
5,066 13.8
4,512 12.5
112.3
1,985 13.3
7,593 13.1
15 – 19 7,618 10.5
4,144 11.3
3,474 9.6
119.3
1,459 9.8
6,159 10.7
20 – 24 6,103 8.4
2,976 8.1
3,127 8.7
95.2
1,152 7.7
4,951 8.6
25 – 29 5,091 7.0
2,302 6.3
2,789 7.7
82.5
1,004 6.7
4,087 7.1
30 – 34 4,450 6.1
1,990 5.4
2,460 6.8
80.9
951 6.4
3,499 6.1
35 – 39 3,552 4.9
1,708 4.7
1,844 5.1
92.6
732 4.9
2,820 4.9
40 – 44 3,236 4.5
1,602 4.4
1,634 4.5
98
691 4.6
2,545 4.4
45 – 49 2,337 3.2
1,216 3.3
1,121 3.1
108.5
502 3.4
1,835 3.2
50 – 54 2,090 2.9
1,074 2.9
1,016 2.8
105.7
464 3.1
1,626 2.8
55 – 59 1,173 1.6
651 1.8
522 1.4
124.7
263 1.8
910 1.6
60 – 64 1,222 1.7
604 1.6
618 1.7
97.7
255 1.7
967 1.7
65 – 69 745 1.0
370 1.0
375 1.0
98.7
191 1.3
554 1.0
70 – 74 903 1.2
406 1.1
497 1.4
81.7
217 1.5
686 1.2
75 – 79 541 0.7
254 0.7
287 0.8
88.5
161 1.1
380 0.7
80 – 84 475 0.7
216 0.6
259 0.7
83.4
113 0.8
362 0.6
85+ 491 0.6
201 0.6
290 0.7
220.2
119 0.8
372 0.7
All Ages 72,688 100.0
36,649 100.0
36,039 100.0
101.7
14,928 100.0
57,760 100.0
0-14 32,661 44.9
16,935 46.2
15,726 43.6
107.7
6,654 44.6
26,007 45.0
15-64 36,872 50.7
18,267 49.8
18,605 51.6
98.2
7,473 50.1
29,399 50.9
65+ 3,155 4.3
1,447 3.9
1,708 4.7
84.7
801 5.4
2,354 4.1
Age-dependency ratio 97.1 100.6 93.7 99.8 96.5 Source: Ghana Statistical Service, 2010 Population and Housing Census

18
2.2.3 Population pyramid
A population pyramid graphically represents age and sex data as depicted in figure 2.2. The
District has a youthful population. This is shown by a greater percentage of the population
being between the ages of 0-24 years. It is obvious that with increasing age, the population
pyramid looks considerably thinner for males compared to females, demonstrating that with
advancing age, the proportion of males is lower than that of females.
Figure 2.1: Population pyramid
Source: Ghana Statistical Service, 2010 Population and Housing Census
2.3 Fertility, Mortality and Migration
The future of population size and age-structure of any society depends basically on three
demographic components: fertility, mortality and migration.
2.3.1 Fertility
Fertility is one of the most important components of demographic change. It is the frequency
of childbearing among the population and measures the relative frequency with which births
occur within a given population at a particular time. The total fertility rate (TFR) is the
average number of children that would be born to a woman by the time she completes her
childbearing age. The crude birth rate (CBR), general fertility rate (GFR) among others is
some of the measures. The crude birth rate (CBR) is the simplest and most frequently used
measure of fertility. It is easy to calculate because it requires only the total number of births
and the total population. It is considered crude because it’s always expressed per 1000
population and includes all ages and both sexes in the denominator. The general fertility rate
8,000 6,000 4,000 2,000 0 2,000 4,000 6,000 8,000
0-4
5-9
10-14
15-19
20-24
25-29
30-34
35-39
40-44
45-49
50-54
55-59
60-64
65-69
70-74
75-79
80-84
85+
Population
Age
Female Male

19
(GFR) expresses births relative to the number of women in the reproductive age. More data
are required to calculate the GFR than the CBR because one has to know the age and sex
composition of the population.
From Table 2.2; the Krachi Nchumuru District has 16,449 women within the child bearing
ages of 15 - 49years and older and a total fertility rate of 3.8 which certainly differs from the
general fertility rate (110.8) and crude birth rate of 25.1.
Table 2.2: Reported total fertility rate, general fertility rate and crude birth rate
District Population
Number of
women 15-49
years
Number
of births
in last 12
months
Total
Fertility
Rate
*General
Fertility
Rate
**Crude
Birth
Rate
All Districts 2,118,252 517,313 51,292 3.38 99.2 24.2
South Tongu 87,950 21,325 2,209 3.56 103.6 25.1
Keta Municipal 147,618 36,102 3,204 3.11 88.7 21.7
Ketu South 160,756 41,944 3,887 3.05 92.7 24.2
Ketu North 99,913 24,604 2,439 3.41 99.1 24.4
Akatsi 95,426 24,128 2,492 3.61 103.3 26.1
Central Tongu 59,411 14,512 1,377 3.25 94.9 23.2
Agotime 36,391 9,351 666 2.45 71.2 18.3
Ho Municipal 177,281 49,729 3,702 2.62 74.4 20.9
South Dayi 46,661 11,048 1,052 3.27 95.2 22.5
Kpando Municipal 53,736 13,506 1,177 3 87.1 21.9
Hohoe Municipal 167,016 42,220 4,052 3.29 96 24.3
Biakoye 65,901 15,067 1,484 3.37 98.5 22.5
Jasikan 59,181 13,924 1,455 3.45 104.5 24.6
Kadjebi 59,303 13,652 1,430 3.57 104.7 24.1
Krachi East 116,804 26,146 3,319 4.28 126.9 28.4
Krachi West 49,417 11,225 1,245 3.72 110.9 25.2
Nkwanta South 117,878 27,226 3,304 4.01 121.4 28
Nkwanta North 64,553 14,758 2,043 4.57 138.4 31.6
North Tongu 89,777 22,874 1,931 2.9 84.4 21.5
Akatsi North 33,035 7,797 723 3.3 92.7 21.9
Adaklu 28,013 6,843 747 3.76 109.2 26.7
Ho West 94,600 21,926 2,294 3.61 104.6 24.2
Afadzato South 95,030 21,842 2,373 3.85 108.6 25
North Dayi 39,913 9,115 865 3.34 94.9 21.7
Krachi Nchumuru 72,688 16,449 1,822 3.77 110.8 25.1 Source: Ghana Statistical Service, 2010 Population and Housing Census
Note: * Number of live births per 1,000 women aged 15-49 years
** Number of live births per 1,000 population
Children surviving
The 2010 PHC, asked questions on the fertility of females 12years and older. Table 2.3 shows
that more females 60years and older have the highest number of surviving children (10,790)
than all the other age groups. This is followed by the 30-34 age brackets with 8,336 surviving
children made up of 4,213males and 4,123 females in the District. In terms of sex variations,

20
more males survive for births given by women in the early age groups (12-29 years) as shown
in Table 2.3. But higher in female survival rates are recorded for women (60+). It can be said
however, that there is a generally high level of survival rates in the District. This could
probably be attributed to improvements in health facilities and health care deliveries in the
region.
Table 2.3: Female population 12 years and older by age, children ever born,
children surviving and sex of child
Age
Number
of
Females
Children Ever Born Children Surviving
Both
sexes Male
Female
Both
sexes Male Female
All ages 22,837
67,207 34,323 32,884
58,040 29,320 28,720
12 - 14 2,524
18 10 8
13 8 5
15 - 19 3,474
456 239 217
430 217 213
20 - 24 3,127
3,436 1,752 1,684
3,171 1,587 1,584
25 - 29 2,789
6,587 3,394 3,193
6,047 3,039 3,008
30 - 34 2,460
9,179 4,709 4,470
8,336 4,213 4,123
35 - 39 1,844
8,740 4,622 4,118
7,880 4,150 3,730
40 - 44 1,634
8,979 4,497 4,482
7,775 3,842 3,933
44 - 49 1,121
6,449 3,246 3,203
5,619 2,850 2,769
50 - 54 1,016
6,041 3,110 2,931
5,117 2,563 2,554
55 - 59 522
3,544 1,811 1,733
2,862 1,473 1,389
60 + 2,326 13,778 6,933 6,845 10,790 5,378 5,412 Source: Ghana Statistical Service, 2010 Population and Housing Census
2.3.2 Mortality
Mortality is the deaths that occur within a population at a particular time. The probability of
dying during a given time period is linked to many factors, such as age, sex, race, occupation,
and economic status. This indicator reveals much about a population’s standard of living and
health care. The reported age specific death rate (ASDR) for the under-five is slightly higher
for males than for the females. The ASDRs for females aged 5-9 and up to 50-54 is higher
compared to males. There is a sharp drop in ASDRs for males at 60-64 whereas that of
females increases sharply from age 55-59 (Figure 2.2).
Figure 2.2: Age-Specific death rate (ASDR), 2010
Source: Ghana Statistical Service, 2010 Population and Housing Census
0
0.005
0.01
0.015
0.02
0.025
0.03
0.035
0.04
0-4 5-9 10-14 15-19 20-24 25-29 30-34 35-39 40-44 45-49 50-54 55-59 60-64 65-69 70+
Deaths
Age
Male
Female

21
Crude death rate
Crude death rate (CDR) is the number of deaths per 1000 population in a given year. Krachi
Nchumuru District recorded 456 deaths in households of which the CDR constitute 6.3 deaths
per 1,000 populations (Table 2.4).
Table 2.4: Total population, deaths in households and crude
death rate
District
Total
Population
Deaths in
households
*Crude
death rate
All District 2,118,252 18,596 8.8
South Tongu 87,950 1,025 11.7
Keta Municipal 147,618 1,819 12.3
Ketu South 160,756 1,160 7.2
Ketu North 99,913 908 9.1
Akatsi 95,426 1,013 10.6
Central Tongu 59,411 590 9.9
Agotime 36,391 165 4.5
Ho Municipal 177,281 1,468 8.3
South Dayi 46,661 495 10.6
Kpando Municipal 53,736 478 8.9
Hohoe Municipal 167,016 1,458 8.7
Biakoye 65,901 414 6.3
Jasikan 59,181 568 9.6
Kadjebi 59,303 521 8.8
Krachi East 116,804 717 6.1
Krachi West 49,417 174 3.5
Nkwanta South 117,878 568 4.8
Nkwanta North 64,553 383 5.9
North Tongu 89,777 742 8.3
Akatsi North 33,035 450 13.6
Adaklu 28,013 404 14.4
Ho West 94,600 1,181 12.5
Afadzato South 95,030 927 9.8
North Dayi 39,913 512 12.8
Krachi Nchumuru 72,688 456 6.3 Source: Ghana Statistical Service: 2010 Population and Housing Census
Note: * Number of deaths per 1,000 population
2.3.3 Migration
Migration refers to the movement of people (persons) from one place to stay at another. It
plays an important role in the redistribution of the population of Ghana and the District.
Migration contributes to the decrease in the population of the area of origin or increase in the
destination areas. Migration is also selective with regard to age, sex and therefore productive
capacity. Thus, migration has significant demographic, social and economic impact on both
the areas of origin and destination.
More persons 11,513 representing 29.5 percent have lived in the District for 20 years or more
whilst 13.4 percent have lived in the District for less than 1year (Table 2.5). The Table also

22
indicates that 5,743 people living in the District were born elsewhere in the region. Of this
figure, 24.0 percent have lived in the District between 1-4 years and 27.0 percent have lived
there for 20 or more years. Majority (40.8%) of those who have lived in the District for 20 or
more years come largely from the upper West region followed by 38.8 percent migrants that
come from Northern Region whilst 14.3 out of the total of 49.0 percent who migrated from
the Upper West Region have lived in the Krachi Nchumuru District for less than one year.
Table 2.5: Birthplace by duration of residence of migrants
Birthplace
Duration of residence (%)
Number
Less than
1 year
1-4
years
5-9
years
10-19
years
20+
years
Total 11,513 13.4 22.8 15.1 19.2 29.5
Born elsewhere in the region 5,743 14.8 24.0 15.5 18.6 27.0
Born elsewhere in another region
Western 49 12.2 26.5 6.1 18.4 36.7
Central 284 14.8 22.9 20.1 20.8 21.5
Greater Accra 643 15.6 26.6 11.2 26.3 20.4
Volta 0 0.0 0.0 0.0 0.0 0.0
Eastern 272 11.4 25.4 13.2 17.3 32.7
Ashanti 368 16.3 19.6 13.9 14.7 35.6
Brong Ahafo 548 11.7 25.5 18.1 25.9 18.8
Northern 2,466 11.1 17.6 13.6 18.8 38.9
Upper East 80 17.5 11.3 18.8 18.8 33.8
Upper West 49 14.3 10.2 18.4 16.3 40.8
Outside Ghana 1,011 9.2 26.6 16.9 17.0 30.3 Source: Ghana Statistical Service, 2010 Population and Housing Census
Of the 5,743 migrants to the District, those from the Northern Region form the highest
(43.0%) followed by those from the Greater Accra Region (11.2%) and those from the Brong
Ahafo Region (9.5%). A further 1,011 migrants from outside Ghana were enumerated in the
District. Less than 10 percent of them (9.2%) have lived outside the District for less than
1year, 16.9 percent for 5-9 years and 30.3percent have lived outside the District for 20 or
more years.

23
CHAPTER THREE
SOCIAL CHARACTERISTICS
3.1 Introduction
The size, composition, and structure of households are influenced by socio-economic, and
demographic factors such as age at first marriage and birth, length of time spent in school,
occupation, material or financial abilities, capabilities of parents and couples, fertility and
mortality rates, and migration. The total size of the District’s population and its
characteristics are, therefore, largely a reflection of what pertains within households.
Households constitute important units in planning and as such knowledge of household
structure, composition, and headship provides important statistical tool for social and
economic planning. An analysis of households also provides the basis for a reasonable
projection of the future size of population, and planning of housing needs. The chapter
focuses on household size, composition and headship as well as the marital characteristics
and nationality of the inhabitants of the District and discusses further the religious and the
educational statuses of the District.
3.2 Household Size, Composition and Structure
3.2.1 Household size
The 2010 PHC defined a household as a person or group of persons who live together in the
same house or compound and share the same house keeping arrangements. Members of a
household are not necessarily related by blood or marriage. The household has a defined
structure and has a head recognized by all members.
Table 3.1 indicates that the total household population in the District is 72,009. The majority
(79.4 %) live in rural areas. The number of households is 12,333. The average household size
for the District is 5.9. Similarly, 5.6 and 6.0 are the average household size for both urban and
rural localities respectively.
Table 3.1: Household size by type of locality
Categories Total
Country
District
Total Urban Rural
Total household population 24,076,327 72,009 14,832 57,177
Number of households 5,467,054 12,333 2,676 9,657
Average households per house 1.6 1.1 1.1 1
Average household size 4.5 5.9 5.6 6 Source: Ghana Statistical Service, 2010 Population and Housing Census
3.2.2 Household composition
Table 3.2 indicates that 52.2 percent of household populations are children (son/daughter)
while household heads constitute 17.1 percent and spouses (wife/husband) comprise 11.2
percent of household composition. The proportion of male – headed households is 26.9
percent higher than female- headed households (7. 2%). This implies that about four out of
every seven households is headed by males and further implies that even though female-

24
headed households are increasing, the percentage is still not very significant. Female spouses
constitute 22.0 percent of household members while the male spouses constitute less than one
percent of the total household population.
Table 3.2: Household composition by sex
Household composition
Total Male Female
Number Percent
Number Percent
Number Percent
Total 72,009 100.0
36,303 100.0
35,706 100.0
Head 12,333 17.1
9,768 26.9
2,565 7.2
Spouse (wife/husband) 8,039 11.2
187 0.5
7,852 22.0
Child (son/daughter) 37,602 52.2
20,410 56.2
17,192 48.1
Parent/Parent in-law 894 1.2
84 0.2
810 2.3
Son/Daughter in-law 357 0.5
47 0.1
310 0.9
Grandchild 3,512 4.9
1,676 4.6
1,836 5.1
Brother/Sister 2,927 4.1
1,742 4.8
1,185 3.3
Step child 694 1.0
397 1.1
297 0.8
Adopted/Foster child 347 0.5
147 0.4
200 0.6
Other relative 4,682 6.5
1,537 4.2
3,145 8.8
Non-relative 622 0.9 308 0.8 314 0.9 Source: Ghana Statistical Service, 2010 Population and Housing Census
3.2.4 Household structure
The nature of the family structure as observed in Table 3.3 underscores the prevalence and
strength of the extended family system. The proportion of the District population that lives in
various extended family households is 37.6 percent compare to 34.5 percent that live in
nuclear households. Single person households are not common.
Similarly, the extended and nuclear family systems are dominant in both male and female-
headed households. The percentage is higher (38.2%) for female-headed extended households
compare to 36.9 percent for their male counterparts But male-headed nuclear households is
36.4 percent compare to 32.6 percent for their female counterparts. Single parent (extended +
non-relative) constitute the lowest household structure in both male and female-headed
households.
Table 3.3: Household structure by sex
Household structure
Total
Male Female
Number Percent Number Percent Number Percent
Total 72,009 100.0
36,303 100.0 35,706 100.0
Head only 1,020 1.4
688 1.9 332 0.9
Head and a spouse only 492 0.7
251 0.7 241 0.7
Nuclear (Head spouse(s) children) 24,849 34.5
13,225 36.4 11,624 32.6
Extended (Head spouse(s) children
Head's relatives) 27,044 37.6
13,397 36.9 13,647 38.2
Extended + non relatives 1,327 1.8
648 1.8 679 1.9
Head spouse(s) and other composition 1,850 2.6
931 2.6 919 2.6
Single parent Nuclear 5,127 7.1
2,332 6.4 2,795 7.8
Single parent Extended 6,444 8.9
2,980 8.2 3,464 9.7
Single parent Extended + non relative 430 0.6
218 0.6 212 0.6
Head and other composition but no
spouse 3,426 4.8 1,633 4.5 1,793 5.0
Source: Ghana Statistical Service, 2010 Population and Housing Census

25
3.3 Marital Status
Marriage is a highly valued institution in Ghana. It is one of the determinants of an individual
status and also an indicator of social responsibility, trust and achievement. Every adult unless
afflicted by serious illness or deformity is expected to marry. Voluntary celibacy was frown
upon in traditional Ghanaian societies. Most adults would therefore wish to get married at
one time or the other and this is more so with females.
The 2010 Census classified “marital status” into six categories namely; never married, living
together/consensual union, married, separated, divorced and widowed. Each individual aged
12 years and older fell into only one of the six categories. The definition of marriage includes
persons in any of the following types of marriages: civil, traditional and common
law/consensual. Table 3.4 shows that of a total of 45,422 persons 12 years and older 40.6
percent never married while 47.7 percent married. The rest are either widowed, (5.2%) living
together in informal or consensual union (2.9%), divorced (2.2%) or separated (1.4%).
Table 3.4: Persons 12 years and older by sex, age-group and marital status
Sex/age-group Number
Never
married
Informal/
Consensual
union/Living
together Married Separated Divorced Widowed
Both Sexes
Total 45,422 40.6 2.9 47.7 1.4 2.2 5.2
12 – 14 5,395 95.5 0.4 4.1 0.0 0.0 0.0
15 - 19 7,618 90.9 1.7 7.1 0.2 0.0 0.1
20 - 24 6,103 59.8 6.2 31.8 1.2 0.6 0.4
25 - 29 5,091 29.6 6.7 60.8 1.3 1.2 0.5
30 - 34 4,450 11.7 4.1 78.1 2.0 2.2 1.8
35 - 39 3,552 6.2 3.0 83.4 2.0 3.0 2.5
40 - 44 3,236 4.4 1.4 83.0 2.7 3.7 4.7
45 - 49 2,337 2.1 1.5 81.8 2.2 5.2 7.3
50 - 54 2,090 3.0 1.5 72.4 4.0 5.9 13.3
55 - 59 1,173 3.0 0.9 71.4 2.7 6.0 15.9
60 - 64 1,222 3.3 0.7 63.4 2.3 8.1 22.3
65+ 3,155 4.1 0.4 54.6 2.1 4.4 34.4
Male
Total 22,585 48.7 2.5 44.4 1.3 1.8 1.3
12 – 14 2,871 95.8 0.3 3.9 0.0 0.0 0.0
15 - 19 4,144 94.7 0.6 4.3 0.1 0.1 0.1
20 - 24 2,976 79.9 4.5 14.7 0.7 0.2 0.1
25 - 29 2,302 46.9 6.8 44.4 0.8 1.0 0.2
30 - 34 1,990 19.2 5.4 71.2 2.1 1.6 0.6
35 - 39 1,708 10.5 3.9 81.1 1.3 2.0 1.1
40 - 44 1,602 6.2 1.1 86.4 2.1 3.1 1.1
45 - 49 1,216 2.2 2.2 86.3 2.7 4.4 2.1
50 - 54 1,074 4.4 1.5 81.8 3.9 6.1 2.4
55 - 59 651 4.1 0.8 82.3 3.4 4.6 4.8
60 - 64 604 5.3 1.2 80.3 2.3 6.5 4.5
65+ 1,447 4.8 0.6 79.5 2.3 4.7 8.1

26
Table 3.4: Persons 12 years and older by sex, age-group and marital status (cont’d)
Sex/age-
group Number Never married
Informal/
Consensual
union/Living
together Married Separated Divorced Widowed
Female
Total 22,837 32.6 3.2 51.0 1.6 2.5 9.1
12 – 14 2,524 95.2 0.5 4.3 0.0 0.0 0.0
15 - 19 3,474 86.4 2.9 10.3 0.2 0.0 0.1
20 - 24 3,127 40.7 7.9 48.2 1.6 1.0 0.6
25 - 29 2,789 15.3 6.6 74.3 1.6 1.5 0.7
30 - 34 2,460 5.6 3.0 83.8 1.9 2.8 2.8
35 - 39 1,844 2.2 2.1 85.5 2.7 3.8 3.8
40 - 44 1,634 2.6 1.8 79.7 3.3 4.3 8.3
45 - 49 1,121 1.9 0.7 76.8 1.7 6.1 12.8
50 - 54 1,016 1.5 1.5 62.5 4.0 5.8 24.7
55 - 59 522 1.5 1.1 57.9 1.9 7.7 29.9
60 - 64 618 1.3 0.2 46.9 2.3 9.7 39.6
65+ 1,708 3.5 0.3 33.6 1.8 4.1 56.7 Source: Ghana Statistical Service: 2010 Population and Housing Census
For the sexes marriage is higher for the females than for the males. For example, proportion
married is 51.0 percent higher for the females than for the males (44.4%).At the same time
the, proportion of females widowed is 9.1 percent higher than for the males (1.3%) and
females living together in informal or consensual union is 3.2 percent higher than for the
males.
For the age groups, proportion married is highest for the age –group 35-39 (83.4%) while
those living together in informal or consensual union are highest for age group 25-29 (6.7%).
Proportion widowed is highest for age group 65 an above (34.4%) By age 60-64 years the
proportion divorced is 9.7 percent higher for the females than for the males which are 6.5
percent.
The proportions separated, is higher among females than males and for both sexes it increases
with age and is highest in the age groups 39- 54 years. However unlike divorce, the
proportions for the various age groups are not consistently higher for males.
The data also show that there is a positive correlation between age and widowhood, but with
proportions higher for females than males. For example by age 65 years and above, 56.7
percent of females are widowed while only 8.1 percent males are reported as widowers.
3.3.1 Persons 12 years and older by sex, marital status and level of education.
Out of the total population of 18,434 persons who have never married, more than half
(58.3%) have basic education followed by 29.3 percent who do not have any level of
education. (Table 3.5). While 10.7 percent of the never married have obtained secondary
education, less than one percent (0.2%) of them have tertiary level education. Among the
married population of 21,684 persons who are 12 years and older almost three-quarters,
(74.5%) percent have no education followed by 20.7 percent who have basic education and
2.7 percent with secondary education. Those with tertiary education are only 0.3 percent.
Similarly, out of a population of 1,296 persons 12 years and above who are living together
in informal or consensual unions, almost half (48.0%) have no education followed by 36.5
percent with basic education.

27
There are variations in marital statuses between the sexes. For example, there are more
married females (80.1%) with no education than their male counterparts (67.9%).But the
proportion of married males with basic education is24.4 percent higher than that for the
females which is 17.5 percent. Similarly the proportion of females living in informal or
consensual union is 55.9 percent higher than their male counterparts (38.1%) But the
proportion of females with basic education living together in informal or consensual union is
34.1 percent less than their male counterparts which is 39.5 percent At the same time, divorce
is 73.0 percent higher for females with no education than for the males with no education
(64.4%).But divorce for males with basic education is 27.9 percent higher than that for the
females with basic education which is 22.8 percent. Similarly, the proportion widowed is
very high for females with no education (92.1%) compare to 79.2 percent for the males. But
the proportion widowed is 16.0 percent higher for males with basic education than for their
female’s counterparts with 7.2 percent.
Table 3.5: Persons 12 years and older by sex, marital status and level of education
Sex/Marital status Number
All
levels
No
Education Basic1
Secon-
dary2
Voc/
Tech/
Comm
Post
middle/
secondary
certificate/
diploma3 Tertiary
4
Both Sexes
Total 45,422 100.0 56.0 36.0 6.1 0.5 1.2 0.2
Never married 18,434 100.0 29.3 58.3 10.7 0.4 1.1 0.2
Informal/Consensual
union/Living together 1,296 100.0 48.0 36.5 11.9 1.7 1.9 0.1
Married 21,684 100.0 74.5 20.7 2.7 0.5 1.4 0.3
Separated 657 100.0 65.1 26.9 5.6 0.9 1.4 0.0
Divorced 979 100.0 69.6 24.9 3.3 1.0 1.2 0.0
Widowed 2,372 100.0 90.5 8.3 0.7 0.1 0.3 0.1
Male
Total 22,585 100.0 48.0 40.6 8.5 0.6 2.0 0.3
Never married 10,997 100.0 28.6 56.8 12.3 0.6 1.5 0.2
Informal/Consensual
union/Living together 575 100.0 38.1 39.5 16.9 1.6 3.8 0.2
Married 10,036 100.0 67.9 24.4 4.2 0.6 2.4 0.5
Separated 288 100.0 60.4 28.8 8.3 1.7 0.7 0.0
Divorced 401 100.0 64.6 27.9 3.0 1.7 2.7 0.0
Widowed 288 100.0 79.2 16.0 3.8 1.0 0.0 0.0
Female
Total 22,837 100.0 63.9 31.4 3.8 0.4 0.5 0.1
Never married 7,437 100.0 30.3 60.6 8.3 0.3 0.4 0.1
Informal/Consensual
union/Living together 721 100.0 55.9 34.1 7.9 1.8 0.3 0.0
Married 11,648 100.0 80.1 17.5 1.3 0.4 0.5 0.1
Separated 369 100.0 68.8 25.5 3.5 0.3 1.9 0.0
Divorced 578 100.0 73.0 22.8 3.5 0.5 0.2 0.0
Widowed 2,084 100.0 92.1 7.2 0.3 0.0 0.3 0.1
Source: Ghana Statistical Service, 2010 Population and Housing Census

28
3.3.3 Marital status by economic activity
Regarding economic activity by marital status for the population 12 years and older in the
District, Table 3.6 show a total of 45,422. Of this total, 30,284 persons representing 66.7
percent are employed, 0.9 percent unemployed and 32.5 percent is economically not active.
For employed persons 12 years and older, 7,707 representing 41.8 percent have never married
whereas 18,993 representing 87.6 percent are married. Less than one percent (0.8%) of the
unemployed population is married whilst 11.6 of the economically not active population are
married. There are quite significant percentages of economically not active persons 12years
and above who are widowed (44.0%) and those who are divorced (16.9%)
Table 3.5 show fewer employed females (65.6%) than males (68.0%) just as there are more
economically not active females than males (33.6 %) and 31.3 percent respectively. It also
depicts a higher percentage of females into informal/consensual union (721) than males
(575). Eighty five percent (85%) of this male figure are employed compared to 66.6 of the
female figure. The Table also show more divorced females 578 than males 401 and as
expected the higher number of widowed females (2,084) than males (288) may probably be
explained by the fact that more men are known to die because of the nature of their jobs.
Table 3.6: Persons 12 years and older by sex and economic activity status
Sex/marital status
Total
Employed Unemployed
Economically not
active
Number Percent Number Percent Number Percent Number Percent
Total 45,422 100.0
30,284 66.7
395 0.9
14,743 32.5
Never married 18,434 100.0
7,707 41.8
152 0.8
10,575 57.4
Informal/consensual
union/living together 1,296 100.0
969 74.8
23 1.8
304 23.5
Married 21,684 100.0
18,993 87.6
168 0.8
2,523 11.6
Separated 657 100.0
511 77.8
13 2.0
133 20.2
Divorced 979 100.0
796 81.3
18 1.8
165 16.9
Widowed 2,372 100.0
1,308 55.1
21 0.9
1,043 44.0
Male
Total 22,585 100.0
15,347 68.0
168 0.7
7,070 31.3
Never married 10,997 100.0
4,977 45.3
88 0.8
5,932 53.9
Informal/consensual
union/living together 575 100.0
489 85.0
8 1.4
78 13.6
Married 10,036 100.0
9,138 91.1
53 0.5
845 8.4
Separated 288 100.0
232 80.6
5 1.7
51 17.7
Divorced 401 100.0
334 83.3
6 1.5
61 15.2
Widowed 288 100.0
177 61.5
8 2.8
103 35.8
Female
Total 22,837 100.0
14,937 65.4
227 1.0
7,673 33.6
Never married 7,437 100.0
2,730 36.7
64 0.9
4,643 62.4
Informal/consensual
union/living together 721 100.0
480 66.6
15 2.1
226 31.3
Married 11,648 100.0
9,855 84.6
115 1.0
1,678 14.4
Separated 369 100.0
279 75.6
8 2.2
82 22.2
Divorced 578 100.0
462 79.9
12 2.1
104 18.0
Widowed 2,084 100.0 1,131 54.3 13 0.6 940 45.1
Source: Ghana Statistical Service, 2010 Population and Housing Census

29
3.4 Nationality
Table 3.7 presents the distribution of population by nationality and sex. The Table show that
about 95.5 percent of the District population are Ghanaians with 90.4 percent being
Ghanaians by birth, 3.9 percent by dual nationality and 1.2 percent by naturalization. The
figure further show that 3.9 percent and 0.5 percent constituted people from ECOWAS
countries and Africa other than ECOWAS respectively. The least percentage was registered
by other nationals comprising European, Americas (North, South/Caribbean), Asian and
Oceania (0.2%). Variations by sex follow similar pattern just as shown in Table 3.6 and Fig.1
where majority for both sexes are Ghanaians either by birth, naturalization or dual
citizenship.
Table 3.7: Population by nationality and sex
Nationality
Both sexes Male Female Number Percent Number Percent Number Percent
Total 72,688 100.0
36,649 100.0
36,039 100.0
Ghanaian by birth 65,680 90.4
33,137 90.4
32,543 90.3
Dual nationality (Ghanaian &
Other) 2,803 3.9
1,360 3.7
1,443 4.0
Ghanaian by naturalisation 907 1.2
451 1.2
456 1.3
ECOWAS 2,800 3.9
1,464 4.0
1,336 3.7
African other than ECOWAS 342 0.5
171 0.5
171 0.5
Other 156 0.2 66 0.2 90 0.2 Source: Ghana Statistical Service, 2010 Population and Housing Census.
3.5 Religious Affiliation
Out of the total population of 72,688 persons in the District, more than half (56.6%) are
Christians (Table 3.8). This comprises of Pentecostals or Charismatics 24.4 percent,
Protestants 7.9 percent, Catholics 17.5 percent and 6.8 percent forming the rest of the
Christian population. The population in the District who are Traditionalist is 20.5 percent and
quite a sizable percentage (11.6) of the population belong to No religion, while 10.5 percent
adhere to Islam.
Table 3.8: Population by religion and sex
Religion
Both sexes Male Female
Number Percent
Number Percent
Number Percent
Total 72,688 100.0
36,649 100.0
36,039 100.0
No religion 8,465 11.6
4,476 12.2
3,989 11.1
Catholic 12,704 17.5
6,331 17.3
6,373 17.7
Protestants (Anglican Lutheran etc.) 5,708 7.9
2,850 7.8
2,858 7.9
Pentecostal/Charismatic 17,745 24.4
8,804 24.0
8,941 24.8
Other Christian 4,948 6.8
2,430 6.6
2,518 7.0
Islam 7,649 10.5
3,937 10.7
3,712 10.3
Traditionalist 14,893 20.5
7,541 20.6
7,352 20.4
Other 576 0.8 280 0.8 296 0.8 Source: Ghana Statistical Service, 2010 Population and Housing Census.
The proportion of female Pentecostal/Charismatic population is 24.8 percent more than the
males (24.0%). Similarly, female Catholics are 17.7 percent more than the males (17.3%).
But the percentage of those who profess the Traditionalist religion is 20.6 percent higher for
the males than for the females which are 20.4 percent. (Table 3.8)

30
3.6 Literacy and Education
3.6.1 Literacy
The distribution of the population 11 years and older according to the languages in which
they are literate by sex is presented in Table 3.9. The Table indicates that 25,749 of the
population 11 years and older are not literate while 21,222 are literate.
Among the literate population, the age group that recorded the highest literacy in English
only is 11-14 years (59.4%) while the age group with the lowest literacy (32.1%) in English
is 50-54 years. It is observed that literacy in English only, decreases marginally as age
increases until age 25-29 where there is evidence of an increase.
It is also evident that there are variations across all the age groups with respect to literacy in
Ghanaian language only, English and Ghanaian language, English and French, and English,
French and Ghanaian language. In terms of literacy in English among sexes, it is observed
that there are more literate males than their female counterparts across all the age groups.
Also, in terms of literacy in Ghanaian language only, it is evident that females are more
literate than males. With respect to English and French Language, there are more literate
males than females across all age groups except 35-39 years. Furthermore, there are more
male literates than females in English and Ghanaian Language, and English, French and
Ghanaian language.
Table 3.9: Population 11 years and older by sex, age and literacy status
Age group
None
(not
literate) Literate Total
English
only
Ghanaian
language
only
English
and
Ghanaian
language
English
and
French
English,
French and
Ghanaian
language
Both sexes
Total 25,749 21,222 100.0 47.9 5.7 45.7 0.3 0.4
10-14 1,316 5,628 100.0 59.4 6.2 33.9 0.3 0.1
15-19 2,129 5,489 100.0 51.5 4.3 43.6 0.2 0.3
20-24 3,005 3,098 100.0 41.3 4.5 53.7 0.3 0.2
25-29 3,210 1,881 100.0 41.9 5.8 51.4 0.5 0.4
30-34 3,201 1,249 100.0 38.6 6.1 54.4 0.5 0.4
35-39 2,509 1,043 100.0 39.0 8.0 51.9 0.6 0.6
40-44 2,474 762 100.0 41.3 8.4 48.6 0.1 1.6
45-49 1,752 585 100.0 37.4 6.3 54.5 0.7 1.0
50-54 1,573 517 100.0 32.1 6.8 60.2 0.4 0.6
55-59 868 305 100.0 32.8 8.2 58.0 0.0 1.0
60-64 979 243 100.0 35.0 4.9 58.8 0.0 1.2
65+ 2,733 422 100.0 38.2 11.1 50.7 0.0 0.0
Male
-
Total 11,005 12,385 100.0 45.7 4.9 48.5 0.4 0.5
10-14 660 3,016 100.0 58.2 5.2 36.0 0.4 0.2
15-19 1,053 3,091 100.0 51.1 3.4 44.8 0.3 0.4
20-24 1,101 1,875 100.0 38.9 4.6 55.8 0.3 0.4
25-29 1,208 1,094 100.0 38.7 5.0 55.4 0.7 0.2
30-34 1,230 760 100.0 34.1 5.5 59.3 0.7 0.4
35-39 1,060 648 100.0 36.7 6.3 56.0 0.0 0.9
40-44 1,092 510 100.0 41.2 8.2 49.2 0.0 1.4
45-49 834 382 100.0 34.6 4.7 59.2 0.5 1.0
50-54 732 342 100.0 30.4 5.0 63.2 0.6 0.9
55-59 443 208 100.0 33.7 3.8 61.1 0.0 1.4 60-64 431 173 100.0 36.4 5.8 56.6 0.0 1.2
65+ 1,161 286 100.0 37.1 8.7 54.2 0.0 0.0

31
Table 3.9: Population 11 years and older by sex, age and literacy status (cont’d)
Age
group
None
(not
literate) Literate Total
English
only
Ghanaian
language
only
English
and
Ghanaian
language
English
and
French
English,
French and
Ghanaian
language
Female
Total 14,744 8,837 100.0 51.0 6.9 41.6 0.3 0.2
10-14 656 2,612 100.0 60.9 7.4 31.4 0.3 0.0
15-19 1,076 2,398 100.0 52.1 5.5 42.1 0.1 0.2
20-24 1,904 1,223 100.0 45.0 4.4 50.4 0.2 0.0
25-29 2,002 787 100.0 46.4 6.9 45.9 0.3 0.6
30-34 1,971 489 100.0 45.6 7.0 46.8 0.2 0.4
35-39 1,449 395 100.0 42.8 10.6 45.1 1.5 0.0
40-44 1,382 252 100.0 41.7 8.7 47.2 0.4 2.0
45-49 918 203 100.0 42.9 9.4 45.8 1.0 1.0
50-54 841 175 100.0 35.4 10.3 54.3 0.0 0.0
55-59 425 97 100.0 30.9 17.5 51.5 0.0 0.0
60-64 548 70 100.0 31.4 2.9 64.3 0.0 1.4
65+ 1,572 136 100.0 40.4 16.2 43.4 0.0 0.0 Source: Ghana Statistical Service, 2010 Population and Housing Census
3.6.1 Education
Population 3 years and older by level of education, school attendance and sex is presented in
Table 3.9. Table 3.10 show that more than half (51.9%) of the population 3 years and older
are in the primary school level followed by 16.3 percent in JSS/JHS
Vocational/technical/commercial level is 0.2 percent. It is also observed that only a small
number of the population 3 years and older are in the tertiary level (0.5%).
An analysis of both sexes indicates that majority of the population 3 years and older are in the
primary level (32.4%) while the least are in the vocational/technical/commercial level (1.9%).
The Table further indicates that from the nursery level to the primary level, the proportion of
females currently attending school is more than that of males, however, from the JSS/JHS
level to the tertiary level the proportion of males currently attending school are more than the
females. This show that the number of females decline as they ascend the educational ladder.

32
Table 3.10: Population 3 years and older by level of education, school attendance and sex
Level of education
Currently attending Attended in the past
Both Sexes
Male
Female
Both sexes
Male
Female
Number Percent Number Percent Number Percent Number Percent Number Percent Number Percent
Total 25,085 100.0
13,739 100.0
11,346 100.0
9,225 100.0
5,480 100.0
3,745 100.0
Nursery 2,298 9.2
1,216 8.9
1,082 9.5
0 0.0
0 0.0
0 0.0
Kindergarten 3,774 15.0
1,900 13.8
1,874 16.5
0 0.0
0 0.0
0 0.0
Primary 13,017 51.9
6,959 50.7
6,058 53.4
2,985 32.4
1,501 27.4
1,484 39.6
JSS/JHS 4,082 16.3
2,359 17.2
1,723 15.2
2,552 27.7
1,414 25.8
1,138 30.4
Middle 0 0.0
0 0.0
0 0.0
1,944 21.1
1,292 23.6
652 17.4
SSS/SHS 1,666 6.6
1,112 8.1
554 4.9
778 8.4
543 9.9
235 6.3
Secondary 0 0.0
0 0.0
0 0.0
345 3.7
263 4.8
82 2.2
Vocational/Technical/Commercial 56 0.2
42 0.3
14 0.1
173 1.9
99 1.8
74 2.0
Post middle/secondary certificate 75 0.3
60 0.4
15 0.1
188 2.0
139 2.5
49 1.3
Tertiary 117 0.5 91 0.7 26 0.2 260 2.8 229 4.2 31 0.8
Source: Ghana Statistical Service, 2010 Population Census

33
CHAPTER FOUR
ECONOMIC CHARACTERISTICS
4.1 Introduction
The 2010 Population and Housing Census collected information on economic activities on
persons five years and older who worked for at least an hour in the 7 days preceding the
census night. Information was also collected on those who did not work during the reference
period but had jobs to go back to. This chapter seeks to discuss the issue of employed,
unemployed, economically active and economically not active population. The analysis
however is done with reference to the population 15 years and older. Concerning the
employed population, the kind of occupation they engaged in, the kind of industry they found
themselves in as well as their employment status and sectors were also dealt with.
4.2 Economic Activity Status
Activity status refers to economic and non-economic activity of respondents during the seven
days preceding the census.
i. The economically active population is made up of the (a) Employed – That is,
those who worked for at least one hour within the 7 days preceding the census.
Those with a job but not at work, that is, persons who were temporarily not at
work during the reference period but had jobs to return to, were also included in
the economically active population. (b) Unemployed – comprising all persons
who during the reference period were;
Without work and had no fixed jobs;
Currently available for work;
Seeking for work by taking specific steps to look for work (by writing
applications, visiting job sites, and visiting employment agencies).
ii. The economically not active population is made up of those who during the
reference period did not work and were not seeking for work. They are classified
by reasons for not being economically active. They include; homemakers, full-
time students, retired persons and people with disabilities who were unable to
work because of their age or disability.
Table 4.1 shows that, out of the total population of 40,027 persons who are 15 years and
older, 29,193 representing 72.9 percent is economically active whereas 10,834 persons
representing 27.1 percent is economically not active.
Unemployment is very low in the District. Among the economically active population, 98.6
percent are employed with less than two percent (1.4%) being unemployed. The unemployed
persons are also made up of those who are available and seeking work for the first time
(41.0%) or having ever worked before but are now available and seeking for work
(59.0%).There is very little difference in the proportion of economically active males (74.7%)
and females (71.2%). About the same proportions of males and females are currently
employed (74.7% and 71.2%) respectively.

34
Among the unemployed, more males (51.8%) are first time job seekers compared to females
(33.0%).
Table 4.1: Population 15 years and older by activity status and sex
Activity status
Total Male Female
Number Percent Number Percent Number Percent
Total 40,027 100.0
19,714 100.0
20,313 100.0
Economically active 29,193 72.9
14,727 74.7
14,466 71.2
Employed 28,798 98.6
14,559 98.9
14,239 98.4
Worked 27,455 95.3
13,843 95.1
13,612 95.6 Did not work but had job to go back to 1,125 3.9
601 4.1
524 3.7
Did voluntary work without pay 218 0.8
115 0.8
103 0.7
Unemployed 395 1.4
168 1.1
227 1.6
Worked before, seeking work and
available 233 59.0
81 48.2
152 67.0
Seeking work for the first time and
available 162 41.0
87 51.8
75 33.0
Economically not active 10,834 27.1
4,987 25.3
5,847 28.8 Did home duties (household chore) 2,767 25.5
771 15.5
1,996 34.1
Full time education 5,351 49.4
3,179 63.7
2,172 37.1
Pensioner/Retired 75 0.7
47 0.9
28 0.5
Disabled/Sick 552 5.1
235 4.7
317 5.4
Too old/young 1,641 15.1
520 10.4
1,121 19.2
Other 448 4.1 235 4.7 213 3.6 Source: Ghana Statistical Service, 2010 Population and Housing Census
Majority(90.0%) of the economically not-active population (90.0%) is made up of three
main categories namely full time education (49.4%), did household chores (25.5%) and too
old/young to work (15.1%).
In terms of sex differential, the proportion of economically not active males, in full time
education is 63.7percent twice higher than their female counterparts which is 37.1 percent
But the proportion of the population 15 years and older who did home duties or house chores
is 34.1 percent higher for the females than for the males (15.5%). More females (19.7%) than
males (10.4%) are too old or young to work while 5.4 percent of females compare to 4.7
percent of males are economically not active because they are disabled or sick.
4.2.1 Employed and unemployed population
In the 2010 census, the unemployed population was defined as any person 15 years and above
who, during the reference period (7 days preceding the census) had no fixed job, was seeking
for job and was available for work.
4.2.2 Economic activity status of population 15 years and older by sex, and age
Table 4.2 presents the economic activity status of the population 15 years and older by sex
and age. 40-44 age group has the highest proportion of employed population (92.2%). The
least is 37.9 percent. For the economically not active population, the age group 15-19 has the
highest proportion (61.4%), with the least being 40-44 (6.6%) age group.
The male population 15 years and older in the 40-44 age group has the highest proportion of
employed population (96.3%). On the other hand the age group with the highest proportion of
employed females 15 years and older is 45-49 (90.3%). As expected, a higher proportion of
both sexes ages 15- 19 years are economically not active.

35
Table 4.2: Economic activity status of population 15 years and older by sex, and age
Sex/age
group
All status
Employed
Unemployed
Economically not
active
Number Percent Number Percent Number Percent Number Percent
Both Sexes
Total 40,027 100.0
28,798 71.9
395 1.0
10,834 27.1
15-19 7,618 100.0
2,890 37.9
48 0.6
4,680 61.4
20-24 6,103 100.0
3,851 63.1
106 1.7
2,146 35.2
25-29 5,091 100.0
4,187 82.2
82 1.6
822 16.1
30-34 4,450 100.0
3,915 88.0
47 1.1
488 11.0
35-39 3,552 100.0
3,254 91.6
25 0.7
273 7.7
40-44 3,236 100.0
3,005 92.9
18 0.6
213 6.6
45-49 2,337 100.0
2,162 92.5
16 0.7
159 6.8
50-54 2,090 100.0
1,851 88.6
21 1.0
218 10.4
55-59 1,173 100.0
1,023 87.2
5 0.4
145 12.4
60-64 1,222 100.0
939 76.8
22 1.8
261 21.4
65+ 3,155 100.0
1,721 54.5
5 0.2
1,429 45.3
Male
Total 19,714 100.0
14,559 73.9
168 0.9
4,987 25.3
15-19 4,144 100.0
1,615 39.0
17 0.4
2,512 60.6
20-24 2,976 100.0
1,762 59.2
49 1.6
1,165 39.1
25-29 2,302 100.0
1,919 83.4
36 1.6
347 15.1
30-34 1,990 100.0
1,826 91.8
15 0.8
149 7.5
35-39 1,708 100.0
1,633 95.6
11 0.6
64 3.7
40-44 1,602 100.0
1,542 96.3
7 0.4
53 3.3
45-49 1,216 100.0
1,150 94.6
12 1.0
54 4.4
50-54 1,074 100.0
1,000 93.1
6 0.6
68 6.3
55-59 651 100.0
605 92.9
0 0.0
46 7.1
60-64 604 100.0
524 86.8
13 2.2
67 11.1
65+ 1,447 100.0
983 67.9
2 0.1
462 31.9
Female
Total 20,313 100.0
14,239 70.1
227 1.1
5,847 28.8
15-19 3,474 100.0
1,275 36.7
31 0.9
2,168 62.4
20-24 3,127 100.0
2,089 66.8
57 1.8
981 31.4
25-29 2,789 100.0
2,268 81.3
46 1.6
475 17.0
30-34 2,460 100.0
2,089 84.9
32 1.3
339 13.8
35-39 1,844 100.0
1,621 87.9
14 0.8
209 11.3
40-44 1,634 100.0
1,463 89.5
11 0.7
160 9.8
45-49 1,121 100.0
1,012 90.3
4 0.4
105 9.4
50-54 1,016 100.0
851 83.8
15 1.5
150 14.8
55-59 522 100.0
418 80.1
5 1.0
99 19.0
60-64 618 100.0
415 67.2
9 1.5
194 31.4
65+ 1,708 100.0 738 43.2 3 0.2 967 56.6
Source: Ghana Statistical Service, 2010 Population and Housing Census
4.3 Occupation
Table 4.3 provides data on employed persons 15 years and older by occupation and sex. It
show that workers in skilled agriculture, forestry and fishery constitute the largest
occupational group (79.3%) indicating that eight out of every ten persons 15 years and older
of the employed population are into agriculture. Significant proportions of the employed
persons are engaged in service and sales (8.6%) and (6.9%) of the employed are into craft and
related trades. Professional workers constitute only 1.7 percent of the employed population
15 years and above. Alternatively, only a small proportion of employed persons are in the
technical and associated professionals (0.4%) and managerial categories (0.5%). Among both

36
sexes, skilled agricultural, forestry and fishery work is the dominant occupation. There are
more males in managerial and professional occupations (2.7%) than females (1.7%). On the
other hand, the proportion of females (14.2%) engaged in services and sales workers are
higher than that of males (3.0%).
Table 4.3: Employed population 15 years and older by occupation and sex
Occupation
Both sexes Male Female
Number Percent Number Percent Number Percent
Total 28,798 100.0
14,559 100.0
14,239 100.0
Managers 157 0.5
57 0.4
100 0.7
Professionals 482 1.7
334 2.3
148 1.0
Technicians and associate
professionals 101 0.4
72 0.5
29 0.2
Clerical support workers 60 0.2
47 0.3
13 0.1
Service and sales workers 2,468 8.6
442 3.0
2,026 14.2
Skilled agricultural forestry and
fishery workers 22,828 79.3
12,498 85.8
10,330 72.5
Craft and related trades workers 2,000 6.9
678 4.7
1,322 9.3
Plant and machine operators and
assemblers 262 0.9
258 1.8
4 0.0
Elementary occupations 440 1.5
173 1.2
267 1.9
Other occupations 0 0.0 0 0.0 0 0.0 Source: Ghana Statistical Service, 2010 Population Housing Census
The major occupations do not vary much by sex as majority of the employed males (85.8%)
and females (72.5%) are engaged in agriculture, forestry or fishery work. For both services
the next major occupation is craft and related trades workers.
4.4 Industry
Table 4.4 show the employed population 15 years and older by the industries within which
they work. It is evident that the agricultural sector comprising; forestry and fishing industry is
the most dominant industry within the District accounting for 78.8 percent of the employed
population. The manufacturing sector constituted 5.8 percent whilst the wholesale, retail and
repair of motor- vehicles and motorcycles accounted for 7.5 percent of the employed
population. There is however variations amongst the other sectors/industry within which the
employed population work. This result is consistent with the regional average of 50.3 percent,
14.1 percent and 14.0 percent in agriculture, forestry and fishing; manufacturing; and
wholesale, retail and repair of motor vehicles and motorcycles respectively. The male and
female disparities follow similar pattern with agriculture, forestry and fishing; manufacturing;
and wholesale, retail and repair of motor vehicles and motorcycles constituting 85.2 percent,
2.7 percent and 4.4 percent respectively for males and 72.3 percent, 9.1 percent and 10.7
percent respectively for females.

37
Table 4.4: Employed population 15 years and older by industry and sex
Industry
Both sexes Male Female
Number Percent Number Percent Number Percent
Total 28,798 100.0
14,559 100.0
14,239 100.0
Agriculture forestry and fishing 22,696 78.8
12,402 85.2
10,294 72.3
Mining and quarrying 4 0.0
4 0.0
0 0.0
Manufacturing 1,679 5.8
390 2.7
1,289 9.1
Electricity gas stream and air
conditioning supply 2 0.0
2 0.0
0 0.0
Water supply; sewerage waste
management and remediation
activities
10 0.0
4 0.0
6 0.0
Construction 128 0.4
128 0.9
0 0.0
Wholesale and retail; repair of
motor vehicles and motorcycles 2,159 7.5
635 4.4
1,524 10.7
Transportation and storage 242 0.8
236 1.6
6 0.0
Accommodation and food service
activities 628 2.2
65 0.4
563 4.0
Information and communication 4 0.0
3 0.0
1 0.0
Financial and insurance activities 22 0.1
15 0.1
7 0.0
Real estate activities 0 0.0
0 0.0
0 0.0
Professional scientific and technical
activities 22 0.1
19 0.1
3 0.0
Administrative and support service
activities 10 0.0
8 0.1
2 0.0
Public administration and defence;
compulsory social security 73 0.3
64 0.4
9 0.1
Education 409 1.4
291 2.0
118 0.8
Human health and social work
activities 100 0.3
53 0.4
47 0.3
Arts entertainment and recreation 19 0.1
19 0.1
0 0.0
Other service activities 532 1.8
198 1.4
334 2.3
Activities of households as
employers; undifferentiated goods -
and services - producing activities
of households for own use
59 0.2
23 0.2
36 0.3
Activities of extraterritorial
organizations and bodies 0 0.0
0 0.0 0 0.0
Source: Ghana Statistical Service, 2010 Population and Housing Census
4.5 Employment Status
The Krachi Nchumuru District has a total population of 28,798 persons 15 years and older
who are employed (Table 4.5). Amongst those employed however, majority (72.2%) are self-
employed without employees with 20.0 percent of them contributing to family work. 3.4
percent of them are employees and 0.6 percent of them employed as house helps.

38
Table 4.5: Employed population 15 years and older by employment status and sex
Employment sector
Both sexes Male Female
Number Percent Number Percent Number Percent
Total 28,798 100.0 14,559 100.0
14,239 100.0
Employee 975 3.4 718 4.9
257 1.8
Self-employed without employee(s) 20,805 72.2 10,804 74.2
10,001 70.2
Self-employed with employee(s) 602 2.1 325 2.2
277 1.9
Casual worker 140 0.5 108 0.7
32 0.2
Contributing family worker 5,759 20.0 2,377 16.3
3,382 23.8
Apprentice 292 1.0 111 0.8
181 1.3
Domestic employee (househelp) 184 0.6 93 0.6
91 0.6
Other 41 0.1 23 0.2 18 0.1 Source: Ghana Statistical Service, 2010 Population and Housing Census
Table 4.5 further show the corresponding proportions (self-employed without employees and
contributing to family work) of 74.2 percent and 16.3 percent for males and 70.2 and 23.8
percent for females. Apart from self-employed without employees and contributing family
workers, the other categories had relatively low values with similar variations. The workforce
who is self-employed with employees accounted for 2.2 percent and 1.9 percent for both male
and female respectively. The result is consistent with the regional average of 2.8 percent but
deviates however, from the national figure of 5.2.
4.6 Employment Sector
Table 4.6 show the distribution of persons 15 years and older by employment sector and sex.
The employment sector refers to the sector in which a person works. The employment sectors
covered in the 2010 census were public, private formal, private informal, semi-
public/parastatal, NGOs and international organizations.
The data indicates that the private informal sector is the largest employer of economically
active persons in the District (97.0%) with the Public (Government) sector employing 1.9
percent. Less than 1.0 percent (0.4%) are in the NGOs (Local and International). A similar
pattern is observed for both sexes, with more males than females employed across all the
sectors with the exception of the private informal sector where there are more female (98.0%)
than male (96.1%).
Table 4.6: Employed population 15 years and older by employment sector and sex
Employment sector
Both sexes Male Female
Number Percent Number Percent Number Percent
Total 28,798 100.0
14,559 100.0
14,239 100.0
Public (Government) 546 1.9
390 2.7
156 1.1
Private Formal 195 0.7
117 0.8
78 0.5
Private Informal 27,946 97.0
13,989 96.1
13,957 98.0
Semi-Public/Parastatal 6 0.0
3 0.0
3 0.0
NGOs (Local and International) 103 0.4
60 0.4
43 0.3
Other International Organisations 2 0.0 0 0.0 2 0.0 Source: Ghana Statistical Service, 2010 Population and Housing Census

39
CHAPTER FIVE
INFORMATION COMMUNICATIONS TECHNOLOGY
5.1 Introduction
Information Communications Technology (ICT) is recognized as an important knowledge-
necessary for socioeconomic developments. The role of ICT in an emerging economy such as
Ghana’s, has been widely recognized even though the technology is not fully experienced at
the District levels. The recognition is reflected in actions such as the development and
deployment of a national ICT infrastructure, institutional and regulatory framework for
managing the sector, promoting the use of ICT in all sectors of the economy, implementing e-
governance in all government institutions and the construction of a National Data Centre as
well as Regional Innovation Centres. The objective of this chapter is to analyse the extent of
individual ownership of mobile phones and the use of internet among the population aged 12
years and older, and the ownership of fixed telephone lines and desktops/laptop computers by
a member of the household.
5.2 Ownership of Mobile Phones
Table 5.1 show that, out of the total population of 45,422 persons who are 12 years and older
in the Krachi Nchumuru District, only 8,886 representing 19.6 percent have their own mobile
phones. When males and females are compared, Table 5.1 show that just a little over twenty-
six percent (26.2%) of the total population of 22,585 who own mobile phones are males. The
situation is less for their female counterparts as the data indicate that thirteen percent (13.0%)
of the total population twelve years and older who own mobile phones are females.
Table 5.1: Population 12 years and older by mobile phone ownership, internet
facility usage and sex
Sex
Population 12 years
and older
Population having
mobile phone Population using
internet facility
Number Percent Number Percent Number Percent
Total 45,422 100.0
8,886 19.6
198 0.4
Male 22,585 49.7
5,920 26.2
149 0.6
Female 22,837 50.3 2,966 13.0 49 0.2 Source: Ghana Statistical Service, 2010 Population and Housing Census
5.3 Use of Internet
Table 5.1 further show that of a population of 45,422 (12 years and older) 198 persons or less
than one percent (0.4%) use internet facility. More males (0.6%) than females (0.2%) use
internet facility.

40
5.4 Household Ownership of Desktop or Laptop Computers
Table 5.2 also indicates that, out of the 12,333 households in the Krachi Nchumuru District,
99 households which is less than one percent (0.8%) own desktop or laptop computers. This
does not portray a very good ICT development in the District. Out of the total number 2,565
households who own laptop or desktop computers, only 12 representing less than one percent
(0.5%) are headed by females whilst of 9,768 households, 87(0.9%) are headed by males.
Table 5.2: Households heads by sex, ownership of desktop/laptop computers
Sex
Number of
households
Households having
desktop/laptop
computers
Number Percent Number Percent
Total 12,333 100
99 0.8
Male 9,768 58.9
87 0.9
Female 2,565 41.1 12 0.5 Source: Ghana Statistical Service, 2010 Population and Housing Census

41
CHAPTER SIX
DISABILITY
6.1 Introduction
Persons living with disabilities (PWDs) have been defined as those who are restricted in the
performance of specific tasks or activities due to loss of function of some part of the body as
a result of impairment or malformation (Ghana Statistical Service, 2012). Disabled persons
constitute an impoverished and marginalised group with little access to public health,
education and social services. The objective of this chapter is to analyse the data on persons
with disabilities. Information was collected on persons with the following disabilities as in
District: Visual/sight impairment, hearing impairment, mental retardation, emotional or
behavioural disorders and other physical challenges.
6.2 Population with Disability
Table 6.1 shows population by type of locality, disability status and sex. The 2010
population and housing census (PHC) indicates that out of a total population 70,165 in the
District, 2,523 representing 3.5 percent are with disability.
In terms of disability by sex, not much difference is observed even though there are more
males who are disabled (3.5%) than the females (3.4%). According to Table 6.1, sight is the
most common type of disability for both the males and the females but the percentage is
slightly higher for the males (42.8%) than for the females (42.0%).
6.3 Types of Disability
According to the Ghana Statistical Service National Analytical Report (2013) nationally,
about 2 out of 5 of the population with disabilities (38.3%) have more than one type of
disability condition. Similarly, almost the same proportions of males (38.2%) and females
(38.5%) have more than one type of disability. Six major types of disabilities are recorded for
Krachi Nchumuru District. These are sight, hearing, physical, intellectual, and emotional
disability. Disability cases can be multiple meaning that a person has more than one
disability. The most common type of disability in the District is sight which affects 42.4
percent of the population. Second is intellectual disability suffered by 21.0 percent of the
people followed by physical (20.6%).
6.4 Distribution by Type of Locality
Table 6.1 presents the distribution of PWDs by type of localities in the District and show a
higher proportion of PLWD’s in the urban areas (6.8%) than in the rural areas (2.6%)
The data show that sight is the most prevalent type of disability for both rural and urban with
urban areas recording a higher percentage of 43.5 points over the rural areas (41.7%).
Physical disability is second and it is suffered by23.9 percent of the rural folks compare to
15.6 percent of urban folks. Similarly, more males (43.3%) than females (42.5%) suffer from
sight disability. Sight is therefore the major disability suffered by Krachi Nchumuru
population

42
Other forms of disability aside those identified for purposes of this census recorded the
lowest percentages for urban females (3.1%) and males (4.2%) as well as females and males
in the rural areas 6.4 percent and 11.4 percent respectively.
Table 6.1: Population by type of locality, disability type and sex
Disability Type Both sexes Male Female
Number Percent Number Percent Number Percent
All Localities
Total 72,688 100.0
36,649 100.0
36,039 100.0 No disability 70,165 96.5
35,369 96.5
34,796 96.6
With a disability 2,523 3.5
1,280 3.5
1,243 3.4 Sight 1,070 42.4
548 42.8
522 42.0
Hearing 454 18.0
210 16.4
244 19.6 Speech 245 9.7
131 10.2
114 9.2
Physical 520 20.6
248 19.4
272 21.9 Intellectual 530 21.0
254 19.8
276 22.2
Emotional 251 9.9
129 10.1
122 9.8 Other 173 6.9
110 8.6
63 5.1
Urban
Total 14,928 100.0
7,410 100.0
7,518 100.0 No disability 13,917 93.2
6,913 93.3
7,004 93.2
With a disability 1,011 6.8
497 6.7
514 6.8 Sight 440 43.5
215 43.3
225 43.8
Hearing 178 17.6
77 15.5
101 19.6 Speech 58 5.7
38 7.6
20 3.9
Physical 158 15.6
73 14.7
85 16.5 Intellectual 368 36.4
176 35.4
192 37.4
Emotional 75 7.4
39 7.8
36 7.0 Other 37 3.7
21 4.2
16 3.1
Rural
Total 57,760 100.0
29,239 100.0
28,521 100.0 No disability 56,248 97.4
28,456 97.3
27,792 97.4
With a disability 1,512 2.6
783 2.7
729 2.6 Sight 630 41.7
333 42.5
297 40.7
Hearing 276 18.3
133 17.0
143 19.6 Speech 187 12.4
93 11.9
94 12.9
Physical 362 23.9
175 22.3
187 25.7 Intellectual 162 10.7
78 10.0
84 11.5
Emotional 176 11.6
90 11.5
86 11.8 Other 136 9.0 89 11.4 47 6.4
Source: Ghana Statistical Service, 2010 Population and Housing Census
6.5 Disability and activity status
Table 6.2 indicates that of the economically active persons with disability, 60.6 percent are
employed while less than one percent (0.7%) is unemployed. The economically not active
population is 45.2 percent. More than a half (61.9%) of the economically active population
with sight disability is employed followed by intellectual disability (60.8%) and emotional
disability (58.0%). The Table further reveals that there are more economically active males
with disability who are employed (69.1%) than their counterpart females (52.1%). Among the
economically not active PLWDs there are more females (50.5%) than males (39.9%). Of the

43
economically active employed population who have sight disability; there are more males
(70.9%) than females (52.1%).
Table 6.2: Persons 15 years and older with disability by economic activity status
and sex
Sex/Disability type
All status Employed Unemployed
Economically not
active
Number Percent Number Percent Number Percent Number Percent
Both Sexes
Total 40,027 100.0
28,798 71.9
395 1.0
10,834 27.1
No disability 38,044 100.0
27,597 72.5
381 1.0
10,066 26.5
With a disability 1,983 100.0
1,201 60.6
14 0.7
768 38.7
Sight 908 100.0
562 61.9
5 0.6
341 37.6
Hearing 331 100.0
184 55.6
6 1.8
141 42.6
Speech 152 100.0
87 57.2
2 1.3
63 41.4
Physical 432 100.0
195 45.1
1 0.2
236 54.6
Intellectual 398 100.0
242 60.8
2 0.5
154 38.7
Emotional 200 100.0
116 58.0
0 0.0
84 42.0
Other 133 100.0
90 67.7
0 0.0
43 32.3
Male
Total 19,714 100.0
14,559 73.9
168 0.9
4,987 25.3
No disability 18,727 100.0
13,877 74.1
166 0.9
4,684 25.0
With a disability 987 100.0
682 69.1
2 0.2
303 30.7
Sight 460 100.0
326 70.9
0 0.0
134 29.1
Hearing 145 100.0
97 66.9
2 1.4
46 31.7
Speech 80 100.0
51 63.7
0 0.0
29 36.3
Physical 198 100.0
107 54.0
0 0.0
91 46.0
Intellectual 184 100.0
126 68.5
0 0.0
58 31.5
Emotional 104 100.0
68 65.4
0 0.0
36 34.6
Other 82 100.0
59 72.0
0 0.0
23 28.0
Female
Total 20,313 100.0
14,239 70.1
227 1.1
5,847 28.8
No disability 19,317 100.0
13,720 71.0
215 1.1
5,382 27.9
With a disability 996 100.0
519 52.1
12 1.2
465 46.7
Sight 448 100.0
236 52.7
5 1.1
207 46.2
Hearing 186 100.0
87 46.8
4 2.2
95 51.1
Speech 72 100.0
36 50.0
2 2.8
34 47.2
Physical 234 100.0
88 37.6
1 0.4
145 62.0
Intellectual 214 100.0
116 54.2
2 0.9
96 44.9
Emotional 96 100.0
48 50.0
0 0.0
48 50.0
Other 51 100.0 31 60.8 0 0.0 20 39.2 Source: Ghana Statistical Service, 2010 Population and Housing Census
6.6 Disability by Educational Level Attainment
Table 6.3 describes the distribution of PWDs who are 3 years and older by sex, disability type
and level of education. Sixty six percent (65.8%) persons with disabilities in the District have

44
never attended school. For those who have attended school, 26 percent had basic education,
4.7 percent had Sec/SHS and higher whilst pre-primary recorded the least (3.2%). The
proportion of female with disabilities (74.2%) who had never attended school is higher than
their male counterpart (57.6%). Among those with hearing disabilities, 71.9 percent have
never attended school whereas for those with physical disabilities only 5 percent attained
Sec/SHS and higher.
Table 6.3: Population 3 years and older by sex, disability type and level of education
Sex/Disability
type
Total Never
Pre-
Prim Basic
Sec/SHS
and
higher Total Never
Pre-
Prim Basic
*Sec/SHS
and
higher
Number Percent
Total 65,502 31,192 6,072 24,580 3,658
100.0 47.6 9.3 37.5 5.6
No disability 63,076 29,596 5,986 23,949 3,545
100.0 46.9 9.5 38.0 5.6
With a disability 2,426 1,596 86 631 113
100.0 65.8 3.5 26.0 4.7
Sight 1,031 709 31 243 48
100.0 68.8 3.0 23.6 4.7
Hearing 437 314 21 95 7
100.0 71.9 4.8 21.7 1.6
Speech 218 135 11 68 4
100.0 61.9 5.0 31.2 1.8
Physical 500 338 6 131 25
100.0 67.6 1.2 26.2 5.0
Intellectual 516 333 20 136 27
100.0 64.5 3.9 26.4 5.2
Emotional 239 155 11 62 11
100.0 64.9 4.6 25.9 4.6
Other 168 107 9 48 4
100.0 63.7 5.4 28.6 2.4
Male
Total 33,007 13,788 3,116 13,525 2,578
100.0 41.8 9.4 41.0 7.8
No disability 31,777 13,079 3,064 13,140 2,494
100.0 41.2 9.6 41.4 7.8
With a disability 1,230 709 52 385 84
100.0 57.6 4.2 31.3 6.8
Sight 530 326 20 149 35
100.0 61.5 3.8 28.1 6.6
Hearing 197 131 8 51 7
100.0 66.5 4.1 25.9 3.6
Speech 121 65 8 44 4
100.0 53.7 6.6 36.4 3.3
Physical 234 124 3 87 20
100.0 53.0 1.3 37.2 8.5
Intellectual 246 145 11 72 18
100.0 58.9 4.5 29.3 7.3
Emotional 124 78 7 32 7
100.0 62.9 5.6 25.8 5.6
Other 108 63 7 34 4
100.0 58.3 6.5 31.5 3.7
Female
Total 32,495 17,404 2,956 11,055 1,080
100.0 53.6 9.1 34.0 3.3
No disability 31,299 16,517 2,922 10,809 1,051
100.0 52.8 9.3 34.5 3.4
With a disability 1,196 887 34 246 29
100.0 74.2 2.8 20.6 2.4
Sight 501 383 11 94 13
100.0 76.4 2.2 18.8 2.6
Hearing 240 183 13 44 0
100.0 76.3 5.4 18.3 0.0
Speech 97 70 3 24 0
100.0 72.2 3.1 24.7 0.0
Physical 266 214 3 44 5
100.0 80.5 1.1 16.5 1.9
Intellectual 270 188 9 64 9
100.0 69.6 3.3 23.7 3.3
Emotional 115 77 4 30 4
100.0 67.0 3.5 26.1 3.5
Other 60 44 2 14 0 100.0 73.3 3.3 23.3 0.0 Source: Ghana Statistical Service, 2010 Population and Housing Census
*Sec./ SSS/ SHS, Voc/Tech, Bachelor and Postgraduate
Across the sexes, hearing and physical disabilities recorded the highest proportions of 66.5
percent (males) and 80.5 percent (females) respectively for those who have never attended
school. Similarly, speech (36.4%) and emotional (26.1%) disabilities accounted for the
highest proportions of disabilities in males and females who have attained basic education
(Table 6.3).

45
CHAPTER SEVEN
AGRICULTURAL ACTIVITIES
7.1 Introduction
An agricultural household is defined as one in which at least one person in the household is
engaged in farming/fishing/animal husbandry (PHC, 2010). Agriculture plays a key role in
the socio-economic development of the District and is the main occupation of the people in
the District employing about 68% of its labour force. The sector consists of crop farmers,
fishermen, and livestock keepers. This chapter presents analysis of data on the agricultural
activities in the District, with a main focus on households in agriculture and types of farming.
7.2 Households in Agriculture
A household is classified as an agricultural household if at least one of its members engages
in agricultural production even if not earning from agricultural activity alone. Households in
agriculture by type of locality are shown in figure 7.1. About eighty-two percent (81.8%) of
households in the district are engaged in agriculture. In urban localities 81.8 percent of
households are engaged in agriculture, while in the rural localities 80.6 percent of households
are engaged in agriculture.
Figure 7.1: Households engaged in agriculture by type locality
Source: Ghana Statistical Service, 2010 Population and Housing Census
7.3 Types of farming Activities
Table 7.1 show the total number of households engaged in agricultural (crop farming,
livestock rearing, tree planting and fish farming) stand at 12,333 in the District.
81.8 81.8 80.6
18.2 18.2 19.4
0.0
10.0
20.0
30.0
40.0
50.0
60.0
70.0
80.0
90.0
Total Urban Rural
Percent
Households engaged inagriculture
Households not engagedin agriculture

46
The two traditional activities of crop farming (95.5%) and livestock rearing (45.6%) are
prominent in the District as well as in both urban and rural communities. Fish farming is
relatively low. It is engaged in by 0.1 percent of households in the District.
Table 7.1: Households by type of agricultural activities and locality
Type of activity
Total Urban Rural
Number Percent Number Percent Number Percent
Total households 12,333 100.0 2,676 100.0 9,657 100.0
Households engaged
in agriculture 10,086 81.8
1,955 81.8
8,131 80.6
Crop farming 9,629 95.5
1,911 97.7
7,718 94.9
Tree planting 55 0.5
6 0.3
49 0.6
Livestock rearing 4,598 45.6
501 25.6
4,097 50.4
Fish farming 10 0.1 0 0.0 10 0.1 Source: Ghana Statistical Service, 2010 Population and Housing Census
7.4 Types of livestock and other animals reared
Livestock rearing is the second most important agricultural activity in the District. Table 7.2
also show that the commonest livestock in the District is chicken showing an average of 20
birds for 66,120 chickens for 3,278 keepers. This is followed by goats (34,547) and sheep
(12,892)
The highest average animal per keeper is the dove with an average of (29) and a total of
1,222 animals followed by cattle with an average of (28) and a total of 13,099 animals.
Though the two traditional activities of crop farming and livestock rearing are prominent in
the District and in both urban and rural communities the livestock with the lowest number of
keepers is the snail (5) whilst Island farming and marine farming both record zero from Table
7.2.

47
Table 7.2: Distribution of livestock, other animals and keepers
All Types Quantity Number of
keepers
Average
animal per
keeper
Animals
Cattle 13,099 461 28 Goat 34,547 2,420 14 Sheep 12,892 939 14 Pig 7,273 454 16 Gras Cutter 216 17 13 Rabbit 74 6 12 Birds
Chicken 66,120 3,278 20 Dove 1,222 42 29 Duck 3,083 228 14 Guinea Fowl 6,799 395 17 Ostrich 328 35 9 Turkey 182 19 10
Fish
Fish farming 101 10 10 Inland fishing 0 0 0 Marine fishing 0 0 0 Snails & Silk Worm
Silk worm 373 22 17
Snail 366 5 73
Beehives (Rearing) 202 12 17 Other 661 85 8
Source: Ghana Statistical Service, 2010 Population and Housing Census

48
CHAPTER EIGHT
HOUSING CONDITIONS
8.1 Introduction
Over the years, there have been lots of policy frame works in Ghana underscoring the
importance of housing or shelter; The National Development Planning Commission and the
Ghana Poverty Reduction Strategy have all made inputs in respect of Housing policies.
The 2010 Population and Housing Census solicited responses on housing conditions or
dwellings as to whether they were occupied or not, the main materials used in construction as
well as methods of waste disposal. This is expected to help policy makers formulate realistic
housing policies and programmes for Ghana
8.2 Housing stock
Table 8.1 presents the stock of houses and number of households in the rural and urban areas
of the District. The total number of houses in the District is 11,743 with 20.3 percent located
in the urban areas and 79.7 percent in rural areas. The number of households in the District is
12,333 with 21.7 percent in urban areas and 78.3 percent in rural areas. The average
household size in the District is 5.9. This is higher than both the regional average of 4.3 and
national average of 4.5 respectively. The population per house for the urban areas is 6.4%
which is higher than that for the rural areas (4.8%).
Table 8.1: Stock of houses and households by type of locality
Categories Country Region
District
Total Urban Rural
Total population 24,658,823 2,118,252 72,688 14,928 57,760
Total household population 24,076,327 2,086,567 72,009 14,832 57,177
Number of houses 3,392,745 399,953 11,743 2,385 9,358
Number of households 5,467,054 495,600 12,333 2,676 9,657
Average households per house 1.6 1.2 1.1 1.1 1.0
Population per house 7.3 5.3 6.2 6.3 6.2
Average household size 4.5 4.3 5.9 5.6 6.0 Source: Ghana Statistical Service, 2010 Population and Housing Census.
8.3 Type of Dwelling, Holding and Tenancy Arrangements
8.3.1 Type of Dwelling
In different parts of the country (Ghana) houses are built using all manner of materials
ranging from mud to bricks, sticks or wood, grass or thatch. This is not very different from
what pertains in the Krachi Nchumuru District. Table 8.2 show that almost half (47.5 %) of
all dwelling units in the Krachi Nchumuru District are separate housing units followed by
compound house dwelling units (31.2%) and semi- detached (16.6%).The Table further show
that there are more female- headed separate house dwelling units (48.0%) compare to their
male counterparts which is 47.4 percent. Similarly, the proportion of female –headed semi-
detached dwelling units is 17.1 percent compare to 16.5 percent for their male counterparts.

49
Table 8.2: Type of occupied dwelling unit by sex of household head and type of locality
Type of dwelling
Total
Country Region
District
Total Male
headed
Female
headed Urban Rural Number Percent
Total 5,467,054 495,600 12,333 100.0 100.0 100.0 100.0 100.0
Separate house 1,471,391 212,170 5,860 47.5 47.4 48.0 39.8 49.6
Semi-detached house 391,548 33,286 2,048 16.6 16.5 17.1 18.2 16.2
Flat/Apartment 256,355 7,668 121 1.0 1.0 0.9 1.5 0.8
Compound house (rooms) 2,942,147 219,276 3,844 31.2 31.2 31.0 39.1 29.0
Huts/Buildings (same compound) 170,957 15,705 387 3.1 3.4 2.3 0.8 3.8
Huts/Buildings (different
compound) 36,410 2,781 25 0.2 0.2 0.1 0.0 0.3
Tent 10,343 989 22 0.2 0.1 0.4 0.3 0.2
Improvised home (kiosk/container
etc) 90,934 1,198 5 0.0 0.0 0.1 0.1 0.0
Living quarters attached to
office/shop 20,499 1,157 11 0.1 0.1 0.2 0.2 0.1
Uncompleted building 66,624 858 1 0.0 0.0 0.0 0.0 0.0
Other 9,846 512 9 0.1 0.1 0.2 0.1 0.1
Source: Ghana Statistical Service, 2010 Population and Housing Census
Reasons that may however, be attributed to this development could be that there are more
female breadwinners than males because of possible increasing divorce cases or that the
males have moved out of the District in search of better job opportunities or that more males
may have died than females in the last 10years. Notable also is the fact that a high proportion
(31.2%) of the occupied dwelling units in the District is compound houses. These houses
demonstrate the culture of the people of the District and the Northern part of the Volta
Region where most of the housing units are compound houses.
8.3.2 Holding of tenancy arrangements
Table 8.3 shows the ownership status of the various dwellings in Ghana, especially in the Volta
Region and Krachi Nchumuru District. Out of the total of 5,467,054 dwellings in the Country,
13,439 are in the Krachi Nchumuru District. The data further show an expected higher
ownership of dwellings by males (86.5%) than females (75.1%) in the District. This could be as
a result of the culture of the area which is mainly dominated by the male sex as heads of families
and the females regarded more as house wives than as heads of family.
Table 8.3: Ownership status of dwelling by sex of household head and type of locality
Ownership status
Total
Country Region
District
Total Male
headed
Female
headed Urban Rural Number Percent
Total 5,467,054 495,600 13,439 100.0 100.0 100.0 100.0 100.0
Owned by household member 2,883,236 304,481 6,554 48.8 86.5 75.1 77.8 85.9
Being purchased (e.g. mortgage) 45,630 3,075 204 1.5 1.2 1.7 0.4 1.5
Relative not a household member 851,630 91,956 2,837 21.1 6.2 13.3 9.6 7.2
Other private individual 1,439,021 81,191 3,333 24.8 4.8 8.9 11.1 4.1
Private employer 83,610 3,475 99 0.7 0.2 0.1 0.1 0.2
Other private agency 21,123 1,419 65 0.5 0.2 0.2 0.3 0.1
Public/Government ownership 118,804 8,003 282 2.1 0.7 0.6 0.5 0.7
Other 24,000 2,000 65 0.5 0.2 0.1 0.3 0.2 Source: Ghana Statistical Service, 2010 Population and Housing Census

50
Female ownership of dwelling units in the rural areas is 85.9 percent compared to 77.8
percent for their males’ counterparts in the District. Dwelling units owned by other private
individual in the urban areas is 11.1 percent compared to 4.1 percent for the rural areas in the
District. Those owned by relative not a household member in the urban areas is 9.6 percent
compare to 7.2 percent for the rural areas The Table also show that less than one percent
(0.5%) of housing units are owned by other private agencies. Dwellings units owned by the
Government in the District is 2.1 percent and are headed more by males (0.7%) than females
(0.6) (Table 8.3).
8.4 Construction Materials
The 2010 (PHC) elicit information on the main materials used for the construction of outer
walls, floor and roofing of dwelling units. This data is expected to help policy makers and
those who matter have a better understanding of the housing conditions in the country.
8.4.1 Main construction material for outer wall of dwelling unit by type of locality
Table 8.4 show that mud brick/earth is the main construction material for the outer wall of
dwellings in the District accounting for 78.0 percent. This is followed by the cement
blocks/concrete (15.2%). All the others (wood, metal sheets, stone, burnt brick, landcrete
bamboo, other) account for 6.8% of the construction materials for outer walls of the dwelling
units in the District.
Table 8.4: Main construction material for outer wall of dwelling unit by type of locality
Material for Outer wall
District Total
Country Region Number
Percent Urban Rural
Total 5,817,607 550,006
13,957 100.0
100.0 100.0
Mud brick/Earth 1,991,540 264,357
10,887 78.0
77.9 78.0
Wood 200,594 4,900
142 1.0
1.4 0.9
Metal sheet/Slate/Asbestos 43,708 3,131
74 0.5
0.6 0.5
Stone 11,330 1,172
27 0.2
0.1 0.2
Burnt bricks 38,237 3,183
49 0.4
0.2 0.4
Cement blocks/Concrete 3,342,462 250,762
2,115 15.2
14.5 15.3
Landcrete 104,270 7,772
495 3.5
4.9 3.2
Bamboo 8,206 819
7 0.1
0.0 0.1
Palm leaf/Thatch
(grass)/Raffia 38,054 11,454
115 0.8
0.0 1.0
Other 39,206 2,456 46 0.3 0.2 0.4 Source: Ghana Statistical Service, 2010 Population and Housing Census
Regarding locality of residence, it is noted that mud brick/earth is the main construction material
used for outer walls of dwellings units in the District in both urban (79%) and rural (78%) areas.
The use of cement block/concrete as the main construction material for outer walls of dwelling
units in the District is 14.5 percent for urban compared to 15.3 percent for rural areas.
8.4.2 Main construction materials for the floor of dwelling unit by type of locality
Table 8.5 show that cement/concrete is the main construction materials for the floors used by
71.4 percent of the dwelling units in the District. It is less common in the rural areas (68.0%)
of the District compare to urban (83.7%) Second is the use of earth/mud materials for
construction by 26.4 percent of dwelling units. Comparatively, it is more common in the rural
areas (29.9%) than urban areas (13.8%). There is a less than one percent of dwelling units
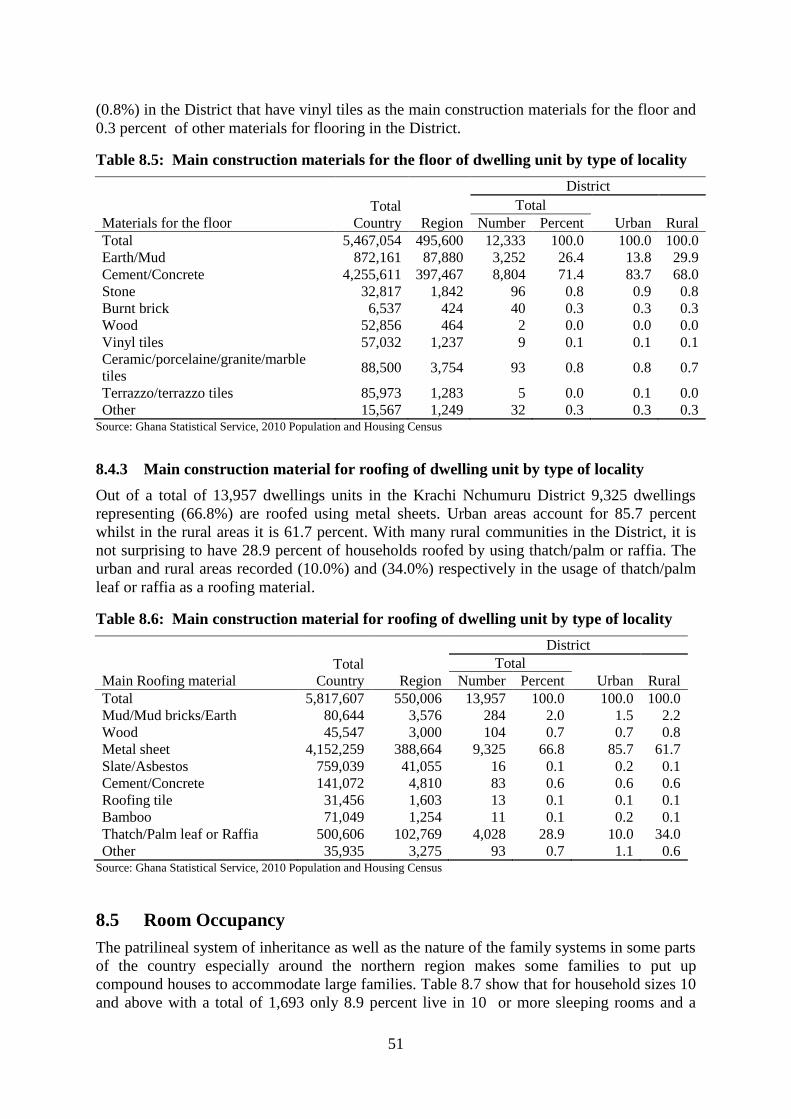
51
(0.8%) in the District that have vinyl tiles as the main construction materials for the floor and
0.3 percent of other materials for flooring in the District.
Table 8.5: Main construction materials for the floor of dwelling unit by type of locality
Total
Country Region
District
Materials for the floor Total
Urban Rural Number Percent Total 5,467,054 495,600 12,333 100.0 100.0 100.0 Earth/Mud 872,161 87,880 3,252 26.4 13.8 29.9 Cement/Concrete 4,255,611 397,467 8,804 71.4 83.7 68.0 Stone 32,817 1,842 96 0.8 0.9 0.8 Burnt brick 6,537 424 40 0.3 0.3 0.3 Wood 52,856 464 2 0.0 0.0 0.0 Vinyl tiles 57,032 1,237 9 0.1 0.1 0.1 Ceramic/porcelaine/granite/marble
tiles 88,500 3,754 93 0.8 0.8 0.7
Terrazzo/terrazzo tiles 85,973 1,283 5 0.0 0.1 0.0 Other 15,567 1,249 32 0.3 0.3 0.3
Source: Ghana Statistical Service, 2010 Population and Housing Census
8.4.3 Main construction material for roofing of dwelling unit by type of locality
Out of a total of 13,957 dwellings units in the Krachi Nchumuru District 9,325 dwellings
representing (66.8%) are roofed using metal sheets. Urban areas account for 85.7 percent
whilst in the rural areas it is 61.7 percent. With many rural communities in the District, it is
not surprising to have 28.9 percent of households roofed by using thatch/palm or raffia. The
urban and rural areas recorded (10.0%) and (34.0%) respectively in the usage of thatch/palm
leaf or raffia as a roofing material.
Table 8.6: Main construction material for roofing of dwelling unit by type of locality
Main Roofing material Total
Country Region
District
Total Urban Rural Number Percent
Total 5,817,607 550,006 13,957 100.0 100.0 100.0 Mud/Mud bricks/Earth 80,644 3,576 284 2.0 1.5 2.2 Wood 45,547 3,000 104 0.7 0.7 0.8 Metal sheet 4,152,259 388,664 9,325 66.8 85.7 61.7 Slate/Asbestos 759,039 41,055 16 0.1 0.2 0.1 Cement/Concrete 141,072 4,810 83 0.6 0.6 0.6 Roofing tile 31,456 1,603 13 0.1 0.1 0.1 Bamboo 71,049 1,254 11 0.1 0.2 0.1 Thatch/Palm leaf or Raffia 500,606 102,769 4,028 28.9 10.0 34.0 Other 35,935 3,275 93 0.7 1.1 0.6
Source: Ghana Statistical Service, 2010 Population and Housing Census
8.5 Room Occupancy
The patrilineal system of inheritance as well as the nature of the family systems in some parts
of the country especially around the northern region makes some families to put up
compound houses to accommodate large families. Table 8.7 show that for household sizes 10
and above with a total of 1,693 only 8.9 percent live in 10 or more sleeping rooms and a

52
striking 2.4 percent live in just one sleeping room. For household sizes of 6 with a total
population 1,510, (15.2%) live in one sleeping room, (38.5%) in two sleeping rooms and less
than one percent (0.7%) for nine or more rooms.
Table 8.7: Household size and number of sleeping rooms occupied in dwelling unit
House-
hold
size
Number of sleeping rooms
Total
One
room
Two
rooms
Three
rooms
Four
rooms
Five
rooms
Six
rooms
Seven
rooms
Eight
rooms
Nine
rooms
or more Number Percent
Total 12,333 100.0
27.6 28.9 18.5 10.8 5.4 3.6 1.7 1.4 2.0
1 1,020 100.0
86.8 8.3 2.2 1.6 0.5 0.6 0.0 0.0 0.1
2 910 100.0
60.3 30.7 4.0 1.9 0.8 1.3 0.9 0.0 0.2
3 1,260 100.0
44.6 36.9 12.0 3.1 1.5 0.6 0.6 0.4 0.3
4 1,452 100.0
35.3 40.8 15.4 4.8 1.6 0.9 0.2 0.8 0.2
5 1,617 100.0
23.7 40.8 20.2 7.8 3.1 2.3 0.4 0.6 1.1
6 1,510 100.0
15.2 38.5 24.4 13.4 3.4 2.8 0.7 0.9 0.7
7 1,212 100.0
11.8 31.0 29.6 14.1 6.8 3.7 0.7 0.3 1.9
8 947 100.0
7.7 21.9 30.0 20.4 10.3 3.9 2.3 1.9 1.6
9 712 100.0
4.5 18.0 28.7 22.3 13.1 5.2 4.1 2.0 2.2
10+ 1,693 100.0 2.4 11.0 18.5 20.4 13.9 12.2 6.9 5.7 8.9
Source: Ghana Statistical Service, 2010 Population and Housing Census
For individual household sizes, there are a total of 1,020. Of this total, 86.8 percent live in
one sleeping room and less than one percent (0.1%) lives in nine or more sleeping rooms.
8.6 Access to Utilities and Household Facilities
The 2010 PHC gathered information on the main source of lighting for dwelling units in the
country and by extension the District.
8.6.1 Main source of lighting of dwelling unit.
Table 8.8 show a total of 5,467,054 dwelling units in the country that use various forms of
light. The District has a total of 12,333 dwellings using light but just 5,320 out of the total
have electricity as their main source of light which represents 43.1 percent. Second main
source of light in the District is the use of Kerosene by 41.6 percent of households. The use of
flashlight is next with 13.7 percent. In urban and rural localities, households in urban areas
use electricity as their main source of lighting more (69.0%) than in the rural areas (36.0%).
This is however different in the use of Kerosene and flash light as main source of lighting in
the rural and urban areas where more households in rural areas (45.9%) than in urban areas
(25.9%) use kerosene as their main source of lighting. Flash light is also used by more
households in the rural areas (16.5%) than households in the urban areas (3.6%).
The Table also reveals that less than one percent of households use firewood (0.3%) and crop
residue (0.2%) as their main source of lighting in the District.

53
Table 8.8: Main source of lighting of dwelling unit by type of locality
Main source of light
Total
Country Region
District
Total
Urban Rural Number Percent
Total 5,467,054 495,600
12,333 100.0 100.0 100.0
Electricity (mains) 3,511,065 245,583
5,320 43.1 69.0 36.0
Electricity (private generator) 36,142 3,923
86 0.7 0.7 0.7
Kerosene lamp 971,807 200,064
5,129 41.6 25.9 45.9
Gas lamp 9,378 799
14 0.1 0.1 0.1
Solar energy 9,194 783
16 0.1 0.1 0.1
Candle 41,214 2,239
13 0.1 0.2 0.1
Flashlight/Torch 858,651 39,881
1,689 13.7 3.6 16.5
Firewood 13,241 1,474
42 0.3 0.2 0.4
Crop residue 4,623 425
20 0.2 0.0 0.2
Other 11,739 429 4 0.0 0.1 0.0 Source: Ghana Statistical Service, 2010 Population and Housing Census
8.6.2 Main source of cooking fuel
Table 8.9 indicates that wood (84.1%) is the main source of cooking fuel in the District. This
pattern is similar regarding locality of residence where a higher proportion of households use
wood as their main source of cooking fuel in both urban (75.3%) and rural (86.5%) areas
respectively. It is also observed that the use of charcoal is common. This certainly has an
adverse effect on our forests growth and reserves.
Table 8.9: Main source of cooking fuel by type of locality
Main source of cooking Total
Country Region
District
Total
Urban Rural Number Percent
Total 5,467,054 495,600
12,333 100.0 100.0 100.0
None no cooking 306,118 12,888
314 2.5 2.7 2.5
Wood 2,197,083 283,048
10,372 84.1 75.3 86.5
Gas 996,518 46,084
103 0.8 0.9 0.8
Electricity 29,794 972
31 0.3 0.1 0.3
Kerosene 29,868 2,512
65 0.5 0.4 0.6
Charcoal 1,844,290 146,677
1,368 11.1 19.7 8.7
Crop residue 45,292 2,419
71 0.6 0.7 0.5
Saw dust 8,000 389
5 - - 0.1
Animal waste 2,332 104
- - - -
Other 7,759 507 4 - 0.1 - Source: Ghana Statistical Service, 2010 Population and Housing Census
8.6.3 Cooking space used by households
Separate rooms for exclusive use of households (32.8%) account for the highest cooking
space used by households in the District. The use of open space in compound is also quite
common in the District accounting for 27.5 percent. This however, is more predominant in the
urban (29.9%) and rural (26.8%) areas respectively (Table 8.10).

54
Table 8.10: Cooking space used household by type of locality
Cooking space used by household
Total
Country Region
District
Total
Urban Rural Number Percent
Total 5,467,054 495,600 12,333 100.0 100.0 100.0
No cooking space 386,883 21,127 536 4.3 4.0 4.4
Separate room for exclusive use of
household 1,817,018 173,544 4,042 32.8 22.6 35.6
Separate room shared with other
household(s) 410,765 17,362 758 6.1 5.9 6.2
Enclosure without roof 117,614 9,352 324 2.6 3.3 2.4
Structure with roof but without walls 349,832 97,942 2,506 20.3 23.8 19.4
Bedroom/Hall/Living room) 74,525 17,049 28 0.2 0.4 0.2
Verandah 1,173,946 51,288 678 5.5 9.5 4.4
Open space in compound 1,115,464 106,104 3,391 27.5 29.9 26.8
Other 21,007 1,832 70 0.6 0.6 0.5 Source: Ghana Statistical Service, 2010 Population and Housing Census
8.7 Main Source of Water for Drinking and for Other Domestic Use
It is commonly said that ‘‘water is life’’ because it is used in every facet of our lives as it
even helps in the regulation of body temperature. It is for this and other reasons that
governments and institutions into the provision of portable water make efforts at getting good
water to all parts of Ghana.
8.7.1 Main source of water of dwelling unit for drinking
The data in Table 8.11 show that 32.1 percent of 12,333 households in the District use bore-
hole/pump/tube well as main source of water for drinking. More than a half (59.5%) of the
households in urban areas use public tap /stand pipe as their main source of water for
drinking but the percentage is far less in the rural areas where only 14.1 percent use public
tap/standpipe as main source of drinking water. But the proportion of households in rural
areas that use borehole / pump /tube well and river/stream as main source of drinking water in
rural areas is far higher (39.2% and 27.7% respectively) compared to urban areas which is 6.8
percent and 0.6 percent respectively.

55
Table 8.11: Main source of water of dwelling unit for drinking and other
domestic purposes
Source of water
District
Total
Country Region
Total
Urban Rural Number Percent
Main source of drinking water for
household Total 5,467,054 495,600
12,333 100.0 100.0 100.0
Pipe-borne inside dwelling 790,493 36,536
105 0.9 0.3 1.0
Pipe-borne outside dwelling 1,039,667 93,019
1,111 9.0 17.9 6.5
Public tap/Standpipe 712,375 95,209
2,951 23.9 59.5 14.1
Bore-hole/Pump/Tube well 1,267,688 81,286
3,964 32.1 6.8 39.2
Protected well 321,091 22,577
253 2.1 8.0 0.4
Rain water 39,438 15,627
65 0.5 1.3 0.3
Protected spring 19,345 1,626
27 0.2 0.1 0.2
Bottled water 20,261 761
34 0.3 0.4 0.2
Sachet water 490,283 16,196
26 0.2 0.3 0.2
Tanker supply/Vendor provided 58,400 2,120
1 0.0 0.0 0.0
Unprotected well 112,567 24,012
287 2.3 3.4 2.0
Unprotected spring 12,222 2,677
42 0.3 0.0 0.4
River/Stream 502,804 81,663
2,626 21.3 0.6 27.0
Dugout/Pond/Lake/Dam/Canal 76,448 21,897
840 6.8 1.2 8.4
Other 3,972 394
1 0.0 0.0 0.0
Main source of water for other
domestic use of household
Total 5,467,054 495,600
12,333 100.0 100.0 100.0
Pipe-borne inside dwelling 905,566 36,186
123 1.0 0.4 1.2
Pipe-borne outside dwelling 1,089,030 74,062
1,094 8.9 17.8 6.4
Public tap/Standpipe 704,293 83,508
2,802 22.7 56.2 13.5
Bore-hole/Pump/Tube well 1,280,465 73,484
3,457 28.0 7.5 33.7
Protected well 465,775 38,510
330 2.7 9.9 0.7
Rain water 39,916 14,834
49 0.4 1.2 0.2
Protected spring 18,854 1,986
25 0.2 0.2 0.2
Tanker supply/Vendor provided 100,048 2,325
43 0.3 0.6 0.3
Unprotected well 152,055 38,472
284 2.3 4.0 1.8
Unprotected spring 15,738 2,942
43 0.3 0.0 0.4
River/Stream 588,590 100,918
3,009 24.4 1.0 30.9
Dugout/Pond/Lake/Dam/Canal 96,422 27,098
1,042 8.4 1.2 10.4
Other 10,302 1,275 32 0.3 0.0 0.3 Source: Ghana Statistical Service, 2010 Population and Housing Census
8.7.2 Main source of water for other domestic purposes
Borehole /pump /Tube well is the main source of water for other domestic use for 28.0
percent of households but use more by 33.7 percent of rural dwellers than urban dwellers
(7.3%). Similarly, river /stream are more widely used by 30.9 percent of rural dwellers than
by only 1.0 percent of urban dwellers (8.11).

56
8.8 Bathing and Toilet Facilities
8.8.1 Toilet facility
Table 8.12 shows that 15.1 percent of the population in the rural areas of the Krachi
Nchumuru District use the bushes and beaches as their toilet facility. Only, 7.3 percent of
households in the District use W.C as their toilet facility, whereas 44.4 percent of households
use the public toilet facility. At the urban and rural areas of the District, (53.8%) and (68.5%)
respectively use the bushes as their toilet facilities. The pit latrine is still used in the District
as shown in Table 8.12 by (15.4%) in the urban and (13.7%) in the rural areas of the District.
8.8.2 Bathing facility
Table 8.12 further provides data on bathing facilities used by households. There are
1,535,392 households who have one bathroom for exclusive use as a bathing facility. It
depicts 168,731 and 3,906 for the region and District respectively as households with
exclusive bathroom facility. At the District, 3,914 households representing (29.1%) use
shared bathrooms in the same house as 24.0 percent of households use shared open cubicles
as their bathing facility and (4.5%) of households in the District use open space around the
house as their bathing facility. The story is not too different at the rural and urban areas of the
District where (25.7%) of households in the urban areas use shared bathrooms as it is in the
rural areas representing (19.1%).
Table 8.12: Bathing facility and toilet facilities used by household
Total
Country Region
District
Toilet facility/Bathing facility
Total
Urban Rural Number Percent
Toilet facility used by household
Total 5,467,054 495,600
13,439 100.0 100.0 100.0
No facilities (bush/beach/field) 1,056,382 137,522
2,028 15.1 58.3 68.5
W.C. 839,611 29,799
978 7.3 0.2 0.6
Pit latrine 1,040,883 112,196
1,844 13.7 15.4 13.7
KVIP 572,824 63,237
2,503 18.6 14.3 6.2
Bucket/Pan 40,678 2,393
45 0.3 0.0 0.1
Public toilet (WC,KVIP,PitPan etc) 1,893,291 148,740
5,971 44.4 11.5 10.8
Other 23,385 1,713
70 0.5 0.2 0.1
Bathing facility used by household
Total 5,467,054 495,600
13,439 100.0 100.0 100.0
Own bathroom for exclusive use 1,535,392 168,731
3,906 29.1 48.0 44.1
Shared separate bathroom in the same
house 1,818,522 111,402
3,914 29.1 25.7 19.1
Private open cubicle 381,979 49,908
934 6.9 3.6 5.6
Shared open cubicle 1,000,257 98,801
3,222 24.0 8.7 9.3
Public bath house 140,501 3,408
221 1.6 1.0 0.5
Bathroom in another house 187,337 19,847
495 3.7 5.0 6.9
Open space around house 372,556 39,498
603 4.5 8.0 13.8
River/Pond/Lake/Dam 14,234 1,281
12 0.1 0.0 0.3
Other 16,276 2,724 132 1.0 0.0 0.5 Source: Ghana Statistical Service, 2010 Population and Housing Census
There are as many as 8.7percent of households in the urban areas who have shared open
cubicles as their bathing facility and 13.8 percent of the rural areas of the District use open
spaces around the house as their bathing facility.

57
8.9 Method of Waste Disposal
One of the major challenges in Ghana has been issues of waste disposal, which has called for
some waste management experts like ZOOMLION to develop innovative methods of waste
disposal in the country thus, helping to reduce infections and improve environmental hygiene.
8.9.1 Solid waste disposal
As shown in Table 8.13 the commonest method of solid waste disposal by households is at
the public dumps (open space) both at the National 2,061,403 and District 4,110 (30.6%)
levels. The District has 30.6 percent of its households who throw their rubbish at the public
dump. It is more in the rural areas (50.8%) than in the urban areas (48.3%) of the District.
Similarly, 4.6% of households in the District collect their rubbish or solid wastes whilst
(5.5%) dump it indiscriminately.
8.9.2 Liquid waste disposal
The disposal of liquid waste is equally high for households who throw their waste onto the
streets/outside (31.7%) (Table 8.13). Forty three percent (42.65%) of households in the
District throw their liquid waste onto the compound which can be considered as unhygienic.
This is even more pronounced in both urban and rural areas of the District as 62.2 percent of
households in the urban areas of the District practice this method of liquid waste disposal
whilst (56.3%) of households in the rural areas do same. Less than one percent (0.4%) of
households in the urban areas of the District disposes of waste through the sewerage system
whereas 2.0 percent is recorded for the rural areas.
Table 8.13: Method of rubbish and liquid waste disposal by households
Total
Country Region
District
Waste disposal method
Total
Urban Rural Number Percent
Method of rubbish disposal by
household
Total 5,467,054 495,600
13,439 100.0 100.0 100.0
Collected 785,889 30,430
624 4.6 7.5 9.8
Burned by household 584,820 78,604
2,365 17.6 3.4 6.9
Public dump (container) 1,299,654 82,361
4,870 36.2 29.1 5.8
Public dump (open space) 2,061,403 204,656
4,110 30.6 50.8 48.3
Dumped indiscriminately 498,868 67,801
739 5.5 3.3 25.5
Buried by household 182,615 26,014
588 4.4 5.6 3.2
Other 53,805 5,734
143 1.1 0.3 0.5
Method of liquid waste disposal by
household
Total 5,467,054 495,600
13,439 100.0 100.0 100.0
Through the sewerage system 183,169 4,906
350 2.6 0.4 2.0
Through drainage system into a gutter 594,404 12,540
694 5.2 5.3 2.0
Through drainage into a pit (soak away) 167,555 11,493
212 1.6 2.4 3.8
Thrown onto the street/outside 1,538,550 154,009
4,254 31.7 17.9 29.0
Thrown into gutter 1,020,096 46,100
1,943 14.5 11.2 6.8
Thrown onto compound 1,924,986 258,942
5,725 42.6 62.2 56.3
Other 38,294 7,610 261 1.9 0.6 0.2 Source: Ghana Statistical Service, 2010 Population and Housing Census

58
CHAPTER NINE
SUMMARY OF FINDINGS AND POLICY
RECOMMENDATIONS
9.1 Introduction
There cannot be any meaningful developmental activity without taking into account the
characteristics of the population for whom the activity is targeted. The size of the population
and its spatial distribution, growth and change over time, and socio-economic characteristics
are all important in development planning. This makes the population census the most
important source of data on the population in a country, region and district. It provides
information on the size, composition, growth and distribution of the population at the national
and sub-national levels.
It is in view of this that the Ghana Statistical Service (GSS) decided to provide data users
with an analytical report on the 2010 PHC at the District level to facilitate planning and
decision-making. Information, conclusions and recommendations from the District analytical
report is expected to serve as a basis for improving the quality of life of the people in the
District through evidence-based policy formulation, planning, monitoring and evaluation of
developmental goals and intervention programs at the local level. The District Analytical
Report for the Krachi Nchumuru District is one of the 216 district reports aimed at making
data available to planners and decision makers at the District level.
9.2 Summary of findings
9.2.1 Demographic characteristics
The demographic characteristics covered in the report included; Population size and
distribution, sex ratio, dependency ratio, population pyramid, fertility, mortality and
migration.
The report shows that the District has a population size of 72,688 with 36,649 males
representing 50.4 percent and 36,039 females representing 49.6 percent. This culminates into
a sex ratio of 101.7, indicating that to every 100 females, there are about 102 males. The
population structure of the District depicts a broad base made up of a large number of
children and a small number of elderly persons at the apex with similar proportional shares of
male and female populations across the age groups. Indicating that every individual within
the working age group takes care of one dependent and this is higher among males than
among females.
The total fertility rate in the Krachi Nchumuru District for women aged 15 - 49 years is 3.8
births per woman. This however appeared to be within what was recorded in almost all the
Districts but slightly higher than the regional average of 3.4 births per woman. More females
60 years and older have the highest number of surviving children (10,790) compared to all
the other age groups. This is followed by the 30-34 age brackets with 8,336 surviving
children made up of 4,213 males and 4,123 females in the District.

59
The District recorded a total of 11,513 migrants, consisting 5,743 born elsewhere in the
region, 1,011 born outside Ghana and the remaining (4,759) born elsewhere in another
region. Among migrants born elsewhere in another region, the highest proportion are from
the Northern region (2,466) followed by the Greater Accra region (643) and the lowest from
the Western Region and Brong Ahafo (49). About 95.5 percent of the District population are
Ghanaians with 90.4 percent being Ghanaians by birth, 3.9 percent by dual nationality and
1.2 percent by naturalization.
9.2.2 Social characteristics
The District has a total of 12,333 households representing about 2.5percent of all households
in the Volta region. With a household population of 12,333, this gives an average household
size of 5.8 persons per household and 3.7 persons for male-headed households and 13.9
persons for female-headed households. The District has a higher proportion of households
(26.9%) headed by males while a proportion of 7.2 percent are headed by females.
The report also shows that 52.2 percent of household populations are children (son/daughter)
while household heads constitute 17.1 percent and spouses (wife/husband) comprise 11.2
percent of household composition. Also, a small proportion of male-headed (0.2%)
households have their parents/parent in-law living with them as against 2.3 percent in female-
headed households.
Information from the 2010 Population and Housing Census also revealed that 51.3 percent of
the population 12 years and older have ever been married; 54.2 percent are currently married
or living together, whiles 3.6 percent are separated or divorced and 5.2 percent are widowed.
Whereas only about one in three females (32.6%) have never been married, the proportion for
males is about fifty percent (48.7%). An opposite trend emerges in relation to widowhood
where females widowed are about eight times higher than their male counterparts (9.1%
versus 1.3%). The percentage of the population who are widowed increase with age to the
extent that by age 65 years and over about one of every three (34.4%) are widowed. There are
substantial variations between males and females. For example, by age 25-29 years, only 15.3
percent of females have never married compared to 46.9 percent of males.
Regarding economic activity by marital status for the population 12 years and older who are
employed in the District, 41.8 percent are never married whereas 87.6 percent are married.
The employed widowed, divorced, consensual unions and separated constitute only 8.6
percent of the total employed population. However, for the unemployed population of 395
persons by marital status, over fifty percent (42.5%) are married and the never married being
38.5 percent.
A greater percentage of the population in the District are Christians (56.6%) even though the
percentage of Traditionalist is also high (20.5%) while quite a sizable percentage (11.6%) of
the population belonging to No religion.
Out of a total of 21,222 persons who are 11 years and older, 47.9 percent are literate in only
English, whereas those who are literate in English and any other Ghanaian language is 45.7
percent. The analyses showed that there are 51.9 percent of the population 3 years and older
in the primary school level and 0.2 percent in vocational/technical/commercial institutions
respectively. It can also be observed that only a small number of the population 3 years and
older are in the tertiary level (0.5%). The report further indicates that from the nursery level
to the primary level, the proportion of females currently attending school is more than that of

60
males, however, from the primary level to the tertiary level the proportion of males currently
attending school are more than the females.
9.2.3 Economic characteristics
The report showed that 72.9 percent of the population 15 years and older were economically
active within the seven days preceding the census night and 27.1 percent were economically
not active. Unemployment is very low in the District. Among the economically active
population, 98.6 percent are employed with a little over one percent (1.4%) being
unemployed. Further, the proportion of economically inactive males who were students (full
time education) was higher (63.7 %) than economically inactive female students (37.1%).
With reference to employed persons 15 years and older, it is evident that workers in skilled
agriculture, forestry and fishery constitute the largest occupational group (79.3%) indicating
that eight out of every ten persons 15 years and older of the employed population are into
agriculture, 8.6 percent in service and sales and 6.9 percent of the employed are into Craft
and related trades. Professional workers constitute only 1.7 percent of the employed
population 15 years and above.
It is also evident that the agricultural sector comprising; forestry and fishing industry is the
most dominant industry within the District accounting for 78.8 percent of the employed
population. The wholesale, retail and repair of motor- vehicles and motorcycles accounted for
7.5 percent whilst the manufacturing sector constituted 5.8 percent of the employed
population.
Amongst those employed, 72.2 percent are self-employed without employees with 20.0
percent of them contributing to family work. 3.4 percent of them are employees and 0.6
percent of them employed as house helps. The distribution of persons 15 years and older by
employment sector indicates that the private informal sector is the largest employer of
economically active persons in the District (97.0%) with the Public (Government) sector
employing 1.9 percent. Less than 1.0 percent are in the Semi-public/Parastatal and other
International organisations.
9.2.4 Information Communication Technology
ICT has become an important tool in various aspects of life. Out of the population 12 years
and older in the Krachi Nchumuru District, only 8,886 representing about 19.6 percent have
their own mobile phones with 26.2 percent of the total male population owning mobile
phones while 13.0 percent of the total female population who are twelve years and older own
mobile phones.
In terms of usage of internet facilities, the percentage of population 12 years and older using
internet facility is 0.4 percent. Amongst the 0.4 percent who uses internet facility in the
District, there are more males (0.7%) than females (0.2%).
Only 110 households representing 0.9 percent had fixed telephone lines. Further, only 0.8
percent of households own desktop or laptop computers and out of the households who own
desktops/ laptop computers in their homes, more males (0.9%) than females (0.5%) own
desktop or laptop computers.

61
9.2.5 Disability
The 2010 PHC puts the total number of people with any form of disability in the Krachi
Nchumuru District at 2,523 representing 3.5 percent with 3.5 percent males and 3.4 percent
females. There are also slightly more persons with disabilities in the urban areas (6.8%),
compared to rural areas (2.6%). Sight disability is the main type of disability accounting for
42.4 percent in the District followed by intellectual disability accounting (21.0%) and speech
disability (9.7%).
Linking disability to employment, the report showed that 60.6 percent of those with disability
are employed. Again, many PWDs are not economically active (45.2%) compared to their
non-disabled counterparts (27.9%). It is further evident that more males with disability
(69.1%) as against (52.1%) of females with disability are employed.
9.2.6 Agricultural activities
Out of the 12,333 households in the District, 10,086 representing 81.8 percent of households
are engaged in agriculture. Of the agricultural households, 19.4 percent of the urban
households in the District are engaged in agriculture whereas 80.6 percent of the rural
households are also engaged in agriculture. The two traditional activities of crop farming and
livestock rearing are prominent in the District and in both urban and rural communities.
About one percent (0.5%) of agricultural households are into tree planting.
In the bird category, there were 66,120 chicken, 6,799 guinea fowls, 3,083 ducks and 182
turkeys. Among the other livestock (non-traditional livestock) reported, grass-cutters and
rabbits were 216 and 74 respectively.
9.2.7 Housing conditions
The 2010 PHC results show that the District had a housing stock of 11,743 and out of this
number, 20.5 percent of the stocks are in urban localities whilst the remaining 79.5 percent
houses are located in rural localities. Further, the District recorded 12,333 households, with
the rural localities accounting for a greater proportion of 78.3 percent. Each house recorded
an average of 6.2 persons with the urban and rural localities having 6.4 and 4.8 persons per
house respectively.
Almost half (48.8%) of dwellings are owned by household members with 24.8 percent owned
by other private individuals and 21.1 percent by relative not household member. Amongst
male-headed households, 86.5 percent lived in houses owned by household member, 4.8
percent lived in dwellings owned by other private individuals whilst (6.2%) lived in
dwellings owned by relative not household member. Similarly, 75.1 percent, 8.9 percent and
13.3 percent of female-headed households lived in houses owned by household member,
other private individual and relative not household member respectively.
In terms of the dwelling types, the report revealed that more households reside in separate
houses in the District than any other dwelling type and this accounted for 47.5 percent whilst
31.2 percent of households live in compound houses. Semi-detached houses accounted for
16.6 percent whilst Huts/Buildings (same compound) accounted for 3.1 percent.

62
Most outer walls in the District are built with mud brick/earth and this represents 78.0 percent
of all outer wall material. Outer walls made of cement blocks/concrete and landcrete
accounted for 15.2 percent and 3.5 percent respectively.
Cement/concrete is the most used construction materials for floors of dwelling units by 71.4
percent of households followed by the use of earth / mud (26.4%) The use of burnt bricks,
vinyl tiles, wood, terrazzo, others and stones accounted for about one percent.
Also, 66.8 percent of dwelling units are roofed with metal sheets while 28.9 percent are
roofed with thatch/palm leaf or raffia. Other types of roofing materials used ranges between
0.1 percent and 2.0 percent. With reference to occupancy, the data showed that 86.8 percent
of households had only one room, with 40.8 percent having two sleeping rooms whilst 5.7
percent and 8.9 percent of households had eight and nine or above rooms respectively.
Electricity (mains) is the main source of lighting used by households in the District and this
accounted for 43.1 percent. The proportion of dwelling units using kerosene lamp and
flashlight/Torch as main sources of lighting was 41.6 percent and 13.7 percent respectively.
High technology related sources of lighting including solar accounted for 0.1 percent whilst
the proportion of dwelling units using electricity (private generator) as the main source of
lighting recorded only 0.7 percent.
Households in the Krachi Nchumuru District derive the bulk of their cooking energy needs
from charcoal (44.1%) and wood (40.6%). The use of gas is 10.5 percent while kerosene is
minimal (0.6%) with the other sources such as sawdust, animal and crop residue and
electricity recorded insignificant percentages.
Cooking space used by households showed that separated room for exclusive use of
household accounted for 32.8 percent whilst Open space in compound accounted for 27.5
percent. The variation is much in terms of rural urban use of open space in compound as their
cooking space.
The report shows that huge proportions of housing units have no toilet facilities and as such
use public toilet (WC/KVIP/PitPan) (44.4%). The use of open defecation in the
bush/beach/field accounted for 15.1 percent, Pit latrines accounted for 13.7 percent, KVIP
(18.6%).
Almost one- third of households (29.1%) have their own bathrooms for exclusive use, and
shared separate bathroom in the same house respectively, 24.0 percent use shared open
cubicle, 4.5 percent use open space around compound as bathing facilities. The use of public
bath houses accounted for only 1.6 percent.
The data indicates that 36.2 percent of households dispose of their solid waste at public
dumps (container), 5.5 percent dispose of solid waste indiscriminately, whilst 30.6 percent
use public dumps (open space) as their means of solid waste disposal. Waste collection which
is the most appropriate means of waste disposal is still quite low in the District and this
account for 4.6 percent. With reference to liquid waste disposal, 42.6 percent of households
dispose of their liquid waste by throwing it onto compound, 31.7 percent resort to throwing
their liquid waste onto the street/outside whilst 14.5 percent throw their liquid waste into
gutters. Only 2.6 percent of households dispose of their liquid waste through the sewerage
system.

63
9.3 Policy Recommendation
The various issues discussed and analysed in this report presents both opportunities and
challenges towards the development of the District. The opportunities include taking advantage of
the demographic dividend associated with fertility decline and the subsequent increase in the
active population as well as taking advantage of the large economically active population. The
challenges border on creating employment for the young and fairly well educated population and
reducing the over-reliance on wood for cooking. The formulation and implementation of
development policies are often driven by data and the District specific data provides
information that will inform policies, programmes and activities. The report makes the
following recommendations based on the findings of the report:
9.3.1 Population size, growth and structure
The population structure of the District depicts a broad base made up of a large number of
children and a small number of elderly persons at the apex with similar proportional shares of
male and female populations across the age groups. The broad base means a population
momentum has been built into the population which will cause population growth over a
period of time. Having a youthful population means that more efforts should be geared
towards youthful policies and programmes in terms of social services, particularly education
and health. It is therefore recommended that the integration of population variables into
development planning at the District level should be considered a priority so as to take
advantage of the demographic window of opportunity resulting from the increasingly large
working population which will be evident in the face of declining total age-dependency ratio.
The age and structure of the population show a relatively young population, which has the
potential for further growth. The results may have serious cost implications for the provision of
social services, particularly education and health.
It is therefore recommended that the integration of population variables which has the potential of
stalling the rate of growth of the population such as effective family planning methods be
considered a priority in the District development planning.
The large youth population also calls for increased education and training targeted at
adolescents and young adults on reproductive and related issues so as to reduce the higher-
risk in sex behaviour which could lead to potential increases in prevalence of HIV/AIDS
among the youth.
9.3.2 Fertility
The Total Fertility Rate in the Krachi Nchumuru District for women aged 15 - 49 years is 3.8
births per woman. This percentage happens to be the fourth highest in the region. The urgent
need therefore to continue and intensify fertility education and expand family planning
programmes in the District cannot be over-emphasized.
9.3.3 Mortality
The relatively low level of infant and child mortality rates in the District is recommendable as
it goes a long way to achieving the Millennium Development Goals 4 which is the health
indicator on child and infant mortality. Given the rates, there will be the need for proactive
measures aimed at reducing infant and child mortality as already being implemented in the
District. The provision of more health facilities like the Community Health Planning Services
(CHIPS) compounds in the rural areas should be vigorously pursued. Also, effort should be

64
made to improve access to education and secondly encourage females to progress at least to
the secondary level.
9.3.4 Marriage
The 1994 Revised Population Policy of Ghana seeks to reduce fertility through a number of
social interventions. The findings that highly educated people get married at latter ages of
their lives could be targeted for achieving lower fertility goals. As women spend more time
schooling, the chances of entering to early marriages reduce, which then reduces their fertility
potentials as well as changing high fertility intentions. To that extent, there is a need to
provide more access to formal education by removing economic and spatial barriers.
9.3.5 Literacy and education
The observation that the current school attendance of females was higher than that of males
in the early years of schooling but not at the higher levels, point to the disadvantage that
females face at the older ages where they are equally needed. The results indicate that the
Ministry of Education and parents must work together at ensuring that high participation rates
are achieved at all levels and that the levels among females at the lower levels of education
are carried over into the secondary and higher levels of education. Implementing the policy
would call for public and private partnership in the provision of facilities as well as
scholarships and incentives to ensure that females stay in school.
Educational initiatives policies such as the School Feeding Programme, Capitation Grant and
provision of free uniform should be vigorously utilized to enrol more children in school.
Further, the District Assembly should establish an educational fund to assist needy students,
especially girls, to pursue senior high school and tertiary education.
9.3.6 Labour force
The report indicates that 73.4 percent of the total population are within the working age group
(15-64 years) implying a large pool of working population available to be harnessed for
productive work. This calls for changes in our educational curricula so as to produce a
competent workforce.
9.3.7 Occupation and industry
Workers in skilled agriculture and related occupations are in the majority in the District and
Agriculture/Forestry/ Fishing is the largest industrial sector employing more than 78 percent
of the economically active population. On the basis of these results, the following are
suggested:
Efforts to modernize agriculture using appropriate technologies to increase
productivity in the sector need to be intensified;
Farmers in agriculture need to be supported to acquire implements and small-to
medium scale irrigation equipment that will facilitate farming activities throughout
the year;
The linkage between agriculture related activities and local industries need to be
strengthened to create employment and ensure efficiency in both sectors.

65
9.3.8 Information Communication Technology
The limited use and access to ICT in the District has policy implications for support to getting
the ICT facilities to individuals and households in the District. To increase the use of internet,
the government, especially the District Assembly and private organization, may need to set
up internet centres in public places such as libraries and community centres. The use of
internet, however, is closely linked with regular supply of electricity.
9.3.9 Disability
Most disabled children have little or no education. This calls for the establishment of special
schools for children with disability, giving support services to persons with disabilities, for
example, provision of hearing aid, Braille and wheel chairs among others to PWDs which in
turn will encourage them to attend school and participate fully in school activities.
9.3.10 Agricultural activities
About 81.8 percent of households in the District are engaged in agriculture. Crop farming and
livestock rearing are prominent in the District while fish farming is relatively low in the
District. On the basis of these results, the following are suggested:
Efforts to modernize agriculture using appropriate technologies to increase
productivity in the sector need to be intensified;
Farmers in agriculture need to be supported to acquire implements and small-to
medium scale irrigation equipment that will facilitate farming activities throughout
the year;
Much investment should be made in fish farming and tree planting.
9.3.12 Housing conditions
The results from the census provide aggregate picture of the housing and social amenities
such as water, sanitation, electricity and other facilities. The general observation is that even
at that gross level the housing and associated facilities are either inadequate, unreliable or of
poor quality. Therefore, there will be the need for government and local administrations to
enforce the minimum standards of house construction and the provision of basic facilities
such as cooking areas and toilets in houses.
There should be a process of providing facilities such as pipe borne water supply and
sanitation services including the extension of waste collection to both urban and rural areas in
the District. Although rural electrification is improving and should be intensified,
government should continue to explore non-conventional sources of energy such as solar.
There is the need for initiatives aimed at addressing the lighting needs of off-grid populations
by making safe, affordable, durable, and environmentally sustainable lighting available.
The proportion of the population with access to adequate and hygienic toilet facilities is low.
Laws on sanitation should be enforced on home ownership of clean toilets as well as maintain
clean public toilet facilities.
Water supply continues to be a challenge in the District. Communities in both urban and rural
areas do not have adequate, reliable and clean water supply throughout the year. The
available evidence indicates that Ghana with Krachi Nchumuru District as no exception will
not be able to meet the water and sanitation targets in the MDGs. Therefore, the District
Assembly in collaboration with Non-governmental organizations operating in the water

66
sector need to target underserved communities to construct more of bore-holes. This will
ensure access to potable water for those communities.
Further, the District Assembly should be supported to enforce by-laws regarding the disposal
of solid and liquid wastes.
An important concern is the use of wood as the main source of fuel for domestic consumption
with its attendant impact on deforestation in the District. District planners need to devise
strategies for households to cut down on use of wood for cooking and encourage the use of
gas as replacement.

67
REFERENCES
Krachi Nchumuru District (2013), District Profile.
Ghana Statistical Service, (2012); 2010 Population and Housing Census. Summary Report of
Final Results GSS, Accra
Ghana Statistical Service, (2009); 2010 Population and Housing Census, Enumerator’s
Manual.

68
APPENDICES
Table A1: Household Composition by type of locality
Household Composition
Total Urban Rural
Total Percent
Number Percent
Number Percent
Total 72,009 100.0
14,832 100.0
57,177 100.0
Head only 1,020 1.4
276 1.9
744 1.3
Household with head and a spouse only 492 0.7
128 0.9
364 0.6
Household with head and biological/adopted children only 5,127 7.1
1,235 8.3
3,892 6.8
Household with head spouse(s) and biological/adopted children only 24,849 34.5
4,719 31.8
20,130 35.2
Household with head spouse(s) biological/adopted children and relatives of the
head only 27,044 37.6
5,123 34.5
21,921 38.3
Household with head spouse(s) biological/adopted children relatives and
nonrelatives of the head 1,327 1.8
318 2.1
1,009 1.8
Household with head spouse(s) and other composition 1,850 2.6
511 3.4
1,339 2.3
Household with head biological/adopted children and relatives of the head only 6,444 8.9
1,578 10.6
4,866 8.5
Household with head biological/adopted children relatives and nonrelatives of the
head 430 0.6
104 0.7
326 0.6
Household with head and other composition but no spouse 3,426 4.8 840 5.7 2,586 4.5 Source: Ghana Statistical Service, 2010 Population and Housing Census

69
Table A2: Population 3 years and older by sex, disability type and level of education
Sex/Disability type Total
Never
attended Nursery
Kinder
garten Primary
Middle
/JSS/ JHS
Sec. /SSS
/SHS
Voc./ Tech./
Comm.
Post
sec
Bachelor
degree
Post graduate
(Cert. Diploma
Masters PHD etc)
Total 65,502 31,192 2,298 3,774 16,002 8,578 2,789 229 549 75 16
No disability 63,076 29,596 2,260 3,726 15,661 8,288 2,718 221 517 75 14
With a disability 2,426 1,596 38 48 341 290 71 8 32 0 2
Sight 1,031 709 14 17 121 122 20 3 23 0 2
Hearing 437 314 13 8 58 37 4 0 3 0 0
Speech 218 135 5 6 42 26 4 0 0 0 0
Physical 500 338 2 4 58 73 20 1 4 0 0
Intellectual 516 333 7 13 72 64 19 2 6 0 0
Emotional 239 155 3 8 37 25 6 4 1 0 0
Other 168 107 7 2 23 25 2 0 2 0 0
Male Total 33,007 13,788 1,216 1,900 8,460 5,065 1,918 141 442 64 13
No disability 31,777 13,079 1,193 1,871 8,268 4,872 1,862 141 416 64 11
With a disability 1,230 709 23 29 192 193 56 0 26 0 2
Sight 530 326 9 11 69 80 14 0 19 0 2
Hearing 197 131 5 3 29 22 4 0 3 0 0
Speech 121 65 5 3 27 17 4 0 0 0 0
Physical 234 124 2 1 36 51 18 0 2 0 0
Intellectual 246 145 5 6 36 36 12 0 6 0 0
Emotional 124 78 3 4 19 13 6 0 1 0 0
Other 108 63 6 1 15 19 2 0 2 0 0
Female Total 32,495 17,404 1,082 1,874 7,542 3,513 871 88 107 11 3
No disability 31,299 16,517 1,067 1,855 7,393 3,416 856 80 101 11 3
With a disability 1,196 887 15 19 149 97 15 8 6 0 0
Sight 501 383 5 6 52 42 6 3 4 0 0
Hearing 240 183 8 5 29 15 0 0 0 0 0
Speech 97 70 0 3 15 9 0 0 0 0 0
Physical 266 214 0 3 22 22 2 1 2 0 0
Intellectual 270 188 2 7 36 28 7 2 0 0 0
Emotional 115 77 0 4 18 12 0 4 0 0 0
Other 60 44 1 1 8 6 0 0 0 0 0
Source: Ghana Statistical Service: 2010 Population and Housing Census

70
Table A3: Distribution of households engaged in tree growing or crop farming
by type of crop and population engaged
Households/ Type of crop Households
Population in occupied
units
Population engaged in
agricultural activities
Total Male Female Total Male Female
Households engaged in agricultural
activities 10,086 62,588 31,811 30,777
23,578 12,788 10,790
Households engaged in crop farming or
tree growing 9,632 60,125 30,554 29,571
22,774 12,315 10,459
Households engaged in crop farming 9,629 60,116 30,551 29,565
22,767 12,312 10,455
Households engaged in tree growing 55 347 176 171
163 89 74
Agro forestry (tree planting) 55 347 176 171
163 89 74
Alligator pepper 94 536 268 268
208 108 100
Apples 18 131 74 57
37 27 10
Asian vegetables (e.g. tinda,
cauliflower) 49 304 154 150
100 64 36
Avocado 4 33 12 21
7 4 3
Banana 32 262 129 133
85 43 42
Beans 621 4,480 2,266 2,214
1,748 939 809
Black pepper 77 445 244 201
172 78 94
Black berries 4 33 19 14
13 5 8
Cabbage 2 8 4 4
2 2 0
Carrot 20 89 46 43
32 24 8
Cashew 32 232 131 101
91 48 43
Cassava 5,661 36,651 18,764 17,887
13,972 7,668 6,304
Citronella 3 14 7 7
7 4 3
Citrus 2 5 3 2
2 2 0
Cloves 2 9 6 3
6 4 2
Cocoa 248 1,182 660 522
500 297 203
Coconut 37 236 105 131
83 49 34
Cocoyam 91 498 257 241
202 117 85
Cocoyam / Taro (kooko) 5 28 12 16
22 8 14
Coffee 7 53 23 30
17 9 8
Cola 4 13 8 5
6 4 2
Cotton 11 75 42 33
53 32 21
Cucumber 58 406 210 196
184 99 85
Egg plant 6 48 22 26
12 8 4
Garlic 6 31 15 16
12 8 4
Garden eggs 115 771 367 404
321 152 169
Ginger 22 164 74 90
59 27 32
Groundnut 2,814 20,315 10,024 10,291
7,924 3,810 4,114
Guava 23 159 84 75
60 32 28
Kenaf 4 28 12 16
6 4 2
Lemon grass 5 11 7 4
9 7 2
Lettuce 3 14 8 6
12 7 5
Maize 4,747 32,064 16,406 15,658
12,401 6,707 5,694
Mango 60 392 197 195
135 80 55
Melon (agusi) 163 1,173 627 546
589 336 253
Millet 636 4,798 2,430 2,368
1,860 983 877
Mushroom 8 68 30 38 23 10 13

71
Table A3: Distribution of households engaged in tree growing or crop farming
by type of crop and population engaged (cont’d)
Households/ Type of crop Households
Population in occupied
units
Population engaged in
agricultural activities
Total Male Female Total Male Female
Oil palm 124 890 481 409
352 197 155
Okro 1,400 10,030 5,105 4,925
4,094 1,980 2,114
Onion 18 110 56 54
57 31 26
Pawpaw 24 161 76 85
61 29 32
Peas 23 139 82 57
57 41 16
Pepper 3,074 20,782 10,416 10,366
8,545 4,041 4,504
Pineapple 41 252 122 130
109 60 49
Plantain 157 715 387 328
297 183 114
Potatoes 4 28 13 15
14 8 6
Rice 363 2,435 1,274 1,161
883 481 402
Rubber 1 3 1 2
2 1 1
Shallot 1 8 6 2
2 1 1
Sorghum 11 70 40 30
28 17 11
Soya beans 60 432 214 218
156 75 81
Spinach 2 18 10 8
4 2 2
Sugarcane 10 63 29 34
23 14 9
Sun flower 2 6 2 4
2 0 2
Sweet pepper 2 12 4 8
2 2 0
Sweet potatoes 17 102 65 37
28 16 12
Tiger nut 124 1,091 578 513
382 162 220
Tobacco 18 143 58 85
45 19 26
Tomatoes 211 1,515 749 766
652 303 349
Water melon 17 106 53 53
43 25 18
Yam 7,459 48,935 25,195 23,740
18,420 10,334 8,086
Other (specify) 130 908 487 421 330 183 147 Source: Ghana Statistical Service, 2010 Population and Housing Census

72
Table A4: Population by sex, number of households and houses in the 20
largest communities
S/No Community Name Total Male Female House
holds Houses
1 Banda 9,716 4,820 4,896 1,684 1,528
2 Borae No. 2 4,590 2,232 2,358 909 768
3 Grubi 3,832 1,878 1,954 724 813
4 Chinderi 3,634 1,797 1,837 739 630
5 Bejamse 3,361 1,649 1,712 635 667
6 Buafri 2,166 1,055 1,111 392 370
7 Akaniem 2,099 1,052 1,047 410 494
8 Anyinamae 1,856 886 970 362 372
9 Zongo Macheri 1,820 933 887 325 330
10 Lonkortor 1,227 616 611 290 261
11 Kradente 1,140 563 577 154 149
12 Borae Ahenfie 1,127 510 617 254 233
13 Binandin 1,024 537 487 228 123
14 Ngbanye 1,014 480 534 147 123
15 Korkorse 1,002 547 455 134 124
16 Banda Buya 902 457 445 99 92
17 Konado 899 456 443 121 95
18 Nasende (Lija) 869 424 445 161 115
19 Tribi 804 423 381 98 89
20 Kronkuase 783 403 380 92 92 Source: Ghana Statistical Service, 2010 Population and Housing Census

73
Table A5: Population by age group in the 20 largest communities
S/No Community Name All ages 0-4 5-9 10-14 15-19 20-24 25-29 30-34 35-39 40-44 45-49 50-54 55-59 60-64 65-69 70-74 75+
1 Banda 9,716 1,506 1,518 1,321 936 712 634 589 494 484 329 304 162 166 135 148 278
2 Borae No. 2 4,590 724 675 576 496 382 318 289 215 192 161 143 97 89 56 68 109
3 Grubi 3,832 562 524 497 426 306 287 245 190 158 129 137 66 89 56 49 111
4 Chinderi 3,634 513 513 437 405 282 288 259 165 165 124 118 78 75 47 66 99
5 Bejamse 3,361 535 421 396 371 334 254 199 159 162 135 96 48 61 40 36 114
6 Buafri 2,166 346 322 253 217 175 167 142 153 91 84 71 20 35 21 22 47
7 Akaniem 2,099 326 258 332 252 169 137 115 122 82 76 64 39 36 33 26 32
8 Anyinamae 1,856 286 250 221 211 149 113 125 115 104 65 68 35 34 25 19 36
9 Zongo Macheri 1,820 213 188 231 214 177 163 118 101 77 79 61 42 36 23 41 56
10 Lonkortor 1,227 212 159 147 101 95 77 100 78 71 48 33 23 27 13 18 25
11 Kradente 1,140 229 192 132 107 121 85 58 44 45 34 28 21 19 11 5 9
12 Borae Ahenfie 1,127 131 142 168 149 102 66 66 63 60 41 47 32 14 10 11 25
13 Binandin 1,024 154 139 122 99 87 76 82 71 54 34 33 13 14 6 19 21
14 Ngbanye 1,014 230 195 132 95 52 49 52 64 58 21 27 8 18 4 6 3
15 Korkorse 1,002 161 167 128 115 84 68 57 40 44 40 26 20 21 12 11 8
16 Banda Buya 902 172 168 160 68 47 56 80 29 23 18 20 21 9 12 13 6
17 Konado 899 159 135 126 116 75 55 47 27 47 19 20 19 12 2 14 26
18 Nasende (Lija) 869 175 129 126 84 68 83 72 36 16 21 14 6 12 4 12 11
19 Tribi 804 197 149 91 79 46 52 42 38 25 27 12 7 5 7 5 22
20 Kronkuase 783 135 122 107 73 72 54 45 27 33 29 32 8 11 5 3 27 Source: Ghana Statistical Service, 2010 Population and Housing Census

74
LIST OF CONTRIBUTORS
Project Secretariat
Dr. Philomena Nyarko, Government Statistician
Mr. Baah Wadieh, Deputy Government Statistician
Mr. David Yenukwa Kombat, Acting Census Coordinator
Mr. Sylvester Gyamfi, DISDAP Project Coordinator
Mrs. Abena A. Osei-Akoto, Data Processing
Mr. Rochester Appiah Kubi Boateng, Data Processing
Mrs. Jacqueline Anum, Data Processing
Mrs. Samilia Mintah, Data Processing
Mr. Yaw Misefa, Data Processing
Mr. Ernest Enyan, Data Processing
Mr Chirs Amewu, Regional Statistician
Ms. Hanna Frempong Konadu, Formatting/Typesetting
Mrs. Hellen Ayitevie, Formatting/Typesetting
Mrs. Victoria Sottie, Formatting/Typesetting
Writers
Mr. Awapoayi James
Mr. Sidney Y. Kumah
Consultant
Mr. Jasper Adeku
Editor/ Reviewers
Prof. S. O Kwankye
Mrs. Rebecca Ninson