Embed Size (px)
Citation preview

1 | P a g e
ENGR 4620: Senior Design II
Kortick
Manufacturing An Analysis of Equipment Replacement and
Manufacturing Improvement
Prepared for
Dr. David Bowen, Instructor of ENGR 4620
Engineering Department
California State University, East-Bay
Hayward CA, 94542
Prepared By Cordell Samai, Asmar Farooq, Jerome Ross
Students of ENGR 4620
ENGR Department CSUEB
Hayward CA, 94542
Jun 3rd 2010
2 | P a g e
Kortick Manufacturing Project (Jun 4th 2010)
Dear Mr. Frase,
Asmar, Jerome and Cordell of California State University East Bay, would like to extend
our gratitude for the opportunity to work on the Kortick project over the past few months. Our
goal in this project is to provide the company with a quantitative economic analysis of two
different equipment capable of doing similar jobs. This analysis will help the company to make
an equipment replacement decision based engineering economics principles. In addition we have
also calculated the payback period on the repair cost of the 500 ton press as requested.
We are delighted to share the results of our analysis with the Kortick team and hope
that your company will benefit from it. Our project is divided into three major sections which
correlate to the three major tasks we were required to work on.
The bulk of the project is based on reducing the cycle time of the cross arm
assembly. To facilitate this task, our team has done several time studies which have allowed us to
find ways to reduce cycle time. We have compiled a summary of results recommendations at the
end of this report which we hope will be beneficial to the company. Please extend our gratitude
to the rest of the Kortick family for helping us to complete this project. We hope that our
recommendations presented in this report prove to be useful to Kortick and hope that California
State University will have the opportunity to work with you again in the future.
Sincerely,
Asmar Farooq
Cordell Samai
Jerome Ross

3 | P a g e
1. Executive summary
Our task is to assist Kortick with equipment replacement decision by using engineering
economics. We were also required to reduce the cycle time of the assembling of the fiberglass
cross arm. The equipment replacement decision is based on present worth analysis criterion. This
approach compares the present worth values of different projects and selects the ones which
yield the highest present worth value. Our analysis showed that the induction furnace is more
profitable to the company in the long run. The equipment investment will not only result in
higher profit but also safer working condition and greater consistency in quality.
Engineering economics was also used to analyze the feasibility of repairing 500 ton cold
press. The payback period from repairing this machine was also calculated and compared to
Kortick’s required payback period. Based on our analysis the payback period of this project is
27.7 months. This is approximately 10 months higher than the desired payback period. Hence,
Kortick should not expect the project to payback itself within the time frame of 18 months.
Our group was also given the task of reducing the cycle time of the assembling of cross
arm. This problem was approached by conducting time study on the present assembling method.
Several recommendations were made based on our findings in the time study. The
recommendations made included redesign of workstation, layout of work area, the
implementation of power tools and color coded bins. With the improved design Kortick can
expect a reduction in cycle time of up to 27%. These recommendations will allow substantial
savings in labor cost

4 | P a g e
Table of Contents 1. Executive summary ................................................................................................................................... 3
2. Table of Contents ....................................................................................... Error! Bookmark not defined.
3. Company Background .............................................................................................................................. 6
4. Mission statement: .................................................................................................................................... 6
5. Project statement ....................................................................................................................................... 7
6. ECONOMIC ANALYSIS OF FURNACE REPLACEMENT ................................................................. 9
6.1 Introduction ........................................................................................................................................ 9
6.2 Economic Analysis ............................................................................................................................. 10
6.2.1 Induction furnace (Challenger) .................................................................................................. 11
6.2.2 Gas furnace (Defender) .............................................................................................................. 17
6.3 Results ............................................................................................................................................... 21
7. Repairing of 500 Ton Press ..................................................................................................................... 21
7.1 Introduction ...................................................................................................................................... 22
7.2 Current method of manufacturing V-Braces .................................................................................... 22
7.3 Managers Investment Requirement ................................................................................................. 22
7.4 Components & Startup Cost Required For Repairing ....................................................................... 23
7.5 Operating costs of 500 Ton Press ..................................................................................................... 24
7.6 Results of Payback Period Calculations ............................................................................................. 27
8. Assembly of the Cross Arm ..................................................................................................................... 27
8.1 Introduction ...................................................................................................................................... 27
8.2 Cross arm assembly Parts ................................................................................................................. 28
8.3 Time study on Current assembly Method ........................................................................................ 29
8.4 Current methods of assembly ........................................................................................................... 31
8.4.1 Assembling the parts.................................................................................................................. 31
8.4.2 Mounting the copper wire ......................................................................................................... 33
8.5 Observation after time study ............................................................................................................ 34
8.6 Recommendations ............................................................................................................................ 35
8.7 Time study with the new proposed method .................................................................................... 36
8.8 Results ............................................................................................................................................... 38

5 | P a g e
8.9 Payback period with additional equipment ...................................................................................... 39
9. Results & Final Recommendations ......................................................................................................... 41
10. Conclusion ............................................................................................................................................ 42
11. References ........................................................................................................................................... 444
12. Appendix ............................................................................................................................................. 444

6 | P a g e
3. Company Background
Kortick Manufacturing is considered the pioneer of Pole Line Hardware manufacturing
on the west coast. Located in Hayward California, the company has been a leader in the industry
for decades, and has been in business for over one hundred years. Kortick strives to build its
business reputation on service and quality. They continuously express appreciation to their
customers for making the growth and development of the company possible over the years and
look forward to the same in the future. Being a company that takes great pride in the quality of
its products, Kortick is highly revered in pole line hardware manufacturing industry. Their
manufactured parts are capable of meeting many nationally recognized engineering
specifications and standards. Currently Kortick manufactures over 3000 different parts but most
of their business comes from producing approximately 800 parts per year. Moreover, as of now,
they are one of the few producers of square head bolts. Kortick was the second production
facility to be given a Bay Area Green Business Certification and the first pole line manufacturing
plant to receive this certification.
4. Mission statement:
Kortick Manufacturing aspires to be a company that all of its employees and its
surrounding community can take pride in. The company’s mission is to maintain the highest
standards in the pole line hardware manufacturing a well as provide customers with the best
delivery times while offering excellent service at competitive prices. They aim to achieve this
while attempting to bring manufacturing jobs back to America. The company also aspires to
have a positive impact on our environment.
7 | P a g e
Kortick Manufacturing values:
- Growing domestic manufacturing and employment
- Environmental stewardship and social responsibility
- Good green business practices
- Mutually Beneficial relationships with distributors to reduce cost and serve the end user
utility
Kortick Manufacturing guarantees:
- Price competitive products
- The highest standards in the pole line manufacturing industry
- On time delivery of products orders
- To be among the highest quality in the industry
5. Project statement
This project is divided into three major sections. Section one focuses on equipment
replacement while section two is concerned with an economic analysis of repair cost. The third
section area of focus is manufacturing improvement via reduction in cycle time.
Section 1: Economic analysis of Equipment Replacement of old gas furnace
The purpose of this section of the project is to help Kortick make an equipment replacement
decision based on cost comparison between two types of furnaces. It compares the cost of
keeping the present gas furnace to the cost of replacing it with an induction furnace over a period
of 10 years. This cost comparison requires knowledge of annual operating costs of equipments,
interest rate, energy cost and initial cost of new equipment. The cost comparison is done using

8 | P a g e
present worth analysis: a technique used in engineering economics that brings all future
payments to the present for comparison purposed. This is done after adjusting them according to
on the time value of money. Present worth analysis is one of the tools that businesses use to
make equipment replacement decisions.
Section 2: Economic analysis of repairing the 500 ton press
This section examines the cost associated with repairing the 500 Ton press. Presently, the 500
ton press is not being used since it is inoperable. Kortick is planning to introduce cold bending in
an attempt to increase efficiency of manufacturing V braces. Moreover, 500 ton press will result
in less usage of both the gas furnace and labor cost. The cost associated with repairing 500 ton
press includes labor, parts and the addition of a laser locking system as a safety device. Kortick’s
VP requires a maximum payback period of 18 months. The payback period of this investment is
calculated and compared to Kortick’s VP requirement.
Section 3: Assembly of the cross arm
The cross arm is a new product that Kortick has started assembling. The current method of
assembling is relatively time consuming and requires a great deal of manual labor. In order to
reduce the cycling time of the process, our team has conducted several time studies and analyzed
them for possible improvements. In addition to this, other alternative methods were also tested
for improvements. The time for each method was compared to the time taken for the current
assembling method and the one with the lowest time was chosen.

9 | P a g e
6. ECONOMIC ANALYSIS OF FURNACE REPLACEMENT
6.1 Introduction
A furnace is a machine used to heat up a work piece. At present Kortick has several gas
furnaces and generally operates three at any given time for forging processes. It uses natural gas
to generate high enough temperature to soften the metal before forging. Although the process is
reliable, the high energy consumption of the gas furnace makes the manufacturing process too
costly. The efficiency of the current gas furnace is 50% to 60%; this means that only 50% to
60% of the input energy is actually converted to usable heat energy. For this reason, the company
is considering switching over to more energy efficient induction furnace.
Induction furnace uses electric current to generate heat. Electric current is passed
through the work piece and heat is generated by the resistance of the work piece. Induction
furnaces have a much higher efficiency rate than gas furnaces (85% minimum). It also has the
advantage of remote or computer control operation. Hence, the operator is not required to stand
by the furnace, which can result in labor savings. Moreover, Induction furnaces create a safer
work environment because of the absence of flames.
Kortick is considering buying an induction furnace to produce square head bolt. The
square head bolt will be heated up to high temperature on both ends and then hammered to make
a head. With the induction furnace, the time it takes to heat up one bolt will be reduced to from
48 seconds to 9 seconds. This will improve the efficiency of the production of the square head
bolt. When gas furnace is used to heat up the bolts, due to direct contact with flames, scales are
10 | P a g e
formed on bolts. These scales require labor hours spent by team members to remove them.
Induction furnace will eliminate this problem since no flames are involved.
In order to help Kortick make this decision, our team has used present worth analysis:
one of the tools used in engineering economics to make equipment replacement decisions.
Present worth analysis brings all future funds at present value after discounting to reflect the time
value of money. The project which results in higher present worth value is chosen over the other.
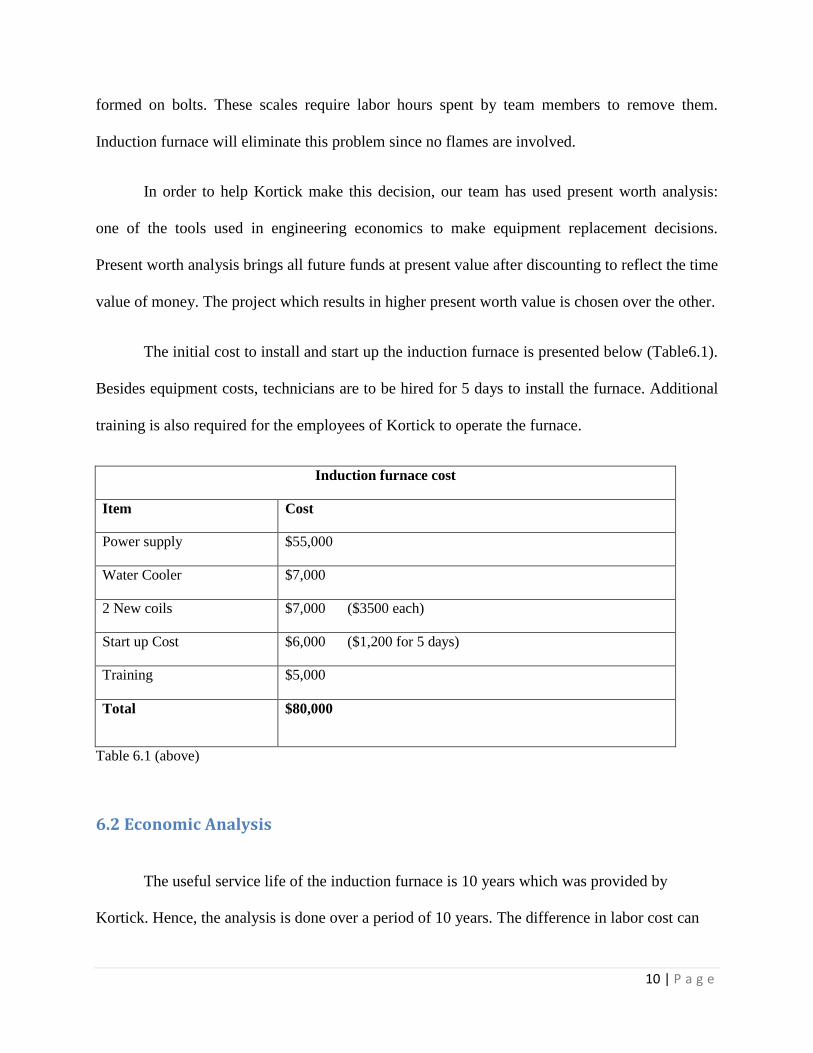
The initial cost to install and start up the induction furnace is presented below (Table6.1).
Besides equipment costs, technicians are to be hired for 5 days to install the furnace. Additional
training is also required for the employees of Kortick to operate the furnace.
Induction furnace cost
Item Cost
Power supply $55,000
Water Cooler $7,000
2 New coils $7,000 ($3500 each)
Start up Cost $6,000 ($1,200 for 5 days)
Training $5,000
Total $80,000
Table 6.1 (above)
6.2 Economic Analysis
The useful service life of the induction furnace is 10 years which was provided by
Kortick. Hence, the analysis is done over a period of 10 years. The difference in labor cost can

11 | P a g e
be considered negligible, since workers will spend approximately the same amount of time on
either furnace. However, the induction furnace will produce bolts at a significantly higher rate
since the cycle time is much lower compared to the gas furnace. Moreover Kortick is planning to
use induction furnace not only for producing bolts, but to manufacture other products in the
future. For the scope of this project, it is assumed that the Induction furnace will only be used for
producing bolts over the next 10 years .In order to determine which furnace is most profitable to
the company in the long run (up to 10 years), present worth analysis criterion is used. Present
worth analysis is method used in engineering economics to convert all cash flows to a common
point in time after taking the time value of money into consideration. In our analysis, the
common point in time is the year 2010. In order to perform a present worth analysis on both
furnaces, the following information is required.
1) Operating cost of Gas and Induction furnaces (Energy or utility cost to run the furnace)
2) Startup cost of Induction furnace
3) Salvage value of Gas and Induction furnaces
4) Additional profits generated by Induction furnace due to higher productivity
5) Company’s MARR (minimum attractive rate of return)
6.2.1 Induction furnace (Challenger)
In this economic analysis the induction furnace will be referred to as the challenger.
Below (Figure 6.2) is the cash flow diagram of the induction furnace. All the down arrows
correspond to negative cash flow since it is an expense to the company. Similarly, the up arrows
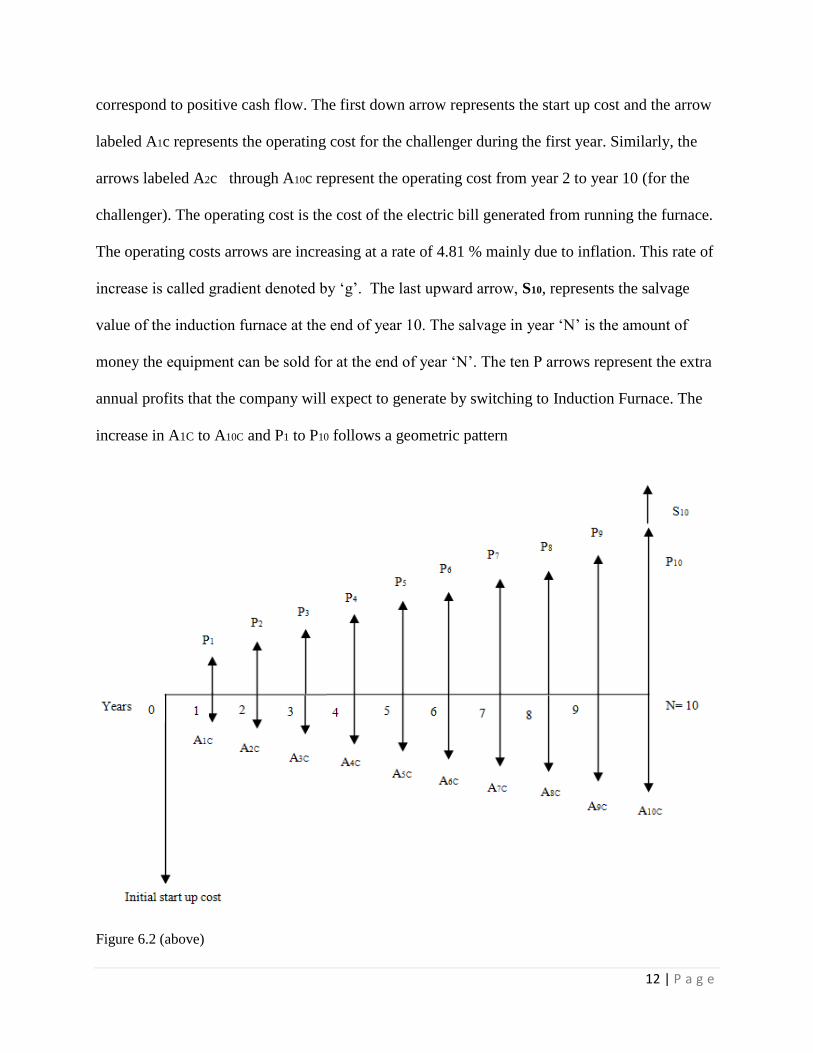
12 | P a g e
correspond to positive cash flow. The first down arrow represents the start up cost and the arrow
labeled A1c represents the operating cost for the challenger during the first year. Similarly, the
arrows labeled A2c through A10c represent the operating cost from year 2 to year 10 (for the
challenger). The operating cost is the cost of the electric bill generated from running the furnace.
The operating costs arrows are increasing at a rate of 4.81 % mainly due to inflation. This rate of
increase is called gradient denoted by ‘g’. The last upward arrow, S10, represents the salvage
value of the induction furnace at the end of year 10. The salvage in year ‘N’ is the amount of
money the equipment can be sold for at the end of year ‘N’. The ten P arrows represent the extra
annual profits that the company will expect to generate by switching to Induction Furnace. The
increase in A1C to A10C and P1 to P10 follows a geometric pattern
Figure 6.2 (above)

13 | P a g e
The following is list different terms and their abbreviations used in our economic analysis:
PWc = Present worth of challenger
PW(Sc10) = present worth of salvage value in year 10 of challenger
IC = Initial start up cost of challenger
PW (Ac) = Present worth of all operation costs (energy cost) from yr 1 through yr10
PW (Pc) = Present worth of all profits from yr 1 through yr 10
Hence the present worth of the challenger is calculated as follows:
PWc = IC + PW(Sc10) + PW (Ac) + PW (Pc)
6.2.1.1 Induction Furnace: Present worth of operating cost
The operating cost Present Worth can be calculated using the following formula :
or PW(Ac) = ( P/ A1c, g, i, N) where
A1c = Operating cost of first year
g = gradient
i = MARR which is minimum attractive rate of return
N = number of years = 10 years
In order to calculate the operating cost of the induction furnace for the first year, we first
calculated how much power is required for one cycle of heating 6 square head bolts. The
induction furnace uses 460 volts at 100 amps.

14 | P a g e
Power = voltage * current = 460v * 100 amps = 46,000 Watts
Each cycle takes 27 seconds to complete.
From the above power calculation, the required energy for one cycle can be calculated as
follows:
Energy/cycle = Power * time = 46,000 watts * 27 seconds = 1242,000 joules = 1242 kilojoules
per cycle
1 Kilo Watt hour = 3600 Kilojoules
1242 kilojoules = 1242 kilojoules * 1 Kilo watt hour/3600 kilojoules 0.345 Kilo watt hour per
cycle
Hence in one cycle, the induction furnace consumes 0.345 KWh of energy.
The cost per kilowatt hour provided by PG&E is 16 cents
One cycle has 6 bolts
Energy consumed by one bolt (16 cents/KWh) * (0.345 KWh/cycle) * (1 cycle / 6 bolts) =
0.92 cents per bolt
Currently, Kortick manufactures bolts at rate of 170 bolts per hour from each furnace.
In one day furnaces are run for 6.5 hours on average and are used twice per week
Based on the above information, the annual operating cost can be calculated as follows:

15 | P a g e
Operating Cost = (0.92 cents per bolt) * (170 bolts per hour) * (6.5 hours /day) * (2 days per
week) * (50 weeks per year) = 101,660 cents per year = $1,016.60 per year
The operating cost of the induction furnace will be approximately $1,016.60 for the first
year.
Gradient
Over the last ten years period, the price of electricity has increase from 10 cents per KWh
to 16 cents per KWh. This information was provided by a PG&E representative. For the scope of
this project, we will assume that the rate of increase in the electric bill will follow this trend over
the next ten years. The rate of increase, gradient (g), can be calculated a follow:
10 * (1 + g) 10 = 16 g = 0.0481 = 4.81 %
Interest rate
For interest rate we used the MARR value provided by Kortick = 10.0%
Present Worth of operating cost for challenger PW(Ac)
= (P /-$1016.60, g = 4.81%, I = 10%, N = 10 years) = -$7507.21
The present worth of the operating cost PW(Ac) of the induction furnace is -$7507.21

16 | P a g e
6.2.1.2 Induction Furnace: Present worth of salvage value
The equipment cost consists of the following, cost of power supply, cost of water cooler and cost
of 2 new coils. The total cost of the equipment obtained from Table 6.1 is $69,000
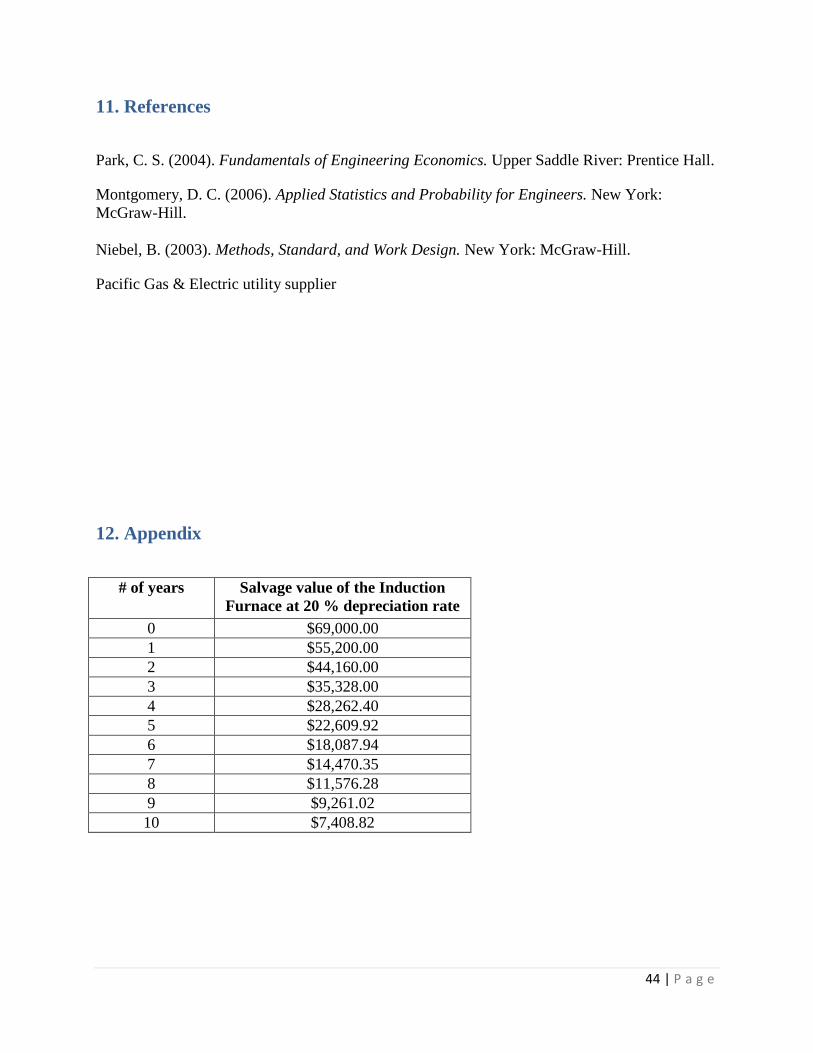
The depreciation rate of the induction furnace is 20% provided by Kortick
After 10 years, the book value of the induction furnace is estimated to be $7,408.52. (see
appendix)
The present worth value of this is PW (Sc10) = $7,408.52 (P/F, i = 10%, N = 10yrs) =
$2,856.31
6.2.1.3 Induction Furnace: Present worth of additional profits
Each year Kortick will be generating extra profits due to higher productivity by switching to
Induction furnace. By switching to the induction furnace, Kortick‘s VP expects to generate
additional annual profits due to higher productivity of the induction furnace. According to Gavin,
the company expects to generate an additional profit of $20,000 in the first year. These
additional profits are expected to grow at a rate of 5 % over the previous year for the next 10
years. Below (Figure 6.4) is the cash flow diagram representing the profits over 10 years.
Figure 6.3

17 | P a g e
PW (Pc) = $20,000 (P/ A1c, g=5%, i=10 %, N=10 years) = $148,796.24
The present worth of these profits PW (Pc) is expected to be $148,796.24
6.2.1.4 Induction furnace: Net Present Worth
Having calculated the present worth of all annual costs and profits over 10 years as well
as the present worth of the salvage value of the induction furnace(in year 10), it is now possible
to calculate the present worth of the challenger, PWc.
From above,
PWc = IC + PW(Sc10) + PW (Ac) + PW (Pc)
PWc= -$80,000 + $2,856.31 - $7507.21 + $148,796.24 = $ 64,145.34. Hence the present worth
using the induction furnace is $64,145.34
6.2.2 Gas furnace (Defender)
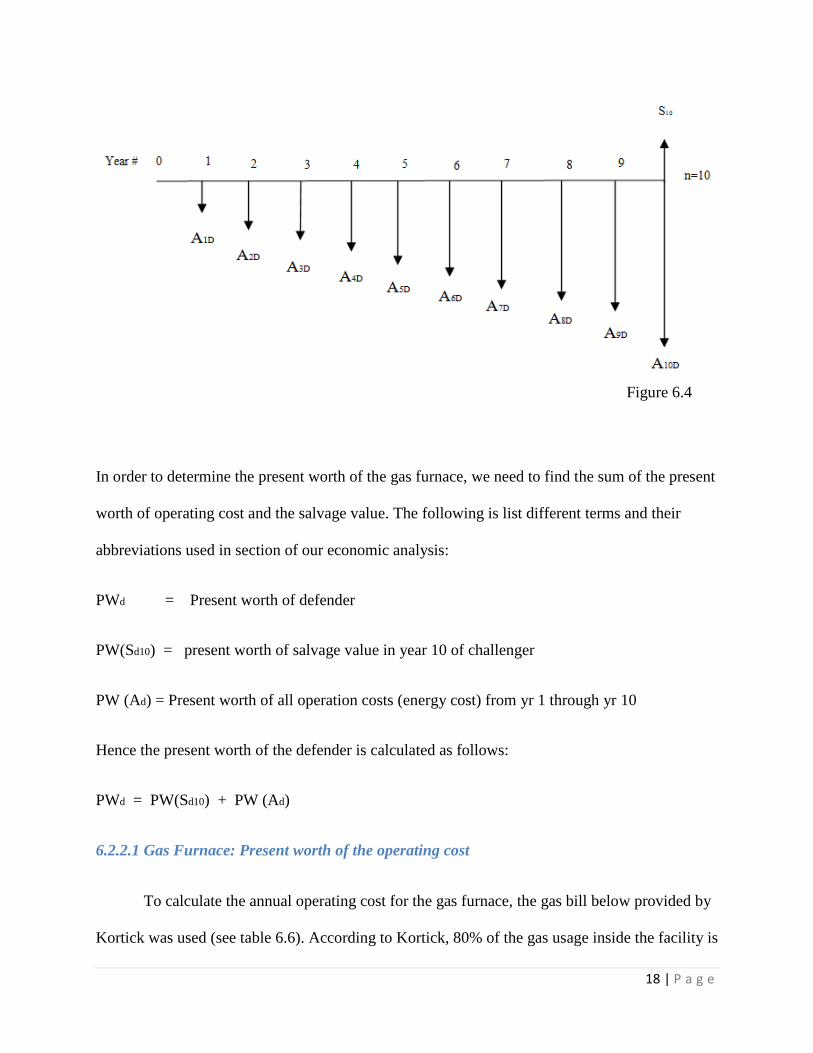
In this analysis the gas furnace is referred to as the defender in this case. Figure 6.5
shows the cash flow for the gas furnace. All the down arrows represent the operating cost of the
gas furnace over the 10 years. The operating cost of the gas furnace is the cost of gas used to
operate the furnace. There is no initial start up cost since the gas furnace is already in place. The
last upward arrow represents the salvage value of the gas furnace after 10 years.
18 | P a g e
Figure 6.4
In order to determine the present worth of the gas furnace, we need to find the sum of the present
worth of operating cost and the salvage value. The following is list different terms and their
abbreviations used in section of our economic analysis:
PWd = Present worth of defender
PW(Sd10) = present worth of salvage value in year 10 of challenger
PW (Ad) = Present worth of all operation costs (energy cost) from yr 1 through yr 10
Hence the present worth of the defender is calculated as follows:
PWd = PW(Sd10) + PW (Ad)
6.2.2.1 Gas Furnace: Present worth of the operating cost
To calculate the annual operating cost for the gas furnace, the gas bill below provided by
Kortick was used (see table 6.6). According to Kortick, 80% of the gas usage inside the facility is

19 | P a g e
affiliated with furnace operation during winter and 95% during summer. On average, Kortick
operates three furnaces daily. The calculation of the annual energy cost from operating three
furnaces can be obtained by using the gas bill. The table below (Table6.6) shows the monthly
costs of operating the three furnaces over the course of 1 year. It also shows the estimated annual
bill for operating the three furnaces ($10,526.5). Hence, the estimated annual bill for operating
one furnace = $10,526.5/3 = $3,508.83.
Bill Date
Gas Usage
(Therms)
Total
Charges Season Percent
Charges for 3
furnaces
1/14/2010 3141 $1,367.86 winter 80% $1,094.29
12/14/2009 4101 $1,684.48 winter 80% $1,347.58
11/12/2009 4350 $1,557.65 winter 80% $1,246.12
10/13/2009 2028 $722.15 winter 80% $577.72
9/14/2009 2221 $774.76 summer 95% $736.02
8/13/2009 1759 $619.74 summer 95% $588.75
7/16/2008 2969 $959.12 summer 95% $911.16
6/16/2008 2102 $699.75 summer 95% $664.76
5/15/2008 2530 $821.70 summer 95% $780.62
4/15/2008 3237 $1,125.23 summer 95% $1,068.97
3/17/2008 3259 $828.89 winter 80% $663.11
2/14/2008 2778 $1,059.24 winter 80% $847.39
Estimated Annual bill for three furnaces $10,526.50
Estimated Annual bill for one furnace $3,508.83
Table 6.5

20 | P a g e
Gradient
The gas prices have increased from 0.71 cents to 0.93 cents over the last 10 years according to a
PG&E representative. Based on this information, the gradient value can be calculated as follows:
0.71 * ( 1 + g )10 = 0.93 g = 0.0273 = 2.73 %
Therefore, the rate of increase in operating cost of the gas furnace is estimated to be 2.73%.
The following is a list of abbreviations of terms used to perform an economic analysis of the
defender (gas furnace)
PW(Ad) = ( P / -3508.83, g = 2.73%, I = 10%, N = 10 years) = -$23,904.70
6.2.2.2 Gas Furnace: Present worth of salvage value
The salvage value of the current gas furnace is estimated to be around $500. This was provided
by Kortick.
The present worth of salvage value = PW (Sd10) = $500 (P/F, i = 10%, N = 10yrs) = $192.77
6.2.2.1 Gas Furnace: Net Present worth
The net present worth of gas furnace is the sum of present worth of operating cost and the
salvage value.
PWd = PW(Ad) + PW(Sd10) = -$23,904.70+ $192.77 = -$ 23,711.93
The total present worth of the gas furnace is -$ 23,711.93

21 | P a g e
6.3 Results
PWd = -$ 23,711.93 Gas Furnace
PWc = $64,145.34 Induction Furnace
By comparing the present worth of both furnaces, it is clear that induction furnace is far
better and profitable option for Kortick. Not only Kortick will be making additional profits,
Induction furnace will lower the operating cost, reduce labor, increase safety and quality of their
products.
7. Repairing of 500 Ton Press
(Figure 7.1 500 ton press)

22 | P a g e
7.1 Introduction
Kortick is presently considering repairing The 500 ton press machine for the purpose of
cold bending of V-Braces. In addition, this machine will also be used for stamping and punching
of various parts. The 500 press uses hydraulic pressure for cold bending and does not require gas
in its operation. By repairing this machine, the company will be able speed up the manufacturing
processes of V-Braces as well as reduce their gas consumption.
7.2 Current method of manufacturing V-Braces
Presently V-Braces are manufactured in batches of 300 using a heat furnace that runs on
gas. After heating up the metal in the furnace, the heated part is taken to the 200 Ton press where
the bending process initiates. This bending process requires two people, one holding either end.
After bending is completed, the V-Brace is then taken over to special area for cooling. Kortick
considers the entire process to be rather time consuming and would like to manufacture V-Braces
using a more efficient method. As mentioned above, the current method of manufacturing a
single V-Brace requires the labor of two people. By using the 500 ton press for bending, the V-
Braces can be made with just 70 % of the labor used on the gas furnace. Hence, by
manufacturing V-Braces with an induction furnace results in a labor savings of 30 percent.
7.3 Managers Investment Requirement
Kortick’s VP is hoping to have a maximum payback period of 18 months. In determining
the feasibility of this project, payback screening can be useful. Payback screening is a method of
screening out obviously unacceptable investments. Having decided that the payback period is

23 | P a g e
within an acceptable range, using payback screening, the next step is to perform a formal
evaluation such as present worth analysis.
7.4 Components & Startup Cost Required For Repairing
The startup cost of the 500 Ton press is estimated to be $10,000 by VP Garvin. This cost
consists of parts and labor, $3,500 and $6,500 respectively. Gavin has also requested the
installation of a laser locking system safety device. This device detects body parts that can be
harmed by the press while it is operating. If the laser senses a body part within the loading area,
it automatically switches off the machine to avoid potential injuries to the operator. Even though
this is not a required operating feature, its investment is justified by the huge cost the company
can incur due to team member injuries. Laser locking systems come in various sizes according to
the height of the area requiring protection. The height of the area that requires protection on the
500 ton press is approximately 2 feet. The laser locking system that Gavin is interested in is
called a 750 mm (approx 2.5 ft) type 4 safety light curtain. This device is manufactured by Leuze
Electronics located in New Hudson Michigan (see www.leuzeusa.com).

24 | P a g e
Diagrams:
Above: laser beam detecting body parts
Right: Type 4 E safety light curtain
(safety laser locking system)
Designed to withstand industrial conditions.
Figure 7.2 (Above)
7.5 Operating costs of 500 Ton Press
Table 7.3 (below) shows the start up cost associated with the repairing of the 500 ton press. The
Total estimated start up cost of the repair is $11,950.In addition to the start up cost, the total
annual savings resulting from the switch to the 500 ton press is required to calculate the payback
period. The total annual savings is calculated in Table 7.4 (below). By having these essential cost
components, we can now proceed with the calculation of the payback period. The operating cost
and startup cost are shown in the cash flow diagram below (Figure 7.5).

25 | P a g e
Table 7.3 (Below)
Item (for startup) Cost $
parts 3500
labor 6500
Laser locking system(safety device) 1950
Total start up cost 11,950
There are two methods used in calculating payback period namely conventional payback
period and discounted payback period. The former does not take the time value of money into
consideration while the latter does. In this project our team has decided to use discounted
payback period since the time value of money is not negligible. It is also worthwhile to mention
that the energy cost associated with the operation of this machine is very small and can be
excluded. The interest rate given by Gavin is 6.5 % compounded annually. The savings resulting
from operating the 500 ton press consists of labor savings and gas bill savings. V-Braces are
usually manufactured 4 months out of the year. The process requires 2 full time team members
each working an eight hour shift. Operation of the 500 ton press will result in a labor savings of
30 percent .The savings in labor from operating the 500 ton press is computed as follows:
$15.00/ HR*8HR/Day * 20 work days/month*4 months* 2 (team members)*30% = $2,880
The savings from the gas bill results from the reduction in therms (unit of gas) from switching to
the 500 ton press. The company is expected to reduce it gas consumption by 85 percent after
switching to the 500 ton press. This corresponds to a reduction of 3280 therms on the gas bill
over the course of 4 months (the time frame for manufacturing V-Braces). At a current price of
$0.93 cents per therm, the total savings on the gas bill is calculated to be $3,050. In addition, 500
ton press requires about $ 200 in hydraulic fluid over the course of 4 months. A summary of the
costs and saving is displayed in Table 7.4
26 | P a g e
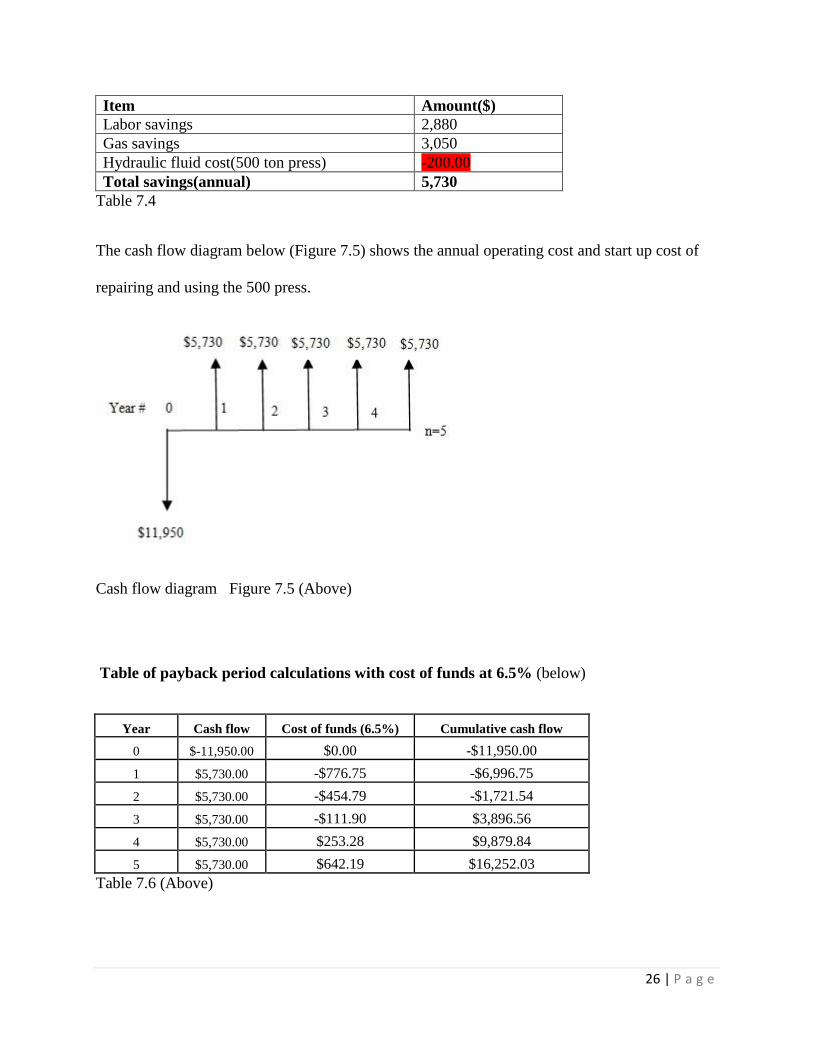
Item Amount($)
Labor savings 2,880
Gas savings 3,050
Hydraulic fluid cost(500 ton press) -200.00
Total savings(annual) 5,730
Table 7.4
The cash flow diagram below (Figure 7.5) shows the annual operating cost and start up cost of
repairing and using the 500 press.
Cash flow diagram Figure 7.5 (Above)
Table of payback period calculations with cost of funds at 6.5% (below)
Year Cash flow Cost of funds (6.5%) Cumulative cash flow
0 $-11,950.00 $0.00 -$11,950.00
1 $5,730.00 -$776.75 -$6,996.75
2 $5,730.00 -$454.79 -$1,721.54
3 $5,730.00 -$111.90 $3,896.56
4 $5,730.00 $253.28 $9,879.84
5 $5,730.00 $642.19 $16,252.03
Table 7.6 (Above)

27 | P a g e
From the above payback period table (Table7.6), it is apparent that the payback occurs
between the second and third year since the cumulative cash flow switches from negative to
positive. A more precise time for the switch can be calculated using linear interpolation. If we let
the payback period =N (where N=2+n) years (n denotes the fraction of the year at which the
payback period occurs), then we can calculate n as follows: n= -cumulative flow (yr 2)/
[(cumulative flow (yr 3) - cumulative flow (yr 2)]
n=-(-1721.54)/[(3896.56)-(-1721.54)] = .31 years. Hence, the payback period is 2.31 years or
27.7 months.
7.6 Results of Payback Period Calculations
As mentioned earlier, Gavin is hoping to obtain a maximum payback period of 1.5 years
(18 months). According to the calculations above, this requirement is not feasible based on the
data provided. Hence, our team’s recommendation is the investment in the repairing of the 500
ton press will require a payback period of approximately 27.7 months, about 10 months longer
than the maximum desirable payback period.
8. Assembly of the Cross Arm
8.1 Introduction
Cross arms are elongated rectangular bars used on power transmission lines. It is a
required component on pole which supports the ceramic insulator over which high voltage
conductors are strung. Traditionally, it is made from treated Apitong wood which is relatively
inexpensive. The disadvantage of using Apitong wood is its lack of resilience to weathering.

28 | P a g e
Moreover, wood is flammable which can cause a fire during voltage surges. Recently, PG&E
switched from wood to fiberglass in the manufacturing of cross arms. Fiberglass has several
advantages over wood such as durability and resilience to harsh weathering conditions since it
erodes at a very slow rate. In addition, fiberglass has a much higher tensile strength than wood
and allows greater consistency and versatility in cross arms.
8.2 Cross arm assembly Parts
At present, Kortick is manufacturing fiberglass cross arm in two lengths; 48” (K8425)
and 96” (KM180143). The fully assembled cross arm consists of following parts listed in Table
8.1(below)
No. of pieces Piece
1 Fiberglass arm
1 Cross bracket
3 Groove bracket
1 Back plate
Above: Table8.1 (major components of cross arm)
29 | P a g e
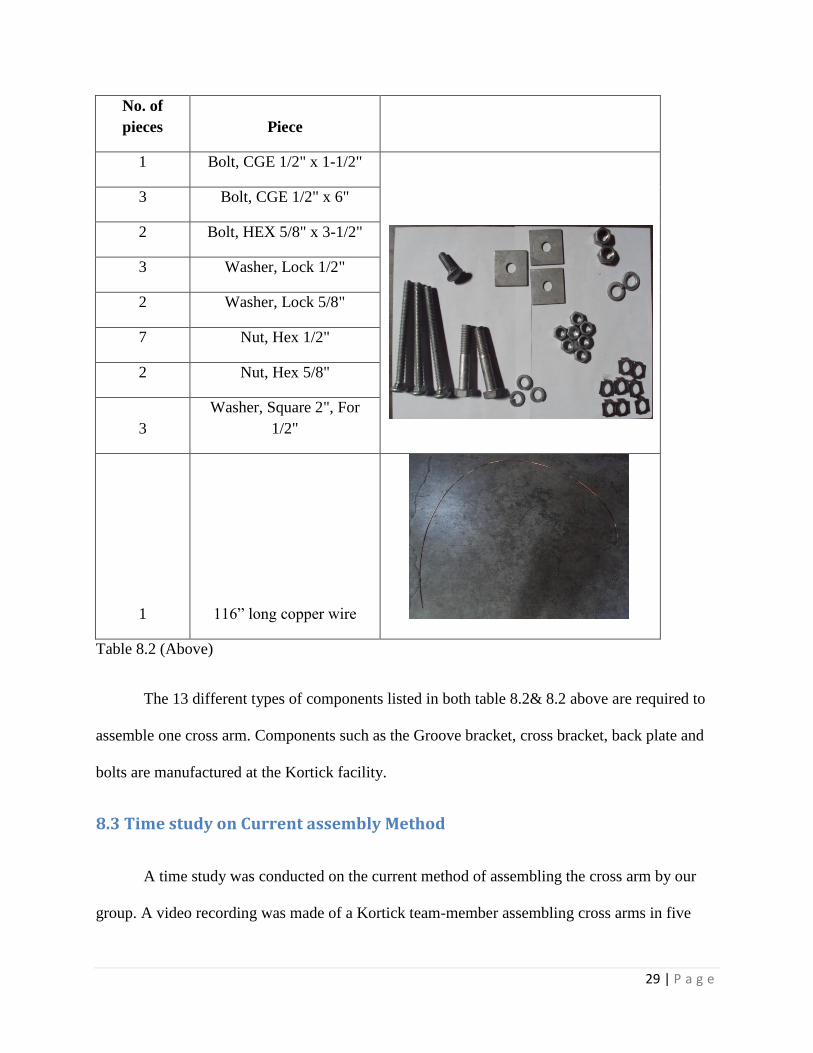
No. of
pieces Piece
1 Bolt, CGE 1/2" x 1-1/2"
3 Bolt, CGE 1/2" x 6"
2 Bolt, HEX 5/8" x 3-1/2"
3 Washer, Lock 1/2"
2 Washer, Lock 5/8"
7 Nut, Hex 1/2"
2 Nut, Hex 5/8"
3
Washer, Square 2", For
1/2"
1 116” long copper wire
Table 8.2 (Above)
The 13 different types of components listed in both table 8.2& 8.2 above are required to
assemble one cross arm. Components such as the Groove bracket, cross bracket, back plate and
bolts are manufactured at the Kortick facility.
8.3 Time study on Current assembly Method
A time study was conducted on the current method of assembling the cross arm by our
group. A video recording was made of a Kortick team-member assembling cross arms in five

30 | P a g e
different instances. With the help of the video recording, the time for each task was recorded for
further analysis. Hand and Body movements were also analyzed for possible improvements. The
whole assembly process was broken down into 10 major parts. The data collected from the video
recording of the cross arm assembling is listed in table below (all units are in seconds)
Assembly process Trial 1 Trial 1 Trial 3 Trial 4 Trial 5 Average Standard Deviation
Get cross arm 26 27 25 24 25 25.4 1.14
Mount T bracket and back plate 50 57 134 59 64 72.8 34.58
Mount groove brackets 107 91 84 90 96 93.6 8.62
Tighten bolts 110 113 110 113 124 114 5.79
Fetching small components 22 23 23 15 20 20.6 3.36
Add wire mounts 54 49 40 56 53 50.4 6.35
Changing work station 23 13 17 14 14 16.2 4.09
Mount wire 241 193 189 190 195 201.6 22.15
Staple wire 72 93 41 75 139 84 35.99
Transportation 24 17 48 25 16 26 12.94
Total 729 676 711 661 746 704.6
Table 8.3 (Above)
The average assembly time was 704.6 seconds or 11 minutes and 45 seconds. The two
processes with the largest standard deviations are mounting T bracket & back plate and Stapling
of the wire. Mounting T bracket & back plate had high standard deviation because in one of the
trials, the team-member picked a defective part. The replacing of this part added to the time
taken to complete the task. The reason for the high standard deviation in the stapling of the wire
is due high amounts of stapling errors. The stapling errors occurred at random.
The following bar graph (Figure 8.2) displays the amount of time in seconds spent on each
process. The detailed process of assembly is explained in the next section.

31 | P a g e
Figure 8.2 (Above)
8.4 Current methods of assembly
The assembly process of the cross arm can be broken into two major steps:
1) Assembling of the parts
2) Mounting of the copper wire.
8.4.1 Assembling the parts
The method currently used by Kortick’s team members to assemble the cross arm
commences with the worker walking from the work station to get the fiberglass brace from a
pallet. Presently this step takes about 25.4 seconds and requires walking a distance of 40 ft.
The next step is the mounting the T bracket and its back plate. This involves the worker bending
over to pick up a T bracket from a storage bin as well as grabbing a back plate from another bin.
Next, the workers has to go to another storage area of the work station to get 2 large bolts, nuts
0 50 100 150 200 250
Get cross arm time
mount T bracket and back plate
mount groove brackets
tighten bolts
fetching small components
add wire mounts
changing work station
mount wire
staple wire
Transportation
25.4
72.8
93.6
114
20.6
50.4
16.2
201.6
84
26

32 | P a g e
and lock washers from bins adjacent to the work station. The worker then places the T bracket
on the cross arm and pushes the bolts through the holes on the T bracket and cross brace. This is
followed by placing bolts through the back plates and adding lock washers. This step is
completed by the tightening of the nuts and bolts. This process takes an average of 72.8 seconds.
The next step is the mounting the groove brackets. This involves the worker walking over to the
storage area and picking up 3 groove brackets which are placed on the arm. The worker then
walks to the small components storage area and gets the following: 3 carriage bolts, 3 lock
washers and 3 square washers. After gathering the required components, the worker then places
the carriage bolts in the square holes on the groove bracket and through the cross brace. In order
to prevent the bolts and brackets from falling off, the cross arm rotated 90 degrees by the worker.
The worker then places the square washers on the ends of the bolts followed by the lock washers
and nuts. This process takes on average 93.6 seconds to complete.
Following the above step is the tightening of the bolts. The worker accomplishes this by using a
socket wrench and two different size sockets. He first tightens the large bolts on the T bracket
and back plate. Once they are tightened to the correct specification he then switches to the
smaller socket and tightens the carriage bolts on the groove brackets. This process takes
approximately 114 seconds to complete.
The above step is followed by fetching the small components and placing the wire
mounts on the tops of the exposed bolts. This requires the worker to grab 8 wire mounts, 4 nuts
and one short carriage bolt. The wire mounts are placed on the exposed bolts on top of the
already fastened nut. These nuts are attached to the longer carriage bolts. Furthermore, each
mount is topped with another bolt. The next step is to insert the short carriage bolt into a square
33 | P a g e
hole on the T bracket so that it is facing the back plate. The wire mounts are placed on the end of
the bolt and topped with a nut. This process takes on average 71 seconds (20.4 for fetching the
small components and 50.6 for adding the wire mounts). The worker then has to change work
stations to start the mounting of the copper wire. The change of work station takes
approximately16.2 seconds.
8.4.2 Mounting the copper wire
The next step is the mounting the wire and is the most time consuming of all the
assembling steps. This requires the worker to transport the cross arm from the first work bench to
the second one and position it so that the wire mounts are facing up. Then the worker grabs a
precut length of 6 gauge copper wire. He then attaches one end of the wire on to the outer wire
mount with about 10 inches of excess. In order to secure the wire, the nuts are then tightened.
The worker then bends the excess wire around the bolt so that it does not extend beyond the
length of the cross arm. The wire is bent into shape by striking it with a pair of pliers until it is
flush against the cross arm. The wire is then attached to the other mounts and hand tightened to
prevent it from sliding. The team-member repeats the process of bending the wire into shape by
striking it with the pliers. This is done until the wire is flush against the cross brace, and the nut
is then tightened to secure it. Once the wire is placed into the last wire mount the team member
adjusts the shape of both ends by striking it with the pliers. On average this process takes about
201.6 seconds.
The last step is the stapling the wire onto the cross brace. This is done in the same work station
using a pneumatic staple gun. By placing the muzzle of the staple gun over the wire and pulling
the trigger staples are fired into the fiberglass securing the wire. It requires 4 staples to securely
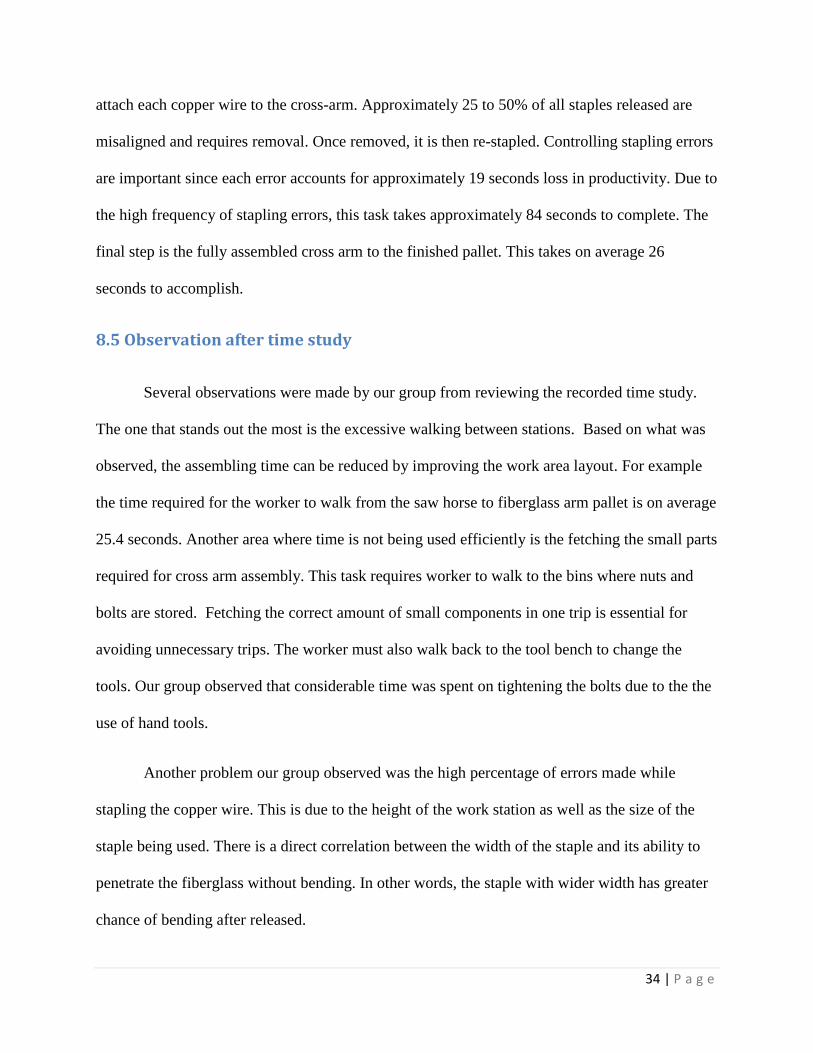
34 | P a g e
attach each copper wire to the cross-arm. Approximately 25 to 50% of all staples released are
misaligned and requires removal. Once removed, it is then re-stapled. Controlling stapling errors
are important since each error accounts for approximately 19 seconds loss in productivity. Due to
the high frequency of stapling errors, this task takes approximately 84 seconds to complete. The
final step is the fully assembled cross arm to the finished pallet. This takes on average 26
seconds to accomplish.
8.5 Observation after time study
Several observations were made by our group from reviewing the recorded time study.
The one that stands out the most is the excessive walking between stations. Based on what was
observed, the assembling time can be reduced by improving the work area layout. For example
the time required for the worker to walk from the saw horse to fiberglass arm pallet is on average
25.4 seconds. Another area where time is not being used efficiently is the fetching the small parts
required for cross arm assembly. This task requires worker to walk to the bins where nuts and
bolts are stored. Fetching the correct amount of small components in one trip is essential for
avoiding unnecessary trips. The worker must also walk back to the tool bench to change the
tools. Our group observed that considerable time was spent on tightening the bolts due to the the
use of hand tools.
Another problem our group observed was the high percentage of errors made while
stapling the copper wire. This is due to the height of the work station as well as the size of the
staple being used. There is a direct correlation between the width of the staple and its ability to
penetrate the fiberglass without bending. In other words, the staple with wider width has greater
chance of bending after released.

35 | P a g e
8.6 Recommendations
To address the problem of lengthy time required to get the cross arm, our team decided to
redesign the work station. By reducing the walking distance between the fiberglass pallet and
the workstation can address the excessive time spent on walking. By placing the pallet directly in
front of the saw horses, the walking distance is minimized. In this improved design, the walking
distance is reduced from 30 feet to 8 feet. This reduction in distance will also decrease the
worker’s fatigue.
For tightening the bolts the use of power tools should be implemented as a time saving
strategy. Since the facility is already equipped with air compressors and extra connecting lines, it
is capable of accommodating the use of pneumatic tools. In particular, the tightening of bolts can
achieved via the used of butterfly impact gun. The butterfly impact is more efficient alternative
to manual wrenches that is currently being used. The switch to manual tools to pneumatic tools is
relatively inexpensive and straightforward since sockets can be used on either tool. This will
make the process of tightening bolts much faster and more effortless.
To reduce the frequency of stapling errors, it is recommended to design a new
workstation which is more ergonomic. This means designing the workstation with a lower height
to improve the stability of the staple gun. It allows the worker to apply more force to the work
piece during stapling. This would help decrease the time being used to maneuver the work piece
and make the stapling easier for the worker. As mentioned above, the width of the staple is
correlates to its ability to penetrate through the fiberglass without bending. The current staple
being used has a width of ½ inch. Selecting a staple with a narrower width will results in less
stapling errors.

36 | P a g e
Making the workstation mobile will allow it to be used as a transportation device for
finished cross arms. Another advantage of having a mobile workstation is that it can transport
multiple finished products in one trip. This can tremendously reduce worker’s fatigue since the
cross arms can weigh up to 40 lbs.
Presently, small parts are stored in the same cardboard boxes in which it was shipped in.
This delays the amount of time gathering those components since it requires opening of the
boxes while fetching the parts. By placing these parts in color coded bins, the time spent fetching
them can be significantly reduced. Moreover, having the color coded will allow faster
identification of the parts.
Another possible alternative will be to use a tool belt that would hold the small
components and tools. This will also greatly reduce the time spent on changing tools and
fetching small parts. However, it has its limitations. The added weight of the loaded tool belt will
put an added strain on the worker and the weight should be kept under 30lbs.
8.7 Time study with the new proposed method
After observing and analyzing the first time study, a second time study was conducted
using our group recommendations. The recommendation included were
1) An improved layout with shorter distances between stations
2) Usage of pneumatic butterfly impact gun
3) An improved ergonomic mobile workstation for wiring
4) Open bins for easier access to parts

37 | P a g e
The work station was designed and built by Jerome Ross. This work station has a shorter
height than the previous one. It has two slot welded on its arm on both sides to stabilize the work
piece. This work station has lock wheels which helps to stabilize it when in use. It also has more
storage space to accommodate up to 2 additional work pieces. The picture of this workstation is
shown in Figure 8.3
Figure 8.3
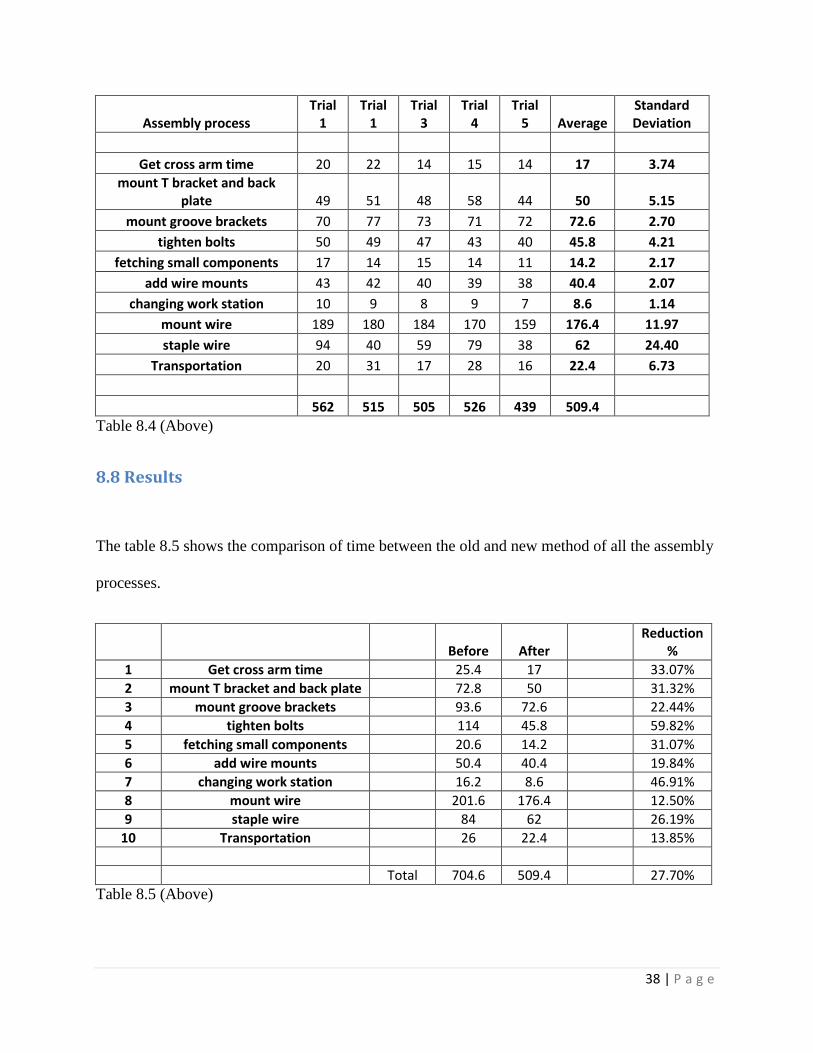
The sequence of assembling the cross arm was kept the same. The times collected with the
implemented tools, improved layout and the work station are shown in table 8.4.
38 | P a g e
Assembly process Trial
1 Trial
1 Trial
3 Trial
4 Trial
5 Average Standard Deviation
Get cross arm time 20 22 14 15 14 17 3.74
mount T bracket and back plate 49 51 48 58 44 50 5.15
mount groove brackets 70 77 73 71 72 72.6 2.70
tighten bolts 50 49 47 43 40 45.8 4.21
fetching small components 17 14 15 14 11 14.2 2.17
add wire mounts 43 42 40 39 38 40.4 2.07
changing work station 10 9 8 9 7 8.6 1.14
mount wire 189 180 184 170 159 176.4 11.97
staple wire 94 40 59 79 38 62 24.40
Transportation 20 31 17 28 16 22.4 6.73
562 515 505 526 439 509.4
Table 8.4 (Above)
8.8 Results
The table 8.5 shows the comparison of time between the old and new method of all the assembly
processes.
Before After Reduction
%
1 Get cross arm time 25.4 17 33.07%
2 mount T bracket and back plate 72.8 50 31.32%
3 mount groove brackets 93.6 72.6 22.44%
4 tighten bolts 114 45.8 59.82%
5 fetching small components 20.6 14.2 31.07%
6 add wire mounts 50.4 40.4 19.84%
7 changing work station 16.2 8.6 46.91%
8 mount wire 201.6 176.4 12.50%
9 staple wire 84 62 26.19%
10 Transportation 26 22.4 13.85%
Total 704.6 509.4 27.70%
Table 8.5 (Above)

39 | P a g e
Figure 8.6
Figure 8.6 shows that the new method significantly reduces the time taken of each
assembling step. The improved assembling method reduced the cycle time from 704.6 seconds to
509.4 seconds. This is a reduction of 195 seconds or 27% reduction in production time.
Tightening the bolts had the highest percent reduction in time due to use of butterfly
impact gun. The reduction in time in mounting of the T bracket and groove brackets is attributed
to new relocation of storage bins.
This warrants that the pneumatic impact guns over manual tools whenever possible.
Moreover, work station and layout should be redesign to better suit the needs of each worker.
This will not only reduce the cycle time but also reduce the worker’s fatigue. It will result in high
productivity.
8.9 Payback period with additional equipment
The total cost of the tools and supplies estimated to be $600 dollars. This includes:
1) 2 butterfly impact guns
0 50 100 150 200 250
Transportation
staple wire
mount wire
changing work station
add wire mounts
fetching small components
tighten bolts
mount groove brackets
mount T bracket and back plate
Get cross arm time
AFTER
BEFORE

40 | P a g e
2) 1narrow crown stapler
3) 2 additional high pressure air hoses
4) A pressure regulation/oiling system
5) Color coded bins.
Currently Kortick is producing cross arms at the rate of 3600 per year. Labor cost for
producing the cross arm is $28 dollars per hour. The costs of producing 3600 units with current
and proposed methods are as follows
Cost (with current method) = 704.6 seconds/unit * 3600 units * $28/hour * 1 hour/3600 seconds
= $19,712.
Cost (with proposed method) = 509.4 seconds/unit * 3600 units * $28/hour * 1 hour/3600
seconds = $14,252.
This a saving of $5,460 in labor cost for the 3600 cross arms in one year.
With this information an economic analysis was conducted to find the present worth of this
investment.

41 | P a g e
PW= -$600+$5460(P/F, i= 10%, n=1) = $-600+ ($5,460x1.1^-1) = $4,363.69
Given the minimum attractive rate of return of 10% this project has a present worth of
$4,463.69 dollars.
Using linear interpolation the exact payback period was calculated.
$-600/ ($5460 - $-600) = .099 years
3600 units/ year x 0.099 years = 356.4 units or during the 357 cross arm.
With the current production rate, this investment will breakeven after the 357th cross arm.
9. Results & Final Recommendations
One of the measurements of effectiveness used to evaluate this project is reduction in
cycle time. This is particularly relevant to the cross arm assembly. By implementing the design
of a new work station and introducing power tools to the assembling process, our group was able
to make a significant reduction in assembly time of up to 27%. The investment in the power tools
is warranted by the quick payback period which occurs during the production of first batch (after
357th cross arms). This new method of assembling cross arms has an added advantage of

42 | P a g e
reducing worker’s fatigue. Hence our team recommends that Kortick adopts our suggested
methods of improvements in assembling the cross arms.
In the case of the decision of replacing the gas furnace with induction furnace, our team
strongly recommends replacing the gas furnace. The present worth analysis of the induction
furnace is $64,145.34 and -$23,711.93 for the gas furnace. Based on these results it is apparent
that the gas furnace is a more profitable investment to the company in a long run. For the
purpose of sensitivity analysis, an excel file is included in appendix. In addition, it offers a safer
work environment due to the absence of escaping flames. This furnace also has the ability to
produce products with more consistence in quality. This is partially due to its ability to produce
square head bolts without any slag or scale.
Our team was also required by Kortick to examine the feasibility of repairing the 500 ton
press. This was also done using engineering economics principles. The maximum payback
period specified by Kortick’s VP is 18 months. Based on our analysis, we calculated the payback
period to be 27.7 months. This is approximately 10 months longer than the desired period.
Hence, our recommendation is that Kortick should expect a longer payback period of up to one
year.
10. Conclusion
Based on findings in this project, our group proposes that Kortick should apply our
suggestions in their daily production. These suggestions will allow the company to benefit by
yielding higher profits. Most of our calculations are based on estimations which should allow for
a margin of error. In the case of cross arm assembly, even though the cycle time was

43 | P a g e
significantly reduced, it is worthwhile to mention that our time study was based on just 5 trials.
These 5 trials were done over the period of 1.5 hours which doesn’t represent someone working
a full shift. Hence, the results may vary over long shifts. In the case of gas furnace replacement
decision, even if the interest rate was to change slightly (see appendix for sensitivity analysis),
our recommendation to invest in induction furnace will stay the same.
One of the many benefits of doing this project is opportunity to work as a team while
sharing ideas with each other. Each group member was able to contribute from their area of
expertise. The synergistic effect from working as a team was far greater than if we work
independently. The time spent on this project was rewarding experience for all of us. We hope
that Kortick and CSUEB continue to work together in future.
44 | P a g e
11. References
Park, C. S. (2004). Fundamentals of Engineering Economics. Upper Saddle River: Prentice Hall.
Montgomery, D. C. (2006). Applied Statistics and Probability for Engineers. New York:
McGraw-Hill.
Niebel, B. (2003). Methods, Standard, and Work Design. New York: McGraw-Hill.
Pacific Gas & Electric utility supplier
12. Appendix
# of years Salvage value of the Induction
Furnace at 20 % depreciation rate
0 $69,000.00
1 $55,200.00
2 $44,160.00
3 $35,328.00
4 $28,262.40
5 $22,609.92
6 $18,087.94
7 $14,470.35
8 $11,576.28
9 $9,261.02
10 $7,408.82

45 | P a g e
$0.00
$20,000.00
$40,000.00
$60,000.00
$80,000.00
$100,000.00
$120,000.00
0 2 4 6 8 10 12 14 16 18 20
PW
of
ind
uct
ion
fu
rnac
e
MARR value in %
Present worth of induction furnace at different MARR


