Embed Size (px)
Citation preview

econstor www.econstor.eu
Der Open-Access-Publikationsserver der ZBW – Leibniz-Informationszentrum WirtschaftThe Open Access Publication Server of the ZBW – Leibniz Information Centre for Economics
Standard-Nutzungsbedingungen:
Die Dokumente auf EconStor dürfen zu eigenen wissenschaftlichenZwecken und zum Privatgebrauch gespeichert und kopiert werden.
Sie dürfen die Dokumente nicht für öffentliche oder kommerzielleZwecke vervielfältigen, öffentlich ausstellen, öffentlich zugänglichmachen, vertreiben oder anderweitig nutzen.
Sofern die Verfasser die Dokumente unter Open-Content-Lizenzen(insbesondere CC-Lizenzen) zur Verfügung gestellt haben sollten,gelten abweichend von diesen Nutzungsbedingungen die in der dortgenannten Lizenz gewährten Nutzungsrechte.
Terms of use:
Documents in EconStor may be saved and copied for yourpersonal and scholarly purposes.
You are not to copy documents for public or commercialpurposes, to exhibit the documents publicly, to make thempublicly available on the internet, or to distribute or otherwiseuse the documents in public.
If the documents have been made available under an OpenContent Licence (especially Creative Commons Licences), youmay exercise further usage rights as specified in the indicatedlicence.
zbw Leibniz-Informationszentrum WirtschaftLeibniz Information Centre for Economics
Becker, Sascha O.; Nagler, Markus; Woessmann, Ludger
Conference Paper
Education Promoted Secularization
Beiträge zur Jahrestagung des Vereins für Socialpolitik 2014: EvidenzbasierteWirtschaftspolitik - Session: Religion and Secularization, No. F11-V1
Provided in Cooperation with:Verein für Socialpolitik / German Economic Association
Suggested Citation: Becker, Sascha O.; Nagler, Markus; Woessmann, Ludger (2014) :Education Promoted Secularization, Beiträge zur Jahrestagung des Vereins für Socialpolitik2014: Evidenzbasierte Wirtschaftspolitik - Session: Religion and Secularization, No. F11-V1
This Version is available at:http://hdl.handle.net/10419/100608

1
Education Promoted Secularization*
Sascha O. Becker† Markus Nagler
§ Ludger Woessmann
‡
U Warwick and CAGE U Munich U Munich and ifo
Why did substantial parts of Europe abandon the institutionalized churches around 1900?
Empirical studies using modern data mostly contradict the traditional view that education was a
leading source of the seismic social phenomenon of secularization. We construct a unique panel
dataset of advanced-school enrollment and Protestant church attendance in German cities
between 1890 and 1930. Our cross-sectional estimates replicate a positive association. By
contrast, in panel models where fixed effects account for time-invariant unobserved
heterogeneity, education – but not income or urbanization – is negatively related to church
attendance. In panel models with lagged explanatory variables, educational expansion precedes
reduced church attendance.
Keywords: Secularization, education, history, Germany
JEL classification: Z12, N33, I20
January 20, 2014
* Valuable comments were kindly provided by Oliver Falck, David Figlio, Jared Rubin, and seminar
participants at Stanford, Gothenburg, Hong Kong UST, Modena, the CAGE/CEPR Conference on “Long-Run
Growth: Unified Growth Theory and Economic History” at Warwick, the CAS conference on “The Long Shadow of
History” in Munich, the CEPR Economic History Symposium in Perugia, the CESifo Economics of Education area
meeting in Munich, the European Economic Association in Gothenburg, the Ammersee workshop “Natural
Experiments and Controlled Field Studies”, the Education Committee of the German Economic Association in
Wuppertal, and the workshop “Political Economy, Economic History, and Religion” at WZB Berlin. We are grateful
to Lucian Hölscher for providing the Sacrament Statistics, to Christoph Albert, Laurenz Detsch, and Andreas Ferrara
for capable research assistance, and to the Pact for Research and Innovation of the Leibniz Association for partial
financial support. † Department of Economics, University of Warwick, Coventry, CV4 7AL, United Kingdom; also Ifo, CEPR,
CESifo, and IZA; [email protected]. § Department of Economics, University of Munich, Akademiestr. 1, 80799 Munich, Germany;
[email protected]. ‡ Department of Economics, University of Munich and Ifo Institute, Poschingerstr. 5, 81679 Munich,
Germany; also CESifo, IZA, and CAGE; [email protected].

2
1. Introduction
Secularization, understood as churches’ loss of importance in society, is a European
phenomenon of the late 19th
and early 20th
century that brought fundamental change to societies.
In our micro-regional German data, participation in Holy Communion per Protestant declined on
average by nearly a third of its initial value from 1890 to 1930. Despite hot academic debates,
empirical evidence on the sources of this seismic social change is scarce. Classic secularization
hypotheses argued that, besides improved material conditions, increased education may have
been a leading source of secularization, as advanced scientific knowledge may have reduced
belief in supernatural forces (e.g., Hume (1757 [1993]); Freud (1927 [1961]); cf. McCleary and
Barro (2006a)). However, cross-sectional evidence generally contradicts this view and finds a
positive association between education and church attendance (Iannaccone (1998)). But such
association may well emerge from bias due to omitted variables: For example, more orderly
people may go both to church and to school. Consistently, in contrast to the cross-sectional
finding, in a randomized laboratory setting Gervais and Norenzayan (2012) find that analytical
thinking induced by priming promotes religious disbelief. However, it is unclear how such
modern experience from short-term lab interventions transmits to the analysis of decade-long
societal developments during important historical phases of secularization.
To provide evidence from an historical setting, this paper constructs a unique panel dataset
on education and Protestant church attendance in German cities from 1890 to 1930. We confirm
a positive cross-sectional association. But results are reversed in panel estimates that use city and
year fixed effects to take out unobserved time-invariant city characteristics and common trends.
Exploiting city-specific variation over time, enrollment increases in advanced schools are related
to decreases in church attendance. While recent comparable findings suggest that increased
income did not lead to reduced church attendance (Becker and Woessmann (2013)), this panel
result is in line with the traditional view that modernization facilitated secularization.
Panel models with lagged explanatory variables show that increased enrollment in advanced
schools preceded decreases in church attendance, whereas the reverse is not true. In contrast to
education, measures of income (municipal tax) and urbanization (city population) as alternative
dimensions of modernization are not significantly related to changes in church attendance. The
main result is confirmed in a series of robustness tests, such as controlling for the age and gender
structure of a city, migration patterns, alternative secular movements, university enrollment, and

3
secular vs. religious schools, as well as in alternative specifications of the education variable and
in subsamples.
Our analysis makes two main contributions to the literature. First, it provides insight into the
mechanisms and reasons of a fundamentally important social phenomenon in Europe in the late
19th
and early 20th
century. In contrast to the income and urbanization measures, education is the
only measure of modernization that is significantly associated with sizeable changes in church
attendance. Second, by replicating the existing cross-sectional patterns and overturning them in
panel analyses, the analysis suggests that the existing cross-sectional literature is likely to suffer
from severe identification problems. In line with recent (quasi-)experimental evidence from
modern times, our panel evidence suggests that educational expansion was negatively related to
religious behavior, confirming traditional secularization hypotheses during an historical period of
mass secularization when they were very prominent but lacked empirical validation.
Section 2 provides context and reviews the literature. Sections 3 and 4 introduce our data
and empirical model. Sections 5 and 6 report results and robustness analyses. Section 7 concludes.
2. Background and Existing Literature
During the 19th
and early 20th
centuries, Western Europe underwent a profound process of
secularization. While the very concept of secularization has been questioned for the United
States (e.g., Finke and Stark (1992)), it is generally accepted that key indicators of secularization,
in particular reduced church attendance, have been “dramatically increasing” in Western Europe
(Berger (1996)). For instance, Becker and Woessmann (2013) find that church attendance fell by
3.6 percentage points per decade, on average, across Prussian counties between 1850 and 1931.1
The period and location we study is therefore of chief interest when analyzing the
determinants of the process of secularization. In fact, the very religious census that our analysis
draws on was established mainly to analyze the “decay” in religiosity in Germany (Hölscher
(2005)), indicating a process of secularization observed by the clergy. This is also confirmed in
Hölscher (2001), who locates the process from the late 18th
century onwards.2 Nipperdey (1988)
supports the existence of this process and points to a large decline in church attendance between
1 Franck and Iannaccone (2014) show that the process of declining church attendance continued, albeit at a
slower pace, in several Western countries over 1925-1990. 2 Hölscher (2005) reports that since the mid-18
th century, it became unusual to punish people’s absence from
church, hence changing it from a duty to a convention. As we focus on a time period after this substantial change in
social pressure, our results are unlikely to be influenced by this anymore, adding credibility to our estimates.

4
1870 and 1912. He narratively attributes this pattern to increases in urbanization, technological
progress, and the advancement of a rational view on the world.
The latter is a key aspect that is often discussed as part of classic secularization hypotheses:
Increased education may have been a leading source of demand-induced secularization.3 In one
form or another, this view on education and religiosity has been advanced by such eminent
scholars as Hume (1757 [1993]), Marx (1844), Weber (1904 [2001]), and Freud (1927 [1961]),
among many others. McCleary and Barro (2006b) summarize this traditional view as follows:
“one argument for secularization is that more educated people are more scientific and are,
therefore, more inclined to reject beliefs that posit supernatural forces” (p. 151).4
Despite hot academic debates about secularization, empirical evidence on the sources of this
phenomenon is scarce. In the sociological literature, this debate has been going on for a long
time (Sherkat and Ellison (1999)). The existing evidence, which is mostly cross-sectional, is
generally not in line with the traditional view that education reduces church attendance.
Iannaccone (1998) summarizes the literature as follows: “In numerous analyses of cross-
sectional survey data, rates of religious belief and religious activity tend not to decline with
income, and most rates increase with education” (p. 1470).
Similarly, in a cross-country analysis, McCleary and Barro (2006b) find that while
religiosity is negatively related to overall economic development,5 it is actually positively related
to education. Using individual-level data from the British National Child Development Study
(NCDS), Brown and Taylor (2007) also find a positive association between education and church
attendance.6 A positive effect of education on religiosity could be explained by alternative
hypotheses based on advantages of educated people in the kind of abstract thinking required for
3 While our analysis contributes to testing of “demand-side” secularization hypotheses, there is substantial
evidence that elements of a “supply-side” religion-market model also contribute to understanding religiosity (e.g.,
Finke and Iannaccone (1993); Stark and Iannaccone (1994); McCleary and Barro (2006b)). Gruber and Hungerman
(2008) show that church attendance faces competition from secular time uses. 4 Modern psychological literature suggests that, while religiosity comes natural at early age, rational reflection
can reduce it (Bloom (2007); Kapogiannis et al. (2009); Shenhav, Rand, and Greene (2012)). 5 Similarly, Lipford and Tollison (2003) find a negative effect of income on church membership using U.S.
state-level data. Becker and Woessmann (2013) study the two-way interplay between church attendance and income
in a panel of Prussian counties in 1886-1911. They find that once county fixed effects are controlled for, the link
disappears. Quite to the opposite of the general pattern in the literature, Franck (2010) finds that the secular
politicians who voted in favor of the separation between church and state in France in 1905 were elected in areas
with high literacy but lower values on some economic indicators. 6 Against this general finding, Ruiter and van Tubergen (2009) and Deaton (2011) find negative associations of
education with indicators of religiosity in cross-country analyses, although not uniformly across all countries.

5
religion (McCleary and Barro (2006b)) or based on educated people getting higher returns from
social networking in church (Glaeser and Sacerdote (2008)).
It is, however, not clear to what extent the existing cross-sectional findings suffer from
omitted-variable bias. For example, it is easily conceivable that more orderly people are more
inclined to go both to church and to school, and that more conservative people put particular
emphasis on religious rituals and on educational achievement. These examples would give rise to
a positive correlation between education and church attendance that does not necessarily stem
from a causal effect of education.7
Recent evidence from modern times underlines such concerns with cross-sectional studies.
When exploiting exogenous variation from changes in compulsory schooling laws, Hungerman
(2011) finds that education led to a reduction in reported religious affiliation in Canada in post-
WW II data. Similarly, recent psychological evidence from laboratory experiments where
participants are primed with analytic processing before being asked about their belief in God
suggests that analytic thinking promotes religious disbelief (Gervais and Norenzayan (2012)).8
Our analysis complements this literature by going back to a crucial period of secularization in a
core European country during which church attendance decreased long before official church
membership figures declined. Observing this social phenomenon over various decades goes
beyond what modern setups can possibly capture.
3. Data
To provide new evidence from a historical setting that avoids important sources of bias, we
construct a unique new panel dataset of German cities between 1890 and 1930 that covers
measures of both education and church attendance (see Data Appendix for details).
First, we digitized data on enrollment in advanced schools (Höhere Unterrichts-Anstalten)
from different volumes of the Statistical Yearbooks of German Cities from Neefe (1892) through
Deutscher Städtetag (1931).9 Covering all German cities with a population over 50,000
7 There may also be bias from reverse causality; e.g., Meyersson (2014) provides evidence that religion –
specifically, Islamic party rule – affects female education, using a regression-discontinuity design that compares
Turkish municipal elections where an Islamic party barely won or lost mayor seats. 8 Sander (2002) and Brown and Taylor (2007) are other notable exceptions which explicitly address concerns
of endogeneity, although it is not clear to what extent their use of parental education (and, in the latter case, school
characteristics and ability measures) as instruments for education can solve the indicated omitted-variable problems. 9 We are not aware of a source where data on advanced-school enrollment and tax revenues are consistently
available for 1890-1930 at the city or county level other than this source for large cities.
6
inhabitants, these yearbooks regularly report the number of students enrolled in advanced
schools. Variation in enrollment in advanced schools seems particularly relevant to test the
traditional view of education and secularization, both because advanced schools are most likely
to convey the kind of scientific thinking stressed by secularization hypotheses and because
enrollment in elementary schools was as good as universal in Germany throughout our period of
observation, in particular in Protestant regions (Becker and Woessmann (2009)).
Our main measure of the enrollment rate in advanced schools is the number of enrolled
students as a share of the city population. Although the number of students who are actually
enrolled does not constitute a large part of the Protestant population of a city, the structure of the
school system is indicative of a city’s educational orientation as parents arguably decide upon
investment in the children’s education. In our view, this measure hence best reflects the overall
educational and scientific orientation of the city.10
The yearbooks provide us with data for an unbalanced panel of a total of 61 German cities
observed over eight waves that cover every five years from 1890 to 1930 (with the exceptions
that, due to the interruptions of World War I, there are no data for 1920 and values for 1913 are
used instead of 1915). Apart from the education data, the yearbooks also report data on
municipal tax per capita, a proxy for income, and on the total population of the city, which
captures different degrees of urbanization.
We match these data with unique data on church attendance of Protestants. This exceptional
database stems from the practice of the Protestant Church to count the number of participations
in Holy Communion every year.11
At the time, church membership was close to 100 percent and
hardly reveals information about actual religious involvement. In contrast, data on participation
in Holy Communion reflects “demonstrations of churchly life … that were considered already by
contemporaries as indicators of churchliness” (Hölscher (2001), p. 4).12
As the communion data
are based on direct head counts, they also do not suffer from the usual unreliability of survey
data on church attendance (Hadaway, Marler, and Chaves (1998); Woodberry (1998)).
10
Results are similar when using the size of the population aged below 20 (rather than the total population),
available in a subsample, as the numerator (Table A1, column 2). Results are also robust to controlling for cities’
age structure as a potential influence (Table A1, column 1; see Azzi and Ehrenberg (1975)). 11
Since the norm was to participate in Holy Communion only once per year (Hölscher (2001), p. 37), changes
in the opportunity cost of participation are unlikely to drive changes in this measure, in contrast to measures of
weekly church attendance. 12
Hölscher (2005) reports that religious behavior in Germany in the 19th
century mainly involved publically
visible actions like church attendance.

7
Hölscher (2001) gathered the historical Sacrament Statistics for the modern-day German
territory from regional archives, providing data on church attendance as measured by the number
of participations in communion divided by the Protestant population (see also Becker and
Woessmann (2013)). The communion data are available at the level of church districts, which we
match to our city database. Given that advanced schools draw their enrollment both from the city
itself and from the surrounding countryside, the availability of the communion data at the church
district level (and of the education data only for larger cities) provides a reasonable match.13
Throughout, standard errors in all regressions are clustered at the level of church districts. Also,
while the church attendance measure refers to Protestants only, educational enrollment refers to
the whole city population; models in subsamples of cities with a mostly Protestant population
confirm that this is not driving the results (Table A2, columns 5-8).
The number of cities with complete available data for our analysis from both sources
increases from 25 in 1890 to 51 in 1930. In total, there are 291 city-year observations over the
eight waves in our unbalanced panel.14
To compare city characteristics of the initial dataset of up
to 522 city-year observations with our estimation sample, Table 1 shows descriptive statistics for
both datasets. None of the differences is statistically significant. In the estimation sample,
average church attendance is 25 percent, ranging from 5 percent to 74 percent.
Overall, the data document a process of secularization in German cities over the period 1890
to 1930: Panel estimates with city fixed effects reveal a statistically highly significant average
decrease in church attendance by about 2 percentage points per decade (not shown).
4. Empirical Model
The panel setup of our database allows us to estimate panel models with fixed effects that
identify only from within-city variation over time. Such models avoid identification from
unobserved time-invariant regional characteristics that may be correlated with both education
and church attendance. Specifically, we estimate the following equation:
13
Results are robust in subsamples where the city size coincides closely with the size of the church district
(Table A2, column 3). 14
Results are qualitatively the same when the sample is restricted to the initially observed 25 cities (Table A2,
column 1). For 32 observations, church attendance values were imputed from neighboring years by linear
interpolation (see Data Appendix). Results are also robust when dropping these observations (Table A2, column 2).

8
where denotes participations in Holy Communion per Protestant population, and denote
fixed effects for city (i) and time (t), respectively, is advanced-school enrollment per city
population, is a set of covariates, and is an error term. Our parameter of interest is . In
the baseline fixed effects specification, the covariates include municipal tax revenues (a proxy
for income) and city population (a proxy for urbanization). In a pooled OLS specification that
replicates the cross-sectional nature of existing studies, the city fixed effects are replaced by a
dummy that indicates whether the city ever belonged to Prussia and the share of Protestants (in
1910, the only year for which this highly stable measure is available at the city level).
The inclusion of city fixed effects addresses potential omitted variable bias from unobserved
time-invariant city characteristics. The inclusion of time fixed effects addresses potential bias
from nation-wide common trends in the variables of interest. The remaining question is whether
such identification from city-specific variation over time can be given a causal interpretation.
Our analysis does not directly model exogenous variation and hence cannot unequivocally claim
causal inference. Although we cannot fully exclude the possibility of bias from reverse causality,
regressions with lagged explanatory variables indicate that we capture an effect from education
to religiosity, and not vice-versa. The estimates would still be biased if there were omitted
variables whose city-specific change over time correlates with changes in the two variables of
interest. For example, systematic changes in the composition of a city’s population would not be
captured in the fixed effects. However, additional controls for changes in the demographic
composition of the city – age structure, gender structure, and recent migration – included in
robustness specifications do not alter our results. In our historical data, measurement error in the
independent variables is also likely to attenuate coefficient estimates towards zero; in this sense,
our estimates are, if anything, conservative.
5. Results
Using the cross-sectional dimension of our data, columns 1 and 2 of Table 2 replicate the
common finding from the literature that education is significantly positively associated with
church attendance in the cross-section, both in the full 1890-1930 period and before World War
I. In the pooled OLS estimation with year fixed effects, an advanced-school enrollment rate that
is higher by one standard deviation is associated with 3.9 percentage points (or 0.28 standard

9
deviations) higher church attendance in 1890-1930. This positive association is easily visible in a
simple scatterplot depicted in panel (a) of Figure 1 for the example of the year 1900.
However, when using only within-city variation over time in a panel model with city and
year fixed effects, this result is turned around (columns 3-4). Increases in education are now
significantly negatively related to changes in church attendance.15
This pattern is in line with the
traditional view that education leads to secularization. In the panel fixed effects estimation, an
increase in the advanced-school enrollment rate by one standard deviation is related to a decrease
in church attendance by roughly 1.5 percentage points (or 0.10 standard deviations), in both the
full and the pre-WW I sample.16
This negative association between changes in education and in
church attendance is again easily visible in the scatterplot, depicted in panel (b) of Figure 1 for
the pre-WW I period. To put the magnitude in perspective, consider the 24 cities observed both
in 1890 and in 1913: If, rather than their actual mean change in education, they would have only
had the change in education of the city at the 10th
percentile, the reduction in church attendance
would have been 1.3 percentage points smaller. This would account for about one quarter of the
actual mean reduction in church attendance of 4.6 percentage points.
The change in the sign of the estimated effect between the cross-sectional and the fixed
effects model is consistent with the presence of unobserved time-invariant city-specific
characteristics that give rise to a positive correlation in cross-sectional regressions. For instance,
a city’s population may have historically been of more conservative attitude, putting a stronger
emphasis on educational attainment as well as on institutionalized religiosity – hence the initial
positive correlation. However, with an increase in advanced-school enrollment, also these cities
witnessed a drop in church attendance over time.
Interestingly, education is the only measure of modernization that yields sizeable and
significant estimates. Although municipal tax revenue may be an imprecise proxy for income,
the positive point estimate casts doubt on the hypothesis that income adversely affected
religiosity. This is in line with Becker and Woessmann (2013) who find that, once fixed effects
15
We understand our education measure – the number of advanced-school students as a share of the total city
population – as an indicator of the inclination of families towards advanced education. Due to diverse obstacles to
actual enrollment such as school fees, this number is likely a truncated measure of the latent propensity to enroll. 16
The estimate for the post-WW I period (not shown) is only about half as large (in absolute terms) and does
not reach statistical significance. The within-city variation explained by the regressors drops by nearly half in the
post-WW I model, possibly reflecting the large disturbances in society due to the war. For example, Hölscher (2001)
reports that society’s trust in the clergy collapsed after WW I throughout Germany. However, the weaker finding in
the post-WW I sample might also reflect that this sample includes only two waves of data.

10
are included, there is no significant effect of income on religious participation. Similarly, the size
of the city population as a proxy of urbanization is not significantly related to church attendance.
When adding the lagged enrollment variable to the model, both enrollment measures have
negative coefficients, but the lagged variable is about twice as large in absolute terms and is the
only one capturing statistical significance (columns 5-6). This pattern is in line with a causal time
pattern where increased enrollment in advanced schools is followed by subsequent decreases in
church attendance. By contrast, lagged church attendance does not significantly predict
enrollment rates (not shown). Finally, first-differenced models that regress the change in church
attendance from 1890 to 1913/1930 on the change in the explanatory variables over the same
time, although based on small samples, confirm the panel fixed effects models (columns 7-8).
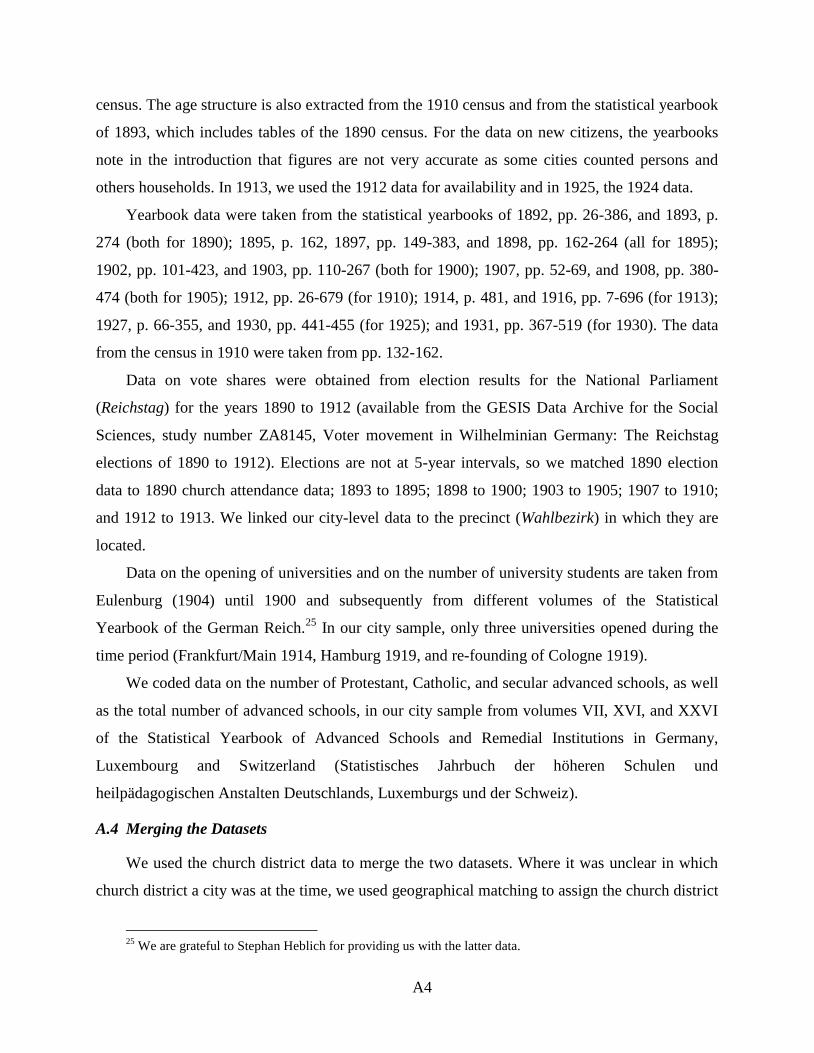
6. Robustness Analyses
A factor often argued to be relevant for religious participation is the age of a person (e.g.,
Azzi and Ehrenberg (1975)). To control for this potential influence, column 1 of Table A1 in the
Appendix includes measures of a city’s age structure, namely the shares of under-20-year-olds
and of over-60-year-olds. Despite being available only for the census years 1890 and 1910,
results in a sample of 46 observations leave the effect of education qualitatively unchanged and
even larger.17
Both age measures have the expected sign but are statistically insignificant.
While conceptually, the share of advanced-school students in the entire city population is
our preferred indicator of a city’s educational and scientific orientation, in this smaller sample
we can also calculate the enrollment rate as a fraction of under-20-year-olds. Using this variable
leaves the significant negative coefficient on education unaffected, indicating that our results are
robust to this change in the measure of education (column 2).18
Traditionally, women participated more regularly in church activities, possibly because of
lower opportunity costs (Azzi and Ehrenberg (1975)). When including the share of females in the
model, our result remains robust and the female share is insignificant (column 3).
17
The specification includes a dummy for Kassel in 1910, an outlier in this specification. 18
Because the within-variation of the share of under-20-year-olds in a city is small (standard deviation of 0.01
vs. 0.05 between), we conducted the same exercise using a city’s share of under-20-year-olds in 1890 or 1910 for all
observations. Hence, for the sake of the argument, we assumed there was no within-variation at all in the share of
young people. Both alternative measures yield smaller, but significantly negative estimates.

11
To account for possible effects of migration on church attendance, we include the share of
recently arrived citizens in a city (column 4). The coefficient on the share of new citizens is
insignificant and small, while the coefficient on education is qualitatively unaffected.
Activities in secular associations might have increasingly crowded out participation in
church activities during our period of observation. However, when including the vote share for
social-democratic parties in national elections over time as a proxy for the strength of alternative
secular movements, results on our main coefficient of interest are unaltered and the vote share
for social-democratic parties is itself statistically insignificant (column 5).19
To ensure that results are not related to foundations of new universities in the cities, column
6 controls for an indicator for openings of new universities, as well as for the share of university
students in the city population. Neither enters the model significantly, and the coefficient on the
enrollment rate in advanced schools remains qualitatively unaffected.
During our period of observation, some advanced schools changed from being religiously
affiliated into non-religious schools.20
To the extent that this entailed a change towards a less
religious curriculum, our main effect might capture a change in curriculum and educational
content rather than an increase in education per se (e.g., Franck and Iannaccone (2014)).
However, when including the share of Protestant advanced schools in a city as an additional
control, it does not enter the model significantly and does not qualitatively change our main
result (column 7).21
Results also prove robust in different subsamples. They are qualitatively unaffected in the
sample of the 25 cities already observed in 1890 (Table A2, column 1). Results are also robust
when dropping the 32 observations whose church attendance data were imputed by linear
interpolation (column 2). We further test the robustness of our results to discrepancies in the
number of Protestants between the church district and the city in 1910 (the only year for which
both measures are available). In a subsample of cities whose size was close to that of the church
19
The same qualitative results are obtained when controlling for the vote share of all left-leaning parties (not
shown). 20
In our data, the average number of advanced schools hardly changed between 1885 and 1905 (average
increase of 0.13 schools per city), but the number of Protestant schools decreased by an average of 0.38 schools,
whereas the number of secular schools increased by an average of 0.55 schools (the difference being made up by an
average decrease of Catholic schools of 0.05). 21
Similarly, the share of Catholic or secular advanced schools does not enter the model significantly or change
our main result. The same is true for the total number of advanced schools, indicating that our result does not
capture an effect of increased supply of advanced schools, but rather a demand-side effect.
12
district, the education coefficient remains qualitatively unchanged (column 3). Over time, new
advanced schools may have been set up in medium-sized cities in the neighborhood of the large
cities included in our sample, pulling medium-city students out of the large-city advanced
schools that they had previously attended.22
To test that results are not driven by such changes,
we exclude all cities situated in urban regions, restricting the analysis to only those cities situated
in rural regions or regions with rudiments of suburbanization (Regionen mit Verstädterungs-
ansätzen);23
results hold (column 4).24
Finally, when we split the sample along the share of Protestants in the city in the census year
1910 (columns 5-8), we find that the result is largely the same in cities with a Protestant majority
and minority. In cities that are overwhelmingly Protestant, the coefficient is still negative and
large, but loses statistical significance. This may reflect the reduced sample size, but it may also
indicate that determinants of demand decreases like education play a lesser role in cities with a
very large Protestant share because social pressure motives make it more common that people
attend church as an investment in social capital (Hölscher (2005)).
7. Conclusion
Despite extensive academic debates, there is fairly little empirical evidence on the sources
of secularization during its crucial phase in European history. To overcome potential bias in
existing cross-sectional analyses of the association between education and secularization, we
constructed a unique panel dataset of German cities between 1890 and 1930 that has not been
analyzed so far. Using cross-sectional methods, we replicate the existing finding that education
and church attendance are positively correlated. But the finding turns around when city fixed
effects control for time-invariant city characteristics.
22
This may also explain why the average share of advanced-school students in the total population does not
increase on average in our city sample, although it does increase steadily in the German Reich at least since 1895
(Müller (1987)). Still, the absolute number of students more than doubled in our city sample from 1890 to 1930. 23
These classifications are based on the modern classification of regions (Siedlungsstrukturelle Regionstypen)
by the Federal Institute for Research on Building, Urban Affairs and Spatial Development; given the long-run
process of urbanization, this restricts the sample even further than would be required by historical standards. 24
Results are also robust to dropping Berlin, by far the largest city in the sample (not shown). As additional
robustness checks, we included dummy variables for structural breaks in municipal borders, such as when smaller
neighboring towns were incorporated into Berlin before the 1925 observation and into several cities in the Ruhr area
before 1930; qualitative results are unaffected (not shown). Furthermore, to test that results are not driven by jumps
due to measurement error in the data, we included dummy variables for periods whenever particularly large changes
occurred in the variable of interest between two points in time, such as upward or downward jumps of 50 percent, 30
percent, or even only 20 percent; results are fully robust, and if anything, point estimates become larger, as would be
expected by classical measurement error theory (not shown).

13
This result suggests that the reason why the vast majority of the existing empirical literature
in both sociology and economics rejects the traditional view that education led to secularization
may well be due to its cross-sectional nature. When using within-city variation over time in panel
fixed effects models, our evidence appears to resurrect the traditional view. The stark contrast
between cross-sectional and panel evidence, the robustness of the result in several sensitivity
analyses, and the fact that increases in education precede declines in church attendance suggest
that it may be too soon to lay the traditional view of secularization hypotheses to rest, after all.
The results do not imply that advanced scientific knowledge is incompatible with belief in
God or that education is generally hostile to religious participation. They simply show that, in
this historical setting, increased advanced schooling was related to declining church attendance,
an indication of secularization understood as the loss of influence of the organized church.
Education may well have led people who believe in God to break with the institution of the
church, without weakening their belief in God. It is also possible that, for example, people who
did not have a strong belief in God in the first place were led by education to abandon their
custom to attend church. Still, the results show that increases in education were closely related to
people’s reduced active involvement with the institutionalized church and its rituals, one of the
most seismic changes in social history since the 19th
century.

14
References
Azzi, Corry, and Ronald Ehrenberg. 1975. "Household allocation of time and church
attendance." Journal of Political Economy 83, no. 1: 27-56.
Becker, Sascha O., and Ludger Woessmann. 2009. "Was Weber wrong? A human capital theory
of Protestant economic history." Quarterly Journal of Economics 124, no. 2: 531-596.
Becker, Sascha O., and Ludger Woessmann. 2013. "Not the opium of the people: Income and
secularization in a panel of Prussian counties." American Economic Review, Papers and
Proceedings 103, no. 3: 539-544.
Berger, Peter L. 1996. "Secularism in retreat." National Interest 46, Winter: 3-12.
Bloom, Paul. 2007. "Religion is natural." Developmental Science 10, no. 1: 147-151.
Brown, Sarah, and Karl Taylor. 2007. "Religion and education: Evidence from the National Child
Development Study." Journal of Economic Behavior and Organization 63, no. 3: 439-460.
Deaton, Angus S. 2011. "Aging, religion, and health." In Explorations in the economics of aging,
edited by David A. Wise. Chicago, IL: University of Chicago Press: 237-268.
Deutscher Städtetag. 1931. Statistisches Jahrbuch Deutscher Städte. 26. Jahrgang. Jena: Gustav
Fischer.
Eulenburg, Franz. 1904. Die Frequenz der deutschen Universitäten von ihrer Gründung bis zur
Gegenwart, Reprint 1994. Berlin: Akademie Verlag.
Finke, Roger, and Laurence R. Iannaccone. 1993. "Supply-side explanations for religious
change." Annals of the American Academy of Political and Social Science 527: 27-39.
Finke, Roger, and Rodney Stark. 1992. The churching of America, 1776-1990: Winners and
losers in our religious economy. New Brunswick, NJ: Rutgers University Press.
Franck, Raphaël. 2010. "Economic growth and the separation of church and state: The French
case." Economic Inquiry 48, no. 4: 841-859.
Franck, Raphaël, and Laurence R. Iannaccone. 2014. "Religious decline in the 20th century
West: Testing alternative explanations." Public Choice: forthcoming.
Freud, Sigmund. 1927 [1961]. The future of an illusion. New York: W. W. Norton.
Gervais, Will M., and Ara Norenzayan. 2012. "Analytic thinking promotes religious disbelief."
Science 336, no. 6080: 493-496.
Glaeser, Edward L., and Bruce I. Sacerdote. 2008. "Education and religion." Journal of Human
Capital 2, no. 2: 188-215.
Gruber, Jonathan, and Daniel M. Hungerman. 2008. "The Church vs. the Mall: What happens
when religion faces increased secular competition." Quarterly Journal of Economics 123,
no. 2: 831-862.
Hadaway, C. Kirk, Penny Long Marler, and Mark Chaves. 1998. "Overreporting church
attendance in America: Evidence that demands the same verdict." American Sociological
Review 63, no. 1: 122-130.
Hölscher, Lucian. 2001. Datenatlas zur religiösen Geographie im protestantischen Deutschland:
Von der Mitte des 19. Jahrhunderts bis zum Zweiten Weltkrieg. 4 vols. Berlin: Walter de
Gruyter.
Hölscher, Lucian. 2005. Geschichte der protestantischen Frömmigkeit in Deutschland. Munich:
C.H.Beck.

15
Hume, David. 1757 [1993]. The natural history of religion. Oxford: Oxford University Press.
Hungerman, Daniel M. 2011. "The effect of education on religion: Evidence from compulsory
schooling laws." NBER Working Paper 16973. Cambridge, MA: National Bureau of
Economic Research.
Iannaccone, Laurence R. 1998. "Introduction to the economics of religion." Journal of Economic
Literature 36, no. 3: 1465-1496.
Kapogiannis, Dimitrios, Aron K. Barbey, Michael Su, Giovanna Zamboni, Frank Krueger, and
Jordan Grafman. 2009. "Cognitive and neural foundations of religious belief." Proceedings
of the National Academy of Sciences 106, no. 12: 4876-4881.
Lipford, Jody W., and Robert D. Tollison. 2003. "Religious participation and income." Journal
of Economic Behavior and Organization 51, no. 2: 249-260.
Marx, Karl. 1844. "Zur Kritik der Hegel'schen Rechtsphilosophie: Einleitung." In Deutsch-
Französische Jahrbücher, edited by Arnold Ruge and Karl Marx. Paris: Bureau der
Jahrbücher: 71-85.
McCleary, Rachel M., and Robert J. Barro. 2006a. "Religion and economy." Journal of
Economic Perspectives 20, no. 2: 49-72.
McCleary, Rachel M., and Robert J. Barro. 2006b. "Religion and political economy in an
international panel." Journal for the Scientific Study of Religion 45, no. 2: 149-175.
Meyersson, Erik. 2014. "Islamic rule and the emancipation of the poor and pious."
Econometrica: forthcoming.
Müller, Detlef K. 1987. Datenhandbuch zur deutschen Bildungsgeschichte. Band II: Höhere und
mittlere Schulen. 1. Teil: Sozialgeschichte und Statistik des Schulsystems in den Staaten des
Deutschen Reiches, 1800-1945. Göttingen: Vandenhoeck und Ruprecht.
Neefe, M. 1892. Statistisches Jahrbuch Deutscher Städte. Zweiter Jahrgang. Breslau: Verlag
von Wilh. Gottl. Korn.
Nipperdey, Thomas. 1988. "Religion und Gesellschaft: Deutschland um 1900." Historische
Zeitschrift 246, no. 3: 591-615.
Ruiter, Stijn, and Frank van Tubergen. 2009. "Religious attendance in cross-national perspective:
A multilevel analysis of 60 countries." American Journal of Sociology 115, no. 3: 863-895.
Sander, William. 2002. "Religion and human capital." Economics Letters 75, no. 3: 303-307.
Shenhav, Amitai, David G. Rand, and Joshua D. Greene. 2012. "Divine intuition: Cognitive style
influences belief in God." Journal of Experimental Psychology 141, no. 3: 423-428.
Sherkat, Darren E., and Christopher G. Ellison. 1999. "Recent developments and current
controversies in the Sociology of Religion." Annual Review of Sociology 25: 363-394.
Stark, Rodney, and Laurence R. Iannaccone. 1994. "A supply-side reinterpretation of the
"secularization" of Europe." Journal for the Scientific Study of Religion 33, no. 3: 230-252.
Weber, Max. 1904 [2001]. The Protestant ethic and the spirit of capitalism. London: Routledge
Classics.
Woodberry, Robert D. 1998. "When surveys lie and people tell the truth: How surveys
oversample church attenders." American Sociological Review 63, no. 1: 119-122.

A1
Data Appendix
A.1 Data on Enrollment in Advanced Schools
Our main measure of the enrollment rate in advanced schools is calculated as the number of
students enrolled in advanced schools as a share of the city population. Consecutive volumes of
the Statistical Yearbooks of German Cities (Neefe (1892) through Deutscher Städtetag (1931))
report data on enrollment in advanced schools (Höhere Unterrichts-Anstalten). The yearbooks
cover all German cities with a population of over 50,000 inhabitants, providing data on up to 61
German cities observed over eight waves that cover every five years from 1890 to 1930.
Exceptions due to the interruptions of World War I are that there are no data for 1920 and that
1913 values are used instead of 1915. When sub-district values of a city are reported, we use the
joint value. Where the yearbooks in some cases provide values of adjacent years (while other
values in the table are reported for the actual year), we use these values. If data were reported as
double years, e.g., 1892/93, we chose the first year of a double year where differences were
minor and the available value if the year of interest was only reported once.
When only the number of male students is reported in a given year but both male and female
students are reported in adjacent years, we estimate the number of female students in the year of
interest by assuming that the relative share of male and female students remained constant
relative to the adjacent year (four cases in 1890, one in 1900). If the variation over time was
large and values appeared not comparable, we refrained from doing so. Where every measure
was missing in one year, we took the adjacent year’s value. This occurred in the 1895 sample, for
which we took the values of the school year 1893/94 (also one case in 1913; two cases in 1895
have values from 1896/97). Where it was not possible to use adjacent years, we used the average
relative size of female to male students (one case in 1930). Where outliers were obtained, we
refrained from imputing the number of students.
In several waves, enrollment data are reported by school type (e.g., municipal vs. state
schools). Where one of the parts was indicated as missing, we treated the entire value as missing.
We do not include so-called pre-schools (Vorschulen), which are sometimes connected with
advanced schools, in our measure. The separation is generally possible for male students,
whereas pre-schools are not separately indicated for female students. The relatively low share of
students relative to the city population in 1925 is pointed out in the 1927 yearbook’s introduction
and justified by small birth cohorts between 1915 and 1918, during World War I.

A2
A.2 Data on Church Attendance
Our measure of church attendance stems from an exceptional database that “unlocks source
material that is internationally unique in its scope and historical depth: the statistical surveys of
the Protestant Regional Churches of Germany on the Expressions of Churchly Life” (Hölscher
(2001), p. 29). The uniform annual surveys were organized by the Statistical Central Office at the
Protestant Higher Church Council in Berlin from 1880 (with precursors) to World War II. Parish
priests collected the data on preprinted forms following uniform surveying directives. Regional
Consistories combined these parish data into registers at the level of church districts.
Our main indicator of church attendance is the “sacrament participation” (Hölscher (2001)),
measured as the number of participations in Holy Communion divided by the number of
Protestants in a church district. Counting sacrament participations is deemed relatively reliable
because the established practice was to count the number of issued wafers from the number of
wafers before and after the sacrament. The general Protestant norm at the time was to have Holy
Communion only once a year (Hölscher (2001), p. 37), although there were regional differences.
The possibility of multiple individual attendances, the possibility of attending Holy Communion
outside the home parish, and the counting of non-confirmed children among the number of
Protestants in the denominator constitute reasons why the indicator does not directly measure the
actual sacrament participation of parishioners (see Becker and Woessmann (2013)).
At the time, the data were regularly published in a comparative manner at the level of the
Regional Churches. Hölscher (2001)’s “Data Atlas on the Religious Geography in Protestant
Germany: From the Mid-19th
Century to the Second World War” for the first time brings
together the district-level data, gathered from regional archives, for the geographic coverage of
modern Germany. Hölscher kindly provided us with digital versions of the data as published in
the Data Atlas. After assigning IDs to every church district (Kirchenkreis) and cross-checking
the data, we combined the data into one panel dataset. In few cases where data referred to double
years, we assigned attendance numbers to the first of the double year.
The church attendance data have gaps for some church districts in some years. Where the
year of interest was unavailable but a precedent and a subsequent year were available, we
computed the linear interpolation between the years available to obtain an estimate of the church
attendance in the year of interest. This was done in a total of 17 observations (3 in 1890, 4 in
1900, 1 in 1905, 3 in 1910, 1 in 1913, 1 in 1925, and 4 in 1930). Where only the precedent year,

A3
only subsequent years, or years very far from the point of time of interest were available, we
computed a city-specific linear time trend and interpolated the closest available church
attendance measure to the year of interest. This was applied in 30 church district observations
translating to 34 city-year observations (9 in 1890, 4 in 1895, 1 in 1900, 2 in 1905, 4 in 1910, 3
in 1913, 4 in 1925, and 7 in 1930). Of the 51 imputed dependent variables, 36 enter the merged
dataset. Of these 36 observations, 32 enter our regression analyses. When dropping all
observations that have an imputed dependent variable, the number of observations that can be
used in the regression drops to 259; the coefficient of education remains qualitatively unaffected
in this smaller sample (Table A2, column 2).
Some notable changes occurred in the borders of church districts. Where a city changed
districts, we assigned the district value in which the city was at the point of time. For the values
of the number of Protestants in a church district taken from Hölscher (2001), we proceeded
analogously to the imputation of church attendance. Where the value for either Protestants or
church attendance was available and the other one was missing, we took the reported value and
imputed the other one, where possible.
A.3 Additional Data
The Statistical Yearbooks of German Cities provide a number of additional data used in our
analyses. As an indicator of city income, we use municipal tax revenues, which refer to total
municipal tax revenues (Gemeindesteuereinnahmen Gesamt) in a city in a year. Because
numbers were unavailable for 1925, we used the 1927 values, the first year after the year of
interest in which tax revenues were available. Again, if double years were reported, we chose the
first year where differences were minor. Where some of the entries were reported as double and
others as single years, we took the single-year values where possible.
As a general rule, the population data are taken from the December count. This was not
applicable in 1913, where we used the latest possible population data, from October 1913, to be
as close as possible to the December standard. In 1925, the only population count available was
from June. In 1930, only the average value over the entire year was available. If census data were
available, we referred to this data source (in 1890, 1895, and 1910). The same sources also
provide data on the share female.
The data on share of Protestants in 1910 were taken from the 1910 census. Where data were
missing for the share of Protestants in 1910 in the yearbooks, we took the value of the 1910
A4
census. The age structure is also extracted from the 1910 census and from the statistical yearbook
of 1893, which includes tables of the 1890 census. For the data on new citizens, the yearbooks
note in the introduction that figures are not very accurate as some cities counted persons and
others households. In 1913, we used the 1912 data for availability and in 1925, the 1924 data.
Yearbook data were taken from the statistical yearbooks of 1892, pp. 26-386, and 1893, p.
274 (both for 1890); 1895, p. 162, 1897, pp. 149-383, and 1898, pp. 162-264 (all for 1895);
1902, pp. 101-423, and 1903, pp. 110-267 (both for 1900); 1907, pp. 52-69, and 1908, pp. 380-
474 (both for 1905); 1912, pp. 26-679 (for 1910); 1914, p. 481, and 1916, pp. 7-696 (for 1913);
1927, p. 66-355, and 1930, pp. 441-455 (for 1925); and 1931, pp. 367-519 (for 1930). The data
from the census in 1910 were taken from pp. 132-162.
Data on vote shares were obtained from election results for the National Parliament
(Reichstag) for the years 1890 to 1912 (available from the GESIS Data Archive for the Social
Sciences, study number ZA8145, Voter movement in Wilhelminian Germany: The Reichstag
elections of 1890 to 1912). Elections are not at 5-year intervals, so we matched 1890 election
data to 1890 church attendance data; 1893 to 1895; 1898 to 1900; 1903 to 1905; 1907 to 1910;
and 1912 to 1913. We linked our city-level data to the precinct (Wahlbezirk) in which they are
located.
Data on the opening of universities and on the number of university students are taken from
Eulenburg (1904) until 1900 and subsequently from different volumes of the Statistical
Yearbook of the German Reich.25
In our city sample, only three universities opened during the
time period (Frankfurt/Main 1914, Hamburg 1919, and re-founding of Cologne 1919).
We coded data on the number of Protestant, Catholic, and secular advanced schools, as well
as the total number of advanced schools, in our city sample from volumes VII, XVI, and XXVI
of the Statistical Yearbook of Advanced Schools and Remedial Institutions in Germany,
Luxembourg and Switzerland (Statistisches Jahrbuch der höheren Schulen und
heilpädagogischen Anstalten Deutschlands, Luxemburgs und der Schweiz).
A.4 Merging the Datasets
We used the church district data to merge the two datasets. Where it was unclear in which
church district a city was at the time, we used geographical matching to assign the church district
25
We are grateful to Stephan Heblich for providing us with the latter data.

A5
in which the city was in 1910. Where cities changed in their adherence to a church district, we
used the largest available district for clustering and assigned the fraction of communion attenders
of the church district in which the city was at the specific point in time.
If a city’s value was reported in more than one data point (e.g., large cities where the church
district was split into urban and rural districts), we used the largest church district related to the
city (that is, the urban one). In cases in which the split and merge of church districts was unclear,
we refrained from using the data. Hölscher (2001) reports data for modern Germany, with the
exception of the Province of Brandenburg (except for Berlin) and Western Pomerania. Due to
this limitation, our analysis does not cover some Eastern parts of modern Germany and the parts
of the German Reich not located in modern Germany (esp. the Eastern Provinces located in
modern Poland and Russia).
TABLE A1: ROBUSTNESS CHECKS: AGE, GENDER, MIGRATION, SECULAR MOVEMENTS, UNIVERSITIES, AND SECULAR SCHOOLS
Enrollment rate: Per city
population
Per under-
20-year-olds Per city population
(1) (2) (3) (4) (5) (6) (7)
Enrollment rate in advanced schools -4.191* -1.837
* -1.671
** -1.164
** -1.864
* -1.612
*** -3.226
**
(2.250) (0.888) (0.767) (0.560) (0.945) (0.532) (1.303)
Municipal tax per capita 0.001 0.001 -0.0001 -0.00006 0.0009 0.00002 0.0016
(0.002) (0.002) (0.0004) (0.0003) (0.0008) (0.0003) (0.0017)
Population (in millions) 0.052 0.043 0.011 0.009 0.074 0.009 -0.023
(0.063) (0.062) (0.012) (0.011) (0.057) (0.011) (0.064)
Share under 20 year olds -0.160 -0.422
(0.492) (0.449)
Share over 60 year olds 1.349 1.275
(0.993) (0.982)
Share female 0.161
(0.246)
Share new citizens -0.009
(0.087)
Share social-democratic votes 0.009
(0.095)
Foundation of university 0.014
(0.012)
Enrollment rate in universities 0.093
(1.304)
Share of Protestant advanced schools -0.044
(0.034)
City and year fixed effects yes yes yes yes yes yes yes
Observations 46 46 193 257 190 291 73
Clusters 23 23 54 57 47 58 33
R2 (within) 0.673 0.684 0.492 0.465 0.507 0.494 0.368
Dependent variable: church attendance (participations in Holy Communion over Protestants). Unbalanced panel of 61 German cities with over 50,000 inhabitants
observed in eight waves that cover every five years from 1890 to 1930 (no data for 1920; 1913 instead of 1915). Columns 1 and 2: waves 1890 and 1910.
Column 5: waves before WW I. Column 7: waves 1890, 1895, and 1905. Enrollment rate in advanced schools refers to enrolled students over city population; in
column 2, it refers to enrolled students over city population aged below 20 years. Standard errors clustered at the church district level in parentheses: significance
at * 10%,
** 5%,
*** 1%.
Data sources: church attendance: Hölscher (2001) based on Sacrament Statistics; other variables: Statistical Yearbooks of German Cities (Neefe (1892) through
Deutscher Städtetag (1931)).

TABLE A2: ROBUSTNESS SAMPLES AND SAMPLES BY PROTESTANT SHARE
Sample: Cities obser- No Similar Non-urban Above Below Above Below
ved in 1890 imputations district size regions 50% Protestants 75% Protestants
(1) (2) (3) (4) (5) (6) (7) (8)
Enrollment rate in advanced schools -1.310* -1.798
** -1.389
** -1.054
* -1.708
* -0.909
** -0.818 -1.901
**
(0.791) (0.692) (0.624) (0.538) (0.919) (0.425) (0.997) (0.759)
Municipal tax per capita 0.0005 -0.00004 0.0003 -0.0005 0.00007 -0.0005 -0.00009 -0.0001
(0.0005) (0.0003) (0.0004) (0.0008) (0.0006) (0.0003) (0.0008) (0.0003)
Population (in millions) 0.0008 0.008 0.005 0.551***
0.005 0.110* 0.013 0.077
(0.011) (0.011) (0.010) (0.145) (0.011) (0.060) (0.013) (0.056)
City and year fixed effects yes yes yes yes yes yes yes yes
Observations 173 259 223 111 175 116 130 161
Clusters 25 56 49 26 39 19 27 31
R2 (within) 0.501 0.458 0.490 0.719 0.468 0.672 0.595 0.490
Dependent variable: church attendance (participations in Holy Communion over Protestants). Unbalanced panel of 61 German cities with over 50,000 inhabitants
observed in eight waves that cover every five years from 1890 to 1930 (no data for 1920; 1913 instead of 1915). Enrollment rate in advanced schools refers to
enrolled students over city population. Column 1 excludes cities not already observed in 1890. Column 2 excludes observations with imputed dependent variable.
Column 3 excludes cities where the number of Protestants in the church district is more than twice as large as in the city in 1910. Column 4 excludes cities
situated in urban regions. Columns 5-8 divide the sample along the share of Protestants in a city in 1910. Standard errors clustered at the church district level in
parentheses: significance at * 10%,
** 5%,
*** 1%.
Data sources: church attendance: Hölscher (2001) based on Sacrament Statistics; other variables: Statistical Yearbooks of German Cities (Neefe (1892) through
Deutscher Städtetag (1931)).

FIGURE 1: EDUCATION AND CHURCH ATTENDANCE: LEVELS AND CHANGES
(a) Levels, 1900
(b) Changes, 1890-1913
Scatterplots of church attendance against enrollment rate in advanced schools for German cities, (a) 1900 levels and
(b) 1890-1913 changes. Church attendance refers to participations in Holy Communion over Protestants. Enrollment
rate in advanced schools refers to enrolled students over city population.
Data sources: church attendance: Hölscher (2001) based on Sacrament Statistics; enrollment rate in advanced
schools: Statistical Yearbooks of German Cities (Neefe (1892) and following).

TABLE 1: DESCRIPTIVE STATISTICS
Full Sample Estimation Sample
Mean Observations Mean Minimum Maximum
(1) (2) (3) (4) (5)
Church attendance 0.258 386 0.246 0.049 0.738
(0.154) (0.140)
Enrollment rate in advanced schools 0.023 443 0.023 0.006 0.050
(0.008) (0.009)
Municipal tax per capita 33.405 436 32.950 10.747 75.889
(13.145) (12.712)
Population (in millions) 0.208 522 0.247 0.053 4.337
(0.347) (0.433)
Share of Protestants (1910) 0.637 514 0.613 0.077 0.968
(0.293) (0.286)
Prussia 0.625 522 0.601 0 1
(0.485) (0.490)
Observations
291 291 291
Notes: Sample means. Standard deviations in parentheses. Full sample denotes the entire original dataset. Estimation sample denotes the dataset that is used in
the baseline regressions. Church attendance refers to participations in Holy Communion over Protestants. Enrollment rate in advanced schools refers to enrolled
students over city population.
Data sources: church attendance: Hölscher (2001) based on Sacrament Statistics; other variables: Statistical Yearbooks of German Cities (Neefe (1892) through
Deutscher Städtetag (1931)).

TABLE 2: EDUCATION AND CHURCH ATTENDANCE: PANEL ESTIMATES FOR GERMAN CITIES, 1890-1930
Estimation method: Pooled OLS
Fixed effects Fixed effects, lagged
explanatory variable
First difference
Sample period: Full Pre-WW I Full Pre-WW I Full Pre-WW I Full Pre-WW I
(1) (2) (3) (4) (5) (6) (7) (8)
Enrollment rate in advanced schools 4.508***
6.494***
-1.620***
-1.866**
-0.497 -1.152 -2.598 -4.800**
(1.483) (1.860) (0.534) (0.832) (0.574) (0.958) (2.654) (2.183)
Lagged enrollment rate in advanced schools -0.898* -2.051
**
(0.491) (1.017)
Municipal tax per capita -0.002* -0.008
*** 0.00005 0.0009 0.0002 0.0006 0.0004 0.0023
*
(0.001) (0.003) (0.0003) (0.0009) (0.0003) (0.0009) (0.0012) (0.0012)
Population (in millions) -0.016 -0.004 0.009 0.076 0.002 0.051 0.005 0.068
(0.017) (0.023) (0.011) (0.056) (0.011) (0.069) (0.014) (0.081)
Share of Protestants (1910) -0.129* -0.113
(0.068) (0.069)
Prussia -0.076**
-0.087**
(0.034) (0.035)
Year fixed effects yes yes yes yes yes yes no no
City fixed effects no no yes yes yes yes no no
Observations 291 190 291 190 231 142 20 20
Clusters 58 47 58 47 54 42 20 20
R2 (in FE: within) 0.318 0.404 0.493 0.507 0.470 0.548 0.083 0.415
Dependent variable: church attendance (participations in Holy Communion over Protestants). Unbalanced panel of 61 German cities with over 50,000 inhabitants
observed in eight waves that cover every five years from 1890 to 1930 (no data for 1920; 1913 instead of 1915). In columns 7 and 8, all variables refer to the
change between starting point and end point of the period. Enrollment rate in advanced schools refers to enrolled students over city population. Standard errors
clustered at the church district level in parentheses: significance at * 10%,
** 5%,
*** 1%.
Data sources: church attendance: Hölscher (2001) based on Sacrament Statistics; other variables: Statistical Yearbooks of German Cities (Neefe (1892) through
Deutscher Städtetag (1931)).