Embed Size (px)
Citation preview
KMAP BASELINE SURVEYPROFILE OF THE FISH FARMING ENTERPRISES
1
2
OVERVIEW
Background
Survey objectives
Methodology and sample structure
The survey execution
Study sites
Main findings
Key Action Points
BACKGROUNDThe Kenya Market-Led Aquaculture Project (KMAP) is a four-year project funded by the Embassy of the Kingdom of the
Netherlands and implemented by Farm Africa as the lead implementing agency together with 5 other partners including:
PUM (Senior Dutch Experts), Larrive, World Fish Centre, BoP Inc and Wageningen University Center for Development
Innovation (CDI).
KMAP’s overall long term impact is a vibrant aquaculture industry that generates sustainable incomes, food security, and
employment.
The project has three key result areas:
Result area 1: To sustainably increase production and productivity of medium to large scale fish farmers, hatcheries and
fish feed producers
Result area 2: To increase access to markets for medium to large scale fish farmers and input suppliers
Results area 3: To enhance the enabling environment to support aquaculture development.
3

SURVEY OBJECTIVES
The objectives of undertaking this study were:
To generate fish farming baseline & productivity data needed to ensure that project
interventions are designed to achieve positive results.
To establish the level of the project indicators and enable the project set targets that will be
attributable impact to the life of the project
To identify practices and characteristics of aquaculture farmers as well as any existing actors
along the value chain that exist and their roles and operations.
To improve on implementation for better understanding of the farmers and their challenges
4
Quantitative data was collected in 221 fish farms across the 14 KMAP counties using ODK for real time data collection
and GPS data collection.
Purposive sampling was used in the identification of farmers. This methodology was selected based on the fact that
KMAP is not working with just any fish farmer but those who meet the minimum requirements of owning at least
three active ponds, interest and resources available to invest in growing their fish production. Hence, the need to have
data for this specific category of entrepreneurs guided the sampling methodology for use.
As the farmers were being recruited on an ongoing basis, a rolling baseline was also conducted (between June and
October 2016) in line with the recruitment rate.
Once at the enterprises, questionnaires that had been pre-tested were administered to the farmers. Respondents at
the farms were majorly the farm owners. However, in their absence and with their approval, farm managers/ relatives
who were aware and involved in the daily operations of the fish farm were interviewed.
The survey achieved an overall 221 respondents. Since KMAP’s target beneficiaries is 1,100 farmers, this sample at
90% confidence level gives a margin of error of 4.9%.
Methodology & Sample Structure
5
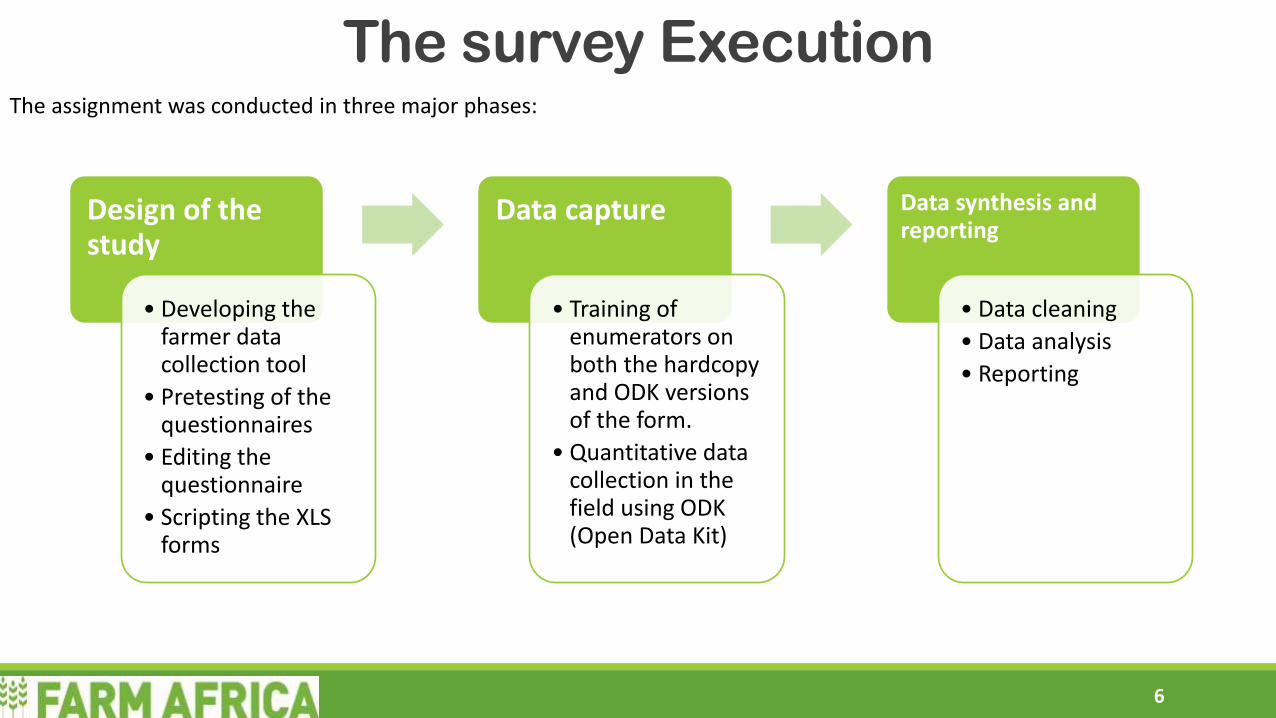
The survey Execution
Design of the study
• Developing the farmer data collection tool
• Pretesting of the questionnaires
• Editing the questionnaire
• Scripting the XLS forms
Data capture
• Training of enumerators on both the hardcopy and ODK versions of the form.
• Quantitative data collection in the field using ODK (Open Data Kit)
Data synthesis and reporting
• Data cleaning
• Data analysis
• Reporting
The assignment was conducted in three major phases:
6

Study Sites
The Study was conducted in the 14
counties where KMAP program is
implemented.
GPS information was collected from the
different sites.
The spread of farmers interviewed is as
shown in the map.
7

To enable the computation of gross margins from a complete cycle, the baseline survey was based on recall data
from the farmers’ previous production cycles (with some recall dating back as far as 4 years) . Though production
and sales data have been computed in this study, we do appreciate that recall data may sometimes be over/
under reported and therefore based on this, the production and sales figures will be verified against the data
collected in Q1 and Q2.
Further need to clarify this is based on the fact that only 29% of the farmers reported having a weighing scale
indicating that the sales volumes for the majority was based on estimates. Hence, we need the data to be
compared against verifiable production in the first quarter of monitoring.
Limitation
8
To counter the limitation stated in slide 8, this report was further updated in July 2017 to factor in more verifiable
data that was gathered from farms that were yet to harvest during the baseline (period of February – April 2017).
Close monitoring was carried out and data was gathered from 62 farms spread across the KMAP counties that
recorded to have harvested during this period.
Though, the descriptive analysis on the demographics remains the same, production data was what was
confirmed and updated. The annul production reported on slide 21 is hence an updated representative and much
more true indication of the production capacities before KMAP intervention on the farmers as they were able to
give much more accurate information from real-time harvests.
UPDATE
9
KEY FINDINGS
10

Summary on enterprisesTotal/ Average Male Female Institution
No. of enterprises Surveyed 221 163 45 13
Number of Tilapia farmers 220 163 44 13
Number of Catfish Farmers 82 58 18 6
Size of farms/ Average area of all ponds per
enterprise (in m2)1,887 1,805 1,847 2,968
Average pond size (in m2) 296 308 238 344
Average number of ponds owned 7 6 7 8
Average number of ponds stocked with tilapia 3 3 3 7
Average number of ponds stocked with catfish 2 2 3 0
11
2 3 4
7 7
1213
1517
1819
30
35
39
0
5
10
15
20
25
30
35
40
45
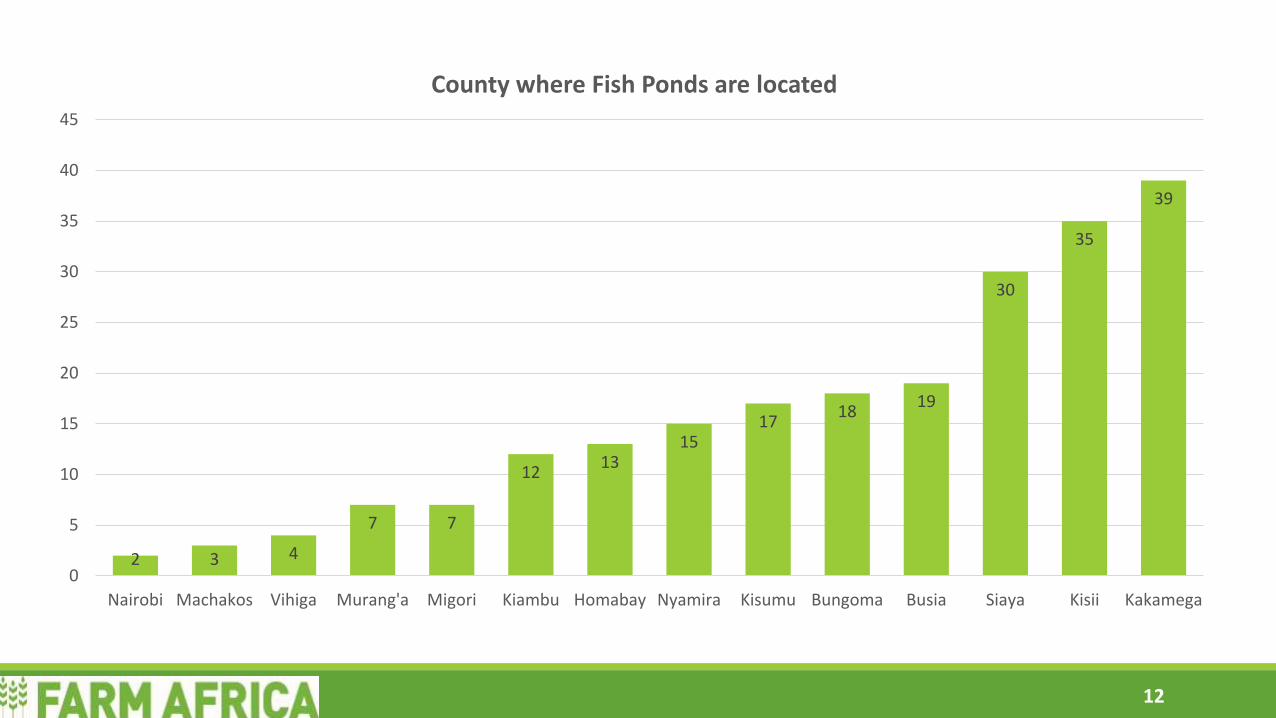
Nairobi Machakos Vihiga Murang'a Migori Kiambu Homabay Nyamira Kisumu Bungoma Busia Siaya Kisii Kakamega
County where Fish Ponds are located
12
Male Owned73%
Female Owned
21%
Institutions6%
WHAT IS THE GENDER OF THE OWNER OF THE FISH FARM ENTERPRISE?
Male owner60%
Female owner10%
Family Property
18%
Corporate Land6%
leased land -Male farm
5%
leased land -institution farm
1%
WHO OWNS THE LAND WHERE THE FISH PONDS ARE LOCATED?
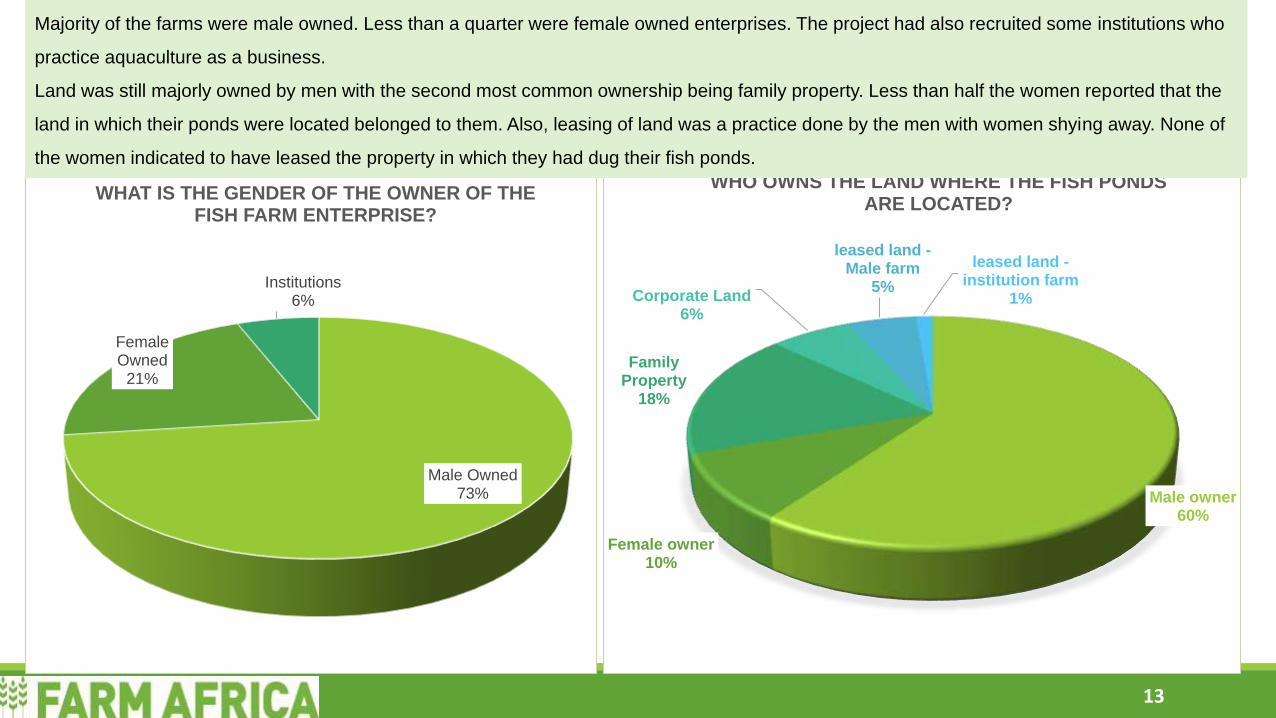
Majority of the farms were male owned. Less than a quarter were female owned enterprises. The project had also recruited some institutions who
practice aquaculture as a business.
Land was still majorly owned by men with the second most common ownership being family property. Less than half the women reported that the
land in which their ponds were located belonged to them. Also, leasing of land was a practice done by the men with women shying away. None of
the women indicated to have leased the property in which they had dug their fish ponds.
13
0
10
20
30
40
50
60
70
1 2 3 4 5 6 7 8 9 10 11 12 13 14 15 16 17 18 20 21 22 30 87
Nu
mb
er o
f fa
rmer
s
Number of ponds owned
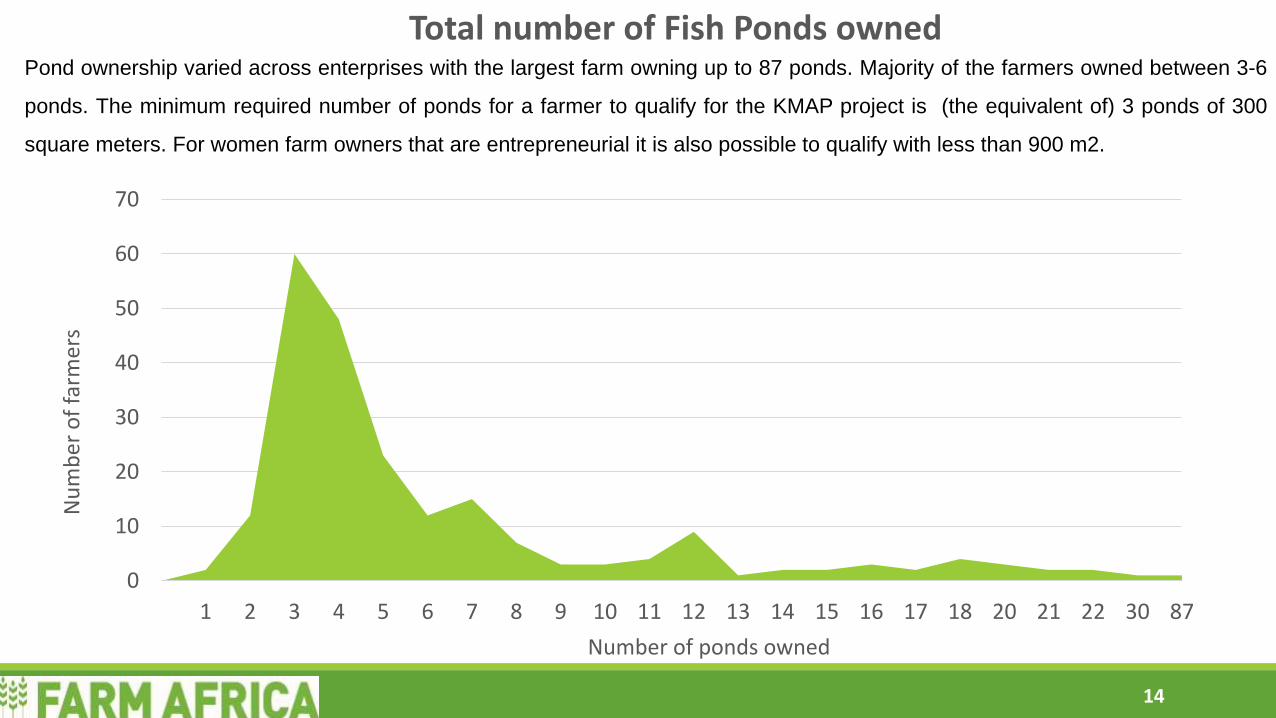
Pond ownership varied across enterprises with the largest farm owning up to 87 ponds. Majority of the farmers owned between 3-6
ponds. The minimum required number of ponds for a farmer to qualify for the KMAP project is (the equivalent of) 3 ponds of 300
square meters. For women farm owners that are entrepreneurial it is also possible to qualify with less than 900 m2.
Total number of Fish Ponds owned
14
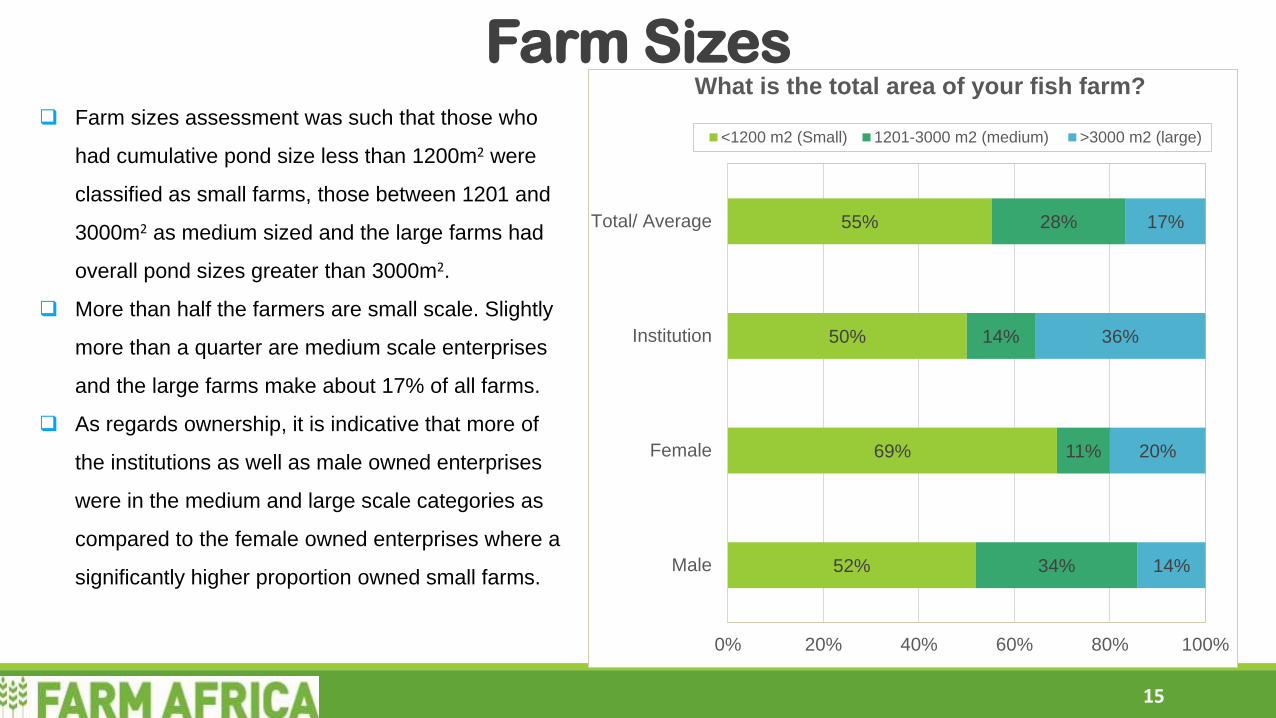
Farm sizes assessment was such that those who
had cumulative pond size less than 1200m2 were
classified as small farms, those between 1201 and
3000m2 as medium sized and the large farms had
overall pond sizes greater than 3000m2.
More than half the farmers are small scale. Slightly
more than a quarter are medium scale enterprises
and the large farms make about 17% of all farms.
As regards ownership, it is indicative that more of
the institutions as well as male owned enterprises
were in the medium and large scale categories as
compared to the female owned enterprises where a
significantly higher proportion owned small farms.
Farm Sizes
15
52%
69%
50%
55%
34%
11%
14%
28%
14%
20%
36%
17%
0% 20% 40% 60% 80% 100%
Male
Female
Institution
Total/ Average
What is the total area of your fish farm?
<1200 m2 (Small) 1201-3000 m2 (medium) >3000 m2 (large)
1%4%
44%
51%
0%
10%
20%
30%
40%
50%
60%
18-24 yrs 25-35 yrs 36-55 yrs 56+ yrs
Age of Entreprise Owners
0
5
10
15
20
25
30
35
In which year was the fish farming business started?
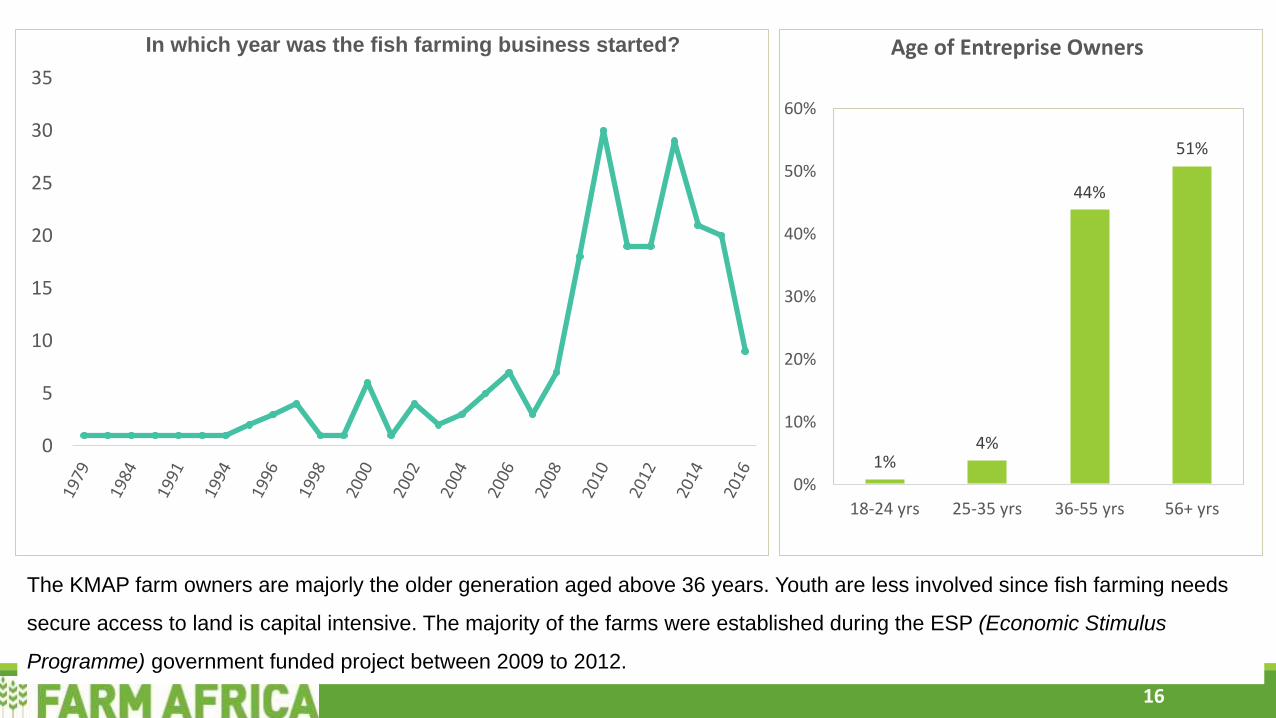
The KMAP farm owners are majorly the older generation aged above 36 years. Youth are less involved since fish farming needs
secure access to land is capital intensive. The majority of the farms were established during the ESP (Economic Stimulus
Programme) government funded project between 2009 to 2012.
16
tilapia only63%
tilapia catfish different ponds
19%
tilapia catfish
polyculture 17%
catfish only1%
Ornamentals0%
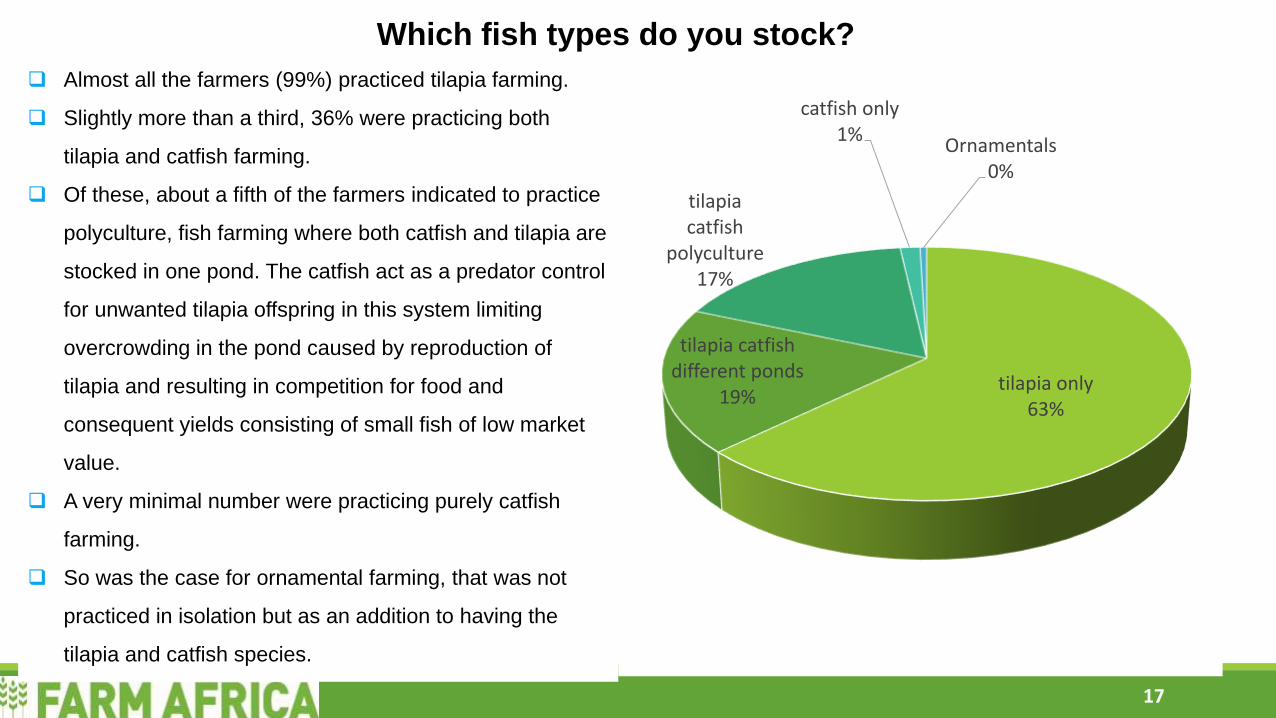
Almost all the farmers (99%) practiced tilapia farming.
Slightly more than a third, 36% were practicing both
tilapia and catfish farming.
Of these, about a fifth of the farmers indicated to practice
polyculture, fish farming where both catfish and tilapia are
stocked in one pond. The catfish act as a predator control
for unwanted tilapia offspring in this system limiting
overcrowding in the pond caused by reproduction of
tilapia and resulting in competition for food and
consequent yields consisting of small fish of low market
value.
A very minimal number were practicing purely catfish
farming.
So was the case for ornamental farming, that was not
practiced in isolation but as an addition to having the
tilapia and catfish species.
Which fish types do you stock?
17

Mono-sex62%
Mixed Sex38%
What type of tilapia fingerlings did you stock?
18
Pond production for both catfish and tilapia farming was majorly the intermediate form of production, semi-intensive, where farmers combined both
manuring and supplementing the fish with some commercial feed. Mono-sex tilapia (all male) fingerlings will perform about 30% better than mixed
sex. More than a third claimed they stocked mixed fingerlings, but in practice nobody checked. This highlights that awareness needs to be made to
the farmers on the importance of using only mono-sex fingerlings. There is need for setting the standard of what % of male is called all male.
92% 94%
6% 4%2% 2%
0%
10%
20%
30%
40%
50%
60%
70%
80%
90%
100%
Tilapia Catfish
Which farming system do you implement in your ponds?
Intensive (Quality feeding and aeration)
Extensive (green water)
Semi intensive (manuring and supplementing feed)
Total/ Average Owner
Farm Manager Farm Hand
Primary/ secondary level education
52% 54% 31% 82%
Degree/ certification not in aquaculture
23% 29% 12% 11%
Certificate/ Diploma in aquaculture
13% 13% 19% 4%
Degree in Aquaculture 4% 2% 10% 0%
No formal education 2% 2% 4% 0%
Did not disclose 6% - 25% 4%
What is the highest level of the person responsible for running
the daily operations on the farm?
72%
68%
30%
64%
16%
19%
54%
24%
11%
13%
16%
13%
0% 20% 40% 60% 80% 100%
<1200 m2
1201-3000 m2
>3000 m2
Total/ Average
Who is responsible for running the day to day operations of the farm enterprise?
Owner Farm Manager Farm Hand
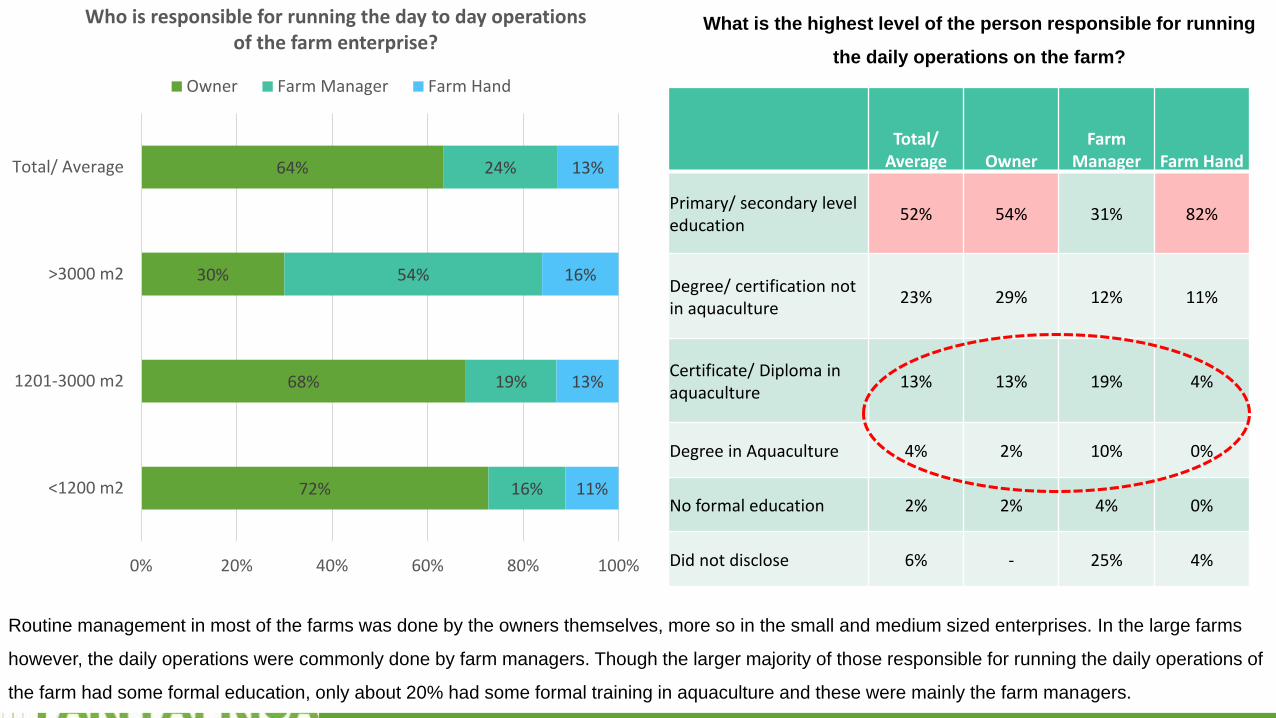
Routine management in most of the farms was done by the owners themselves, more so in the small and medium sized enterprises. In the large farms
however, the daily operations were commonly done by farm managers. Though the larger majority of those responsible for running the daily operations of
the farm had some formal education, only about 20% had some formal training in aquaculture and these were mainly the farm managers. 19
38%
33%
57%
38%
62%
67%
43%
62%
0% 20% 40% 60% 80% 100%
Male owned
Female owned
Institution owned
Total/ Average
Do you keep records of your enterprise?
Yes No
80%76%
70% 69%
63%
57%
37%
0%
10%
20%
30%
40%
50%
60%
70%
80%
90%
Types of records kept by those doing record keeping n=84
20
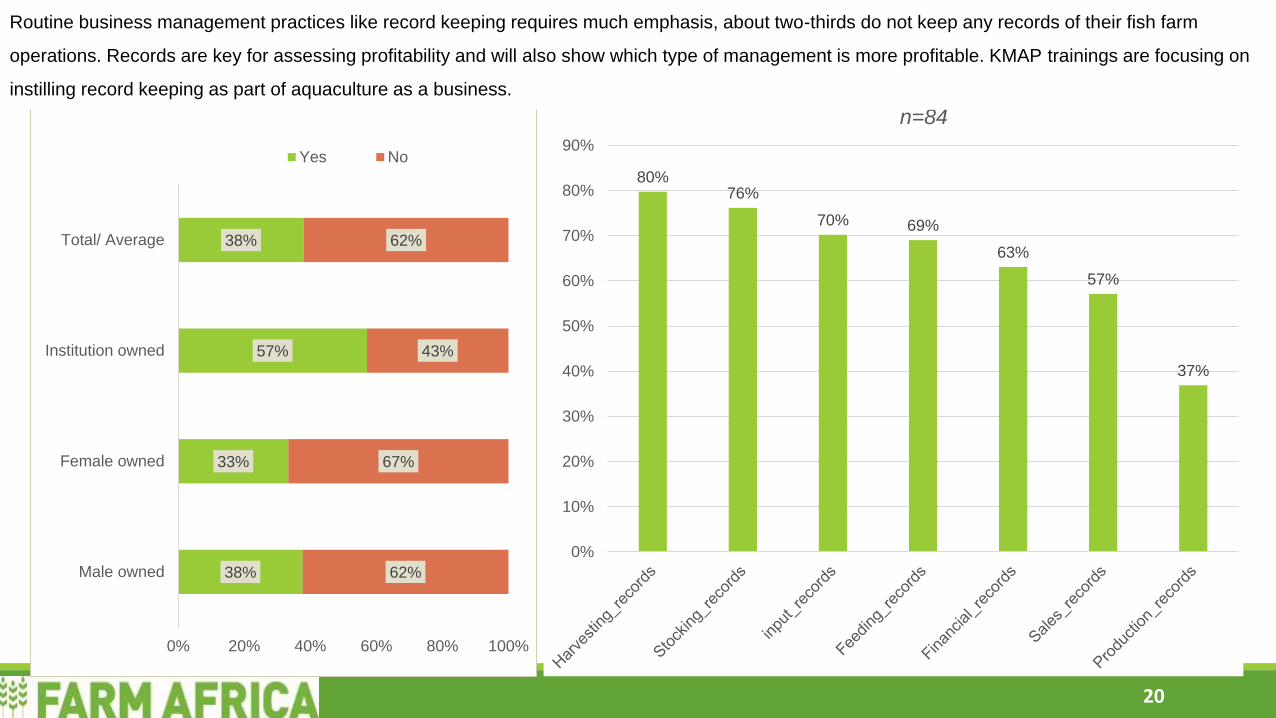
Routine business management practices like record keeping requires much emphasis, about two-thirds do not keep any records of their fish farm
operations. Records are key for assessing profitability and will also show which type of management is more profitable. KMAP trainings are focusing on
instilling record keeping as part of aquaculture as a business.
SUMMARY ON PRODUCTION (Annual Production**)
21
FARM SIZE GENDER
AverageSmall
<1200 m2
Medium
1201-3000 m2
Large
>3000 m2MALE FEMALE INSTITUTION
Production cycle (months) 9 9 9 10 9 9 8
Average Kgs of Tilapia Harvested 186 130 240 536 161 188 537
Tilapia harvested per m2 0.31 0.30 0.27 0.69 0.28 0.33 0.69
Tilapia KGs Sold 158 118 208 325 156 128 323
Tilapia Price per KG 295 178 520 283 306 277 203
Average Kgs of Catfish Harvested 14 14 18 - 19 2 -
Catfish harvested per m2 0.14 0.16 0.11 - 0.15 0.09 -
Catfish Kgs Sold 17 13 28 - 18 17 -
Catfish Price per KG 1,342 1,481 1,280 - 1,805 50 -
Annual Revenue per enterprise 70,059 41,875 121,379 84,928 71,196 62,800 84,467
Average Farm costs per cycle 55,347 29,563 61,952 337,899 44,864 49,623 237,397
Labor cost per enterprise per cycle 13,307 5,263 13,685 112,667 9,193 18,615 52,000
FARM GROSS MARGIN (6,876) 210 21,013 (282,566) 7,064 (14,588) (182,563)
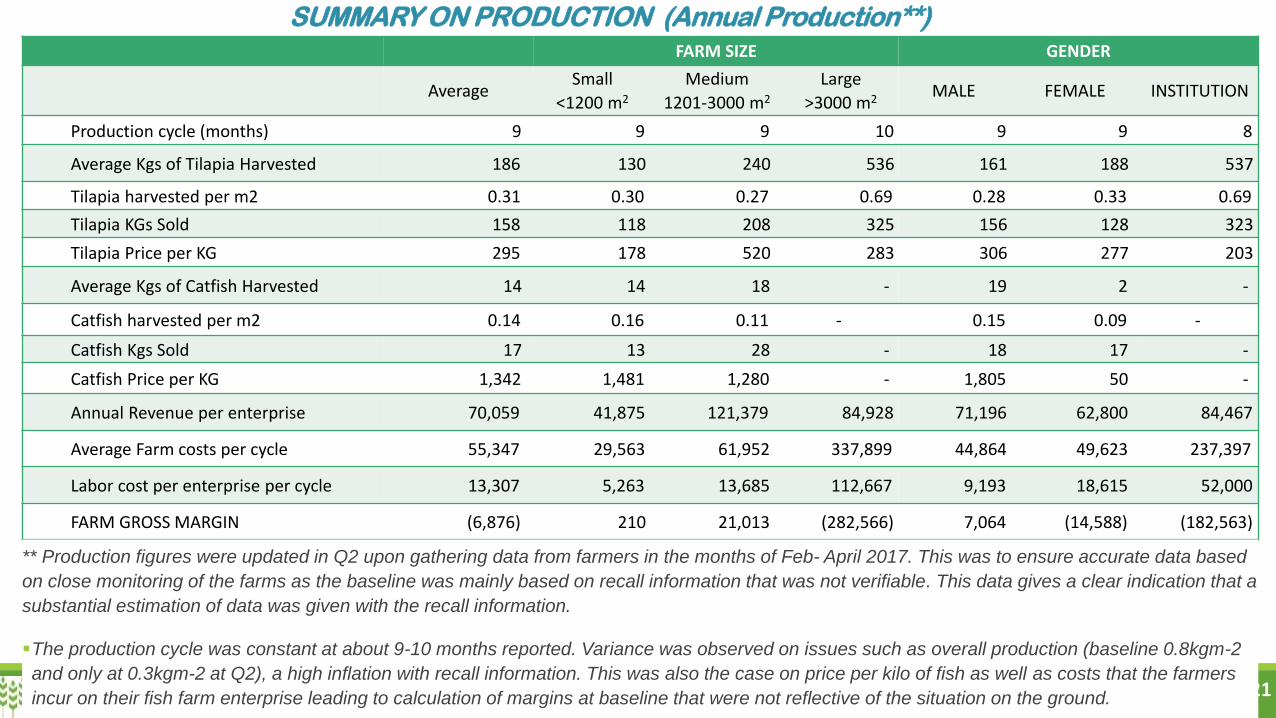
** Production figures were updated in Q2 upon gathering data from farmers in the months of Feb- April 2017. This was to ensure accurate data based
on close monitoring of the farms as the baseline was mainly based on recall information that was not verifiable. This data gives a clear indication that a
substantial estimation of data was given with the recall information.
The production cycle was constant at about 9-10 months reported. Variance was observed on issues such as overall production (baseline 0.8kgm-2
and only at 0.3kgm-2 at Q2), a high inflation with recall information. This was also the case on price per kilo of fish as well as costs that the farmers
incur on their fish farm enterprise leading to calculation of margins at baseline that were not reflective of the situation on the ground.

69%
64%
53%
36%
19%
10%
0%
10%
20%
30%
40%
50%
60%
70%
80%
Mash SinkingPellets
Home-madeFeeds (Ownformulation)
Green Water/algae
HouseholdLeft Overs
Extruded/Floatingpellets
What kind of feed did you feed your tilapia in the last production cycle? Main Feed Type % using as
main typeFCR
Sinking Pellets 38% 2.48
Mash 25% 2.51
Home-made Feeds (Own formulation) 28% 3.07
Household Left Overs 2% 3.12
Green Water/ algae 4% -*
Extruded/ Floating pellets 3% 1.22
Total/ Average 100% 2.69
22
Most of the farmers use more than one feed type for their fish. The most common were the local feeds consisting of mash and sinking pellets. Use
of quality feeds reduces the quantity a farmer needs to feed the fish to achieve the same output, as is also demonstrated by the FCR of the farmers
using the extruded pellets, yet use of the extruded pellets was very low, mainly because of the cost implications.
Tilapia Feeds & FCR
*not possible to quantify feed amount
72% 70%
39%
25%
16%
5%
0%
10%
20%
30%
40%
50%
60%
70%
80%
SinkingPellets
Mash Home-madeFeeds
Green Water/algae
Left Overs Extruded/Floatingpellets
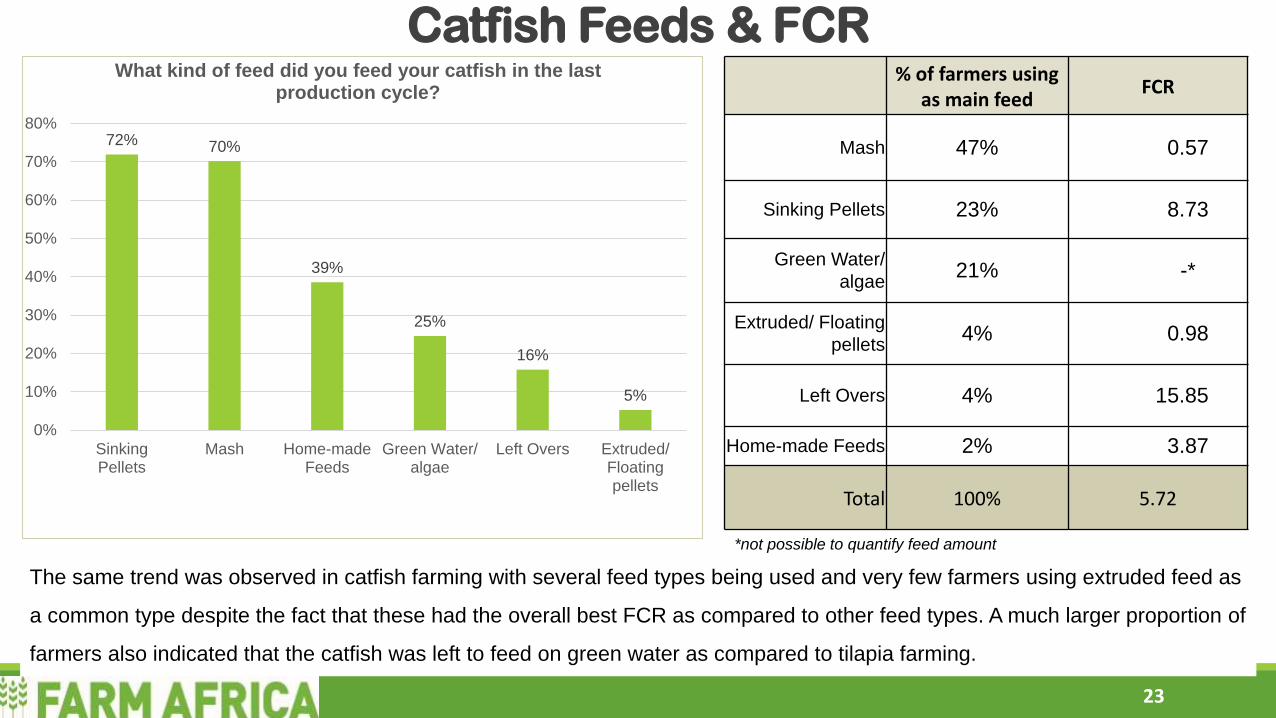
What kind of feed did you feed your catfish in the last production cycle?
% of farmers using as main feed
FCR
Mash 47% 0.57
Sinking Pellets 23% 8.73
Green Water/
algae21% -*
Extruded/ Floating
pellets4% 0.98
Left Overs 4% 15.85
Home-made Feeds 2% 3.87
Total 100% 5.72
23
Catfish Feeds & FCR
The same trend was observed in catfish farming with several feed types being used and very few farmers using extruded feed as
a common type despite the fact that these had the overall best FCR as compared to other feed types. A much larger proportion of
farmers also indicated that the catfish was left to feed on green water as compared to tilapia farming.
*not possible to quantify feed amount
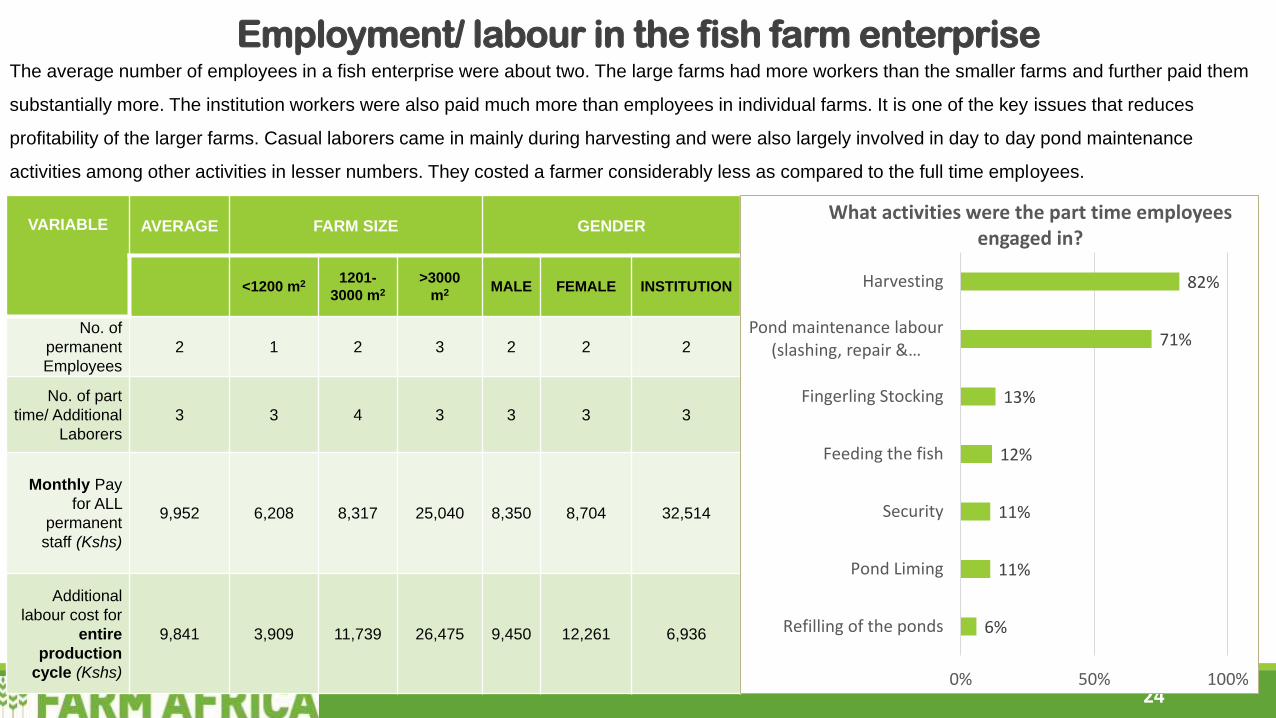
Employment/ labour in the fish farm enterprise
VARIABLE AVERAGE FARM SIZE GENDER
<1200 m2 1201-
3000 m2
>3000
m2 MALE FEMALE INSTITUTION
No. of
permanent
Employees
2 1 2 3 2 2 2
No. of part
time/ Additional
Laborers
3 3 4 3 3 3 3
Monthly Pay
for ALL
permanent
staff (Kshs)
9,952 6,208 8,317 25,040 8,350 8,704 32,514
Additional
labour cost for
entire
production
cycle (Kshs)
9,841 3,909 11,739 26,475 9,450 12,261 6,936
24
The average number of employees in a fish enterprise were about two. The large farms had more workers than the smaller farms and further paid them
substantially more. The institution workers were also paid much more than employees in individual farms. It is one of the key issues that reduces
profitability of the larger farms. Casual laborers came in mainly during harvesting and were also largely involved in day to day pond maintenance
activities among other activities in lesser numbers. They costed a farmer considerably less as compared to the full time employees.
6%
11%
11%
12%
13%
71%
82%
0% 50% 100%
Refilling of the ponds
Pond Liming
Security
Feeding the fish
Fingerling Stocking
Pond maintenance labour (slashing, repair & …
Harvesting
What activities were the part time employees engaged in?

25
Fingerling supplier Feed SupplierIndividual seller/ local
market/ Agrovet 32% 56%
Dominion 17% 8%
Lake Basin Development Authority 11% 1%
Government Fisheries department 10% 9%
Jewlet 9% 8%
Others (KEMFRI, Sagana. Mabro etc) 9% 6%
Kisii Fish Farm 6% 5%
Jambo 2% 5%
Jaffy 1% 1%
Uganda 1% 2%
From whom did you buy your inputs?
53.6
54.7
59.6
54.1
32.9
44.5
39.5
35.7
0.0 10.0 20.0 30.0 40.0 50.0 60.0 70.0
Male
Female
Institution
Average
What is the distance from your enterprise to where you bought the inputs? In KMs
Feed distance Fingerling distance
The farmers seemed to approach the same fingerling and feed supplier for their inputs. Also, distance seemed to be a great contributor in
selection of the input supplier with the average distance being about 50kms and 34kms for the fingerlings & feed respectively. The farmers
commonly went for local providers who were in a radius of close proximity to the premises, instead of focusing on quality.
63%72%
37%28%
0%
10%
20%
30%
40%
50%
60%
70%
80%
90%
100%
Tilapia Catfish
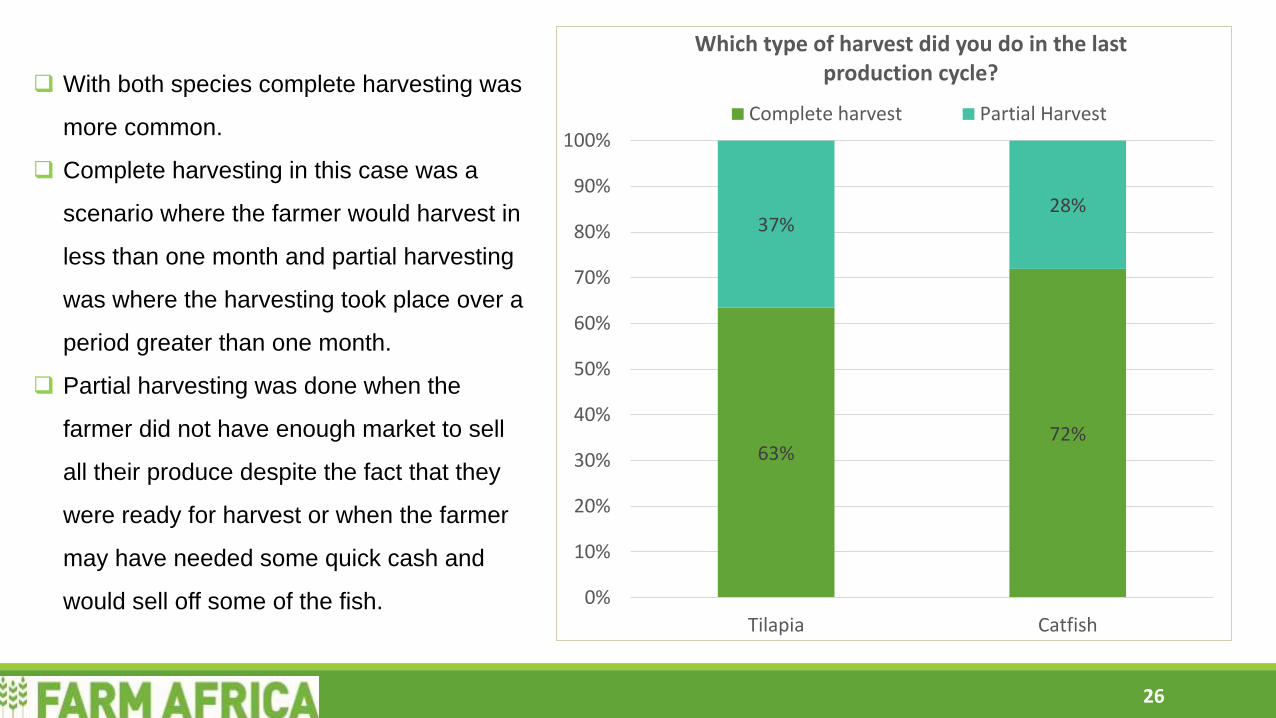
Which type of harvest did you do in the last production cycle?
Complete harvest Partial Harvest
26
With both species complete harvesting was
more common.
Complete harvesting in this case was a
scenario where the farmer would harvest in
less than one month and partial harvesting
was where the harvesting took place over a
period greater than one month.
Partial harvesting was done when the
farmer did not have enough market to sell
all their produce despite the fact that they
were ready for harvest or when the farmer
may have needed some quick cash and
would sell off some of the fish.
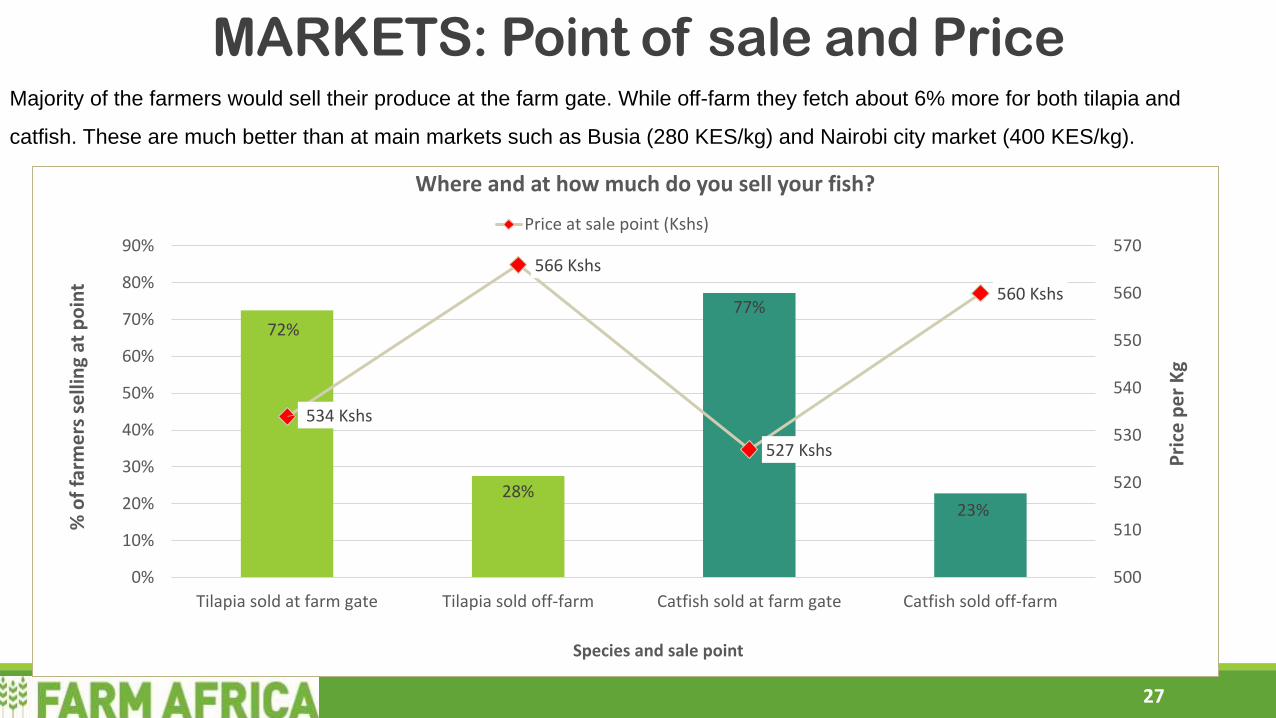
MARKETS: Point of sale and Price
72%
28%
77%
23%
534 Kshs
566 Kshs
527 Kshs
560 Kshs
500
510
520
530
540
550
560
570
0%
10%
20%
30%
40%
50%
60%
70%
80%
90%
Tilapia sold at farm gate Tilapia sold off-farm Catfish sold at farm gate Catfish sold off-farm
Pri
ce p
er
Kg
% o
f fa
rme
rs s
elli
ng
at p
oin
t
Species and sale point
Where and at how much do you sell your fish?
Price at sale point (Kshs)
27
Majority of the farmers would sell their produce at the farm gate. While off-farm they fetch about 6% more for both tilapia and
catfish. These are much better than at main markets such as Busia (280 KES/kg) and Nairobi city market (400 KES/kg).

46%43%
2%
9%
65%
33%
2% 0%0%
10%
20%
30%
40%
50%
60%
70%
Private Buyers/Individuals
Traders Hotels Institutions (Schools,hospitals...)
Who are the main buyers of your fish?
Tilapia Catfish
MARKETS: Buyers
BUYER Price per Kg (Kshs)TILAPIA CATFISH
Private Buyers/ Individuals 517 451
Traders 559 699
Hotels 435 500
Institutions (Schools, hospitals...) 625 535
28
The main buyers constituted four types of persons,
private buyers, traders, hotels and institutions.
The most common buyers were individuals/ private
buyers.
For catfish, the majority sold to these private buyers
despite the fact that they offered the least price as
compared to the other buyers in the market.
For tilapia, there was almost equal sales going to
both the traders and individual buyers. The traders
offered a better price but the best price was from the
institutions. However, very few farmers sold their
produce to them.

Challenges Faced by Fish Farm Enterprises% of Total (221) Male (163) Female (45) Institution (13)
Predation (animal, humans, birds) 50% 48% 53% 57%
High Price of feeds 49% 53% 42% 21%
Difficulty getting quality fingerlings 40% 41% 44% 21%
Difficulty getting affordable quality feeds 36% 35% 38% 43%
Harsh weather (e.g. low temperature, drought, flooding) 26% 28% 22% 21%
Access to finance 23% 25% 16% 21%
High price of fingerlings 19% 17% 31% 7%
Access to markets 10% 10% 11% 7%
High mortality of fingerlings 8% 7% 4% 21%
Limited training on aquaculture 7% 5% 13% 14%
Inability to access extension services 3% 2% 7% -
High water Cost 3% 2% 4% 7%
High transportation costs to and from markets 3% 3% 2% -
Fish disease - 1% - -
Fish disease - 1% - -
29
The highlighted areas are to be addressed in the trainings. On the other hand marketing is also a key area to improve while this is currently not
seen as a priority by the farmers as they tend to focus mainly on technical issues.
17%
27%
31%
33%
35%
42%
46%
52%
54%
59%
62%
63%
0% 10% 20% 30% 40% 50% 60% 70% 80%
Business Management
Marketing & Sales
Transporting fingerlings
Post-Harvest management
Site selection
Record keeping
Stocking the pond
Pond maintenance and rehabilitation
Pond preparation
Pond construction
Pond Management
Feeding fish
Which areas on fish farming and business management have you been trained on? n= 177
80%84%
67%
79%
0%
10%
20%
30%
40%
50%
60%
70%
80%
90%
100%
Total Male Female Institution
Have you ever received any training on fish farming?
ACCESS TO TRAINING
30
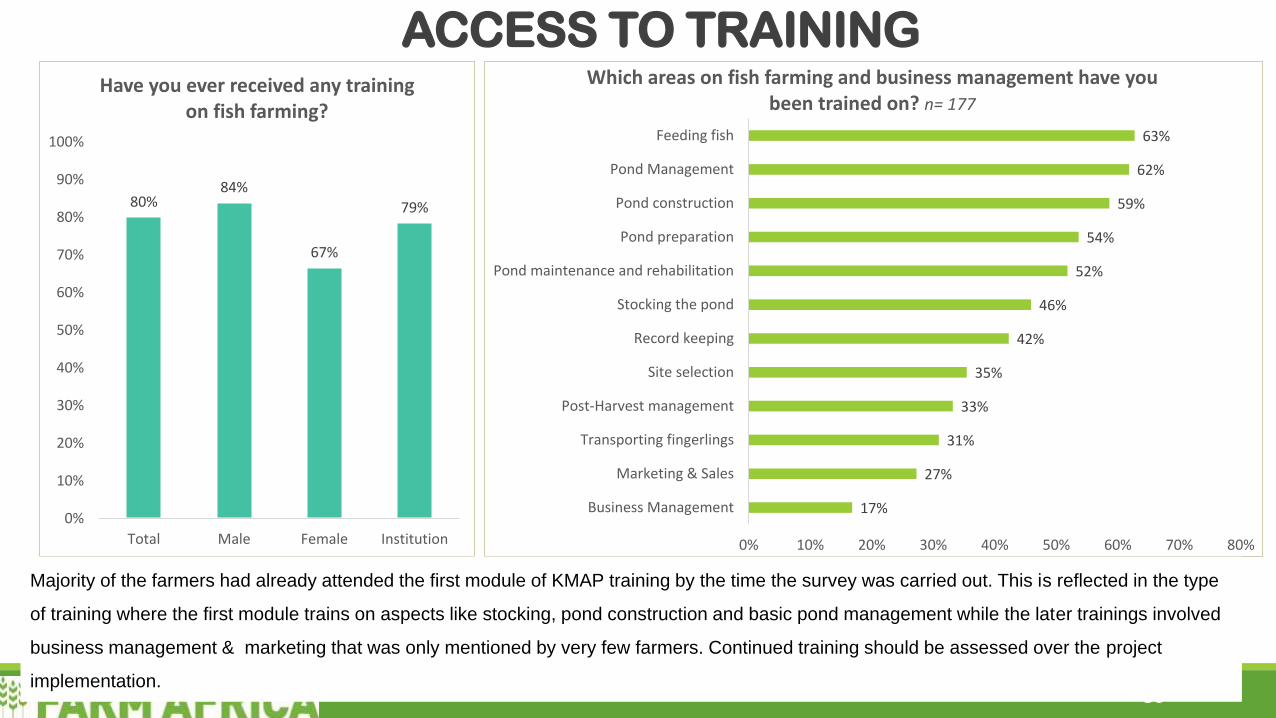
Majority of the farmers had already attended the first module of KMAP training by the time the survey was carried out. This is reflected in the type
of training where the first module trains on aspects like stocking, pond construction and basic pond management while the later trainings involved
business management & marketing that was only mentioned by very few farmers. Continued training should be assessed over the project
implementation.
Yes13%
No87%
Did you apply for a loan in the last production cycle?
4%
8%
17%
88%
88%
0% 50% 100%
Buy/ leased land
School fees
Used on Other agriculturalactivities (non-fish related)
Purchased fish farmequipment (e.g. generator,
water pipes, nets etc)
Run daily fish farmingactivities
How did you use the loan money? n=28
5%
7%
8%
8%
15%
17%
27%
0% 5% 10% 15% 20% 25% 30%
No trust in credit organizations
Did not have collateral to applyfor a loan
Too expensive interest rates
Fish business not profitableenough to sustain a loan
Procedures are toocomplicated
Did not know whom to go tofor a loan
Had sufficient funds to operatethe entreprise
Reasons for not applying for a loan n=193
Access to financial/ credit services
31
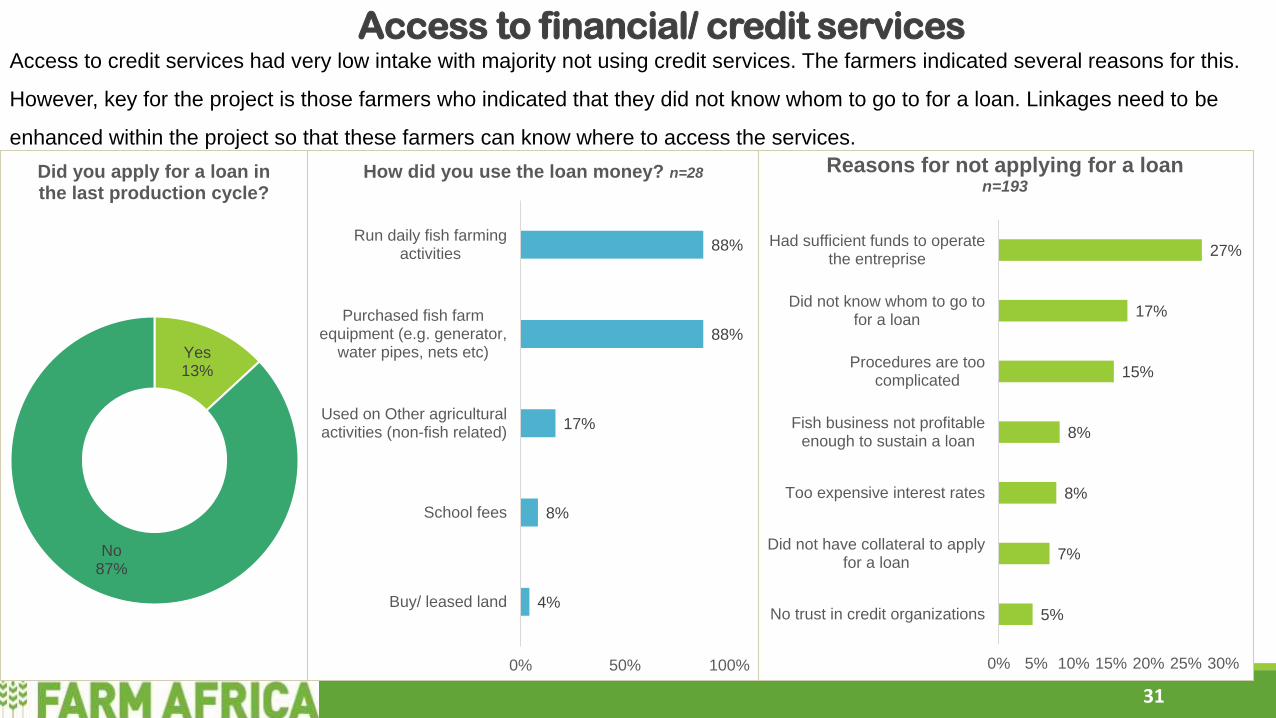
Access to credit services had very low intake with majority not using credit services. The farmers indicated several reasons for this.
However, key for the project is those farmers who indicated that they did not know whom to go to for a loan. Linkages need to be
enhanced within the project so that these farmers can know where to access the services.
41% 40% 40%
57%
59% 60% 60%
43%
0%
10%
20%
30%
40%
50%
60%
70%
80%
90%
100%
Average Male Female Institution
Do you have any insurance cover?
Yes No
0%
1%
2%
4%
4%
16%
23%
86%
0% 10% 20% 30% 40% 50% 60% 70% 80% 90%
Fish insurance
Education_insurance
Funeral_insurance
Livestock_insurance
Crop_insurance
Life_insurance
Property_Insurance
Health_insurance
Which type of insurance do you have? n=91
ACCESS TO INSURANCE
32
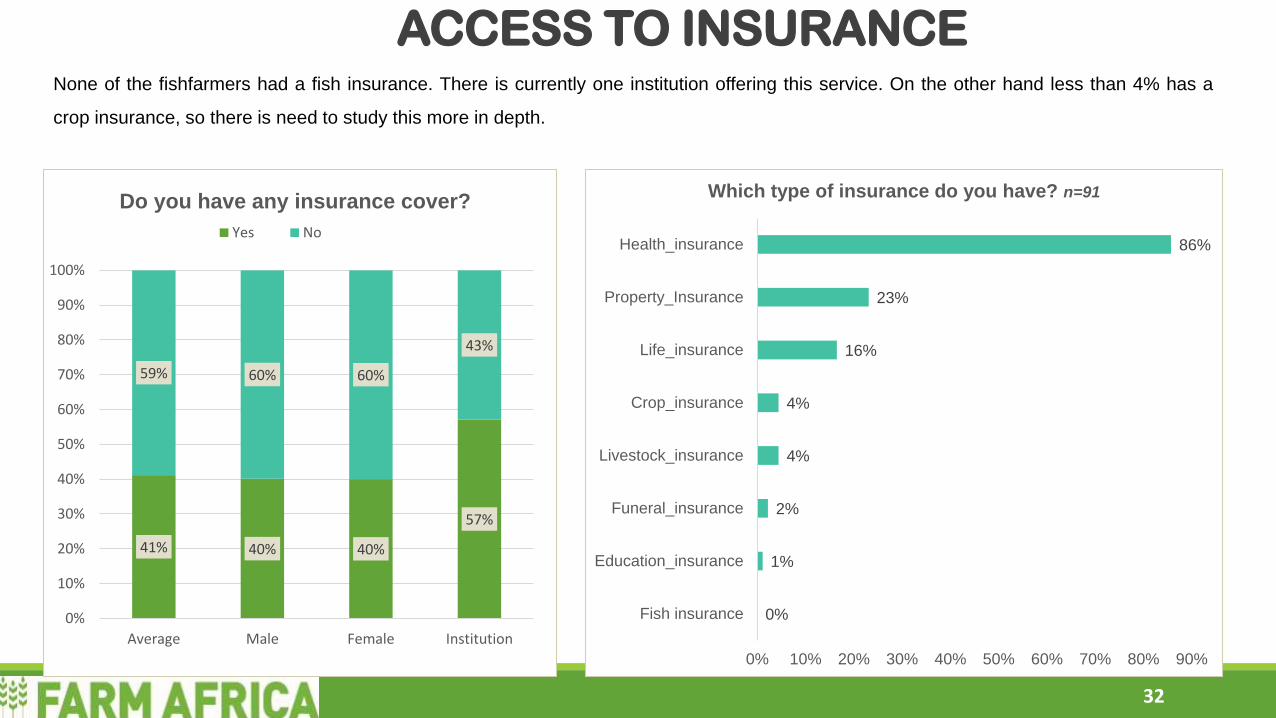
None of the fishfarmers had a fish insurance. There is currently one institution offering this service. On the other hand less than 4% has a
crop insurance, so there is need to study this more in depth.
Fish farming16%
Salaried/ eaged
employment (including pension)
30%
Farming (other value
chains)41%
Business13%
Of these, which is the main source of household income?
Total (208)Male (163) Female (45)
Farming (other
value chains)71% 71% 73%
Fish farming 55% 56% 51%
Salaried /wage
employment (incl.
pension)
43% 43% 40%
Business 31% 28% 40%
Sources of household income in the entrepreneurs’ household:
33
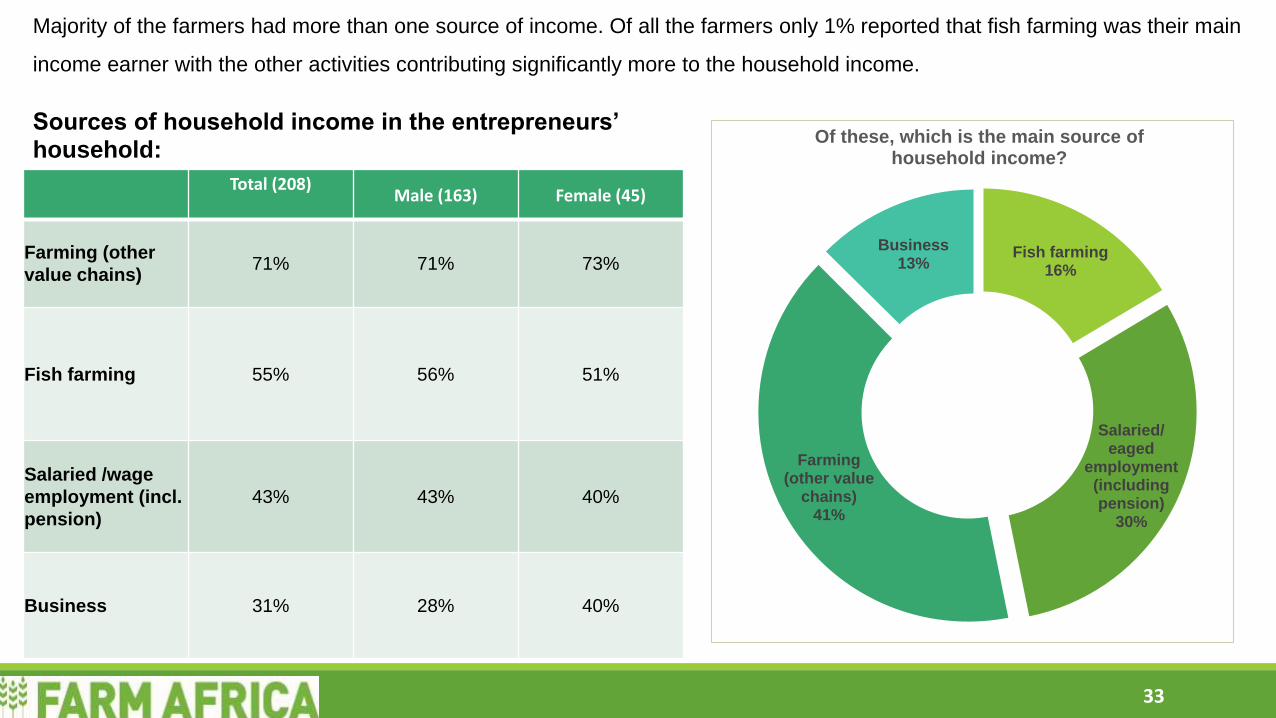
Majority of the farmers had more than one source of income. Of all the farmers only 1% reported that fish farming was their main
income earner with the other activities contributing significantly more to the household income.
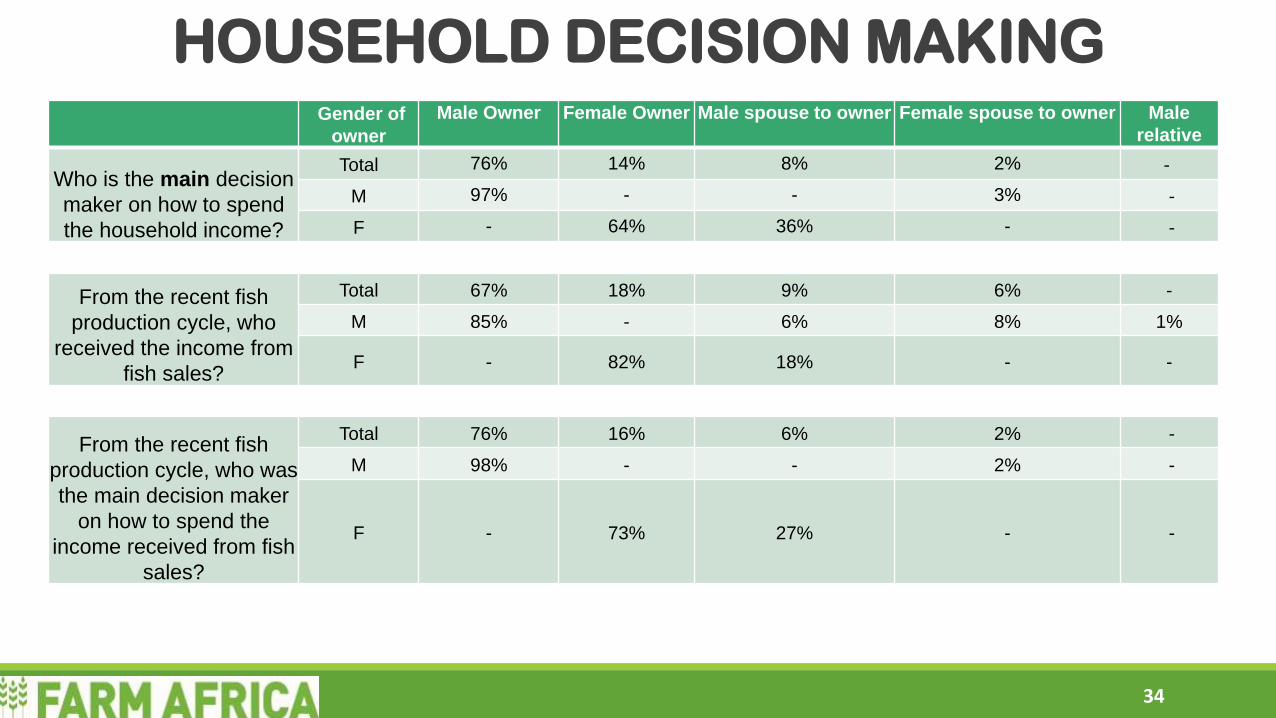
HOUSEHOLD DECISION MAKINGGender of
owner
Male Owner Female Owner Male spouse to owner Female spouse to owner Male
relative
Who is the main decision
maker on how to spend
the household income?
Total 76% 14% 8% 2% -
M 97% - - 3% -
F - 64% 36% - -
From the recent fish
production cycle, who
received the income from
fish sales?
Total 67% 18% 9% 6% -
M 85% - 6% 8% 1%
F - 82% 18% - -
From the recent fish
production cycle, who was
the main decision maker
on how to spend the
income received from fish
sales?
Total 76% 16% 6% 2% -
M 98% - - 2% -
F - 73% 27% - -
34
Key Actions for the ProjectWomen inclusion in the project needs to be boosted. Women with less than 3 ponds can be recruited into the
project.
Youth participation in aquaculture appears low. Strategies on youth inclusion should be developed and
explored as a key demographic bracket in Kenya.
Farmers’ knowledge on sources of quality and affordable fingerlings could be intensified further more so to
promote use of good quality fingerlings that would lead to improved FCR and overall production. Have strong
campaigns by the team on need of farmers using high quality floating feeds in the course of production.
Lack of ease in access to quality inputs should be addressed by the team. Identification of players like the
aqua shops who can be linked to manufacturers, suppliers and farmers with a view to enhance access of the
inputs would be key in promoting the access of these inputs.
35

Training of workers within fish farms: farmers should be highly encouraged to engage technical staff even as they
themselves (owners) too are taken through fundamental training modules necessary for the profitable running of
their fish farming business
Results on farmer training should be utilized to enable the technical team know which areas to focus on more for
the purposes of objectivity
Record keeping is a practice that needs to be upheld by every business enterprise. Record keeping should be encouraged
by the KMAP team and included in the trainings.
The KMAP team will set up strategies that would address marketing challenges faced by farmers due to several reasons
including price, harvesting trends, distance to markets, transport and logistical challenges. The team will pilot together with
BoP Inc. on setting up a model local traders distribution network within fish producing zones with traders that fit their size.
Key Actions for the Project
36