Embed Size (px)
Citation preview

I LMSC-HREC TR Db9782Y
li NUMERICAL ANALYSIS
I OF NATURAL CONVECTION IN TWO-DIMENSIONAL SQUARE
I kLD CIRCULAR CONTAINERS I IN LOW GRAVITY I August 1980
Contract NASW-3281 (Interim Report)
Prepared for
NASA HEADQUARTERS WASHINGTON, DC 20546
I H~ntsvilk Research & Engimring Centor 48W Bmdfrrd Drive, HutrvPIe, A1 35807
I (NASA-Ck-1 b3487) N U M E h I i A i I I A ~ A L Y ~ I S u i? , ~ 8 ~ - 3 0 6 8 0 Y A T U H A L C O N V K T X G N I N l ' K 3 - ~ I i l l ; ~ i S l d N A ~ SQUAdE ANU L l d C U L A R C(iNTfr.lNELiS i n ib* k ; a A V I ' i ' Y I u t e r i n He port ( L o c k heed LILL;,L it:s .;IIC~ S ~ C L C C ! I1 i~c:las
I Lo.) 39 p tic ,2u3/MF A31 L J ~ L i d d b ~ / A q 1t>3.34
https://ntrs.nasa.gov/search.jsp?R=19800022182 2018-08-12T21:41:06+00:00Z
FOREWORD
This docurlrcnt r e p o r t s ttlc r c s u l t s of e f fo r t by pe r sonne l
of Lorkhced Miss i l ee Rr Space C o n ~ p a n y , Inc., Huntsv i l le R s -
~ ~ a r c l l IL Engineering Cen te r , f o r the National Acronau t i c s a n d
S p c t - Adnrinis t rat ion under Con t r ac t NASW - 328 1, "Manufactur - ing i ~ r Space: Flu id Dynamics Nunrcr ica l Analyeis." T h e NASA
teclrnic.al d i r e c t o r f o r t h i s con t r ac t is D r . R o b e r t F. D r e s a l e r ,
Mitnager, Advanced Technology P r o g r a m , NASA Z-{cadqtmrters,
Washington, D. C.
ACKNOWLEDGMENT
Tlrt? atrtllurs arc ploascd to e x p r c s s app rec i a t ion t o the
NASA tr*cllnici~l d i r t -c tor , Dr . Rober t F. Dressier, and the
originittor of tlrt* t-ffort, Dr . John H. Car ru t l r c r s , f o r t h e i r
intcrt8st in i\nd suppor t f o r this work. D r . D r e s s l c r l e guid-
ancr* and ~ ~ r o n i t o r i n g of o u r affor ta cont r ibu ted subs tan t ia l ly
to (JIG O L I ~ C O I I I C of thia task.
Wc arc a l s o g ra t e fu l t o Lockhecd pe r sonne l who con-
t r ibu ted in va r ioua ways t o thia e f for t , in pa r t i cu l a r , Kenneth E.
Xiqura who ~rladc? eubs tan t ia l con t r ibu t iu~r s to the nulrlc r i cn l
computat ional work.
i i
L(WkHLtD . HUNTSVILLE H t OCARCH 6 f NGlNt I HINC' C.t NTt R

5
I I-,
*, 'r.
C
91
C .-. e--
ABSTRACT
A numerical study of natural convection in c i rcu la r cylinder and square
enclosures shows that the analytic low Rayleigh number theory of previous
investigators i s valid for Rayleigh numbers up to 1000. F o r a Rayleigh nurn-
be r of 5000, steady s ta te values of maximum fluid velocity differ by 20 per-
cent. This deviation between analytic theory and numerical resul ts increases
for higher Rayleigh numbers. In addition, the low Rayleigh number theory i s
shown to be valid for higher Rayleigh numbers for a portion of the transient
phase before significant deviation becomes apparent. It is a l so shown that
square shaped experiment configurations may be analytically approximated
with good accuracy by c i rcular cylinders of equal c r o s s sectional a r e a for
the prediction of convection velocities and flow patterns a t low Rayleigh
nttnr be r .
i i i
LOCKHEED. HUNlSVlLLE RESEARCH & ENGINEERING CENTER
- *--...---~~----*-----.- .---- --

Section
Fig urc-
1
2a
CONTENTS
FOREWORD
ACKNOWLEDGMENT
ABSTRACT
NOMENCLATURE
CIRCULAR CYLINDER ENCLOSURE
SQUARE ENCLOSURE
CONCLUSIONS
REFERENCES
LIST O F ILLUSTRATIONS
Page
i i
i i
i i i
vi
1
3
15
3 1
32
G c o l ~ ~ c t r y for Circular Cylinder Enclosure 3
Maxinlunl Velocity a s a Function of Time for Water 5 Contained in a Horizontal Circular Cylinder Enclosure a t Various Raylcigh Numbers
Velocity Deviation a s a Function of Time for Water 6 Cont-aincd in a klorizonbl Circular Cylinder Enclosure a t Various Rayleigh Numbers
Variation of Maximum Equilibrium Velocity with Rayleigh 7 Number for Water Contained in a Horizontal Cylinder
Conlparison of Velocity Distributions Along Horizontal 9 Radius a s a Function of Time fo r Rayleigh Numbers of 1 and 100,000
GIM Code Velocity Vector Plots a t Steady State for Circular 10 Cylinder a t Various Rayleigh Numbers
GIM Code Velocity Contour Plots a t Steady State for Circular 11 Cylinder a t Various Rayleigh Numbers
LOCKHLLD. HUN1SVILI.E RESEARCH & ENGINEERING CENTER
" . , . . " ..-...-.-. .. .- ..

Figure
7 GIM Code Temperature Contour Plots a t Steady State f o r Circular Cylinder a t Vrtrious Rayleigh Numbers 12
Comparison of GIM Code Temperature Contour and Velocity 13 Vector Variation with Time for Circular Cylinder a t Rayleigh Number of 100,000
Geometry for Square Enclosure
Variation of Maximum Equilibrium Velucity with Rayleigh Number for Water Contained in Square Enclosure
LOCAP Velocity Vector Plots a t Steady State for Square Enclosure a t Various Rayleigh Numbers
LOCAP Streamline Plots a t Steady State fo r Square En- c losure a t Various Rayleigh Numbers
LOCAP Absolute Velocity Contour Plots at Steady State fo r Square Enclosure a t Various Rayleigh Numbers
LOCAP Temperature Contour Plots at Steady State fo r Square Enclosure a t Various Rayleigh Numbers
GIM Code Velocity Vector Plots a t Steady State fo r Square Enclosure a t Various Rayleigh Numbers
GIM Code Velocity Contour Plots a t Steady State fo r Square Enclosure a t Various Rayleigh Numbers
GIM Code Temperature Contour Plots a t Steady State fo r Square Enclosure a t Various Rayleigh Numbers
Maximum Velocity a s a Function of Time fo r Water Con- tained in a Square Enclosure a t Various Rayleigh Numbers
Vclocity Distribution a s a Function of Time fo r Water Con- tained in a Square Enclosure with Rayleigh Number = 1
Comparison of GIM Code Temperature and Velocity Vector 28 Variation with Time for Square Enclosure a t Rayleigh Num- ber of 100,000
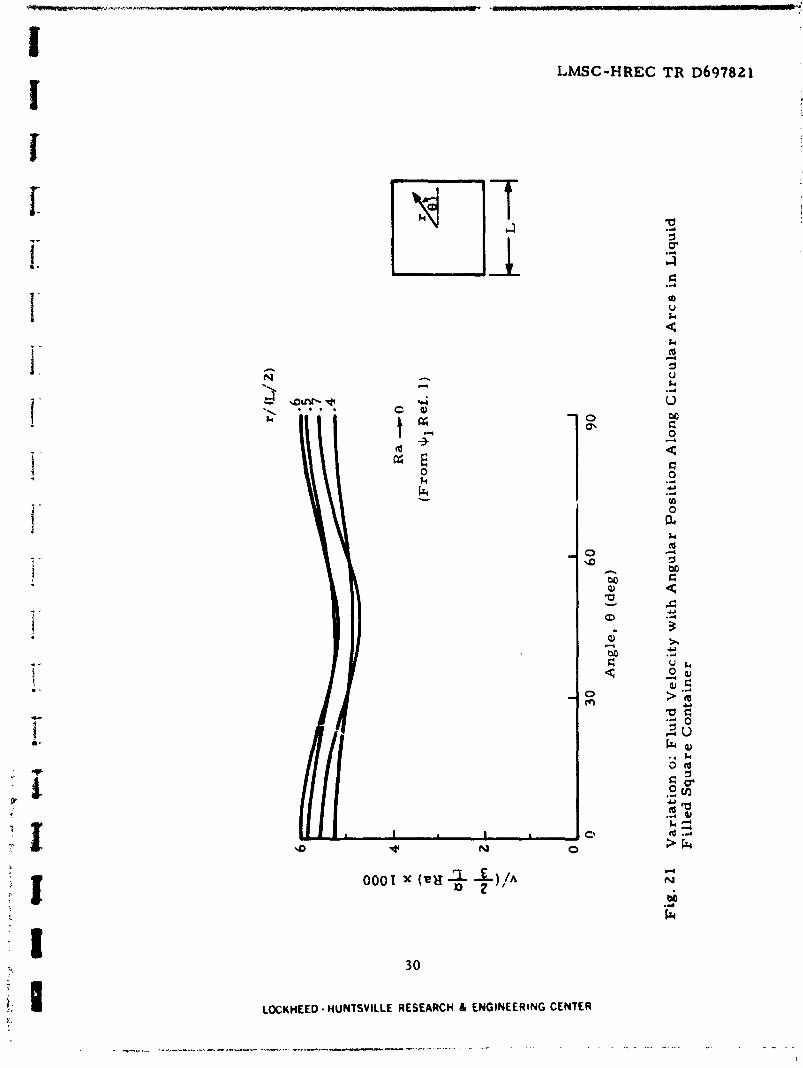
Variation of Fluid Velocity with Angular Position Along 3 0 Circular Arcs in Liquid Filled Square Container
v
LOCKHEED - HUNTSVILLE RESEARCH & ENGINEERING CENTER

Symbol
d
6
L
r
R
Ra
NOMENCLATURE
Description
cylinder diameter = 2 R
gravity force
length of square side
radial distance
cylinder radius
Rayleigh number = , cylinder va
- - 8, square am
temperature
initial mid-point temperature
temperature difference across circular cylinder o r square enclosure
time
dimensionless time I vt /~ ' , cylinder 2
V~/ ' (L /Z) , sqnare
velocity
dimensionless velocity = lL8' v, cylinder g p ~ ~ d 2
rectangular coordinates (Figs. 1 and 9)
thermal diffusivity
volumetric coefficient of thermal expansion , ,
; 1
i' v i
f f. LOCKHEED HUNTSVILLE RESEARPY 6 ENGINEERING CENTFR
*a*., . U - W i C a * r W l i i *..,,- - ,.-.* wV...-- V I P * ,I,U I . .? .a7.. lf .U- "ll)--.*C.-. .,.-*- ""- .. . . - -- . - we...... -..<.- r

polar angle (Fig. 1 )
kinematic viscosity
stream function
dimensionless stream function = lZBv JI, cylinder gB AT d3
vii
LOCKHEED - HUNTSVILLE RESEARCH L CNGINEERING CENTER
- -. .

LMSC-HREC TR 0697821
1. INTRODUCTION
The NASA Materials Processing in Space program includes a number
of experiments to be performed using the Fluids Experiment System (FES)
facility aboard the Spacelab vehicle in orbit. These experiments will investi-
gate various fluid phenomena of interest to materials processing in space
applications. . Fluid convection induced by residual gravity forces under
orbital conditions is of interest to a number of possible materials process-
ing applications.
This report describes numerical fluid dynamics analyses of simplified
geometries to investigate fluid convection behavior under various conditions
of thermal gradients and gravitational loading. These combined effects a r e
indicated by the magnitude of the Rayleigh number (see Nomenclature).
The particular configurations investigated in this study were two-
dimensional circular cylinder and square enclosures with horizontally im-
posed initial temperature gradients. The fluid was water in both cases.
Batchelor [Ref. I ) investigated rectangular enclosures using non-numerical
analytical methods for the limiting case of low Rayleigh number (Ra --, 0 )
and steady state conditions. Weinbaum (Ref. 2) made a similar study for the
circular cylinder. Dr. Robert F. Dressler (Ref. 3) of NASA Headquarters has
recently developed a non-numerical transient solution for the cylinder con-
figuration.
The purpnsc of the numerical study described herein is to establish
thc range of Rayleigh numbers for which the low Rayleigh number theories
of Batchelor, Weinbaum and Dressler may be considered valid. We used
the Lockheed developed LOCAP (Eckheed - Convection Analyzer Program) - - and GIM (General Interpolant Method) codes to perform these numerical
LOCKHEtD HUNTSVILLE RESEARCH & ENGINEERING CENTER - M III -- .----I---- -.--- -I-I----- -.. --- - - --.-- -

c.ot~rputalions. Tllc W C A P code is a two-dimensional code for analyzing
convection in rectangular enclosures, and the GIM code is a general purpose
fluid mechanics code for al l kinds of geometries and flow conditions. The
LOCAP computations were performed on the NASA-MSFC Univac 1108 com-
puter, and the GIM code on the much faster and more efficient NASA-Langley
STAR- 100 vector computer.
2
LOCKHEED - HUNTSVILLE RESEARCH 6 ENGINEERING CENTER
. -_..*--- - ". - -

LMSC-HREC TR 0697821
2. CIRCUIAR CYLINDER ENCLOSURE
r 1 Numerical computations were made for natural convection within the
circular cylinder configuration shown in Fig. 1.
Cold Hot Side - X
Fig. 1 - Geometry for Circular Cylinder Encloeure
The initial temperature distribution w Le based on a horizontal gradient in
the x direction, with the boundary pointe held constant in time;
T(R, t) = To + AT/^) c0.8
3
LOCKHEED HUNTSVILLE RESEARCH & ENGINFFQ iNG CENTER

The geometry module of the GIM code divided the c i rcular region into
an a r r a y of 20 x 20 a r e a elements with 21 x 21 nodal points. The proces s
treated the boundary as a four-sided figure, each side being a ci rcular a r c .
By use of stretching ful~ctions, each a r e a element became a quadrilateral,
with curvilinear sides, and with the nodal points located a t i t s four corner:.
F rom the discussion of the computer geaerated velocity vector plots, i t will
become c lear where the nodal points were placed.
We obtained transient flowfield conlputations over a range of Rayleigh
numbers f rom 1 to 100,000. Figure 2a shows a t ime history of maximum
computed flowfield velocities for various Rayleigh numbers. Both velocity
and time a r e dimensionless a s described in the nomenclature.
Up through Ra = 1000, the values of Tmax closely follow the same curve
through steady state. This curve i s a lso close to the theoretical t r a n ~ i e n t of
Dress le r (Ref. 3). Sorl?e deviation f r o m the low Ra results begins to occur a t - t = 0.1 for Ra = 5000 and 10,000. The steady state values for these cases
were extrapolated f rom the derivatives of ;max, since the numerical calcula-
tions converged slowly.
F o r higher Ra the deviations begin a t ea r l ie r t imes. Thus, for Ra = 100,000,
the low R a curve is followed until? = 0.06 where Tmax peaks and then falls to a
lower steady state value. Figure 2b shows a time history of deviation f r o m max the low R a values. Fo r Ra = 5000, the deviation is l ess than I ! yo throughout the
transient phase, while for Ra = 10,000 this level i s reached halfway through the
transient. Fo r the higher Rayleigh numbers, 20% deviation is reached about one-
third through the tranaient period.
Figure 3 shows Tmax a t steady state a s a function of Ra. The computed
results closcly approach the analytic value for low Ra, showing that the theory
i s valid up to Ra = 1000. The range of values 5000 < Ra < 50,000 may be viewed
a s a "transitiontt region. l o r l a rger Ra, the trend in Tmax approaches the (Rn)-f
dependence given by Weinbaum (Ref . 2).
LOCKHEED - HUNTSVILLE RESEARCH & ENGINEERING CENTER

LMSC-HREC TR D697821
LOCKHEED - HUNTSVILLE RESEARCH 6 ENGINEERING CENTER
.,_I__ ___ ._ .___ _ _ ..,. , , _. . .__^ ' _ _ _ __ *. _.I..-.--- - - * .. --------------I
-m I / J\ I 0
I - 2
I I
3 I &. 1 0 : $
W d
0 w * I W> 0 I
I - S
0 0 I a I
I 0 I
a 0 -2 - 0 0 3 0 0 C
I
0' 0 0 v 0
+ C
0 - *. .5 0
0 e
0 .d i! 0 a,
0 1- 0 -2 i
0 .a E 0 b
0 0 m
0 0
0 4
r? 0 0 4 o. 0 0 0 d
t 0.0 0 0 a rd 0.0 0 b Q - .. . .- 0. 0 0 4 rd o e o 0 a 11 Do. 0 b d
In W O O b a rrCP 4 , :, 2
I . . . 0 a
*O a - 0
a a
0
.I I .
0
1 I 0
N. ..1
2 0 d ( r r a l u o ~ r u o r u ~ ~ ) X'UIA 'Aa!>a~ah urnuqxwyy -

LOCKHEED - HUNTSVILLE RESEARCH & ENGINEERING CENTER

LOCKHEED - HUNTSVILLE RESEARCH 6 ENGINEERING CENTER

d
The low Ra theory i s a l s o valid f o r higher Ra during s o m e ini t ial pa r t d I of the transient . A s noted e a r l i e r , f o r Ra = 100,000 th is ini t ial s t age last
until; = 0.06. Th i s i s fu r the r indicated by compar ison of the radia l d i s t r i -
bution of velocities for Ra = 1 and 100,000 shown in Fig. 4. Not only the
maximum velocity, but a l s o the en t i r e velocity field c o m p a r e s well up t o - t = 0.06. Note that the computed distr ibution approaches the low Ra theo-
r e t i ca l s teady s t a t e distribution. Note a l s o that the e a r l y velocity d is t r ibu-
t ions a r c essent ia l ly l inear f o r a considerable d is tance away f r o m the cen te r ,
thus forming a solid body rotation inner c o r e that gradually d iminishes with
tinrc.
GIM code generated velocity vec to r plots r evea l that tb? flow a t low
Raleigh n\imbcr remains unicellular f r o m initial t r ans ien t through s teady
sh tc . The velocity vector plot shown in Fig. 5 f o r Ha = 1 a t s teady s t a t e is
seen to be nearly perfectly c i r cu la r . This plot i s essent ia l ly duplicated
throughout the t rans ient phase fo r a l l Rayleigh numbers up through Ra = 1,000.
A slight distort ion in the c i r c u l a r flow pattern i s seen fo r Ra = 10,000, and a
dist inct breakup into n ~ u l t i p l e ce l l s i s noted f o r Ra = 130,000. Th i s depar tu re
f r o m c i r c u l a r flow is a l s o indicated by the velocity contour plots in Fig . 6.
Notc thc skcwness that has developed in the s t i l l unicel lular contours f o r
Ila = 10,000. This skewness i s apparently c a r r i e d over into the mult iple c e l l
c-ontours for Ra = 100,000.
l lca t t r ans fe r a t low Raylcigh numbers i s domina tcd by conduction, and
thc 1-ffcct of increasing Rayleigh number is to inc rease the d is tor t ian of the
temperature? cc3ntours f r o m the ini t ial conduction profile. This ef fec t i s shown
in the steady s ta te t e n ~ p e r a t u r e contour plots in Fig. 7. Note tha t f o r Ra = 1
the contours a r e near ly s t r a igh t l ines , corresponding to a nea r ly pure conduction
t cmpera tu re field. The d is tor t ion in the t cmpera tu re field a t h igher Rayleigh
n i ~ ~ n b e r s leads to a n unstable condition that r e su l t s in depar tu re f r o m c i r c u l a r
flow and, fo r sufficiently high Rayleigh numbers , eventual breakup into multiple
ce l l s . This is c lea r ly indicated in the compar ison of t empera tu re contour and
vclocity vcctor plots shown in Fig. 8 f o r var ious t imes with Ra = 100,000. At .7..
t 1 0.1, the t cmpera tu re field is grea t ly d is tor ted f r o m the ini t ial pure conduction
LOCKHEED - HUNTSVILLE RESEARCH & ENGINEERING CENTER

LMSG-HREC TR D6978L1
9
LOCKHEED - HUNTSVILLE RESEARCH h ENGINEERING CENTER

LOCKHEED
10
HUNTSVILLE RESEARCH & ENGINEERING CENTER

LMSC-HREC TR ~ 6 9 7 8 2 1
LOCKHEED - HUNlSVlLLE RESEARCH 6 ENGINEERING CENTER

LOCKHEEO - HUNTSVlLl E RESEARCH 6 ENGINEERING CENTER

7-
LMSC-HREC TR ~ 6 9 7 8 2 1
13
LOCKHEED - HUNTSVILLE RESEARCH 4 ENGINEERING CENTER
-....-, .---.--. a

field, with the interior contours nearly horizontal. The flow i s s t i l l unto IC
cellular, but it has become somewhat skewed. By t = 0.2, the flow has
broken up into two cells , and this has caused the temperature contours to B r loop past the horizontal and to further dis tor t the temperature field. By -
,;; t = 0.3, a third cel l has developed and this has tended to shift the tempera-
tu re contours back toward a more stable configuration. i
'. 4 LOCKHEED - HUNTSVILLE RESEARCH 6, ENGINEERING CENTER w
. ; 111* - ------.-.---- 1: , A
, , *r*r. +-- ---. " , ~ - I. -"-?."we*---
LMSC-HREC TR ~ 6 9 7 8 2 1 3 ; 1
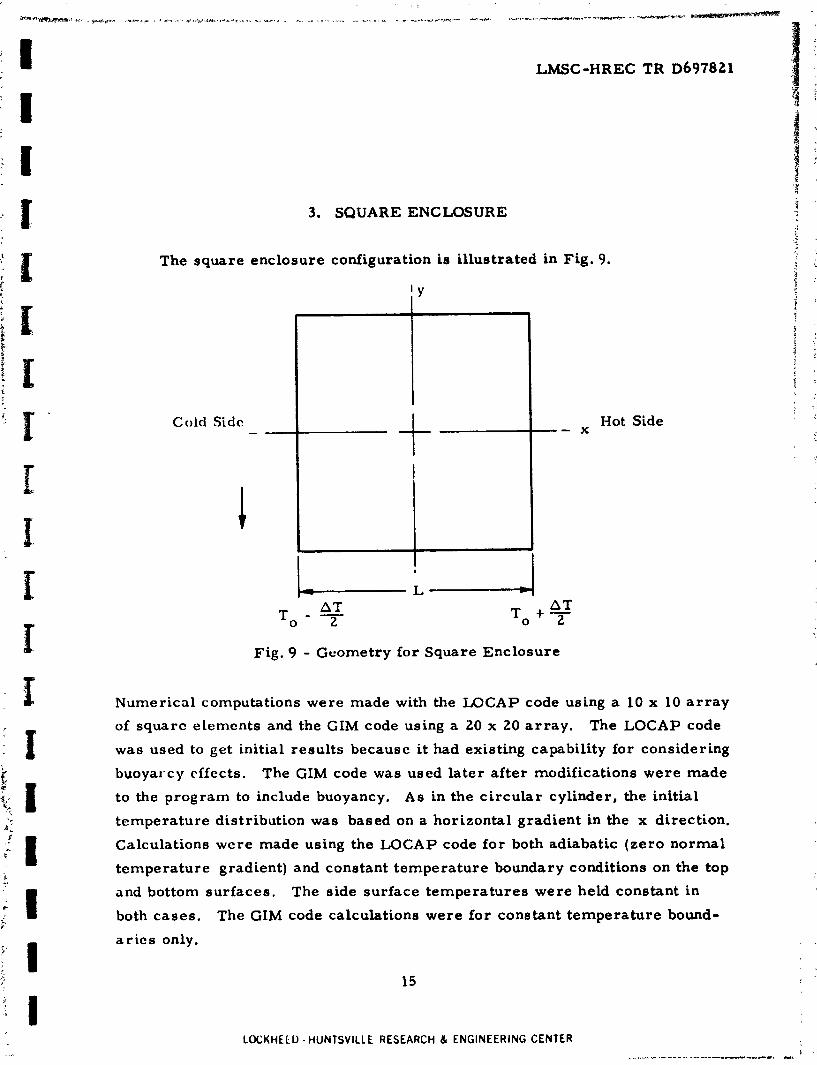
3. SQUARE ENCLOSURE
Fig. 9 - Geometry for Square Enclosure
The square enclosure configuration is illustrated in Fig.
' Y
Hot Side - X Cold Sidc! -
I
Numerical computations were made with the LOCAP code using a 10 x 10 a r r a y
of square elemcnts and the GIM code using a 20 x 20 a r r ay . The LOCAP code
was used to get initial resul ts because i t had existing capability for considering
buoyal-cy effects. The GIM code was used la te r after modifications were made
to the program to include buoyancy. As in the c i rcu la r cylinder, the initial
temperature distribution was based on a horizontal gradient in the x direction.
Calculations were made using the LOCAP code fo r both adiabatic ( ze ro normal
temperature gradient) a.nd constant temperature boundary conditions on the top
and bottom surfaces. The side surface temperatures were held constant in
both cases . The GIM code calculations were for constant temperature bound-
a r i e s only.
t
i
LOCKHEEO - HUNTSVILLE RESEARCH & ENGINEERING CENTER I
" ,.---.-- -,-.----- -

LMSC-MREC TR ~ 6 9 7 8 2 1
Shown in Fig. 10 a r e the computed maximum flow velocities a s a func-
tion of Raylpigh number after the flow has reached an equilibrium condition,
The theoretical low Rayleigh number limiting value, based on the f irst order
stream function in Ref. 1, is shown for comparison. Good agreement is noted
between the theoretical low Rayleigh number limit and the computed results.
The LOCAP results indicate significant deviation from the low Rayleigh nurn-
ber results starting a t about Ra = 1000. The GIM code results follow the same
general trend, but the deviation occurs a t highex Rayleigh number. Note that
the adiabatic boundary produces the greatest deviation from the low Rayleigh
number results in the LOCAP data.
LOCAP generated plots of velocity vectors, streamlines and absolute
velocities a re shown in Figs. 11, 12 and 13. Note the skewness that develops
in the unicellular flow patterns as Rayleigh number increases. At Ra = 100,000,
the flow appears to be nearly broken up into two cells. LOCAP plots of tem-
perature contours a r e shown in Fig. 14. Note that the adiabatic boundary
permits a greater distortion in the temperature contours than the constant
temperature boundary. This probably accounts for the greater deviation
from the low Rayleigh number results shown in Fig. 10 for the adiabatic
boundary cases.
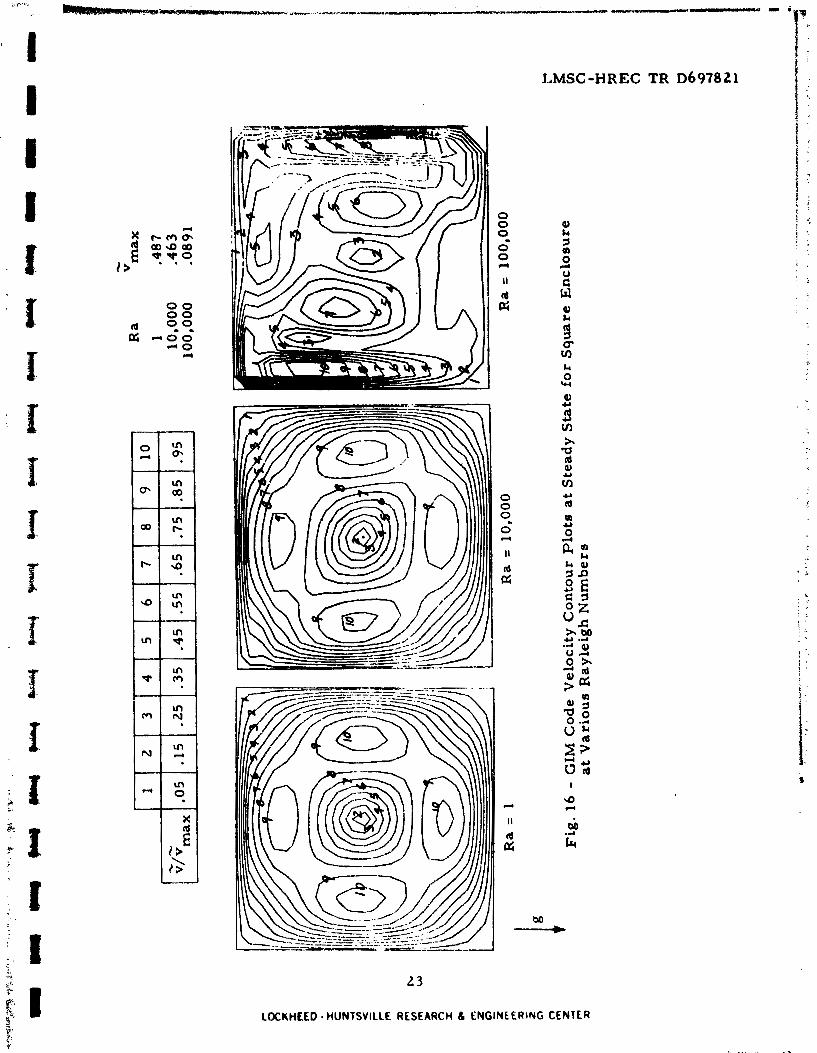
CIM code generated velocity vector, absolute velocity and temperature
contour plots a r e shown in Figs. 15, 16 and 17 for constant temperature bound-
aries. The GIM code results generally confirm the LOCAP data. The GIM
code, however, predicts a definite breakup into three convection cells a t
Ra = 100,000, whereas the LOCAP code noted only an apparent incipient
double cell pattern a t the same Rayleigh number.
The differences between the LOCAP and GIM results may be attributed
not only to differences in the LOCAP and CIM computational techniques, but
also to the fact that the GIM computations were based on finer grid of nodal
points. The finer grid for the GIM computations was made possible by the
greater speed and efficiency of the STAR- 100 vector computer.
LOCKHEED - HUNTSVILLE RESEARCH & ENGINEERING CENTER

17
LOCKHEED - HUNTSVILLE RESEARCH 6 ENGINEERING CENTER
" .


2 E .: : t g -1a;,-. c, Id 5 4a 2 k: c E a ~d o s o P; U H h
LMSC-HREC TR D697821
LOCKHEED - HUNTSVILLE RESEARCH & ENGINLERING CENTER
ail 'iZ

LMSC-HREC TR D697821
LOCKHECD HUNTSVILLE RESEARCH 6 ENGINEERING CENTE R

LMSC-HREC TR D697821
2 1
LOCKHEED - HUNTSVILLE RESEARCH 6 ENGINEERING CENTER
* . " - - --- - .-. - ".- - ..- " -- - . . - .. - . -

I dRIGINAL PAGE IS OF POOR QUALITY
LOCKHEED - HUNTSVILLE RESEARCH 6 ENGINEERING CENTER
23
LOCKHEED. HUNTSVILLE RESEARCH 6 ENGINEERING CENTER

LMSC-HREC TR D697821
LOCKHEED - HUNTSVILLE RESEARCH 4 ENGINCERING CENTER

The variation in maximum velocity a s a function of time is shown in
Fig. 18 for the GIM code data. The LOCAP code did not provide realistic
rcsults during the transient phase for the lower Rayleigh numbers. The
GIM code rcsults in Fig. 18 exhibit basically the same trends noted earlier
in Fig. 2 for the circular cylinder. Again, the theoretical low Rayleigh num-
ber limiting value, based on the first order stream function, + in Ref. 1, is 1' shown for comparison.
The velocity distribution along a horizontal bibector is shown in Fig. 19
as a function of time for R a = 1. The low Rayleigh number theoretical equi-
lrbrium distribution is shown for comparison. The traversing of the theo-
retical equilibrium curve over the GIM code results near equilibrium for
x/(L/z) > 0.7 is obviously not realistic. The solution for the f irst order
stream function given by Batchelor in Ref. 1 is actually an approximate solu-
tion intended to provide a simple algebraic equation form for the stream
function. Hence, exact agreement is not expected.
A conlparison of temperature contour and velocity vector plots at
various times is shown in Fig. 20 for Ra = 100,000. A strong correlation is
indicated between distortion of the temperature field and departure from
synlnletrical unicellular flow, as was shown earlier i12 Fig. 8 for the
circular cylinder.
A strong similarity has been noted throughout this section between the
square enclosure and the previously discussed circular cylinder results.
This suggests the possibility of using the simpler, more analytically defined
circular cylinder theory to predict convection velocities and flow patterns
in actual experiment configurations, which a r e more likely to be square than
circular. In order to match velocities in a model circular cylinder configura-
tion to an experimental square enclosure, we set the theoretical equilibrium
velocities for the two configurations equal and find the ratio of the circle
diameter to square side (page 29):
LOCKHEED. HUNISVILLE RESEARCH & ENGlNtERlNG CENTER
. . . .

LOCUHEED - HUNTSVlLLE RESEARCH & ENGINEERING CENTER

Fig
. 19
- V
elo
city
Dis
trib
uti
on
as a
Fu
nct
ion
of
Tim
e f
or
Wa
ter
Co
nta
ined
in
a S
qu
are
E
ncl
osu
re w
ith
Ra
yle
igh
Nu
mb
er =
1

LMSC-HREC TR Dbo7821
I . . - - - - - - - - - - - e m . .
LOCKHEED - HUNTSVILLE RESEARCH 6 ENGINEERING CENTER

m u I I I III L M
LMSC-HREC TR D69782l
Compare this ratio to the ratio 1.1284 that yields equal areas for the circle
and square. This somewhat fortuitous result clearly implies that an experi-
mental square enclosure may be closely modeled by a circular cylinder of
equal cross sectional area. The validity of this modeling is additionally
supported by the rather remarkable degree of radial symmetry that exists
in the low Rayleigh number velocity field in the square enclosure. This is
dieplaycd in the angular variation of velocity shown in Fig. 21 for various
radial distances. These velocities were determined from the first order
stream function in Ref. 1.
29
LOCKHEEO - HUNTSVILLE RESEARCH 6 tNGlNEERlNG CENTER
ti-
t'""'
(Fr
om
Ref. 1
)
0 1
I I I
n 3 o
6
0
90
An
gle
, 8
(de
g)
Fig
. 2
1
Va
ria
tio
n o:
Flu
id V
elo
city
wit
h A
ng
ula
r P
osi
tio
n A
lon
g C
ircu
lar
Ar
cs
in L
iqu
id
Fil
led
Sq
ua
re C
on
tain
er

LMSC-HREC TR D697821
4. CONCLUSIONS
The primary conclusion to be drawn f r o m this study i e that the low
Rayleigh number theorv for convection in c i rcular cylinder and square box
enclosures i s valid throughout the transient phase to equilibrium fo r Rayleigh
numbers up to a t leas t 1000. The GIM code resul ts , which we assume to be
most valid, show a deviation of 20% from the low Rayleigh number resul ts a t
Ra = 5,000. Additionally, for higher Rayleigh numbers, the low Rayleigh
number theory is valid f o r some portion af the transient, depending on the
value of the Rayleigh number, before significant deviation becomes apparent.
In the case of both c i rcular cylinder and square box enclosures a t Ra = 100,000
the valid portion of the transient phase extends up to?= 0.06, which i s approxi-
mately 20410 of the time required to reach equilibrium.
Another conclusion drawn f rom the comparison of the c i rcular cylinder
and square box enclosure resul ts i s that experimental square shaped con-
ta iners can be analytically modeled ra ther closely by c i rcu la r ~ y l i n . ~ e r s of
equal c r o s s sectional a r e a for the prediction of convection velocities and flow
patterns a t low Rayleigh number.
3 1
LOCKHEED. HUNTSVILLE RESEARCH 6 ENGINEERING CENTER
. +-- .-.-.- *------.-- . .-

I
'I-
4 d -
I
LMSC-HREC TR D(9 ; 7821
REFERENCES
1 . Batchelor, G. W . , "Heat Transfer by F r e e Convection Across a Closed Cavity Between Vertical Boundaries at Different Temperatures," Quart. Appl. Math., Vol. 12, No. 3, 1954, p. 209.
2. W einbaurn, S., "Natural Convection in a Horizontal Circular Cylinder , I 1
J. Fluid Mech., Vol. 18, 1964, p. 409.
3. Dress ler , R . F., NASA Headquarters, Washington, D. C. (to be published).
LOCKHEED -
, ..
HUNTSVILLE RESEARCH 4 ENGINEERING CENTER
.. ... .