Embed Size (px)
Citation preview
版权所有©1993-2021金蝶国际软件集团有限公司
Kingdee International Software Group2020 Annual Results Announcement
Stock Code: 268.HK25 March 2021
2
Business Highlights
Cloud Market Update
Cloud Strategy Update
CFO Report Appendix

3
Business Highlights
Cloud Market Update
Cloud Strategy Update
CFO Report Appendix

4
v KIS and K/3 Wise terminatedv EAS license: -22.3% yoyv Maintenance & Service: -2.2% yoyv Implementation: -13.3% yoy
v Enterprise Cloud Service: +46.3% yoyv Finance Cloud Service: +70.0% yoyv Industry Cloud Service +20.7% yoy
Cloud Services
Revenue 45.6% YoY Revenue -28.2% YoY
Management Software
Growth by Segments

5
Cloud Services in 2020Cloud Services in 2019
+45.6%
Growth of Cloud Services
39.5% 57.0%

6
2019 2020
Growth of Cloud Subscription
Subscription ARR reflects approximate annualized recurring revenue as of 31 Dec 2020 fromKingdee Cloud products.
+58%
Subscription ARR
~630mn
~1bn

7
Growth of Cloud Contract Liabilities
(RMB’000) 2020 2019 Change
Subscription 824,892 421,541 95.7%
Others 171,944 121,252 41.8%
Total Cloud Contract Liabilities 996,836 542,793 83.6%

8

9
2020: Total New & Upsells:
- Cosmic New Clients: - Cosmic Upsell Clients:
Total contract size:
Average contract size:
Revenue
36728384
RMB 467mn
RMB 1.3mn
Rmb 190mn, +220% yoy
Cosmic Overview
通 I 源 I 石 I 油

10
Cosmic Distribution
Cloud technology Customer Origin Distribution Customer Industry Distribution
37%
23%
40%
Kingdee new customerCosmic upsellKingdee ERP upgrade
49.3%50.7%
Public cloud Hybrid cloud
22.5%
14.2%
12.1%9.3%
8.7%
7.8%
4.6%
3.8%
3.5%
3.5%1.7%
8.4%
Manufacturing Business serviceRetail & Wholesale Construction & Real estateEnergy TMTSocial service CoglomerateFinancial AgricultureMetallurgy Others

11
Cosmic Subscription Distribution by Module
2019 2020
32.5%
23.4%5.6%
38.5%
Finance/Accounting Supply Chain, Channel, SRMConstruction & Real Estate Cosmic Platform
36.1%
17.0%9.3%
37.6%
Finance/Accounting Supply Chain, Channel, SRMConstruction & Real Estate Cosmic Platform

12
Supply ChainCloud
• Purchase Cloud• Sales Cloud• Inventory Cloud• Supplier Relationship
Cloud
Manufacturing Cloud
• Production Manufacturing Cloud• Manufacturing coordination Cloud• Manufacturing Execution Cloud• Quality Cloud• Equpiment Cloud• Product Service Cloud
HRCloud
• Core HR Cloud• HR Platform Service Cloud• Organization Development
Cloud• Salary Welfare Cloud• HR Supply Chain Cloud• Social Insurance & Tax Cloud
MarketingCloud
• Omni-Channel Cloud• Guanyi Cloud• Fxiaoke• E-commerce Cloud• Community E-commerce Cloud
Finance Cloud
• Financial Accounting Cloud• Enterprise Performance Cloud • Mgmt Accounting Cloud• Tax Cloud• Cash Mgmt Cloud• Employee Service Cloud
Data AnalyticsCloud
• Data Platform• Lite Analysis• Financial Reporting Cloud• Industry peer Analysis• Smart Data Insight
Cosmic SaaS Portfolio
Industries: Steel/Metallurgy, Real Estate, Construction, Property Mgmt, Modern Agriculture, Tobacco, Equipment Production, Foreign Trade, Asset Supervision and Administration, etc.
Supply ChainCloud
MarketingCloud
Data AnalyticsCloud
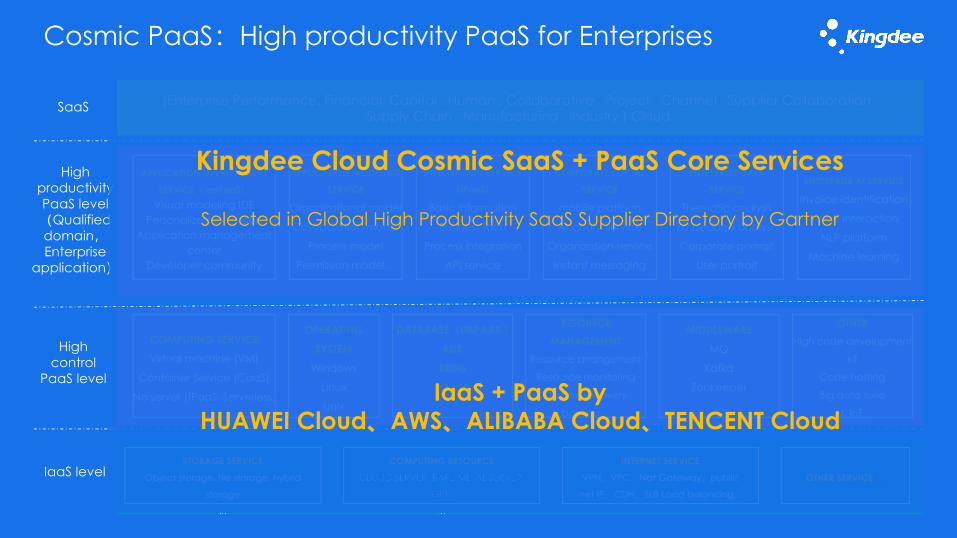
Cosmic PaaS:High productivity PaaS for Enterprises
(Enterprise Performance, Financial, Capital , Human , Collaborative , Project , Channel , Supplier Collaboration , Supply Chain , Manufacturing , Industry ) Cloud.
STORAGE SERVICE
Object storage, file storage, hybrid
storage
COMPUTING RESOURCE INTERNET SERVICE
VPN、VPC、Nat Gateway、public
net IP、CDN、SLB Load balancing...
OTHER SERVICE …
COMPUTING SERVICEVirtual machine (VM)
Container Service (CaaS)
No server (fPaaS, Serverless)
OPERATING
SYSTEMWindows
Linux
Unix
…
DATABASE(DBPAAS )
RDS
REDIS
HBASE…
RESOURCE
MANAGEMENTResource arrangement
Resource monitoring
Disaster recovery
backup…
MIDDLEWAREMQ
Kafka
Zookeeper
…
OTHERHigh code development
kit
Code hosting
Big data suite
AI, IoT...
APPLICATION DEVELOPMENT
SERVICE( adPaaS)
Visual modeling IDEPersonalized extension
Application management center
Developer community
INTEGRATION SERVICE
(iPaaS)
Basic information
Business form
Process integration
API service
CORPORATE SOCIAL
SERVICE
mobile platform
Account service
Organization service
Instant messaging
ENTERPRISE DATA
SERVICE
Thematic analysis
Embedded analysis
Corporate portrait
User portrait
ENTERPRISE AI SERVICE
Invoice identification
Voice interaction
NLP platform
Machine learning
SaaS
IaaS level
High productivity PaaS level (Qualified domain,Enterprise
application)
High control
PaaS level
APPLICATION MODELING
SERVICE
Organizational model
Collaboration model
Process model
Permission model…
Kingdee Cloud Cosmic SaaS + PaaS Core Services
Selected in Global High Productivity SaaS Supplier Directory by Gartner
IaaS + PaaS byHUAWEI Cloud、AWS、ALIBABA Cloud、TENCENT Cloud

14
Cosmic PaaS Technology Highlights
Coding amount reduced by 90%
Development efficiency improve by 500%
ChipsHisilicon, Loongson,
Phytium
DatabaseHuawei Gauss DB,
Dameng DB
ServerHuawei Taishan, Inspur, Great
Wall, Sugon
System integration
Tai chi, Inspur, Chinasoft, Huadi, Thunisoft,
DHC, Tsinghua Unigroup, etc.
OSHuawei Euler OS,
NeoKylin OS, Kylin OS
Low-code Development Localization Efforts Enterprise cloud computing1 2 3 Selected into Gartner's Global High-
Productivity PaaS vendor list
Full Stack development + Open Source, to
support 100% local solution
Container + Micro-service,
Elastic computing
Applied over 160 patents
Source: Gartner

15

16
Galaxy Overview
customers cumulatively, +25% YoY
from Kingdeenew customers
dollar retention customer retention
growth 45%+ yoygrowth 31% yoy
>17,200
90%
86% 85%
ARRRevenue
金砖新开发银行

17
Galaxy Customer Analysis
28% of customers have 2
solutions
33% of customers have 3+
solutions
98.0%
52.7%
18.7%4.8% 1.1%
Finance/A
ccounting
Supply
Chain
Manufacturin
g
Omni-channel
Caterin
g
79.0%
12.0%
9.0%
Customers New to ERPCustomers From CompetitorKingdee existing customers

18
31% Revenue Growth
25% Customer
Growth
86% Dollar Retention
Rate
Galaxy Customers by Sector
15%
15%
13%
Retail
Service
Manufacturing
IT
Building Materials
Mechanical & Electrical
Government, Medical & Public Services
Education & Media
Morden Agriculture

19
Galaxy SaaS Portfolio
• General Ledger• Smart Accounting
Platform• Budget Mgmt• Expense Mgmt• Cost Mgmt• Mgmt Accounting• Cash Mgmt
Finance Cloud Supply Chain
Cloud• Sales Mgmt• Purchase Mgmt• Inventory Mgmt• Inter-organization
Settlement• Bar-code Mgmt• Supplier Relationship• Credit Mgmt Supply
Chain
PLM Cloud
• R&D Project Mgmt• Design Document Mgmt• Material Mgmt• Material Standard• Design BOM Mgmt• Design Modification Mgmt• CAD Software Integration
• Engineering Data Mgmt• Manufacturing Mgmt• Outsource Mgmt• Workshop Mgmt• Quality Mgmt• Quality Assurance• Manufacturing Line
Production
Manufacturing Cloud
MES Cloud
• Smart Workshop• Equipment Online• OEE Analysis• Emergency Mgmt• Fog Computing
Deployment
• Franchise Mgmt• Multi-end POS System• Store Coordination• Membership Mgmt• Promotion Mgmt
Retail Cloud
Omni-ChannelCloud
• BBC Distributor Portal• BBC Business Center• Order Plan Mgmt• Promotion Mgmt• All Channel Membership
Mgmt
• Sales Forecast• Order Plan Forecast• Order Risk Warning
Smart Data Analytics Cloud
Supply ChainCloud
Manufacturing Cloud
Retail Cloud Smart Data Analytics Cloud

20
Galaxy’s 18 industry solutions
Food
Consumer Electronics
Instruments & Meters
Electronics
IndustrialMechanical
Auto Parts CosmeticsOnline Education
Catering
Bakery
Household Appliance
Tourism
Home Decoration
Construction
Chemical
Service
Pharmaceuticals
Technology

21

22
Stellar & Jingdou Overview
Jingdou Cloud:
Paying Customers
Dollar Retention Rate
>160,000
76%
Kingdee Cloud Stellar:
Avg subscription
Launched in 2020
>3,000+ customers
RMB8,000

23
Stellar & Jingdou SaaS Portfolio
• Finance Cloud• Tax Cloud
• Customization Development Platform
• Open API• APP Market Place• DingTalk, Work Wechat
Connection
• Retail Cloud (Unmanned Store, Cashier Free, Code Scan Purchase)
• Ordering Mall• Supply Chain Cloud
Industries: Wholesale, Retail, Technology, Professional Service, etc.
• Lite Analysis• Smart Reporting• Business Dashboard• Data Platform
Operation Finance Eco-system Data Service
24
Business Highlights
Cloud Market Update
Cloud Strategy Update
CFO Report Appendix

25
*数据来自IDC研究报告《Enterprise Application SaaS Tracker for PRC , 2020H1 IDC. Inc. 》
Market Leader in China's Enterprise SaaS Market
PRC Finance Cloud Market in 2020H1PRC Enterprise ERM SaaS Market in 2020H1
OthersOthers

26
0
2000
4000
6000
8000
10000
12000
2020e 2021e 2022e 2023e 2024e
EA SaaS market CAGR in 2020-2024:
The EA SaaS market in China is becoming more and more mature, which is mainly focused on the following four sections
• Application SaaS
• Platform SaaS
• Ecosystem
• Data Intelligence
37.1%
China Enterprise Application SaaS Market Trend
Source: IDC PRC PUBLIC CLOUD SERVICES TRACKER 2020H1
PRC EA SaaS Market Forecast, 2020-2024($ M)
35.7%39.4% 38.4%
36.2%
27
0.0%
4.0%
8.0%
12.0%
16.0%
20.0%
Discrete
Manufa
cturing
IT Servi
ceReta
il
Finance
Healthcare
Process Manufa
cturing
Educatio
n
Professi
onal Servi
ce
Telecom
Media
Constructio
n
Utilities
Transp
ortatio
n
Government
Public Se
rvice
2019H1 2020H1
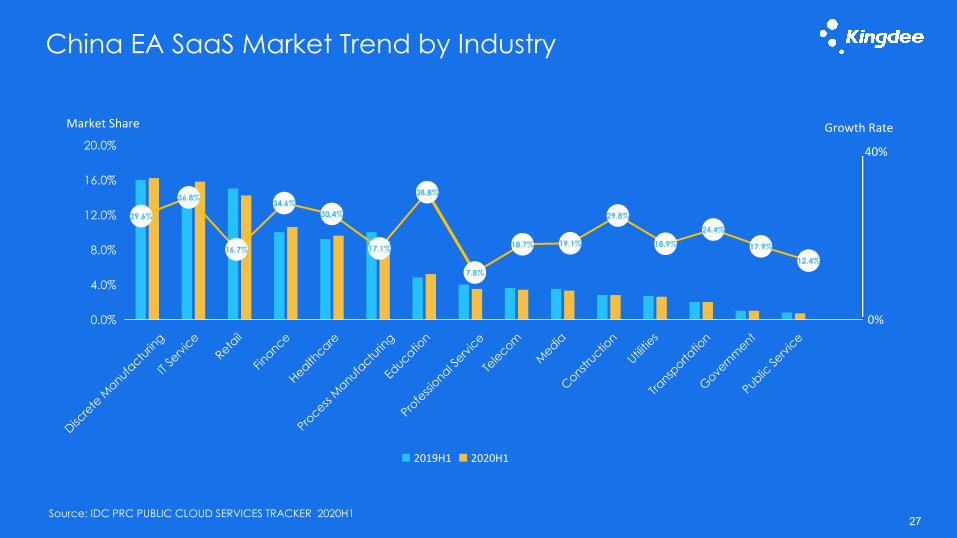
China EA SaaS Market Trend by Industry
Source: IDC PRC PUBLIC CLOUD SERVICES TRACKER 2020H1
29.6%
36.8%
16.7%
34.6%30.4%
17.1%
38.8%
7.8%
18.7% 19.1%
29.8%
18.9%
24.4%
17.9%
12.4%
Market Share Growth Rate
40%
0%

28
Business Highlights
Cloud Market Update
Cloud Strategy Update
CFO Report Appendix

29
Kingdee is the winner of IDC 2020 SaaS ERP Customer Satisfaction Award, based on the results of IDC's SaaSPath Global Survey, and the ONLY Chinese SaaS company recognized by this award.v The Customer Satisfaction Award Program (the CSAT Awards) seeks to recognize
leading software-as-a-service (SaaS) vendors in each application market with the highest customer satisfaction scores based on IDC's SaaSPath survey. SaaSPath is a global survey of approximately 2,000 organizations across all geographic regions and company sizes, where customers are asked to rate their vendors on more than 30 different customer satisfaction metrics.
v The SaaSPath survey is conducted across all company sizes around the world, including roughly 55% IT leaders and 45% line of business leaders, and its survey targets cover enterprises senior management. All respondents go through an extensive screening process to ensure they are familiar with the technologies they are being asked about, are current users, and have influence in their company's technology buying decisions.
IDC 2020 SaaS Customer Satisfaction Award

30
China enterprise addressable market for Kingdee Cloud
Source: China Top-500 Enterprise Development Report
Rmb20mn-2bn
Rmb2-10bn
SaaS demand Transformation DriverAmount
10k+
500k+
Rmb3-20mn
20mn+Scenario (digital marketing),Business integrationAccounting service
<Rmb1mn 88mn+ Single application,Accounting service
>Rmb10bn1000+217 with Rmb100bnannual revenue
Strategic innovation,
Product and service innovation,
Business operation
<Rmb3mn
Single application,Scenario (digital marketing),Business/Finance/Tax integration
15mn+
Enterprise market segment
Localization, Platform
Indusrty specific,
Business scenario
Loclization, Platform
Sharing service,
Industry specific
Platform
Indusrty specific,
Business scenario
Large
MediumLarge
Medium
Small
Micro
IndividualBusiness
Annual Revenue
Strategic innovation,
Product and service innovation,
Business operation
Product and service innovation,
Business operation
Business operation
Business operation
Business operation
Cosmic
Cosmic, EAS Cloud
Galaxy
Stellar
Stellar, Jingdou
Wise Note
31
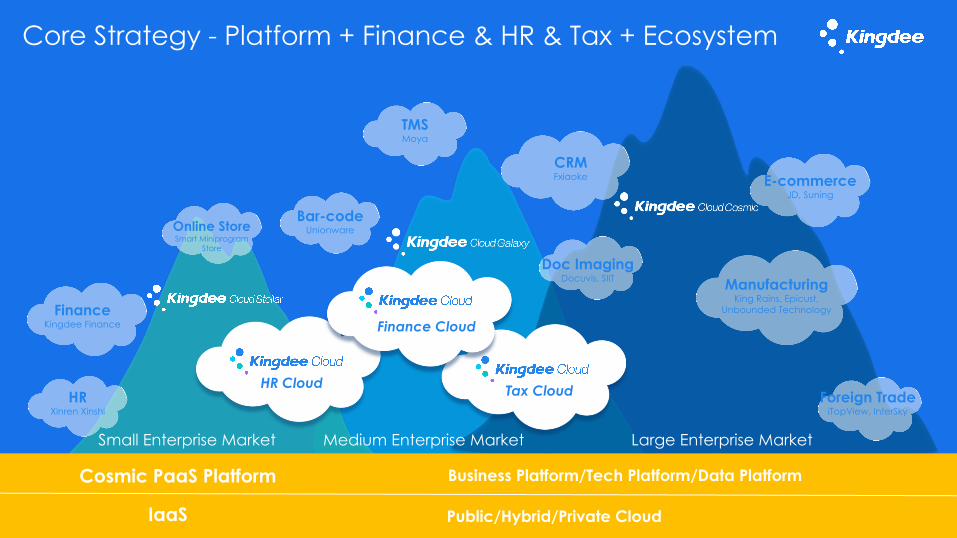
Small Enterprise Market Medium Enterprise Market Large Enterprise Market
IaaS
Cosmic PaaS Platform
Public/Hybrid/Private Cloud
Business Platform/Tech Platform/Data Platform
Online StoreSmart Miniprogram
Store
HRXinren Xinshi
TMSMoya
Doc ImagingDocuvis, SIIT
Foreign TradeiTopView, InterSky
ManufacturingKing Rains, Epicust,
Unbounded TechnologyFinanceKingdee Finance
Bar-codeUnionware
CRMFxiaoke E-commerce
JD, Suning
Core Strategy - Platform + Finance & HR & Tax + Ecosystem
Tax CloudHR Cloud
Finance Cloud

32
Open Ecosystem Platform for ISVs
Applications
Infrastructure
多租户Muti-Tenant
元数据Metadata
微服务Microservices
容器
Doker
分布式Distribution
安全Security
区块链Block chain
性能&可靠性
Performance & Availability
Core capabilities
行业&客户&用户定制Customization
企业模型组件Building Block
企业流程模型Workflow Chatbot
对话机器人 嵌入式AIEmbedded AI
轻分析Light Analysis
移动&社交Mobile&Social
APP&API Market应用市场
Packages
应用包管理Code Audit
代码审计CI/CD
持续集成与持续交付License
ISV许可
CloudIDE云开发
ToolsBOTP
业务流设计
Light IDE
轻量级开发
KDSript
脚本开发
Html5
轻应用
Workflow
工作流设计 APIs&Events
UnitTest
单元测试 SDK
33
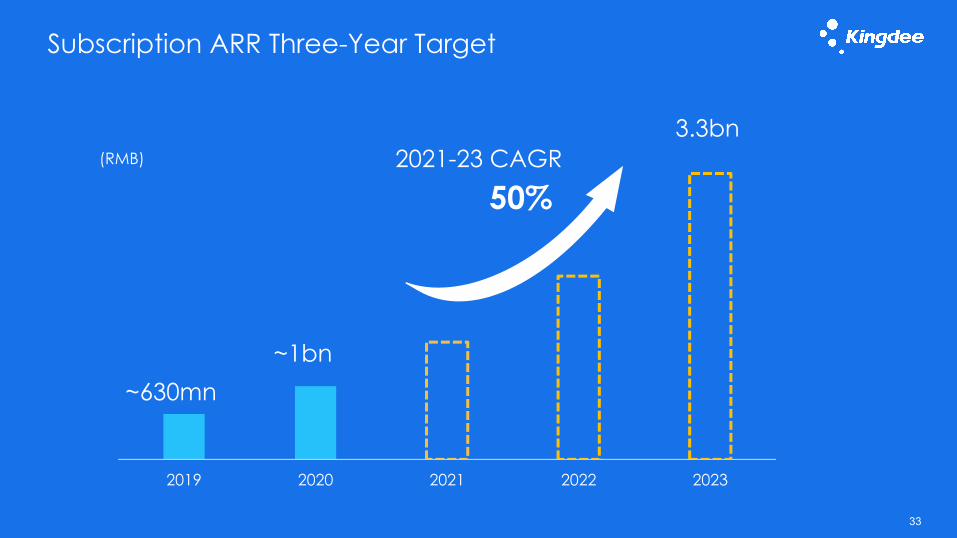
Subscription ARR Three-Year Target
2019 2020 2021 2022 2023
50%
~630mn~1bn
3.3bn(RMB) 2021-23 CAGR

34
Cloud Services Revenue Guidance
Guidance:
2021 Cloud
services revenue
up by yoy45%+
0
500
1,000
1,500
2,000
2,500
3,000
2015 2016 2017 2018 2019 2020 2021
(RMB mn)
45%+

35
Business Highlights
Cloud Market Update
Cloud Strategy Update
CFO Report Appendix
36
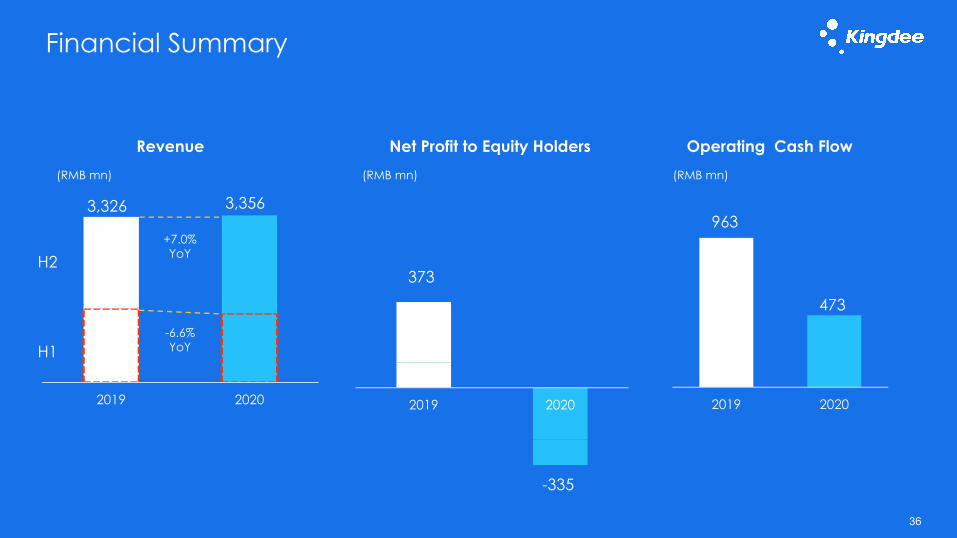
2019 2020 2019 2020
Revenue Operating Cash Flow(RMB mn)
Net Profit to Equity Holders(RMB mn) (RMB mn)
Financial Summary
473
963
373
3,326 3,356
2019 2020
H2
H1
+7.0%YoY
-6.6%YoY
-335

37
Key Financial Drivers - Business mix shift
72.3%
65.8%
2019 2020
-6.5pp
KIS & K/3 Wise Cloud EAS and Others
2019 2020
-82.2%
-6.8%
+45.6%
Revenue mix shift in 2020 Gross Margin dip due to proactive business transition with KIS & K/3 Wise termination

38
Key Financial Drivers – R&D Investments
R&D Cost Capitalized R&D Amortization R&D expense
2019 2020
+35.7%
-34.2%
+67.7%
113
506
-195
79 113
-607
Inv property Mgmt software Cloud
2019 2020
R&D expense hike due to1) investment expansion, 2) lower capitalization rate
Operating loss due to 1) Cloud investments, 2) KIS&K/3 Wise termination
(RMB mn)

39
222
422
825
2018 2019 2020
Key Financial Drivers - Adjusted with contract liabilities
+95.7%
Cloud subscription contract liabilities
3,5253,760
2019 2020
Adjusted Revenue = Revenue + (Year end contract liabilities - Year start contract liabilities)
+6.7%
+90.0%
(RMB mn) (RMB mn)

40
Key Financial Drivers - OPEX
S&Mas a % of total revenue
42.5%+1.2pp
29.3%+11.7pp
RMB 1.4bn+3.7% yoy growth
R&Das a % of total revenue
RMB 984mn+67.7% yoy growth
G&Aas a % of total revenue
12.3%+0.7pp
RMB 414mn+7.1% yoy growth

41
Key Financial Drivers
(Rmb mn)
2020 Operating Cash major inflow & outflow

42
Financial Overview
Note: The Group believes that providing non-GAAP financial measures may prove useful to investors and enable investors to evaluate financial results in the same way management does* Note: non-GAAP tax provisions uses a long-term projected tax rate of 12.5%
(RMB’000) 2020 2019 ChangeRevenue 3,356,445 3,325,590 0.9%Cost of Sales -1,147,437 -922,373 24.4%Gross Margin 65.8% 72.3% -6.5pp Total Operating Expenses -2,892,449 -2,395,581 20.7%Other Income & Gains 262,538 376,157 -30.2%Operating Profit -415,353 423,787 NAOperating Margin -12.4% 12.7% NAFinance Costs– net 35,934 5,370 569.2%Loss before Income Tax -382,739 396,131 NANet Profit – equity holders -335,479 372,580 NANet Profit Margin -10.00% 11.20% NADiluted EPS(cents) -10.12 11.52 NAGain on investment properties -5,550 -39,994 -86.1% Stock-based compensation 161,194 103,948 55.1% Tax effects and adjustments* 17,450 7,994 118.3% Non-GAAP Net Profit -213,332 428,540 NA Non-GAAP EPS(cents) -6.43 13.25 NA
43
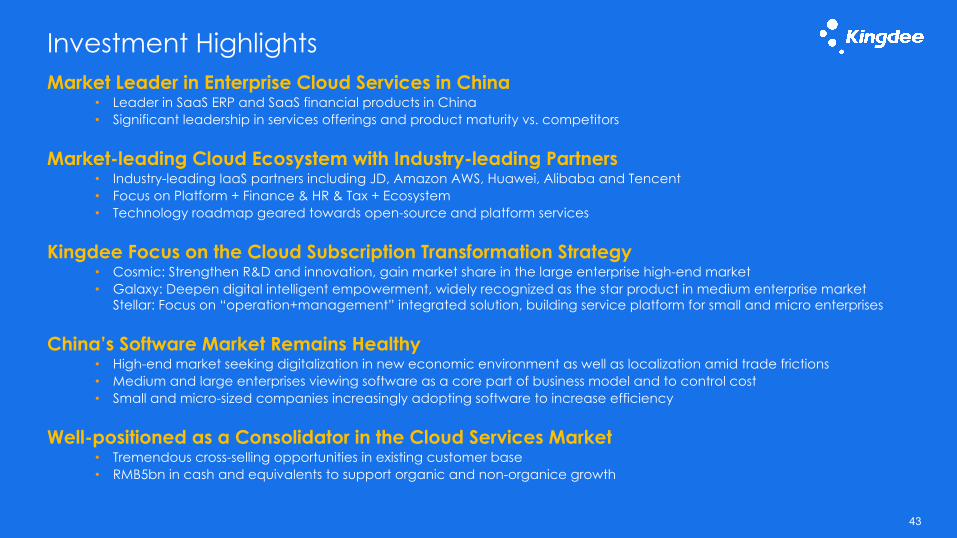
Market Leader in Enterprise Cloud Services in China• Leader in SaaS ERP and SaaS financial products in China• Significant leadership in services offerings and product maturity vs. competitors
Market-leading Cloud Ecosystem with Industry-leading Partners• Industry-leading IaaS partners including JD, Amazon AWS, Huawei, Alibaba and Tencent• Focus on Platform + Finance & HR & Tax + Ecosystem• Technology roadmap geared towards open-source and platform services
Kingdee Focus on the Cloud Subscription Transformation Strategy • Cosmic: Strengthen R&D and innovation, gain market share in the large enterprise high-end market• Galaxy: Deepen digital intelligent empowerment, widely recognized as the star product in medium enterprise market
Stellar: Focus on “operation+management” integrated solution, building service platform for small and micro enterprises
China’s Software Market Remains Healthy• High-end market seeking digitalization in new economic environment as well as localization amid trade frictions• Medium and large enterprises viewing software as a core part of business model and to control cost• Small and micro-sized companies increasingly adopting software to increase efficiency
Well-positioned as a Consolidator in the Cloud Services Market• Tremendous cross-selling opportunities in existing customer base• RMB5bn in cash and equivalents to support organic and non-organice growth
Investment Highlights

44
Business Highlights
Cloud Market Update
Cloud Strategy Update
CFO Report Appendix

45
(RMB’000) 2020% of TotalRevenue
2019 % of TotalRevenue
Change
Cloud services business 1,912,385 57.0% 1,313,595 39.5% 45.6%
Management Software business 1,444,060 43.0% 2,011,995 60.5% -28.2%
- Sale of software licenses 447,626 13.3% 979,607 29.5% -54.3%
- Implementation services 465,711 14.0% 537,403 16.2% -13.3%
- Maintenance & training 459,820 13.7% 470,195 14.1% -2.2%
- Others 70,903 2.0% 24,790 0.7% 186.0%
Total 3,356,445 100.0% 3,325,590 100.0% 0.9%
Total Revenue by Segments
46
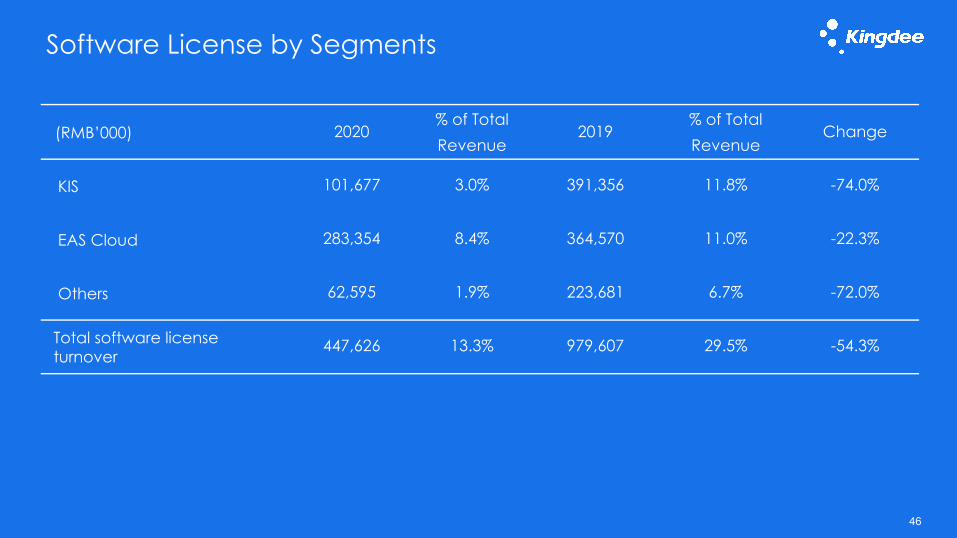
Software License by Segments
(RMB’000) 2020% of TotalRevenue
2019 % of TotalRevenue
Change
KIS 101,677 3.0% 391,356 11.8% -74.0%
EAS Cloud 283,354 8.4% 364,570 11.0% -22.3%
Others 62,595 1.9% 223,681 6.7% -72.0%
Total software license turnover
447,626 13.3% 979,607 29.5% -54.3%

47
R&D Expenses
(RMB’000) 2020 2019 Change
Salaries and staff welfare 772,016 555,587 39.0%
Option & restricted stock expense 45,324 31,192 45.3%
Fixed costs 32,937 32,642 0.9%
Travelling costs 8,382 7,988 4.9%
Others 23,900 23,090 3.5%
Total R&D costs 882,559 650,499 35.7%
Less: development costs capitalised -314,119 -477,654 -34.2%
Add: amortisation 415,434 413,982 0.4%
Total R&D Expenses 983,874 586,827 67.7%
R&D Expenses / Total Revenue 29.3% 17.6% +11.7pp

48
Selling & Marketing Expenses
(RMB’000) 2020 2019 Change
Advertising and marketing 116,904 115,516 1.2%
Sales promotion 162,395 132,792 22.3%
Salaries and staff welfare 998,362 957,172 4.3%
Project cooperation and outsourcing service fee 22,774 43,489 -47.6%
Travelling expenses 48,592 47,463 2.4%
Fixed costs 68,660 69,078 -0.6%
Others 7,393 8,504 -13.1%
Total 1,425,080 1,374,014 3.7%
S&M % of Total Revenue 42.5% 41.3% +1.2pp
49
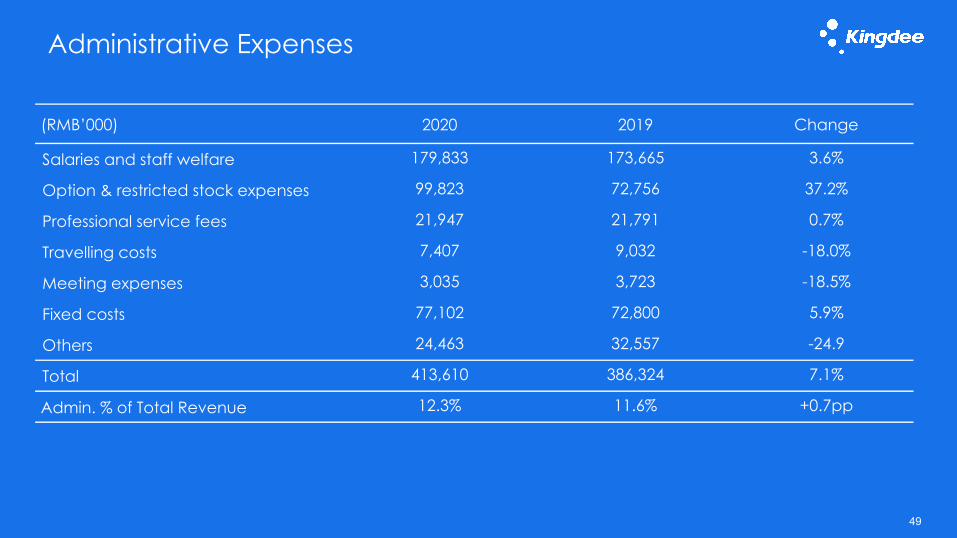
Administrative Expenses
(RMB’000) 2020 2019 Change
Salaries and staff welfare 179,833 173,665 3.6%
Option & restricted stock expenses 99,823 72,756 37.2%
Professional service fees 21,947 21,791 0.7%
Travelling costs 7,407 9,032 -18.0%
Meeting expenses 3,035 3,723 -18.5%
Fixed costs 77,102 72,800 5.9%
Others 24,463 32,557 -24.9
Total 413,610 386,324 7.1%
Admin. % of Total Revenue 12.3% 11.6% +0.7pp

50
(RMB’000) 2020 2019 Change
VAT refund 135,544 164,308 -17.5%
Government projects 60,965 31,317 94.7%
Rental income - net 73,129 73,243 -0.2%
Others -7,100 107,289 NA
Total 262,538 376,157 -30.2%
VAT % of Total Revenue 4.0% 4.9%
Other Gains

51
Balance Sheet Overview
(RMB’000) 31 Dec. 2020 31 Dec. 2019 Change
Trade and other receivables 383,238 330,153 +16.1%
Cash and equivalents 5,045,176 3,273,877 +54.1%
Total assets 10,722,079 8,420,153 +27.3%
Current assets 6,183,414 4,241,447 +45.8%
Borrowings 120,000 199,625 -39.9%
Trade and other payables 794,603 684,624 +16.1%
Total equity 7,958,477 6,145,671 +29.5%

版权所有©1993-2021 金蝶国际软件集团有限公司
Thanksterima kasih
感謝
谢谢
ありがとう
ข อ บ ค ุ ณ


![Yum Cha 飲 茶 - chinastock.com.hk · 2 Kingdee International [0268.HK] Kingdee International (Kingdee) reported a satisfactory set of 1H 2016 results. Its 20.5% top-line growth](https://img.dokumen.tips/doc/110x75/5f0850d57e708231d4216792/yum-cha-e-eoe-2-kingdee-international-0268hk-kingdee-international-kingdee.jpg)