Embed Size (px)
Citation preview

International Journal of Scientific and Research Publications, Volume 3, Issue 8, August 2013 1 ISSN 2250-3153
www.ijsrp.org
Kinetics of Lead and bio-concentration factor (BCF) in
different tissues of Clarias batrachus during experimental
Plumbism
Prafulla Chandra Rout &BijayanandaNaik*
Faculty of Zoology, Govt. Sc. College, Malkangiri, Odisha, India 764045
Abstract:A Common Indian cat fish, Clarias batrachus Linneaus was treated with Lead Acetate for sub-acute and chronic exposure
to the xenobiotic. The sub acute study included 3 days and 7 days exposure to different concentrations of lead acetate, while chronic
study included exposure to 15 ppm lead acetate for 105 days. In all the cases tissues from Gills, Bones, Liver, Blood, Kidneys,
Muscles, Skin and GI tract were removed and analyzed by AAS to find lead accumulation. The Bio-Concentration Factor (BCF) was
calculated .The BCF varies from organ to organ. Additionally , X-rays photography was made on the chronic treated fishes from time
to time, to see whether skeletal tissue is a target of the heavy metal or not. The Co-relation Co-efficient ( r’) in these tissues between
Lead treatment and Lead accumulation was found to be highly significant suggesting it both as a dose-dependent and time-dependent
process.
Index terms: Atomic Absorption Spectrophotometer(AAS), Bio-Concentration Factor (BCF), chronic treatment, Clarias, Kinetics,
Lead accumulation, Pool, Sub acute, Target organ, X-rays.
I. INTRODUCTION
he heavy metals occupy a frontier position in IRPTC. These have been recognized and registered as potentially toxic chemicals,
may be neurotoxic, haemotoxic, genotoxic or carcinogenic. The most biologically significant and most significantly studied of
these heavy metals include cadmium, mercury, lead, zinc, chromium and copper. As a leading member of the heavy metal family.
Lead (plumbum-pb) is extensively used and studied for its toxic nature like mercury(Hg) and cadmium(Cd). Leads toxicity comes
from each part of the environment i.e. air, water and soil due to its ubiquitous uses and entry to the respective zones either naturally or
artificially or both. Obtained as galena, in the earth’s crust, lead has been variously used in different ways. Biologically lead has no
significant role in any way, but still it is found in the human body up to 120 mg as a non-essential trace element. Its ubiquitous use has
made its entry in to our body through various sources as a contaminant. The over increasing use of this metal has so heavily
contaminated the environment that exposure to lead is inescapable. Estimations from various sources have shown that the primitive
man had only about 2mg of lead in contrast to 120 mg today. The lead content of the Egyptian mummies was also found to be
markedly less-only about 1.5 mg i.e. one-tenth of the lead load in present day (Kanwar and Sharma 1987): The average daily intake of
lead by present day man is about 0.45 mg which comes mainly from food (0.22 mg to 0.4 mg) water (0.02 mg), inhalations (0.03 mg)
and cigarettes (0.04 mg of one smokes 30 cigarettes a day).
In our country India, the department of Science and Technology (DST) had launched a study related to heavy metal pollution
from 1982 through 1987. it has been found various states leading in lead pollution in various forms in India. Murti (1989), based on
six years studies reported the lightest level of lead as follows:
Air – 0.699 g/m2 (Bihar)
Water – 0.968 g/ml (Tamilnadu)
Vegetarian food – 18.51 /g (Himachal Pradesh)
Non-vegetarian food – 9.32 g/g (Orissa)
As reported by Jana (1987), several brands of shampoos contain lead sulphide to give the hair a dark hue. The eye cosmetics
“Kajal” used by Hindus and “Surma” by Muslims have large concentrations of lead, reported 88% lead sulphide in mascara. Face
powders, pastes and liquids also contain about 67% lead.
The use of Sindoor, basically red lead by Hindu women continues till date and there is no indication of ban on its use in the
near future. Sindoor poses hazards that are well documented but it continues to be considered sacred.
Its properties such as durability, corrosion resistance, easy gluing of its pieces, have made lead a perfect metal for use in
batteries, cables, pigneus, petrol additives, solder and steel products and ever as pesticides. The most wide spread use of lead as in
T
International Journal of Scientific and Research Publications, Volume 3, Issue 8, August 2013 2 ISSN 2250-3153
www.ijsrp.org
paints. Pottery work, foundry work, welding, soldering, stained glass fabrication ceramic works continue to use lead (Oladele, 2007).
Very recently the use of Lead in Calabash chalk as an antidote has been reported( Google Alert, 2013).
So far the literature is concerned as above the report on lead toxicity in aquatic ecosystem are scanty. Kinetics of lead in
aquatic ecosystems and its impact on aquatic animals and their systems need to be thoroughly studied as they often remain as an
essential component in the food chain. The study may have some implications in understanding the problems of lower vertebrate
physiology, biochemistry, immunology environmental biotechnology and aquaculture pathology etc. Therefore, in the present study
our aim is to understand some of the major problems under the guidelines of WHO (1995), as out lined below :
- To select a model fish, best for laboratory work and expose it to the soluble compound of lead i.e. lead acetate for
toxicological and biochemical analysis.
- To asses the toxicity of the compound with variation of dose and period of exposure in order to select suitable doses for
short-term and chronic exposure.
- To study the kinetics of lead under controlled conditions of aquaria both for short-term and chronic exposure on the model
fish.
II. MATERIAL AND METHODS
2.1 Experimental design:
Large-sized (120-200 gms.) fishes were collected from culture ponds of village Deopada in Bhadrak district of Odisha and
aclimatized for seven days in the laboratory aquaria as reported earlier (Rout and Naik 1996). For short-term studies, different
subacute concentrations of lead acetate [ Pb (CH3-COO)2], Johnson and Sons, Ltd., London, 1990] were choosen after obtaining
LC50(500 ppm) and LT50 (45 days for25pm, 40 days for 50 ppm, 37days for 75 ppm., 35 days for 100 ppm, 30days for 125ppm and 28
days for 150ppm.
For 3 days and 7 days of treatment seven fishes each were selected and kept in separate aquaria demarcated for control, 25 ppm, 50
ppm, 75 ppm, 100 ppm, 125 ppm and 150 ppm of lead acetate.
For chronic treatment 15 ppm of lead acetate was chosen because of relatively high LT50(150 days), suitable for chronic
studies. Eight fishes taken for experiment each in separate aquaria and eight for control. The study periods involve 1st, 15
th, 30
th, 45
th,
60th
, 75th
, 90th
and 105th
days respectively with the control for comparison.
All the experiments were repeated ten times and the physico-chemical profiles were monitored following APHA (1980)
carefully in each day during replacement of water.
2.2 AAS for hard and soft tissues.
The methods of studying tissue accumulation of lead were followed to Ferguson et. al. (1993) and ATSDR (2005) using a
Perkin Elmer Atomic Absorption Spectrophotometer (MODEL - 37).
The collected bone samples were minced and oven-dried at 120°C for 6 hrs. Then desired amount of the ass was taken and
digested in 5:1 Nitric and Perchloric acid. The digested material then fumed in a Fume Hood (Macro Scientific Works- MSW 167)
with addition of 1 ml of cone. H2SO4. and the solution kept in ice-bath and filtered. The volume was made up to 100 ml with de-
ionized water and kept for analysis by AAS at 510 nm.

International Journal of Scientific and Research Publications, Volume 3, Issue 8, August 2013 3 ISSN 2250-3153
www.ijsrp.org
After adequate exposure, the fishes were autopsied and the tissues like gill, liver, kidney, muscle, bone and skin were blotted
with blotting paper and deep freezed after weighting. Tissues (1g wt.) were digested with concentrated Nitric acid and Perchloric acid
(in 4:1 ratio. These were kept in water bath for 6-7 days until the samples were digested thoroughly and became clear.
Cool digests were filtered through What man grade 541 filter paper and made up to 10 ml with double distilled water. Entire
metal analysis was done by using Perkin Elmer- 37 Atomic Absorption Spectrophotometer.
Stock lead solution: 0.1599g of Pb (NO3)2 was dissolved in about 20 ml of distilled water. 1 ml of distilled nitric acid again was added
following volume make up to 100 ml with distilled water.
Standard lead solutions : The standard lead solutions were prepared of concentration 1/5, 10/ 25 and 50 g/1 by two step dilutions
stock lead solution with de-ionized distilled water containing nitric acid.
2.3 Analysis of blood samples for lead:
It was followed according to Australian standard (AS2411 - 1980) for AAS. After collection the heparinized blood samples
were kept at 4°C. During analysis 3ml of thoroughly mixed blood sample were immediately dispensed to the centrifuge tube. The lead
in blood was made complexes with APDC by adding 0.5 ml of 2% APDC to it and extracted into 3 ml of n-butyl acetate by proper
shaking. Lead was determined in the organic phase by AAS within one hour.
Calculation was done by the help of calibration curve using standard solution.
Lead content = Value Standard
sample the of ODg/gm/ml of the tissue.
Bio concentration factor (BFC) = waterin Pb of ionConcentrat
tissues in Pb of ionConcentrat
2.4. X-ray photography
To study accumulation of lead on bone X-ray photography was followed according to Yarmenenko (1988) and ATSDR
(2005). The fishes were anesthetized by intramuscular injection of sodium barbiturate. Then they were taken to X-ray laboratory and
X-ray was taken through ME-2085 machine at frequency 50 KG x 0.2 MA.
2.5. Statistical methods:
All the data obtained from the control and experimental fishes were statistically analyzed as follows:
2.5.1. ANOVA: One-way analysis of variance (ANOVA) for accumulation and kinetic studies, DNA, RNA and protein relations,
activities of different enzymes, haematological studies and Immunological studies were performed with the respective F-values in all
observations following Sanders (1994). All the ANOVA tables are separately attached by an annexure.
2.5.2. Parson’s Correlation Coefficient (r) : The r- values between doses of lead acetate with lead accumulation as well as the lead
accumulation and various parameters of the control groups & experimental were calculated with significance following Sanders
(1994) and Chainy et. al. (2008).
III. RESULTS
The AAS analysis of different tissues displayed accumulation of lead after 3 days of exposure (Table I), 7 days of exposure
(Table III) and chronic 105 days of exposure (Table V) The Bio Concentration Factor (BCF) have been worked out as in Tables II, IV
and VI respectively.
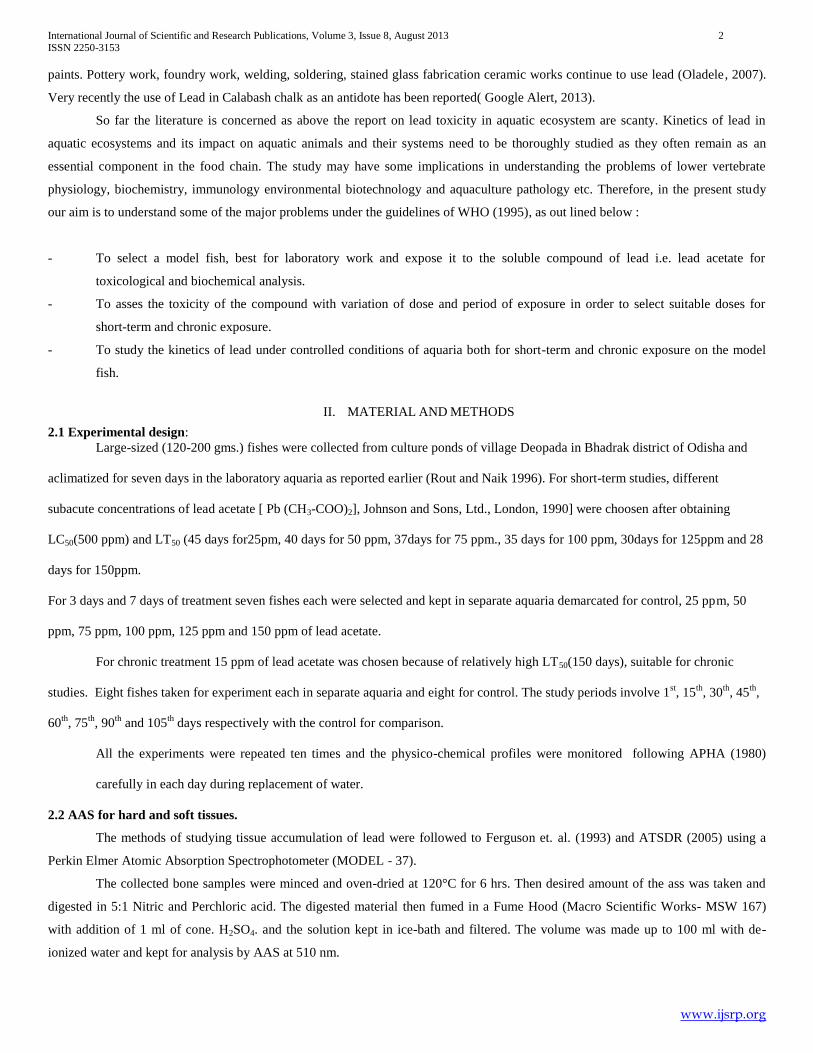
After 3 days of Exposure, the accumulation was a dose-dependant response in the gills, liver, blood, kidneys and GI tract as
evident from the F-values from ANOVA, while in the bones, muscles and skin there was no significant response. The correlation Co-

International Journal of Scientific and Research Publications, Volume 3, Issue 8, August 2013 4 ISSN 2250-3153
www.ijsrp.org
efficient (r) between lead accumulation and lead treatment is also significant in cases of the described organs ( Figure 4). The BCF is
very high (Table II & Figure 1 )
After 7 days of exposure, lead accumulation in various tissues was invariably a dose-dependant response, as evident from the
Table III, and Figure 5. BCF was also very high (Table IV, Figure 2) and correlation coefficient between Lead treatment and Lead
accumulation is also highly significant ( Figure 5).
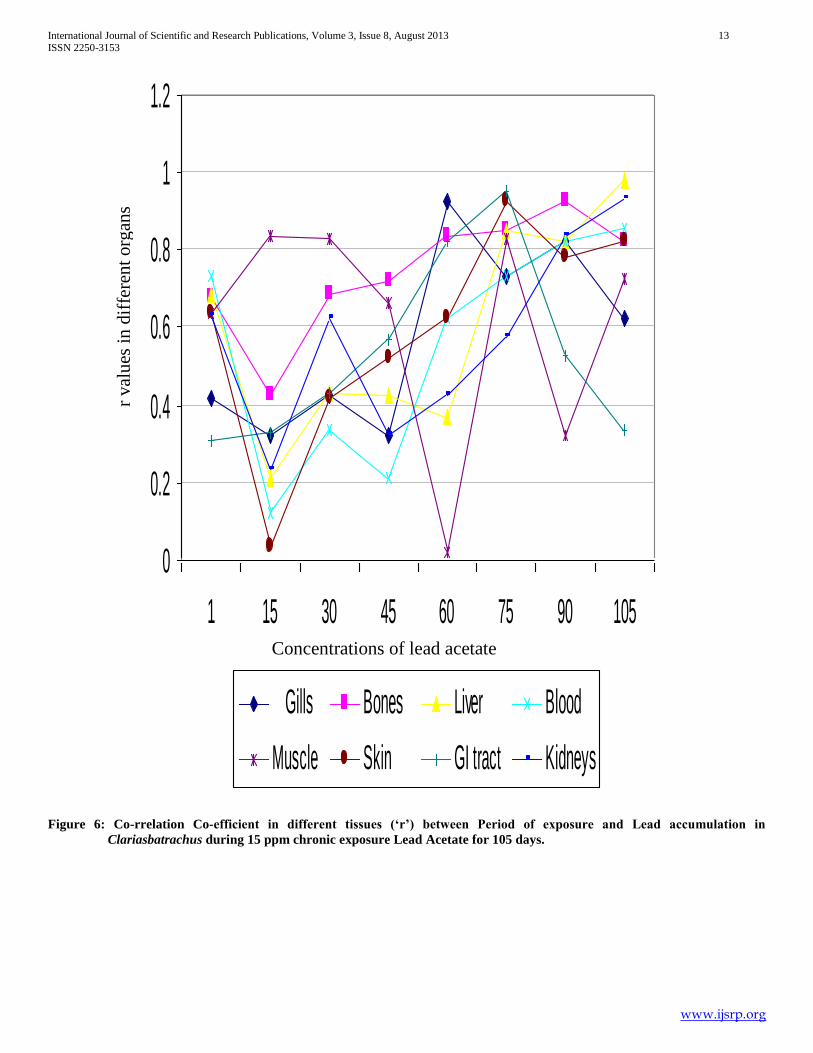
The accumulation gradually increases with increase in period of exposure during chronic treatment(Table V). There is a +ve
correlation between the period of exposure and lead accumulation in different tissues for 105 days. Accumulation steadily increases up
to 60 days in the gills and then falls. A similar response is observed up to 75 days in the kidneys and muscled. In other organs there is
a steady increase. A similar response is in BCF (TableVI, Figure 3) and there is a highly significant correlation coefficient (r) between
the period of exposure and lead accumulation ( Figure 6).
The X-ray photography of control and exposed fishes have been compared (Plate-I). Gradual deposition of deep lead- lines
on the skull and vertebral bones have been depicted after 45th
day, 75th
day, and 105th
day of chronic exposure. The X-ray results
support the AAS studies on Lead accumulation in the bones.
Table I: Accumulation of lead after short-term (48 hrs) of exposure to various concentrations of lead acetate.
Concentration of lead
acetate(ppm) Lead content g / gm weight of tissues
Gills Bones Liver Blood
(g/dl)
Kidney Muscle Skin GI tract
Control 0.1
0.001
0.2
0.001
0.01
0.001
3.8
0.001
0.01
0.001
0.01
0.001
0.1
0.001
0.01
0.001
25 10.22
0.021
0.81
0.012
6.83
0.351
12.30
0.269
4.54
0.611
1.82
0.082
3.02
0.641
2.51
0.001
50 15.62
1.232
2.19
0.821
8.6
1.152
13.01
0.251
5.36
0.731
3.63
0.912
5.25
1.231
2.63
0.081
75 12.14
2.333
3.16
0.981
10.36
2.341
13.52
0.512
6.21
1.283
4.08
1.114
5.53
1.672
4.61
0.061
100 13.13
2.461
5.68
1.230
11.38
2.152
14.13
0.132
8.36
1.391
4.45
1.631
5.79
1.231
5.23
0.7
125 13.57
2.231
5.51
2.381
13.13
1.623
13.21
0.213
8.59
1.251
5.20
0.291
6.23
1.331
5.45
0.8
150 15.38
2.110
6.21
1.381
14.33
0.231
12.69
0.619
8.21
0.631
6.31
0.381
7.35
1.161
5.62
0.093
┴ P<0.005, † P<0.05
Table II: Bio concentration factor (BCF) of blood (mg / lit) in different tissues of Clariasbatrachus after short-term (48 hrs) of
exposure:
Concentration
levels
Gills Bones Liver Blood Kidney Muscle Skin GI tract
25 630 50 420 760 270 110 180 0155
50 480 60 260 400 160 100 160 81
75 250 60 210 280 120 80 110 54
100 200 80 170 210 120 60 80 81
125 160 60 160 160 100 60 70 67
150 150 60 140 130 80 60 70 58

International Journal of Scientific and Research Publications, Volume 3, Issue 8, August 2013 5 ISSN 2250-3153
www.ijsrp.org
PLATE-I : X-ray Photomicrographs showing Lead Accumulation in Bone
i) Control Dorsal View
ii) Control Lateral View.
iv) After 45 days – Dorsal View
v) After 45 days- Lateral View.
v) After 75 days of treatment v) After 105 days of treatment

International Journal of Scientific and Research Publications, Volume 3, Issue 8, August 2013 6 ISSN 2250-3153
www.ijsrp.org
0%
10%
20%
30%
40%
50%
60%
70%
80%
90%
100%
Gills GI Bones Blood Liver Kidney Muscle Skin
150
125
100
75
50
25
Figure 1:Bio-Concentration Factor (BCF) of Lead in different tissues after 3 days of exposure to different concentrations of
Lead Acetate.
% o
f B
CF
shar
ed a
t dif
fere
nt
conce
ntr
atio
ns
of
Lea
d A
ceta
te
Different types of tissues

International Journal of Scientific and Research Publications, Volume 3, Issue 8, August 2013 7 ISSN 2250-3153
www.ijsrp.org
Table III: Accumulation of lead in various tissues after seven days of exposure to various concentrations of lead acetate.
Concentration of
lead
acetate(ppm)
Lead content g / gm wt. on tissues
Gills Bones Liver Blood
(g/dl)
Kidney Muscle Skin GI
tract
Control 0.1
0.001
0.2
0.001
0.1
0.001
3.7
0.001
0.01
0.001
0.1
0.001
0.1
0.001
0.01
0.001
25 12.46
1.24
5.12
0.938
0.72
0.001
13.50
0.544
1.01
0.001
2.56
0.001
3.58
0.012
6.28
0.08
50 15.62
0.924
5.56
0.726
0.93
0.001
14.56
0.279
1.52
0.001
4.23
0.001
7.23
0.312
8.69
0.13
75 19.69
0.815
9.23
1.291
1.59
0.006
15.26
0.716
1.69
0.003
4.76
0.002
7.82
1.231
10.168
0.113
100 24.92
0.741
10.13
0.368
2.58
0.007
17.19
0.218
2.18
0.001
4.31
0.003
9.35
1.114
10.25
0.14
125 30.13
0.069
12.13
0.694
3.62
0.006
18.25
0.125
3.18
1.201
4.59
0.231
10.12
1.235
11.11
0.115
150 38.25
0.192
16.52
0.215
5.26
0.123
22.21
0.238
3.56
0.126
8.39
0.001
10.79
0.115
13.12
0.611
┴ P<0.005, * P<0.001, † P<0.05
Table IV: Bio concentration factor (BCF-mg / lit) of lead in different tissues after 7- days of exposure to various concentration
of lead acetate.
Concentration
levels
Gills Bones Liver Blood Kidney Muscle Skin GI
tract
25 772 317 44 837 62 158 222 389
50 484 172 28 451 47 131 224 269
75 407 190 32 315 34 98 161 210
100 386 157 40 266 33 73 145 158
125 373 150 44 226 39 56 116 137
150 395 170 54 229 36 86 111 135

International Journal of Scientific and Research Publications, Volume 3, Issue 8, August 2013 8 ISSN 2250-3153
www.ijsrp.org
0%
20%
40%
60%
80%
100%
Gills GI Bones Blood Liver Kidney Muscle Skin
150
125
100
75
50
25
Figure 2: Bio-Concentration Factor (BCF) of Lead in different tissues after 7 days of exposure to different concentrations of
Lead Acetate.
Different types of tissues
% o
f B
CF
shar
ed a
t dif
fere
nt
conce
ntr
atio
ns
of
Lea
d A
ceta
te

International Journal of Scientific and Research Publications, Volume 3, Issue 8, August 2013 9 ISSN 2250-3153
www.ijsrp.org
Table V:Accumulation of lead(Mean ± SEM) in various tissues of Clariasbatrachus during 15 ppm Chronic exposure of lead
acetate and F- values obtained from ANOVA showing effectiveness of Period of Exposure.
Period of
exposure (days)
Gills
(µg/gm)
GI
(µg/gm)
Bones
(µg/gm)
Blood
(g/dl)
Liver
(µg/gm)
Kidney
(µg/gm)
Muscles
(µg/gm)
Skin
(µg/gm)
01 C
E
0.2
0.006
0.01
0.001
0.3
0.007
5.0
0.187
0.1
0.003
0.1
0.002
0.1
0.001
0.2
0.001
5.0
0.051
1.56
0.001
0.5
0.041
10.11
0.577
3.5
0.211
0.1
0.002
0.1
0.001
0.8
0.004
15 C
E
0.15
0.001
0.01
0.001
0.23
0.002
4.83
0.178
0.2
0.001
0.08
0.001
0.09
0.001
0.3
0.001
70.0
6.312
6.39
0.112
8.0
0.251
21.53
0.758
1.00
0.16
0.78
0.008
0.67
0.004
2.0
0.008
30 C
E
0.25
0.002
0.18
0.001
0.32
0.001
5.02
0.158
0.08
0.001
0.12
0.002
0.08
0.001
0.1
0.001
115.0
8.512
0.28
01.132
19.53
3.412
41.53
1.561
1.35
0.121
1.11
0.008
1.56
0.005
6.0
0.052
45 C
E
0.23
0.001
0.19
0.012
0.26
0.001
4.78
0.129
0.06
0.001
0.08
0.001
0.09
0.003
0.09
0.001
135.5
10.811
15.34
1.215
28.0
3.512
55.07
0.721
2.13
0.055
2.60
0.631
3.14
0.842
11.0
0.315
60 C
E
0.18
0.001
0.15
0.011
0.41
0.002
4.98
0.286
0.09
0.001
0.09
0.001
0.16
0.001
0.31
0.001
161.5
9.856
22.39
2.231
38.4
3.151
82.25
1.406
3.16
0.691
4.81
0.823
3.89
0.235
13.0
2.815
75 C
E
0.32
0.002
0.12
0.011
0.25
0.002
4.85
0.183
0.12
0.001
0.12
0.001
0.08
0.001
0.26
0.002
125.0
8.536
28.39
2.125
46.5
2.517
111.29
1.504
4.31
1.131
4.98
0.121
4.21
0.962
18.5
2.112
90 C
E
0.16
0.002
0.15
0.008
0.26
0.001
4.85
0.210
0.11
0.001
0.2
0.001
0.15
0.002
0.18
0.002
86.0
5.813
35.63
1.129
55.621
3.861
123.35
2.508
5.23
1.661
3.24
0.151
3.51
0.891
25.8
3.512
105 C
E
0.23
0.001
0.12
0.001
0.35
0.001
4.98
0.613
0.10
0.001
0.25
0.002
0.09
0.002
0.25
0.002
69.6
5.812
38.21
1.123
89.0
2.512
141.12
2.413
6.84
1.583
2.58
0.006
2.50
0.080
32.5
3.812
F-value C
E
1.566 2.087 1.320 2.675 1.762 1.289 1.267 2.315
269.987 67.54 274.147 864.154 318.076 79.324 89.567 563.254
Table VI: Bio concentration factor (BCF) of lead in various tissues of Clariasbatrachusduring chronic 15 ppm chronic
exposure of lead acetate.
Period of exposure
(days)
BCF (mg / lit) in various tissues
Gills GI Bones Blood Liver Kidney Muscle Skin
01 515 160 515 1042 360 10 10 82
15 7216 658 824 2219 103 80 64 206
30 11855 1059 2010 4281 139 114 160 618
45 13917 1582 2885 5677 219 268 323 1134
60 16649 2308 3958 8479 325 495 349 1340
75 12885 2926 4793 11473 444 513 434 1907
90 8865 3673 5731 12716 539 334 361 2659
105 717 3939 9175 14548 705 265 257 3350

International Journal of Scientific and Research Publications, Volume 3, Issue 8, August 2013 10 ISSN 2250-3153
www.ijsrp.org
0%
10%
20%
30%
40%
50%
60%
70%
80%
90%
100%
Gills GI Bones Blood Liver Kidney Muscle Skin
105
90
75
60
45
30
15
1
Figure 3: Bio-Concentration Factor (BCF) of Lead in different tissues during chronic 105 days of exposure 0f 15ppm Lead
Acetate.
% o
f B
CF
shar
ed a
fter
15 d
ays
inte
rval
of
exposu
re o
f 15 p
pm
Lea
d a
ceta
te
Different types of tissues
International Journal of Scientific and Research Publications, Volume 3, Issue 8, August 2013 11 ISSN 2250-3153
www.ijsrp.org
Figure 4: Co-rrelation Co-efficient (‘r’) in different tissues between Lead treatment and Lead accumulation in
Clariasbatrachus after 3 days of exposure to different concentrations of Lead Acetate.
0
0.1
0.20.3
0.4
0.5
0.6
0.70.8
0.9
1
Control
(0)
25 50 75 100 125 150
Gills Bones Liver Blood Muscle
Skin GI tract Kidney
r val
ues
in
dif
fere
nt
org
ans
Concentrations of lead acetate

International Journal of Scientific and Research Publications, Volume 3, Issue 8, August 2013 12 ISSN 2250-3153
www.ijsrp.org
Figure 5:Co-rrelation Co-efficient(‘r’) in different tissues between Lead treatment and Lead accumulation in Clariasbatrachus
after 7 days of exposure to different concentrations of Lead Acetate
0
0.2
0.4
0.6
0.8
1
1.2
Control
(0)
25 50 75 100 125 150
Gills Bones Liver Blood Muscle
Skin GI tract Kidney
r val
ues
in
dif
fere
nt
org
ans
Concentrations of lead acetate
International Journal of Scientific and Research Publications, Volume 3, Issue 8, August 2013 13 ISSN 2250-3153
www.ijsrp.org
0
0.2
0.4
0.6
0.8
1
1.2
1 15 30 45 60 75 90 105
Gills Bones Liver Blood
Muscle Skin GI tract Kidneys
Figure 6: Co-rrelation Co-efficient in different tissues (‘r’) between Period of exposure and Lead accumulation in
Clariasbatrachus during 15 ppm chronic exposure Lead Acetate for 105 days.
r val
ues
in
dif
fere
nt
org
ans
Concentrations of lead acetate
International Journal of Scientific and Research Publications, Volume 3, Issue 8, August 2013 14 ISSN 2250-3153
www.ijsrp.org
IV. DISCUSSIONS
The kinetics of lead can be discussed as under:
-Absorption
-Distribution
-Elimination and excretion
The absorption of lead from water to blood of the model fish Clariasbatrachus involves mainly three different routes, via the
respiratory, dietary and dermal. The gills being major organ for respiration, has two processes, the deposition of water borne lead, on
the gill lamellae and absorption and a very limited animal studies confirm that there is almost complete absorption of lead . A
significantly increase in gill lead content in all the sets of subacute and chronic exposure is dose dependant as well as on the period of
exposure (Sakr et.at. 2005). A decline of lead concentration after both days during chronic treatment indicates hyperplasia and
necrosis of the soft gill lamellae.
In Clariasbatrachus, lead absorption by the gastrointestinal tract comes from the same source of water along with food. As
reported earlier the food supply to the fish was live earthworm whose lead content has been analysed to be < 0.01 ppm in their muscle.
Hence, the food when supplied is taken along with water of the experimental aquaria having measured lead concentration. The lead
intake however increases after fasting (Abassi et.al. 1998). A dose dependent increase in lead accumulation may be a linear process
that the decline in BCF from lower concentration of lead content to high concentration is equivocal with the statement that, absorption
of lead in the GI tract is a saturable process. With increase in doses, lead absorption as a % of dose decrease in dietary studies. The
accumulation in this case is not the highest in intestine as reported by Gupta and Bakre (1996) in case of Pilaglobosa But this amount
certainly contributing to the absorption in to blood stream. The deposition of lead on skin is also significant. It is both dose dependent
( Tables I, & III )as well as on period of exposure (Table-V). The BCF is high in chronic cases. The results however shows that the
dermal absorption is minimal as on also verified earlier by Abassi et.al.(1998). Apart of from mucus secretions the skin generally
lowly permeable to lead. A good amount of accumulation lead may be shared from internal uptake mechanisms.
4.2.1. The relationship of internal lead exposure to blood lead concentration:
In the fish all these three routes provide their way to lead concentration in blood. External exposures are sum of the quantities
of lead consumed from all sources.
Historically, these are two lines of approach in under study the lead exposure and blood lead relationship (WHO-1995) most have
been empirical and measured environmental lead and PbB levels either at one time or repeatedly with these observed correlations and
with no assumptions about how lead moves inside the body, many reasonable predictions is optimum when only one source
dominates. Some of these only on linear functions, while others have specified non-linearity’s, especially, over very wide range of
lead exposures. However when multiple sources are considered these predictive models have been less satisfactory.
Blood is the compartment in which lead is most often measured as a marker of exposure. The lead concentration with either
increase in dose or period is curvilinear. A number of biological factors may explain the curvilinear relationship such as increased
renal clearance with high PbB as advocated by Chamberlin (1985), distributuional non-linearities due to differences in lead finding
sites in different tissues, or a sizeable pool of mobile lead in bone maintained more or less independently of uptake.
4.2.2. Distribution:
The initial distribution of lead in the body may depend upon the rate of delivery of blood to various organs. However it
would appear that distribution occurs in a similar manner regardless of the route of absorption. The results from short-term subacute
International Journal of Scientific and Research Publications, Volume 3, Issue 8, August 2013 15 ISSN 2250-3153
www.ijsrp.org
and seven days subacuteexposures show that accumulation in Liver, Kidney, and bones is considerably more significant than muscle
apart from blood as previous by found in other animal models. The level of significance is very high in all these tissues during chronic
exposure up to 105th
day. About 90% lead is stored in bone which is visible under X-ray photography. The amount of lead
accumulation as in bone > Skin > Muscle > Liver > Kidney with high BCF. The results obey the studies of Rabinwitz et.al. (1976) and
Aufderheide (1992) showing three different pools of biokinetic movements of lead. These three pools are blood, bone and soft tissues
in human beings show distinct half-lives of lead. Blood lead is most labile with a half-life of about 36 days, bone lead is the most
stable with about 27 years and lead in soft tissues has a half-live of approximately 40 days. Until recently it had been assumed that
bone lead is metabolically insert and with a little heath-risk assessment. Current evidence is that bone comprises and is a target for
toxicity. These factors complicate bone lead kinetics as applied to long term modelling; the toxicity of bone lead to blood is import. In
the 1st day liver showed high lead content probably reflecting its role in detoxification of the xenobiotic.
Two physiological compartments appear to exist for lead in cortical and trabecular bone (ATSDR, 2005).
• the inert component stores lead for decades
• the labile component readily exchanges bone lead with the blood.
Under certain circumstances, however, this apparently inert lead will leave the bones and reenter the blood and soft tissue organs.
• Bone-to-blood lead mobilization increases during periods of pregnancy, lactation, menopause, physiologic stress, chronic disease,
hyperthyroidism, kidney disease, broken bones, and advanced age, all which are exacerbated by calcium deficiency.
• Consequently, the normally inert pool poses a special risk because it is a potential endogenous source of lead that can maintain BLLs
(Blood Lead Levels)long after exposure has ended.
Because lead from past exposures can accumulate in the bones (endogenous source), symptoms or health effects can also appear in the
absence of significant current exposure.
• In most cases, toxic BLLs reflect a mixture of current exposure to lead and endogenous contribution from previous exposure.
• An acute high exposure to lead can lead to high short-term BLLs and cause symptoms of lead poisoning( UNEP, 2010).
• It is important that primary care physicians evaluate a patient with potential lead poisoning, examine potential current and past lead
exposures and look for other factors that affect the bio-kinetics of lead (such as pregnancy or poor nutrition).
4.2.3. Elimination and Excretion:
In both humans and experimental animals, lead is eliminated from the body in both urine and faeces. About 85% of lead
ingested lead excreted of it about 90% comprise faeces. But in our model fish, Clariasbatrachus. kept in the aquaria containing lead
acetate, the excreted lead again reenters into the fish body. However, the significant amount of lead during subacute (short-term and
7days) exposure is accumulated reflecting retention of lead in the intertubular as (Jana 1998) reported earlier (Gennart and Lauwerys
1992) leading to intratubular spaces as it is Fanchoni syndrome.
Acknowledgement:
Thanks are due to The V.C, F. M. University, Balasore and The Principal D.D. Autonomous College, Keonjhar for laboratory
facilities.

International Journal of Scientific and Research Publications, Volume 3, Issue 8, August 2013 16 ISSN 2250-3153
www.ijsrp.org
REFERENCES 1. Abbasi, S.A., N. Abbasi and R. Soni.(1998): Heavy Metals in the Environment. Mittal Publications, New Delhi, P. 125-140.
2. APHA, American Public Health Association, Standard methods for examination of water and waste water, (1989) 17th(ed), Washington DC, USA.
3. AS , Australian Standard Methods of Analysis. AS-241,(1980) Sydney.
4. ATSDR, Agency for Toxic Substances and Disease Registry. (2005). Toxicological profile for lead. Atlanta: US Department of Health and Human Services, Public Health Service.
5. Aufderheide, A.C. (1992): Selected aspects of the spatial distribution of lead in bone. Neurotoxicology. 13(4) winter (1992) P.809.
6. Chainy, G.B.N., G. Mishra and P.K. Mohanty.(2008): Biostatistics Theory and Applications. Kalyani Publishers, Ludhiana. P.353.
7. Chamberlin, S.A.(1983): Lead from the petrol browser to blood and bone. The journal of the Lead. Vol1 P.110.
8. Ferguson, S. A. (1993): Lack of effect of chronic developmental lead treatment on Biogenic amines and metabolites in monkey cerebrospinal fluid. Neurotoxicology and Teratology 15 (4)
P.229.
9. Gennart, J. P. and Lauwerys, R. (1992): Assessment of thyroid, testes kidney and autonomic nervous system functions in lead exposed workers. Int. Archv. ofOccu. andEnv. Healths 60 (1) P.49.
10. Google Alerts. (July15, 2013): Pregnant women warned not to eat toxic chalk product, From Hackney gazette (As a member of the web link daily subscribed).
11. Gupta, S. and P.P. Bakre, (1996): Influence of calcium on the uptake and deposition of lead in Pilaglobosa. Ind. J. of Env. and Toxic. Vol. 6(1), P. 39-42.
12. Jana, S. (1987): Effects of lead poisoning Science reporter. July P.478.
13. Kanwar, K. C. and Sharma, S. (1987): Lead and its toxicity. Science Reporter Nov. P.586.
14. Murti, C.R.K. (1989): Toxic metals in the Indian Environment. Vishanathan, P. (Editor).
15. Oladele A., Ogunseital (2007): Public Health and Environmental benefits of adopting lead free solders. Journal of Medicine, Vol:7, P.12-17.
16. Rabinowitz MB, Wetherill GW, Kopple JD. 1976. Kinetic analysis of lead metabolism in healthy humans. J Clin Invest 58:260-270.
17. Rout Prafulla Chandra, Naik BN and ChoudhuryS(1997b): Lead accumulation in various tissues of Clasiasbatrachus during experimental plumbism. J. Appl. Zool.Res. Vol.8(2) p.157-159.
18. Rout Prafulla Chandra, Naik BN (1998b). Immunotoxic studies on Clariasbatrachusduring subacute lead toxicity. J.NATCON 10(1) p.97-99.
19. Sakr, S.A. and SM. Jamal Al Jail. (2005): Fenvalerate induced histopathological and histochemical changes in the liver of the Catfish Clariasgariepinus. Journal of Applied Sciences Research,
Vol.1(3) P.263-267.
20. Sanders, D.H.(1994): Statistics: A fresh Approach, McGraw Hill Publication, Newyork.
21. UNEP, United Nations Environmental Program (2010): Final review of scientific information on lead. Version of December2010.
22. WHO. (1995): Inorganic Lead. Environmental Health Criteria165. Published by WHO, Geneva.
23. Yarmenenko, S.P. (1988): Radiobiology of Humans and Animals. Mir Publishers, Moscow.
AUTHORS
1. Prafulla Chandra Rout- Lecturer in Zoology, Govt. Sc. College, Malkangiri, Odisha, India 764045.
2. BijayanandaNaik, Ex- Professor & HOD ENV. Sciences, F.M. University, [email protected]


![Best practices for collection of luminescence samples and ... poster Rittenour... · lead to inaccurate age results ... conversion on radiogenic particle concentration: [R]= concentration](https://img.dokumen.tips/doc/110x75/5f02d63d7e708231d4064187/best-practices-for-collection-of-luminescence-samples-and-poster-rittenour.jpg)