Embed Size (px)
Citation preview

Journal of Industrial and Engineering Chemistry 19 (2013) 547–553
Kinetic modeling of uranium permeation across a supported liquid membraneemploying dinonyl phenyl phosphoric acid (DNPPA) as the carrier
Sujoy Biswas a, P.N. Pathak b,*, S.B. Roy a
a Uranium Extraction Division, Bhabha Atomic Research Centre, Mumbai 400 085, Indiab Radiochemistry Division, Bhabha Atomic Research Centre, Mumbai 400 085, India
A R T I C L E I N F O
Article history:
Received 14 April 2012
Accepted 10 September 2012
Available online 17 November 2012
Keywords:
Uranium
Permeation
Membrane
DNPPA
Kinetic modeling
A B S T R A C T
This paper reports the permeation of U(VI) from nitric acid medium across polytetrafluoroethylene
(PTFE) membrane impregnated with dinonyl phenyl phosphoric acid (DNPPA) as carrier. The effects of
various parameters such as nature and concentration of receiver phases, feed acidity, carrier/uranium
concentration and membrane thickness were evaluated. 6 M H2SO4 was identified as receiver phase.
Experimental data were fitted to a kinetic model to calculate the diffusion coefficient D(o) and mass
transfer coefficients D�1ðaÞ . The optimized conditions were applied for recovery of uranium from uranyl
nitrate raffinate (UNR) waste solution generated during the purification of uranium through U(VI)–
HNO3–TBP route.
� 2012 The Korean Society of Industrial and Engineering Chemistry. Published by Elsevier B.V. All rights
reserved.
Contents lists available at SciVerse ScienceDirect
Journal of Industrial and Engineering Chemistry
jou r n al h o mep ag e: w ww .e lsev ier . co m / loc ate / j iec
1. Introduction
Nuclear power has to play an important role to meet the worldenergy demand with the diminishing resources of fossil fuels andcontributes about 13.5% of the world’s electricity demand. Provennatural uranium reserves of India are �172,000 tonnes of U3O8 andthose of thorium are �650,000 tonnes [1]. However, it is requiredto explore various resources of uranium including secondaryresources for long-term energy sustainability of Indian nuclearprogramme [2–5]. In this context, the large volume of raffinategenerated during the purification of uranium from nitric acidmedium using tri-n-butyl phosphate (TBP) as extractant containssignificant quantities of uranium (�0.5 g/L) and therefore istreated as a secondary resource of uranium [6,7]. Even though,liquid–liquid extraction is widely used in the recovery of uraniumfrom different resources, solutions like uranyl nitrate raffinate(UNR) which contain �0.5 g/L U, are considered as very dilutestreams [8–12]. Therefore, such solutions are generally unsuitablefor their treatment by conventional liquid–liquid extractionprocesses [5]. Thus, there is always an emphasis on developmentof new separation technologies which may be effectively utilizedfor separation of uranium from those lean sources. In this context,liquid-membrane based separation holds promise for recovery ofmetal ions from lean resources and has received a considerable
* Corresponding author. Fax: +91 22 25505151.
E-mail address: [email protected] (P.N. Pathak).
1226-086X/$ – see front matter � 2012 The Korean Society of Industrial and Engineer
http://dx.doi.org/10.1016/j.jiec.2012.09.029
attention in the area separation science and technology [13–16].The main advantages of the membrane separation especially flatsheet supported liquid membrane (FSSLM) technique are: lowsolvent inventory, low operation cost, clean separation, highselectivity (by selecting suitable extractant) and reasonably highefficiency. Recovery of uranium by supported liquid membrane(SLM) technique has been reported from various waste streamsusing carrier as diverse as tri-n-butyl phosphate (TBP), di(2-ethylhexyl) phosphoric acid (D2EHPA), 2-ethylhexyl phosphonicacid mono-2-ethylhexyl ester (PC88A), bis[2,4,4 trimethyl pentyl]phosphinic acid (Cyanex 272) and amines [16–21]. Dinonyl phenylphosphoric acid (DNPPA, Fig. 1) is a close analog of D2EHPA and itis widely used for recovery of uranium from wet phosphoric acidby solvent extraction [22–25]. Systematic study on solventextraction of U(VI) from nitric acid medium using DNPPA wascarried out in our laboratory. The comparison of DU value fordifferent acidic organophosphorous extractant shows the follow-ing order: DNPPA–Cyanex272 > PC88A > D2EHPA [26]. The studyhas been extended for the SLM based transport of U(VI) from nitricacid medium using DNPPA as carrier solvent. The effect of variousparameters such as composition of receiver phase, concentrationof receiver phase, optimization of carrier concentration, membranethickness etc. on U(VI) transport was investigated. Experimentaldata were fitted in a simple kinetic model to calculate the differentmembrane properties such as diffusion coefficient (D(o)), and masstransfer coefficient D�1
ðaÞ under the present experimental condi-tions. The optimized contitions were tested to recover uraniumfrom UNR solution successfully.
ing Chemistry. Published by Elsevier B.V. All rights reserved.

PO
OO
HO
DNPPA
Fig. 1. Structure of dinonyl phenyl phosphoric acid (DNPPA).
Table 3Various properties of the polytetrafluoroethylene (PTFE) membrane used in present
experiments.
Membrane properties Values
Diameter 47 mm
Pore size 0.45 mm
Porosity 72%
Thickness 60 mm
Chemical compatibility Compatible with solvents, acids
and bases
Flow rate for isopropanol per cm2 20 ml/min at Dp = 1 bar j �15 psi
Bubble point with isopropanol 0.8 bar j � 12 psi
S. Biswas et al. / Journal of Industrial and Engineering Chemistry 19 (2013) 547–553548
2. Experimental
2.1. Materials and solutions
DNPPA (from Heavy Water Board, India, 95% pure) was usedwithout further purification. DNPPA exists as dimeric form(H2A2) in non-polar diluents like n-paraffin (a mixture of C12–
C14). All other reagents used in the experiments were of A.R.grade. Natural uranium oxide and uranyl nitrate raffinate (UNR)waste solutions were obtained from Uranium Metal Plant, BARC,Mumbai. Tables 1 and 2 show the specification of UNR solutionused in the present experiment [6,7].Uranium oxide dissolved innitric acid was diluted as per requirements. The variousconcentrations of carrier solution of DNPPA were prepared byweighing the required amounts and making up the volume withn-paraffin. All the experiments were carried out at roomtemperature (25 8C) and at least in duplicate. The reproducibilityof the experimental data was within �10%.
2.2. Preparation of SLM
The polytetrafluoroethylene (PTFE) membranes from Sartorius,Germany were used as solid support in this study. The vaiousproperties of the PTFE membrane used in the present study arelisted in Table 3. The preparation of SLM was carried out by dippingPTFE membrane with desired carrier solutions over night. Themembrane was rinsed with distilled water before used fortransport studies.
Table 1Major components of a typical raffinate solution (of uranium purification cycle).
Component Concentration
U 0.35–1.4 g/L
Free acidity 1.1–2.0 M
Soluble solida 6.43% (w/v)
Suspended solidsa 0.23% (w/v)
a Determined by gravimetry.
Table 2ICP-AES analysis of typical raffinate solution (of uranium purification cycle).
Element Concentration
(mg/mL)
Element Concentration
(mg/mL)
Al 257 Fe 238
B 0.37 Mg 37.5
Cd 0.53 Mn 3.84
Ce 0.65 Ni 6.75
Co 0.43 Sm <0.1
Cr 9.27 Yb <0.1
Dy <0.10
Eu <0.1
Detection limit (3s) of non-transition elements: <0.2 ppb; transition elements:
<1 ppb and rear earths elements: <3 ppb. Standard deviations of the measurements
are with in 2–5%.
2.3. Analytical instruments
Unicam UV500 (UV–visible) spectrophotometer and an induc-tively coupled plasma emission spectrophotometer (ICPAES) fromJobinyvon emission, model no JY 328 instruments were used todetermine the concentration of uranium and other trace impuritiesin solutions. The viscosities of various compositions of carriersolutions in n-paraffin were measured at 25 � 1 8C using a SVM3000 Stabinger viscometer (Antonpaar, Austria).
2.4. Membrane transport experiments
The transport studies were carried out using a Pyrex glass cellconsisting of two equal compartments of 25 mL capacity (Fig. 2).The feed and receiver phase solutions were stirred using Tefloncoated magnetic spin bar at constant speed, 200 rpm and atroom temperature (25 8C). The SLM was positioned in betweenthe two compartments of the glass cell, joined by glass flanges.The concentration of uranium in the feed as well as in receiverphase solution was monitored by taking 0.1 mL samples at fixedtime intervals (generally 30 min). The permeability coefficient(P) of metal ions was calculated using following equation[27–29]:
lnC f ;t
C f ;0
� �¼ �QPt
V f(1)
where Cf,t and Cf,0 are the concentration of metal ion in feedsolution at time t and 0, Q represented as the product ofgeometrical surface area (A) and the porosity (e), Vf is the volumeof the feed phase, t represent time. The effective geometricsurface area of the membrane used in the present study is4.94 cm2. The percentage transport of U(VI) (%T) across SLM wascalculated as:
%T ¼ Ct;r
C0; f
� �� 100 (2)
where C0,f and Ct,r are the concentrations of U(VI) in feed andreceiver compartment at time 0 and t, respectively.
Feed Membrane Receiver
Stirring bar Stirring bar
Fig. 2. A typical membrane transport cell used in the present study.
0.0
0.5
1.0
1.5
2.0
2.5
3.0
3.5
4.0P
x 1
04 c
m/s
ec
0.5 M Oxalic acid 0.5 M Na2CO 3 0.5 M H2SO 4
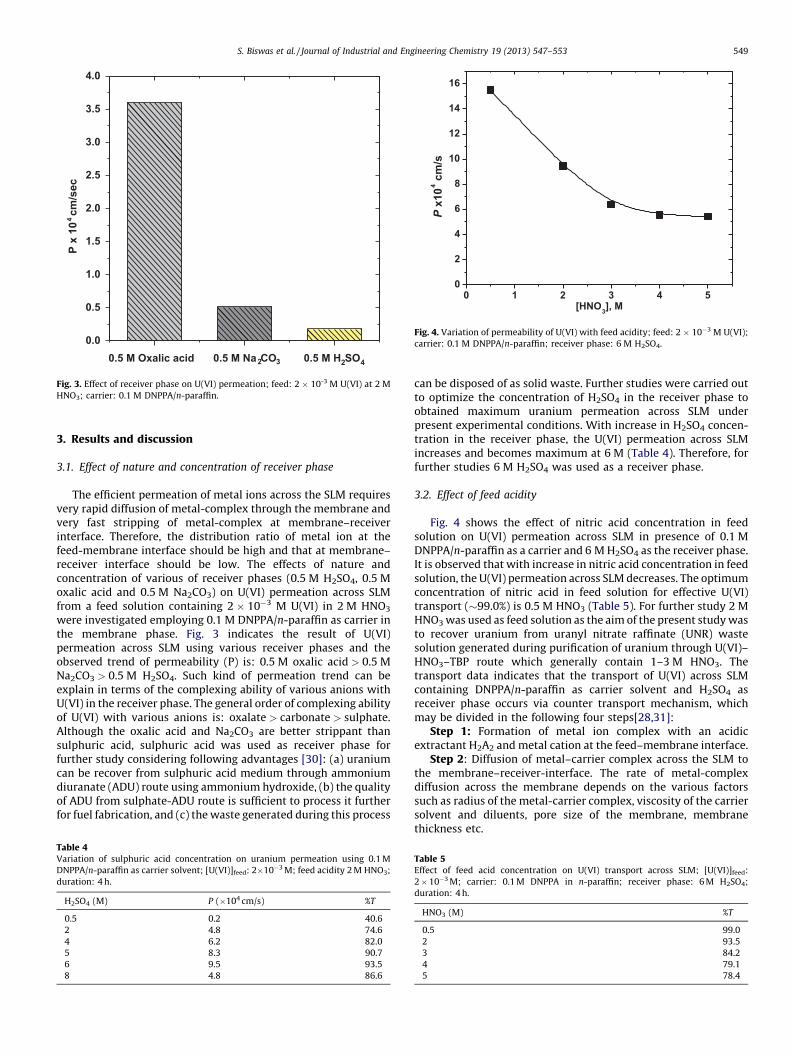
Fig. 3. Effect of receiver phase on U(VI) permeation; feed: 2 � 10-3 M U(VI) at 2 M
HNO3; carrier: 0.1 M DNPPA/n-paraffin.
0 1 2 3 4 50
2
4
6
8
10
12
14
16
P x
10
4 c
m/s
[HNO3], M
Fig. 4. Variation of permeability of U(VI) with feed acidity; feed: 2 � 10�3 M U(VI);
carrier: 0.1 M DNPPA/n-paraffin; receiver phase: 6 M H2SO4.
S. Biswas et al. / Journal of Industrial and Engineering Chemistry 19 (2013) 547–553 549
3. Results and discussion
3.1. Effect of nature and concentration of receiver phase
The efficient permeation of metal ions across the SLM requiresvery rapid diffusion of metal-complex through the membrane andvery fast stripping of metal-complex at membrane–receiverinterface. Therefore, the distribution ratio of metal ion at thefeed-membrane interface should be high and that at membrane–receiver interface should be low. The effects of nature andconcentration of various of receiver phases (0.5 M H2SO4, 0.5 Moxalic acid and 0.5 M Na2CO3) on U(VI) permeation across SLMfrom a feed solution containing 2 � 10�3 M U(VI) in 2 M HNO3
were investigated employing 0.1 M DNPPA/n-paraffin as carrier inthe membrane phase. Fig. 3 indicates the result of U(VI)permeation across SLM using various receiver phases and theobserved trend of permeability (P) is: 0.5 M oxalic acid > 0.5 MNa2CO3 > 0.5 M H2SO4. Such kind of permeation trend can beexplain in terms of the complexing ability of various anions withU(VI) in the receiver phase. The general order of complexing abilityof U(VI) with various anions is: oxalate > carbonate > sulphate.Although the oxalic acid and Na2CO3 are better strippant thansulphuric acid, sulphuric acid was used as receiver phase forfurther study considering following advantages [30]: (a) uraniumcan be recover from sulphuric acid medium through ammoniumdiuranate (ADU) route using ammonium hydroxide, (b) the qualityof ADU from sulphate-ADU route is sufficient to process it furtherfor fuel fabrication, and (c) the waste generated during this process
Table 4Variation of sulphuric acid concentration on uranium permeation using 0.1 M
DNPPA/n-paraffin as carrier solvent; [U(VI)]feed: 2�10�3 M; feed acidity 2 M HNO3;
duration: 4 h.
H2SO4 (M) P (�104 cm/s) %T
0.5 0.2 40.6
2 4.8 74.6
4 6.2 82.0
5 8.3 90.7
6 9.5 93.5
8 4.8 86.6
can be disposed of as solid waste. Further studies were carried outto optimize the concentration of H2SO4 in the receiver phase toobtained maximum uranium permeation across SLM underpresent experimental conditions. With increase in H2SO4 concen-tration in the receiver phase, the U(VI) permeation across SLMincreases and becomes maximum at 6 M (Table 4). Therefore, forfurther studies 6 M H2SO4 was used as a receiver phase.
3.2. Effect of feed acidity
Fig. 4 shows the effect of nitric acid concentration in feedsolution on U(VI) permeation across SLM in presence of 0.1 MDNPPA/n-paraffin as a carrier and 6 M H2SO4 as the receiver phase.It is observed that with increase in nitric acid concentration in feedsolution, the U(VI) permeation across SLM decreases. The optimumconcentration of nitric acid in feed solution for effective U(VI)transport (�99.0%) is 0.5 M HNO3 (Table 5). For further study 2 MHNO3 was used as feed solution as the aim of the present study wasto recover uranium from uranyl nitrate raffinate (UNR) wastesolution generated during purification of uranium through U(VI)–HNO3–TBP route which generally contain 1–3 M HNO3. Thetransport data indicates that the transport of U(VI) across SLMcontaining DNPPA/n-paraffin as carrier solvent and H2SO4 asreceiver phase occurs via counter transport mechanism, whichmay be divided in the following four steps[28,31]:
Step 1: Formation of metal ion complex with an acidicextractant H2A2 and metal cation at the feed–membrane interface.
Step 2: Diffusion of metal–carrier complex across the SLM tothe membrane–receiver-interface. The rate of metal-complexdiffusion across the membrane depends on the various factorssuch as radius of the metal-carrier complex, viscosity of the carriersolvent and diluents, pore size of the membrane, membranethickness etc.
Table 5Effect of feed acid concentration on U(VI) transport across SLM; [U(VI)]feed:
2 � 10�3 M; carrier: 0.1 M DNPPA in n-paraffin; receiver phase: 6 M H2SO4;
duration: 4 h.
HNO3 (M) %T
0.5 99.0
2 93.5
3 84.2
4 79.1
5 78.4

FEED SLM STRIP
Mn+ →→→→→→
→→
H+←←←←← ←←←← ←←…. ←← Η +←←←←
→→→→→→ Μ n+
H2A2
M(HA2)n
H2A2
M(HA2)n
HA2-
Fig. 5. Counter transport steps of metal ion in SLM using acidic extractants.
S. Biswas et al. / Journal of Industrial and Engineering Chemistry 19 (2013) 547–553550
Step 3: Decomposition of metal-complex at the membrane–receiver interface and liberation of the metal cation to the receiverphase in presence of complexing agent.
Step 4: Extractant HA2� picks up H+ ions from the receiver
phase solution to form H2A2 species. The H2A2 species regenerateddiffuse back to the feed–membrane interface, pick up more metalions and the process continues. The mechanism of extraction andback extraction of U(VI) in SLM using DNPPA can be described bythe following equations [26]:
UO2þ2ðfeedÞ þ 2H2A2ðmembraneÞ ¼ UO2ðHA2Þ2ðmembraneÞ þ 2HþðfeedÞ (3)
UO2ðHA2Þ2ðmembraneÞ þ 2H2SO4ðstripÞ
¼ UO2ðSO4Þ2�2ðstripÞ þ H2A2ðmembraneÞ þ 2HþðstripÞ (4)
The schematic diagram of counter transport of uranium usingDNPPA was given in Fig. 5
3.3. Effect of carrier concentration
The concentration of carrier solvent present in the membranephase plays an important role for permeation of metal ions acrossSLM. In order to have a clear idea on the effect of carrierconcentration on U(VI) permeation, the concentration of DNPPAin the membrane phase was varied in the range of 0.01–0.2 M. TheU(VI) concentration, feed acidity, receiver phase concentrationand stirring speed were 2 � 10�3 M, 2 M HNO3, 6 M H2SO4, and
0.00 0.05 0.10 0.15 0.200
2
4
6
8
10
12
14
P x
10
4 cm
/s
[DNPPA], M
Fig. 6. Variation of permeability of U(VI) with carrier concentration; carrier: 0.1 M
DNPPA/n-paraffin; feed: 2 � 10�3 M U(VI) at 2 M HNO3; Receiver phase: 6 M H2SO4.
200 rpm respectively. Fig. 6 shows the permeation of U(VI) acrossthe SLM for various DNPPA concentrations in the membranephase. With increase in DNPPA concentration, the U(VI) perme-ation across increased. However, transport data shows U(VI)transport across SLM became optimum at 0.1 M (�93.4%), furtherrise in DNPPA concentration there is negligible increase (�4%) inU(VI) transport (Table 6). The reason behind increase in U(VI)permeation with increase in carrier concentration is due to moreU(VI)–DNPPA complex formation at the feed–membrane inter-face. More over at lower extractant concentration, the interfacewas not saturated by the extractants and hence the permeation ofU(VI) increases with increase in extractant concentration. But,after 0.1 M extractant concentration there is not much increase inU(VI) transport due to combined effect of presence of limitedamount of carrier at the membrane phase and increase in theviscosity of membrane phase. The effect of mass transfer acrossSLM on viscosity of the carrier can be explain on the basis ofStokes–Einstein equation
Dð0Þ ¼kT
6phR(5)
where D(o) is the diffusion coefficient of metal ligand complexthrough the membrane, k is the Boltzman constant, T is theabsolute temperature, R is the the radius of metal–ligand complexand h is the dynamic viscosity of the carrier solution. According toEq. (5), with increase in viscosity of carrier solution in themembrane phase the diffusional resistance increase which limit
Table 6Variation of carrier (DNPPA)/n-paraffin concentration; [U(VI)]feed: 2 � 10�3 M; feed
acidity 2 M HNO3; receiver phase: 6 M H2SO4; duration: 4 h.
DNPPA (M) P (�104 cm/s) %T
0.01 0.8 20.0
0.02 1.1 27.4
0.03 2.6 51.0
0.05 3.2 60.3
0.10 9.5 93.5
0.20 12.3 96.8
Table 7Viscosity and density measurements of different concentration of DNPPA dissolved
in n-paraffin.
DNPPA (M) Density (g/cc) Viscosity (mPa s)
0.01 0.7471 1.3927
0.02 0.7496 1.4176
0.03 0.7512 1.4576
0.05 0.7569 1.5339
0.10 0.7653 1.7281
0.20 0.7859 2.2979

0.00 0.02 0.04 0.06 0.08 0.10 0.120
2000
4000
6000
8000
10000
1/P
1/K
Slope = 69046.04± 6757
R = 0.98
Fig. 7. Plot of 1/P vs 1/K at different DNPPA concentrations; diluent: n-paraffin;
feed: 2 � 10�3 M U(VI) at 2 M HNO3; receiver phase: 6 M H2SO4.
Table 8Comparison of diffusion coefficient D(o) of different metal ion extractant systems.
Sr. no. Metal ion–extractant
system
Diffusion coefficient
D(o)
Reference
1 Co(II)–Cyanex 272 3.25 � 10�12 m2 s�1 [35]
2 Eu(III)–DTMPPA 2.07 � 10�10 m2 s�1 [36]
3 Cu(II)–MOC-55 TD 1.2 � 10�8 cm2 s�1 [37]
4 Cd(II)–Cyanex 923 6.5 � 10�6 cm2 s�1 [38]
5 U(VI)–DNPPA–
Cyanex 923
1.51 � 10�9 cm2 s�1 [39]
6 U(VI)–DNPPA 2.35 � 10�7 cm2 s�1 [Present work]
S. Biswas et al. / Journal of Industrial and Engineering Chemistry 19 (2013) 547–553 551
the U(VI) transport across SLM [19,32,33]. The dependence ofpermeability (P) with dynamic viscosity of carrier solution is givenin Table 7. Therefore, for further experiment 0.1 M DNPPA/n-paraffin was used as carrier solution in combination with 6 MH2SO4 as receiver phase for effect U(VI) transport across the PTFEmembrane.
3.4. Kinetic modeling
The experimental data were fitted to a kinetic model to evaluatethe diffusion coefficient of U(VI)–DNPPA complex across SLM. Theproposed kinetic model was based on the following assumptions:
(a) Interfacial mass transfers at feed–membrane and membrane–receiver interface are instantineous and hence the theinterfacial fluxes were neglected.
(b) The interfacial chemical reactions at feed–membrane andmembrane–receiver interface are faster than diffusion.
(c) The rate of mass transfer across SLM is diffusion controlled.(d) Complex formation of uranium with DNPPA at the feed–
membrane interface is a single step process.The extraction of U(VI) from HNO3 medium using DNPPA/n-paraffinwas studied and extraction mechanism described elsewhere [26]. Theextraction equilibria at 2 M HNO3 concentration can be described bythe following equations and extractants constants:
UO2þ2ðaÞ þ 2H2A2ðoÞ $
z}|{Kex
UO2ðHA2ÞðoÞ þ 2HþðaÞ (6)
Kex ¼ ½UO2ðHA2Þ2�ðoÞ � ½Hþ�2ðaÞ
n o= ½UO2þ
2 �ðaÞ � ½H2A2�2ðoÞn o
(7)
where ‘H2A2’ refers to dimeric form of DNPPA. Kex is the conditionalextraction constant and subscripts (a) and (o) represent theaqueous and organic phases, respectively. The value of Kex wascalculated as 8.954 � 104 using slope ratio technique [26]. The fluxof metal ion transport through the membrane was given by theFick’s first law of diffusion to the diffusion layer on the feed side tothe membrane. According to the law, the permeability coefficient(P) can be written as [28,34]:
P ¼ J
½UO2þ2 �
(8)
P ¼ DU
ðDUDðaÞ þ DðoÞÞ(9)
Where DU is the distribution radio of U(VI) with DNPPA at feed-membrane interface and D(a) and D(o) are the resistance intransport in bulk feed phase and membrane phase respectively.Combining Eqs. (7) and (9) following equation can be derived:
P ¼ Kex½H2A2�2ðoÞ �½Hþ�2ðaÞ
fDðoÞ þ DðaÞðKex � ½H2A2�2ðoÞ � ½Hþ�2ðaÞÞg
(10)
1
P¼ DðaÞ þ
DðoÞ
ðKex½H2A2�2ðoÞ � ½Hþ�2ðaÞÞ
(11)
Fig. 7 showed the plot of 1/P as a function of 1/K whereK = (Kex�[H2A2]2
(o)�[H+]2(a)) for different extractant concentration
at 2 M HNO3 concentrations is a straight line with a slope D(o) andintercept D(a). The values of D(o) and D(a) were determined fromproposed kinetic model as 69046.4 � 6757 and 975.64 �374.34 s cm�1, respectively. The transport resistance due to diffusionby the membrane (D(o)) was expressed as follows:
DðoÞ ¼tdðoÞDðoÞ
(12)
where t is the tortuosity of the membrane, d(o) is the thickness oforganic layer and D(o) is the diffusion coefficient of the metalcomplex across the membrane. Considering the known value of tas 2.7 and d(o) as 60 � 10�4 cm, the D(o) value was evaluated fromproposed model as 2.35 � 10�7 cm2 s�1. The mass transfercoefficient was calculated as D�1
ðaÞ = 1.02 � 10�3 cm s�1. A compar-ison of the diffusion coefficient, D(o) of different metal ions–extractant system is listed in Table 8. Observation indicate that thediffusion coefficient, D(o) calculated in the present work iscompariable with the reported values. The diffusion coefficientof the uranium complex in the bulk organic phase (D(o), b) can becalculated from the diffusivity in the membrane, D(o) usingfollowing equation [39]:
DðoÞ ¼ e �DðoÞ; b
t2(13)
where e is the porosity of the membrane (0.72). The value ofD(o), b was found to be 2.38 � 10�6 cm2 s�1. The above resultsshowed that the value of diffusion coefficient in membrane is lessthat the bulk diffusion coefficient. The less value of diffusioncoefficient in membrane is caused by the diffusional resistanceoffered by the microporous thin PTFE membrane placed betweenfeed and receiver phase.
3.5. Effect of U(VI) concentration
The concentration of U(VI) in feed solution is an importantfactor which strongly influences the permeation of metal ionacross the SLM. The effect of U(VI) concentration on uraniumpermeation was studied in the range of 4.8 � 10�4–3.2 � 10�3 Mthrough SLM containing 0.1 M DNPPA/n-paraffin as carrier solvent

40 60 80 100 120 140 160 180
2.0x10⁻⁴
4.0x10⁻⁴
6.0x10⁻⁴
8.0x10⁻⁴
1.0x10⁻³
P, cm
/sec
(1/d0) cm
-1
slope = 5.99 x 10⁻⁶
± 7.9 x 10⁻⁷
R =0.98
Fig. 9. Plot of P vs 1/d(0); carrier: 0.1 M DNPPA/n-paraffin; feed: 2 � 10�3 M U(VI) at
2 M HNO3; receiver phase: 6 M H2SO4.
Table 9Transport behavior of different metal ions present in a typical UNR solution at 1.1 M
HNO3 employing 0.1 M DNPPA/n-paraffin as carrier and 6 M H2SO4 as receiver
phase; Duration: 4 hours.
Elements Concentration
(mg/mL)
% U(VI) transport
in 4 h
U 550 94.2
Al 257 <1
Co 0.43 1.7
Cr 9.27 <1
Fe 237 3.8
Cd 0.53 <1
Ce 0.65 <1
Ni 6.75 <1
Y 0.32 <3.0
5 10 15 20 25 30 35
4
6
8
10
12
14
16P
x 1
04 c
m/s
ec
[U] x10, M4
R = 0.99
Fig. 8. Effect of U(VI) concentration in the feed solution on its permeation; carrier:
0.1 M DNPPA/n-paraffin; feed acidity: 2 M HNO3; receiver phase: 6 M H2SO4.
S. Biswas et al. / Journal of Industrial and Engineering Chemistry 19 (2013) 547–553552
at 2 M HNO3 as feed acid and 6 M H2SO4 as the receiver phase(Fig. 8). The decrease in U(VI) permeation was observed withincrease in U(VI) concentration from 4.8 � 10�4 M U(VI) to3.2 � 10�3 M U(VI). This behavior can be attributed to decreasein the ligand concentration in the membrane phase, which shouldbe available for uranium transport [40]. Similar observations werereported in case of Co(II) and U(VI) transport through a supportedliquid membrane system containing triethanolamine/cyclohexa-none and di(2-ethylhexyl)isobutyramide (D2EHIBA) as carrier[41,42].
3.6. Effect of membrane thickness
As described Section 3.4, the transport of uranium across SLM isa diffusion controlled phenomena. For such transport process, thepermeability (P) of the metal ion is depends on the membranethickness (effective diffusion path length) [19,32]. The permeabili-ty coefficient (P) depends on the membrane thickness d(o) and
distribution coefficient (DU) of the metal ion by the followingequation [28]:
P ¼ DU
DUðdðaÞ=DðaÞÞ þ ðtdðoÞ=DðoÞÞ(14)
where, P, the permeability coefficient, DU is the distribution ratio ofU(VI), d(a), D(a) are the thickness of aqueous layer, diffusioncoefficient of aqueous phase and d(o), t, D(o) are the thickness ofmembrane phase, tortuosity and diffusion coefficient of metal-ligand complex across SLM, respectively. The U(VI) permeationexperiments were carried out by varying the effective membranethickness from 60 mm to 240 mm (pore size: 0.45 mm) and using2 � 10�3 M U(VI) in the feed solution containing 2 M HNO3. 0.1 MDNPPA/n-paraffin was used as carrier solvent in the membranephase in presence of 6 M H2SO4 as the receiver phase. Here thegeometrical thickness of the membranes are considered aseffective diffusion path length d(0). With increase in membranethickness there is a gradual decrease in U(VI) permeation (Fig. 9)due to increase in diffusional resistance with effective path length.Assuming the diffusion of U(VI)–(HA2)2 across membrane is ratedetermining step, the first term in the denominator of Eq. (10) canbe ignored and P can be represented as [31]:
P ¼ DU �DðoÞtdðoÞ
(15)
Fig. 9 shows the plot of P vs 1/d(o) yield a straight line with a slope of5.99 � 10�6 � 7.9 � 10�7. Assuming the known value of DU
(1.05 � 102) and t(2.7), D(o) was calculated as 1.58 � 10�7 cm2 s�1.The D(o) calculated from kinetic modeling and membrane thicknessvariation methods are in well agreement. Similar results of D(o) werereported for uranium permeation from nitric acid medium across SLMusing a synergistic mixture of 0.1 M DNPPA + 0.05 M Cyanex 923/n-paraffin as carrier [38].
3.7. Uranium recovery studies from actual UNR waste solution
The SLM based separation process developed was applied forselective recovery of uranium from UNR waste solution generatedduring purification of uranium from crude raw material throughU(VI)–HNO3–TBP route in the front end of fuel cycle. It contains�0.5 g/L U(VI) at �1.1 M HNO3 solution and a large number ofother metal ions as impurities (Table 7). Recovery of U(VI) fromsuch nuclear waste solution was carried out employing SLM basedseparation techniques where 0.1 M DNPPA/n-paraffin was used ascarrier solution and 6 M H2SO4 as receiver phase. PTFE membranehaving pore size of 0.45 mm was used as solid support at 200 r.p.mstirring speed. �94% uranium transport was observed within 4 hunder the present experimental conditions (Table 9). Interestinglythere is negligible transport for transition and rare earth elements.These studies suggest that an optimum condition 0.1 M DNPPA/n-paraffin as carrier in combination with 6 M H2SO4 as receiver phasecan be used to recover uranium from UNR waste solutionefficiently.

S. Biswas et al. / Journal of Industrial and Engineering Chemistry 19 (2013) 547–553 553
4. Conclusions
The U(VI) permeation studies from 2 � 10�3 M U(VI) at 2 MHNO3 as feed, across SLM impregnated with DNPPA dissolvedin n-paraffin as carrier solvents was investigated. The variationof H2SO4 concentration in the receiver phase showed thaturanium transport across the membrane increase with increasein H2SO4 concentration and become optimum at 6 M. Thevariation of feed acidity shows that the U(VI) across SLM isoptimum at 0.5 M HNO3 in presence of 0.1 M DNPPA as carrierand 6 M H2SO4 as receiver phase. A kinetic model was proposedto evaluate the diffusion parameters of the system and it wasobserved that the diffusion coefficient of the metal –complexacross SLM was 2.35 � 10�7 cm2 s�1. The U(VI) permeationacross SLM decreased with increase in membrane thickness.Based on the experiments an optimized condition was applied torecover uranium from UNR waste solution and satisfactoryresults were obtained.
References
[1] Department of Atomic Energy, Annual Report 2011–12 (2011) 4.[2] B. Bhattacharjee, 14th Indian Nuclear Society Annual Conference (INSAC), IT-1,
2003, 1–27.[3] Thorium Fuel Cycle: Potential Benefits and Challenges, International Atomic
Energy Agency (IAEA) Technical Document 1450, May (2005).[4] T.K. Mukherjee, H. Singh, 14th Indian Nuclear Society Annual Conference (INSAC)
IT-7, 2003, 1–9.[5] C.K. Gupta, H. Singh, Uranium Resource Processing: Secondary Resources, Spring-
er, Germany, 2003.[6] S. Biswas, P.N. Pathak, S.B. Roy, V.K. Manchanda, Separation Science and Tech-
nology 46 (2011) 592–600.[7] S. Biswas, P.N. Pathak, S.B. Sangita Pal, P.K. Roy, V.K. Tewari, J. Manchanda,
Separation Science and Technology 46 (2011) 2110–2118.[8] S. Biswas, P.N. Pathak, D.K. Singh, S.B. Roy, J. Manchanda, Journal of Radio-
analytical and Nuclear Chemistry 284 (2010) 13–19.[9] C.T. Huang, T.C. Huang, Solvent Extraction and Ion Exchange 5 (1987)
611–631.[10] F.J. Hurst, D.J. Crouse, K.B. Brown, Industrial and Engineering Chemistry Process
Design and Development 11 (1972) 122–128.[11] S. Mishra, V. Chakravortty, Hydrometallurgy 44 (1997) 371–376.[12] T. Sato, Journal of Inorganic and Nuclear Chemistry 24 (1962) 699–706.[13] IUPAC Technical Report Series No. 431, Application of Membrane Technologies for
Liquid Waste Processing, IAEA, Vienna, 2004.
[14] W.C. Babcock, R.W. Baker, E.D. Lachapelle, K.L. Smith, Journal of MembraneScience 7 (1980) 71–87.
[15] S. Sifniades, T. Largman, A.A. Tunick, F.W. Koff, Hydrometallurgy 7 (1981)201–212.
[16] M.A. Chaudry, N.D. Mohammad, Journal of Radioanalytical and Nuclear Chemistry109 (1987) 11–22.
[17] J.P. Shukla, S.K. Misra, Journal of Membrane Science 64 (1991) 93–102.[18] S.K. Singh, S.K. Misra, M. Sudersanan, A. Dakshinamoorthy, Separation Science
and Technology 44 (2009) 169–189.[19] J.M. Joshi, P.N. Pathak, A.K. Pandey, V.K. Manchanda, Hydrometallurgy 96 (2009)
117–122.[20] C.S. Kedari, S.S. Pandit, S.K. Misra, A. Ramanujam, Hydrometallurgy 62 (2001)
47–56.[21] S. Biswas, P.N. Pathak, S. Pal, S.B. Roy, P.K. Tewari, V.K. Manchanda, Separation
Science and Technology 46 (2011) 2110–2118.[22] H. Singh, S.L. Mishra, M. Anita, R. Vijayalakshmi, A.B. Giriyalkar, M.K. Kotekar, T.K.
Mukherjee, US Patent. No. 7192563, 2007.[23] H. Singh, R. Vijayalakshmi, S.L. Mishra, C.K. Gupta, Hydrometallurgy 59 (2001)
69–76.[24] H. Singh, S.L. Mishra, R. Vijayalakshmi, Hydrometallurgy 73 (2004) 63–70.[25] H. Singh, S.L. Mishra, R. Vijayalakshmi, A.B. Giriyalkar, C.K. Gupta, US Pat. no.
6,645,453B2, Nov. 11, 2003.[26] S. Biswas, P.N. Pathak, D.K. Singh, S.B. Roy, V.K. Manchanda, International Journal
of Mineral Processing 104–105 (2011) 17–23.[27] S. Sriram, P.K. Mohapatra, A.K. Pandey, V.K. Manchanda, L.P. Badheka, Journal of
Membrane Science 177 (2000) 163–175.[28] P.R. Danesi, Separation Science and Technology 19 (1984) 857–894.[29] P.R. Danesi, R. Chiarizia, P. Rickert, E.P. Horwitz, Solvent Extrction and Ion
Exchange 3 (1985) 111–147.[30] H. Singh, C.K. Gupta, Mineral Processing and Extractive Metallurgy Review 21
(2000) 307–349.[31] M. Alonso, A.L. Delgado, A.M. Sastre, AlguacilF F.J., Chemical Engineering Journal
118 (2006) 213–219.[32] S.K. Singh, S.K. Mishra, S.C. Tripathi, D.K. Singh, Desalination 250 (2010) 19–25.[33] S. Panja, P.K. Mohapatra, S.C. Tripathi, V.K. Manchanda, Separation Science and
Technology 46 (2011) 94–104.[34] T.C. Huang, R.S. Juang, Journal of Chemical Technology and Biotechnology 42
(1988) 3–17.[35] B. Swain, J. Jeong, J. Lee, G. Lee, Journal of Membrane Science 297 (2007) 253–261.[36] R.S. Juang, S.H. Lee, Journal of Membrane Science 110 (1996) 13–23.[37] F.J. Alguacil, M. Alonso, A.M. Sastre, Journal of Membrane Science 184 (2001)
117–122.[38] S. Biswas, P.N. Pathak, S.B. Roy, Desalination 290 (2012) 74–82.[39] A. Sastre, A. Madi, J.L. Cortina, N. Miralles, Journal of Membrane Science 139
(1998) 57–65.[40] P. Surajit, P.K. Mohapatra, S.C. Tripathi, V.K. Manchanda, Journal of Membrane
Science 337 (2009) 274–281.[41] N. Bukhari, M.A. Chaudry, M. Mazhar, Journal of Membrane Science 234 (2004)
157–165.[42] S. Shailesh, P.N. Pathak, P.K. Mohapatra, V.K. Manchanda, Journal of Membrane
Science 272 (1–2) (2006) 143–151.