Embed Size (px)
Citation preview
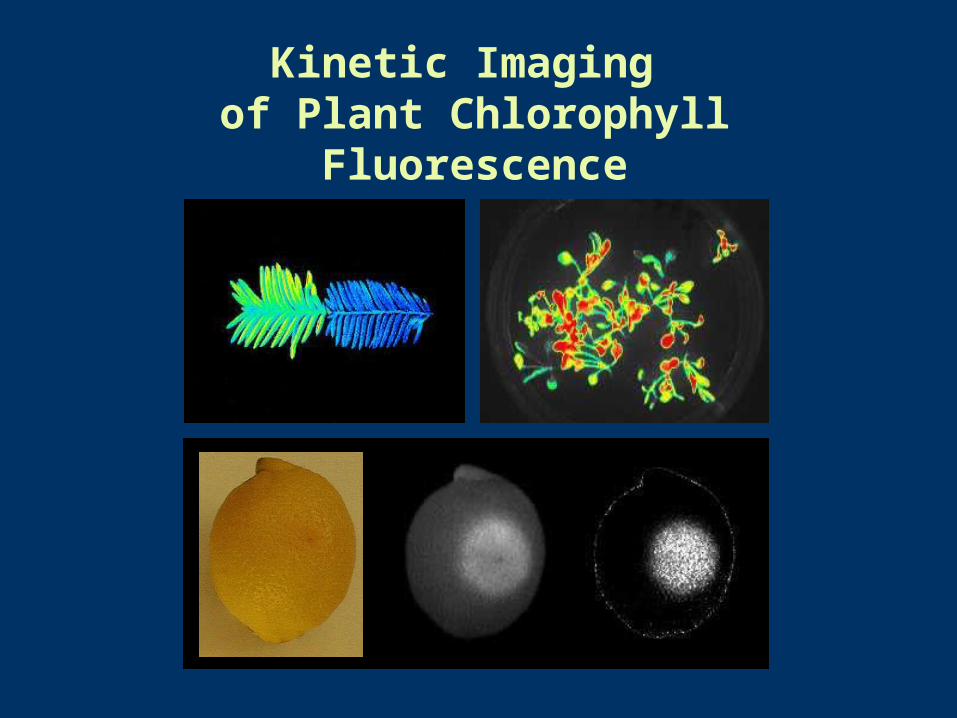
Kinetic Imaging of Plant Chlorophyll Fluorescence
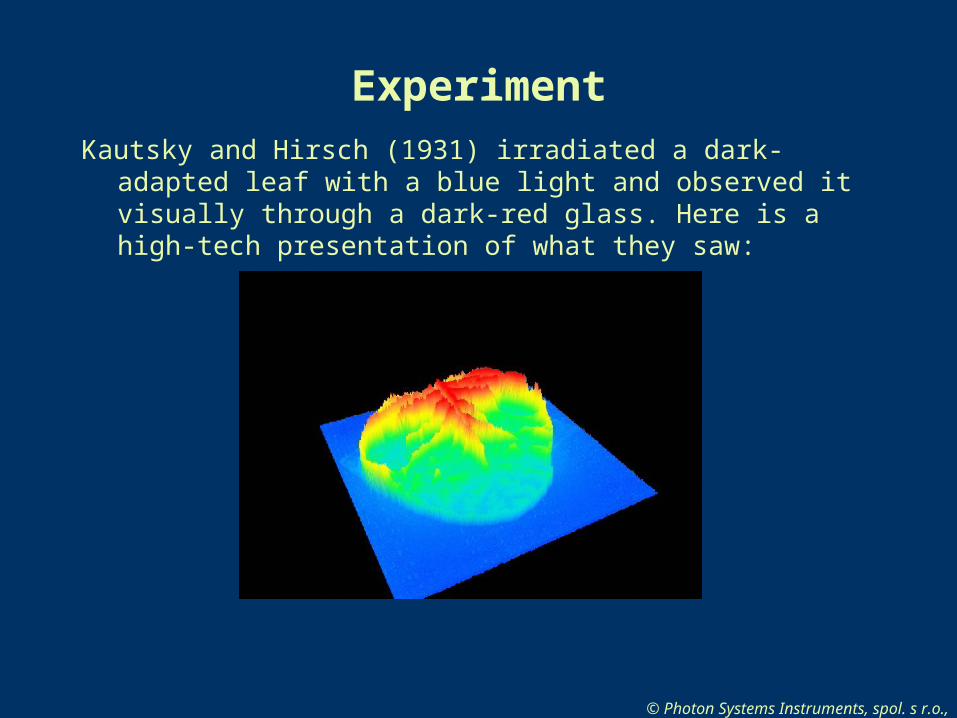
ExperimentKautsky and Hirsch (1931) irradiated a dark-adapted leaf with a blue light
and observed it visually through a dark-red glass. Here is a high-tech presentation of what they saw:
© Photon Systems Instruments, spol. s r.o., CZ

Chla fluorescence competes with photosynthesis for excitation energy
S0
S1
S2
Chla 1
hblue
fluorescence hNIR
photosynthesis
© Photon Systems Instruments, spol. s r.o., CZ
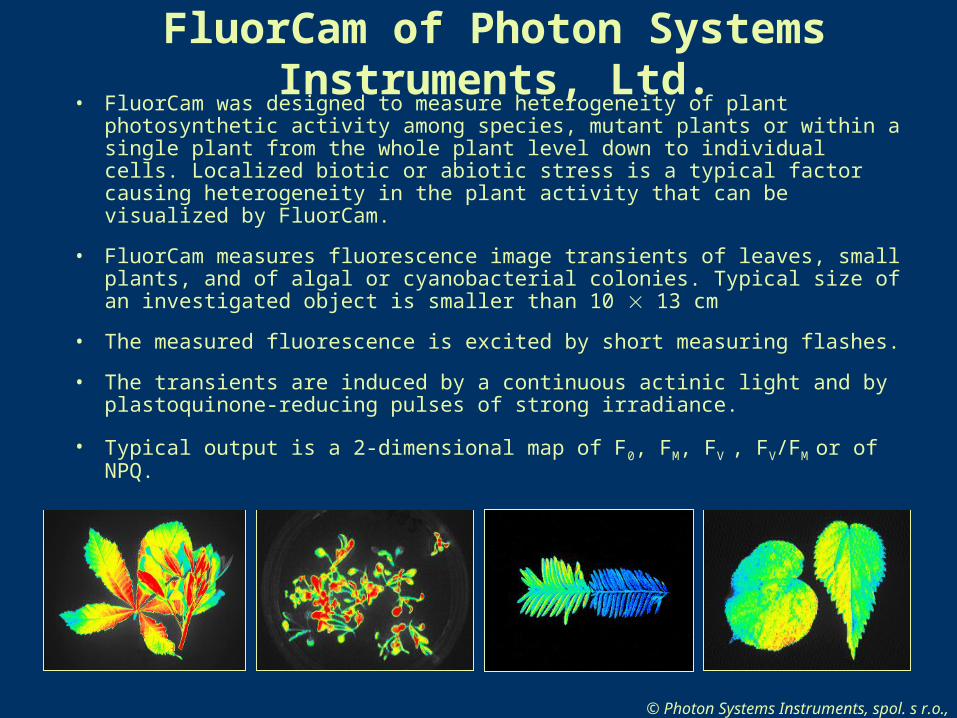
FluorCam of Photon Systems Instruments, Ltd.• FluorCam was designed to measure heterogeneity of plant photosynthetic activity
among species, mutant plants or within a single plant from the whole plant level down to individual cells. Localized biotic or abiotic stress is a typical factor causing heterogeneity in the plant activity that can be visualized by FluorCam.
• FluorCam measures fluorescence image transients of leaves, small plants, and of algal or cyanobacterial colonies. Typical size of an investigated object is smaller than 10 13 cm
• The measured fluorescence is excited by short measuring flashes.
• The transients are induced by a continuous actinic light and by plastoquinone-reducing pulses of strong irradiance.
• Typical output is a 2-dimensional map of F0, FM, FV , FV/FM or of NPQ.
© Photon Systems Instruments, spol. s r.o., CZ

Fluorescence
QA-
750 LED’s are on for 10-200 s
Only few PSII RC’s are excited
Yet, sufficient fluorescence emission is produced to capture an image
Measuring flashes have little actinic effects
© Photon Systems Instruments, spol. s r.o., CZ

QA- QA
- QA- QA
- QA- QA
-
During the actinic light exposure, the continuous excitation keeps some of the PSII RC’s closed
LEDs are on for seconds to minutes
Actinic light is causing fluorescence induction
© Photon Systems Instruments, spol. s r.o., CZ

F0
FPEAK
from F0 with open PSII RC’s
to FPEAK with mostly closed PSII RC’s
In fluorescence, the actinic light elicits in plants the Kautsky
effect of fluorescence induction.
QA- QA
- QA- QA
- QA- QA
-
© Photon Systems Instruments, spol. s r.o., CZ
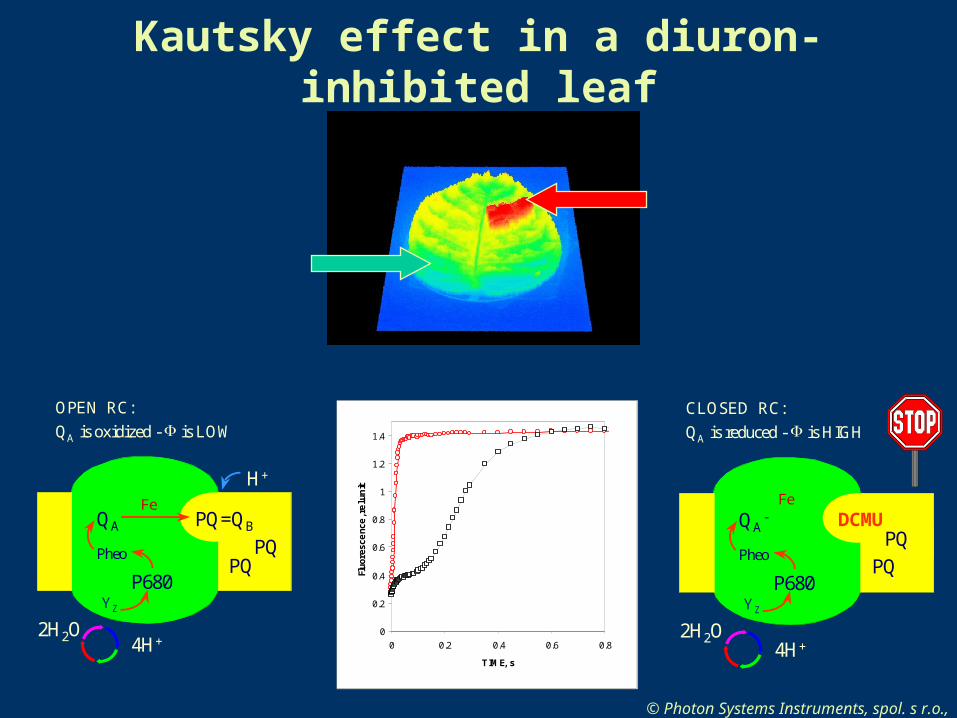
OPEN RC:
QA is oxidized - is LOW
QA PQ=QB
Fe
Pheo
P680YZ
PQPQ
2H2O 4H+
H+
0
0.2
0.4
0.6
0.8
1
1.2
1.4
0 0.2 0.4 0.6 0.8
TIME, s
Fluo
resc
enc
e, r
el.u
nit
Kautsky effect in a diuron-inhibited leaf
© Photon Systems Instruments, spol. s r.o., CZ
QA-
Pheo
P680YZ
PQH2
2H2O4H+
CLOSED RC:
QA is reduced - is HIGH
PQH2
Fe
DCMU

Before the pulse
During the pulse, PSII RC’s are closed by a transient reduction of the plastoquinone pool.
The shutter of the halogen lamp is open typically for 1s
QA-
QA-
QA-QA
-QA
- QA-
QA-
QA-
QA-
QA-
QA-QA
-QA
- QA-
QA-
QA-
PQ-reducing super pulse
© Photon Systems Instruments, spol. s r.o., CZ

Fluorescence before the pulse
F0
Open PSII reaction centersThe closure of all PS RC’s is reflected by a transient
from F0 to FM.
Fluorescence at the end of the pulseFM
QA-
QA-
QA-QA
-QA
- QA-
QA-
QA-
Fluorescence in PQ-reducing super pulse.
© Photon Systems Instruments, spol. s r.o., CZ
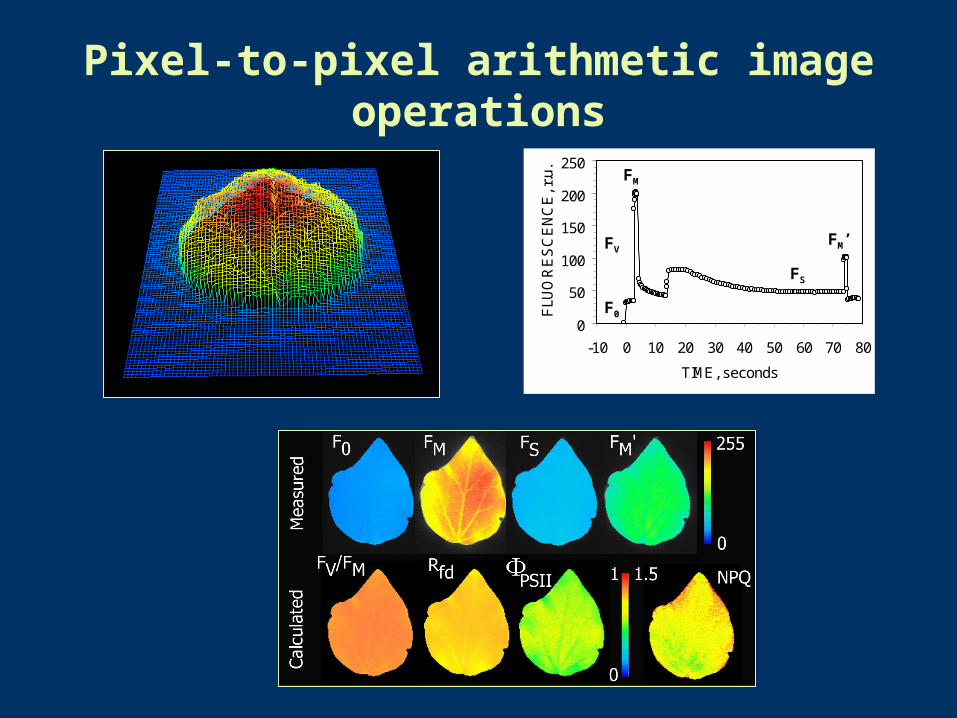
0
50
100
150
200
250
-10 0 10 20 30 40 50 60 70 80
TIME, seconds
FLU
OR
ES
CE
NC
E, r
.u.
F0
FM
FV
FS
FM’
Pixel-to-pixel arithmetic image operations

Color photograph
Fluorescence FM image
Chlorophyll fluorescence from ripe lemon fruits
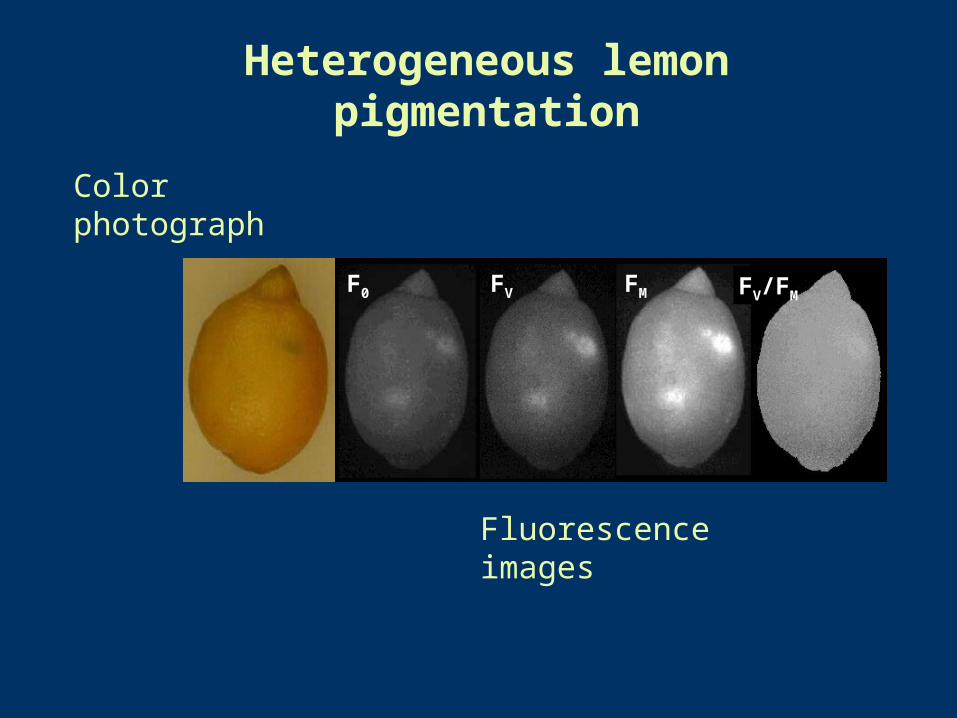
Color photograph
Fluorescence images
F0 FV FM FV/FM
Heterogeneous lemon pigmentation

Color photograph
Fluorescence images
F0 FM FV/FMFV
Post-harvest lemon damage
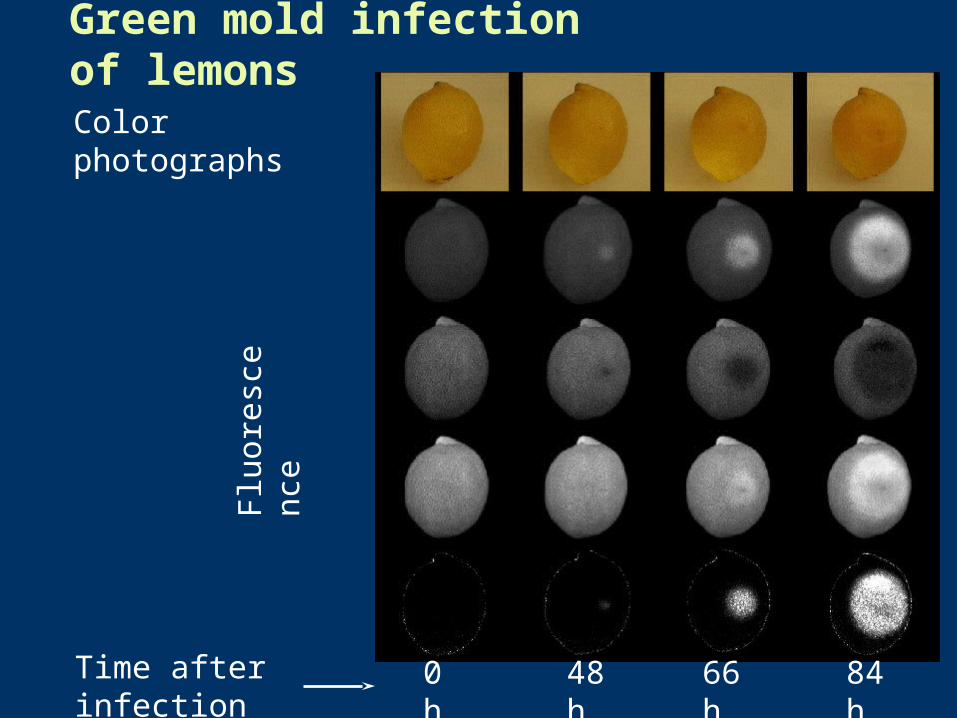
Green mold infection of lemons
Color photographs
Flu
ores
cenc
e
Time after infection 0 h 48 h66 h
84 h

0
0.005
0.01
0.015
0.02
0.025
0.03
0 50 100 150 200
Fluorescence intensity, r.u.
Re
lativ
e fr
eq
uenc
y, r
.u.
Histograms reveal parameters of the highest contrast
FM
F0
FV

The mold-infected peel tissue contains detached antenna complexes
0
0.2
0.4
0.6
0.8
1
640 660 680 700 720 740 760 780
Wavelength, nm
Flu
ore
sce
nce
, r.u
. healthy
infected

Phytotoxin response visualized by fluorescence
Sinapis alba60 h, 2000 mg/l destruxin
Brassica oleracea60 h, 0-500 mg/l destruxin
0.05 mg/l
0 mg/l
0.5mg/l50mg/l
500mg/l

TIME, s0 5 20 30 40
PLA
NT
FLU
OR
ES
CE
NC
E, F
(t) / F
o
0
2
4
6
8
10Hcf mutant
WT
Saturating Pulses:
ONActinic Light: OFF
A B
Mutant selection

High-light stress sensitivity
FV/FM
2
© Photon Systems Instruments, spol. s r.o., CZ

TIME, s0 5 20 30 40
LE
AF
FL
UO
RE
SC
EN
CE
, F(t
) / F
o
0
1
2
3
4
5
6
7
Saturating Pulses:
ON
Young Leaf
Old Leaf
A B C
Actinic Light:
OFF
Leaf development

T I M E , s
0 5 1 0 1 5 2 0 2 5
SIG
NA
L, r
el.u
nits
5 0
5 5
6 0
6 5
7 0
I R R A D I A N C E , m o l ( p h o t o n ) . m - 2 . s - 1
0 2 5 0 5 0 0 7 5 0 1 0 0 0 1 2 5 0 1 5 0 0
FL
UO
RE
SC
EN
CE
F(t
), F
M',
rel.u
nits
2
4
6
8
1 0
1 2
1 4
1 6
1 8
A
C
BA
O NA c t i n i c L i g h t : O F F
Field operation

0 100 110 120 130 140 1500
20
40
60
80
100 Elodea cell diatom
rela
tive
fluor
esce
nce
time / s
50 m
FV / FM FS
FS – F0
Microscopic kinetic fluorescence imaging
diatoms
Elodea chloroplasts
Average

Heterocyst formation in cyanobacteria
Transmittance FM fluorescence