Embed Size (px)
Citation preview

Kinesiology Publications Kinesiology
2-2016
Kinematic and Kinetic Indicators of Sit-to-Stand.Catherine A. StevermerDes Moines University - Osteopathic Medical Center
Jason C. GilletteIowa State University, [email protected]
Follow this and additional works at: http://lib.dr.iastate.edu/kin_pubs
Part of the Biomechanics Commons, Exercise Science Commons, and the Psychology ofMovement Commons
The complete bibliographic information for this item can be found at http://lib.dr.iastate.edu/kin_pubs/15. For information on how to cite this item, please visit http://lib.dr.iastate.edu/howtocite.html.
This Article is brought to you for free and open access by the Kinesiology at Iowa State University Digital Repository. It has been accepted for inclusionin Kinesiology Publications by an authorized administrator of Iowa State University Digital Repository. For more information, please [email protected].

Kinematic and Kinetic Indicators of Sit-to-Stand.
AbstractVariation in the timing indicators separating sit-to-stand (STS) into movement phases complicates bothresearch comparisons and clinical applications. The purpose of this study was to use kinetic referencestandards to identify accurate kinematic and kinetic indicators for STS movement analysis such thatconsistent indicators might be used for STS from varied initial postures. Healthy adults performed STS using4 foot placements: foot-neutral, foot-back, right-staggered, and left-staggered. Kinetic and kinematic data werecollected from force platforms and an 8-camera video system. Initiation, seat-off, vertical posture, andtermination were detected with 5% start and 7.5% end thresholds for changes in kinetic and kinematic STSindicators. Timing differences between kinetic and kinematic indicator time points and the reference verticalseated reaction force end point (seatoff) were determined. Kinematic indicators were compared with selectedkinetic indicators using timing differences, statistical similarity, and internal consistency measures. Our resultssuggest that a single force platform system measuring vertical GRF or a simple camera system to evaluate theshoulder marker position and velocity can accurately and consistently detect STS initiation, seat-off, andvertical posture. In addition, these suggested STS indicators for initiation, seat-off, and vertical posture werenot dependent upon foot placement.
Keywordsbiomechanics, motion analysis, force plate
DisciplinesBiomechanics | Exercise Science | Kinesiology | Psychology of Movement
CommentsThis is a accepted manuscript from Journal of Applied Biomachanics, 2016, 32(1); 7-15. DOI; 10.1123/jab.2014-0189. Posted with permission.
This article is available at Iowa State University Digital Repository: http://lib.dr.iastate.edu/kin_pubs/15
1
Kinematic and Kinetic Indicators of Sit-to-Stand 2
Article Type: Original Research 3
Catherine A. Stevermer1 and Jason C. Gillette2 4
5
1Department of Physical Therapy, Des Moines University, Des Moines, IA, USA 6
2Department of Kinesiology, Iowa State University, Ames, IA, USA 7
8
Funding: University Research Grant, Iowa State University 9
10
Conflict of Interest Disclosure: The authors certify that they have no conflict of interest in 11
connection with the material presented in this manuscript. 12
13
Correspondence Address: Catherine A. Stevermer 14
Des Moines University 15
Department of Physical Therapy 16
3200 Grand Avenue – AC 317 17
Des Moines, IA 50312, USA 18
Telephone: +1 515-271-1467 19
Fax: +1 515-271-1614 20
22
Running Title: Indicators of Sit-to-Stand 23
24

2
Abstract: Variation in the timing indicators separating sit-to-stand (STS) into movement phases 25
complicates both research comparisons and clinical applications. The purpose of this study was 26
to use kinetic reference standards to identify accurate kinematic and kinetic indicators for STS 27
movement analysis such that consistent indicators might be used for STS from varied initial 28
postures. Healthy adults performed STS using four foot placements: foot-neutral, foot-back, 29
right-staggered and left-staggered. Kinetic and kinematic data were collected from force 30
platforms and an eight-camera video system. Initiation, seat-off, vertical posture and termination 31
were detected with 5% start and 7.5% end thresholds for changes in kinetic and kinematic STS 32
indicators. Timing differences between kinetic and kinematic indicator time points and the 33
reference vertical seated reaction force end point (seat-off) were determined. Kinematic 34
indicators were compared to selected kinetic indicators using timing differences, statistical 35
similarity, and internal consistency measures. Our results suggest that a single force platform 36
system measuring vertical GRF or a simple camera system to evaluate the shoulder marker 37
position and velocity can accurately and consistently detect STS initiation, seat-off, and vertical 38
posture. In addition, these suggested STS indicators for initiation, seat-off, and vertical posture 39
were not dependent upon foot placement. 40
41
Keywords: biomechanics, motion analysis, force plate 42
43

3
Introduction: 44
The sit-to-stand (STS) movement is a fundamental activity of daily living required for 45
upright posture, gait initiation, and personal-care tasks.1,2 Hence, it is frequently utilized in a 46
rehabilitation environment for screening or assessment purposes.3 Researchers have investigated 47
links between physical capability and performance environment to evaluate movement 48
compensations in STS.2 However, there is a range of descriptions for STS performance and 49
assessment methods.4 50
The STS task is a transitional movement, requiring an individual to move the center of mass 51
(COM) from a stable position in sitting to more unstable base of support in stance.2 Although 52
some authors simplify STS into two parts (a flexion phase and an extension phase),5 others report 53
four components (initiation, seat-off, ascension and stabilization)6 or four phases (flexion-54
momentum, momentum transfer, extension and stabilization).7 The flexion-momentum phase 55
occurs from movement initiation to seat-off, followed by momentum transfer phase from seat-off 56
to maximal ankle dorsiflexion. The third phase is extension, progressing from maximal 57
dorsiflexion until hip extension is completed. Finally, stabilization proceeds from full hip 58
extension until postural stability is achieved and movement termination is denoted. Besides 59
varying the STS phase descriptions, authors vary the indicators for the beginning and ending 60
points of each phase of STS movement. Inconsistent definitions for indicators and phases 61
complicates the comparisons between published reports.8,9,10 62
Previous research focused on assumptions of bilaterally equivalent anthropometrics, joint 63
timing, and weight-bearing during STS. Most researchers evaluate STS with participants 64
initiating movement from symmetric lower extremity postures involving more than 90° of knee 65
joint flexion.6,9,11,12,13 Kinetic evidence suggests individuals perform STS asymmetrically, despite 66
symmetric foot positioning.13,14 Clinical experience suggests individuals with pathology may 67

4
utilize an asymmetric foot placement as a compensatory mechanism during STS.15,16 Healthy 68
individuals may use an asymmetric placement preceding sit-to-walk transitions or for anticipated 69
directional changes upon standing. Although investigators altered chair height10 and symmetrical 70
foot placement,17 limited evidence exists on STS phase and event sequencing with systematically 71
manipulated lower extremity positions including asymmetric foot placements.2,4,18 Therefore, 72
determining consistent mechanisms for STS evaluation across various lower extremity postures 73
may have substantial utility with clinical populations who cannot attain symmetric positioning, 74
for expanding sit-to-walk as a fall screening tool,19 or for identifying muscle or joint impairments 75
in individuals with asymmetric STS movement patterns.14,20 76
Depending on instrumentation and setting (laboratory versus clinic), variation exists in the 77
availability of kinematic and kinetic measurements during STS performance (Table 1). This 78
difference in equipment availability may affect the assessment of STS duration and phases due to 79
variation in movement indicators. Some authors evaluate STS only from seat-off as it is 80
identifiable from seat switches or force platforms under the feet.10, 25 Others collect data through 81
the end of ascension as it is detected with kinematic measures, rather than assessing STS through 82
the stabilization phase.5,22,26,27,30 All STS phases can be accomplished in various ways as 83
individuals demonstrate multiple strategies for successful STS.10,11 The selected STS strategy 84
may provide key information to a clinician about physical limitations which guide rehabilitation 85
and impact functional capability.28 86
The variation in STS movement indicators may affect descriptions of strategies, performance 87
duration, and time normalization for biomechanical analysis. Kinetic indicators based solely on 88
measurements from a single in-ground or portable force platform would allow for a simple 89
equipment setup. Etnyre & Thomas (2007) identified consistent ground reaction force (GRF) 90

5
events with different STS techniques (arms free, arms crossed, using armrests, and hands on 91
knees).4 Kinematic indicators are used with motion analysis systems, standard video or 92
potentially visual assessment. Knowledge of kinematic and kinetic indicators would allow 93
clinicians and researchers to consistently evaluate STS for collaborative rehabilitation projects 94
such as using STS movement strategies to evaluate rehabilitation efficacy,28,29 or for prognostic 95
research on disease progression or treatment response. The purpose of this investigation was to 96
select accurate kinetic and kinematic indicators for STS movement analysis in healthy adults 97
using kinetic measures as reference standards such that consistent indicators might be used for 98
varied initial postures. 99
Kinetic and kinematic indicators were evaluated for accuracy and consistency in detecting 100
STS movement time points. Our first hypothesis was vertical GRF would provide the most 101
accurate and consistent kinetic indicator of initiation and seat-off due to its ability to detect 102
different STS techniques.4 Our second hypothesis was shoulder horizontal position would be the 103
most accurate and consistent kinematic indicator of initiation as it is sensitive to anterior or 104
posterior postural changes. Based on previous work,9,10,20 our third hypothesis was hip marker 105
vertical position would be the most accurate and consistent kinematic indicator of seat-off as it 106
relates to leaving seated support. Our fourth hypothesis was trunk angular velocity would be the 107
most accurate and consistent kinematic indicator for vertical posture and termination in 108
conjunction with previous authors.8,9 Lastly, as STS movement sequencing does not appear to be 109
altered in healthy populations of various ages,12,28 we expected that selected movement 110
indicators for each time point would exhibit similar levels of accuracy and consistency across 111
symmetric and asymmetric placements. 112
113

6
Methods: 114
Eighteen healthy older adults (67.8 ± 7.5 years) and seventeen healthy younger adults (32.7 ± 115
4.2 years) participated. A verbal review of medical history and physical activity was completed 116
with each participant. Exclusion criteria included physical impairments which limited STS 117
movement performance without upper extremity assistance. The Human Subjects Research 118
Compliance Office at Iowa State University approved the experimental protocol, and research 119
participants provided informed consent before study participation. 120
During the experimental session, participants’ height and weight were assessed. Retro-121
reflective markers were applied to participants for tracking by an eight-camera video system 122
(Peak Performance, Centennial, CO). Spherical markers were attached to skin or snug-fitting 123
clothing. A static standing trial was collected with markers placed bilaterally on the participants’ 124
toes, midfeet, heels, lateral malleoli, medial malleoli, shins, lateral and medial femoral condyles, 125
thighs, greater trochanters, posterior superior iliac spines, acromion processes, upper arms, 126
lateral elbow joints, forearms, and ulnar styloids. Additional markers were placed at the 127
suprasternale and sacrum. This marker set divided the body into eleven segments: right/left feet, 128
right/left calves, right/left thighs, right/left upper arms, right/left forearms, and a head/trunk 129
segment. Video data were collected at a sampling rate of 120 Hz and low pass filtered at a 130
frequency of 6 Hz with a symmetric, fourth-order Butterworth filter. 131
Participants began each STS trial in a seated posture at a height of 48.5 cm on a bench-132
mounted force platform (AMTI, Watertown, MA) to measure vertical seated reaction forces as a 133
seat-off reference standard for comparison with proposed kinetic and kinematic indicators.23 134
With their feet at a comfortable width on separate force platforms (ATMI, Watertown, MA) to 135
record GRF, participants performed STS with four initial foot placements. The initial foot 136

7
placements included: foot-neutral (90º bilateral knee flexion), foot-back (100º bilateral knee 137
flexion), right-staggered and left-staggered. The staggered foot placements entailed a 138
combination of the foot-back and foot-neutral placements. For example, in the right-staggered 139
placement, the right knee was flexed to 100º while the left knee was flexed to 90º. The force 140
platform data were collected at 120 Hz and synchronized with video data through Peak Motus 141
software. 142
Participants performed three repetitions of each foot placement for a total of twelve trials. 143
The order of trials was alternated across participants to reduce the influence of learning and a 144
minimum interval of one minute was allocated between trials to minimize fatigue and allow 145
repositioning. Multi-colored athletic tape marked the three foot placements and the depth of the 146
participant’s buttocks on the bench during initial positioning to ensure consistency between trials. 147
Participants were verbally instructed to position their feet according to tape color for each trial. A 148
two-stage verbal command (“Ready, Go”) cued participants to initiate STS. For all trials, 149
participants' arms remained crossed over their torso throughout the duration of the STS 150
movement, to minimize variation in momentum contributions and movement asymmetry due to 151
arm swing,2,4 and to avoid marker occlusion. Participants remained standing in their final 152
position for five seconds at the conclusion of the STS movement. 153
Data Processing: 154
Kinetic and kinematic indicators for STS time points of initiation, seat-off, vertical posture, 155
and termination were based on previous studies (Table 1). To detect changes in potential STS 156
indicators, start and end point thresholds were calculated using minimum and maximum values 157
from the range of data for the specific kinematic or kinetic indicator during each trial: 158
159

8
Thresholdstart = 0.05*(maximum value – minimum value) 160
Thresholdend = 0.075*(maximum value – minimum value) 161
The start point of a potential STS indicator was detected when a 5% threshold change (increasing 162
or decreasing) from the baseline seated value occurred. The end point of an indicator was 163
detected when a 7.5% threshold change from the final standing value occurred starting at the end 164
of the trial and moving backward in time.23 Baseline seated and final standing values were 165
determined from the initial or final 10 time points of data from each trial respectively. Depending 166
on the temporal pattern of the potential STS indicator, a maximum and/or a minimum value was 167
also detected. To form a common time comparison of all indicators, a known reference time 168
point was determined. The end point of the vertical seated reaction force was chosen since this 169
measure falls to zero at seat-off. 170
Kinetic STS indicators included anterior-posterior (AP) GRF, vertical GRF, and AP center of 171
pressure (COP). AP COP velocity was calculated, but did not have a consistent pattern across 172
participants and was not further considered. All kinetic values were calculated by combining 173
values from force platforms under the right and left feet, to allow systematic evaluation while 174
accounting for symmetric and asymmetric initial positions. Besides start and end time points, AP 175
GRF and vertical GRF had maximum points, while AP COP had a minimum point. Kinematic 176
movement indicators included hip marker horizontal/vertical position and velocity, shoulder 177
marker horizontal/vertical position and velocity, hip flexion angle and angular velocity, and 178
trunk lean angle and angular velocity. The hip flexion angle was a relative angle between the 179
trunk segment (hip marker to shoulder marker) and the thigh segment (hip marker to knee 180
marker), while the trunk lean angle was between the trunk segment and the global horizontal axis. 181
All positions, velocities and angles were calculated using markers on the right side of the body. 182

9
In addition to start and end time points for each kinematic indicator, velocities and angles had 183
maximum points, while angular velocities had maximum and minimum points. 184
Data Analysis: 185
Kinetic and kinematic indicators were determined for the foot-back placement because it is a 186
preferred posture due to lower physical demands during STS2,10,12,17 and similar knee flexion 187
ranges (95-110°) have been used for healthy adults.5,6,11,25,31 Timing differences between the 188
proposed kinetic and kinematic indicator time points and the reference vertical seated reaction 189
force end point were calculated for the foot-back placement for all participants. The proposed 190
kinetic and kinematic indicators were ordered by timing difference from earliest to latest 191
occurrence (Table 2). A one-way factorial ANOVA compared timing differences with a 192
significance level set at P>0.05 to denote statistical similarity amongst kinetic and kinematic 193
indicators for all time points. Previous investigators identified 6-10% timing differences in 194
movement phases as differentiating STS strategies,28 so differences below 230 milliseconds 195
defined an acceptable accuracy level based on a STS time of 2.3 seconds.4 A reliability analysis 196
of foot-back placement trials was performed to evaluate the internal consistency of indicators at 197
each time point, using correlation coefficients above 0.3 as representative of moderate inter-item 198
consistency, and above 0.5 as representative of a strong correlation.32 SPSS software (SPSS, Inc., 199
Chicago, Illinois) was used for statistical analysis. 200
Timing differences between the proposed kinematic indicators and vertical and AP ground 201
reaction force time points were calculated for initiation (Vertical and AP GRF Start), seat-off 202
(Vertical and AP GRF Maximum), vertical posture (Vertical GRF End), and termination (AP 203
GRF End) for the foot-back placement. The vertical and AP GRF kinetic reference points were 204
used for kinematic comparisons due to the clinical utility of one piece of equipment to assess all 205

10
STS phases and the ability to compare with previous literature referencing vertical GRF.4,6,8,10,11 206
Kinematic indicators were compared to kinetic indicators using timing differences, statistical 207
similarity, and internal consistency measures. This analysis was repeated for the remaining foot 208
placement conditions to test if timing differences, similarity, and consistency were dependent 209
upon foot placement. 210
Results: 211
The AP and vertical GRF maximum points displayed the lowest timing differences (t= -0.04 212
to 0.03 s respectively) from the vertical seated reaction force end point as kinetic indicators of 213
seat-off across all foot placements (Table 2; Figure 1). The vertical GRF and AP GRF start 214
points exhibited the lowest timing differences (t=0.04 to 0.09 s) and statistical similarity (P=1.0) 215
compared to the vertical seated reaction force start point in detecting STS movement initiation 216
for all foot placements (Table 3). The vertical GRF starting point exhibited strong correlations 217
(r=0.745-0.931) with the vertical seated reaction force start point for all foot placements. The AP 218
GRF start point demonstrated a moderate correlation (r=0.380) with the vertical seated reaction 219
force start for the foot-back placement, but low correlations during other placements. The AP 220
COP start point did not correlate with the vertical seated reaction force start point nor other 221
kinematic STS indicators (r<0.3) and was not further considered. 222
The shoulder horizontal position and hip flexion angle start points exhibited statistical 223
similarity (P=1.0) and the lowest timing differences (t= -0.05 to 0.07 s) compared to the vertical 224
and AP GRF start points for detecting STS initiation across foot placements (Table 4; Figure 2). 225
The shoulder horizontal position start point demonstrated moderate correlations with vertical and 226
AP GRF in the foot-back and staggered placements (r=0.306-0.496), however low correlations in 227
foot-neutral (r=0.230-0.251). The hip flexion angle start point exhibited moderate correlations 228

11
with vertical and AP GRF in the foot-back placement for initiation (r=0.463), yet low 229
correlations in the other foot positions (r=0.093-0.267). 230
As a seat-off indicator, the hip flexion angle maximum point demonstrated the lowest timing 231
differences (t= -0.13 to -0.07 s), statistical similarity (P=1.00), and moderate correlations 232
(r=0.337-0.400) with the vertical GRF and AP GRF maximum points during the foot-back 233
placement (Table 5). Although equivalent timing differences and statistical similarity were 234
present in the other foot placements, the hip flexion angle maximum point exhibited low to 235
moderate correlations (r=0.075-0.449) with kinetic maximums. The shoulder vertical velocity 236
maximum point exhibited the next lowest timing differences (t=0.20 to 0.22), statistical 237
similarity (P=1.00), and strong correlations (r=0.579-0.790) compared to the vertical GRF 238
maximum point for all foot placements (Table 5; Figure 2). The shoulder horizontal velocity 239
maximum point had low timing differences (t= -0.14 to -0.16 s) and statistical similarity 240
(P=1.00), yet low to moderate correlations (r=0.122-0.389) compared to the AP GRF maximum 241
point across foot placements. Hip marker position-related indicators demonstrated larger timing 242
differences (Table 2) and small correlations (<0.3) with seat-off kinetic reference points. 243
The shoulder vertical position and velocity end points demonstrated the lowest timing 244
differences (t= -0.15 to 0.08 s), statistical similarity (P=1.00), and moderate correlations 245
(r=0.292-0.721) when compared to the vertical GRF end point as indicators of vertical posture 246
during all foot placements (Table 6). The AP COP minimum point did not have a correlation 247
above 0.3 with any kinematic STS indicator and was not considered further. 248
The trunk angular velocity and lean angle end points exhibited the lowest timing differences 249
(t= -0.22 to -0.20 s), statistical similarity (P=1.00), and moderate strength correlations (r=0.300-250
0.307) compared to the AP GRF end point as an indicator of STS termination in the foot-back 251

12
placement (Table 7). However, the timing differences were larger (t= -0.36 to -0.44 s) and 252
approached statistical significance for other foot placements (P<0.08). The AP COP end point 253
did not correlate (r<0.3) with any kinematic STS indicator in the foot-back placement, and was 254
not further considered. 255
Discussion: 256
For this study, kinematic and kinetic STS indicators for the time points of initiation, seat-off, 257
vertical posture and termination were identified using an algorithmic approach. For a kinetic or 258
kinematic indicator to be used for clinical and laboratory assessments, we recommend it be 259
accurate and consistent for varied foot placements and different populations. A common kinetic 260
or kinematic indicator to detect initiation, seat-off, vertical posture, and termination is desired. 261
Therefore, a set of kinetic and kinematic STS indicators was assessed based on the following 262
factors: 1) accuracy as evaluated by low average timing differences between kinetic and 263
kinematic indicators, 2) statistical similarity with reference time points, and 3) internal 264
consistency with kinetic indicators. 265
Our first hypothesis was the vertical GRF would provide the most accurate and consistent 266
kinetic indicators of STS initiation and seat-off. This hypothesis was supported with the vertical 267
GRF start point for initiation and the maximum point for seat-off (Figure 1). For initiation, the 268
vertical GRF start point had low timing differences (40 ms) and was strongly correlated with the 269
vertical seated reaction force start point (Table 3). For seat-off, the vertical GRF maximum point 270
had low timing differences (20-30 ms) when compared to the vertical seated reaction force end 271
point (Table 2). This is consistent with literature indicating seat-off from vertical GRF within 80 272
ms.33 For vertical posture, the vertical GRF end point had low timing differences (140-150 ms) 273
and was strongly correlated with the shoulder vertical position end point (Table 6). These results 274

13
suggest a portable single force platform system measuring vertical GRF could be used clinically 275
to assess STS initiation, seat-off, and vertical posture timing points. 276
AP GRF was considered as a kinetic indicator of STS timing points. The AP GRF maximum 277
point demonstrated a low timing difference (20-40 ms) compared to the vertical seated reaction 278
force for seat-off for all foot placements (Table 2). However, low correlations with vertical 279
seated reaction force during foot-neutral and staggered foot placements (Table 3) suggest the 280
vertical GRF is a superior choice as the kinetic indicator for STS initiation. No time point was 281
associated with AP GRF indicating vertical posture. The AP GRF end point appears to indicate 282
STS termination, but its effectiveness may be limited to foot-back placements (Table 7). 283
Alternate kinetic measures such as AP COP acceleration and different termination thresholds 284
merit further investigation. 285
Our second hypothesis of shoulder horizontal position being the most accurate and consistent 286
kinematic indicator of initiation was partially supported. For initiation, the shoulder horizontal 287
position start point had low timing differences (0-10 ms) compared to the vertical GRF start 288
point, but failed to exhibit consistent correlations across foot placements (Table 4). Regarding 289
seat-off, the third hypothesis of hip vertical position as an accurate indicator was not supported 290
as the shoulder vertical velocity maximum point was more accurate (200-220 ms) and exhibited 291
strong correlations with the vertical GRF maximum point across foot placements (Table 5). As 292
stated, a common kinematic indicator across multiple STS time points is desired. For detecting 293
vertical posture, the shoulder vertical position end point had low timing differences (140-150 ms) 294
and strong correlations with the vertical GRF end point across foot placements (Table 6). These 295
results are encouraging as shoulder-based kinematic measures (Figure 2) could indicate initiation 296

14
(shoulder horizontal position start point), seat-off (shoulder vertical velocity maximum point), 297
and vertical posture (shoulder vertical position end point). 298
As shoulder position is involved in hip flexion angle determinations, hip flexion angle may 299
be an alternative to joint marker position as an indicator because it incorporates lower and upper 300
body movements. Although the hip angle start point inconsistently detected STS initiation across 301
foot placements (Table 4), the hip flexion angle maximum point had the lowest timing 302
differences (120-130 ms) and moderate correlations with the vertical GRF maximum point at 303
seat-off for symmetrical foot placements (Table 5). Maximal hip flexion angle may provide 304
information about the STS movement strategy utilized, as suggested by previous 305
investigators.21,28 From a clinical perspective, observing seat-off relative to initiation and 306
termination time points may be important for assessing lower extremity strength, movement 307
strategy, or weight-shifting capability.28,31 Alternatively, specific determinations of seat-off may 308
be more relevant to laboratory-based activities. 309
Our fourth hypothesis that trunk angular velocity would be the kinematic indicator of choice 310
for STS vertical posture and termination was only partially supported. The trunk angular velocity 311
timing points had high timing differences and low correlations compared to the vertical GRF end 312
point. As mentioned, the shoulder vertical position end point is recommended for the kinematic 313
vertical posture indicator. 314
The trunk lean angle and angular velocity end point had the lowest timing differences (200-315
220 ms) and moderate correlations compared with the AP GRF end point as an indicator of 316
termination in the foot-back placement (Table 7). However, higher timing differences (360-440 317
ms) were observed with other placements and statistical similarity was not maintained. Other 318
kinematic indicators such as AP COM position or velocity may detect the termination point 319

15
across all foot placements, but require a more complex video analysis. Other investigators 320
suggested poor reliability of an algorithmic approach to detect STS termination, and used visual 321
estimation of steady standing posture as an alternative.4 The stabilization phase of STS may be 322
analyzed using techniques associated with quiet standing, although such analysis may require a 323
force platform to measure COP, which may preclude its clinical utility. 324
As expected, STS timing differences of the indicators for initiation, seat-off, and vertical 325
posture did not vary upon foot placement. This suggests that kinetic and kinematic indicators 326
could be consistently utilized for STS assessment without specific requirements for initial seated 327
posture. This is consistent with previous work in younger individuals suggesting standardized 328
indicators for STS analysis with the caveat of armrest involvement.4 However, timing differences 329
for STS termination were dependent upon foot placement using the indicators in this study. 330
There are limitations to this study. First, the only ‘gold standard’ STS timing measure is the 331
vertical seated reaction force reaching zero at seat-off. Similar standards do not exist for 332
initiation, vertical posture, or termination. Studying analog video synchronized with digital 333
measurements and/or comparing hand analysis with automated detection may provide further 334
evidence. Second, 5% start and 7.5% end thresholds of detection were utilized from previous 335
studies23 and incorporate movement ranges (based on maximum and minimum values) which 336
may be affected by participant heights given the fixed seat height. Threshold points may also be 337
impacted by combined lower extremity GRF data versus unilateral data. Further study of 338
threshold optimization may produce more accurate STS indicators. For example, a lower start 339
threshold for a dramatically changing measure like vertical GRF and a higher end threshold for 340
an oscillating measure like AP COP may be appropriate. Third, the combination of data from 341
younger and older healthy adults in this study may differ from indicators selected from a more 342
16
homogenous sample. However, we expect the results to be robust given similar movement 343
sequencing in healthy individuals12,30 and similar STS times for individuals utilizing a consistent 344
chair height.10,26 Individuals who struggle with STS movements may utilize alternate STS 345
strategies and exhibit movement patterns with slower, smoothed, or unpredictable changes in 346
indicators. A measurement used as an indicator or threshold levels may require adjustment if 347
STS time points are not consistently detected. Although the selected indicators were consistent 348
across foot placements, the timing differences (10-220 ms) may impact STS time normalization 349
which could alter phase designations and movement strategy determinations. Finally, requiring 350
participants to complete STS with arms crossed in this study may limit variation in movement 351
patterns analyzed. However, previous work demonstrated a common sequence of STS events 352
during upper extremity conditions in healthy individuals with the exception of armrest usage.4 353
Research laboratories analyzing STS movements commonly incorporate one or more force 354
platforms and automated motion capture cameras to provide a three-dimensional assessment. 355
However, elaborate set-ups and equipment are not available in many clinical settings to analyze 356
movement to an equivalent extent. This study offers recommendations for alternative assessment 357
methods in the event equipment available for STS analysis is limited. These results suggest a 358
single force platform system measuring vertical GRF can accurately and consistently detect STS 359
initiation, seat-off, and vertical posture. Additionally, results suggest a simple camera system to 360
evaluate shoulder marker position and velocity can detect STS timing points. A simplified 361
movement analysis system may allow increased collaboration between clinicians and researchers, 362
with the potential to impact individuals with pathology through improved assessment and 363
intervention. 364
365

17
Acknowledgements: 366
The authors would like to acknowledge Annika Triplett and Michael Hanish for assistance with 367
data compilation. 368
369
This work was supported by an Iowa State University Research Grant.370

18
References: 371 372
1. Eriksrud O, Bohannon RW. Relationship of knee extension force to independence in sit-to-373
stand performance in patients receiving acute rehabilitation. Phys Ther. 2003; 83(6):544-551. 374
2. Janssen WGM, Bussmann HBJ, Stam HJ. Determinants of the sit-to-stand movement: A 375
review. Phys Ther. 2002; 82(9):866-879. 376
3. Lusardi MM, Pellecchia GL, Schulman M. Functional performance in community living 377
older adults. J Geri Phys Ther. 2003;26(3):14-22. 378
4. Etnyre B, Thomas DQ. Event standardization of sit-to-stand movements. Phys Ther. 379
2007;87(12):1651-1666. 380
5. Nuzik S, Lamb R, VanSant A, Hirt S. Sit-to-stand movement pattern. Phys Ther. 381
1986;66(11):1708-1713. 382
6. Kralj A, Jaeger RJ, Munih M. Analysis of standing up and sitting down in humans: 383
Definitions and normative data presentation. J Biomech. 1990;23(11):1123-1138. 384
7. Schenkman M, Berger RA, Riley PO, Mann RW, Hodge WA. Whole-body movements 385
during rising to standing from sitting. Phys Ther. 1990;70(10):638-651. 386
8. Gross MM, Stevenson PJ, Charette SL, Pyka G, Marcus R. Effect of muscle strength and 387
movement speed on the biomechanics of rising from a chair in healthy elderly and young 388
women. Gait Posture. 1998;8(3):175-185. 389
9. Mourey F, Grishin A, d'Athis P, Pozzo T, Stapley P. Standing up from a chair as a dynamic 390
equilibrium task: A comparison between young and elderly subjects. J Gerontol A Biol Sci 391
Med Sci. 2000;55(9):B425-B431. 392
10. Schenkman M, Riley PO, Pieper C. Sit to stand from progressively lower seat heights - 393
alterations in angular velocity. Clin Biomech. 1996;11(3):153-158. 394
11. Doorenbosch CAM, Harlaar J, Roebroeck ME, Lankhorst GJ. Two strategies of transferring 395
from sit-to-stand: The activation of monoarticular and biarticular muscles. J Biomech. 396
1994;27(11):1299-1307. 397
12. Kerr KM, White JA, Barr DA, Mollan RAB. Analysis of the sit-to-stand movement cycle in 398
normal subjects. Clin Biomech. 1997;12(4):236-245. 399
13. Lundin TM, Grabiner MD, Jahnigen DW. On the assumption of bilateral lower extremity 400
joint moment symmetry during the sit-to-stand task (technical note). J Biomech. 1995;28(1): 401
109-112. 402
14. Schofield JS, Parent EC, Lewicke J, Carey JP, El-Rich M, Adeeb S. Characterizing 403
asymmetry across the whole sit-to-stand movement in healthy participants. J Biomech. 404
2013;46(15):2730-2735. 405
15. Brunt D, Greenberg B, Wankadia S, Trimble MA, Shechtman O. The effect of foot 406
placement on sit to stand in healthy young subjects and patients with hemiplegia. Arch Phys 407
Med Rehabil. 2002;83(7):924-929. 408
16. Su FC, Lai KA, Hong WH. Rising from chair after total knee arthroplasty. Clin Biomech. 409
1998;13(3):176-181. 410
17. Kawagoe S, Tajima N, Chosa E. Biomechanical analysis of effects of foot placement with 411
varying chair height on the motion of standing up. J Orthop Sci. 2000;5(2):124-133. 412
18. Cameron DM, Bohannon RW, Garrett GE, Owen SV, Cameron DA. Physical impairments 413
related to kinetic energy during sit-to-stand and curb-climbing following stroke. Clin 414
Biomech. 2003;18(4):332-340. 415

19
19. Kerr A, Rafferty D, Kerr KM, Durward B. Timing phases of the sit-to-walk movement: 416
Validity of a clinical test. Gait Posture. 2007;26(1):11-16. 417
20. Mizner RL, Snyder-Mackler L. Altered loading during walking and sit-to-stand is affected by 418
quadriceps weakness after total knee arthroplasty. J Orthop Res. 2005;23(5):1083-1090. 419
21. Shepherd RB, Gentile AM. Sit-to-stand: Functional relationship between upper body and 420
lower limb segments. Hum Mov Sci. 1994;13(6):817-840. 421
22. Schenkman M, Hughes M, Samsa G, Studenski S. The relative importance of strength and 422
balance in chair rise by functionally impaired older individuals. J Am Geriatr Soc. 423
1996;44(12):1441-1446. 424
23. Pai Y-C, Rogers MW. Control of body mass transfer as a function of speed of ascent in sit-425
to-stand. Med Sci Sports Exerc. 1990;22(3):378-384. 426
24. van der Linden ML, Rowe PJ, Myles CM, Burnett R, Nutton RW. Knee kinematics in 427
functional activities seven years after total knee arthroplasty. Clin Biomech. 2007;22(5):537-428
542. 429
25. Lundin TM, Jahnigen DW, Grabiner MD. Maximum trunk flexion angle during the sit to 430
stand is not determined by knee or trunk-hip extension strength in healthy older adults. J 431
Appl Biomech. 1999;15(3): 233-241. 432
26. Alexander NB, Schultz AB, Warwick DN. Rising from a chair: Effects of age and functional 433
ability on performance biomechanics. J of Gerontol: Med Sci. 1991;46(3):M91-98. 434
27. Burnett DR, Campbell-Kyureghyan NH, Cerrito PB, Quesada PM. Symmetry of ground 435
reaction forces and muscle activity in asymptomatic subjects during walking, sit-to-stand, 436
and stand-to-sit tasks. J Electromyogr Kinesiol. 2011;21(4):610-615. 437
28. Moxley Scarborough D, Krebs DE, Harris BA. Quadriceps muscle strength and dynamic 438
stability in elderly persons. Gait Posture. 1999;10(1):10-20. 439
29. Papa E, Cappozzo A. Sit-to-stand motor strategies investigated in able-bodied young and 440
elderly subjects. J Biomech. 2000;33(9):1113-1122. 441
30. Millington PJ, Myklebust BM, Shambes GM. Biomechanical analysis of the sit-to-stand 442
motion in elderly persons. Arch Phys Med Rehabil. 1992;73(3):609-617. 443
31. Alexander NB, Schultz AB, Ashton-Miller JA, Gross MM, Giordani B. Muscle strength and 444
rising from a chair in older adults. Muscle Nerve. 1997;20(S5):56-59. 445
32. Cohen J. Statistical Power Analysis for the Behavioral Sciences. 2nd ed. Hillsdale, NJ: 446
Lawrence Erlbaum Associates, 1988. 447
33. McGibbon CA, Goldvasser D, Krebs DE, Moxley Scarborough D. Instant of chair-rise lift-448
off can be predicted by foot-floor reaction forces. Hum Mov Sci. 2004;23(2):121-132. 449
450

20
Table 1: Variation in Published Movement Indicators for Sit-to-Stand 451 452
Initiation Seat-Off Termination or
Vertical Posture
Vertical GRF 4,6,21 Vertical GRF 10 COM Position 10,18,22
COM Velocity 23 Seated GRF 13,23 COM Velocity 23
Trunk Angle 18 Max Horizontal GRF 8,11 Hip Angular Velocity 20
Trunk Angular Velocity 8,9 Seat Switch 4,6,21 Trunk Angular Velocity 8,9
Hip Flexion 14,17,20 Hip Vertical Position 9,22,24 Hip Vertical Position 24
Head Movement 24 Hip Horizontal Velocity 21
Forward Lean 11,12 Backward Lean 12
Body Movement 5 Pelvic Position 5
GRF (Ground Reaction Force); COM (Center of Mass) 453

Table 2: STS Timing Indicators. Indicator time points are referenced to when vertical seated reaction force drops to zero (seat-off, 454
shaded in grey). Time results are presented as mean (SD) for Foot-Back, Foot-Neutral, and Staggered (combined) placements. 455
STS Timing Indicators Foot-Back Neutral Staggered STS Timing Indicators Foot-Back Neutral Staggered
Hip Angular Velocity Start -0.68 (0.33) -0.57 (0.15) -0.64 (0.24) Vertical GRF Maximum 0.02 (0.03) 0.03 (0.05) 0.02 (0.03)
Trunk Angular Velocity Start -0.65 (0.22) -0.63 (0.21) -0.67 (0.23) Hip Horizontal Velocity Maximum 0.20 (0.31) 0.14 (0.20) 0.15 (0.35)
Hip Horizontal Velocity Start -0.61 (0.36) -0.51 (0.33) -0.66 (0.44) Hip Vertical Velocity Maximum 0.22 (0.23) 0.20 (0.13) 0.25 (0.33)
Shoulder Horizontal Velocity Start -0.58 (0.47) -0.58 (0.09) -0.60 (0.16) Shoulder Vertical Velocity
Maximum 0.22 (0.08) 0.25 (0.09) 0.23 (0.09)
Hip Vertical Velocity Start -0.58 (0.47) -0.54 (0.35) -0.57 (0.46) Hip Angular Velocity Minimum 0.35 (0.21) 0.34 (0.11) 0.36 (0.33)
AP COP Start -0.52 (0.20) -0.57 (0.16) -0.52 (0.14) Trunk Angular Velocity Maximum 0.37 (0.24) 0.36 (0.11) 0.40 (0.33)
Trunk Lean Angle Start -0.52 (0.17) -0.50 (0.13) -0.51 (0.15) Shoulder Vertical Position End 0.51 (0.13) 0.54 (0.13) 0.52 (0.14)
Vertical Seated Force Start -0.49 (0.12) -0.49 (0.10) -0.47 (0.10) Vertical GRF End 0.66 (0.12) 0.68 (0.12) 0.66 (0.12)
Shoulder Horizontal Position Start -0.45 (0.11) -0.44 (0.07) -0.44 (0.09) Shoulder Vertical Velocity End 0.68 (0.14) 0.73 (0.18) 0.74 (0.31)
Vertical GRF Start -0.45 (0.11) -0.45 (0.11) -0.43 (0.10) Hip Vertical Position End 0.73 (0.60) 0.67 (0.53) 0.66 (0.54)
AP GRF Start -0.40 (0.18) -0.42 (0.12) -0.41 (0.14) AP COP Minimum 0.81 (1.47) 0.34 (0.98) 0.64 (1.34)
Hip Flexion Angle Start -0.38 (0.10) -0.38 (0.08) -0.38 (0.10) Shoulder Horizontal Velocity End 0.94 (0.34) 0.92 (0.49) 0.99 (0.55)
Shoulder Vertical Velocity Start -0.27 (0.09) -0.29 (0.09) -0.29 (0.10) Hip Flexion Angle End 0.95 (0.51) 0.85 (0.32) 0.86 (0.37)
Trunk Angular Velocity Minimum -0.19 (0.24) -0.22 (0.03) -0.18 (0.34) Shoulder Horizontal Position End 1.08 (0.46) 1.05 (1.03) 1.20 (0.72)
Shoulder Horizontal Velocity
Maximum -0.18 (0.03) -0.17 (0.03) -0.17 (0.03) Trunk Lean Angle End 1.15 (0.60) 1.19 (0.63) 1.11 (0.48)
Trunk Lean Angle Maximum -0.17 (1.60) -0.29 (1.63) -0.00 (1.69) Hip Vertical Velocity End 1.15 (1.23) 1.42 (1.55) 1.29 (1.30)
Hip Vertical Position Start -0.17 (0.18) -0.15 (0.18) -0.13 (0.13) Trunk Angular Velocity End 1.16 (0.62) 1.17 (0.79) 1.12 (0.73)
Hip Horizontal Position Start -0.17 (0.15) -0.13 (0.07) -0.13 (0.11) Hip Horizontal Position End 1.24 (0.66) 1.18 (0.55) 1.25 (0.59)
Hip Angular Velocity Maximum -0.16 (0.44) -0.19 (0.45) -0.23 (0.34) Shoulder Vertical Position
Maximum 1.31 (0.75) 1.24 (0.83) 1.34 (1.03)
Hip Flexion Angle Maximum -0.11 (0.05) -0.09 (0.03) -0.10 (0.05) AP GRF End 1.36 (0.51) 1.55 (0.65) 1.55 (0.82)
Shoulder Vertical Position Start -0.04 (0.08) -0.08 (0.10) -0.05 (0.10) Shoulder Horizontal Position
Maximum 1.39 (1.60) 1.17 (0.69) 1.15 (1.57)
AP GRF Maximum -0.04 (0.05) -0.02 (0.04) -0.03 (0.04) Hip Angular Velocity End 1.44 (1.07) 1.47 (1.11) 1.39 (1.09)
Vertical Seated Force Zero 0.00 0.00 0.00 Hip Horizontal Velocity End 2.56 (1.45) 2.53 (1.56) 2.42 (1.48)
AP COP End 5.04 (1.10) 5.28 (1.32) 5.39 (1.30)
AP (Anterior-Posterior); COP (Center of Pressure); GRF (Ground Reaction Force)456
2
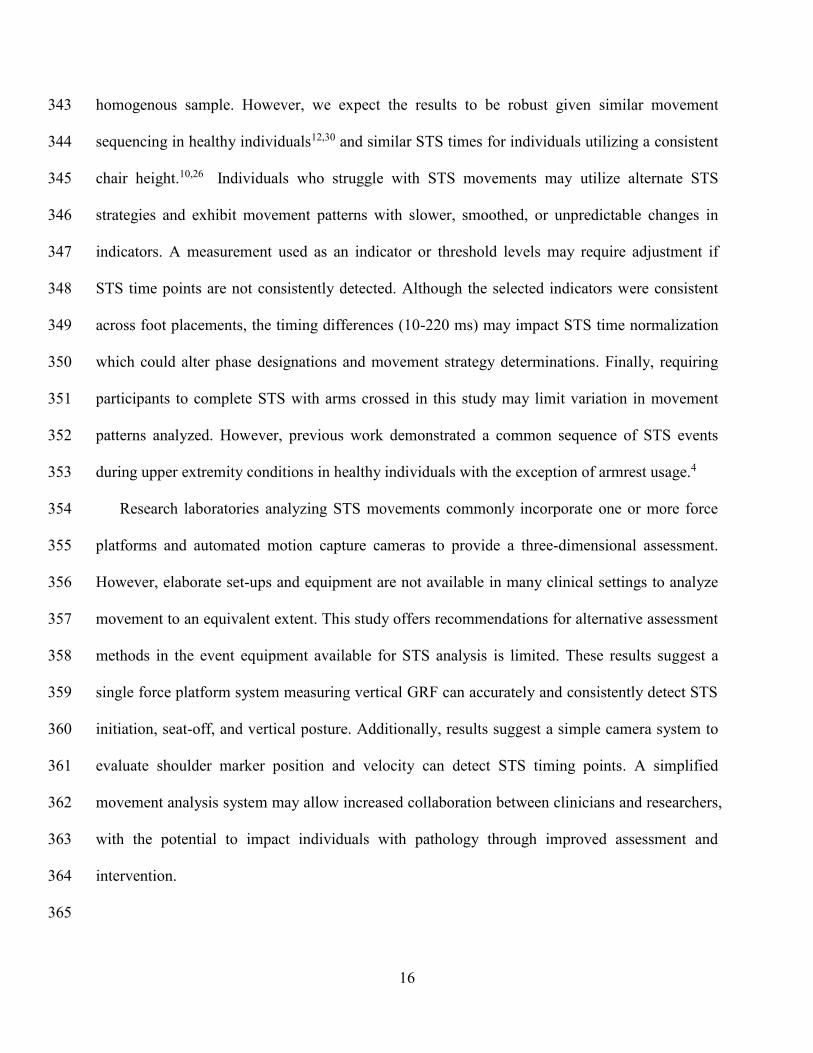
Table 3: Kinetic STS Initiation Indicators. Indicator timing differences referenced to the vertical seated reaction force start point 457
(shaded in grey). Statistical similarity was defined as P > 0.05. Positive correlations of moderate strength were defined as r > 0.30. 458
459
Foot-Back Placement Foot-Neutral Placement Staggered Foot Placements
STS Initiation
Indicators
Timing
(s)
P-Value Correlation Timing
(s)
P-Value Correlation Timing
(s)
P-Value Correlation
Vert Seated Force
Start 0.00
0.00 0.00
Vert GRF Start 0.04 1.000 0.931 0.04 1.000 0.814 0.04 1.000 0.745
AP GRF Start 0.09 1.000 0.380 0.07 1.000 0.085 0.06 1.000 0.075
AP COP did not have a correlation >0.3 with seated reaction forces. 460

3
Table 4: Kinematic STS Initiation Indicators. Indicator timing differences referenced to the vertical GRF and AP GRF start points 461
(shaded in grey). Statistical similarity was defined as P > 0.05. Positive correlations of moderate strength were defined as r > 0.30. 462
463
Foot-Back Placement Foot-Neutral Placement Staggered Foot Placements
STS Initiation
Indicators
Timing
(s)
P-Value Correlation Timing
(s)
P-Value Correlation Timing
(s)
P-Value Correlation
Shoulder Horiz
Velocity Start -0.13 1.000 0.466 -0.13 1.000 0.235 -0.17 1.000 0.377
Trunk Lean Angle
Start -0.07 1.000 0.344 -0.05 1.000 0.021 -0.07 1.000 0.250
Shoulder Horiz
Position Start 0.00 1.000 0.496 -0.00 1.000 0.251 -0.01 1.000 0.306
Vert GRF Start 0.00 0.00 0.00
Hip Flexion Angle
Start 0.07 1.000 0.463 0.06 1.000 0.093 0.05 1.000 0.256
Hip Horiz Position
Start 0.28 0.999 0.322 0.31 1.000 0.123 0.30 1.000 0.074
STS Initiation
Indicators
Timing
(s)
P-Value Correlation Timing
(s)
P-Value Correlation Timing
(s)
P-Value Correlation
Shoulder Horiz
Velocity Start -0.18 1.000 0.462 -0.16 1.000 0.240 -0.19 1.000 0.332
Shoulder Horiz
Position Start -0.05 1.000 0.485 -0.02 1.000 0.230 -0.04 1.000 0.316
AP GRF Start 0.00 0.00 0.00
Hip Flexion Angle
Start 0.02 1.000 0.357 0.04 1.000 0.153 0.03 1.000 0.267
Note: The AP COP start point did not have a correlation above 0.3 with the vertical seated reaction force start point or any other 464
kinematic STS indicator465

4
Table 5: Kinematic STS Seat-Off Indicators. Indicator timing differences referenced to the AP GRF and vertical GRF maximum 466
value points (shaded in grey). Statistical similarity was defined as P > 0.05. Positive correlations of moderate strength were defined 467
as r > 0.30. 468
469
Foot-Back Placement Foot-Neutral Placement Staggered Foot Placements
STS Seat-Off
Indicators
Timing
(s)
P-Value Correlation Timing
(s)
P-Value Correlation Timing
(s)
P-Value Correlation
Hip Flexion Angle
Max -0.13 1.000 0.337 -0.12 1.000 0.449 -0.13 1.000 0.259
Vert GRF Max 0.00 0.00 0.00
Shoulder Vert
Velocity Max 0.20 1.000 0.697 0.22 1.000 0.790 0.21 1.000 0.579
Shoulder Vert
Position End 0.48 0.346 0.560 0.51 0.443 0.607 0.49 0.008 0.452
STS Seat-Off
Indicators
Timing
(s)
P-Value Correlation Timing
(s)
P-Value Correlation Timing
(s)
P-Value Correlation
Shoulder Horiz
Velocity Start -0.55 0.108 0.305 -0.56 0.102 0.371 -0.57 0.001 0.291
Shoulder Horiz
Velocity Max -0.14 1.000 0.389 -0.16 1.000 0.122 -0.14 1.000 0.259
Hip Flexion Angle
Max -0.07 1.000 0.400 -0.07 1.000 0.075 -0.07 1.000 0.329
AP GRF Max 0.00 0.00 0.00
470

5
Table 6: Kinematic STS Vertical Posture Indicators. Indicator timing differences referenced to the vertical GRF end point (shaded 471
in grey). Statistical similarity was defined as P > 0.05. Positive correlations of moderate strength were defined as r > 0.30. 472
473
Foot-Back Placement Foot-Neutral Placement Staggered Foot Placements
STS Vertical
Indicators
Timing
(s)
P-Value Correlation Timing
(s)
P-Value Correlation Timing
(s)
P-Value Correlation
Shoulder Vert
Velocity Max -0.43 0.643 0.670 -0.44 1.000 0.810 -0.43 0.105 0.746
Shoulder Vert
Position End -0.15 1.000 0.721 -0.14 1.000 0.720 -0.14 1.000 0.708
Vert GRF End 0.00 0.00 0.00
Shoulder Vert
Velocity End 0.03 1.000 0.559 0.05 1.000 0.463 0.08 1.000 0.292
Note: The AP COP minimum value point did not have a correlation above 0.3 with any kinematic STS indicator. 474
475

6
Table 7: Kinematic STS Termination Indicators. Indicator timing differences referenced to the AP GRF end point (shaded in grey). 476
Statistical similarity was defined as P > 0.05. Positive correlations of moderate strength were defined as r > 0.30. 477
478
Foot-Back Placement Foot-Neutral Placement Staggered Foot Placements
STS
Termination
Indicators
Timing
(s)
P-Value Correlation Timing
(s)
P-Value Correlation Timing
(s)
P-Value Correlation
Shoulder Horiz
Velocity End -0.42 0.694 0.312 -0.62 0.018 0.026 -0.56 0.001 0.437
Hip Flexion Angle
End -0.41 0.746 0.385 -0.70 0.002 0.201 -0.70 0.001 0.121
Trunk Lean Angle
End -0.22 1.000 0.300 -0.36 1.000 0.070 -0.44 0.065 0.073
Trunk Angular
Velocity End -0.20 1.000 0.307 -0.38 1.000 0.141 -0.44 0.075 0.137
AP GRF End 0.00 0.00 0.00
Note: The AP COP end point did not have a correlation above 0.3 with any kinematic STS indicator479

480
![Dyrobes Rotordynamics Software ://dyrobes.com/wp-content/uploads/2016/12/...nonlinearities associated with structural kinematic and kinetic effects [4], 3) easily accommodates various](https://img.dokumen.tips/doc/110x75/5fdda5998da647596b12bff2/dyrobes-rotordynamics-software-nonlinearities-associated-with-structural.jpg)