Embed Size (px)
Citation preview
confidential
KiNativ® In situ kinase profiling
Stanford University ChEM-H
@KiNativPlatform

Principle of the KiNativ platform
2
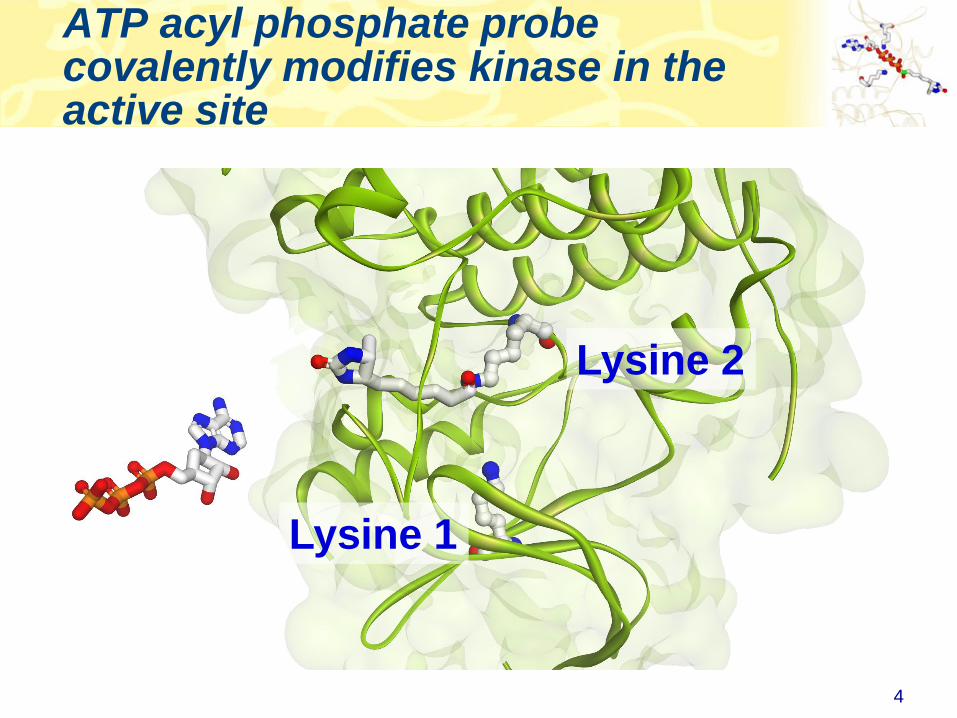
• ATP (or ADP) acyl phosphate binds to, and covalently modifies
Lysine residues in the active site
• Thus, ATP acyl phosphate with a desthiobiotin tag can be used
capture and quantitate kinases in a complex lysate
Desthiobiotin tag ATP
Acyl phosphate
ATP acyl phosphate probe covalently modifies kinase in the active site
3
Lysine 2
Lysine 1
ATP acyl phosphate probe covalently modifies kinase in the active site
4
Lysine 2
Lysine 1
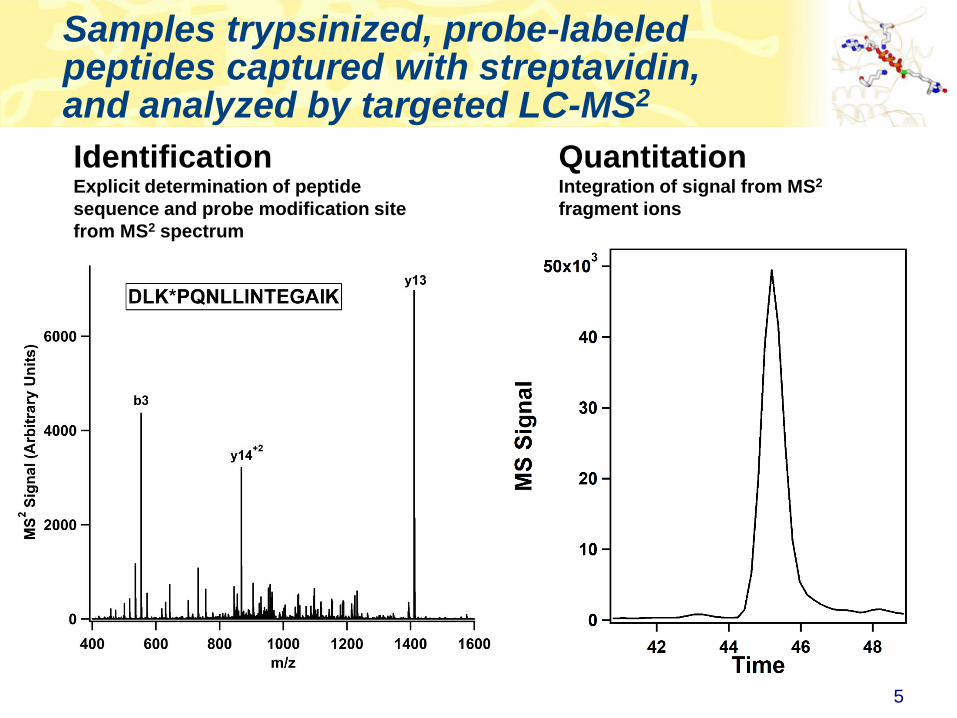
Samples trypsinized, probe-labeled peptides captured with streptavidin, and analyzed by targeted LC-MS2
5
QuantitationIntegration of signal from MS2
fragment ions
IdentificationExplicit determination of peptide
sequence and probe modification site
from MS2 spectrum

Comprehensive Coverage of Protein and Lipid Kinases
Protein kinases Atypical kinases
~80% of known protein and atypical kinases identified on the platform
http://www.kinativ.com/coverage/protein-lipid.html 6
Green: Kinases detected on KiNativ
Red: Kinases not detected on KiNativ

Profiling compound(s) on the KiNativ platform
7
Control sample – add probe
Treated sample – add inhibitor followed by probe
Inhibited
kinaseGreen: Kinases Blue: Probe
Gray: Non-kinases Red: Inhibitor
Sample: Lysate
derived from any
cell line or tissue
from ANY species

Profiling compound(s) on the KiNativ platform
8
Control sample – add probe
Treated sample – add inhibitor followed by probe
Sample: Lysate
derived from any
cell line or tissue
from ANY species
Inhibited
kinase
MS
sig
na
lM
S s
ign
al
Time
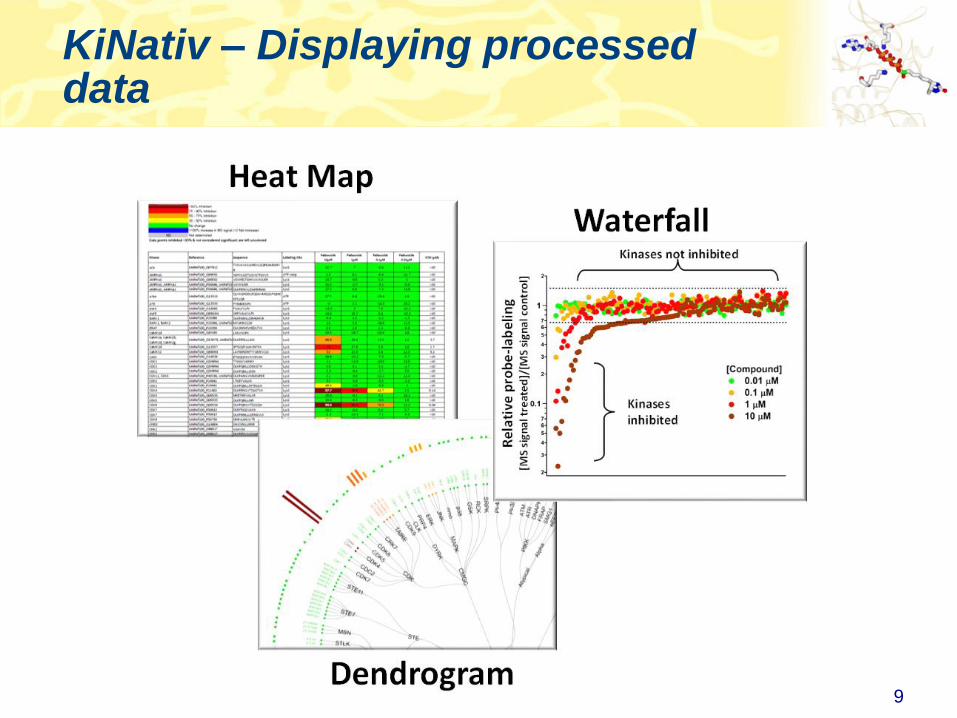
KiNativ – Displaying processed data
9
KiNativ profiling formats
• Lysate
• Compound(s) added to lysate prepared from relevant cell line/tissue
followed by probe
• Efficient approach to determine on-target potency and selectivity
• Live cell
• Compound(s) added to cells for a period of time, after which cells
are harvested, washed, lysed and probe-labeled
• Confirm cell permeability and compound MOA, i.e., how well does
on-target potency (KiNativ) compare to EC50 values from a cell-
based assay
• Note: 10X dilution during lysis prior to probe addition, reversible
compounds may re-equilibrate with target(s)
• Live animal
• Animals treated with compound, after which they are sacrificed,
relevant tissues harvested, snap-frozen and sent out for profiling on
KiNativ
• Recommended 100 mg tissue per sample10
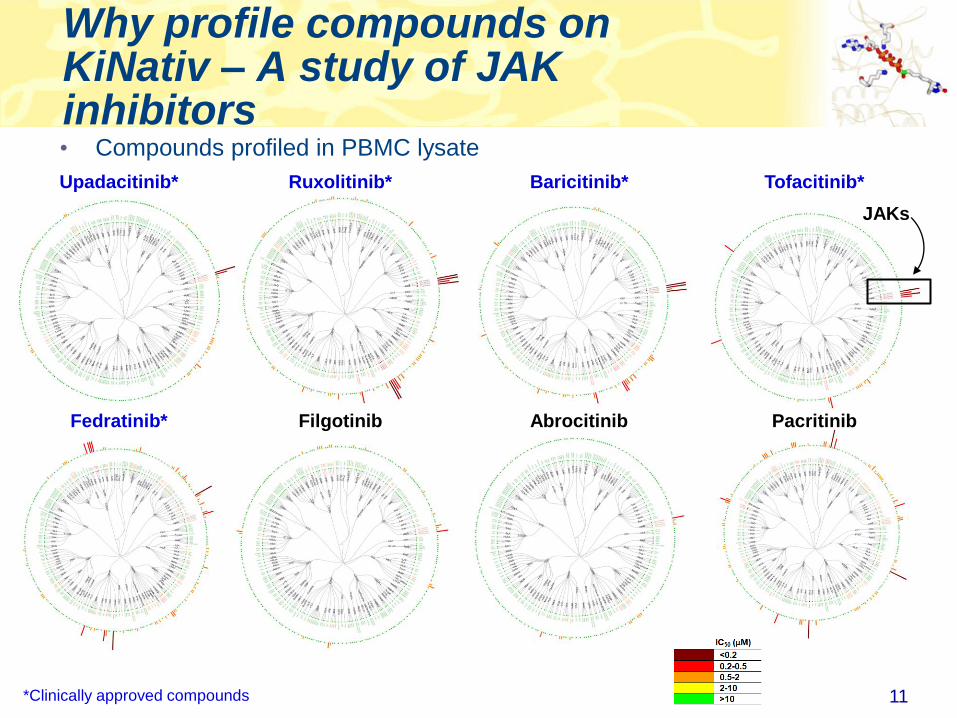
Why profile compounds on KiNativ – A study of JAK inhibitors
11
Upadacitinib* Tofacitinib*Ruxolitinib* Baricitinib*
Fedratinib* PacritinibAbrocitinibFilgotinib
*Clinically approved compounds
• Compounds profiled in PBMC lysate
JAKs
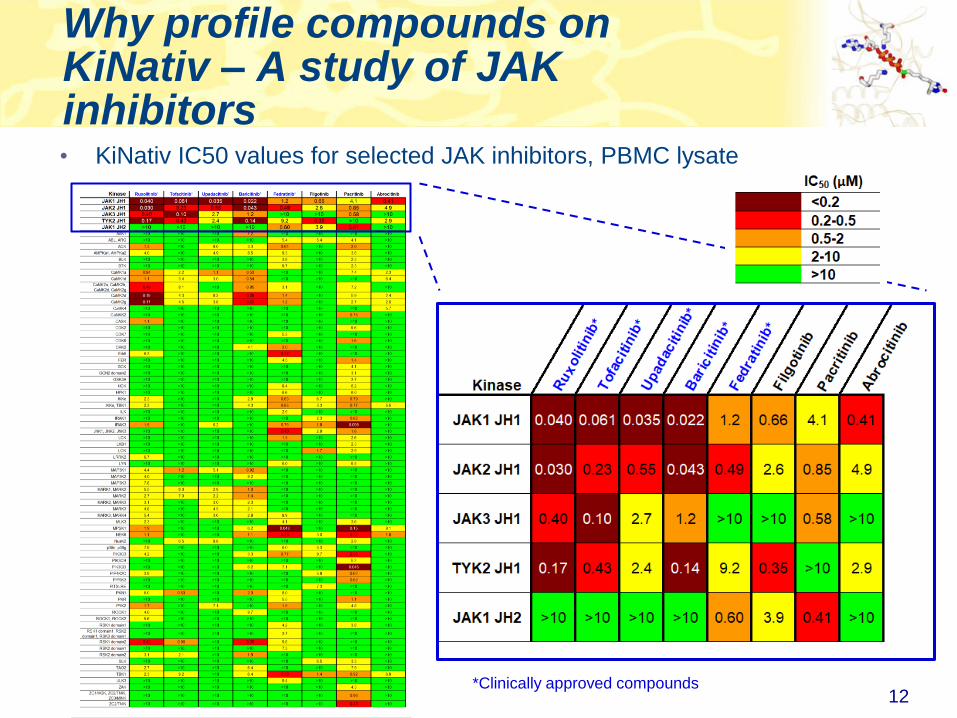
Why profile compounds on KiNativ – A study of JAK inhibitors• KiNativ IC50 values for selected JAK inhibitors, PBMC lysate
12*Clinically approved compounds

Comparing JAK1/TYK2 pIC50 to cell-based pEC50
13
Ruxolitinib
Tofacitinib
Baricitinib
Upadacitinib
Abrocitinib
Filgotinib
Pacritinib
Fedratinib
Ruxolitinib
Baricitinib
Upadacitinib
Tofacitinib
Abrocitinib
Filgotinib
Fedratinib
Pacritinib
IC50 and EC50 values within 3-fold
KiNativ Recombinant
Cell-based assay: Monitor inhibition of INFα dependent pSTAT1 in Jurkat cells
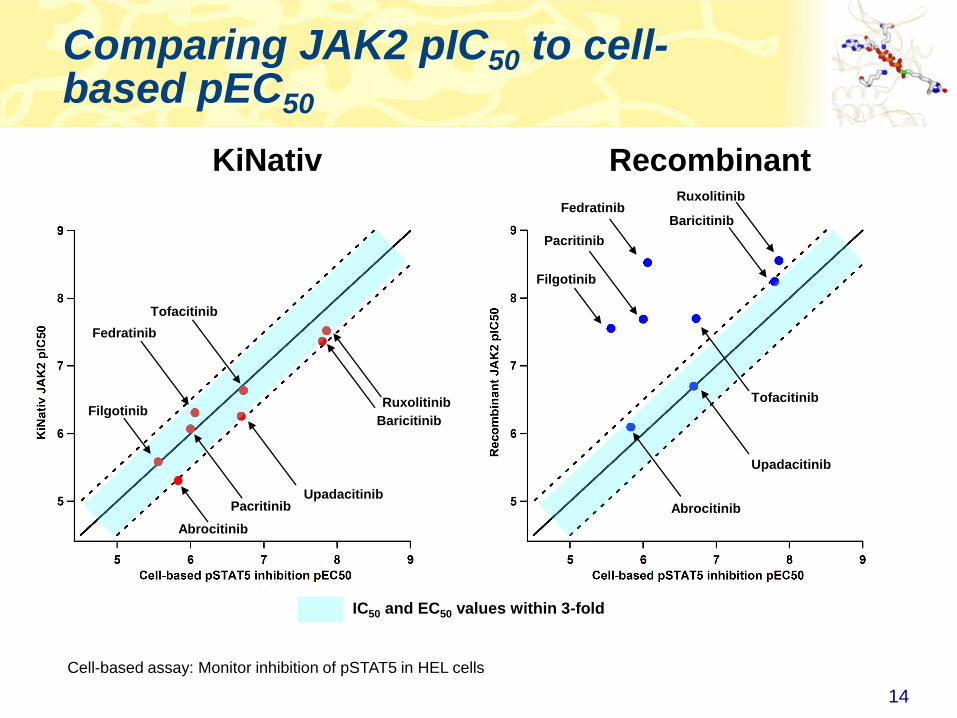
Comparing JAK2 pIC50 to cell-based pEC50
14
Baricitinib
Ruxolitinib
Baricitinib
Tofacitinib
Upadacitinib
Fedratinib
Pacritinib
Filgotinib
Abrocitinib
Ruxolitinib
Baricitinib
Tofacitinib
Upadacitinib
Fedratinib
Abrocitinib
Pacritinib
Filgotinib
IC50 and EC50 values within 3-fold
KiNativ Recombinant
Cell-based assay: Monitor inhibition of pSTAT5 in HEL cells
Quantifying the selectivity of kinase inhibitors
• One of the main reasons for profiling inhibitors against a panel of
kinases is to assess selectivity
• Assessing selectivity can be arbitrary!
Method to quantify selectivity – Selectivity score (S)
• Based on the method described by Piotr Grazcyk “Gini
Coefficient: A New Way To Express Selectivity of Kinase
Inhibitors against a Family of Kinases”
doi.org/10.1021/jm070562u
• Profile compound at 2-4 doses, estimate IC50s
• Convert IC50s to pIC50s and normalize to target pIC50, i.e., on-
target normalized pIC50 = 1
• Plot the normalized IC50s against the targets and determine
area under the curve
• Reciprocal of the area under the curve = Selectivity score (S)
(higher the score, more selective the compound)15

Quantifying Selectivity – JAK inhibitors
16Kinases
Upadacitinib* S = 9.2
Tofacitinib* S = 7.9
Baricitinib* S = 7.8
Ruxolitinib* S = 7.0
Abrocitinib# S = 6.0
Filgotinib^ S = 5.8
Fedratinib* S = 3.7
Pacritinib^ S = 3.0
* Clinically approved compounds# Undergoing clinical trials
^ Failed clinical trials
The steeper the slope,
the fewer off-targets
were observed
More potent
on-target
activity
Off-targets
more potently
inhibited than
on-target
• Approved JAK inhibitors had good selectivity scores
• Fedratinib, an approved JAK2 inhibitor for
myeloproliferative diseases had a surprisingly low
selectivity score
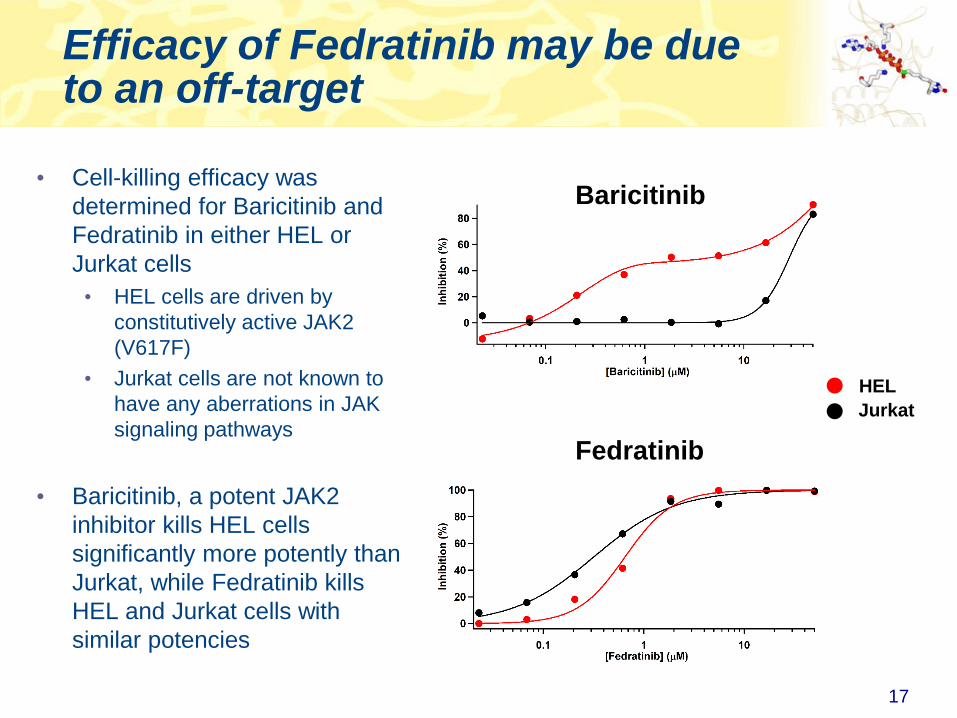
Efficacy of Fedratinib may be due to an off-target
17
HEL
Jurkat
• Cell-killing efficacy was
determined for Baricitinib and
Fedratinib in either HEL or
Jurkat cells
• HEL cells are driven by
constitutively active JAK2
(V617F)
• Jurkat cells are not known to
have any aberrations in JAK
signaling pathways
• Baricitinib, a potent JAK2
inhibitor kills HEL cells
significantly more potently than
Jurkat, while Fedratinib kills
HEL and Jurkat cells with
similar potencies
Baricitinib
Fedratinib

Profiling the covalent BTK inhibitor Ibrutinib
• Ramos cells were treated with Ibrutinib (10 and 1 µM, and no-inhibitor
control) for one hour
• Cells were then washed, harvested and lysed
• Lysate was divided into two parts and either probe-labeled as is, or gel-
filtered and then probe-labeled
18

Profiling Ibrutinib in Ramos cells
19
• Ibrutinib modifies BTK on Cys-481 (highlighted)
• For all kinases that appear to be covalently modified by Ibrutinib, there is a
Cys residue either precisely aligned with BTK Cys-481, or in close proximity

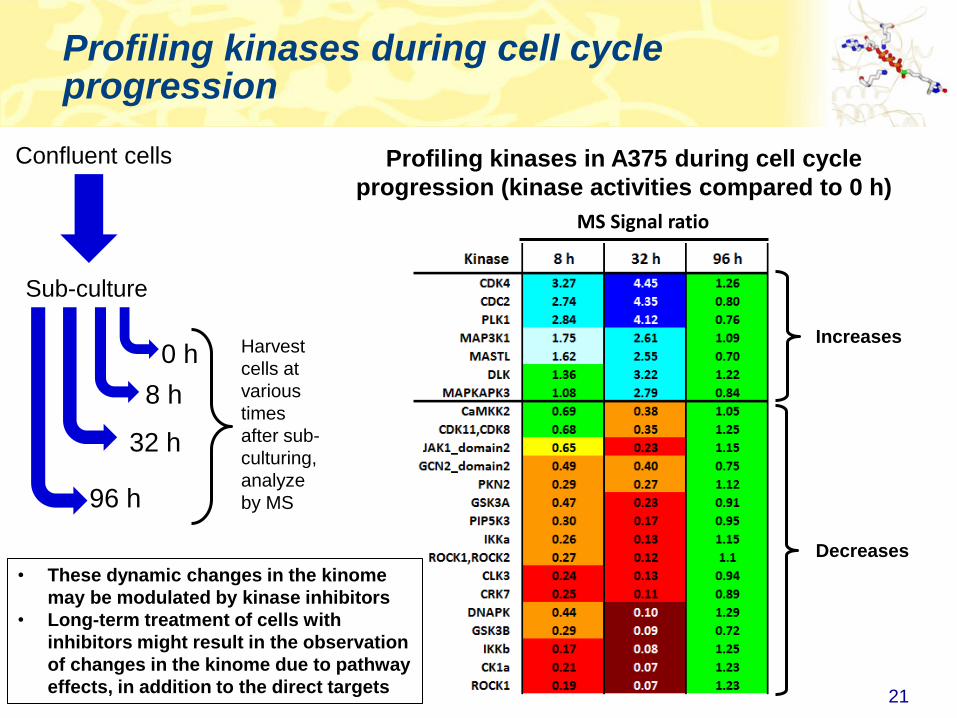
Profiling kinases during cell cycle progression
Confluent cells
Sub-culture
0 h
8 h
32 h
96 h
Harvest
cells at
various
times
after sub-
culturing,
analyze
by MS
Profiling kinases in A375 during cell cycle
progression (kinase activities compared to 0 h)
20
0.67X
1.5XR
ela
tive
kin
as
e a
cti
vit
y
Kinases
Profiling kinases during cell cycle progression
21
Increases
Decreases
Profiling kinases in A375 during cell cycle
progression (kinase activities compared to 0 h)
Confluent cells
Sub-culture
0 h
8 h
32 h
96 h
Harvest
cells at
various
times
after sub-
culturing,
analyze
by MS
• These dynamic changes in the kinome
may be modulated by kinase inhibitors
• Long-term treatment of cells with
inhibitors might result in the observation
of changes in the kinome due to pathway
effects, in addition to the direct targets
MS Signal ratio

Profiling the CDK4/CDK6 inhibitor Palbociclib, in Colo-205 cells
22
Palbociclib
• Palbociclib is an FDA approved CDK4/CDK6 inhibitor for the treatment
of ER-positive and HER2-negative breast cancer
• The compound exhibits a wide-range of potencies in cell-killing assays
• The molecular basis determining sensitivity or resistance to the
compound is not fully understood
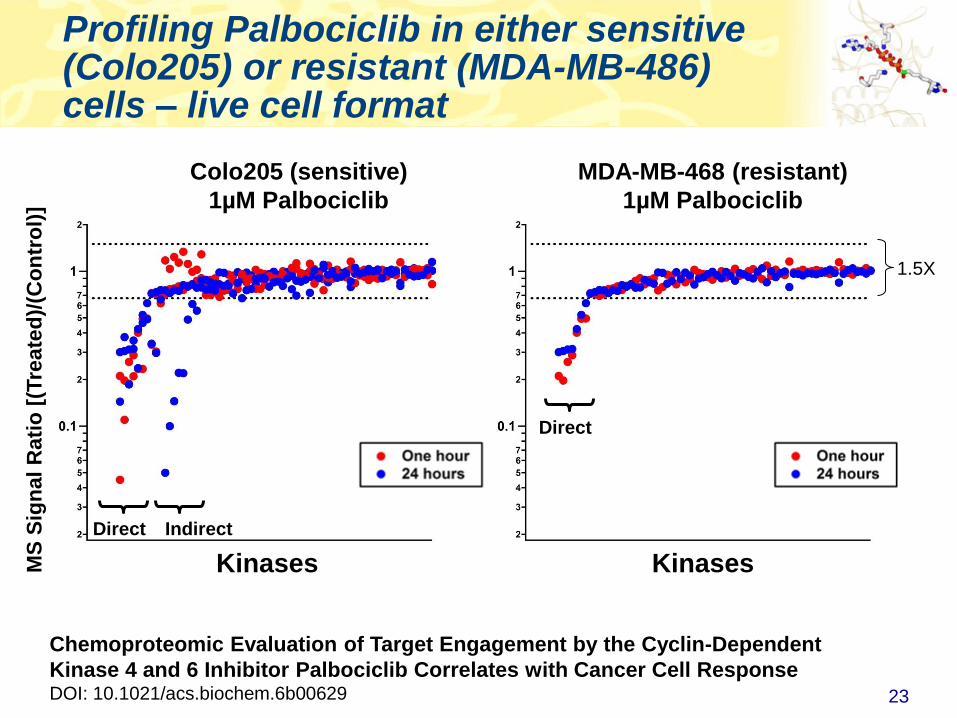
Profiling Palbociclib in either sensitive (Colo205) or resistant (MDA-MB-486) cells – live cell format
23
Colo205 (sensitive)
1µM Palbociclib
MDA-MB-468 (resistant)
1µM Palbociclib
Direct Indirect
Direct
MS
Sig
nal
Rati
o [
(Tre
ate
d)/
(Co
ntr
ol)
]
Kinases
Chemoproteomic Evaluation of Target Engagement by the Cyclin-Dependent
Kinase 4 and 6 Inhibitor Palbociclib Correlates with Cancer Cell ResponseDOI: 10.1021/acs.biochem.6b00629
Kinases
1.5X
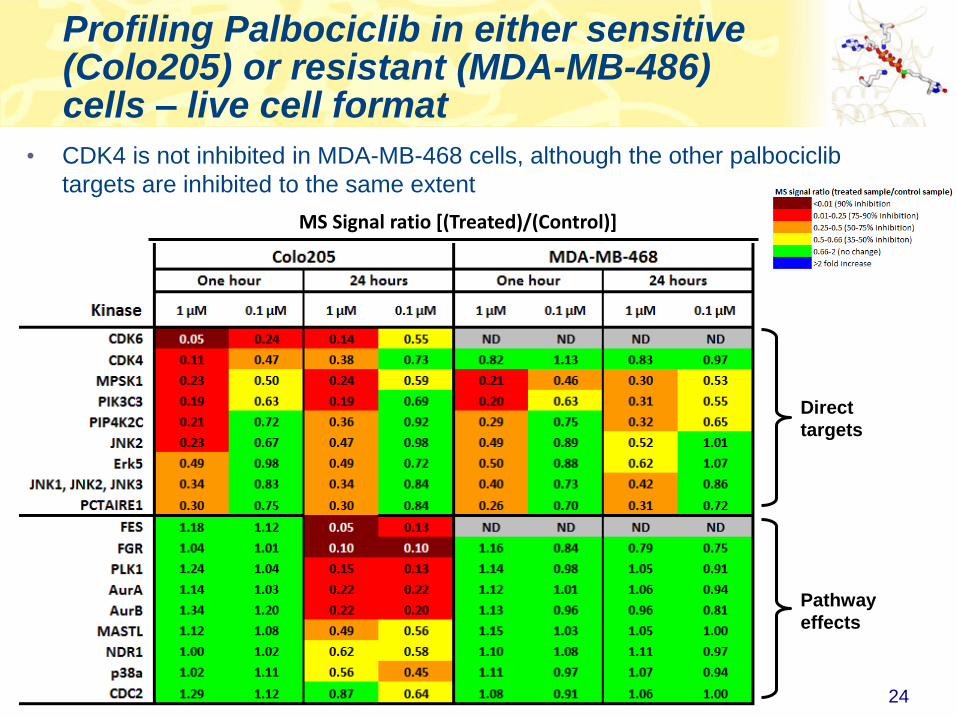
Profiling Palbociclib in either sensitive (Colo205) or resistant (MDA-MB-486) cells – live cell format
24
Direct
targets
• CDK4 is not inhibited in MDA-MB-468 cells, although the other palbociclib
targets are inhibited to the same extent
Pathway
effects
MS Signal ratio [(Treated)/(Control)]

Mechanistic basis for sensitivity/resistance of cells to CDK4/CDK6 inhibitors
• Elevated levels of CDKN2
proteins, but not CDKN1
proteins inhibit both the binding
of ATP probe and inhibitor to
CDK4 and CDK6
• Observation is consistent with
the fact that CDKN2 proteins
bind CDK4 and CDK6, while
CDKN1 proteins bind CDK2
25
Direct CDKN2 Modulation of CDK4 Alters Target Engagement of CDK4 Inhibitor DrugsDOI: 10.1158/1535-7163.MCT-18-0755
MCF7 cells were transfected with either GFP or
various CDKN proteins, lysates were then
generated, probe-labeled and analyzed by KiNativ
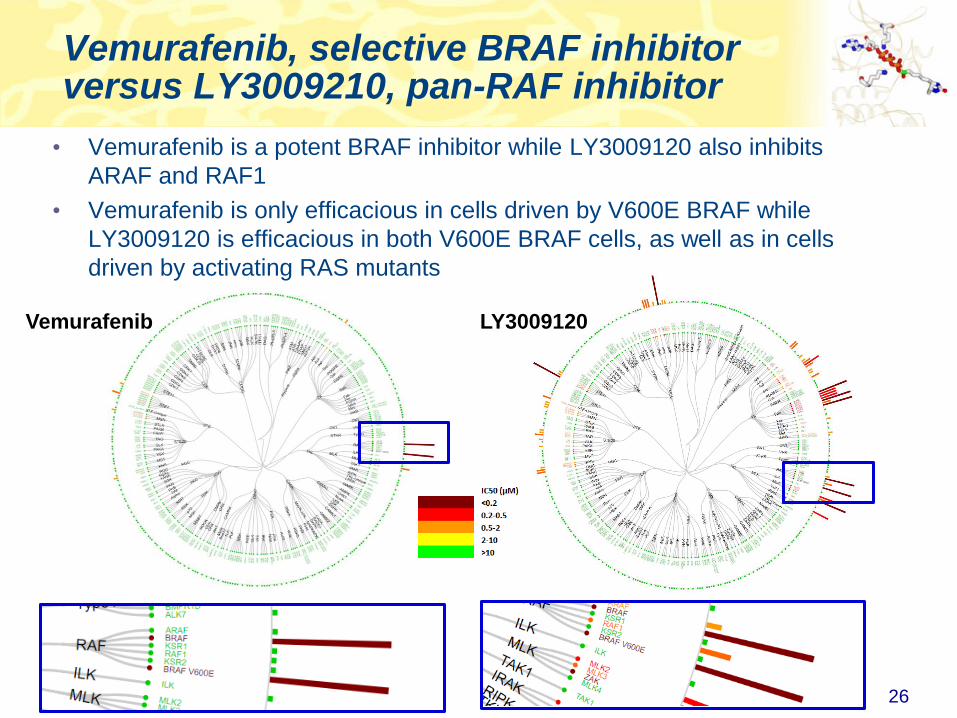
Vemurafenib, selective BRAF inhibitor versus LY3009210, pan-RAF inhibitor
26
• Vemurafenib is a potent BRAF inhibitor while LY3009120 also inhibits
ARAF and RAF1
• Vemurafenib is only efficacious in cells driven by V600E BRAF while
LY3009120 is efficacious in both V600E BRAF cells, as well as in cells
driven by activating RAS mutants
Vemurafenib LY3009120
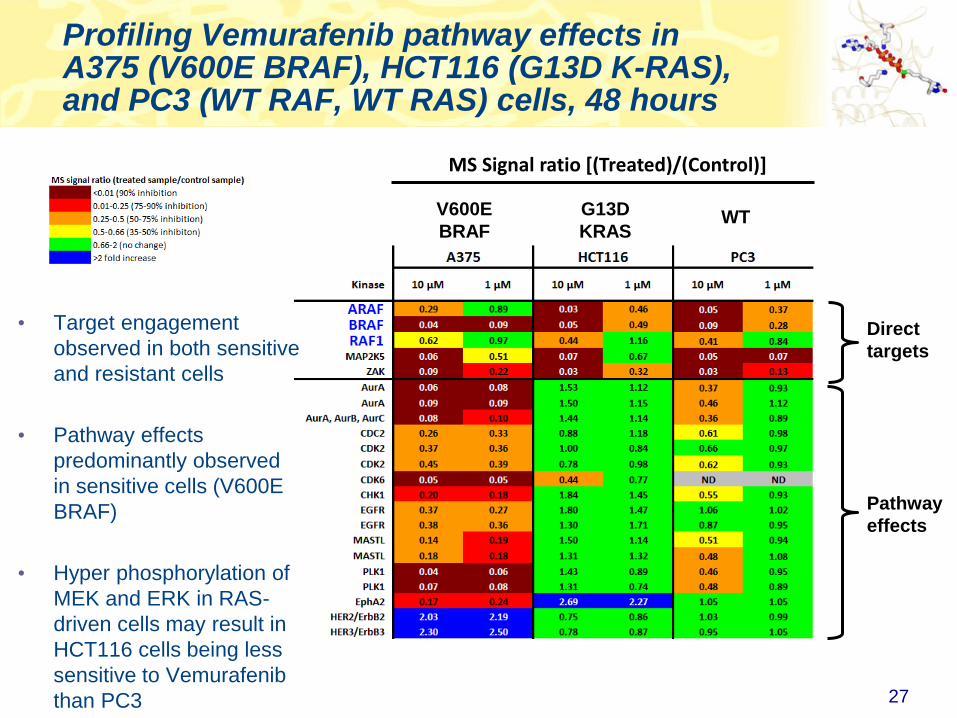
Profiling Vemurafenib pathway effects in A375 (V600E BRAF), HCT116 (G13D K-RAS), and PC3 (WT RAF, WT RAS) cells, 48 hours
27
Direct
targets
Pathway
effects
• Target engagement
observed in both sensitive
and resistant cells
• Pathway effects
predominantly observed
in sensitive cells (V600E
BRAF)
• Hyper phosphorylation of
MEK and ERK in RAS-
driven cells may result in
HCT116 cells being less
sensitive to Vemurafenib
than PC3
V600E
BRAF
G13D
KRASWT
MS Signal ratio [(Treated)/(Control)]
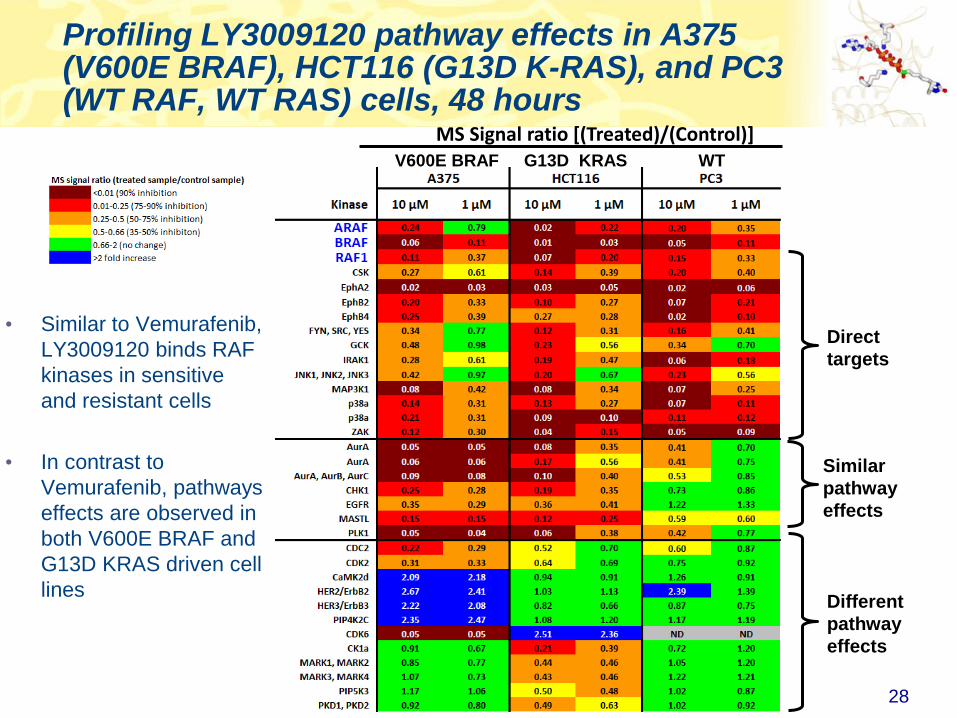
Profiling LY3009120 pathway effects in A375 (V600E BRAF), HCT116 (G13D K-RAS), and PC3 (WT RAF, WT RAS) cells, 48 hours
28
Direct
targets
Similar
pathway
effects
• Similar to Vemurafenib,
LY3009120 binds RAF
kinases in sensitive
and resistant cells
• In contrast to
Vemurafenib, pathways
effects are observed in
both V600E BRAF and
G13D KRAS driven cell
linesDifferent
pathway
effects
V600E BRAF G13D KRAS WT
MS Signal ratio [(Treated)/(Control)]

Profiling the Aurora kinase inhibitor Alisertib – G2/M arrest
• Aurora kinase inhibitors induce G2/M arrest in contrast to CDK and RAF
inhibitors which induce G0/G1 arrest
• PLK1 is downregulated during G0/G1 arrest, but upregulated at G2/M
arrest 29
Direct
targets
Pathway
effects
MS Signal ratio [(Treated)/(Control)]
Kinases
1 hour
24 hours
48 hoursAurora
EphR
PLK1, CDK9,
ROCK, FAM20B
MS
Sig
nal
Rati
o [
(Tre
ate
d)/
(Co
ntr
ol)
]
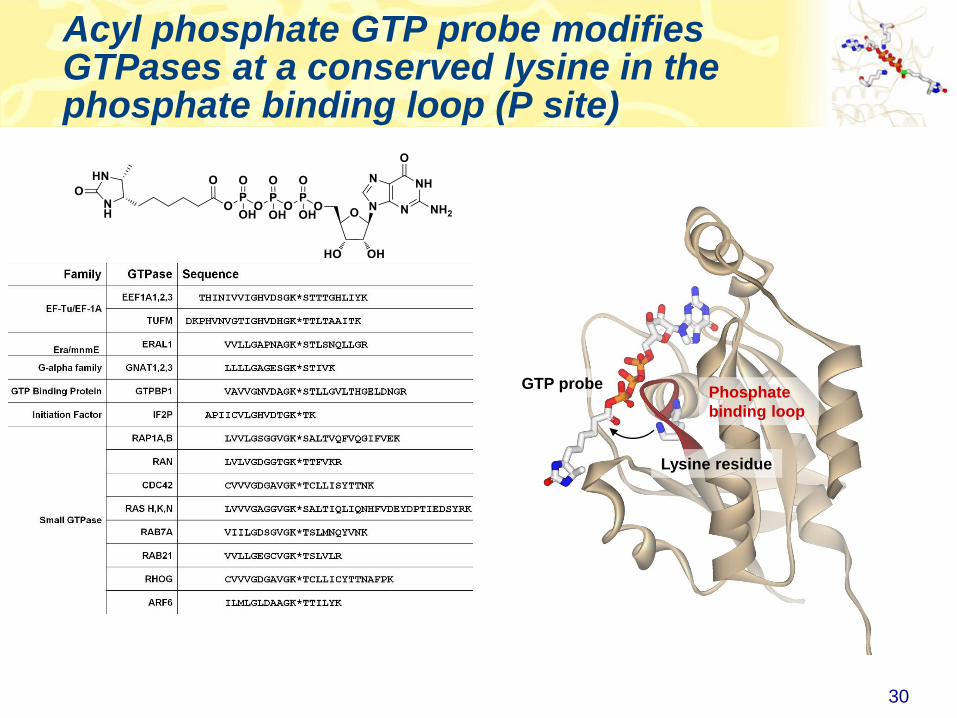
Acyl phosphate GTP probe modifies GTPases at a conserved lysine in the phosphate binding loop (P site)
Lysine residue
GTP probePhosphate
binding loop
30

• H,K,N-RAS probe-labeled peptide contains
codons 12 and 13 which are mutated in a variety
of cancers
• Wild type peptide
6 – LVVVGAGGVGK*SALTIQLIQNHFVDEYDPTIEDSYRK
• Mutant peptides have distinct m/z values and MS2
spectra from the wild-type peptide
• Thus, the GTP probe can be used to detect and
quantitate mutant RAS protein in lysates
Using the GTP probe to profile RAS mutants
31

In each cell line profiled, mutant RAS detected with the probe was consistent with the genetic information
• A375: Wild-type
• A549: G12S K-Ras
• RPMI-8226: G12A K-Ras
• PANC1: G12D K-Ras
• MDA-MB-231: G13D K-Ras
32
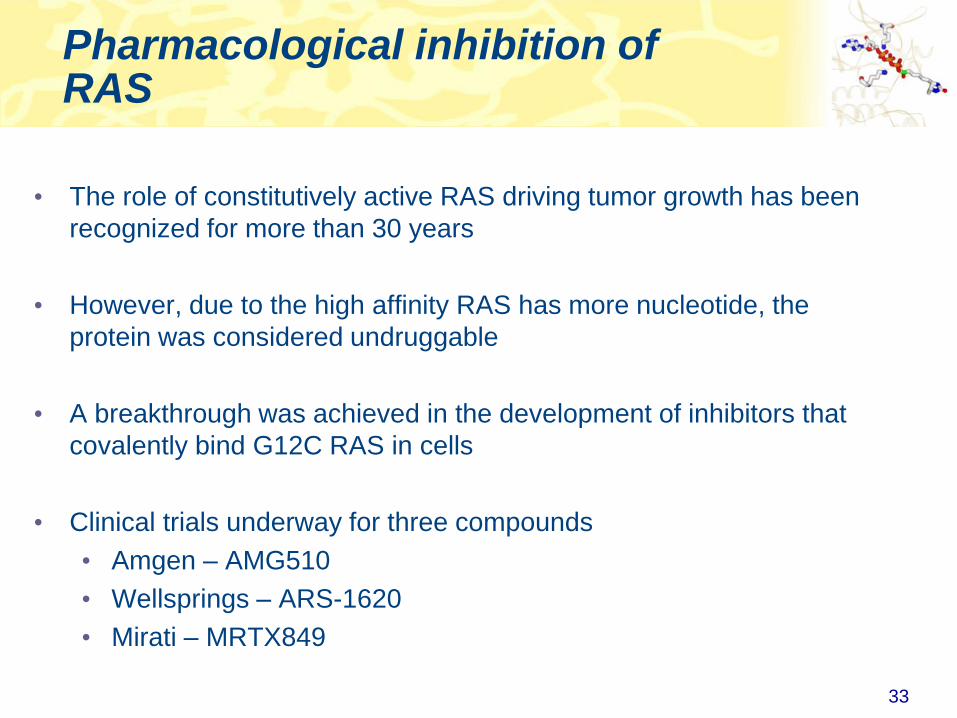
Pharmacological inhibition of RAS
• The role of constitutively active RAS driving tumor growth has been
recognized for more than 30 years
• However, due to the high affinity RAS has more nucleotide, the
protein was considered undruggable
• A breakthrough was achieved in the development of inhibitors that
covalently bind G12C RAS in cells
• Clinical trials underway for three compounds
• Amgen – AMG510
• Wellsprings – ARS-1620
• Mirati – MRTX849
33

Pharmacological inhibition of RAS G12C
34
Time
WT RAS
G12C RAS
Control
AMG510 (10 µM)
• Both AMG510 and ARS-1620 potently inhibit probe-labeling of G12C
RAS (H358 cells harboring G12C KRAS treated with 10 µM compound
for two hours)
• No off-targets observed amongst the GTPases profiled (results shown
for AMG510
GTPase Selectivity
Profile for AMG510
(10 µM)
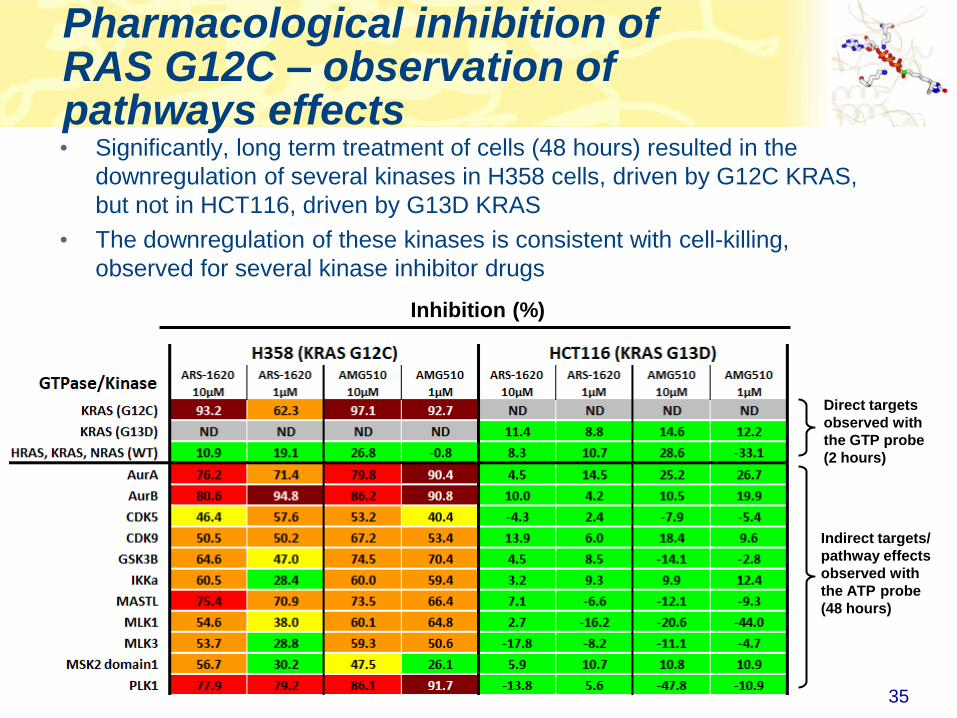
Pharmacological inhibition of RAS G12C – observation of pathways effects
35
Direct targets
observed with
the GTP probe
(2 hours)
• Significantly, long term treatment of cells (48 hours) resulted in the
downregulation of several kinases in H358 cells, driven by G12C KRAS,
but not in HCT116, driven by G13D KRAS
• The downregulation of these kinases is consistent with cell-killing,
observed for several kinase inhibitor drugs
Indirect targets/
pathway effects
observed with
the ATP probe
(48 hours)
Inhibition (%)

Advantages of the KiNativ platform
KiNativ is a universal assay that can be applied to
different stages of drug discovery
• Confirm on-target potency and selectivity (lysate format)
• Determine in-cell target engagement to confirm compound
permeability and MOA (live cell format)
• Long-term cell treatment experiments to examine pathway
effects (live cell format)
• Pre-clinical efficacy and safety studies, same assay applied to
different species (live animal format)
• Profiling tissues from tumor xenografts - measure both target
engagement and detect pathway effects (live animal format)
• Confirm target engagement in human clinical samples
36@KiNativPlatform


![Kinases in Protein Kinase Enzymes · 2015-09-01 · LCK LYNa LYNb PYK2 SRC ... LTK MER MET MET[D1228H] MET[M1250T] ... e p Protein Profiling (Km app.) (1mM) Profiling Your largest](https://img.dokumen.tips/doc/110x75/5e89186df7d09e798a30d950/kinases-in-protein-kinase-enzymes-2015-09-01-lck-lyna-lynb-pyk2-src-ltk-mer.jpg)