Embed Size (px)
Citation preview

7/27/2019 kina25943enc_0
http://slidepdf.com/reader/full/kina25943enc0 1/112
Adult and continuingeducation in Europe
Using public policyto secure a growth in skills
Research and
Innovation

7/27/2019 kina25943enc_0
http://slidepdf.com/reader/full/kina25943enc0 2/112
EUROPEAN COMMISSION
Directorate-General for Research & InnovationDirectorate B -- European Research AreaUnit B.5 -- Social Sciences and Humanities
Contact: Monica Menapace
European CommissionB-1049 Brussels
E-mail: [email protected]

7/27/2019 kina25943enc_0
http://slidepdf.com/reader/full/kina25943enc0 3/112
EUROPEAN COMMISSION
Adult and continuingeducation in Europe:
Using public policy to securea growth in skills
Directorate General or Research and InnovationSocio economic Sciences and Humanities2013 EUR 25943

7/27/2019 kina25943enc_0
http://slidepdf.com/reader/full/kina25943enc0 4/112
Europe Direct is a service to help you fnd answersto your questions about the European Union.
Freephone number (*):
00 800 6 7 8 9 10 11* Certain mobile telephone operators do not allow access to 00 800 numbers
or these calls may be billed.
LEGAL NOTICE
Neither the European Commission nor any person acting on behal o the Commission isresponsible or the use which might be made o the ollowing in ormation. The views expressedin this publication are the sole responsibility o the author and do not necessarily re ect theviews o the European Commission.
More in ormation on the European Union is available on the Internet http://europa.eu .
Cataloguing data can be ound at the end o this publication.
Luxembourg: Publications O ce o the European Union, 2013
ISBN 978 92 79 29623 9doi: 10.2777/98975
© European Union, 2013Reproduction is authorised provided the source is acknowledged.
Images © Éva Széll, 2013
Printed in Luxembourg

7/27/2019 kina25943enc_0
http://slidepdf.com/reader/full/kina25943enc0 5/112
AcknowledgementThis report has been written by Paolo Federighi, who is Pro essor o Theories and Methodologies o Adult Education at the Department o Sciences o Education and Psychology, FlorenceUniversity. In order to complete his work, he analysed the nal reports, working papers andpublished articles rom research projects unded by the Directorate-General or Research andInnovation under the sixth and seventh ramework programmes.
Monica Menapace, o the European Commission’s Directorate-General or Research and Inno-vation Unit B5 ‘Social Sciences and the Humanities’ , supervised the work.
Paul Stanistreet, Editor o the NIACE Journal “Adult Learning”, edited the text.

7/27/2019 kina25943enc_0
http://slidepdf.com/reader/full/kina25943enc0 6/112
Table o contents
Foreword ..........................................................................................................................6
Executive summary .........................................................................................................
1. The three unctions o public policy or continuing vocationaleducation and training CVET and adult education ..............................................
1.1. Guaranteeing the skills supply .................................................................................................
1.2. Guaranteeing adequate equity in growth opportunities ................................................141.3. Guaranteeing educational and learning support orthe social inclusion o people with low skills .........................................................................
2. Using adult and continuing education to reduce the numbero low skilled people ..............................................................................................
2.1. Expand participation and/or one step ahead or all ...........................................................222.2. The institutional ramework ampli es the weight o the exclusion actors .......282.3. Availability o social capital is a precondition or growth ...............................................29
3. Workplace learning ....................................................................................................
3.1. Workplace learning potential ...................................................................................................3.2. Acting on the actors that increase the training potential o a workplace ...........353.3. Structuring the management o workplace learning potential ...................................403.4. Imbalances among companies ..................................................................................................3.5. Imbalances among workers .....................................................................................................3.6. The role o companies in worker upskilling ...........................................................................3.7. The role o public policies ......................................................................................................
4. Management o training processes that generate innovation ......................514.1. Innovation is the result o internal learning processes ....................................................524.2. Organisational models that avour innovation ability and
innovation orientated training .................................................................................................4.3. National and regional policies concur with context quality ..........................................57

7/27/2019 kina25943enc_0
http://slidepdf.com/reader/full/kina25943enc0 7/112
5. Markets and systems o adult and continuing vocationaland training: the governance challenge ....................................................................
5.1. The weight o adult and continuing education in markets ............................................605.2. Financial support or training demand ...................................................................................5.3. The o er o training goods and services ................................................................................5.4. Public policies or market governance ...................................................................................5.5. Investment transparency and e ectiveness .........................................................................725.6. Policies according to results .....................................................................................................
Conclusions ....................................................................................................................
Annexes ...........................................................................................................................
Annex 1 – List o Re erences ............................................................................................................Annex 2 – List o European research projects ...................................................................................Annex 3 – List o Acronyms ..............................................................................................................Annex 4 – List o Boxes .....................................................................................................................De nitions ...........................................................................................................................................

7/27/2019 kina25943enc_0
http://slidepdf.com/reader/full/kina25943enc0 8/112
6
ForewordIt may surprise you that I have written this oreword or a report that is dedicated to continuingadult education given that I am responsible or EU policy or research and innovation. Thereis, in act, a link because investment in continuing education increases the innovation capacity o companies. More generally, o course, continuing education helps workers keep theirskills up-to-date and reduces the likelihood o labour market exclusion. It plays, there ore,a undamental role to achieve the objectives o the Europe 2020 strategy, as regards bothgrowth and inclusion.
We know that in spite o existing measures, unemployment across the EU is unacceptably highand skills mismatch is one the biggest issues or our economies. We also know that the mostvulnerable groups – the low skilled, the unemployed, older workers – have less access to resheducation opportunities. We need to take e ective action to address this skills de cit, but this
action must be underpinned by evidence based policy making.
One o the strengths o the EU is that we can learn rom our diverse range o experiences andcompare and contrast di erent approaches. So in 2012 my services asked Pro essor PaoloFederighi to review the ndings o several research projects on adult and continuing educationthat have been unded under the 6th and 7th EU Research Framework Programmes.
The data analysed and presented in Pro essor Federighi’s review covers the adult and con-tinuing education markets across the EU, whether they are growing or shrinking, their uptakeo innovations applied to training, and the role o consultancies, big companies and othereconomic considerations. These data will help policy makers understand which strategieswill lead to more e ective governance o adult and continuing education, to help them shapedynamic learning environments adapted to di erent sectors, education levels and enterprisesize. Special attention must be paid to the translation o demand or skills into e ectivetraining products; providing training that allows or the acquisition o real knowledge, skills orattitudes is the only way o preventing a waste o resources.
I believe this document makes a valuable contribution to an important policy debate. It proposes a number o policy priorities to support adult and continuing education, and how to bestexploit the potential o existing knowledge through an ‘Intelligent Decision Support System’to acilitate the ex ante impact assessment o policy strategies.
Europe urgently needs to address the skills mismatch in its labour markets, and I commend thisreview, there ore, to all those involved in employment, education and inclusion policies. TheEU’s next research programme, Horizon2020, will build on the successes o its predecessorsand will continue to support evidence based policy making in these key areas.
Robert Jan SmitsDirector General or Research and Innovation
European Commission

7/27/2019 kina25943enc_0
http://slidepdf.com/reader/full/kina25943enc0 9/112
7
Executive summaryAdult and continuing education has the dual unction o contributing to employability andeconomic growth, on the one hand, and responding to broader societal challenges, in par-ticular promoting social cohesion, on the other. Companies and amilies support importantinvestments that have, to date, ensured signi cant growth in both skills and the ability o theEuropean population to innovate. Thanks to this commitment, Europe today has a wealth o organisations specialising in adult and continuing education. The sector has grown in importance, not only as an increasingly signi cant player in the economy but also in terms o itscapacity to respond to the demand or learning rom the knowledge economy. Adult and continuing education has a critical role to play in ensuring Europe copes with the phenomenon o educational exclusion, which, repeated year afer year, generation afer generation, underminessocial cohesion and restricts the growth o employment. The prevalence o private interventionhas created a situation in which participation in adult and continuing education is unevenly
distributed, o ering particular encouragement to certain groups (such as people with highlevels o education or avoured social and cultural origin, and those employed in the knowl-edge intensive productive sectors while less advantaged groups are doubly disadvantaged.
Demographic dynamics mean that the population, and hence the labour orce, in the 45 65age group will increase in the next decades, while the population aged between 15 and 44 willdecrease. This phenomenon, linked to the increasing number o knowledge and skill-intensive
jobs, makes adult education even more relevant.
Nevertheless, the actor that, more than others, determines the likelihood o accessing learn-ing opportunities is geography: the city, region and country o residence. This con rms theimportance o past and present policies and, hence, the potential role o the state.
Public policies must respond to two strategic challenges: to encourage the propensity toinvest in adult and continuing education and to guarantee the reduction o educational exclu-sion. There ore, investing appropriately in adult education will contribute to overcoming theeconomic crisis and to meeting the Europe 2020 targets on employment, poverty reduction,education, sustainability and innovation.
Given this complex setting, research provides tools and data or helping policy makers de nee ective policy measures. This publication is a review o the ndings o several EU- undedresearch projects under the 6th and 7th Framework Programmes or Research.
The conclusions o the research projects reviewed in this publication propose a number o policy priorities to support adult and continuing education and to harvest the potential o existing scienti c production. This paper surveys these conclusions and guides policy makersin developing policy interventions which both support the growth o adult and continuingeducation and exploit the wealth o research and research tools available.

7/27/2019 kina25943enc_0
http://slidepdf.com/reader/full/kina25943enc0 10/112

7/27/2019 kina25943enc_0
http://slidepdf.com/reader/full/kina25943enc0 11/112
1.The threeunctions o
public policy
or continuingvocationaleducation andtraining (CVET)
and adulteducation

7/27/2019 kina25943enc_0
http://slidepdf.com/reader/full/kina25943enc0 12/112
10ADULT AND CONTINUING EDUCATION IN EUROPE
The underlying rationale or public policy on adult and continuing education can be re erred tothree main objectives: to guarantee the availability o a skills supply adequate to the demandso economic growth; to correct the ailings o initial education and training; and to support thedynamics o cohesion and social inclusion, as re ected in the European social model.
1.1. Guaranteeingthe skills supply
Adult and continuing education publicpolicies are the educational instru-ment used by governments to ensurean adequate skills supply.
In addition to guaranteeing the supplyo young people with the skills requiredto enter the job market, public poli-cies should contribute to the development o “a more quali ed labour orce,which, thanks to new models o workorganisation, (is) capable o contrib-uting to technological change and
adjusting to it” (European Commission, 2010:2). “The serious shortages o quali ed person-nel, as well as technical and management skills, speci c or certain pro essions, obstructthe achievement o EU objectives in matters o sustainable growth” (European Commission,2010:10 .
According to research, three main structural actors are set to in uence the shape o adultand continuing education in Europe in years to come:
a. demographic dynamics will be a very signi cant actor Box 1 . “In the nextdecade only the number o 45 54 and 55 64 year olds will increase. In the agegroup 15 44, population and labour orce will decrease. … In the age group45 54, growth in the labour orce will be even higher than that o the populationas a result o activation measures” Cede op, 2010:40 .
This report is based on a review o severalresearch projects nanced by the Researchand Innovation Directorate General o theEuropean Commission (Sixth and SeventhFramework Programmes or Research). Inparticular, it draws on Li elong Learning 2010,“Toward a li elong learning society in Europe:the contribution o the education system”,
and the ongoing project, LLLight in Europe,“Li eLong Learning, Innovation, Growth andHuman Capital: Tracks in Europe” (see Annex 2
or a list o FP6 and FP7 projects relevant tothe topic). This report also takes into accountthe related work o other institutions, such asCEDEFOP, Euro ound, Eurostat and OECD, as wellas research by academics in the area.

7/27/2019 kina25943enc_0
http://slidepdf.com/reader/full/kina25943enc0 13/112
11THE THREE FUNC TIONS OF PUBLIC POLICY FOR CONTINUING VOCATIONAL EDUCATION AND
TRAINING (CVET) AND ADULT EDUCATION
Box 1. Changes in population and labour orce by age, 2010 20, EU 27+
Source: Cede op (IER estimates rom StockMOD).
The increase in the number o employed people aged between 45 and 64 meansthat this age group will bear much o the burden o responding to the need orskills in coming years. Their pro essional growth is necessary, i we are to rise tothe challenge o demographic change. It is also possible, thanks to the reducingnegative e ects o ageing on the per ormance o workers. The extension o active li e is re ected in changes to the work ability index o older workers. Theratio between ageing and productivity varies according to work quality, but, ingeneral Box 2 , “value added is not much a ected by the average age o thework orce. Labour costs increase at lower ages and are roughly constant romage 40 onwards. Apparently, as the average age o the work orce increases, thedi erence between value added and wage costs is smaller. O course, we cannotderive any causal conclusion rom Box 2 as across age groups di erent rmsare compared” Jan C. van Ours, Lenny Stoeldraijer, 2010:10 .
8
4
0
-4
-8
15 - 24 25 -34 35 - 44 45 - 54 55 - 64
Males
Females
Total population
8
4
0
-4
-8
8
4
0
-4
-8
m i l l i o n s
Population Labour force

7/27/2019 kina25943enc_0
http://slidepdf.com/reader/full/kina25943enc0 14/112
12ADULT AND CONTINUING EDUCATION IN EUROPE
Box 2. Median value added and median labour costs by age group; log scale
Source: Jan C. van Ours, Lenny Stoeldraijer, 2010
With the increase in more knowledge intensive work and the correspondingdecrease in work requiring physical e ort, the maximum level o productivity willmove progressively within the reach o older people. The possibility o extendingactive li e should lead to increased investment in learning or adults.
b. The second structural actor that will in uence adult and continuing educationis the projected increase in the number o employed people with high levels o quali cation Box 3 . This will cause anincrease in demand or adult andcontinuing education . “The baseline scenario projects that between 2010and 2020 the labour orce o Europe EU 27+ aged 15+ holding high levelquali cations will increase by more than 15 million” Cede op, 2010:50 .
Box 3. Supply trends in labour orce 15+ by quali cation, EU 27+
Source: Cede op, 2010.
2.5
3
3.5
4
4.5
-25 25 - 29 30 - 34 35 - 39 40 - 44 45 - 49 50 - 56 57+
Age category
V a
l u e a
d d
e d
a n
d l a b
o r c o s
t s
Median value added Median wage costs
millions500
400
300
200
100
0
2000 2005 2010 2015 2020
High qualicationMedium qualicationLow qualication
30.6 % 22.5 % 16.1 %
48.3 % 49.9 % 50.4 %
21.1 % 27.7 % 33.5 %

7/27/2019 kina25943enc_0
http://slidepdf.com/reader/full/kina25943enc0 15/112
13
The increase in numbers o highly quali ed workers requires the ongoingdevelopment o skills which are at constant risk o obsolescence. Research andEurostat ndings con rm that adults with high levels o education are the groupmost likely to participate in li elong learning.
The analysis o participation in education and training activities ound in theEurostat survey Box 4 shows how, during the nine years considered, thepropensity to participate doubled according to the level o quali cation held.
Box 4. Participation in ormal or non ormal education and training by educationalattainment %. Age 25 64 years.
Isced levels 1997 2003 2004 2005 2006 2007 2008 2009 2010 20110-2 3.3 3.6 3.7 3.7 3.6 3.8 3.9 3.8 3.93 and 4 8.3 9.5 8.8 8.5 8.2 8.3 8.1 8.0 7.65 and 6 17.1 19.5 18.5 18.0 17.5 17.5 16.9 16.7 16.0All 8.5 9.8 9.5 9.3 9.1 9.2 9.2 9.1 8.9
Source o Data: Eurostat. All Eurostat Data are extrac ted on 18 November 2012
c. Third, the changing structure o employment, together with the growing number o jobs that are more knowledge- and skill-intensive , increases demand orpro essional growth among the employed ( Box 5). “Many jobs (…) require morehighly-skilled/quali ed people than in the past ( because o the ) changes in the skills/quali cation composition within each o these job categories” (Cede op, 2010:71).
Box 5. Net employment change by occupation and quali cation, 2010 20, EU 27+
Source: Cede op, 2010
This means that nearly 15 million workers will be involved in up-skilling processesthat will be achieved through both on- and o -the-job training courses, and whichwill be accompanied by horizontal and vertical mobility processes within the samecompany or that could concern companies belonging to di erent productive sectors.
millions -6 -4 -2 0 2 4 6 8 10
High-skilled non-manualoccupations (legislators, manager,
professionals and technicians)
Skilled non-manual occupations(clerks and services/sales workers)
Skilled manual occupations(agricultural, cra and trade workers,
machine operators
Elementary occupations(labourers)
High qualicationMedium qualicationLow qualication
THE THREE FUNC TIONS OF PUBLIC POLICY FOR CONTINUING VOCATIONAL EDUCATION AND
TRAINING (CVET) AND ADULT EDUCATION

7/27/2019 kina25943enc_0
http://slidepdf.com/reader/full/kina25943enc0 16/112
14ADULT AND CONTINUING EDUCATION IN EUROPE
d. The imperative to develop skills implies the need or a soundsystem ormonitoring the possession o skills . Guaranteeing an adequate skills supplymeans ensuring that the actors on the job market know “who knows what”.In other words, it demands a system that delineates the actual possession o skills and not just quali cations. Research Collins, 1979et al . has shown howquali cations can be more o a barrier or admission to a social class than a
unction or identi ying actual skills. The main purpose o higher quali cationsis not necessarily to denote acquired skills, but rather to limit access to somespeci c pro essions. Since what unites a social class is a common culture,education plays a considerable role in transmitting and consolidating thiscommon culture, regardless o the pro essional capabilities transmitted.“The existence o jobs with higher level quali cations can lead to acredentialism rather than a more skilled work orce” Dokeryet al ., 2012:5 . Research on theactual linguistic and mathematic skills o 15 year olds and PIAAC data, have
shown the limits o the accumulation o certi cates credentialism) and thelimited importance o quali cations with respect to in ormation about the skillssomeone actually has.
1.2. Guaranteeing adequate equityin growth opportunities
A second unction o adult and continu-ing education policy is to correct thesocial exclusion produced, rst o all,by the education system, rom schoolto university, as well as by other ac-tors that impact on the socialisation o young people. The European Commis-sion’s Agenda or new skills and jobs
states: “Irrespective o age, gender, socio-economic background, ethnicity or disability, all EUcitizens should have the opportunity to acquire and develop the mix o knowledge, skills andaptitudes they need to succeed in the labour market” (European Commission, 2010:10).
As ar as the transition o young people rom school to work is concerned, the need or adultand continuing education policies arises rom the shortcomings o the initial education system.As more European countries have modernised, the number o people with access to educationhas grown, and people have remained in compulsory education or longer. In spite o re orm,schools have not been able to provide an adequate skills supply. Schools continue to perpetu-ate social distinctions (Box 6 ). “The odds that a 20-34 year-old will attend higher educationare low i his or her parents have not completed upper secondary education. On average acrossOECD countries, young people rom amilies with low levels o education are less than one-hal (odds o 0.44) as likely to be in higher education, compared to the proportion o such amilies inthe population” (OECD, 2012:104).
In spite o decades o re orm, the educationsystem selects young people on the basis o their social class, not their merits. Policiesshould reduce the e ects o educationalexclusion by enriching social capital, workplacelearning and the response to individuals’intellectual growth ambitions.

7/27/2019 kina25943enc_0
http://slidepdf.com/reader/full/kina25943enc0 17/112
15
Box 6. Participation in higher education o students whose parents have low levels o education OECD, 2009
Note: !e number o students attending higher education are under-reported or Australia, Canada, New Zealand and the
United States compared to the other countries as they only include students who attained ISCED 5A, while the other countries
include students who attained ISCED 5A and/or 5B. !ere ore, the omission o data on 5B quali cations may understate
intergenerational mobility in these countries.
1. Data source rom Adult Literacy and Li eskills Survey (ALL) o 2006.
2. Data source rom Adult Literacy and Li eskills Survey (ALL) o 2003.
Countries are ranked in descending order o the odds o attending higher education.
“The chance that a young person whose parents have not attained an upper secondary educationwill attend higher education is limited”. On the other hand, “In general, students whose parentshave higher levels o education are more likely to enter tertiary education. On average, a 20-34year-old rom a highly educated amily is almost twice (1.9) as likely to be in higher education,as compared with the proportion o such amilies in the population” (OECD, 2012:104).
“On average across OECD countries, approximately hal o 25-34 year-old non-students haveachieved the same level o education as their parents: 13% have a low level o education (ISCED0/1/2), 22% have a medium level o education (ISCED 3/4), and a urther 15% have attained tertiaryeducation (ISCED 5/6). More than one-third (37%) o all young people have surpassed their parents’educational level, while 13% have not reached their parents’ level o education” (OECD, 2012:108).
The obvious ailings o countries’ school systems highlight the need or adult and continu-ing education policies which expand access to personal and pro essional growth pathways.Research on equity policies shows how they largely meet the training demand o people who start rom non-disadvantaged conditions . We have already presented dataconcerning the greater propensity o people with higher levels o education to participatein adult and continuing education (Box 4 ). Below, we show data rom Eurostat’s ALS survey
Box 7 , which indicate the greater propensity o employed people to train.
908070605040302010
0
0.90.80.70.60.50.40.30.20.10.0
% Odds ratio
Proportion of young students (20-34 year-olds) in higher education whose parents have low levels of education (Le axis)
Proportion of parents with low levels of education in the total parent population (Le axis)
I c e
l a n
d
T u r k e y
P o
r t u g a
l
I r e l a n
d
U n i t e
d K i n g
d o m
D e n m a r k
S w e
d e n
S p a
i n
N e
t h e r l a n
d s
A u s t r a
l i a 1
I t a l y
O E C D
a v e r a g e
P o
l a n
d
F i n l a n
d
L u x e m
b o u r g
G e r m a n y
A u s t r i a
N o r w a y
G r e e c e
F r a n c e
S w
i t z e r l a n
d
H u n g a r y
B e
l g i u m
C z e c h
R e p u
b l i c
S l o v e n i a
U n
i t e d S t a t e s 2
C a
n a
d a 2
N e w
Z e a
l a n
d 1
Odds of being a student in higher education if parents have low levels of education (Right axis)
THE THREE FUNC TIONS OF PUBLIC POLICY FOR CONTINUING VOCATIONAL EDUCATION AND
TRAINING (CVET) AND ADULT EDUCATION

7/27/2019 kina25943enc_0
http://slidepdf.com/reader/full/kina25943enc0 18/112
16ADULT AND CONTINUING EDUCATION IN EUROPE
Box 7. Participation rate in education and training by labour status 2007
Labour status Percentage o total
employed 42.1unemployed 24.1inactive 16.6European Union (27 countries) 34.9
Source o Data Eurostat
The OECD’s 2000 International Adult Literacy Survey (OECD, 2000) – which understood “lit-eracy” as the ability to understand and employ printed in ormation in daily activities, at home,
at work and in the community – supported this nding. The results were con rmed by laterresearch, speci cally the OECD’s Adult Literacy and Li e Skills ALL Survey OECD, 2011 andthe LLL2010 survey. The ALL results include a number o important acts:
• Many o the di erences in the level and distribution o pro ciency can beexplained by social background, educational attainment and a range o variablesrelating to use o and engagement with literacy and numeracy and the waysadults lead their lives;
• Signi cant proportions o the adult population display poor levels o pro ciency in oneor more o the skill domains assessed and many per orm poorly in all domains; and
• The di erences in the level and distribution o literacy, numeracy and problem-solving skills are associated with large di erences in economic and social outcomes.
This means that policies or adult and continuing education aimed at promoting equity have anessential unction in maintaining acquired learning conditions and in the emancipationo a reduced share o the population that can improve their own quali cations through
ormal adult education.
1.3. Guaranteeing educational and learning supportor the social inclusion o people with low skills
The third, and nal, unction o public policy or adult and continuing education is to buildinclusion opportunities or low-skilled people, whether they have no quali cations or theirskills are obsolete.
Over the last decade, research has concentrated on the ollowing targets Box 8 :
a. Adults with low education attainment, de ned by Eurostat as those who haveattained an ISCED level no higher than 0, 1 or 2.
b. Early leavers rom education and training, de ned by Eurostat as the percentageo the population aged between 18 and 24 who have attained, at most, lower

7/27/2019 kina25943enc_0
http://slidepdf.com/reader/full/kina25943enc0 19/112
17
secondary education and who have not being involved in urther education ortraining i.e. people aged 18 to 24 who meet the ollowing two conditions: thehighest level o education or training they have attained is ISCED 0, 1, 2 or 3cshort; and they have not received any education or training in the our weekspreceding the survey .
c. Young people who are neither in employment nor in education and training – theso-called “NEETs” (those who, ollowing the Eurostat de nition, are not employed andhave not received any education or training in the our weeks preceding the survey).
d. Students who, at 15, have serious educational de ciencies, speci cally inreading literacy. According to data rom the Programme or InternationalStudent Assessment PISA , reading literacy is de ned as understanding, usingand re ecting on written texts, in order to achieve one’s goals, to develop one’s
knowledge and potential, and to participate in society. Pro ciency at Level 1 andbelow means that pupils are not likely to demonstrate success on the most basictype o reading that PISA seeks to measure.
Box 8. Overview o our indicators o educational hardship
Early leavers rom education and training% o the population aged 18 24 with at most lower secondary education and not in
urther education or trainingGEO\TIME 2004 2005 2006 2007 2008 2009 2010 2011
EU 27 countries 16 15.8 15.5 15.1 14.9 14.4 14.1 13.5
Persons with low educational attainment, by age group: rom 25 to 64 yearsGEO\TIME 2004 2005 2006 2007 2008 2009 2010 2011
EU 27 countries 31.6 30.6 30.1 29.3 28.7 28 27.3 26.6
Low reading literacy per ormance o pupils
Share o 15 year old pupils who are at level 1 or below o the PISA combined readingliteracy scaleGEO\TIME 2003 2006 2009
EU 27 countries 20.8 s 22.6 s 19.6 ss=Eurostat estimate
Young people not in employment and not in any education and trainingin % points o NEET rates Age rom 20 to 34 years
GEO/TIME 2004 2005 2006 2007 2008 2009 2010 2011
EU 27 countries 19.1 18.7 17.6 16.8 16.5 18.5 19.1 19.3Source: Eurostat
THE THREE FUNC TIONS OF PUBLIC POLICY FOR CONTINUING VOCATIONAL EDUCATION AND
TRAINING (CVET) AND ADULT EDUCATION

7/27/2019 kina25943enc_0
http://slidepdf.com/reader/full/kina25943enc0 20/112
18ADULT AND CONTINUING EDUCATION IN EUROPE
The data shown in Box 8 re er to di erent types o problem: lack o quali cations, low level o skills and under-utilisation o skills possessed. However, they are indicative o the scale o the
phenomenon o educational exclusionand the impact o social reproduction.
The data most relevant to policieson adult and continuing educationconcern people with low educationalattainment. The data show a patterno progressive decline, but the trend is
slow. We must also take into account the phenomenon o social reproduction, i.e. the in uenceo the educational attainment o parents on their children’s educational prospects. The lowlevel o education among some parents can have a major negative in uence on the aspira-tions o their own o spring.
The data concerning the other three target groups (early school leavers, NEETs and pupilswith poor reading literacy highlight the existence o a considerable potential addition to thelow-skilled population. The exception could be NEETs with upper-secondary, post-secondarynon-tertiary, rst- and second-stage tertiary education (levels 3-6) quali cations; who, in 2011,were 11.8% o the NEET population. In any case, we must bear in mind the risk that the skillsthey have gained will become obsolete because o lack o use Desjardins, 2004 .
The implementation o policies o social inclusion through adult and continuing education musttake into account other actors, which are associated with the low-skilled condition (OECD,2012:120, 202 203 , or example:
• the greater risk o unemployment;
• less participation in orms o social li e;
• less participation in the political li e o their own country;
• greater propensity or con ict with di erent ethnic groups; and
• lower li e expectancy.
The combination o these conditions makes the implementation o e ective educational poli-cies more di cult. There is a need or complementary, synergistic approaches between thevarious areas o policy.
The dys unctions o society, school and the job market create educational exclusion,among both young people and the elderly. Thisincreases the potential demand or education.However, policies to correct the dys unctionshave so ar had limited impact.

7/27/2019 kina25943enc_0
http://slidepdf.com/reader/full/kina25943enc0 21/112

7/27/2019 kina25943enc_0
http://slidepdf.com/reader/full/kina25943enc0 22/112

7/27/2019 kina25943enc_0
http://slidepdf.com/reader/full/kina25943enc0 23/112
2.Using adultand continuing
educationto reducethe number o low-skilled
people

7/27/2019 kina25943enc_0
http://slidepdf.com/reader/full/kina25943enc0 24/112
22ADULT AND CONTINUING EDUCATION IN EUROPE
2.1. Expand participation and/or one step ahead or allEurope missed the Lisbon objective o achieving a 12.5% rate o adult participation in li elonglearning by 2010. Adult participation reached 9.1% and thereafer stagnated, a negative trendthat continued in 2012. The reasons or this are still not entirely clear. However, we must becare ul not only to consider the reasons or this lack o expansion. We must also ask ourselveswhether the investments made contributed to making members o the various social groupsadvance in their capacity to contribute to European growth strategies, and, i so, how.
From this perspective, research has produced new knowledge that should be use ul or constructing policies.
2.1.1. One step ahead in upskilling
Between 2000 and 2010, the demandor ormal adult education did not
uni ormly ollow a pattern o declineor stagnation. In some countries, sig-ni cant progress was made in some
respects ( Box 9). Demand or upskilling is consistent, though it is not evenly distributed acrossthe age range Beblavyet al ., 2012:29 .
“Findings or the EU27 average show that:
• High skills increase over all cohorts (excepted for older cohorts in rare cases), butthe e ect is strongest or the youngest cohort.
• Low skills generally decrease, but the e ect is strongest for the youngest cohorts– less clear cut than or high skills.” Beblavyet al ., 2012:16
Box 9. Cohort analysis using the LFS macro data
EU27 Average low medium high
2000 From 25 to 34 years 25.7 51.4 22.92010 From 35 to 44 years 23.8 48.3 27.92000 From 35 to 44 years 30.7 48.3 20.92010 From 45 to 54 years 28.9 48.4 22.72000 From 45 to 54 years 39.1 42.4 18.52010 From 55 to 64 years 38.4 42.5 19.1
Source: Beblavy, NeuJobs
It must be acknowledged that the European average, though positive, disguises signi cantvariation in the per ormances o di erent countries. Contrast, or example, the results o Luxembourg or Bulgaria, which have seen alling numbers o low-skilled workers, with Italy,where the trend is negative.
In spite o the crisis and the weakness o publicpolicies, people – whether low, medium or highskilled and regardless o age – are working hardto improve their skills.

7/27/2019 kina25943enc_0
http://slidepdf.com/reader/full/kina25943enc0 25/112
23USING ADULT AND CONTINUING EDUCATION TO REDUCE THE NUMBER OF LOW-SKILLED PEOPLE
Box 10. Cohort analysis using the LFS macro data
Luxembourg low medium high
From 25 to 34 years 31.8 45.3 22.9From 35 to 44 years 19.5 39.0 41.4From 35 to 44 years 35.7 47.3 16.9From 45 to 54 years 25.3 46.8 27.9From 45 to 54 years 42.6 38.9 18.4From 55 to 64 years 30.9 43.8 25.3
Bulgaria low medium high
From 25 to 34 years 23.9 57.3 18.9
From 35 to 44 years 17.0 58.6 24.4From 35 to 44 years 23.6 56.2 20.2From 45 to 54 years 17.8 59.9 22.3From 45 to 54 years 32.9 48.4 18.7From 55 to 64 years 29.5 51.3 19.2
Italy low medium high
From 25 to 34 years 40.7 48.7 10.6
From 35 to 44 years 40.8 43.4 15.8From 35 to 44 years 48.6 40.4 11.0From 45 to 54 years 48.9 39.1 12.0From 45 to 54 years 60.6 29.3 10.1From 55 to 64 years 61.8 27.5 10.7
Source: Beblavy, NeuJobs
The propensity or developing skills measured here using participation in activities thatissue certi cation classi able within the ISCED ramework) is consistently present in Europeancountries andconcerns all educational levels. However, there are countries which, whileobtaining positive results in the development o high skills, do not decrease the number o low skilled workers.
2.1.2. A sel -regulated behaviour
The motivations o those adults who do
take part in adult and continuing educa-tion are highly variable, inspired by theirown changing expectations with respectto di erent phases o the li e cycle.
Among the population there is a widespread
capability or sel -direction in learning.This learning culture is a wealth that publicpolicies should cultivate, respecting individualmotivations.

7/27/2019 kina25943enc_0
http://slidepdf.com/reader/full/kina25943enc0 26/112
24ADULT AND CONTINUING EDUCATION IN EUROPE
The propensity o adults to invest in upgrading their skills is irregularly distributed across theage groups (Box 11 ). It grows and declines according to the use adults can make o it. Thetwo phases o li e in which the propensity o citizens to upgrade their skills is mostly con-centrated are the early years o entering the working world and shortly be ore retirement. Inthe rst case, skill upgrading serves to adapt and increase the skills necessary or work those, particularly, not catered or in school ; in the second case,training can serveto lengthen active li e . Yet we must take into account that “in almost all countries inac-tive persons have a much higher chance or participating in ormal learning than regularlyemployed either ull time or part time or unemployed persons.” LLL2010, 113 .
Box 11. Participation in ormal education and training by age groups rom 25 to 34 yearsand rom 45 to 54 years %
GEO/TIME 2003 2004 2005 2006 2007 2008 2009 2010 2011
European Union(27 countries)
7.1 8.2 8.2 7.9 8.0 8.0 8.2 8.4 8.5
GEO/TIME 2003 2004 2005 2006 2007 2008 2009 2010 2011
European Union(27 countries) 0.7 1.3 1.2 1.1 1.1 1.2 1.2 1.2 1.2
Source: Eurostat
The background trends are the same. Unlike the other age groups, the two under considerationincreased or maintained their rate o participation in ormal education and training, even afer2005 and the onset o the nancial crisis. For both age groups, however, there was a all inparticipation in in ormal education. We might conclude that, aced with the challenges o thecrisis, people pre erred to invest in training with a more immediate return.
This highlights the need to increase the capacity o individuals to manage their own learning.A sel -directed learning policy entails giving powers o decision to individuals and employ-ers, and acknowledges the right o individuals and companies to ollow the motivations thatprompt them to engage in training seeBox 12 , rom LLL2010:124, 129 .
Box 12. Overview – participation events in adult education
Li e Cycle
Focus Main Types Sub-types Description
Education
I CompletingIa Finishing Working while studying without particular
connection o work and education
Ib Entering Being hired in late phases by an employerin need o graduates
II Returning II ReturningReturning to education and overrulinga temporary transition to work
III Trans orming III Trans orming General trans ormation using education asa basis

7/27/2019 kina25943enc_0
http://slidepdf.com/reader/full/kina25943enc0 27/112
25USING ADULT AND CONTINUING EDUCATION TO REDUCE THE NUMBER OF LOW-SKILLED PEOPLE
Li e Cycle
Focus Main Types Sub-types Description
WorkIV Rein orcing
IVa Progressing Progressing in the current eld by at least
one step on the educational adder
IVb AdaptingMaking one step in the current eld, inparallel to an existing one not relevant inthe eld
IVc Specialising Completing on programme as aspecialization
IVd Peaking Completing a ormal programme design orexperienced pro essionals in the eld
V Compensating V Compensating Compensating the restriction o an existing
pathway
Source: LLL201
As ar as policy is concerned, this means not simply imposing a predetermined o er in ormed bysupply-side considerations. Increasing the responsibility o individuals can be supportedthrough policies that act on the demand , i.e. through the construction o highly personalisedpathways. This is certainly, in part, to be achieved through the availability o learning sources(the learning o er), but it also requires the existence o policies and measures that ree theindividual’s learning demand, giving the individual and the company powers o choice, includingthrough the reduction o economic barriers (vouchers, tax deductions, etc.) and time barriers.
2.1.3. The national and local contexts make the di erence
There is a propensity to invest in training and, when we take into account uncerti ed training,it is clear there is much more o this sort o investment than current studies would suggest.Nevertheless, research ndings on par-ticipation are a signi cant indicator o the e ciency o the growth o skillquality in Europe.
The actor which most determinesthe possibility o accessing adult andcontinuing education is the territory inwhich adults live and work. The most consistent di erences, those that create inclusion orexclusion and exceed the weight o any other actor, are the territorial ones Box 13 . An individual in a poorly per orming country can have a chance o accessing adult and continuingeducation as much as 30 times less than those living in top per ormance countries.
The likelihood o having access to li elonglearning varies largely according to countryand region o residence. Nevertheless, thereare countries and regions that, in spite o un avourable conditions, are making aster progress than the best-per orming countries.

7/27/2019 kina25943enc_0
http://slidepdf.com/reader/full/kina25943enc0 28/112
26ADULT AND CONTINUING EDUCATION IN EUROPE
Box 13. Participation in ormal or non ormal education and training by age groupsrom 25 to 64 years %
GEO/TIME 2011
Belgium 7.1Bulgaria 1.2Czech Republic 11.4Denmark 32.3Germany including ormer GDR rom 1991 7.8Estonia 12.0Ireland 6.8Greece 2.4Spain 10.8France 5.5Italy 5.7Cyprus 7.5Latvia 5.0Lithuania 5.9Luxembourg 13.6Hungary 2.7Malta 6.6
Netherlands 16.7Austria 13.4Poland 4.5Portugal 11.0Romania 1.6Slovenia 15.9Slovakia 3.9Finland 23.8Sweden 25.0United Kingdom 15.8Iceland 25.9Norway 18.2Switzerland 29.9Croatia 2.3Former Yugoslav Republic o Macedonia 3.4Turkey 2.9
Source o Data: Eurostat
Even within the best per orming countries, however, there are regional variations likely to beo concern to those resident in less avoured regions Box 14 .

7/27/2019 kina25943enc_0
http://slidepdf.com/reader/full/kina25943enc0 29/112
27USING ADULT AND CONTINUING EDUCATION TO REDUCE THE NUMBER OF LOW-SKILLED PEOPLE
Box 14. Participation o adults aged 25 64 in education and training by NUTS 2 regionsrom 2000 %
GEO/TIME 2011
Baden Württemberg 8.8Bayern 7.2Berlin 9.6Brandenburg 7.2Bremen 9.2Hamburg 10.3Hessen 9.5Mecklenburg Vorpommern 7.7Niedersachsen 6.4Nordrhein West alen 7.1Koblenz 7.3Saarland 7.8Sachsen 7.3Sachsen Anhalt 6.7Schleswig Holstein 7.5Thüringen 8.3
Source: Eurostat
This suggests thatwhat makes a di erence is not a matter o national history or policy, but the capacity o the state to make an impact on the cultures, economiesand conditions o the populations o its various territories .
With this in mind, we shif our interest rom an analysis o the di erences between countriesto a comparison o steps orward taken on national and regional levels during a certain period.The comparison o the degree o positive impact o public policies is more signi cant than thepositioning analysis. This in ormation gives an idea o the possible uture and modi es thetraditional ranking o European countries.
NeuJobs research o ers use ul veri cation on this.Box 15 “shows the development over theyears 2000, 2005 and 2010. It allows examining the evolution o workplace training up skilling through generations instead o ollowing speci c cohorts. The gure shows that trainingparticipation increased particularly in countries where attendance was low in 2000. Thosecountries are gradually catching up with the best per ormers. This progression is mainly dueto the new young generation who invest much more in up skilling than their predecessors. Inthe Nordic countries and Switzerland, where training attendance is the highest in Europe, upskilling grew less than in the South and East o Europe (excepted in Denmark were participation
rose considerably between 2000 and 2005 ” Beblavyet al ., 2012:15 .

7/27/2019 kina25943enc_0
http://slidepdf.com/reader/full/kina25943enc0 30/112
28ADULT AND CONTINUING EDUCATION IN EUROPE
Box 15. Participation in workplace training 24 34 and 50 59
2.2. The institutional ramework ampli esthe weight o the exclusion actors
Analysis o the actors which excludepeople rom adult and continuing edu-
cation con rms the weight o insti-tutional contexts, and highlights the
need or policies that reduce the e ects o demographic barriers such as gender, age, amilyresponsibility and location), social barriers (such as early school dropout, unemployment orabsence rom the labour orce, and part-time or temporary work contracts combined with lowlevels o labour market integration), and low-status barriers (like manual work). These vari-ables orm part o the panorama o issues, highlighted in research, which ace disadvantagedgroups ound in research. The particular con guration varies according to the country, as wellas to policies adopted to counteract them.
The barriers so ar identi ed were the object o a comparative analysis o Adult EducationSurvey (AES) data carried out by LLL2010. The analysis investigated the demographic andsociological barriers and examined the underlying causes o participation in ormal adulteducation Box 16 .
0.6
0.5
0.4
0.3
0.2
0.1
-0.1
0
S w i t z e
r l a n d
I c e l a n d
S w e d e
n
D e n m a
r k
F i n l a n d
U n i t e d
K i n g d o m N o
r w a y
N e t h e
r l a n d s
S l o v e n i a
A u s t r i a
B e l g i u m I t a
l y
E s t o n i a
S p a i n
L u x e
m b o u r
g
P o r t u g a
l
H u n g a r
y
F r a n c e
L i t h u a n i a
R o m a n
i a
G r e e c e
B u l g a r
i a
C z e c h R e
p u b l i c
I r e l a n d L a t v
i a
P o l a n d
S l o v a k i a
Difference between the younger (24-29) and the older (50-59)cohorts in training attendance in 2000 (arrow), 2005 (cap) and 2010 (bullet)
Informal education 2000 Informal education 2005 Informal education 2010
Public policies can encourage the developmento skills using regulations that reducesocio-demographic obstacles

7/27/2019 kina25943enc_0
http://slidepdf.com/reader/full/kina25943enc0 31/112
29USING ADULT AND CONTINUING EDUCATION TO REDUCE THE NUMBER OF LOW-SKILLED PEOPLE
“From the demographic perspective, this analysis revealed the presence o gender inequali-ties in particular or mothers who have amily responsibilities to take care o a young childin the amily. From the viewpoint o sociological obstacles, the multivariate analysis provedthe signi cance o interruption in studies as an underlying mechanism or returning to ormaladult education: longer interruption decreased the odds o participation in li elong learning,particularly in those countries where attendance rates were smaller” LLL2010:129 .
Box 16 . Socio demographic obstacles or participation in adult education in the AEScountries
Sociologicalobstacles**
Demographic obstacles*Low level Low-middle High-middle High level
Low level FI, SE, BE PTLow-middle NO, SI ES
High-middle LT AT, DEHigh level EE, LV, SK CZ, HR HU, BG, FR, CY
* Expected disadvantage or women, old aged respondents , rural inhabitants, those with small children
** Expec ted disadvantage or early school dropouts, those with weak integration in the LM, manual worker status, low level o income
Source: LLL2010
These results (Box 16 ) show howtrends in participation in adult and continuing edu-cation result rom the various policies and their e ectiveness in tackling the actorsshown above. This is the main explanation o the di erences between countries. The LLL2010research on the weight o labour conditions concluded: “ ormal adult education and labourmarket status are both interrelated and dynamic during the period o participation in ormaladult education. Individual participants may combine work and study di erently during thevarious periods o their programmes, but not completely at will. Available space or individualdecision in this matter is expanded or restricted by institutional settings (e.g. availability o grants, leave schemes or part-time programmes). Socio-economic actors (e.g. average income)and local labour market conditions also co-determine the participant’s choices when balancingcontinuing ormal education and economic necessities.” LLL2010:114 .
2.3. Availability o social capital is a preconditionor growth
The growth o skills is connected to thepossibility o belonging to territorial andnon-territorial networks and communi-ties that stimulate and support individ-ual learning needs. The richer and more
dynamic the network o riends, acquaintances, reciprocal and trusting relationships, access tosocial activities, the greater the social capital available. Robert B. Reich (1991) adopted the expres-sion “community o dynamic learning”, attributing to such communities a key role in internationalcompetition and in encouraging participant growth through ongoing continuing in ormal exchange.
What makes the di erence is belongingto networks o dynamic learning and tocommunities, cities and regions with a wealtho sources o knowledge.

7/27/2019 kina25943enc_0
http://slidepdf.com/reader/full/kina25943enc0 32/112
30ADULT AND CONTINUING EDUCATION IN EUROPE
NeuJobs research has shown how belonging to social networks has a positive e ect on accessto adult and continuing education: “all types o social capital (considered ) have a signi cantand positive e ect on adult learning. The size o the e ect varies across the di erent measuresbetween increasing the probability o participating in adult learning by 0.04% to increasingthe probability by 17%. Across all measures o adult learning we identi ed that one more unito the perceived importance to be socially active increases the probability o participation inadult learning by the most 17% and that one additional riend increases this probability bythe least (0.04%). We also nd that the supportiveness o the social network increases theprobability o participating in adult learning by nearly as much as an additional unit in theperceived importance to be politically and socially active.” Thum, 2012:3 .
The ollowing graph (Box 17 ) shows the predicted probabilities o attending pro essionalclasses and the relationship with social capital measures, given a set o controls. The graphshows that the e ect is positive, given the control variables or all three education levels
Thum, 2012:11 .
Box 17. Scatter plot between the predicted probability to attend a pro essional class andthe sociability scale or the low skilled
Source: Thum, NeuJobs
The signifcance o belonging to dynamic learning networks and communitiesshould in orm public policy about the kinds o support that aid prosperity ( romthe old to the very new in rastructures, to li e associated in its new traditional and virtual
orms). Participation in non- ormal adult education and training is a partial measure o thisphenomenon Box 18 .
0
0.1
0.2
0.3
P r ( a
t t _ p r o
f_ c l a s s e s )
f o r
l o w s k
i l l e d
-3 -2 -1 0 1
sociability | controls
Fitted values Pr(att_prof_course)

7/27/2019 kina25943enc_0
http://slidepdf.com/reader/full/kina25943enc0 33/112
31USING ADULT AND CONTINUING EDUCATION TO REDUCE THE NUMBER OF LOW-SKILLED PEOPLE
Box 18. Participation in non ormal education and training by age groupsrom 25 to 64 years %
GEO/TIME 2003 2004 2005 2006 2007 2008 2009 2010 2011
European Union(27 countries)
5.3 7.3 6.9 6.8 6.7 6.9 6.7 6.7 6.4
Source o Data: Eurostat
Between 2003 and 2011 there was a slow decrease in participation in this type o activity. Itis worthwhile wondering how much this phenomenon deprives citizens o a means o developing skills.

7/27/2019 kina25943enc_0
http://slidepdf.com/reader/full/kina25943enc0 34/112

7/27/2019 kina25943enc_0
http://slidepdf.com/reader/full/kina25943enc0 35/112
3.Workplacelearning

7/27/2019 kina25943enc_0
http://slidepdf.com/reader/full/kina25943enc0 36/112
34ADULT AND CONTINUING EDUCATION IN EUROPE
3.1. Workplace learning potential“High quality o work goes hand inhand with high employment participation. This is because the working environment plays a crucial role in enhanc-ing the potential o the work orce and
is a leading competitiveness actor. In order to innovate and to deliver promptly and e ciently,EU companies depend or their survival and expansion on a committed work orce, thrivingin a high-quality working environment, with sa e and healthy working conditions” (EuropeanCommission, 2010:14 .
Adult and continuing education policy can rein orce the learning potential o workplaces. It“depends on the interplay o various dimensions: human resources policies and training pro
vided; participation o the company in innovation; learning opportunities o ered on the job;worker motivation to learn; and the opportunities that the working environment gives themto use newly acquired knowledge and skills” Cede op, 2011:38 39 . “Learning is anchored inwork processes, is project based or embedded in team working” Cede op, 2011:32 .
All companies o er training; it is impossible to think o a company that does not ound itsexistence on its ability to produce knowledge with respect to what and how it produces, whoto sell to and how to sell (Vicari, 2008:55). A business exists as a result o the technologi-cal progress produced by its very economic activity and no longer just by external trans er:“technological advance comes rom things people do” Romer, 1994:12 .
The vast majority o European workers report learning new things in the workplace Box 19 .Only in a small number o occupations is this not the case Euro ound, 2012:99 .
Box 19. Learning new things at work, by occupation, EU27 %
Source: Euro ound (2012), Fi h European Working Conditions Survey
Workplace learning can be understood only by adopting interpretative measures di erent tothose o ormal education LLL2010 .
60 %
50 %
70 %
80 %
90 %
100 %
40 %30 %
20 %
10 %
0 %
201020052000
M a n a
g e r s
P r o f e s
s i o n a l s
T e c h n
i c i a n s a
n d
a s s o c i a t e
p r o f e s
s i o n a l s
C l e r i c a l s u p p
o r t
w o r k e r
s
S e r v i
c e a n
d
s a l e s
w o r k e r
s
S k i l l e d a g r i c u l
t u r a l
w o r k e r
s
C r a a n
d r e l a t e
d
t r a d e
s w o r k e r
s P l a n
t a n d
m a c h i n e
o p e r a
t o r s
E l e m e n t a r
y
o c c u p
a t i o n s
The workplace learning potential is the actor on which the pro essional growth o workersdepends. Workplace learning is, rst o all, theresult o learning embedded in day-to-day work

7/27/2019 kina25943enc_0
http://slidepdf.com/reader/full/kina25943enc0 37/112
35WORKPLACE LEARNING
3.2. Acting on the actors that increasethe training potential o a workplace
“The act that we spend a third o ourdaytime, and more than thirty years o our lives, in successive working envi-ronments emphasises the signi canceo the workplace in making li elonglearning a reality (…). We learn throughwork tasks, rom colleagues and workmentors, through trial and error, by solving challenges and changing job positions, as well asthrough the continuing training that employers may provide” Cede op, 2011:17 .
To manage the growth o skills and hence workplace per ormance, action must be taken onthe actors that create workplace training potential.
Among the actors examined by the Fifh European Working Conditions Survey (Euro-ound: 2012 , we concentrate on those that have direct impact on the Learning Value Propo
sition that a workplace o ers to employees in exchange or their services. The value o eredconsists in learning opportunities, structured or not, which are directly produced by the actorsdescribed below.
a. Work content
The content o work undertaken is the worker’s primary source o learning. The variety o duties, the challenges, the degree o sel -su ciency required, the eedback rom ellow work-ers and managers, the demands o team working and the technologies employed, are a dailysource o learning, whether or not they are encoded. The Fifh European Working ConditionsSurvey provides data on the various components o this actor.
For example, i we consider the types o teamwork employees take part in, an articulatedramework emerges showing the important di erences between the various productive sec
tors, in addition to their internal aspect (Box 20 ). Overall, at least two workers in ve workas part o a team, with a degree o independence. There ore, we can assume that they aredoing a kind o work that o ers them the possibility o analysis and evaluation and a role indecision taking, i.e. in the continuing production o new knowledge.
The policy o developing the learning potentialo workplaces must act at the same time on the
ve actors that create value or employees: job content, career prospects, bene ts, a senseo belonging and the learning culture in jobcontracts

7/27/2019 kina25943enc_0
http://slidepdf.com/reader/full/kina25943enc0 38/112
36ADULT AND CONTINUING EDUCATION IN EUROPE
Box 20. Types o teamwork, by sector %
Source: Euro ound, 2012
b. Career prospects
Work that o ers prospects o advancement, security and personal growth also increasesmotivation and develops a commitment to ongoing improvement. The use o worker develop-ment plans promotes pro essionalism and encourages workers to build uture roles by takingon various work positions, usually accompanied by new learning.
The Fifh European Working Conditions Survey shows how expectations o career promotion arewidespread among a signi cant proportion o employees. Promotion expectations are present inall worker levels (distinguished here by quali cation level). This means that a signi cant numbero employees are engaged in training processes o evaluation and sel -evaluation, acquisitiono new knowledge in their daily work and various types o structured training opportunities,through participation in projects and the management o new challenges. The positive picture thatemerges with respect to these on-going dynamics does not, however, mean that we should notask whether enough people are involved in career development processes – and, hence, whetherall employers o er contexts capable o building people’s skills through pro essional development.The need to ask these questions becomes obvious when we consider the unequal distribution o this opportunity, which is concentrated among those ith the highest levels o quali cation ( Box 21).
Box 21. My job o ers good prospects or career advancement
EU272010
Agree Neither agree nor disagree Disagree
High-skilled clerical 46.2% 22.9% 30.9%Low-skilled clerical 32.1% 24.4% 43.5%
High-skilled manual 24.9% 25.5% 49.6%Low-skilled manual 17.6% 17.1% 65.4%
Total 31.5% 22.9% 45.6%
Source: Euro ound data base, 2013
T r a n s p
o r t
I n d u s t r y
A g r i c u l t u r e
C o n s t r u c
t i o n
F i n a n c i a l s
e r v i c e s
O t h e r s e r v i c e s
E d u c a t
i o n H e
a l t h E U
2 7
W h o l e s a
l e, r e t a i l, f o
o d
a n d a c c o
m m o d a
t i o n
P u b l i c a
d m i n i s t r a t
i o n
a n d d e f e n
c e0 %
10 %20 %30 %40 %50 %60 %70 %80 %90 %
100 %team with some autonomyno teamwork team with no autonomy team with much automomy

7/27/2019 kina25943enc_0
http://slidepdf.com/reader/full/kina25943enc0 39/112
37WORKPLACE LEARNING
c. A liation
The culture o a workplace is an important contributing actor in people’s personal and pro-essional growth. Understanding and identi ying with this culture is an essential condition or
sharing the goals o an organisation. The educational potentials o work are determined bythe meanings an individual nds within his own productive organisation. A certain kind o workcan be considered “ ully meaning ul when it is done responsibly, not only due to the way it iscarried out, but in relationship to the product and the consequences it generates; it opens ustowards another ofen neglected dimension o organisational models: ethical and moral correctness in the workplace” seeBox 22 rom Morin, 2004:7 .
Box 22. Characteristics o a job rich in meaning
Job characteristics De nition
Social signi cance Per orming a job where social use ulness and the contributionit gives to society is evidentMoral correctness Doing something that is morally justi able in terms o
processes and resultsPleasure dueto the results
Feeling pleasure or one’s own work, since it develops theworker’s potential and helps achieve own goals
Autonomy Be capable o using one’s own capabilities and judgement insolving problems and in taking decisions regarding one’s ownwork
Recognition Do work that corresponds to one’s own capabilities, the resultso which are recognised and the salary is suitablePositive relationships Do work that allows having interesting contacts and positive
relationships
Source: Morin, 2004
The results o the Fifh European Working Conditions Survey ( Box 23 ) show that while “only asmall proportion o workers su er rom the absence o a eeling o work well done or doing use-
ul work, there are substantial di erences between sectors. (…) Around 9% o workers reportthat their work ‘always’ or ‘most o the time’ involves carrying out tasks that con ict with theirpersonal values. The variation between sectors is not large, but value con icts appear to be mostprevalent in construction and least prevalent in industry and education” (Euro ound, 2012:56).
Box 23. Your job involves tasks that are in con ict with your personal values
EU 27 Always or most o the time Sometimes Rarely or never
High-skilled clerical 9.1% 13.9% 77.0%Low-skilled clerical 9.1% 12.1% 78.7%High-skilled manual 10.0% 7.9% 82.1%Low-skilled manual 8.6% 8.1% 83.3%
Total 9.2% 11.1% 79.7%
Source: Euro ound data base, 2013

7/27/2019 kina25943enc_0
http://slidepdf.com/reader/full/kina25943enc0 40/112
38ADULT AND CONTINUING EDUCATION IN EUROPE
d. Bene ts
Work conditions, timing and rhythms (including the possibility o dedicating the necessary timeto re ection on work and care o relationships), hygiene and health conditions (noise, physicalrisk, etc.) and respect or diversity (age, gender, physical and cultural characteristics) are all
actors that determine the quality o the workplace as a learning environment.
The degree o satis action with respect to work conditions is signi cant as it is indicative o the suitability o the workplace as a space in which to learn Box 24 .
Box 24. Satis action with working conditions over time, by occupation, EU27 %
Source: Euro ound, 2012
The Fifh European Working Conditions Survey shows how “the di erences in satis action with
working conditions or di erent groups o workers are largely in line with the di erences orintrinsic rewards and positive elements o the job. The same groups o workers who commonlyreport high levels o intrinsic rewards and positive job elements ofen also have high levels o satis action with working conditions” Euro ound, 2012:86 .
e. Employment contract
The type o employment contract is considered by research to be one o the undamental instru-ments that in uences and can oresee and regulate all or some o the actors considered above.It can provide an incentive or pro essional growth, linking salary improvements to the skills an
individual can contribute to an organisation, or, on the other hand, link them to seniority. Fur-thermore, the relationship between types o employment contract and propensity or trainingis a subject or research. A widespread concern with the recent di usion o exible employmentpractices, such as temporary labour contracts, is that these contracts may be detrimental toeconomic per ormance because temporary workers are less likely to be trained ( Box 25 ).
M a n a
g e r s
P r o f e s
s i o n a l s
C l e r i c a l s u p p
o r t
w o r k e r
s S e
r v i c e
a n s s
a l e s w o
r k e r s
S k i l l e d
a g r i c u l t u r
a l w o
r k e r s
C r a a n
d r e l a t e
d
t r a d e
s w o r k e r
s
P l a n t a
n d m a c h i n e
o p e r a
t o r s
E l e m e n t a r
y
o c c u p
a t i o n s
T e c h n
i c i a n s a
n d
a s s o c i a t e
p r o f e
s s i o n a l s
0 %
10 %
20 %
30 %
40 %
50 %
60 %
70 %
80 %
90 %
100 %201020052000

7/27/2019 kina25943enc_0
http://slidepdf.com/reader/full/kina25943enc0 41/112
39WORKPLACE LEARNING
Box 25. Type o employment contract, by age group %
Agegroup
Inde nitecontract
Fixed-termcontract
Temporaryagency contract
Apprenticeship orother training scheme
Nocontract Other
Under 25 50 26 4 9 10 225–34 76 17 2 1 4 135–44 85 9 1 0* 4 145–54 87 7 0 0* 4 155+ 85 8 1 0* 6 1Total 80 12 1 1 5 1
*Too small to be measured.
Source: Euro ound, 2012
As ar as ormal adult education – activity that leads to quali cation – is concerned, the resultso LLL2010 show the importance o employment contracts that allow workers to dedicate timeto study ( Box 26 ). According to LLL2010, “in almost all countries inactive persons have a muchhigher chance or participating in ormal learning than regularly employed (either ull- time orpart-time) or unemployed persons. Among the unemployed this is only the case in the Wallonianpart o Belgium, in Spain and in Finland. On the other hand, LM ( labour market ) status seems tomake no signi cant di erence to participation in Estonia, the Netherlands, Norway and the UK,meaning that unemployed or inactive persons have the same chance o participation in ormaladult education as those with a regular job. Working part-time seems to be a supporting actor
or participation o employed individuals in ormal adult education in Austria, Germany, Denmark,Finland, Ireland and Sweden, meaning that part-time workers have a greater chance or partici-pation in these countries than ull-time workers. We conclude that ‘ ormal adult education’ and‘labour market status’ are both interrelated and dynamic during the period o participation in
ormal adult education. Individual participants may combine work and study di erently duringthe various periods o their programmes, but not completely at will” (LLL2010:113).
Box 26. Types o patterns o relationships between labour market activity,part time work and participation in ormal adult education
Efect o labour Pattern market activity
Pattern type Unemployed Inactive Part-time work Associated countries1 Ø Ø Ø Netherlands, Norway, UK-England,
Wales &N.I., Estonia2 Ø + + Austria, Germany, Denmark, Ireland3 + + + Finland, Sweden
4 Ø + ØBelgium-Flanders, Bulgaria, Cyprus,Czech Republic, Greece, Lithuania,Portugal, Slovakia, Slovenia, Scotland
5 + + Ø Belgium-Brussels/Wallonia, Spain
Ø no signi cant relationship; + signi cant positive relationshipSource: LLL2010 calculations based on AES 2007
The potential or learning in the workplace is the result o the ways in which the ve actorsare combined and the e ects they have with respect to the various conditions.

7/27/2019 kina25943enc_0
http://slidepdf.com/reader/full/kina25943enc0 42/112
40ADULT AND CONTINUING EDUCATION IN EUROPE
3.3. Structuring the management o workplacelearning potential
Increase in the supply o skills avail-able to EU countries depends, in themain, on workplace training potential.That is where “we spend (…) more than
thirty years o our lives” (Cede op, 2011:17) and that is where general knowledge, whereveracquired, can be trans ormed into activities which contribute to economic growth and wellbe-ing. Structuring the management o workplace training potential means increasing the con-scious intentional management o the training processes that generate learning, hence the
undamental knowledge or both organisations and individuals. This depends on the policies acompany adopts with respect to the actors responsible or the growth o training potential, as
discussed above. That is where the actions that avour sel -directed learning come rom: train-ing through participation in productive processes rich in knowledge content, training throughassimilation o knowledge already existing inside or outside the workplace. Structuring themanagement o these processes requires much more rom companies than the creation o academies, company universities or training centres.
The Continuing Vocational Training Survey (CVTS) provides valuable in ormation on trainingpolicies, processes and in rastructures in enterprises. The survey covers key components o training agendas in enterprises (e.g. training plan, speci c budget, assessment o skills needs),organisation (e.g. the existence o a training department or team, collective agreements cover-ing training issues and quality approaches e.g. evaluation o training provided . The resultso the CVTS tell us that in 2005 (and also in 2010) a signi cant proportion o companies inEU countries had some orm o organisation or managing a ew types o training process.
The existence and unctioning o a system or growing a company’s training potential restsmainly on the capability o leaders to develop their colleagues. The boss is a coach responsible
or the learning potential o a workplace, where he per orms – or should per orm – continuousmentoring unctions. “The fh EWCS taps into di erent aspects o leadership behaviour. The
ndings are generally positive:
• 95% of employees a rm that their immediate manager respects them as a person;
• over 80% say that their manager provides help and support, is good at resolvingcon icts, and in planning and organising the work;
• 78% of workers report receiving feedback. However, less than 70% report beingencouraged to take part in important decisions.
The importance o leadership or the well-being o workers is demonstrated by the nding thatemployees who evaluate their manager positively are almost twice as likely to report being satis edwith their working conditions as those who evaluate their boss negatively” (Euro ound, 2012:56).
There are two challenges. The rst concerns the development o managers’ capability to drivethe on-going knowledge production processes o their colleagues (Box 27 ). The initial train-ing given them by public and private universities should develop this type o skill, essential inexercising leadership.
Each company has its more or less structuredtraining system. Its e ectiveness depends onthe learning culture o its leaders
7/27/2019 kina25943enc_0
http://slidepdf.com/reader/full/kina25943enc0 43/112
41WORKPLACE LEARNING
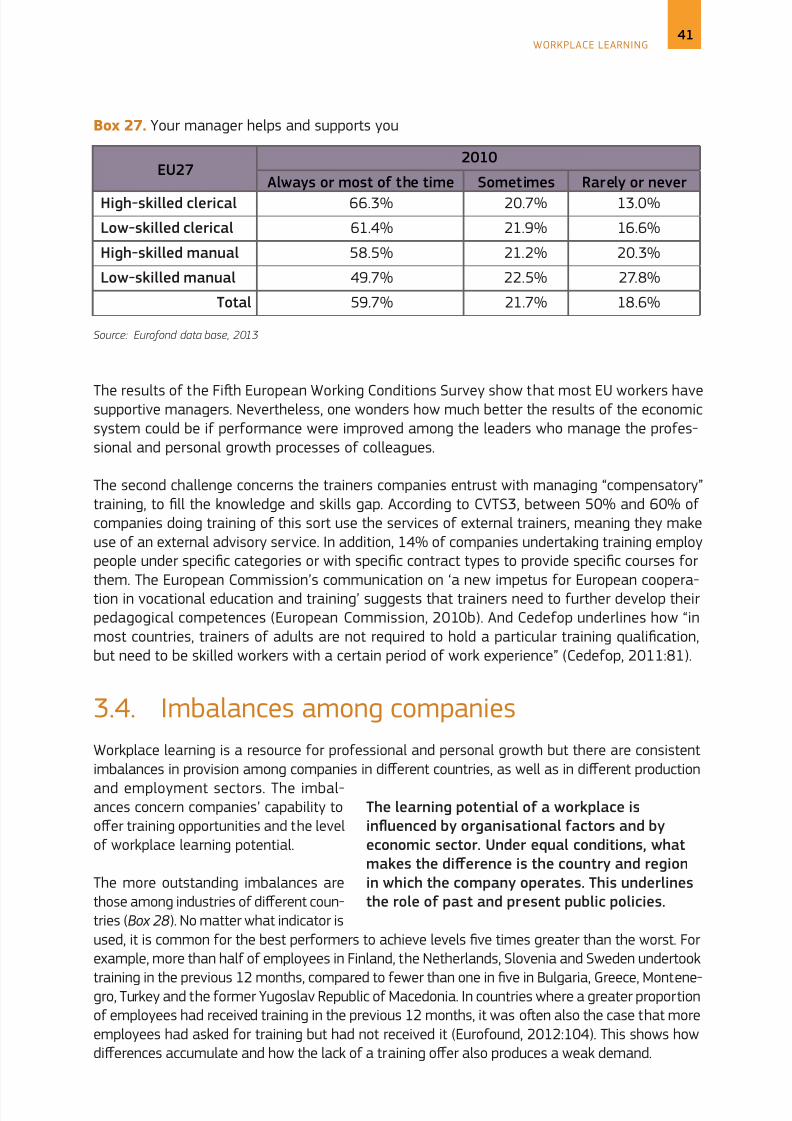
Box 27. Your manager helps and supports you
EU272010
Always or most o the time Sometimes Rarely or never High-skilled clerical 66.3% 20.7% 13.0%Low-skilled clerical 61.4% 21.9% 16.6%High-skilled manual 58.5% 21.2% 20.3%Low-skilled manual 49.7% 22.5% 27.8%
Total 59.7% 21.7% 18.6%
Source: Euro ond data base, 2013
The results o the Fifh European Working Conditions Survey show that most EU workers havesupportive managers. Nevertheless, one wonders how much better the results o the economicsystem could be i per ormance were improved among the leaders who manage the pro essional and personal growth processes o colleagues.
The second challenge concerns the trainers companies entrust with managing “compensatory”training, to ll the knowledge and skills gap. According to CVTS3, between 50% and 60% o companies doing training o this sort use the services o external trainers, meaning they makeuse o an external advisory service. In addition, 14% o companies undertaking training employpeople under speci c categories or with speci c contract types to provide speci c courses orthem. The European Commission’s communication on ‘a new impetus or European cooperation in vocational education and training’ suggests that trainers need to urther develop theirpedagogical competences (European Commission, 2010b). And Cede op underlines how “inmost countries, trainers o adults are not required to hold a particular training quali cation,but need to be skilled workers with a certain period o work experience” Cede op, 2011:81 .
3.4. Imbalances among companiesWorkplace learning is a resource or pro essional and personal growth but there are consistentimbalances in provision among companies in di erent countries, as well as in di erent productionand employment sectors. The imbal-ances concern companies’ capability too er training opportunities and the levelo workplace learning potential.
The more outstanding imbalances arethose among industries o di erent coun-tries ( Box 28 ). No matter what indicator isused, it is common or the best per ormers to achieve levels ve times greater than the worst. Forexample, more than hal o employees in Finland, the Netherlands, Slovenia and Sweden undertook
training in the previous 12 months, compared to ewer than one in ve in Bulgaria, Greece, Montene-gro, Turkey and the ormer Yugoslav Republic o Macedonia. In countries where a greater proportiono employees had received training in the previous 12 months, it was ofen also the case that moreemployees had asked or training but had not received it (Euro ound, 2012:104). This shows howdi erences accumulate and how the lack o a training o er also produces a weak demand.
The learning potential o a workplace isinfuenced by organisational actors and byeconomic sector. Under equal conditions, whatmakes the di erence is the country and regionin which the company operates. This underlinesthe role o past and present public policies.

7/27/2019 kina25943enc_0
http://slidepdf.com/reader/full/kina25943enc0 44/112
42ADULT AND CONTINUING EDUCATION IN EUROPE
Box 28. Employer paid training requested and provided, by country %
Source: Euro ound 2012
“Even when controlling or observable individual characteristics, country e ects account oralmost 1/2 o the explained variation in training participation. In act, di erences associatedwith country o residence remain, ceteris paribus, larger than di erences associated withindustry, occupation, education, age and rm size. Other actors, thus, concur in explaining thedi erence across countries” Bassanini, 2005:77 78 .
A urther reason or the imbalance concerns companies’ learning potential. We have seen howthe level o training o ered by companies varies according to their economic sector Box 29 .“Employer-paid and on-the-job training are most common or employees working in the health,education, public administration and de ence, and nancial services sectors. These sectors arealso the ones with the biggest proportions o workers (15%–20%) reporting that they need
urther training to cope well with the duties their job entails. The EWCS training indicators onemployer-paid training and on-the-job training are associated with each other, meaning that anemployee who participates in one will probably also receive the other” (Euro ound, 2012:103).
The relevance o company size to employers’ training capability must also be borne in mind.“Large rms train more than small ones. This is not surprising or several reasons: i) the collec-tion o in ormation, the de nition o a training plan and the establishment o a training acilityinvolve xed costs and scale economies; ii) small rms might nd more di cult to replace aworker who temporarily leaves or training; and iii) small rms might have ewer opportunitiesto ully reap the bene ts o training through internal reallocation o workers. … large rmsare relatively similar across countries as regards training, and the di erence in training ratesacross countries is mostly due to the behaviour o small rms as well as to the distribution o
rm size within countries”. Bassaniniet al , 2005:65 66 .
Acknowledging the di erences, we must understand to what extent the distances betweeneconomic sectors depend on the di erent need or investment in knowledge. Not all compa
nies have the same level o training demand. It is a matter o understanding what, given thesector and size o a company, is the best level o investment. It would be use ul then to knowand evaluate the di erences between companies in the same sector. This would allow us tosee any imbalances due to actors o another nature – actors which could, potentially, beobviated by training policies.
60 %
50 %
40 %
30 %
20 %
10 %
0 % F I N L S I S E U K C Z N O I E D K A T B E E E S K L U P L D E M T
E U 2 7 E S P T C Y L V H U I T F R L T R O A L X K H R E L M K M O T R B G
asked for training but did not get itemployer-paid training

7/27/2019 kina25943enc_0
http://slidepdf.com/reader/full/kina25943enc0 45/112
43WORKPLACE LEARNING
Box 29. Participation in employer paid training and on the job training, by sector, EU27 %
Source: Euro ound, 2012
3.5. Imbalances among workersImbalances among companies inevi-tably a ect workers who, dependingon the employment sector, will havevarying opportunities or pro essionalgrowth.
Imbalances among workers are linkedto the type o work carried out and to the potential or training associated with that role, inaddition to or in contrast with what is generally present in the workplace.
The learning potential o various jobs can be classi ed according to the time a worker candevote to re ect, the mode o cognition he/she is able to use and the types o processes he/she is involved in. Every job can combine various types o these modes o learning. Yet only
the types o work that o er meta-cognitive opportunities or engagement and re ective typeso cognition provide the most avourable growth conditions Erautet al ., 2007:20 .
on-the-job trainingemployer-paid training
0 % 10 % 20 % 30 % 40 % 50 % 60 %
Agriculture
Industry
Construction
Wholesale, retail, foodand accommodation
Transport
Financial services
Public administrationand defence
Education
Health
Other services
Each job has its potential, determined by theprocesses a person is involved in and by thetimes that can be dedicated to refection anddecision-taking. Di erences between workersare important and are particularly un avourable
or the low skilled.

7/27/2019 kina25943enc_0
http://slidepdf.com/reader/full/kina25943enc0 46/112
44ADULT AND CONTINUING EDUCATION IN EUROPE
Box 30. Interactions between time, mode o cognition and type o process
Type o ProcessMode o Cognition
Instant/Refex Rapid/Intuitive Deliberative/Analytic
Assessmento the situation
Patternrecognition
Rapid interpretationCommunication onthe spot
Prolonged diagnosisReview, discussion andanalysis
Decision making Instantresponse
Recognition primedor intuitive
Deliberative analysis ordiscussion
Overt actions Routinisedactions
Routines punctuatedby rapid decisions
Planned actions withperiodic progress reviews
Metacognitiveengagement
Situationalawareness
Implicit monitoringShort, reactiveRe ections
Monitoring o thought andactivity, re ective learningGroup evaluation
Research on the distribution o complex problem-solving skills (CPS) con rms that those skillsare directly related to the type o occupation a person has and, thus,di erent occupationsare associated with di erent learning opportunities Box 31 : LLLIGHT, 2013 .
Box 31. Complex problem solving by occupation at a large automotive company
The complex problem solving is a measure o the capacity to e ec tively solve problems in dynamic environments’, wheresome o the environments’ regularities can only be revealed by success ul exploration and integration o the in ormationgained in that process (Fischer, Grei and Funke 2012, Funke 2009, Grei 2012)
Source: LLLIGHT, 2013
For public policies on adult and continuing education, the task is to identi y those inequalities
that can be addressed with educational interventions inspired by principles o equity.The imbalances that derive rom the characteristics o workplaces or that are a consequenceo an inequitable distribution o opportunities accumulated during a li etime are more di cultto remove with training. It isn’t impossible but it requires highly personalised interventions ,
120
100
80
60
40
20
0
C P S
s k i l l
Cra sman Engineer Maintenancer Operator Master Technician

7/27/2019 kina25943enc_0
http://slidepdf.com/reader/full/kina25943enc0 47/112
45WORKPLACE LEARNING
which can prove costly. In addition, such interventions are limited in impact, a ecting approxi-mately 2% o low skilled people aged between 25 and 65 (Beblavy et al ., 2012:29). There ore,the impact is less signifcant than the annual increase in the number o young peoplewho become adults without an adequate level o literacy skills (PISA 2009 data showthat 17.7% o 15 year olds are low achievers in reading .
On the other hand, as the data in the preceding tables (Boxes 21, 22, 24, 27 and 28 ) show,low-skilled workers and manual workers generally tend to get ewer benefts romstructured training and rom each o the actors that determine workplace training potential.For public policy, the challenge is two old. It is a matter o rein orcing the possibilities o acquir-ing new quali cations as an adult and, at the same time, reducing the number o low skilledyoung people. Education and training are complementary, learning begets learning. The PISA2009 data are unequivocal ( Box 32 ). The countries with the highest number o high-per orming15 year olds are also those with higher workplace training per ormance.
Box 32. Low per ormers in reading literacy 2000 2009
Source : European Commission (2011b), based on OECD and PISA data. Countries in the lower le quadrant have above EU benchmark level per ormance (low share o low achievers) and have been success ul in reducing this share urther in the past, while countries in the upper right quadrant have below EU benchmark per ormance and have not beensuccess ul in reducing this share in the past.
In addition, the e ects o skills demand expressed by the labour market must be taken intoconsideration since, even where demand does not direct the behaviour o people, it never-theless has the power to predict the skills that will be cultivated in work and those that willbecome obsolete due to lack o use (Box 33 ). Analysing the past decade, “what we would
LT
BE
BG
CZ
DK DE
EE
IE
EL
ESFR
IT
LV
LU
HU
AT
PL PT
RO
SI
SK
FI
NL SE
UK
TR
IS
EU27
NO
-10
-5
0
5
10
15
0 10 20 30 40 50
Performance(Students with low levels of reading literacy in PISA (Level 1 and below), %, 2009)
P r o g r e s s
( c o m p o u n d a n n u a l g r o w
t h r a t e
0 0 - 0
9 , %
)
EU Member States non-EU countries
2020 benchmark(<15%)
2010 benchmark(<17%)

7/27/2019 kina25943enc_0
http://slidepdf.com/reader/full/kina25943enc0 48/112
46ADULT AND CONTINUING EDUCATION IN EUROPE
normally expect is that demand or workers rises as the skill content o these occupationsincreases in a linear ashion. The picture is instead U-shaped, as predicted by job polarisa-tion, and it is the result o an approximately 20% increase in the demand or low skilled andhigh-pro le occupations between 2000 and 2010 and a 4.5% decrease in the demand ormiddle skilled occupations” Maselli, 2012:23 .
Box 33. Job Polarisation in EU27, 2000 2010
Source: NeuJob elaboration o Eurostat – Labour Force Survey data
This situation can lead to a mismatch between the skills o er and demands o the workplace(Box 34 ). “There is a trend towards polarisation on the labour demand side with respect tooccupations in most European countries, whereas on the supply side, the trend is towards alinear upskilling o the population. Depending on the speed o these changes and on the skillcontent o current demand and supply, there is a risk that in some countries a skill mismatchproblem will arise. More speci cally, there is a risk o vertical mismatch, meaning that thereis no correspondence between the ormal quali cation demanded by a certain job and thequali cation o the worker. … The vertical mismatch can be o two types: over quali cationor un lled demand” Maselli, 2012:26 .
Box 34. Demand and Supply o Work with Respect to Skills/Tasks in the EU27, 2010 2020
Source: Maselli, NeuJobs elaboration o Eurostat – Labour Force Survey data
Low-Skilled Medium-Skilled High-Skilled
10
5
0
5
10
15
20
25
30
% c h a
n g e
Low-Skilled Medium-Skilled High-Skilled
% c h
a n g e
-40
-30
-20
-10
0
10
20
30
40
Supply (ISCED) Demand (ISCO)

7/27/2019 kina25943enc_0
http://slidepdf.com/reader/full/kina25943enc0 49/112
47WORKPLACE LEARNING
This situation could result in three types o dynamic:
a. The low skilled demand justi es maintaining part o the population in sucheducational conditions, increasing i necessary the development o a noncognitive type o skills requested by some service industry roles. Only in a ewcountries, such as Italy, Greece and Denmark, are there too many low skilledworkers with respect to uture requests rom the labour market;
b. The under employment and, hence, likely dispersion o medium skilled workers,or that part o them whose skills are not upgraded. “This category risks losingthe most rom the uture potential equilibrium, especially in Germany, Austria,Hungary, Slovakia, Slovenia, the UK and the Baltic states” Maselli, 2012:30
c. The substantial maintenance o the current level o high skilled workers.
3.6. The role o companies in worker upskillingThe role o companies in developingskills and, in particular, quali cationso workers, goes beyond the o er o aworkplace rich in learning potential. TheLLL2010 survey identi ed, or example, particular actions that companies can undertake to sup-port participation in ormal adult education. These measures “can be classi ed into two categories:
1. Supporting individual participation decisions : here the company is not the‘ rst mover’, but provides support or the participant in the orm o motivation,career incentives, or even through the direct or indirect provision o time ormonetary resources.
2. Initiation by the enterprise itsel : i the company acts pro active, all themeasures used to support individual participants may be supplemented by moreinstitutionalised, company wide measures geared towards supporting individualsor even whole groups o employees, ranging rom e.g. career agreementsover project speci c participation plans or entire groups o employees to theestablishment o ormal programmes on a permanent basis” LLL2010: 169 .
We must also acknowledge the role that companies can play in supporting low skilled workers through “the approach centred on embedded learning, which aims to build learning pathways both structured and incidental, while at work (…). In its method o developing spe-ci c competences ( ne tuning), this approach consists o organising activities carried outin the workplace or elsewhere, in order to accelerate the learning o the interested adult.The most signi cant element is that this approach tends to bring into central ocus what isgoing to be learnt in the workplace (…) in an in ormal way. It is there ore a model in whichthe education and training potential present in a speci c social or pro essional activity (the
manu acturing o yogurt, the production o animal eed is used or the personal and pro essional development o low skilled adults. It is an approach which, or those with a low levelo education, is carried out through close cooperation between government, company andother agencies, including one which also provides certi cation and pro essional quali cations”
Federighiet al ., or DGEAC: 10 11 .
Public policies can have contradictory e ects.They must intervene only when the role o public institutions cannot be substituted.

7/27/2019 kina25943enc_0
http://slidepdf.com/reader/full/kina25943enc0 50/112
48ADULT AND CONTINUING EDUCATION IN EUROPE
Nevertheless, there are limits to the e ectiveness o learning policies in the workplace. Learn-ing can have an impact on only some elements o human potential Box 35 : LLLIGHT, 2013 .
Box 35. Human capital development potential
Element o human capital De nition Source Potential
to changePotential
to dissociate
Cognitiveability
Genetic/neural structuresprede ning e ectivenesso learning
Innate Fixed Nontrans erable
MotivationPsychological eatureprede ning willingnessto learn
Innate Quasi xed Nontrans erable
Personality Psychological eatureprede ning propensity todeveloping certain skills
Innate Quasi xed Nontrans erable
Knowledge
Theoretical principle basedschematic structurescontaining actualin ormation or conceptual
rameworks about processes,procedures and relationships
Acquired Changeable/learnable Trans erable
Skills
An ability and capacity
acquired through deliberateand sustained e ort touse acquired knowledge inpractice or carrying outactivities or job unctions
Acquired Changeable/trainable Trans erable
Source: Tamilina, 2012
Cognitive ability, motivation, personality are elements o human capital di cult to change andto trans er trough education and training.
3.7. The role o public policiesPublic policies or adult and continuing education can positively in uence the actors whichare the basis o workplace learning potential ( rom labour contracts to career development,work conditions, supporting innovation and access to out-o -the-job training). However, it isstill a problematic eld o intervention. “Public policies on adult learning and company trainingactions may serve contradictory goals” Cede op, 2011:9 .
Public policies do not always have a positive impact on equity in the growth o skills supply.The challenge is two old. First, “training is not a very good redistributive instrument since itsreturns to disadvantaged workers are not particularly high. Second, rms are concerned withpro tability and may pay little attention to the need o compensating disadvantaged individu-als, even in the presence o subsidies” Bassaniniet al ., 2005:146 .

7/27/2019 kina25943enc_0
http://slidepdf.com/reader/full/kina25943enc0 51/112
49WORKPLACE LEARNING
Research on the impact o public policies remains rare and, where it is conducted, is more ofendirected at describing goals or investments rather than the e ects they produce. Evaluations,though partial, show the shortcomings o all the measures adopted up to today, includingmore recent ones belonging to the model o the “government sponsored co- nanced schemes”,o ering nancial support to individuals and rms (levy/grant schemes, train or pay and taxdeduction systems or rms or subsides, vouchers, individual learning accounts, grants romspeci c unds, etc. or individuals .
These nancial measures have little impact on the more signi cant aspects o workplace learn-ing processes. Indeed, such policies can have negative consequences, encouraging companiesin need o nancing to increase investments in more standardised and less e ective orms o training the ones usually nanced by public policies .
The shortage o research on the impact o public policies or workplace training makes any
conclusion problematic. In view o the data and trends examined, we can say that in order toavoid unexpected e ects, public policies should avoid standardised interventions and inter-vene on speci c emergencies in their own speci c productive sectors. The aim should betoconcentrate resources on the training needs relevant to companies and individuals,in those cases where, without public intervention, there would be no action .

7/27/2019 kina25943enc_0
http://slidepdf.com/reader/full/kina25943enc0 52/112

7/27/2019 kina25943enc_0
http://slidepdf.com/reader/full/kina25943enc0 53/112
4.Management
o trainingprocessesthat generateinnovation

7/27/2019 kina25943enc_0
http://slidepdf.com/reader/full/kina25943enc0 54/112
52ADULT AND CONTINUING EDUCATION IN EUROPE
4.1. Innovation is the result o internallearning processes
The dynamics o innovation, and theirimpact on both economy and society,cannot be understood simply in terms o the application o research. Innovation isthe joint product o processes o externalknowledge absorption originating with
customers, competitors, and providers and o processes o knowledge creation developed withinorganisations. The learning potential o the places in which we live and work is what allows indi-viduals and groups to participate in learning action that avours the production o new knowledge.
Nevertheless, not all types o training carry the same weight with regard to innovation. Thegreatest impact derives rom learning that makes pre-existing knowledge obsolete, thus creat-ing a competitive advantage or the organisations that have the new knowledge.
Such learning is not characterised by the transmission o knowledge that is already encoded, but by cre-ating new knowledge through pro essional work. This is possible within high-per ormance workplaceswhere there are various “drivers o innovation” ( Box 36 ). Through learning- ocused management o networking policies, relationships with customers and suppliers, rewarding and de ning job descriptionsand their knowledge contents, and so on, it is possible to increase the ability o individuals to innovate.
Innovation-orientated learning actions – that have a direct impact on the growth o capacitieso organisations and individuals to be innovative – are the primary object o public and privatepolicies or adult and continuing education in supporting innovation.
Box 36. Drivers o innovation
Source: Euro ound, 2012b:14
High performance workpractices
Training and personaldevelopment
Teamwork/autonomyJob design
Knowledge-sharing,communication and
employee involvementRewards and performance
managementFlexible working practices
and contractsRecruitment and selectionHealth and safety advice
and support
Internal facilitating conditionsEmployee support
Social dialogue and industrial relations systemOrganisational culture
LeadershipOrganisational change orientation
Product/service
innovation
Drivers of innovation
National innovationcontext
Education/researchinfrastructure
Public policy workincluding innovationinitiatives/programmes
(innovation) networks
Business context
TechnologyCustomer demandCompetitor trends
Exposure to globalisation
Organisational context
SizeSector
Organisational structureand governanceR&D investment
Use of ICTOrganisational strategy
Labour market
Bottom lineoutcomes
Service qualityComplaints/rework
EfficiencyProductivity
Gross value added(GVA)
Prot marginMarket share
Increased turnoverEmployment levels
Processinnovation
Employee outcomes
Job satisfactionLabour turnover and
absence
Enhanced motivationWell-being indicatorssuch as job strain and
work–life balanceControl over pace/volume/work tasks
Discipline andgrievance cases
Organisationstructure
innovation
Behavioural outcomes
Increased number of suggestions
Increased exibility
Increased knowledge-sharing and idea
generationAttitudes to risk and
failureWillingness to experimentand engage with change
Organisationalcommitment
Organisational citizenshipbehaviours including
motivation andengagement
Marketinnovation
Innovation is, rst o all, the result o processeso knowledge production inside workplaces.Workplace learning increases the workers’ abilityto innovate. That is what generates innovationand makes its external absorption possible.

7/27/2019 kina25943enc_0
http://slidepdf.com/reader/full/kina25943enc0 55/112
53MANAGEMENT OF TRAINING PROCESSES THAT GENERATE INNOVATION
The potential to create innovation through the workplace depends, in the frst place,on the content o productive work carried out by the frm (Box 37 ). Research distin-guishes between organisations according to their type:
a Lead innovators strategic and intermittent : or these rms, creative in houseinnovative activities orm an important part o company strategy. All rms haveintroduced at least one product or process innovation, developed, at least partly,in house, per orm R&D at least on an occasional basis and have introduced anew to market innovation. These rms are also likely sources o innovations lateradopted or imitated by other rms;
b) Technology modi ers: these rms primarily innovate by modi ying technologydeveloped by other rms or institutions. None o them per orms R&D on either anoccasional or continuous basis. Many rms that are essentially process innovators,
innovating through in-house production engineering, all within this group;
c Technology adopters: these rms do not develop innovations in house, with allinnovations acquired rom external sources. An example is the purchase o newproduction machinery … ;
d Non innovators OECD, 2010:51 58 .
Box 37. A Typology o Innovation Modes or EU Member Nations
Percentage o all rms by country in each innovation mode
Strategic Intermittent Technologymodi ers
Technologyadopters
Non -innovators Total
BelgiumDenmarkGermanyGreeceItalySpainFranceLuxembourgNetherlandsPortugalUKFinlandSwedenAustria
75
1046287834
13118
131415
912
612171415
7191412
161125
515
510201616
5101420
141411104
191148
1316
389
5056397264675952555468555351
100100100100100100100100100100100100100100
Note: “strategic” and “intermittent” modes are internal distinctions o the lead innovator category Arundel et al 2007:19
In all countries, with the exception o Germany, more than hal o all rms all within the cat-egory o “non-innovators”. This means that people employed in these rms have little opportu-nity to develop their innovative ability. This does not mean workers do no work with innovative

7/27/2019 kina25943enc_0
http://slidepdf.com/reader/full/kina25943enc0 56/112
54ADULT AND CONTINUING EDUCATION IN EUROPE
content. In act, wherever you look in Europe, the percentage o employees whose pro essionalwork involves them in resolving unexpected problems is greater than 63% ( Box 38 ). However,it must be acknowledged that in the organisations where the models are more avourable todeveloping innovative processes, access “to the organisation’s critical resources and knowledge... sets the basis o a (…) contract between the employer and the employees” (OECD, 2012:12).
Box 38. Does your work involve solving un oreseen problems on your own?
Source o Data: Euro ound, 2013
Access to the possibility o producing what has not been thought o be ore is itsel subjectto distributive rules adopted by the organisation and to the intensity with which they arepromoted. It depends on the organisational model and practices, which, in general, determinean organisation’s learning potential. InBox 37 we show the organisational work that, usingpeople management, creates work contexts avourable to innovation. Each o the actionsconsidered by the survey, and by other research OECD, Euro ound, Cede op , is important inorder to support and develop individuals’ ability to innovate.
4.2. Organisational models that avour innovationability and innovation orientated training
Organisational models that avourgrowth in the ability to innovate standout rom the others because they
adopt a learning model (called “discre-tionary”) in which the expertise o indi-vidual pro essionals is characterised by
high levels o autonomy at work, learning and problem solving, task complexity, sel -assessmento quality o work and, to a lesser extent, autonomous teamwork (OECD, 2010; Cede op, 2012).
100 %
88 %
75 %
63 %
50 % B E
B G C
Z D K
D E
E E
E L
E S
F R I E I T
C Y
L V L
T L U
H U
M T
N L
A T
P L
P T
R O S
I S K F
I S E
U K
H R
M K
T R
N O A
L X K
M E
E C 1 2
E U 1 5
E U 2 7
100 %
Innovation ability develops in companies thatadopt organisational models which encourage
orms o innovation-orientated training. This is
made possible by rein orcing networks o dynamiclearning, inside and outside the company.

7/27/2019 kina25943enc_0
http://slidepdf.com/reader/full/kina25943enc0 57/112
55MANAGEMENT OF TRAINING PROCESSES THAT GENERATE INNOVATION
This type o organisation – more than any other model (such as lean production, Taylorist or“traditional”) – is capable o increasing the number o “lead innovators” ( Box 39 ).
Adult and continuing education policies which support innovation will avour the implementa-tion o discretionary learning models.
Box 39. Relation between discretionary learning and percentage o lead innovators
Source: OECD, 2010:53
I we consider the educational actors that encourage the presence o discretionary learningorganisations we nd “there is a slight correlation between tertiary educational attainment andthe discretionary learning type o work organisation, but, interestingly, the correlation betweenthe proportion o enterprises providing CVT or their employees and the discretionary learningtype o work organisation is stronger. (…) It cannot be argued that tertiary education does not
play a crucial role in developing more learning-intensive work organisations and innovativecapacity; however, given the di erences between the indicators o CVT provision and tertiaryeducation, the bottleneck seems to be not at the level o tertiary education but at the level o
rm speci c CVT” Cede op, 2012:38 .
One o the actors most correlated with the presence o discretionary learning organisations is rminvestment in vocational training (the percentage o rms that o er vocational training and thepercentage o participants in vocational training as a proportion o employees in all enterprises).
Training with a direct impact on innovation does not have the characteristics o
either ormal or in ormal education, but is mainly based on participation in activitywhich produces innovation . Analyses o training methods that have a more direct correlation with innovation suggest that neither internal nor external training is as signi cant a actoras participatory, on the job training. Results Box 40 demonstrate that “the reason why ‘anyother orms o training’ correlates most strongly with the innovation index might be explained
% Discretionary learning
% L e a d
i n n o v a t o r s
18 28 38 48 58 68
R2 = 0.44
30
25
20
15
10
5
GR
ES
UK
PT IT
BE FR
LUDE
FI
SE
ATDK
NL

7/27/2019 kina25943enc_0
http://slidepdf.com/reader/full/kina25943enc0 58/112
56ADULT AND CONTINUING EDUCATION IN EUROPE
by the act that it includes, to a large extent, learning at the workplace and is, there ore, morerm speci c” Cede op, 2012:42 .
Box 40. Summary innovation index 2006 and type o training and innovationindex 2005 CVTS3
INTERNAL CVT2005
EXTERNALCVT 2005
ANY OTHER FORMSOF TRAINING 2005
CORRELATION BETWEEN TYPE OFTRAINING AND INNOVATION INDEX
0.49 0.28 0.68
Source: MERIT, 2006; Eurostat, 2006. Quoted in Cede op, 2012
Innovation has the characteristic o being the product o participatory processes. “Participatory innovation is placed in opposition to traditional technocratic views o innovation as beingdriven by experts, ofen located in R&D departments and can be included in the category o ‘non R&D innovation’.” Euro ound, 2012:27 .
Training through participation in newly known production processes is achieved only becausethere exist jobs with high learning potential. This implies thatembedded learning is thetype most likely to generate innovation .
Embedded learning consists in incorporating learning into work specially constructed to encour-age the development o people through work and to accelerate the achievement o levelso excellence in their respective job positions. It is aimed at individuals as well as groups, inmoments that are distinct rom work activities, though closely intertwined.
Embedded learning which leads to innovation takes the orm o actions which support thespeci c cognitive processes already present in work activity, in the various phases o creatingsolutions, process management, evaluation o results and personal development, trans er o acquired knowledge to collaborators, and the urther growth o personal skills through, orexample, joining new teams.
Research considering embedded learning, or the purposes o developing innovation ability,attributes particular importance to two types o training: dynamic learning networks and errormanagement work.
Research on learning actions associated with dynamic learning networks attaches importanceto the role o rm-speci c devices (even shared by several organisations) that support theconstruction o learning partnerships or innovation. Research has examined various correlatedactivities. The most studied among these are the various orms o knowledge-brokering, inter-nal and external to rms. Internal brokering expands in proportion to rm size: the larger the
rm the greater the need to achieve, internally, opportunities or mutual learning and crossertilisation to support innovation (Hoegelet al ., 2001). External brokering concerns, rst o
all, training that accompanies the research and construction o orms o cooperative learningaimed at eeding the innovation processes o the cooperating organisations.
Research on training concerned with error management is, as one might expect, the mostdeveloped due to the unction that error correction and prevention can have with respect to

7/27/2019 kina25943enc_0
http://slidepdf.com/reader/full/kina25943enc0 59/112
57MANAGEMENT OF TRAINING PROCESSES THAT GENERATE INNOVATION
innovation o either product or process (OECD, 2010). Its rst elds o application were thesectors o airspace production, justice and health.
Error management has a crucial role in the acquisition and di erentiation o pro essionalknowledge (Bauer, 2008; Ericsson, 2006). Research has consistently considered the actorsuse ul in assessing the reliability o a system, evaluating potential damage generated by anerror, analysing its cause and the possibilities or prevention (Glendon, Clarke, McKenna, 2006).It was here that research in matters o ‘workplace learning’ began producing important contri-butions or identi ying types o learning devices and training activities that manage errors, asan important source o pro essional learning and innovation Bauer, 2008; Cseh, Watkins andMarsick, 2000; Ericsson, 2006). Applied research shows how training actions are developedin organisational contexts with strongly structured training policies and with the capability tomanage the plurality o types o training actions that usually accompany the use o errors asa source o learning and innovation.
4.3. National and regional policies concurwith context quality
The challenge or adult and continuing education policy is to concentrate interventions in a waythat encourages the spread o lead innovators and discretionary learning organisations. Thiscan only happen as the result o mani old policies – rom those concerned with labour orcedevelopment to those ocused on in rastructures and nance. Nevertheless, policies or train-ing in support o innovation must receive speci c attention to ensure they are not exclusivelyconcerned with the o er o skills, guaranteed or with standard policies or ormal training.
Comparative analysis (Box 40 ) shows how there is a close relationship between countries inwhich there exist discretionary learning organisations and the presence o lead innovators.“The our less technological developed southern nations are characterised by both low levels o enterprise continuing vocational training and low use o discretionary learning, while the moredeveloped northern and central European nations are characterised by relatively high levels o enterprise training and by high level use o the discretionary learning orms” (OECD, 2012:65).
This means that in countries where the presence o discretionary learning organisations isunder developed, interventions centred on innovation trans er are not very e ective investments in R&D, territorial innovation systems, increase in the number o graduates). What ismissing is a capability by potential bene ciaries to absorb these interventions. To be meaning-
ul, thesepolicies must be accompanied by measures that develop both the learningculture and the ability to innovate within organisations .

7/27/2019 kina25943enc_0
http://slidepdf.com/reader/full/kina25943enc0 60/112

7/27/2019 kina25943enc_0
http://slidepdf.com/reader/full/kina25943enc0 61/112
5.Markets andsystems o adult andcontinuingvocational andtraining: thegovernancechallenge

7/27/2019 kina25943enc_0
http://slidepdf.com/reader/full/kina25943enc0 62/112
60ADULT AND CONTINUING EDUCATION IN EUROPE
5.1. The weight o adult and continuing educationin markets
Adult and continuing education hasimportant market weight. Understandingand monitoring the progress o the train-ing industry is a precondition o e ectivegovernance o the assets that contribute
to the growth o a country’s skills supply. Some EU countries have placed the matter high on thepolicy agenda. The Social and Economic Council o the Netherlands, or example, accepts that thepost-initial training market will become increasingly important, convinced that, in the Netherlands,“the training market or working people must become more dynamic” ( Advies 2012/02).
Understanding the adult and continuing education market across the piece still poses methodo-logical di culties that are, as yet, unresolved by research. Nevertheless, the demand o economicactors has prompted several companies specialising in market studies (Key Note, Report Linker,Outsell and others) to construct overviews o the market. Training Industry’s Doug Harward statesthat: “the global market or training expenditures in 2011 was about $287 billion. We expect themarket to grow to about $292 billion in 2012. We believe North America represents about 45%o the global market ($130.5 billion) and Europe to be about 29%, or $82.7 billion o the globalmarket. Asia comes in at $28.1 billion (10%), India $20.7 billion (7%), Australia $8.7 billion (3%),South America $6.3 billion (2%), A rica $3.5 billion (1%), and the rest o the world $6.3 billion(2%). Approximately 75% o the global spend or training is in North America and Europe. Asiaand India, the two most populated regions in the world, combined make up about 17% o theglobal market” (Harward, 2012; on the same matter see also Silber et al ., 2012).
Data regarding individual European countries do not lend themselves to comparison, but it isevident that they tend towards greater volumes than those estimated. For example, a studycarried out nationally by the Social and Economic Council o the Netherlands (Rosenboom,Tieben, 2012) shows that in the post-initial training market there are about 19,000 trainingagencies at work Box 41 . O these, about 13,000 are reelancers. Furthermore, researchersestimate, their turnover or 2010 is €3.2 billion.
Box 41. The Dutch post initial training turnover: €3.2 billionOmzet per per-soneelsleden
categorie
< 200.000
euro
200.000– 500.000
euro
500.000 –1.000.000
euro
1 miljoen –5 miljoen
euro
5 miljoen –10 miljoen
euro
10 miljoen –20 miljoen
euro
20 miljoen –50 miljoen
euro
> 50 miljoen
euro
Aantalresp.
Totale omzetper personcat
Omzet perbedrij
Populatie Aantal bedrijven* omzet per
bedrij ZZP ers 127 11 3 1 0 0 0 0 142 9.595.526 67.574 15.137 1.022.867.6382 tot 10 35 8 4 2 0 0 0 0 49 7.555.975 154.204 3.125 481.887.50010 tot 50 3 2 2 1 2 0 0 0 10 12.567.655 1.256.766 4 80 6 03. 247. 68 0
Meer dan 50 0 0 1 1 0 1 1 0 4 31.500.000 7.875.000 136 1.071.000.000Totaal 165 21 10 5 2 1 1 0 205 61.219.156 298.630 18.878 3.179.002.818
Note: Companies in the range of 50-100 employees, from 100 to 500 and over 500 employees are included in the over-50 category
Source: Rosenboom, Tieben, 2012:10
As ar as the UK is concerned, Key Note (2012) argues that training “is one o the largest and most
in uential industries in the country. It is one o the sectors that truly drives the economy and overthe past ew years it has mirrored the expansion and contraction o the UK economy. (…) Afertwo years o continuous decline in the market value o o -the-job training, a slight increase wasobserved in 2010/2011, with value rising to £19.5 billion; although this is still considerably lessthan the £21 billion reported in 2007/2008, be ore the recession took a hold o the UK economy.
It is necessary to make local, national andEuropean training markets more dynamic andaccessible. They are indispensable in increasingthe skills supply in Europe

7/27/2019 kina25943enc_0
http://slidepdf.com/reader/full/kina25943enc0 63/112
61MARKETS AND SYSTEMS OF ADULT AND CONTINUING VOCATIONAL AND TRAINING: THE GOVERNANCE CHALLENGE
It should be noted, however, that training in the public sector has seen some signi cant cut backsin recent years and this is expected to continue in the near uture” (Key Note, 2012).
The data provided re er to the monetary mass moved by adult and continuing education (estimatedthrough di erent methods). Nevertheless, to identi y the volume o investments by companies andpeople, indirect and opportunity costs should also be considered. The ormer are little documented.Labour costs, or example – or employer-sponsored non- ormal education only ( Box 42 ) – repre-sent 0.4% o GDP in those OECD countries or which in ormation is available (OECD, 2012:408).
Box 42. Annual labour costs o employer sponsored non ormal education as a percentageo GDP 2007 Employed 25 64 year olds
Source: OECD, 2012
One characteristic o the adult and continuing education market is that it is strongly rag-mented – made up o markets o various sizes and unctional capabilities. The major problem
or public policy comes rom the presence o “thin markets”, articulations in which the actualand potential number o learners may be too small to attract training providers (Box 43 ).“They are recognised as occurring in occupational, industry and geographic areas, alone or incombination … . The atomisation o training as demand grows or smaller and more speci cskill sets also contributes to thin markets.” Ferrier, F.,et al ., 2008:8 .
Box 43. Type o thin markets
▶ Thin markets or training in occupational areas : these occur where there are ew people seeking trainingor a particular occupation and can include both traditional occupations that have declined such as
blacksmithing , as well as some new or emerging occupations or which demand or training is currentlylow but may grow in the uture.
▶ Thin markets or training in particular industries : these occur where there are ew people seeking trainingor employment in a particular industry. Geography can be a actor—some industries have a strong
presence in some regions and very little in others or example, mining, orestry, shipbuilding .▶ Thin markets or training within a geographic area : these occur where populations are sparse and/or
distances between towns are vast.
Source: Ferrier et al., 2008:30
The thin market presence is the main actor that motivates public policy activation.
0.6
0.5
0.4
0.3
0.2
0.1
0
%
N o r w a y
G e r m a n y
D e n m a r k 1
U n
i t e d K i n g
d o m
1
A u s t r i a
C a n a
d a 2
N e w
Z e a
l a n
d 1
S w e
d e n 3
F i n l a n
d 1
B e
l g i u m
2
N e
t h e r l a n
d s 2
C z e c h
R e p u
b l i c 2
O E C D
a v e r a g e
P o r t u g a
l
S p a
i n
E s t o n
i a
S l o v a
k R e p u
b l i c
P o
l a n
d 1
I t a l y 1
G r e e c e
H u n g a r y 1

7/27/2019 kina25943enc_0
http://slidepdf.com/reader/full/kina25943enc0 64/112
62ADULT AND CONTINUING EDUCATION IN EUROPE
5.2. Financial support or training demandIn order o importance, companies, amilies and the state guarantee nancial support to indi-viduals engaged in adult and continuing education ( Box 44 ). The state has a nancial support
unction between 1.75 and 16 times less than that guaranteed by companies, and between1.75 and 7.5 times less than that guaranteed by amilies.
Box 44. Participation, source o nancing and skill mismatch Percentage o adults aged 16to 65 years excluding ull time students aged 16 to 24 receiving adult educationand training during the 12 months preceding the interview, by source o nancing,by match mismatch categories, and by country, 2003 and 2008
Source: Adult Literacy and Li e Skills Survey, 2003 and 2008.
12345
12345
1
2345
12345
12345
12345
12345
12345
per cent
1. High-skill match 2. Surplus 3. Decit 4. Low-skill match 5. Total
Received some employer nancing
Did not receive employer nancing, but received some government nancing
Did not receive employer or government nancing, but nanced themselves
Norway
Netherlands
Switzerland
Canada
United States
Bermuda
Hungary
Italy
0 5 10 15 20 25 30 35 40 45 50

7/27/2019 kina25943enc_0
http://slidepdf.com/reader/full/kina25943enc0 65/112
63MARKETS AND SYSTEMS OF ADULT AND CONTINUING VOCATIONAL AND TRAINING: THE GOVERNANCE CHALLENGE
The role o the state is less than thato companies and amilies, even withrespect to low skilled workers.
The relationship between the role o the state and the role o companiesvaries rom a maximum o 1.5 to a minimum o 15 times lower or workers who are low-skilled and do work suited to their level. The position o the state is even worse with respectto low-skilled workers with a de cit o skills compared to the work carried out. In this case,the relationship between state and companies varies rom 2.3 to 21. Even the relationshipbetween state and amily intervention shows a strong imbalance: 2.7 to 14.7 times lower.
“Government nancing appears to reach at least equally those in medium to high skill matchedsituations and those in surplus situations. This is consistent with ndings that reliance on
market-based approaches and per ormance criteria used to allocate unding or targetedstrategies may end up bene ting those who already have the most skills because they aremost likely to succeed” OECD, Statistics Canada, 2011:287 .
On the other hand, as the Fifh European Working Conditions Survey shows, in employer- undedtraining an unequal distribution o opportunities is produced by the propensity o companies toprivilege support interventions in avour o people rom whom a higher return o investmentsin training can be expected: “The divide between clerical and manual occupations is very clear.In 2010, over 50% o managers and pro essionals and 48% o technicians and associatepro essionals received employer-paid training, compared with only 26% o craf and relatedtrades workers, 28% o service and sales workers, 28% o plant and machine operators, and33% o clerical support workers” Euro ound, 2012:102 .
Beyond these indicative values, there is no precise in ormation on the volume o investmentrom the various economic subjects and the respective monetary ows. There are problems
in collecting such in ormation. In 2004 the US Department o Labor Employment and TrainingAdministration commissioned a study o occupational training to present a preliminary pictureo the total spending on job training in the United States. Data came rom many sources,including ederal government, state and local government, private employers, philanthropic
oundations and individual workers. Yet this study too was limited to providing estimates onederal and state investments. The results presented in the nal report provided a picture that
was worse than the one documented by the Adult Literacy and Li e Skills Survey ALL , witha relationship between public and private expense o 1:9 Mikelson, 2004 .
Partial and approximate knowledge o all the nancial resources circulating in the adult andcontinuing education market can be considered one o the actors that prevent public policyon adult and continuing education being ully e ective.
Generally, ewer public resources are investedin training than private ones. The propensity
or private individuals to invest in training ispositive, but means that the economic andsocial system may need rebalancing

7/27/2019 kina25943enc_0
http://slidepdf.com/reader/full/kina25943enc0 66/112
64ADULT AND CONTINUING EDUCATION IN EUROPE
5.3. The o er o training goods and servicesThe results, in terms o economic returnand participation in education, are theoutcome o a vast array o di erenttraining activity. I we consider adult andcontinuing education rom an overallviewpoint – taking into account policy
areas rom social inclusion to innovation – the variety o actors seems unlimited, and involves poli-cymaking in areas such as health, culture, research, labour services and social services. Research pro-vides in ormation ocused on two priority spheres: ormal adult education and continuing education.
LLL2010 research sets out a typology o ormal adult education, within which there exist theollowing ‘organisational elds’:
Initial General Education
Initial Vocational Education
Training in the context o Active Labour Market Policies Retraining, RemedyTraining, Wel are to work programmes, Occupational Rehabilitation
On the job training/o the job training in enterprises and organizations, providedinternal by the enterprises or by external training providers
Management Training, Human Resource Development, Organization Development,provided internal by the enterprises or by external training providers
Pro essional Education, geared by pro essional/occupational bodies LLL2010:91
In the continuing education eld, we encounter a wider classi cation that can vary dependingon country Box 45 .
Box 45. Type o organisations
Public and private organisations in NL Private sector in UKNon university higher education Management consultants, coaches andpersonal development specialists;
University higher education Business schools, private colleges and independenteducational establishments such as academies;
Secondary level pro essional training Trade associations and membershipinstitutions, including Chambers o Commerceand employer representative bodies;
Education Arts and cultural bodies;Secondary pro essional education (combined) IT companies;
Distance Learning Publishers;Training companies * Corporate universities
Note: In NL there are 16,541 training companies in a total o 19,062 organisations ound
Sources: NL-Rosenboom, Tieben, 2012:33; UK- Simpson, 2009:14
The quantity and quality o the multiplicity o public and private training activity, large and small,specialised in the various elds o knowledge,make Europe airer and more competitive. Publicpolicies must encourage growth.

7/27/2019 kina25943enc_0
http://slidepdf.com/reader/full/kina25943enc0 67/112
65MARKETS AND SYSTEMS OF ADULT AND CONTINUING VOCATIONAL AND TRAINING: THE GOVERNANCE CHALLENGE
These types o organisation guarantee an o er that potentially covers a vast range o training needs Box 46 .
Box 46. Types o training o ered
UK Netherlands
⇠ Training or school leavers and graduates: orexample, or employability and job readiness.
⇠ Pro essional and technical training: orexample, law, medicine, architecture,engineering and nance, and where initialtraining has usually been provided throughthe education system.
⇠ Functional training: or example, nancialmanagement, HR management, projectmanagement, quality assurance, and salesand marketing.
⇠ Management and organisationaldevelopment: or example, generalmanagement, leadership, strategic planning,and business process improvement.
⇠ HR and personal development: or example,team working, communication skills, stress
management, and assertiveness. Outdoortraining is a small but signi cant high-value sub-sector o the HR and personaldevelopment training market.
Communication / personalbehaviour e ectiveness
pro essional techniquesInstruction and trainingGeneral ManagementCare, wellbeing, sportsOrganisation and management
o human resourcesSales and commerceLanguage coursesICT, nance, economicsHealth and sa etyLogisticsMarketing & PRLegal subjectsProduct qualityPurchasing“OR” company courses (regulated by law)EnvironmentController / auditing
Sources: UK - Key Note’s market report quoted in Simpson, 2009:15The Netherland - Rosenboom, Tieben, 2012:13
Territorially, however, distribution is unequal. Depending on area, the presence o trainingproviders as a percentage o the total business population can vary rom between 0.4% to1%. It is evident rom this that some European regions ace much greater di culty in raisingskills levels.
The uneven distribution o training is not necessarily an obstacle or all those requesting train-ing. For a growing slice o the market, the part interested in advanced specialist training orknowledge workers, there are global training providers Box 47 .

7/27/2019 kina25943enc_0
http://slidepdf.com/reader/full/kina25943enc0 68/112
66ADULT AND CONTINUING EDUCATION IN EUROPE
Box 47. Re erence markets o training industries operating in the Netherlands
Sources: Rosenboom, Tieben, 2012
Unsatis ed demand or advanced training at local level receives a double response in theorm o :
- the growing presence o global training industries, capable o o ering on a local level –whether present or remote – the know-how o organisations operating on a worldwidelevel and enriched by the vast number and variety o customers they work or; and
the ormative o er o highly specialised training industries operating in othercountries, but conceived to attract trainees rom all over the world.
The market is characterised by an abundance o training providers, many with ewer than10 sta (71% in the UK and 98% in the Netherlands). In recent years, the number o suchproviders has increased in spite o the economic crisis between 2000 and 2008 the numberhas doubled in the UK – Simpson: 11). The smaller providers, even i they don’t o er all theadvantages o large training companies, do guarantee cost containment due to strong compe-tition, and they do acilitate access to training or those who are not in a condition to procurethe services o market leaders or themselves Box 48 .
Box 48. Training providers by number o employees in the UK
Source: IDBR 2008, quoted in Simpson:12
0 %
10 %
20 %
30 %
40 %
50 %
60 %
70 %80 %
90 %
100 % in Europe and in the world
in the Netherlands and in other
European countriesonly in the Netherlands
68 %
13 %
8 %
6 %
3 %1 % 1 %
0–4
5–9
10–19
20–49
50–99
100–249
250+

7/27/2019 kina25943enc_0
http://slidepdf.com/reader/full/kina25943enc0 69/112
67MARKETS AND SYSTEMS OF ADULT AND CONTINUING VOCATIONAL AND TRAINING: THE GOVERNANCE CHALLENGE
In conclusion, adult and continuing education is a service-orientated system based on rela-tionships o exchange o goods, services and capitals between di erent economic subjects(companies, amilies, the state) operating on local, national and global levels. This meansthat in order to get the right balance o unctions, public policy must intervene on the existing circuit o production/distribution/exchange/consumption o services. Policymakers cannotlimit themselves to interventions which a ect only those who operate within sectors directlyor indirectly dominated by public nancing. In act, these are an extremely limited part o thesector’s monetary circuit. Such a narrow approach explains why, in many cases, adult andcontinuing education policies have limited impact.
5.4. Public policies or market governancePublic policies or governance o the adult and continuing education market must acknowledge
and act on the ollowing three observations:
• “there are many di erent – mostly private – providers;
• the cost of training is footed largely by enterprises and working people;
• Government plays only a limited role”. (SER, 2012:2).
These observations lead us to conclude that:
1. Public intervention should complement and not compete with private intervention;
2. Public resources should prioritise correcting market imbalances;
3. Ensuring airness in the distribution o resources that allow access to training is aunction to be addressed mainly by public intervention; and
4. The e ectiveness and guarantee o transparency o the relationship betweencosts and bene ts is the basis or a healthy optimisation o resources targeted onthe sector.
5.4.1. Complementarity between public and private resources
In a market economy the imbalance o public and private investment in adultand continuing education is normal.“With per ectly competitive capital and labour markets, there is little role or policies pursuing e ciency” Bassaniniet al ., 2005:136 . The case o the Eastern European socialist stateswas di erent, as the “State was so pro oundly involved into the ormation o skills, that therewas no need in the proactive training policies managed by the enterprises”. But there were
other limits LLL2010:84 .In a market economy the imbalance is justi ed by a division o educational responsibilityaccording to which companies and amilies have the duty to provide personal and pro essionalgrowth (afer schooling has ended). Governments are mainly responsible or removing barriers
Public policies must aim at complementingthe public and private training industries

7/27/2019 kina25943enc_0
http://slidepdf.com/reader/full/kina25943enc0 70/112
68ADULT AND CONTINUING EDUCATION IN EUROPE
to the growth o investment by private individuals and the development o the training market.This rees up public resources and allows them to be concentrated on unctions that guarantee airness and correct market unctioning. A di erent role would require an unsustainablequantity o public resources and would depress the training market.
In this context, the priority duty o public policy concerns reducing the barriers that preventaccess by new economic subjects to the sectors o the training market which are directlyin uenced by public nancial intervention or which do not avour collaboration between publicand private institutions.
5.4.2. Correcting market imbalances
Correcting market imbalances in order
to ensure the e cient use o traininggoods and services is a unction o governance. This can be achieved by“establishing e ective incentives and
cost-sharing arrangements, to enhance public and private investment in the continuing train-ing o the work orce, and increase workers’ participation in li elong learning. Measures couldinclude: tax allowance schemes, education voucher programmes targeted at speci c groups,and learning accounts or other schemes through which workers can accumulate both timeand unding” European Commission, 2010:6 .
The variety o nancial measures adopted by public policies in Europe is wide Box 49 . Characteristically, they act directly on individuals and companies with the aim o increasing theirpropensity to assume training costs direct, indirect and opportunity .
Box 49. Financing adult education: the space o revenues and expenditures by economicunit nancial resources
Economic unit Revenues rom Expenditure or
Learners/amilies
Current income: wage,salary, income rom rent,interest or grants
Tuition ees, interest on loans,amortisation o loans, generaltaxes pro rata or earmarkededucation tax, drawing rightcontributions, saving accountcontributions, cost o living
Past income: ormer savings,heritage, drawing right account
Tuition ees, cost o living
Future income: loan, credit Tuition ees, cost o living
Workers/employees
Current income: wage,salary, income rom rent,interest or grants
Tuition ees, interest on loans,amortisation o loans, generaltaxes pro rata or earmarkededucation tax, drawing rightcontributions, saving accountcontribution, cost o living
Past income: ormer savings,heritage, drawing rights
Tuition ees, cost o living
Future income: loans, credits Tuition ees, cost o living
To correct market imbalances, public policies
can adopt nancial measures which avour companies and amilies. Not all o them havethe same e ectiveness

7/27/2019 kina25943enc_0
http://slidepdf.com/reader/full/kina25943enc0 71/112
69MARKETS AND SYSTEMS OF ADULT AND CONTINUING VOCATIONAL AND TRAINING: THE GOVERNANCE CHALLENGE
Economic unit Revenues rom Expenditure or
Privateorganisations
Employers
Sales, rent, interest, tax/levy exemption/ reduction/rebate rom state oreducational unds, grants/subsidies/ premium
Expenditures or learning o sta ees, take over o loan interest
or loan amortization, selectivegrants to sta members, general
pro rata or education tax, levycontribution to state or learning
unds , contributions to drawing rights or individual educational saving/ individual learningaccounts
Employersassociations/
employers’educationalunds
Employers’ contributions,ees, sale o counselling
services and own educationprogrammes, tax exemptions/ reductions, rebates
Contributions/ grants or loans tosupra rm training
institutions, general tax prorata , selective grantsor loans to learners
Unions
Member contributions, ees,sale o counselling servicesand own education pro-grammes, tax exemptions/reductions, rebates
Contributions/ grants or loans tosupra rm training institutions,general tax pro rata , selectivegrants or loans to learners
Churches
Contributions, ees, donations, taxes rom members
Expenditures or own learninginstitutions and programmes,selective grants or loans tolearners
NGO’s/Wel areOrganisations
Contributions/ donationsrom individuals or organi
sations, sales o counsellingservices, tax exemption orreduction, state subsidies
Expenditures or own learninginstitutions and programmes,selective grants or loans tolearners
Donors
Contributions/ donationsrom individuals, organisa
tions or states, sales o counselling services, taxexemption or reduction,state subsidies
Expenditures or learning institutions and programmes capitalinvestment/ in rastructure ,selective grants or loans tolearners
State
Nationallevel,regionallevel,community
level
Tax revenues rom the taxsystem general taxes, special taxes, education taxes ,revenues rom educationallevy systems, sales o publicservices against ees, oreign aid EU
Expenditures (capital and recur-rent) or own learning institu-tions, revenues oregone by: taxexemptions/ reductions/ rebatesto learners/workers/employees/employers/ associations (employ-ers, unions), NGO’s, churches;matching grants or categoricalaid, grants or loans to learners
Source: Dohmen et al, 2010:20

7/27/2019 kina25943enc_0
http://slidepdf.com/reader/full/kina25943enc0 72/112
70ADULT AND CONTINUING EDUCATION IN EUROPE
Many o these measures have been the object o research. Cede op, in particular, examinedseveral o them:
1. Sectoral training unds in Europe, 2008www.cede op.europa.eu/EN/publications/12944.aspx
2. Individual learning accounts, 2009www.cede op.europa.eu/EN/publications/12896.aspx
3. Tax incentives to promote education and training, 2009www.cede op.europa.eu/EN/publications/5992.aspx
4. Sharing the costs o VET – Schemes in the new Member States, 2009www.cede op.europa.eu/EN/publications/5021.aspx
5. The role o loans in nancing vocational education and training in Europe, 2012www.cede op.europa.eu/EN/publications/19857.aspx
6. The use o payback clauses to promote training, 2012www.cede op.europa.eu/EN/publications/20294.aspx
7. Training leave in Europe 2012http://www.cede op.europa.eu/EN/Files/5528_en.pd
The use o tax incentives is probably the most e ective measure. “Tax incentives have many pos-itive aspects and are appreciated by employers and individuals, particularly or their reductionin education and training costs and their low levels o bureaucracy”. Yet tax incentives also havetheir limits “as they end up avouring those groups already with best access to education/train-ing” (Cede op, 2009a:13). Nevertheless, the use o tax incentives can be considered the primarymeasure or encouraging those economic actors who have an income to engage in education.Tax incentives, in act, avour those who pay more taxes. In spite o these considerations, “datashow they are not the backbone o public education and training policies. In act, they account ora very small percentage o total public expenditure on education and training, as most MemberStates opt or direct unding and provision o these services” (Cede op, 2009a:13). This hap-pens in spite o the lesser e ectiveness o policies ocused on direct nancing o the trainingo er and their undesirable e ects ( nancing the training rms which are incapable o operatingindependently on the training market, increase o nancing destined to overhead costs, etc.).
The jointly governed bipartite or tripartite sectoral training unds STFs have opposing characteristics. They are nanced by a compulsory training levy on the enterprises’ payroll. Leviesrange rom 0.1% to 2.5%, depending on the country. It is a orm o voluntary or compul-sory training levy/tax on work strongly promoted by public policies with direct social partnerinvolvement. Comparative studies provide – alongside some positive ndings –evidence o certain limits, or example:
a compulsory contributions levies to training are sometimes seen by employers asadding to high employment costs;
b not all enterprises bene t rom training activities supported by STFs, despitetraining levies being compulsory particularly SMEs ;

7/27/2019 kina25943enc_0
http://slidepdf.com/reader/full/kina25943enc0 73/112
71MARKETS AND SYSTEMS OF ADULT AND CONTINUING VOCATIONAL AND TRAINING: THE GOVERNANCE CHALLENGE
c di culties and costs in meeting all the conditions required to le grantapplications and comply with STF procedures red tape/bureaucracy problem ;
d levy based unding schemes are ofen criticised because o high deadweighte ects subsidising programmes that would have been provided in any case ;
e a risk o dullness as STFs bene t rom captive resources compulsorycontributions irrespective o the quality o the services and training activitiesprovided;
STFs are sometimes criticised or being particularly concentrated in providingspeci c sector related skills, re ecting very much employers’ perspectives andneeds and not so much those o individual employees. Cede op, 2008:13, 14
Soliciting member states to adopt nancial measures “to enhance public and private investmentin the continuing training o the work orce, and increase workers’ participation in li elong learning”(European Commission, 2010:6) has the positive e ect o not limiting public policies or nancingthe o er. Nevertheless, research shows that such measures must be care ully selected and theircosts and bene ts properly considered. Otherwise, they can create urther undesired imbalances.
5.4.3. Guaranteeing greater equity
The unction o guaranteeing a greater level o equity through public investments should notbe taken or granted. Research shows that “those living in poverty and those who have lefschool early and experience educational disadvantage together with poverty, are requentlyomitted as an identi able target group or priority with regard to national or institutional policyin relation to access to education – in a wide number o countries” LLL2010:186 .
The levels o disadvantage with whichsome adults live demonstrates theimportance o the sa eguard unction o equity margins in a market which tendsto reproduce social inequality. The equity principle allows public nancing to avoid high deadweighte ects and to invest in those who would not have access to training without public intervention.
Despite this, public investment engages ewer low-skilled workers than private investments. Yet,unlike private investors, governments give proportionally more attention to citizens with lowerlevels o education ( Box 44 ). The impact is constrained because o the limited availability o publicinvestments. This limit is aggravated by the low impact o nancial measures on the participation o low-skilled workers and by the modest contribution o training in improving their conditions o li e.
I we consider the results o research on some o these measures, we nd their main weaknessto be their impact capacity with respect to low skilled workers. So, or example:
a. tax incentives act exclusively on those whose tax levels make the policy measuresigni cant;
b. loans are e ective or those who hope to have an income that covers the debt orthe duration o reimbursement;
There is a solution or the low skilled: moreormal education, as soon as possible, even
outside the school and university

7/27/2019 kina25943enc_0
http://slidepdf.com/reader/full/kina25943enc0 74/112
72ADULT AND CONTINUING EDUCATION IN EUROPE
c. vouchers are potentially e ective or everyone, but studies show that high skilledworkers prevail among users;
d. individual learning accounts are potentially better able to avour access by thelow skilled, but this depends on measures that accompany them individualorientation, in ormation, limitation o or recourse to closed catalogues,monitoring, etc. ;
e. leave schemes apply to a limited range o employed workers, usually withpermanent contracts.
Furthermore, i we examine research on the return o training investments, we can see howlow skilled and disadvantaged workers obtain relatively low returns rom training Bassaniniet al ., 2005:150). I investment in training low-skilled workers has limited e ects, it is unlikely
that their costs will be taken on by companies or by individuals and their amilies.
The ine ectiveness o nancial investments combined with the scarce returns o participationand training work are largely attributable to the lack o cognitive prerequisites that allow low-skilled workers to take advantage o such training. The solution is to engage them in ormaladult education pathways: “by increasing the basic skills o the work orce, in terms o literacy,numeracy and cognitive and communication abilities, policy can contribute both to directlyraise the standard o li e o disadvantaged individuals and to increase the private incentiveto train” Bassaniniet al ., 2005:150 .
This is why measures in avour o low-skilled workers must, in order to be e ective, tendtowards the combination o di erent provisions. First o all, they must aim at nancing the
ormal education o adults who consent to upgrading basic knowledge and achieving relatedcerti cations. Second, they must intervene on the creation and quality o institutions o ormaladult education. And third, they must guarantee, or each individual, conditions conduciveto participation. In act, “outreach strategies will only work i other barriers such as nanceand lack o proximity to the educational institution are overcome. Decentralised communitybased locations or learning, such as community li elong learning centres, provide exampleso progressive outreach strategies or reaching marginalized communities and individuals”
LLL2010, 186 .
5.5. Investment transparency and e ectiveness
5.5.1. Greater transparency and method
The need to optimise nancing or adult and continuing education is made more acute by thelimited availability o resources. The objective is urther hampered by the scarce and partialin ormation available to governments regarding the actual amount o public unding destined
or the sector. The adoption o smart and intelligent policies depends on data that can guaran-
tee the pertinence o public support and demonstrate the adequacy o the impact produced.“To have good results, order must be put in the processes and methods o public decision
… A logic o monitoring and evaluation o legislation must be guaranteed in order to ensure

7/27/2019 kina25943enc_0
http://slidepdf.com/reader/full/kina25943enc0 75/112
73MARKETS AND SYSTEMS OF ADULT AND CONTINUING VOCATIONAL AND TRAINING: THE GOVERNANCE CHALLENGE
transparency, constant in ormation on the state o implementing measures, and an objectiveevaluation o the results obtained as a basis or new re orms” Monti, 2012:22 .
5.5.2. The risk o mismanagement and corruption
The scarcity o in ormation about pub-lic nancing implies a low level o protection with respect to the risks o mis-management and corruption. A reportcommissioned by Germany’s FederalMinistry or Economic Cooperation and Development states that “corruption can be ound atmacro, meso and micro levels in the education sector. So called ‘grand corruption’ involvinglarge sums is ound essentially in the eld o procurement (school buildings, textbook pro-
duction, etc. , while ‘petty corruption’ is ound in the other areas” Ochse, 2004:3 . The issueis worth attending to because “education is seldom considered to be the most corrupt publicsector” (Poisson, 2010:3) and because corruption can undermine the e ectiveness o publicinvestment in the sector.
In its 2013 report, Transparency International maintains that “Corruption and poor govern-ance is a major impediment to realizing the right to education, and to reaching the MillenniumDevelopment Goals and Dakar Education or All Framework or Action by 2015. Corruptionnot only distorts access to education, but a ects the quality o education and the reliabilityo research ndings. From corruption in the procurement o school resources and nepotismin the hiring o teachers, to the skewing o research results or personal gain, major corrup-tion risks can be identi ed at every level o education and research systems” (TransparencyInternational, 2013 .
The relationship between corruption o the school system and learning outcomes o studentshas already been highlighted by in depth studies carried out on the data o the PISA surveyBox 50 .
Corruption also concerns the public policies o adult and continuing education. It reduces thequality and e ectiveness o investments andincreases exclusion rom li elong learning.

7/27/2019 kina25943enc_0
http://slidepdf.com/reader/full/kina25943enc0 76/112
74ADULT AND CONTINUING EDUCATION IN EUROPE
Box 50. Mean reading score in PISA 2009 and perceptions o corruption
Global Corruption Barometer/Transparency International: To what extent do you perceive the education system in this country to be afected by corruption? (1-5 strongest)
Source: OECD PISA 2009 Database, Transparency International.
This relationship was urther con rmed by a survey comparing the various Brazil municipalities(Box 51 ). It showed that “leakages rom educational resources can be an important constrainton school quality. Using a novel dataset o corruption in education and schooling outcomesacross public schools in Brazil, we nd that student test scores on a national standardizedexam and pass rates are signi cantly lower, and dropout rates are signi cantly higher inmunicipalities where corruption is prevalent” Ferrazet al ., 2012:22 .
Box 51. Distribution o test scores or mathematics by corruption
Notes: Panel display kernel densities o 2005 test scores aggregated at the school level. The densities were estimated depending on whether the school resided in a municipality where corruption was detected in education.
Source: Ferraz et al, 2012:30
SwitzerlandDenmark
France
Finland
Netherlands
Austria
Germany
Luxembourg
Norway
New Zealand
Iceland
Argentina
ColombiaBrazil
Portugal
Hungary
United Kingdom
IrelandAustralia
Latvia
Poland
Spain
Canada
Israel
Mexico
Italy
Slovenia
Lithuania
United States
Chile
Indonesia
Romania
Peru
Czech Republic
Bulgaria
Greece
Thailand
Turkey
Azerbaijan
Croatia
Serbia
Russian Federation
y = -32.386x + 564.31R²= 0.21736
350
400
450
500
550
1.5 2.0 2.5 3.0 3.5 4.0
OECD average
0
0.01
0.02
0.03
100 150 200 250 300
No corruption Corruption

7/27/2019 kina25943enc_0
http://slidepdf.com/reader/full/kina25943enc0 77/112
75MARKETS AND SYSTEMS OF ADULT AND CONTINUING VOCATIONAL AND TRAINING: THE GOVERNANCE CHALLENGE
The relationship between the corruption index and the European Li elong Learning Index (ELLI)is worth highlighting ( Box 52 ). The European countries with a greater corruption index are thosein which the conditions necessary to guarantee public participation in learning opportunitiesare weaker.
Box 52. ELLI and Corruption Index
Source: Bertelsmann Sti ung, Transparency International, 2009
The various types o corrupt practice ound in the education system are also to be ound inthe adult and continuing education system. The overall result o such practices is to consider-ably reduce the quality and e ciency o public spending in the sector and, consequently, hasa negative impact on the results and on the impact o the initiatives assumed. In other words,public investments – already marginal with respect to private ones – see their volume reduced
urther because o mismanagement and corruption Box 53 .
Box 53. Corrupt practices in the education sector
Areas Corrupt practices
Finance • Transgressing rules/procedures;• In ation o costs and activities in budget
estimates• Embezzlement
Speci c allowances ellowships,subsidies, etc.
• Favouritism, nepotism• Bribes• Bypassing criteria• Discrimination political, social, ethnic
Construction, maintenance andschool repairs
• Fraud in public tendering• Collusion among suppliers• Embezzlement
• Manipulating data• Bypass o school mapping• Ghost deliveries
0 20 40 706010 30 50 80
C o r r u p
t i o
n I n d
e x AT
BE
BG
CY
CZ
DK
EE
FI
FR
DE
GR
HU
IE
ITLV
LT
LU
MT
NL
PL
PT
ROSK
SI
ES
SE
UK
3
4
5
6
7
8
9
10

7/27/2019 kina25943enc_0
http://slidepdf.com/reader/full/kina25943enc0 78/112
76ADULT AND CONTINUING EDUCATION IN EUROPE
Areas Corrupt practices
Distribution o equipment,urniture and material incl.
Transport, boarding, textbooks,canteens and school meals
• Fraud in public tendering• Collusion among suppliers• Siphoning o school supplies• Purchase o unnecessary equipment• Bypass o allocation criteria• Manipulating data• Ghost deliveries
Writing o textbooks • Fraud in the selection o authors avouritism,bribes, gifs
• Bypass o copyright law• Students orced to buy materials copyrighted
by instructorTeacher appointment,management, payment andtraining
• Fraud in the appointment and deployment o teachers avouritism, bribes, gifs• Discrimination political, social, ethnic
• Falsi cation o credentials/ use o akediplomas
• Bypass o criteria• Pay delay, sometimes with unauthorised
reductionsTeacher/school sta behaviour
pro essional misconduct• Ghost teachers• Absenteeism• Illegal ees or school entrance, exams,
assessment, private• tutoring, etc.• Favouritism/nepotism/acceptance o gifs• Discrimination political, social, ethnic
Private tutoring including use o schools orprivate purpose
• Sexual harassment or exploitation• Bribes or avours during inspector visits
In ormation systems • Manipulating data to misrepresent• Selecting/suppressing in ormation• Irregularity in producing and publishing
in ormation• Payment or in ormation that should be
provided reeExaminations and diplomas,access to universities
• Selling exam in ormation• Examination raud impersonation, cheating,
avouritism, gifs• Bribes or high marks, grades, selection to
specialized• programmes, diplomas, admission to
universities• Diploma mills and alse credentials• Fraudulent research, plagiarism
Institution accreditation • Fraud in the accreditation process avouritism,bribes, gifs
Source: Hallack, Poisson, 2007

7/27/2019 kina25943enc_0
http://slidepdf.com/reader/full/kina25943enc0 79/112
77MARKETS AND SYSTEMS OF ADULT AND CONTINUING VOCATIONAL AND TRAINING: THE GOVERNANCE CHALLENGE
5.6. Policies according to results
5.6.1. Good-quality data or smart policies
Orientating the adult and continu-ing education market through publicpolicies is more complex than simplymanaging a system. The policy-mak-ing process must intervene on a widervariety o problems and is in uencedby a greater number o actors. To avoid being opinion-based, it needs quality data to: sup-port the decision making process; in orm the choice o the problems to be tackled; elaboratepolicy options; carry out impact analysis; compare possible options; and structure monitoring
and evaluation European Commission, 2009:21 . Each o these key analytical steps relies ongood quality data European Commission, 2009:18 .
As ar as adult and continuing education is concerned, governments use an increasing varietyo sources to identi y – by comparing countries – their position with respect to the resultso public and private policies, the educational conditions in their territories, and the progressachieved Box 54 .
Box 54. List o the more important European sources
▶ The European Union Labour Force Survey EU LFS , which covers employment related data needs,and gives in ormation on demographic background household and individual and on education andtraining:www.epp.eurostat.ec.europa.eu
▶ TheContinuing Vocation Training Survey (CVTS) provides comparable statistical data on continuingvocational training, skills supply and demand, training needs; the orms, contents and volume o continuing training; the enterprises own training resources and the use o external training providersand the costs o continuing training.
▶ The Adult Education Survey (AES) is part o the EU Statistics on li elong learning. The EU AES is a pilotexercise. The survey covers participation in education and li elong learning activities ormal, non
ormal and in ormal learning including job related activities, characteristics o learning activities, selreported skills as well as modules on social and cultural participation, oreign language skills, IT skills
and background variables related to main characteristics o the respondents. Education at Glance published yearly by OECD TheProgramme or International Student Assessment, which is an internationally standardised
assessment o how ar students near the end o compulsory education have acquired knowledgeand skills that are essential or ull participation in society.
- Programme or the International Assessment o Adult Competencies assess the level anddistribution o adult skills across countries
Source: adapted rom European Commission, 2009
These sources have been enriched by analysis systems that have progressively extendedattention towards the complexity o adult education. The European Li elong Learning Index
ELLI , or example, is an instrument ne tuned to make “li elong and li e wide learning moretangible and measurable”. ELLI o ers the possibility “to make international comparisons o
The availability o quality data on educationalconditions is in continual development. Itallows countries to know and compare thee ectiveness o policies and the economic andsocial attractiveness o their territories

7/27/2019 kina25943enc_0
http://slidepdf.com/reader/full/kina25943enc0 80/112
78ADULT AND CONTINUING EDUCATION IN EUROPE
the ‘state o play’ o li elong learning in countries and, where available, regional comparisonswithin speci c countries” (Hoskins et al . 2010:10). It adopts, as a reading key or each countryor territory, the our learning dimensions (according to the UNESCO de nition): learning to livetogether, learning to be, learning to know and learning to do. For each dimension, ELLI measures the conditions necessary or the population’s participation in learning, and examines thee ects such participation should produce.
It is a use ul instrument “to gain a preliminary picture or indication o how (a) country or regionis per orming in regards to others” Hoskinset al . 2010:10 . At the same time, by monitoringthe preconditions, ELLI allows us to identi y potential causes o existing learning conditions.
In Germany, the ELLI model was applied on a regional level, to re ect the preconditions oruture economic and social success in each region. “The German Learning Atlas is the rst
indicator based regional monitoring instrument or li elong learning in Europe. It is based on
a composite index that (…) allows observation and comparison o the conditions or li elonglearning in all 412 German administrative districts and cities, as well as in the ederal states.… At present, the German Learning Atlas combines 38 actors into an overall index and our
partial indexes. The German Learning Atlas yields in ormation on the quality o learning anddevelopment conditions ound in their regions by individuals in all phases and areas o li e”
Schoo et al ., 2012:3
Other studies have built models o comparison based on measuring progress on positioningthe countries or regions with respect to various indicators. Even though they have so ar beenapplied only to the school system, they are o high interest or adult and continuing educa-tion policies. This is clear in the case o a study onHow the World’s Most Improved School Systems Keep Getting Better . In this report, McKinsey sorts out systems according to startingpoints and progression (Box 55 ). “These per ormance stages continue – rom poor to air,
air to good, good to great, and great to excellence – and are in turn unravelled according tointervention clusters within given contexts. … We see the clusters o interventions, di erent
or those starting rom a weak base than those who have already had signi cant success.We see the pathways playing themselves out in each type o context . We see what it takes toignite system change, what speci c strategies achieve breakthrough, what interventions buildever increasing momentum, how systems can sustain improvement, and especially how theycan go to the next stage o development” Michael Fullan, in: Mourshed, 2010:6 .

7/27/2019 kina25943enc_0
http://slidepdf.com/reader/full/kina25943enc0 81/112
79MARKETS AND SYSTEMS OF ADULT AND CONTINUING VOCATIONAL AND TRAINING: THE GOVERNANCE CHALLENGE
Box 55. Improvement rom poor to air to good to great
1 Systems were categorized across time as poor, air, good, or great based on their average per ormance across test instrument, subject, and age group in each year where assessed. Systems also improve within each phase (e.g. England improved signi cantly within ‘good’ without reaching ‘great’). Universal scale start date marks the beginning o availablestudent assessment data during the re orm time period 2 Score cut ofs: Excellent >560 (none o our sample systems achieved this level); Great 520-560; Good 480-520;Fair 440-480; Poor <440.
Source: TIMSS, PISA, NAEP, national and provincial assessments; McKinsey & Company interventions database
5.6.2. Increasing the e ectiveness o policies through orecasting devices
These data sources are use ul or understanding education conditions, the wealth o humancapital in a territory and the progress achieved. They are help ul in developing strategic goals,but they do not tell us how to construct the policies that can produce change.
For that, we need in ormation on thee ectiveness o the policies we mightadopt and their correlated measures; weneed to create e ective ex-ante impactanalyses; and we need to identi y thevarious likely policy options: “Most governments require sound evidence on both the e ectivenesso outcomes and the e ectiveness o implementation and delivery o policies, programmes andprojects. The availability o both types o evidence is ofen in short supply” (Davies, 2004:24)
Studies o the impact o adult and continuing education policies are not abundant. Reviewsproduced by the European Commission complain that “the analysis o the data gathered oncountry level, have indicated that major directions took place in terms o policies, structures,
legislation and nancial arrangements, but they have not provided the data needed to pro-vide rm conclusions as to the results and impact o the mobilisation strategies put in place”Broek, 2010:99 .
Systems 1
1985 1990 1995 2000 2005 2010
Western Cape, SA
Armenia
Long Beach, CA, USA
Slovenia
Latvia
Saxony, Germany
South Korea
Singapore
ChileGhana
Jordan
Boston/MA, USA
Poland
Lithuania
England
Ontario, Canada
Hong Kong
Poor2 Fair2 Good2 Great 2
Policy-making processes do not make useo all the resources available. Increasinge ectiveness is possible by building intelligentdecision-support systems devices

7/27/2019 kina25943enc_0
http://slidepdf.com/reader/full/kina25943enc0 82/112
80ADULT AND CONTINUING EDUCATION IN EUROPE
Nevertheless, i we examine all the research carried out on the subject in the last decadeson a worldwide level we can see that there is an emerging empirical database (consider, orexample, what was produced by the vast network o public and private research centres exist-ing in numerous EU and OECD countries, in addition to research promoted in support o theWorld Bank and UNESCO). There ore, the scarcity o studies could be alleviated by programmeswith the ollowing aims:
a) capitalisation o the existing knowledge base and systematic development o researchon the impact o adult and continuing education policies.
The quantity is vast. “Evidence-based policy and practice uses a range o types o researchevidence, and is usually guided by the questions being posed rather than by any one typeo research evidence” Davies, 2004:15 . There ore, every policy that is not based merely onthe opinions o individuals or lobbies has enriched the knowledge base by making use o the
various types o evidence-based research. There is a body o knowledge and know-how aboutadult and continuing education policy making, but it is largely tacit, hidden inside institutionsand only partially encoded and systemised. Yet each new policy initiative has to be oundedon shared reasoning and acts and, there ore, it is reasonable to suppose that this involvedthe elaboration o one o the possible types o research evidence(Box 56 .
Box 56. Types o Research Evidence
Source: Davies, 2004:15
b) rein orcement and systemisation o research in orecasting the uture demand or adult and continuing education
This is a sector scarcely covered by research. It is important because it indicates the direction
policies might take and because it addresses Europe’s need “to regain cognitive leadershipby re invigorating its capacity to invent the uture” European Commission 2050, 2012:26 .
In policy-making, orecasting studies are important because they provide our undamen-tal orientations:long-term planning (to know where scarce resources should be allocated),
ImpactEvidence
Implementation
Evidence
DescriptiveAnalyticalEvidence
Economic/Econometric
Evidence
EthicalEvidence
StatisticalModelling
AttitudinalEvidence

7/27/2019 kina25943enc_0
http://slidepdf.com/reader/full/kina25943enc0 83/112
81MARKETS AND SYSTEMS OF ADULT AND CONTINUING VOCATIONAL AND TRAINING: THE GOVERNANCE CHALLENGE
orientation (to know the human capital potential o a country), realistic target setting (to knowthe right time to implement changes), andmotivation or near-term investments that onlyproduce long term bene ts Lutzet al ., 2004:4 .
Studies o uture demand or adult and continuing education are rare, though some exam-ples show that the subject is meaning ul. Let us take, or example, a recent CEPII update onthe educational levels o the working age population over the 1980 2050 period Box 57 . Itshows that Europe in 2050 will move quite close to the secondary school educational levelso the more advanced economies worldwide – though without catching up with them. As aras tertiary education is concerned, current e orts will serve only to maintain current levelso disadvantage Box 57 .
These data have implications or policy in both tertiary education and adult and continuingeducation policy which will be required to ll the gap . It is important to note that these ore
casts are built by using quali cations as a basic proxy. Surveys such as PISA and PIAAC havequestioned the use o quali cations as a proxy or actual competences among the workingage population. The stimulation o research in the sector could help to overcome the di culty“to produce appropriate methods or showing how the educational composition o the adultpopulation changes as a consequence o speci c school enrolment rates” IASA .
Box 57. Educational level in selected countries and zones, 1980 2050,percentage o working age population
Secondary Tertiary
Notations: USA = United States; RUS = Russian Federation; JPN = Japan; EU27 = European Union; CHN = China; BRA = Brazil;IND = India and SSA = Sub-Saharan A rica.
Source: Barro & Lee or data, Fouré et al. (2012) or projections. Quoted also in The Cepii Newsletters, n.49, 1Q, 2012
Forecasting studies are used or understanding the processes o developing human capitalover the long to medium term. Studies orecasting the demand o skills in Europe, carried out
by Cede op 2009b, 2010 , tend in the same direction. However, the short and medium termalso needs be taken into consideration. Forecasting should also concern speci c decisions and,in particular, the likely e ects o policy measures to be adopted or example: tax incentivesversus co- nanced schemes). The inheritance o the various types o evidence-based researchcould allow this to be achieved.

7/27/2019 kina25943enc_0
http://slidepdf.com/reader/full/kina25943enc0 84/112
82ADULT AND CONTINUING EDUCATION IN EUROPE
c) Simplifcation o access to in ormation through intelligent decision-support systemsthat would accompany the policy-making process in its various phases.
As o the 1980s, “there have been signi cant developments in the technologies needed toenable cognitive systems, such as machine learning, reasoning, perception and multimodalinteraction. Improvements in processors, memory, sensors and networking have also dramati-cally changed the context o cognitive systems research” (Nilsson, 2009:35). It is now possibleto encourage the application o ICT and computer science to the di erent phases o the policycycle rom agenda setting to evaluation .
A special issue o the journalArti cial Intelligence and Law planned or 2012 was dedicatedto the theme o “modelling policy-making”. The journal ocuses particularly on “using andintegrating a range o subcomponents in ormation extraction, text processing, representation,modelling, simulation, reasoning, and argument to provide policy-making tools to the public
and public administrators”. This type o research, which has ound important applications invarious elds ( rom healthcare to managing the environment), should be extended to the adultand continuing education eld. This would help sector policies “to go beyond rhetoric and con-sider concrete policy answers to expand learning opportunities or all adults” OECD, 2003:3 .
Strengthening in ormation-processing sofens the bounded rationality o decision-making.But this doesn’t necessarily guarantee a change in the policy agenda. “Political processes aregenerally characterized by stability and incrementalism, but occasionally they produce largescale departures rom the past. Stasis, rather than crisis, typically characterizes most policyareas, but crises do occur” (Trueet al ., 1999:155). Long periods o minimal or incrementalchange have intervals o sudden, unpredictable radical change. The punctuated equilibriumtheory, applied to policy, helps us understand the reasons or long periods o stagnation.This happens in adult and continuing education, as in palaeontology and evolutional biology,because a certain orce o change must rst accumulate in order to overcome all the cognitiveand institutional rictions.

7/27/2019 kina25943enc_0
http://slidepdf.com/reader/full/kina25943enc0 85/112

7/27/2019 kina25943enc_0
http://slidepdf.com/reader/full/kina25943enc0 86/112

7/27/2019 kina25943enc_0
http://slidepdf.com/reader/full/kina25943enc0 87/112
Conclusions

7/27/2019 kina25943enc_0
http://slidepdf.com/reader/full/kina25943enc0 88/112
86ADULT AND CONTINUING EDUCATION IN EUROPE
Ensuring the existence o a skills supply that meets the needs o the productive system whileachieving an adequate level o social cohesion depends on citizens having the opportunity todevelop their skills when they enter the job market and, thereafer, or the rest o their lives.
Adult and continuing education responds to structural concerns and widespread need. This iswhy demand or adult and continuing education has grown between 2007 and 2011, inspite o the economic crisis . There have been a small number o exceptions, and, o course,demand has grown at di erent intensities in di erent places, but it is nevertheless important tonote that this is a general trend that has concerned both low-skilled and high-skilled citizens.
One reason or this is the growing number o providers . Considering just the work-based train-ing sector, training providers represent between 0.4% and 1% o companies. It is a much vaster
eld than the traditional perception o adult and continuing education would lead us to imagine.
Nevertheless, the dimensions o the sector are not such as to avoid distribution problems. Theseare accentuated by the act that “ education and training services have become a com-modity that can be traded like any other service ” (Euro ound, 2011:34). In the near uture,“marketisation may take o in a big way (…), accelerated by pressure on public nances” (Euro-
ound, 2011:43). In act, already today adult and continuing education has a signi cant marketvalue – amounting, or example, to €3.2 billion in the Netherlands alone. Participation in adultand continuing education is supported in the main by companies and amilies . They arethe social actors who sustain most o the cost. The state plays a marginal role, which concernsonly narrow sections o the population, particularly the less advantaged ones. Companies arethe main actor; understandably, since adult and continuing education is a lever or achieving thestrategic objectives. For companies, growth o personnel is a goal to be pursued, to some extent,through o -the-job training, but, above all, through on-the-job training. Yet the desired outcomesare not to be attained simply through ormal, non- ormal and in ormal training. It is the outcomeo the learning potential o each company, that is to say, the content o work, the career prospectso ered to personnel, the values shared and the sense o belonging that is created, the bene ts,and the culture o training expressed through contracts o employment.
When the intervention o companies is not su cient, it is the amilies who intervene. In eachcountry included in the surveys considered,the weight o the amilies was always atleast three times greater than that o the state (the ratio varies rom a minimum o 2.7 to a maximum o 14.7 .
The prevalence o private intervention has created a situation in which participation in adult and con-tinuing education is unevenly distributed, o ering particular encouragement to certain groups, including:
• people with high levels of education;
• employed people;
• those, in particular, employed in the knowledge-intensive productive sectors;
• people with a more favoured social and cultural origin;
• younger people; and
• the non-disadvantaged in general.

7/27/2019 kina25943enc_0
http://slidepdf.com/reader/full/kina25943enc0 89/112
87CONCLUSIONS
Nevertheless, the actor that more than others determines the likelihood o access-ing learning opportunities is the city, the region and the country o residence . Thiscon rms the importance o past and present policies and, hence, the potential role o the state.
The dimensions that the market o adult and continuing education has taken onrequire that public policies take a di erent approach than that which would usually beconsidered appropriate to managing a system or public service, administrated in a monopolyor oligopoly regime.
Policy interventions must be in ormed by two basic considerations. The rst concerns theexistence in Europe o an inheritance o skills which should be sa eguarded and increased.Policy should not concentrate just on what is missing. It should also concern under-standing and increasing the human potential present in Europe . Post-school, little isknown about the quality and consistency o this potential. We recognise the outcomes o the
skills possessed by the active population and their impact on companies and society. But weknow little about their possible sub use or their adequacy with respect to uture challenges.
The second consideration concerns the existence in Europe o a high number o low-skilledadults in 2011, 26.6% o people aged 25 to 64 had an education level below that expectedin lower secondary education). In spite o the act that research indicates potential solutions interms o policy and other interventions, current strategies will lead to minimal change in thepast ve years there has been an improvement o 0.7% per year). Even this evaluation maybe optimistic since, over the course o coming years, the number o low skilled adults will beconstantly increased by the low skilled young people produced by the school system and bythe progressive rise in the quality o basic skills necessary to live and work in the Europe o the uture. To this end, we must ask whether the continuing phenomenon o a high number o low skilled citizens is objectionable simply on grounds o social justice, or i the social cost o low-skilled workers is compensated by the abundance o a work orce willing to do jobs thatrequire low skill levels. Yet, even in this second case,the low-skilled phenomenon stillrequires corrective interventions since it is perpetuated by orms o social repro-duction and entails, there ore, the loss o capable people .
Public policies must concentrate on objectives that sa eguard and develop the behaviours o those who operate and invest in the human growth potential o Europe. At the same time,they must take on duties or correcting the distortions o the adult and continuing educationmarket and, there ore, operate by regulating it and by devising interventions which redistributeopportunities without depressing the investment o investors .
a. policy priorities
The research considered suggests the ollowing policy priorities on the demand ront:
• Concentrate public interventions on adopting rules that reduce the economic andsocial barriers that hamper access to training opportunities or various levels o the population;
• Concentrate the use of public nancial resources on rebalancing functions, i.e.directing them to people, companies, territories that, without public intervention,would not nd an answer to their growth needs;

7/27/2019 kina25943enc_0
http://slidepdf.com/reader/full/kina25943enc0 90/112
88ADULT AND CONTINUING EDUCATION IN EUROPE
• Take on as a priority the sensitive reduction of the number of low-skilled citizenswho, without public intervention, would see their conditions o social and workexclusion progressively worsen; and
• Use direct incentives to encourage those who invest in training, and cautiouslyuse orms o taxation, though nalised at training.
The research considered suggests on the ollowing priorities on the o er ront:
• Use regulative and nancial instruments to promote autonomous initiatives thatincrease the training potential o companies;
• Promote expansion of the training market by reducing obstacles – includingthose o an institutional nature – that hamper growth o the training industries,
cooperation and competition among the various public and private actors, andeliminate the barriers o monopolistic and oligopolistic regimes;
• Promote the presence of all sizes of training provider: micro, small, medium andlarge, whether operating in just one territory or on a worldwide level. Varietyensures a greater likelihood o nding pertinent answers to individual trainingdemand and cost containment; and
• Promote improvement of o er quality, making the university system assumeduties o initial training o the sector operators and sustaining researchorientated to training innovation.
Public policy will be able to recoup spending on orientation in the training market i it canoptimise investments. There ore, policy-makers must de ne a clear vision o the desirable andpossible conditions, and they must adopt policies and measures which evidence suggests willdeliver the desired results.
b. research priorities
The research which has, over the last decade, supporting adult and continuing educationpolicy, has examined the basic knowledge needs relative to elds such as the managementand improvement o the quality o adult learning, recognition o skills, monitoring systems andorientation. At the same time, we must acknowledge the progress made by certain studies,conducted on an international level, and by the individual research centres o EU and OECDcountries. The wealth o data now available demands on-going monitoring and the promo-tion o orms o cooperation within the ramework o large, shared programmes. This wouldincrease the complementarity o investment and the use o the results by policy makers.
To ensure that government strategies and policies targeting adults are success ul, it is vitalthat they are based on concrete evidence, experience and knowledge about people’s situa-tions. Evidence-based policy-making in the eld o adult learning calls or comprehensive
and comparable data on all key aspects o adult learning, or e ective monitoring systemsand cooperation between the various agencies, as well as or high quality research activitiesCouncil Resolution on a renewed European agenda or adult learning, 2011/C 372/02 .

7/27/2019 kina25943enc_0
http://slidepdf.com/reader/full/kina25943enc0 91/112
89CONCLUSIONS
The policy results will correspond to expectations only i these policies are ounded on evi-dence, i in ormation and evaluations are consistent, broad and rigorous and, in particular, i they take into account the oreseeable impact o the measures adopted.
Research carried out on a worldwide level has generated su cient knowledge and know howto oster policies o adult and continuing education which deliver the desired results. Newdevices, re ned by research in the eld o arti cial intelligence, can give policy makers easieraccess to available scienti c knowledge and the possibility o oreseeing the impact o thepolicy measures that have been adopted.
Research should produce an intelligent decision-support system that acilitates theimpact analysis ex-ante o the policy measures or adult and continuing education by gather-ing and analysing evidence, identi ying and diagnosing problems, proposing possible courseso action and evaluating the proposed actions.
1. Orientating the adult and continuing education market
As noted above, research a rms that “education and training services have become a commodity that can be traded like any other service” (Euro ound, 2011:34) and that “marketisationmay take o in a big way in the coming years, accelerated by pressure on public nances”
Euro ound, 2011:43 . In spite o this act, the policies o adult and continuing education arelargely aimed at orientating only the public component o that market. One o the reasons orthis is that the adult and continuing education market is still mostly unknown to public policy,in spite o the act that it has an important slice o the national economy, with a signi cantshare o turnover and an important number o micro, small and medium training industries.
To address this, research should provide knowledge o the economic make-up o the adult andcontinuing education market in the 27 EU countries, the undamental characteristics o theeconomic actors, the dynamics that determine its growth or depression, the trends regardingabsorption o innovations applied to training ICT , the processes o market globalisation andthe role o the large consultancy and training multinationals.
The results should help us to understand which strategies and policies can ensure more e ec-tive governance o adult and continuing education.
2. Developing learning potential and innovation ability in workplaces
The Council recommends “ensuring exible arrangements adapted to di erent training needso adults, including in-company training and workplace-based learning” (Council Resolutionon a renewed European agenda or adult learning, 2011/C 372/03 .
The personal and pro essional growth o people working depends, rst o all, on the quality o the job and its learning potential. Research has provided quite an in depth picture o the actors that determine the learning potential o a workplace, but we still have limited knowledgeo the way in which learning potential is activated in di erent kinds o people.
This implies that we need to study the interconnections between the undamental actors o people-management policies and their training implications. It means knowing the variousways in which actors interact, among them: the training contents o the work being carried

7/27/2019 kina25943enc_0
http://slidepdf.com/reader/full/kina25943enc0 92/112
90ADULT AND CONTINUING EDUCATION IN EUROPE
out, the prospects o career development, the bene ts o educational importance, compensa-tion policies, the sense o belonging and value sharing.
Research should determine how the combination o these actors can be managed or thepersonal and pro essional growth o workers. Likewise, a study should be made o the internaland external actors o a company that determine growth in the ability o individuals and workgroups to innovate. In this case too, the end result should be knowledge o the types o publicpolicy that increase people’s innovation ability in workplaces.
3. Guaranteeing the pertinence o learning opportunities with respect to the demand or skills
Adapting and developing the skills supply o the active population is a undamental unctiono adult and continuing education. Research periodically provides data related to the demand
or skills, present on the job market and in its various articulations, in the short and medium
period.
Yet there is a passage o the skill creation chain that, i not adequately managed, risks takingvalue rom the preceding needs analysis. It is the translation o training needs into a trainingo er. What is it that guarantees that the training response allows the acquisition o knowledge,skills, or attitudes that enable one to e ectively per orm the activities o a given occupationor unction to the standards expected in employment?
Without convincing answers to this question, training e ort risks being wasted.
This matching unction is managed today by governments, by applying national standards(curriculum vitae or standardised didactic units), or by using processes determined by theopinions o the actors involved or, more simply, by the o er available.
Research should determine how public policies can support the planning o personalised train-ing responses.
In educational design, “Training decision support systems” based on arti cial intelligence canplay a signi cant role. “Intelligent decision support systems”, through the interpretative analy-sis o large scale needs data with intelligent and knowledge based methods, allow plannersand designers to quickly gather in ormation and process it in various ways in order to takedecisions about the more appropriate learning pathway.
The device should be created both or planning the training o er on a territorial and organisational level, and or speci c training activities.
4. Expanding the e ectiveness o learning actions
Research developed within the ramework o neurosciences, i applied to adult and continuingeducation, can have an impact on the e ectiveness o learning actions. “An improved dialoguebetween neuroscience and education will be critical in supporting the development, application
and evaluation o educational programmes based on a sound scienti c understanding o thebrain” Howard Jones, 2008:16
Neuroscience research has already achieved important results that can help build learningenvironments that encourage learning development. Changing the li e and work environment

7/27/2019 kina25943enc_0
http://slidepdf.com/reader/full/kina25943enc0 93/112
91CONCLUSIONS
has a direct impact on the brain and its behaviour. This eld o research is particularly important or managing learning processes in the workplace. Research can help understand how toadapt them to the various learning and per ormance needs.
Interdisciplinary research that unites education sciences and neurosciences can help adultand continuing education policy-makers understand how to conceive regulatory interventionsthat make possible the intentional management o in ormal education generated by the workenvironment and in other types o context.

7/27/2019 kina25943enc_0
http://slidepdf.com/reader/full/kina25943enc0 94/112

7/27/2019 kina25943enc_0
http://slidepdf.com/reader/full/kina25943enc0 95/112
Annexes

7/27/2019 kina25943enc_0
http://slidepdf.com/reader/full/kina25943enc0 96/112
94ADULT AND CONTINUING EDUCATION IN EUROPE
Annex 1 – List o Re erencesArundel, A.,Lorenz, E.,Lundvall, B.-Å.,Valeyre, A. (2007), How Europe’s economies learn: acomparison o work organisation and innovation mode or the EU-15, in: Industrial and corpo-rate change, Vol. 16. No 6, pp. 1175 1210.
Barrow, S., Mosley, R. 2005 ,The Employer Brand, Bringing the Best o Brand Management toPeople at Work , Chichester, John Wiley & Sons.
Bauer, J. (2008), Learning rom Errors at Work Studies on Nurses’ Engagement in Error-Related Learning Activities , Regensburg, University o Regensburg.
Bassanini, A., Booth, A., Brunello, G., De Paola, M., Leuven, E. (2005),Workplace Training inEurope , in: IZA DP No. 1640, Bonn.
Beblavy M., Thum, A-E., Potjagailo, G. (2012), Where and when does adult learning happen?A cohort analysis o adult education acquisition in Europe, Neujobs Working Paper N. 4.3.2.
Broek, S.D., Buiskool, B.J., Hake, B. (2010),Impact o ongoing re orms in education and training onthe adult learning sector (2nd phase). Final report, Zoetermeer, the Netherlands Research voor Beleid.
Bruce, L., Aring, M.K., & Brand, B. 1998 . In ormal Learning: The New Frontier o Employee &Organizational Development. InEconomic Development Review , 15 4 : 12 – 18.
Cede op 2008a , Terminology o European education and training policy a selection o 100key terms, Luxembourg: O ce or O cial Publications o the European Communities.
Cede op 2008 ,Sectoral training unds in Europe , Tessaloniki, Luxembourg: O ce or O cialPublications o the European Communities.
Cede op (2009 a), Using tax incentives to promote education and training , Tessaloniki, Luxem-bourg: O ce or O cial Publications o the European Communities.
Cede op 2009 b ,Future skill supply in Europe. Medium-term orecast up to 2020: synthesisreport, Luxembourg: O ce or O cial Publications o the European Communities.
Cede op 2010 ,Skills supply and demand in Europe Medium-term orecast up to 2020 , Luxembourg: Publications O ce o the European Union, 2010.
Cede op (2011),Learning while working. Success stories on workplace learning in Europe ,Luxembourg: Publications O ce o the European Union.
Cede op (2012),Learning and innovation in enterprises , Luxembourg: Publications O ce o the European Union.
Collins. R. (1979), The Credential Society: An Historical Sociology o Education and Strati cation ,New York, Academic Press.
Cross, J. (2007). In ormal Learning: Rediscovering the Natural Pathways that Inspire Innovationand Per ormance , P ei er, San Francisco, CA.

7/27/2019 kina25943enc_0
http://slidepdf.com/reader/full/kina25943enc0 97/112
95ANNEXES
Cseh, M., Watkins, K. E., & Marsick, J., Victoria 2000 ,In ormal and incidental learning in theworkplace , in G. Straka (Ed.), Conceptions o sel -directed learning: theoretical and conceptionalconsiderations Munster, Waxmann: pp. 59 74.
Davies, PH (2004),Is Evidence-Based Government Possible?, Jerry Lee Lecture 2004, 4thAnnual Campbell Collaboration Colloquium Washington DC, 19 February 2004.
Desjardins, R. (2004),Learning or Well Being: Studies Using the International Adult Literacy Survey, Institute o International Education, Stockholm University, Stockholm.
Dohmen, D., Timmermann 2010 ,Financing Adult Learning in times o crisis , Brussels, GHK.
Dockery, A.M., Miller, P.W. (2012),Over-education, under-education and credentialism in the Australian labour market , National Centre or Vocational Education Research – Australian
Government, Adelaide.
Eraut, M., Hirsh, W. (2007), The Signi cance o Workplace Learning or Individuals, Groups and Organisations , Ox ord & Cardi University, ESRC Centre on Skills, Knowledge and Organisa-tional Per ormance.
Ericsson, K. A. (2006),Reproducibly superior pro essional per ormance in a changing world: How it is maintained and improved by deliberate practice . Presentation at the EARLI SIG Pro essionalLearning and Development Con erence, Heerlen, The Netherlands.
Euro ound (2007), Fourth European Working Conditions Survey. Luxembourg: Publications O ce.
Euro ound (2011),Educational and training services: Anticipating the challenges. Overview report , Dublin, Authors: Tine Andersen, Hanne Shapiro, Tom Leney and Clara Emilie Ellegaard.
Euro ound 2012 ,Fifh European Working Conditions Survey , Publications O ce o the European Union, Luxembourg.
Euro ound, (2012b),Work organisation and innovation, Publications O ce o the EuropeanUnion, Luxembourg, Authors: Cox, A., Rickard, C., Tamkin, P.
European Commission 2009 ,Guidance or assessing Social Impacts within the CommissionImpact Assessment system , Re . Ares 2009 326974.
European Commission (2010), An Agenda or new skills and jobs: A European contributiontowards ull employment , Strasbourg, 23.11.2010 COM 682.
European Commission (2010b), A New impetus or European cooperation in vocational educa-tion and training to support the Europe 2020 strategy: Commission Communication, DocumentsCOM 2010 296.
European Union, Council 2011 ,Council Resolution on a renewed European agenda or adult learning , O cial Journal o the European Union, 2011 C372.
European Commission (2011b), Commission Sta Working Document.Progress towards thecommon European objectives in education and training (2010/2011). Indicators and bench-marks , Brussels, SEC, 2011, 526 nal.

7/27/2019 kina25943enc_0
http://slidepdf.com/reader/full/kina25943enc0 98/112
96ADULT AND CONTINUING EDUCATION IN EUROPE
European Commission, Directorate-General or Research and Innovation, Social Sciences andHumanities (2012), Global Europe 2050 , Luxembourg: Publications O ce o the European Union.
European Commission, Eurostat 2012 ,CVTS 4 Manual, Version 6.
Federighi, P., Torlone, F., edited by (2010),Low skilled take their qualifcations “one step up” ,.Final Report o the Study “Enabling the low skilled to take their quali cations one step up ”, theEuropean Commission DG EAC, Firenze University Press.
Ferraz, C., Finan,F., Moreira, D.B. (2012),Corrupting Learning: Evidence rom Missing Federal Education Funds in Brazil , Bonn, IZA DP No. 6634.
Ferrier, F., Dumbrell, T., Burke, G. (2008), Vocational education and training providers in competi-tive training markets , National Centre or Vocational Education Research – Australian Govern-
ment, Adelaide.
Fischer, A., Grei , S. and Funke, J. (2012), The Process o Solving Complex Problems , The Journalo Problem Solving, 4 1 , 19 – 42.
Fouré, J., Bénassy-Quéré, A., Fontagné, L. (2012), The Great Shif: Macroeconomic Projec-tions or the World Economy at the 2050 Horizon , CEPII Working paper 2012-03. Available athttp://www.cepii. r/anglaisgraph/bdd/baseline.htm , also in The CEPII Newsletter, N° 49, 1Q 2012.
Funke, J. 2009 ,Complex problem solving: a case or complex cognition?, Cognitive Processing, 11 2 , 133 – 142.
Glendon, I., Clarke, S. G., & McKenna, E. F.(2006),Human sa ety and risk management , BocaRaton, FL, Taylor and Francis.
Grei , S. (2012),Dynamic Problem Solving: a New Assessment Perspective , Forthcoming inApplied Psychological Measurement.
Hallak, J., Poisson, M. (2007)Corrupt schools, corrupt universities: What can be done? Paris:UNESCO Publishing.
Harward, D. 2012 ,How big is the training market?, in:www.Trainingindustry.com
Hoegl, M., Gemuenden, H.G. (2001), Teamwork Quality and the Success o Innovative Projects:A Theoretical Concept and Empirical Evidence, in: Organization Science, Vol. 12, No. 4, July–August 2001, pp. 435–449.
Hoskins, B., Cartwright, F., Schoo , U.(2010),Making Li elong Learning Tangible! The ELLI Index – Europe 2010 , Gütersloh, Germany, Bertelsmann Stifung.
Howard-Jones, P. (2008), Neuroscience and Education: Issues and Opportunities. A Commentary
by the Teaching and Learning Research Programme , London, ESRCIASA,www.IIASA.ac.at, Population and Human Capital. KeyNote (2012), Training Market Report 2012 . www.KeyNote.co.uk

7/27/2019 kina25943enc_0
http://slidepdf.com/reader/full/kina25943enc0 99/112
97ANNEXES
LLL2010 (2011), Final integrated Report Towards a Li elong Learning Society in Europe: The Con-tribution o Education System , Tallin, Working Paper n. 77, compiled by Ellu Saar and Triin Roosalu.
Lutz, W., Goujon, A., Wils, A. (2005),Forecasting Human Capital: Using Demographic Multi-StateMethods by Age, Sex, and Education to Show the Long-Term E ects o Investments in Educa-tion, Working Paper WP 07 03, Education Policy and Data Center, Washington, DC Academy
or Educational Development .
Maselli, I. 2012 ,The Evolving Supply and Demand o Skills in the Labour Market, in: NeuJobsForum, Challenges Facing European Labour Markets: Is a Skill Upgrade the Appropriate Instru-ment?, Intereconomics.
Mikelson, K.S., Nightingale D. (2004),Estimating Public and Private Expenditures on Occu- pational Training in the United States , U.S. Department o Labor Employment and Training
Administration NW Washington.
Minchington, B., (2010)Employer Brand Leadership - A Global Perspective . Torrensville. Col-lective Learning Australia.
Monti, M. (2012),Cambiare l’Italia, Ri ormare l’Europa. Un’Agenda per un impegno comune ,23 dicembre 2012.
Morin, E. 2004 ,The meaning o work in modern times, Con erence. 10th World Congress onHuman Resources Management , Rio de Janeiro, Brazil, August, 20th, 2004.
Mourshed, M., Chijioke, C., Barber, M. 2010 ,How the world’s most improved school systemskeep getting better , McKinsey & Company,www.mckinsey.com
Nilsson, N. J. 2009 ,The quest or arti cial intelligence. A history o ideas and achievements ,Cambridge, Cambridge University Press.
Ochse, K.L. (2004), Preventing Corruption in the Education System. A Practical Guide . Eschborn,Deutsche Gesellschaf ür Technische Zusammenarbeit, Commissioned by Federal Ministry orEconomic Cooperation and Development, Germany.
OECD (2003), Beyond Rhetoric: Adult Learning Policies and Practices , Paris, OECD Publications.
OECD and Statistics Canada 2005 ,Learning a Living: First Results o the Adult Literacy and Li e Skills Survey , Ottawa and Paris.
OECD (2010),Innovative workplaces: making better use o skills within organisations , Paris,OECD Publishing.
OECD, Statistics Canada 2011 ,Literacy or Li e: Further Results rom the Adult Literacy and Li e Skills Survey , OECD Publishing.
OECD 2012 ,Education at a Glance 2012: OECD Indicators, OECD Publishing.
OECD and Eurostat 2005 ,Oslo Manual: Guidelines or Collecting and Interpreting InnovationData, 3rd edition, OECD, Paris,www.oecd.org/sti/oslomanual

7/27/2019 kina25943enc_0
http://slidepdf.com/reader/full/kina25943enc0 100/112
98ADULT AND CONTINUING EDUCATION IN EUROPE
Poisson, M. 2010 ,Corruption and Education , Bruxelles Paris, International Academy or Education and International Institute or Educational Planning Unesco.
Reich, R. B.(1991),The Work o Nations Preparing Ourselves or 21st-Century Capitalism , New York, Knop .
Romer, P.M. (1990),Endogenous Technological Change , in: The Journal o Political Economy,Vol. 98, N. 5, Part 2: The Problem o Development: A Con erence o the Institute or the Studyo Free Enterprise Systems Oct., 1990 , pp. S71 S102.
Romer, P.M. (1994), The origins o endogenous growth, in The Journal o Economic Perspec-tives, Vol. 8, n.1, pp 3 22.
Rosenboom, N, Tieben, B. (2012),Marktmonitor private aanbieders van beroepsopleidingen ,SEO Economisch Onderzoek, Amsterdam.
Schoo , U., Blinn, M., Schleiter, A., Diaz, M., Jacob, E (2012),The German Learning Atlas. MakingLi elong Learning Tangible on a Regional Level , Gütersloh, Germany, Bertelsmann Stifung.
Schuller, T., Watson, D. (2009),Learning Through Li e: Inquiry into the Future or Li elongLearning , Leicester, NIACE.
SER Sociaal Economische Raad 2012 ,Werk maken van scholing. Advies over de postinitiëlescholingsmarkt, Den Haag.
Silber, J. M., Condra, P. (2012), Education and Training , Equity Research, New York, BMO CapitalMarkets Corp., September 2012
Simpson, L. (2009), Sector paper: The private training market in the UK , IFFL Sector Paper 2, NationalInstitute o Adult Continuing Education, Inquiry into the Future or Li elong Learning, Leicester.
Statistics Canada, Organisation or Economic Co-operation and Development (2005), Learninga Living. First Results o the Adult Literacy and Li e Skills Survey , Minister o Industry , Canadaand Organisation or Economic Cooperation and Development OECD , Paris.
Tamilina, L. (2012),LLLight Project’s approaches to human capital measurement , LLIGHTProject Position Paper, No. 2012 2, p. 19.
Transparency International 2013 ,Global Corruption Report: Education , http://www.transparency.org/research/gcr/gcr_education
True, J. L., Jones, Bryan D., Baumgartner, F. R. 1999 ,Punctuated-Equilibrium Theory Explain-ing Stability and Change in Public Policymaking , in: Paul Sabatier, Editor, Theories o the PolicyProcess, Boulder Ox ord, Westview Press.
Thum, A-E., Beblavy M. (2012),Do Acquaintances and Friends make us Learn? Social capital
and li elong learning in Germany , Brussels, NeuJobs Working Paper N. 4.3.Van Ours, J.C., Stoeldraijer, L. 2010 , Age, Wage and Productivity , Bonn, IZA. Discussion PaperNo. 4765, February 2010
Vicari, S. 2008 ,Conoscenza e impresa , in Sinergie, n. 76, 2008, pp. 43 66.

7/27/2019 kina25943enc_0
http://slidepdf.com/reader/full/kina25943enc0 101/112
99ANNEXES
Annex 2 – List o European research projectsINNOSERV – Innovative Social Services Plat orm www.inno serv.eu
LLL2010 – Towards a li elong learning society in Europe: the contribution o the educationsystem http://lll2010.tlu.ee
LLLight’in’Europe – Li eLong, Learning, Innovation, Growth and Human Capital, Tracks inEurope www.lllightineurope.com
NEUJOBS – Creating and adapting jobs in Europe in the context o a socio-ecological transitionhttp://www.neujobs.eu
WALQING – Work and Li e in New and Growing jobs http://www.walqing.eu
YOUNEX – Youth, unemployment, and exclusion in Europe: A multidimensional approach tounderstanding the conditions and prospects or social and political integration o young unem-ployed” http://www.younex.unige.ch

7/27/2019 kina25943enc_0
http://slidepdf.com/reader/full/kina25943enc0 102/112
100ADULT AND CONTINUING EDUCATION IN EUROPE
Annex 3 – List o AcronymsACVET Adult and Continuing Vocational Education and TrainingAES Adult Education SurveyALL Adult Literacy and Li e Skills SurveyCEDEFOP European Centre or the Development o Vocational TrainingCEPII Centre d’Etudes Prospectives et d’In ormations InternationalesCVET Continuing Vocational Education and TrainingCVTS Continuing Vocation Training SurveyELLI European Li elong Learning IndexEWCS European Working Conditions SurveyIALS International Adult Literacy SurveyIIASA International Institute or Applied System AnalysisICT In ormation and communication technology
ISCED International Standard Classi cation o EducationISCO International Standard Classi cation o OccupationsLFS Labour Force SurveyNAEP National Assessment o Educational Progress USANEET Young people neither in employment nor in education and trainingNCVER National Centre or Vocational Education Research AustraliaOECD Organisation or Economic Cooperation and DevelopmentPIAAC Programme or the International Assessment o Adult CompetenciesPISA Programme or International Student AssessmentR&D Research and DevelopmentSEO SEO Economisch OnderzoekSER Sociaal Economische Raad o the NetherlandsSTF Sectoral Training FundsTIMSS Trends in International Mathematics and Science StudyUNESCO United Nations Educational, Scienti c and Cultural OrganisationVET Vocational Education and Training6 and 7 FP Sixth and Seventh Framework Programmes or Research

7/27/2019 kina25943enc_0
http://slidepdf.com/reader/full/kina25943enc0 103/112
101ANNEXES
Annex 4 – List o BoxesBox 1. Changes in population and labour orce by age, 2010 20, EU 27+ ....................................11Box 2. Median value added and median labour costs by age group; log scale ..........................12Box 3. Supply trends in labour orce 15+ by quali cation, EU 27+ ..................................................1Box 4. Participation in ormal or non ormal education and training by educational
attainment %. Age 25 64 years. ..................................................................................................Box 5. Net employment change by occupation and quali cation, 2010 20, EU 27+ ...............13Box 6. Participation in higher education o students whose parents have low levels o
education OECD, 2009 ................................................................................................................Box 7. Participation rate in education and training by labour status 2007 ...............................16Box 8. Overview o our indicators o educational hardship ..................................................................Box 9. Cohort analysis using the LFS macro data .....................................................................................Box 10. Cohort analysis using the LFS macro data ......................................................................................Box 11. Participation in ormal education and training by age groups
rom 25 to 34 years and rom 45 to 54 years % ........................................................................24Box 12. Overview – participation events in adult education ......................................................................2Box 13. Participation in ormal or non ormal education and training by age groups
rom 25 to 64 years % ..................................................................................................................Box 14. Participation o adults aged 25 64 in education and training by NUTS 2 regions
rom 2000 % ............................................................................................................................Box 15. Participation in workplace training 24 34 and 50 59 ..............................................................Box 16. Socio-demographic obstacles or participation in adult education in the AES countries .......29Box 17. Scatter plot between the predicted probability to attend a pro essional
class and the sociability scale or the low skilled .........................................................................3Box 18. Participation in non ormal education and training by age groups
rom 25 to 64 years % ...................................................................................................................Box 19. Learning new things at work, by occupation, EU27 % ..............................................................Box 20. Types o teamwork, by sector % ................................................................................................Box 21. My job o ers good prospects or career advancement ..............................................................36Box 22. Characteristics o a job rich in meaning.........................................................................................Box 23. Your job involves tasks that are in con ict with your personal values ..............................37Box 24. Satis action with working conditions over time, by occupation, EU27 % ......................38Box 25. Type o employment contract, by age group % .........................................................................Box 26. Types o patterns o relationships between labour market activity,
part time work and participation in ormal adult education ...................................................39Box 27. Your manager helps and supports you ............................................................................................Box 28. Employer paid training requested and provided, by country % ..........................................42Box 29. Participation in employer-paid training and on-the-job training, by sector, EU27 (%) ......43Box 30. Interactions between time, mode o cognition and type o process ...................................44Box 31. Complex problem solving by occupation at a large automotive company ......................44Box 32. Low per ormers in reading literacy 2000 2009 ............................................................................Box 33. Job Polarisation in EU27, 2000 2010 .............................................................................................Box 34. Demand and Supply o Work with Respect to Skills/ Tasks in the EU27, 2010-2020 ...... 46Box 35. Human capital development potential ............................................................................................Box 36. Drivers o innovation ......................................................................................................................Box 37. A Typology o Innovation Modes or EU Member Nations .........................................................Box 38. Does your work involve solving un oreseen problems on your own? ..................................54Box 39. Relation between discretionary learning and percentage o lead innovators ...............55
Box 40. Summary innovation index 2006 and type o training and innovationindex 2005 CVTS3 ......................................................................................................................Box 41. The Dutch post initial training turnover: €3.2 billion....................................................................60Box 42. Annual labour costs o employer sponsored non ormal education as a percentage
o GDP 2007 Employed 25 64 year olds ................................................................................

7/27/2019 kina25943enc_0
http://slidepdf.com/reader/full/kina25943enc0 104/112
102ADULT AND CONTINUING EDUCATION IN EUROPE
Box 43. Type o thin markets .......................................................................................................................Box 44. Participation, source o nancing and skill mismatch Percentage o adults aged 16
to 65 years excluding ull time students aged 16 to 24 receiving adult educationand training during the 12 months preceding the interview, by source o nancing,by match mismatch categories, and by country, 2003 and 2008 ......................................62
Box 45. Type o organisations ......................................................................................................................Box 46. Types o training o ered ................................................................................................................Box 47. Re erence markets o training industries operating in the Netherlands ..........................66Box 48. Training providers by number o employees in the UK ................................................................6Box 49. Financing adult education: the space o revenues and expenditures by economic
unit nancial resources ...............................................................................................................Box 50. Mean reading score in PISA 2009 and perceptions o corruption ........................................74Box 51. Distribution o test scores or mathematics by corruption .......................................................74Box 52. ELLI and Corruption Index ............................................................................................................Box 53. Corrupt practices in the education sector .......................................................................................Box 54. List o the more important European sources ...............................................................................Box 55. Improvement rom poor to air to good to great ...........................................................................Box 56. Types o Research Evidence...........................................................................................................Box 57. Educational level in selected countries and zones, 1980 2050,
percentage o working age population ......................................................................................

7/27/2019 kina25943enc_0
http://slidepdf.com/reader/full/kina25943enc0 105/112
103ANNEXES
De nitionsCVET policies address adults who work with “Education or training afer initial education andtraining – or afer entry into working li e aimed at helping individuals to:
improve or update their knowledge and/or skills;
acquire new skills or a career move or retraining;
continue their personal or pro essional development.” Cede op, 2008a .
Adult education policies re er to a wider eld, which includes CVET, and extends to the entirerange o ormal, non ormal and in ormal learning activities, general and vocational, under
taken by adults afer leaving initial education and training European Union, Council 2011:3 .
Both de nitions are consolidated and shared, being the ruit o more than hal a century o veri cations and improvements (started by Unesco in Helsinor in 1949). They still stronglyidenti y learning with school and training and with some pro essional courses. Everything thatdoes all within these systems is considered in ormal, extraneous and uncerti ed. However, oradults, particularly in the workplace, acquiring knowledge takes place within strongly struc-tured and regulated processes, no less than learning processes in ormal educational systems.This is why research on the subject began to adopt new categories: deliberative training andnatural training. The rst one corresponds to all activities that intentionally produce people’spersonal and pro essional growth. The second one corresponds to the other activities whichare achieved outside a project intentionally built by a social actor.
In the pages that ollow we will use data originating rom various surveys, each one o whichhas its de nition o the eld, not always per ectly comparable or well de ned.
The de nition adopted in Euro ound (2012) distinguishes between the concept o “cognitiveactors” (which includes work tools, knowledge-management processes, and also skills and
learning , “skills” identi ed with the capabilities and knowledge that allow work to be carriedout , “training” de ned as activity accessed by paying a ee and “training on the job” meantas training received on the workplace .
The de nition adopted by the Continuing Vocational Training Survey (CVTS) is more restric-tive since it re ers to the “training” phenomenon, limiting identi cation to situations in whichthe training is: planned in advance is the result o a decision in the enterprise , organised orsupported with the speci c goal o learning (the primary objective is the acquisition o newcompetences or the development and improvement o existing competences), and nanced
ully or at least partly by the enterprise. Hence, the dimension o cognitive actors is not considered. “There must be an actual activity or event or set o activities or events, which canbe identi ed as a speci c and separate period o training, rather than an on-going activitythat cannot be distinguished rom work (learning by experience or random learning is to be
excluded ” European Commission, Eurostat, 2012:21 .The de nition adopted by Eurostat (www.eurostat.eu) or identi ying participation in li elonglearning includes all learning activity undertaken throughout li e, with the aim o improvingknowledge, skills and competences, within a personal, civic, social, and employment related

7/27/2019 kina25943enc_0
http://slidepdf.com/reader/full/kina25943enc0 106/112
104ADULT AND CONTINUING EDUCATION IN EUROPE
perspectives. It considers learning activities to be: any activities o an individual organisedwith the intention to improve his/her knowledge, skills, and competences. Intentional learn-ing (as opposed to random learning) is de ned as a deliberate search or knowledge, skills,competences, or attitudes o lasting value. Organised learning is de ned as learning plannedin a pattern or sequence with explicit or implicit aims.
Formal education is de ned as education provided in the system o schools, colleges, universi-ties and other ormal educational institutions that normally constitutes a continuous “ladder”o ull time education or children and young people, generally beginning at the age o ve toseven and continuing to up to 20 or 25 years old.
Non Formal Education is de ned as any organised and sustained educational activities that donot correspond exactly to the above de nition o ormal education. Non- ormal education maythere ore take place both within and outside educational institutions and cater to persons o
all ages. Depending on country contexts, it may cover educational programmes to impart adultliteracy, basic education or out o school children, li e skills, work skills, and general culture.
In the ollowing pages, we will use the term “adult and continuing education” to include bothCVET and adult education concepts. It is an expression that has been used in the USA or thispurpose since the early 1980s, when the American Association or Adult and Continuing Educa-tion was established. Nowadays, the term is also adopted by some national statistical centres(like National Centre or Educational Statistics at USA Department o Education) or by nationalinstitutions like the National Institute or Adult Continuing Education in England and Wales .

7/27/2019 kina25943enc_0
http://slidepdf.com/reader/full/kina25943enc0 107/112
European Commission
EUR 25943 — Adult and continuing education in Europe: Using public policy to securea growth in skills
Luxembourg: Publications O ce o the European Union
2013 — 104 pp. — 17.6 x 25.0 cm
ISBN 978 92 79 29623 9doi:10.2777/98975

7/27/2019 kina25943enc_0
http://slidepdf.com/reader/full/kina25943enc0 108/112

7/27/2019 kina25943enc_0
http://slidepdf.com/reader/full/kina25943enc0 109/112

7/27/2019 kina25943enc_0
http://slidepdf.com/reader/full/kina25943enc0 110/112

7/27/2019 kina25943enc_0
http://slidepdf.com/reader/full/kina25943enc0 111/112
HOW TO OBTAIN EU PUBLICATIONS
Free publications:
• one copy:via EU Bookshop (http://bookshop.europa.eu);
• more than one copy or posters/maps:from the European Union’s representations (http://ec.europa.eu/represent_en.htm);from the delegations in non-EU countries (http://eeas.europa.eu/delegations/index_en.htm);by contacting the Europe Direct service (http://europa.eu/europedirect/index_en.htm) or calling 00 800 6 7 8 9 10 11 (freephone number from anywhere in the EU) (*).
(*) The information given is free, as are most calls (though some operators, phone boxes or hotels may charge you).
Priced publications:
• via EU Bookshop (http://bookshop.europa.eu).
Priced subscriptions:
• via one of the sales agents of the Publications Office of the European Union(http://publications.europa.eu/others/agents/index_en.htm).

7/27/2019 kina25943enc_0
http://slidepdf.com/reader/full/kina25943enc0 112/112
Adult and continuing education has the dual unction o contributing toemployability and economic growth, on the one hand, and responding tobroader societal challenges, in particular promoting social cohesion, on theother. Companies and amilies support important investments that have, todate, ensured important growth in both skills and the ability o the Europeanpopulation to innovate. Thanks to this commitment, Europe today has awealth o organisations specialising in adult and continuing education. The
sector has grown in importance, both as a increasingly signi cant playerin the economy and in view o its capacity to respond to the demand
or learning by the knowledge economy. As this book shows, adult andcontinuing education has a critical role to play in ensuring Europe copes withthe phenomenon o education exclusion, which, repeated year afer year,generation afer generation, undermines social cohesion and the growth o employment. Public policies must respond to two strategic challenges: toencourage the propensity to invest in adult and continuing education and toguarantee the reduction o educational exclusion.
Studies and reports
K I -N A -2 5 - 9 4 3 -E N - C


