Embed Size (px)
Citation preview

48 City of Baltimore Comprehensive Master Plan
Key TrendsFrom the outset, it is important to recognize that trends themselves are not necessarily positive or negative, rather a reflection of a constantly changing urban landscape. All change presents both challenges and opportunities. Whether Baltimore becomes overwhelmed by the hazards of change or seizes the opportunities for a better quality of life is largely within our control as residents, leaders and policymakers. LIVE • EARN • PLAY • LEARN focuses on the opportunities.
Many of the changes Baltimore has experienced over the past 50 years have also happened in other older urban areas. The growth of population and jobs in suburbs around big cities has been a key trend nationwide over the last 60 years. Manufacturing jobs have been replaced by white collar and service-oriented jobs not only in Baltimore, but in nearly all of the older cities of the Northeast and Midwest.
Nevertheless, Baltimore is still uniquely Baltimore, and the City’s trends need to be seen in the light of our own history of growth, expansion and dispersion. Baltimore has been decompressing and spreading out to its sub-urbs for more than a century, ever since horse drawn street cars, and later electric railways, allowed people to live beyond walking distance of their jobs. The Baltimore Region has never stopped growing, but growth has increasingly happened outside the core City limits. Baltimore City’s popu-lation is projected to stabilize and increase slightly over the next twenty-five years, while the region’s population is projected to grow by a quarter of a million people during the same timeframe. As we move into the next

Key Trends 49
INTR
OD
UC
TION
SU
MM
AR
Y H
ISTO
RY
KE
Y TR
EN
DS
LIVE
EA
RN
PLAY
LEA
RN
IMP
LEM
EN
TATION
MA
NA
GE
ME
NT FIN
AN
CIA
L CO
NC
LUS
ION
GLO
SS
AR
Y A
PP
EN
DIC
ES
Key Trends
millennium, current and emerging trends provide cause for optimism that Baltimore can position itself for a future of growth and prosperity.
Conditions in America’s Cities: Changes & Challenges
The following trends reflect the state of America’s cities, both in the progress that they have made and the challenges they continue to face. Five reports: The State of the Cities 1999 (U.S. Department of Housing & Urban Devel-opment (HUD)); The State of America’s Cities: 2005 (National League of Cities); Income, Poverty, and Health Insurance Coverage in the United States: 2004 (U.S. Census Bureau); Living Cities (the Brookings Institu-tion); and HUD’s State of the Cities Data System, contributed to the follow-ing indicators of urban conditions.
Population
During the 1980s and 1990s, many West Coast and Southwest cities gained population: Phoenix, AZ (68 percent), San Antonio, TX (45 percent), and Portland, OR (44 percent). Some of the increase was due to annexation of surrounding jurisdictions; Baltimore has not been able to annex land since 1918. However, Baltimore, like many other Mid-Atlantic and Midwest cit-ies continued to lose population. In 2000, Baltimore was the 17th largest city in the nation.
Baltimore Philadelphia Cleveland Washington, DC
Population Change, 1980 to 2000
-17.2% -10.1% -16.6% -10.4%
Housing
In 2000, in Baltimore City, the homeownership rate was 50.2 percent, up from 48.6 percent in 1990. The U.S. homeownership rate was 66.2 percent; in the 100 largest cities, the homeownership rate was 52.8 percent. In Baltimore City, 40.0 percent of renters paid more than 30 percent of their income on rent, which is about average for American cities (average from sample of 23 cities is 40.2 percent). However, Baltimore had significantly fewer renters in the low-middle income range ($20,000-$35,000) paying more than 30 per-cent of their income for rent than most other American cities (Baltimore 25.1 percent, average from sample of 23 cities is 42.6 percent).
Baltimore Philadelphia Cleveland Washington, DC
Homeownership Rate 50.3% 59.3% 48.5% 40.8%
Paying more than 30% on rent
40.0% 42.5% 40.7% 35.2%
Income $20,000 to 35,000, paying more than 30% on rent
25.1% 35.1% 20.0% 35.4%
Income and Poverty
Baltimore ranks 87 out of the 100 largest U.S. cities in terms of median house-hold income. Approximately 2 in 10 Baltimore City residents live below the poverty line (22.9 percent) and approximately 4 in 10 families with children

50 City of Baltimore Comprehensive Master Plan
live below 150 percent of the poverty line (39.5 percent). Nationally, an average of 1 in 10 residents live below the poverty line (12.4 percent) and approximately 3 in 10 families with children live below 150 percent of the poverty line (29.3 percent).
Baltimore Philadelphia Cleveland Washington, DC
Median Household Income, 2000
$30,078 $30,746 $25,928 $40,127
Percent Change Median Income, 1990 to 2000
-6.9% -7.0% 8.3% -2.8%
Poverty rate 22.9% 22.9% 26.3% 20.2%
Families with children under 150 percent poverty rate
39.5% 38.0% 47.8% 35.2%
Employment
In 2000, Baltimore’s labor force participation rate (56.6 percent) ranked 95th out of the 100 largest U.S. cities (average 63 percent). Baltimore’s unemploy-ment rate (8 percent) ranked 80th (average 5.4 percent).
Baltimore Philadelphia Cleveland Washington, DC
Labor Force Partici-pation Rate
56.6% 55.9% 57.4% 63.6%
U n e m p l o y m e n t Rate
8.0% 7.5% 8.3% 6.4%
Commuting Patterns
Approximately 6 in 10 Baltimore City residents work in Baltimore City (61.9 percent). Nationally, an average of 7 in 10 residents of a center city also work in the center city (70.4 percent). Less than 1 in 3 residents of the Bal-timore Region work in Baltimore City (28.7 percent).
Baltimore Philadelphia Cleveland Washington, DC
Central city to cen-tral city
13.4 19.0 12.5 11.7
Central city to suburb
7.4 5.9 9.1 4.1
Suburb to central city
15.3 9.9 18.3 20.9
Suburb to suburb 51.2 57.4 55.4 59.1
Outside metro area 12.7 7.8 4.7 4.2

Key Trends 51
INTR
OD
UC
TION
SU
MM
AR
Y H
ISTO
RY
KE
Y TR
EN
DS
LIVE
EA
RN
PLAY
LEA
RN
IMP
LEM
EN
TATION
MA
NA
GE
ME
NT FIN
AN
CIA
L CO
NC
LUS
ION
GLO
SS
AR
Y A
PP
EN
DIC
ES
Baltimore: From Mid-Century to TodayPopulation
In the 1950’s, Baltimore was a city in the midst of a post-war economic boom. Fueled by plentiful jobs and a climate of opportunity, the City’s population swelled to nearly 950,000. The population declined over the next half century to 651,154 in 2000 - a loss of approximately 30 percent from our peak popula-tion in 1950. Since 2000, annual population estimates indicate a leveling off of population decline and a slight future increase in population, based on popula-tion forecasts completed by the Baltimore Metropolitan Council with the sup-port of the Baltimore City Department of Planning.
Households
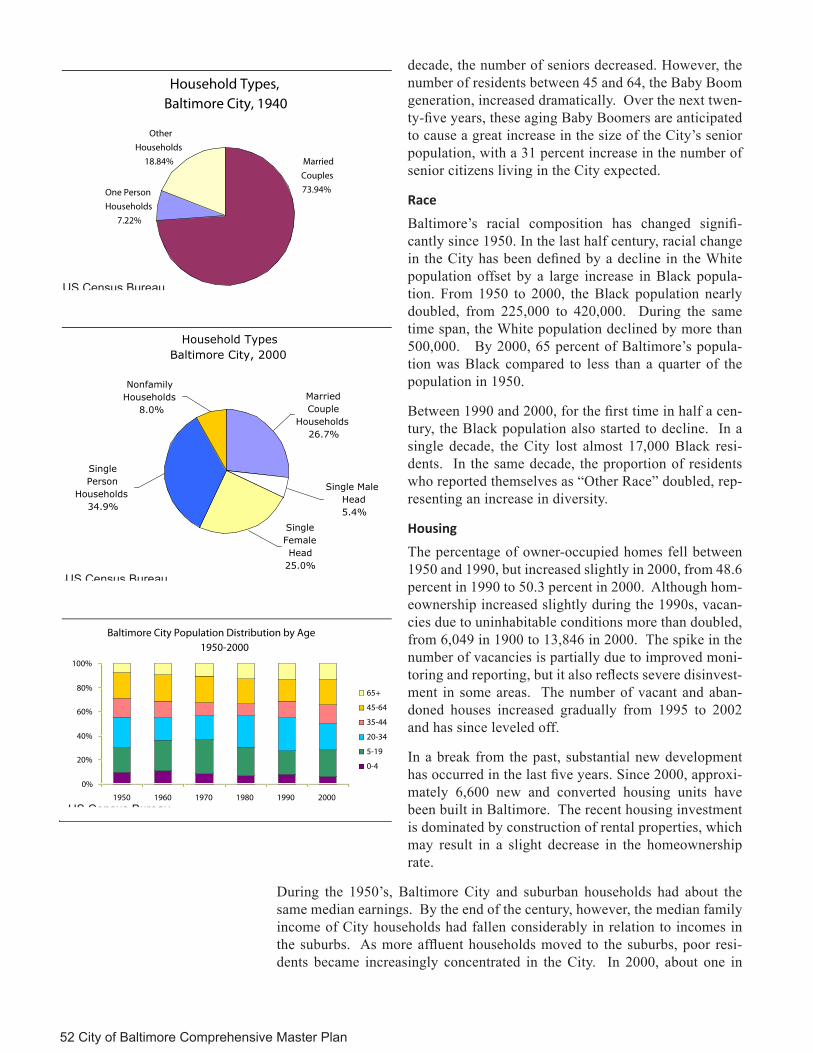
The characteristics of Baltimore households have changed significantly since 1940. The number and size of City households decreased over the last five de-cades. In 2000, the average household size was 2.42 people compared to 3.41 people in 1950, which reflects a dramatic change in the composition of city households. In 2000, only 27 percent of households were headed by married couples compared to a vast majority in 1940. Today, a majority of house-holds are either headed by a single parent or contain a single person. Age
Baltimore of the 1950’s and 1960’s was a youthful city. The Baby Boom was in full swing. Children under the age of 14 comprised the largest single age group in 1960, and City policies favored school construction. The el-derly were a small proportion of the population, and made relatively few demands on City services. Only one in every 14 Baltimore residents was older than 65. Baltimore also has a slightly higher percentage of senior residents than the state, with 17 per-cent of City residents currently over the age of 60, versus 14 percent statewide.
In 2000, Baltimore’s population was less youthful than during the post World War II Baby Boom. The number and proportion of City youth have declined steadily since 1950. In particular, the population under 5 years of age decreased by nearly 30 percent between 1990 and 2000. In contrast, today residents over the age of 65 account for 13.2 percent of the population compared to 7.3 percent in 1950. In the last
6
Baltimore Region Population Trends & Projections 1950-2035
Source: U.S. Census Bureau & Round 7 Cooperative Forecast from the Baltimore Metropolitan Council, 2007
807 , 94 9
95 7 ,50 9
4 1 0,6 3 7
45 1,1 5 6
007 ,84 6
0 02 ,9 56
004,9 66
00 8,5 7 6
00 9, 18 6
0 09,5 86
00 0, 68 6
07 3 ,7 33 ,1
07 6, 07 0,2
07 1 ,2 83 ,2
983,515,2
00 6, 43 6 ,2
004,147,2
0 06 ,0 28 ,2
005 , 178 , 2
002,809 ,2
00 9,93 9,2
00 5,859,2
0
500,000
1,000,000
1,500,000
2,000,000
2,500,000
3,000,000
3,500,000
1950 1970 1990 2000 2005 2010 2015 2020 2025 2030 2035
Baltimore City Baltimore Region
Baltimore City Population & Household Change 1950 - 2000
949,708 939,024905,759
786,775736,014
651,154
268,096 275,597 289,349 281,414 275,977 257,996
0
200,000
400,000
600,000
800,000
1,000,000
1950 1960 1970 1980 1990 2000
Population Households
Source: U.S. Bureau of Census
Baltimore City Population & Household Change 1950 - 2000
8 07,9 49
4 20,9 39
957, 50 9577,687
410 ,63 7
4 51,156
6 90,8 62
7 95,5 72
943, 98 2
414 ,182
7 79,5 72
699,752
0
200,000
400,000
600,000
800,000
1,000,000
195019601970198019902000
PopulationHouseholds
Source: U.S. Bureau of Census
Baltimore City Population & Household Change 1950 - 2000
807, 949
42 0, 93 9
95 7 ,5 09
577,687
4 10, 637
45 1,156
69 0,86 2
79 5 ,57 2
9 43,9 82
414,18 2
779, 57 2
699 ,752
0
200,000
400,000
600,000
800,000
1,000,000
1950 1960 1970 1980 1990 2000
Population Households
Source: U.S. Bureau of Census
52 City of Baltimore Comprehensive Master Plan
decade, the number of seniors decreased. However, the number of residents between 45 and 64, the Baby Boom generation, increased dramatically. Over the next twen-ty-five years, these aging Baby Boomers are anticipated to cause a great increase in the size of the City’s senior population, with a 31 percent increase in the number of senior citizens living in the City expected.
Race
Baltimore’s racial composition has changed signifi-cantly since 1950. In the last half century, racial change in the City has been defined by a decline in the White population offset by a large increase in Black popula-tion. From 1950 to 2000, the Black population nearly doubled, from 225,000 to 420,000. During the same time span, the White population declined by more than 500,000. By 2000, 65 percent of Baltimore’s popula-tion was Black compared to less than a quarter of the population in 1950.
Between 1990 and 2000, for the first time in half a cen-tury, the Black population also started to decline. In a single decade, the City lost almost 17,000 Black resi-dents. In the same decade, the proportion of residents who reported themselves as “Other Race” doubled, rep-resenting an increase in diversity.
Housing
The percentage of owner-occupied homes fell between 1950 and 1990, but increased slightly in 2000, from 48.6 percent in 1990 to 50.3 percent in 2000. Although hom-eownership increased slightly during the 1990s, vacan-cies due to uninhabitable conditions more than doubled, from 6,049 in 1900 to 13,846 in 2000. The spike in the number of vacancies is partially due to improved moni-toring and reporting, but it also reflects severe disinvest-ment in some areas. The number of vacant and aban-doned houses increased gradually from 1995 to 2002 and has since leveled off.
In a break from the past, substantial new development has occurred in the last five years. Since 2000, approxi-mately 6,600 new and converted housing units have been built in Baltimore. The recent housing investment is dominated by construction of rental properties, which may result in a slight decrease in the homeownership rate.
During the 1950’s, Baltimore City and suburban households had about the same median earnings. By the end of the century, however, the median family income of City households had fallen considerably in relation to incomes in the suburbs. As more affluent households moved to the suburbs, poor resi-dents became increasingly concentrated in the City. In 2000, about one in
Household Types,Baltimore City, 1940
One Person
Households
7.22%
Other
Households
18.84% Married
Couples
73.94%
Baltimore City Population Distribution by Age 1950-2000
0%
20%
40%
60%
80%
100%
1950 1960 1970 1980 1990 2000
65+
45-64
35-44
20-34
5-19
0-4
Source: U.S. Census Bureau
Household TypesBaltimore City, 2000
Single Female Head
25.0%
Single Male Head5.4%
Married Couple
Households26.7%
Nonfamily Households
8.0%
Single Person
Households34.9%
Source: U.S. Census 2000
US Census Bureau
US Census Bureau
US Census Bureau

Key Trends 53
INTR
OD
UC
TION
SU
MM
AR
Y H
ISTO
RY
KE
Y TR
EN
DS
LIVE
EA
RN
PLAY
LEA
RN
IMP
LEM
EN
TATION
MA
NA
GE
ME
NT FIN
AN
CIA
L CO
NC
LUS
ION
GLO
SS
AR
Y A
PP
EN
DIC
ES
Baltimore City Racial Composition 2000
White 31.6%
Black64.3%
Two or More Races1.5%
Asian1.6%
Other Race0.7%Native
American0.3%
Source: U.S. Census 2000
every five Baltimore residents lived below the poverty line. From 1990 to 2000, there was an 8 percent decrease in the number of individuals living in poverty.
Education
While the education level of Baltimore residents has im-proved over the last few decades, the City lags behind surrounding counties in terms of adult educational attain-ment. In 2000, more than 30 percent of City adults had not completed high school, double the average rate for the surrounding counties. Only 22 percent of Baltimore residents have a college degree compared to 36 percent in Baltimore County and 59 percent in Howard County.
Economy & Employment
Driven by a huge demand for durable goods during World War II and immediately thereafter, Baltimore’s economy prospered in the 1950s. About one-third of all employees in the City worked in manufacturing. Good wages enabled most Baltimore workers to support an entire family on the salary of a single wage earner. In the next half century, blue collar manufacturing jobs were replaced by white collar service jobs.
Unlike other industrial cities, Baltimore’s manufactur-ing base was not dominated by a single industry – as was Pittsburgh with steel or Detroit with automobiles.
A booming service sector, including health care, technol-ogy, higher education, legal and accounting services, has enabled the City of Baltimore to remain the dominant economic center of the re-gion. In 2000, the vast majority of City residents worked in services or related jobs sectors such as finance, insurance, real estate and information. Among the biggest growth sectors for service jobs are health care, educational services, and accounting.
Employment opportunities in Bal-timore have been projected to grow slowly through 2030. However, jobs in the whole region are expected to in-crease at a faster rate, effectively de-creasing the City’s share of jobs in the region.
The Maryland Office of Planning de-fines the Baltimore Region as Balti-more City and the surrounding counties of Anne Arundel, Baltimore, Car-roll, Harford, and Howard. (The US Census Bureau also includes Queen Anne’s County in their regional statistics.)
Vacant & Abandoned Housing in Baltimore 1970 - 2004
6,2296,302 6,0499,247 10,54311,35511,89012,46413,84613,72315,19015,75315,8640
2,0004,0006,0008,000
10,00012,00014,00016,00018,000
1970 1980 1990 1995 1996 1997 1998 1999 2000 2001 2002 2003 2004
Source: Baltimore City Department of Housing & Community Development
1970 20040
2000
4000
6000
8000
10000
12000
14000
16000
18000
1970 1980 1990 1995 2000 2001 2002 2003 2004 2005 2006 2007 2008 2009
Vacant & Abandoned Housing in Baltimore1970-2009

54 City of Baltimore Comprehensive Master Plan
Three aspects of the Baltimore region are especially noteworthy: its access to water and related port activities; its proximity to Washington, DC; and its geographic position in the middle of the huge megalopolis extending from Boston to Richmond.
The Greater Baltimore State of the Region Report compares 20 regional economies: Atlanta, Austin, Baltimore, Boston, Charlotte, Cleveland, Dal-las, Denver, Indianapolis, Minneapo-lis, Philadelphia, Pittsburgh, Raleigh, Richmond, San Diego, Seattle, St. Louis, Tampa and Washington, DC.
The Baltimore Region Compared to Other Regions Across the U.S.
In December 2005, the Greater Balti-more Committee and the Greater Bal-timore Alliance jointly released the Greater Baltimore State of the Region Report about our metropolitan area. The report compared the Baltimore region to a benchmark group of met-ropolitan areas in the U.S. on numer-ous indicators of economic and social health.
The findings confirm that our region has both strengths to build on and challenges to address. The Greater Baltimore region is relatively affluent with a strong relationship to the Wash-ington, DC region. We offer top-notch health care, transportation and cultural assets, and quality higher education institutions. However, our competi-tiveness as a region is hindered by low employment growth and a relatively less diverse economic structure than Washington, DC.
Baltimore Region’s Population
The Baltimore Region’s population has remained relatively stable com-pared to the twenty benchmark regions in the State of the Region report with a low rate of growth between 2000 and 2004. Our region ranks fifteenth with 3.4 percent growth.
Persons in Poverty in Baltimore Region 2000
47,603 (6.3%)
24,335 (5%)
10,695 (4.9%)
5,617 (3.7%)
9,491 (3.8%)
143,514 (22%)
0 50,000 100,000 150,000
Baltimore City
Baltimore County
Anne Arundel Cnty
Harford County
Howard County
Carroll County
Source: U.S. Census 2000
Adult Educational Attainment in Baltimore Region, 2000
0%
10%
20%
30%
40%
50%
60%
70%
80%
90%
100%
AnneArundel
Co.
BaltimoreCounty
CarrollCounty
HarfordCounty
HowardCounty
BaltimoreCity
Graduate Degree
Bachelor Degree
Associate Degree
H.S. Grad
Not H.S. Grad
Source: U.S. Census 2000
Baltimore Region Median Family Income 1950-2000
$2,098$5,659 $8,815
$15,721
$28,217$35,440
$2,159$6,199
$10,577
$59,324
$21,826$42,206
$0
$10,000
$20,000
$30,000
$40,000
$50,000
$60,000
1950 1960 1970 1980 1990 2000
Baltimore City Baltimore Region
Source: U.S. Census Bureau
US Census Bureau
US Census Bureau
,
US Census Bureau

Key Trends 55
INTR
OD
UC
TION
SU
MM
AR
Y H
ISTO
RY
KE
Y TR
EN
DS
LIVE
EA
RN
PLAY
LEA
RN
IMP
LEM
EN
TATION
MA
NA
GE
ME
NT FIN
AN
CIA
L CO
NC
LUS
ION
GLO
SS
AR
Y A
PP
EN
DIC
ES
Baltimore Region’s Economy and Workforce
Trends in the Baltimore Region’s economy indicate strengths, as well as signs of slow growth. The region remains relatively affluent and above the national average for income mea-sures. Among the 20 benchmark re-gions, it ranks 4th in recent per capita income growth and 11th in effective buying income. Baltimore was the only region among the twenty where regional per capita income increased during the economic downturn that affected the nation after 2001.
While income trends are encourag-ing, the Baltimore Region’s economy has remained stagnant in recent years. The region has suffered in terms of employment, seeing its unemploy-ment rate decline only slightly, from 4.9 percent to 4.8 percent between 2002 and 2004. The Baltimore region now ranks 10th among the benchmark regions in the rate of unemployment.
The Baltimore/ Washington, DC Region
Baltimore’s Relationship to Washington, DC
The Baltimore Region’s population and economic trends are better under-stood within the context of the larger Baltimore–Washington, DC Region, which represents the functional eco-nomic region for Baltimore. Our close economic relationship with the Washington, DC metropolitan area presents both benefits and challenges to our regional economy.
Baltimore’s income and population growth can be partially accredited to the migration of affluent residents from Washington, DC to Baltimore. However, this same trend has con-tributed to the recent rise in the cost of living. The Baltimore Region rose from 3rd least expensive benchmark region to 5th most expensive bench-mark region between 2003 and 2005.
Note: 1997 is the latest year for which comparable data on job sectors is avail-
Baltimore City Jobs by Sector
11,416
33,340
19,624
17,051
40,027
28,029
146,330
17,632
89,415
28,102
24,870
58,730
30,987
79,665
0 50,000 100,000 150,000 200,000
Construction
Manufacturing
Transp & Utility
Wholesale Trade
Retail Trade
F.I.R.E.
Services
1974
1997
* Finance, Insurance, and Real Estate
Source: U.S. Census Bureau
Baltimore City Resident Employment by Sector 2000
12,939
20,082
6,911
22,881
14,285
8,218
17,453
152,978
0 40,000 80,000 120,000 160,000
Construction
Manufacturing
Wholesale Trade
Retail Trade
Transportation & Utilities
Information
F.I.R.E*
Services
* Finance, Insurance, and Real EstateSource: U.S. Census 2000
Baltimore Region Job Estimates & Projections 2000- 2030
450,940 431,880 436,110 440,210 444,170 447,990 451,6601,530,040 1,622,055 1,740,260 1,858,085 1,975,460 2,092,2552,218,410
0
500,000
1,000,000
1,500,000
2,000,000
2,500,000
2000 2005 2010 2015 2020 2025 2030
Baltimore City Baltimore Region
Source: Woods & Poole 2005 State Profile Forecasts
US Census Bureau
US Census Bureau
Baltimore City Jobs by Sector, 1974 and 1997
Baltimore City Resident Employment by Sector, 2000
Baltimore Region Job Estimates & Projections, 2000-2030

56 City of Baltimore Comprehensive Master Plan
Per Capita Personal Income Percentage Change2003–2005 vs. 2001–2003
Cur. Per. Rank Region
2003-2005 Average Annual Percent Change
Ear. Per. Rank
2001-2003 Average Annual Percent Change
1 San Diego 6.6% 3 2.9%
2 Baltimore 6.3% 4 2.6%
3 Washington, DC 5.7% 9 1.6%
4 Pittsburgh 5.3% 5 2.4%
5 Charlotte 5.1% 13 1.1%
6 Boston 5.1% 14 0.5%
7 Austin 5.0% 19 -1.3%
8 Philadelphia 5.0% 2 3.0%
9 Tampa 4.9% 10 1.6%
10 Richmond 4.9% 6 2.2%
11 Denver 4.8% 17 -1.0%
U.S. 4.8% 1.5%
12 Dallas 4.5% 16 -0.2%
13 Cleveland 4.4% 11 1.2%
14 Portland 4.3% 15 0.5%
15 Minneapolis 4.2% 7 1.9%
16 Indianapolis 4.2% 8 1.7%
17 Seattle 3.8% 12 1.2%
18 Raleigh 3.8% 20 -1.4%
19 Atlanta 3.4% 18 -1.1%
20 St. Louis 3.2% 1 3.1%
Source: Bureau of Economic Analysis
Population Growth2000–2003 vs. 2003–2006
2003–2006Rank Region
Average Annual
Growth Rate 2003–2006
2000–2003Rank
Average Annual
Growth Rate 2000–2003
1 Raleigh 4.0% 1 3.8%
2 Charlotte 3.4% 5 2.7%
3 Austin 3.3% 3 3.4%
4 Atlanta 3.2% 2 3.4%
5 Dallas 2.5% 4 2.7%
6 Tampa 2.2% 9 1.8%
7 Richmond 1.6% 11 1.3%
8 Portland 1.6% 7 1.9%
9 Denver 1.6% 8 1.8%
10 Indianapolis 1.4% 10 1.6%
11 Seattle 1.3% 15 1.1%
12 Washington, DC 1.2% 6 2.1%
13 Minneapolis 1.0% 13 1.3%
U.S. 1.0% 1.1%
14 St. Louis 0.6% 16 0.6%
15 Baltimore 0.4% 15 0.9%
16 Philadelphia 0.4% 18 0.4%
17 San Diego 0.2% 12 1.3%
18 Boston 0.0% 17 0.5%
19 Cleveland -0.4% 19 -0.1%
20 Pittsburgh -0.5% 20 -0.3%
Source: Bureau of the Census, 2007
region to 5th most expensive benchmark region between 2003 and 2005. This shift reflects increasing home pric-es in the region, a factor influenced by the discovery of the Baltimore Region’s housing bargains by families previously living in the Washington, DC area, which has the second highest cost of living in the nation.
The Baltimore Region benefits from proximity to the larger Washington, DC retail market. When compared to the largest commercial markets in the United States, Baltimore ranks 19th in size and 18th for effective buy-ing income. While the Baltimore and Washington, DC regions are no longer combined for statistical purposes, our region does benefit from the buying power of the Washington Region, which ranks 4th nationally.
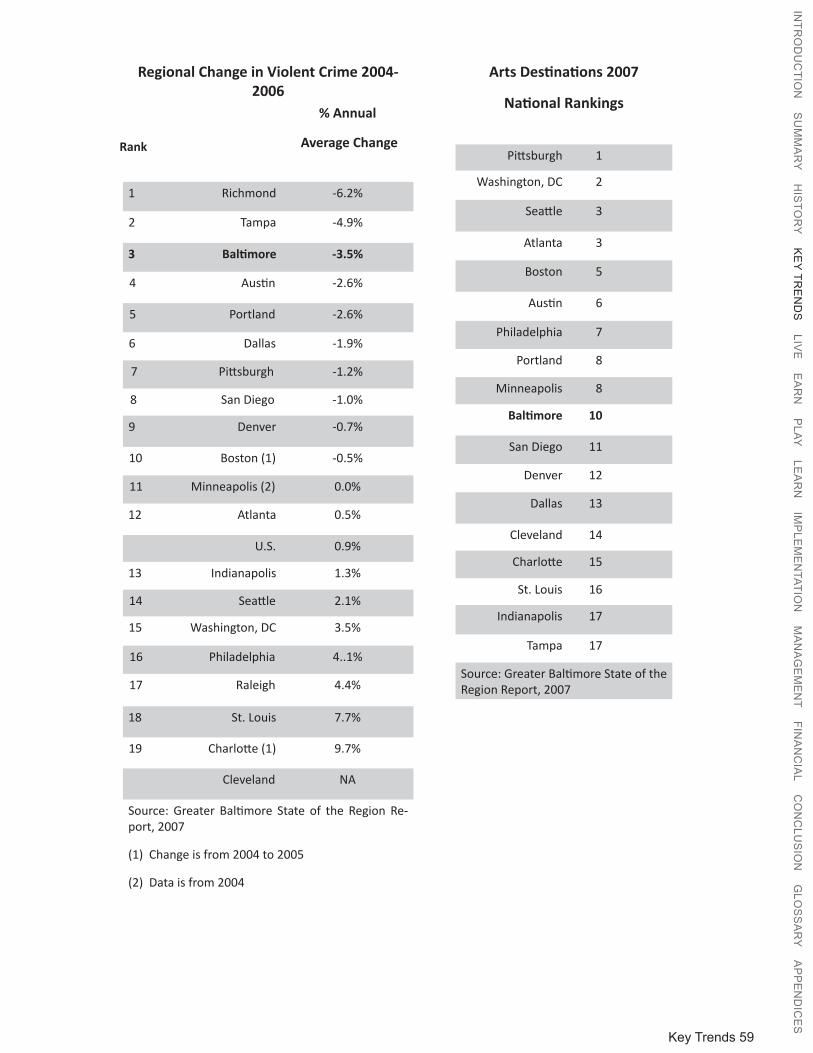
Baltimore Region’s Quality of LifeThe Baltimore Region also benefits from its proximity to Washington, DC amenities; Baltimore, however, as a distinct and unique community, offers a wealth of cul-tural resources that are unmatched by many other re-gions across the country. Our region ranked 19th in the 2004 national arts ranking.

Key Trends 57
INTR
OD
UC
TION
SU
MM
AR
Y H
ISTO
RY
KE
Y TR
EN
DS
LIVE
EA
RN
PLAY
LEA
RN
IMP
LEM
EN
TATION
MA
NA
GE
ME
NT FIN
AN
CIA
L CO
NC
LUS
ION
GLO
SS
AR
Y A
PP
EN
DIC
ES
Our crime rates declined at a faster rate than most other benchmark regions. Between 2002 and 2005, Baltimore’s rate of violent crime decreased by an annual average of 7 percent, making it the fourth highest rate of decrease. However, Baltimore remains near the bottom in the rankings for the incidents of violent crime, indicating crime and public safety remain challenges in the region and specifically in the City of Baltimore.
Median Household Effective Buying Income2006
Rank Region Median IncomeMargin of Error
(+/-)
1 Washington, DC $78,978 784
2 Boston $64,144 926
3 Minneapolis $62,223 464
4 Baltimore $61,010 842
5 Seattle $60,663 506
6 San Diego $59,591 1284
7 Raleigh $56,150 1358
8 Philadelphia $55,593 463
9 Atlanta $55,552 743
10 Denver $54,994 980
11 Richmond $53,416 1298
12 Austin $52,882 1107
13 Portland $52,480 770
14 Dallas $52,001 483
15 Indianapolis $50,841 754
16 Charlotte $50,367 859
17 St. Louis $49,765 699
U.S. $48,451
18 Cleveland $45,925 686
19 Tampa $43,742 707
20 Pittsburgh $43,260 745
Source: U.S. Bureau of the Census, American Community Survey
Cost of Living2007 Q2 and 2005 Q2
2007Rank Region
100%Composite Index,
20072005Rank
100%Composite Index,
2005
1 Charlotte 88.2 2 93.1
2 Dallas 90.9 5 94.4
3 St. Louis 91.0 6 96.8
4 Indianapolis 94.5 1 91.2
5 Austin 95.1 7 97.1
6 Atlanta 95.7 8 97.3
7 Tampa 98.6 9 98.8
8 Pittsburgh 99.5 3 93.2
9 Cleveland 99.6 10 102.0
10 Raleigh 100.4 4 93.3
11 Denver 103.7 11 103.0
12 Richmond 104.1 12 105.2
13 Baltimore 117.6 15 118.5
14 Portland 120.3 13 115.6
15 Seattle 120.4 14 116.4
16 Philadelphia 124.0 16 125.4
17 Boston 135.9 17 137.4
18 Washington, DC 137.0 18 141.4
19 San Diego 140.6 19 152.1
Minneapolis NA NA
Source: ACCRA Cost of Living Index

58 City of Baltimore Comprehensive Master Plan
Twenty Largest U.S. Markets
Median Household Effective Buying
Income 2006Rank RegionPopulation 2006
(000s)Retail Sales 2007
(millions)
1 Washington, DC 5,290.4 $78,978 $70,745
2 Boston 4,455.2 $64,144 $ 65,681
3 Minneapolis 3,175.0 $62,223 $ 48,549
4 Baltimore 2,658.4 $61,010 $35,635
5 Seattle 3,263.5 $60,663 $47,063
6 San Diego 2,941.4 $59,591 $39,582
7 Raleigh 994.5 $56,150 $14,352
8 Philadelphia 5,826.7 $55,593 $ 80,681
9 Atlanta 5,138.2 $55,552 $74,597
10 Denver 2,408.7 $54,994 $35,908
11 Richmond 1,194.0 $53,416 $16,171
12 Austin 1,513.5 $52,882 $21,043
13 Portland 2,137.5 $52,480 $ 32,280
14 Dallas 6,003.9 $52,001 $89,840
15 Indianapolis 1,666.0 $50,841 $25,036
16 Charlotte 1,583.0 $50,367 $ 22,722
17 St. Louis 2,796.3 $49,765 $38,425
18 Cleveland 2,114.1 $45,925 $31,440
19 Tampa 2,697.7 $43,742 $36,872
20 Pittsburgh 2,370.7 $43,260 $32,070
Source: Greater Baltimore State of the Region Report, 2007, Demographic & Market Characteristics
Key Trends 59
INTR
OD
UC
TION
SU
MM
AR
Y H
ISTO
RY
KE
Y TR
EN
DS
LIVE
EA
RN
PLAY
LEA
RN
IMP
LEM
EN
TATION
MA
NA
GE
ME
NT FIN
AN
CIA
L CO
NC
LUS
ION
GLO
SS
AR
Y A
PP
EN
DIC
ES
Arts Destinations 2007
National Rankings
Pittsburgh 1
Washington, DC 2
Seattle 3
Atlanta 3
Boston 5
Austin 6
Philadelphia 7
Portland 8
Minneapolis 8
Baltimore 10
San Diego 11
Denver 12
Dallas 13
Cleveland 14
Charlotte 15
St. Louis 16
Indianapolis 17
Tampa 17
Source: Greater Baltimore State of the Region Report, 2007
Regional Change in Violent Crime 2004-2006
% Annual
Average Change
1 Richmond -6.2%
2 Tampa -4.9%
3 Baltimore -3.5%
4 Austin -2.6%
5 Portland -2.6%
6 Dallas -1.9%
7 Pittsburgh -1.2%
8 San Diego -1.0%
9 Denver -0.7%
10 Boston (1) -0.5%
11 Minneapolis (2) 0.0%
12 Atlanta 0.5%
U.S. 0.9%
13 Indianapolis 1.3%
14 Seattle 2.1%
15 Washington, DC 3.5%
16 Philadelphia 4..1%
17 Raleigh 4.4%
18 St. Louis 7.7%
19 Charlotte (1) 9.7%
Cleveland NA
Source: Greater Baltimore State of the Region Re-port, 2007
(1) Change is from 2004 to 2005
(2) Data is from 2004
Rank