Embed Size (px)
Citation preview

Key Performance Indicators (KPIs)For the financial years ended 31 March 2018 and 31 March 2019 (pro forma KPIs 'A' - post recharge changes/Emergency Services Network transfer and pre IFRS 16).
BT has provided these pro forma KPIs to show the impact of the following changes: adjustments to refine the allocation of costs across BT’s operating units; the transfer of the Emergency Services Network contract from Consumer to Enterprise; and new key performance indicators for its Global operating unit. Results for the years ended 31 March 2018 and 31 March 2019 have therefore been prepared on a pro forma restated basis. These financial statements do not constitute statutory accounts within the meaning of Section 434 of the Companies Act 2006 and have not been audited or reviewed by the independent auditors.
These pro forma KPIs are prepared on an IAS 17 basis. On 1 April 2019 BT adopted IFRS 16, the new accounting standard for leases. Therefore for meaningful prior year comparators from Q1 2019/20 onwards, BT's post IFRS 16 pro forma KPIs (pro forma 'B'), published 3 July 2019, should be used.
DisclaimerAll pro forma financial information contained in this document is unaudited. The pro forma results are presented to investors and analysts as an indication of trend only. The financial statements do not constitute statutory accounts within the meaning of Section 434 of the Companies Act 2006 and have not been audited by BT Group’s indepe ndent auditors. BT Group does not warrant the accuracy, completeness or validity of the information, figures or calculations in this document and shall not be liable in any way for any loss or damage arisin g out of the use of this information, or any errors or omissions in its content.
NotesRevenue categories described as 'Of which' are intended to provide greater detail about the components of larger revenue categories, but are not intended to be the sum of that category.Please see the Glossary pages at the end of this document for details about the metrics included.
For more information please contact BT Group Investor RelationsPhone: +44 (0)207 356 4909Email: [email protected]: www.bt.com/ir
About BT GroupBT Group’s purpose is to use the power of communications to make a better world. It is one of the world’s leading providers o f communications services and solutions, serving customers in 180 countries. Its principal activities include the provision of networked IT services globally; local, national and international telecommunica tions services to its customers for use at home, at work and on the move; broadband, TV and internet products and services; and converged fixed-mobile products and services.
British Telecommunications plc (BT) is a wholly-owned subsidiary of BT Group plc and encompasses virtually all businesses and assets of the BT Group. BT Group plc is listed on stock exchanges in London and New York.
BT Group plcRegistered Office: 81 Newgate Street, London, EC1A 7AJ, United KingdomRegistered in England and Wales no. 4190816www.btplc.com

Group: Income statement (pro forma KPIs A)
INCOME STATEMENT 2017/18 2017/18 2017/18 2017/18 2017/18 2018/19 2018/19 2018/19 2018/19 2018/19
£m unless otherwise stated Q1 Q2 Q3 Q4 Full year Q1 Q2 Q3 Q4 Full year
Revenue
Consumer 2,539 2,580 2,653 2,543 10,315 2,570 2,654 2,757 2,610 10,591
Enterprise 1,648 1,680 1,681 1,708 6,717 1,588 1,633 1,583 1,592 6,396
Global 1,246 1,265 1,265 1,243 5,019 1,147 1,185 1,202 1,201 4,735
Openreach 1,287 1,299 1,379 1,320 5,285 1,255 1,293 1,256 1,271 5,075
Other 2 4 2 2 10 1 1 2 (1) 3
Eliminations (887) (893) (915) (890) (3,585) (845) (858) (818) (820) (3,341)
Total Group revenue 1 5,835 5,935 6,065 5,926 23,761 5,716 5,908 5,982 5,853 23,459
Underlying revenue YoY 2 (0.6)% (2.7)% (1.4)% (2.1)% (1.7)% (2.0)% (0.2)% (1.0)% (0.8)% (0.9)%
EBITDA
Consumer 528 541 504 625 2,198 564 559 590 618 2,331
Enterprise 458 491 502 527 1,978 455 486 483 486 1,910
Global 58 66 126 120 370 80 98 132 134 444
Openreach 723 732 827 755 3,037 671 714 683 676 2,744
Other 18 (10) (23) 9 (6) 30 18 (10) (75) (37)
Total Group EBITDA 1 1,785 1,820 1,936 2,036 7,577 1,800 1,875 1,878 1,839 7,392
YoY (3.7)% (6.4)% (0.3)% (0.3)% (2.6)% 0.8% 3.0% (3.0)% (9.7)% (2.4)%
Margin 30.6% 30.7% 31.9% 34.4% 31.9% 31.5% 31.7% 31.4% 31.4% 31.5%
Adjusted profit before tax 791 798 928 999 3,516 816 841 830 742 3,230
Profit after tax 285 533 611 675 2,104 549 503 594 513 2,159
INCOME STATEMENT 2017/18 2017/18 2017/18 2018/19 2018/19 2018/19
£m unless otherwise stated H1 H2 Full year H1 H2 Full year
Total Group revenue 1 11,770 11,991 23,761 11,624 11,835 23,459
Operating costs before D&A and specific items (8,165) (8,019) (16,184) (7,949) (8,118) (16,067)
Total Group EBITDA 1 3,605 3,972 7,577 3,675 3,717 7,392
Depreciation and amortisation 1 (1,757) (1,757) (3,514) (1,736) (1,810) (3,546)
Adjusted operating profit 1,848 2,215 4,063 1,939 1,907 3,846
Net finance expense 1 (259) (287) (546) (283) (334) (617)
Share of post tax profits/losses of assoc. & JVs 1 0 (1) (1) 1 0 1
Adjusted profit before tax 1,589 1,927 3,516 1,657 1,573 3,230
Total specific items (496) (332) (828) (317) (247) (564)
Of which impact operating profit (387) (223) (610) (248) (177) (425)
Of which net interest on pensions (109) (109) (218) (69) (70) (139)
Reported profit before tax 1,093 1,595 2,688 1,340 1,326 2,666
Tax excluding tax on specific items (321) (350) (671) (340) (279) (619)
Tax rate before specific items 20.2% 18.2% 19.1% 20.5% 17.7% 19.2%
Tax on specific items 46 41 87 52 60 112
Profit after tax 818 1,286 2,104 1,052 1,107 2,159
Adjusted basic earnings per share (pence) 12.8 15.9 28.6 13.3 13.0 26.3
Reported basic earnings per share (pence) 8.2 12.9 21.2 10.6 11.1 21.8
Dividend per share (pence) 4.85 10.55 15.40 4.62 10.78 15.40
Average number of shares in issue (m) 9,915 9,906 9,911 9,910 9,911 9,912
1 Adjusted, i.e. before specific items2 Excluding specific items, foreign exchange movements and the effect of acquisitions and disposals
Please see the Glossary pages for relevant definitions
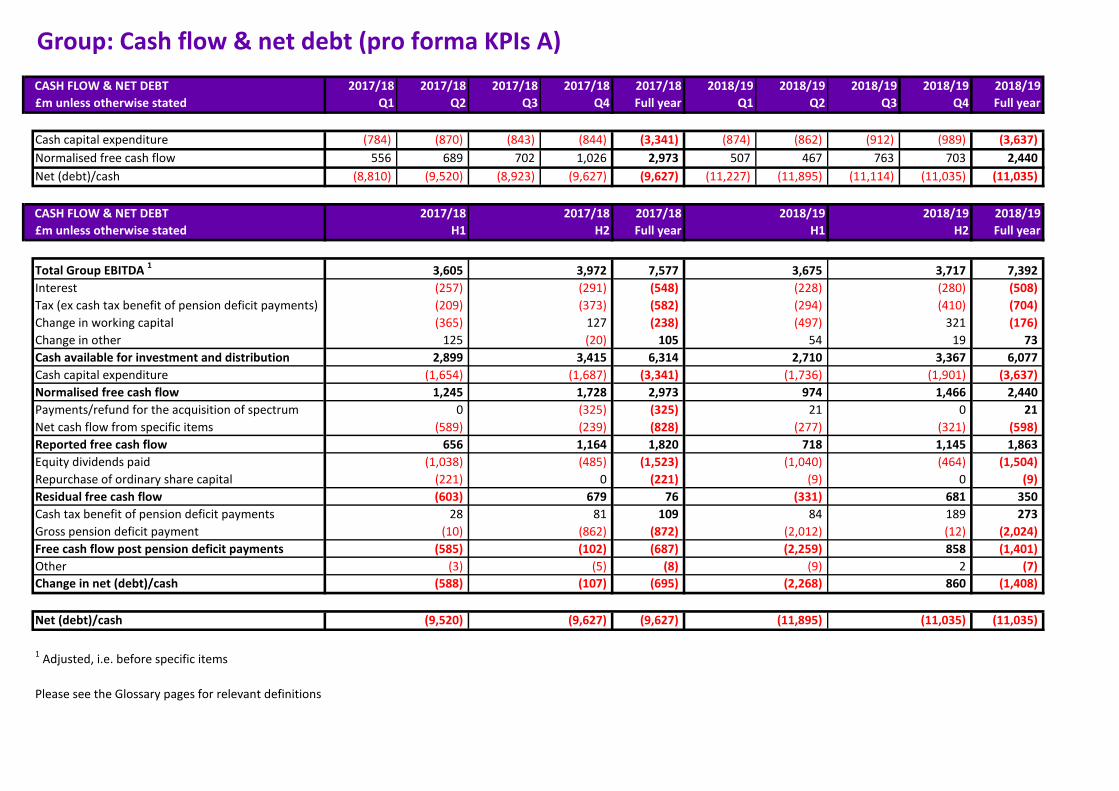
Group: Cash flow & net debt (pro forma KPIs A)
CASH FLOW & NET DEBT 2017/18 2017/18 2017/18 2017/18 2017/18 2018/19 2018/19 2018/19 2018/19 2018/19
£m unless otherwise stated Q1 Q2 Q3 Q4 Full year Q1 Q2 Q3 Q4 Full year
Cash capital expenditure (784) (870) (843) (844) (3,341) (874) (862) (912) (989) (3,637)
Normalised free cash flow 556 689 702 1,026 2,973 507 467 763 703 2,440
Net (debt)/cash (8,810) (9,520) (8,923) (9,627) (9,627) (11,227) (11,895) (11,114) (11,035) (11,035)
CASH FLOW & NET DEBT 2017/18 2017/18 2017/18 2018/19 2018/19 2018/19
£m unless otherwise stated H1 H2 Full year H1 H2 Full year
Total Group EBITDA 1 3,605 3,972 7,577 3,675 3,717 7,392
Interest (257) (291) (548) (228) (280) (508)
Tax (ex cash tax benefit of pension deficit payments) (209) (373) (582) (294) (410) (704)
Change in working capital (365) 127 (238) (497) 321 (176)
Change in other 125 (20) 105 54 19 73
Cash available for investment and distribution 2,899 3,415 6,314 2,710 3,367 6,077
Cash capital expenditure (1,654) (1,687) (3,341) (1,736) (1,901) (3,637)
Normalised free cash flow 1,245 1,728 2,973 974 1,466 2,440
Payments/refund for the acquisition of spectrum 0 (325) (325) 21 0 21
Net cash flow from specific items (589) (239) (828) (277) (321) (598)
Reported free cash flow 656 1,164 1,820 718 1,145 1,863
Equity dividends paid (1,038) (485) (1,523) (1,040) (464) (1,504)
Repurchase of ordinary share capital (221) 0 (221) (9) 0 (9)
Residual free cash flow (603) 679 76 (331) 681 350
Cash tax benefit of pension deficit payments 28 81 109 84 189 273
Gross pension deficit payment (10) (862) (872) (2,012) (12) (2,024)
Free cash flow post pension deficit payments (585) (102) (687) (2,259) 858 (1,401)
Other (3) (5) (8) (9) 2 (7)
Change in net (debt)/cash (588) (107) (695) (2,268) 860 (1,408)
Net (debt)/cash (9,520) (9,627) (9,627) (11,895) (11,035) (11,035)
1 Adjusted, i.e. before specific items
Please see the Glossary pages for relevant definitions

Group: Costs (pro forma KPIs A)
OPERATING COSTS 2017/18 2017/18 2017/18 2018/19 2018/19 2018/19
£m unless otherwise stated H1 H2 Full year H1 H2 Full year
Direct labour costs before leaver costs 2,690 2,658 5,348 2,664 2,701 5,365
Indirect labour costs 451 476 927 472 467 939
Leaver costs 30 20 50 8 9 17
Gross labour costs 3,171 3,154 6,325 3,144 3,177 6,321
Capitalised labour (668) (742) (1,410) (729) (777) (1,506)
Net labour costs 2,503 2,412 4,915 2,415 2,400 4,815
Product costs and sales commissions 1 2,153 2,276 4,429 2,172 2,292 4,464
Payments to telecommunications operators 1,207 1,099 2,306 1,073 986 2,059
Property and energy costs 649 636 1,285 661 664 1,325
Network operating and IT costs 476 487 963 508 518 1,026
TV programme rights charges 377 386 763 403 438 841
Provision and Installation 1 322 335 657 295 329 624
Marketing and sales 1 177 140 317 167 155 322
Other operatings costs 1 404 369 773 369 462 831
Other operating income (103) (121) (224) (114) (126) (240)
Operating costs before D&A and specific items 8,165 8,019 16,184 7,949 8,118 16,067
Depreciation and amortisation (D&A) 1,757 1,757 3,514 1,736 1,810 3,546
Total operating costs before specific items 9,922 9,776 19,698 9,685 9,928 19,613
Specific items 373 214 587 212 182 394
Total operating costs 10,295 9,990 20,285 9,897 10,110 20,007
REPORTED CAPITAL EXPENDITURE 2017/18 2017/18 2017/18 2018/19 2018/19 2018/19
£m unless otherwise stated H1 H2 Full year H1 H2 Full year
Consumer 400 414 814 373 571 944
Enterprise 298 299 597 246 305 551
Global 128 150 278 99 146 245
Openreach 808 891 1,699 1,055 1,026 2,081
Other 59 75 134 60 82 142
Total Group 2 1,693 1,829 3,522 1,833 2,130 3,963
Of which capacity/network 856 872 1,728 988 1,095 2,083
Of which customer driven 493 487 980 443 486 929
Of which systems/IT 295 392 687 327 420 747
Of which non-network infrastructure 49 78 127 75 129 204
ROLES 2017/18 2017/18 2018/19 2018/19
Full-time equivalent H1 Full year H1 Full year
Consumer 17,842 18,177 19,047 19,709
Enterprise 13,422 13,254 13,426 13,381
Global 17,399 16,945 16,274 16,603
Openreach 31,418 31,187 32,307 33,156
Other 26,230 26,224 25,405 23,893
Total Group 106,311 105,787 106,459 106,742
1 Other operating costs have been disaggregated and re-presented2 Gross BDUK grant funding deferral (clawback) included in capacity/network: 2014/15: £29m; 2015/16: £229m; 2016/17: £188m; 2017/18: £112m; 2018/19: £213m
Please see the Glossary pages for relevant definitions

Consumer (pro forma KPIs A)
FINANCIAL 2017/18 2017/18 2017/18 2017/18 2017/18 2018/19 2018/19 2018/19 2018/19 2018/19
£m unless otherwise stated Q1 Q2 Q3 Q4 Full year Q1 Q2 Q3 Q4 Full year
Revenue
Fixed 1,158 1,159 1,154 1,187 4,658 1,149 1,151 1,178 1,150 4,628
YoY 5.9% (0.4)% (0.6)% 3.9% 2.1% (0.8)% (0.7)% 2.1% (3.1)% (0.6)%
Mobile 977 1,000 989 965 3,931 989 1,018 995 969 3,971
YoY - - - - - 1.2% 1.8% 0.6% 0.4% 1.0%
Of which postpaid mobile 865 882 876 864 3,487 890 908 894 877 3,569
YoY 4.8% 5.3% 4.3% 3.3% 4.4% 2.9% 2.9% 2.1% 1.5% 2.4%
Equipment 315 331 416 296 1,358 346 393 476 387 1,602
YoY 1.6% (6.8)% 3.2% (4.2)% (1.4)% 9.8% 18.7% 14.4% 30.7% 18.0%
Other 89 90 94 95 368 86 92 108 104 390
Total 2,539 2,580 2,653 2,543 10,315 2,570 2,654 2,757 2,610 10,591
Underlying YoY - - - - - 1.2% 2.9% 3.9% 2.6% 2.7%
Of which Internal 25 25 25 28 103 25 27 27 28 107
EBITDA 528 541 504 625 2,198 564 559 590 618 2,331
Underlying YoY - - - - - 6.8% 3.3% 17.1% (1.1)% 6.1%
Margin 20.8% 21.0% 19.0% 24.6% 21.3% 21.9% 21.1% 21.4% 23.7% 22.0%
OPERATIONAL 2017/18 2017/18 2017/18 2017/18 2017/18 2018/19 2018/19 2018/19 2018/19 2018/19
Q1 Q2 Q3 Q4 Full year Q1 Q2 Q3 Q4 Full year
Average revenue per customer (£ per month)
Fixed 37.6 37.8 37.7 38.9 38.0 37.9 38.3 39.6 38.8 38.6
YoY 7.4% 1.1% 1.1% 6.0% 3.8% 0.8% 1.3% 5.0% (0.3)% 1.6%
Postpaid mobile 22.0 22.1 21.6 21.1 21.7 21.7 22.0 21.4 20.9 21.5
YoY (0.5)% 0.0% (0.9)% (1.4)% (0.5)% (1.4)% (0.5)% (0.9)% (0.9)% (0.9)%
Prepaid mobile 8.0 8.2 8.3 8.2 8.1 8.1 8.3 8.4 7.9 8.2
YoY 6.7% 2.5% 0.0% 6.5% 3.8% 1.3% 1.2% 1.2% (3.7)% 1.2%
Monthly churn
Fixed 1.3% 1.4% 1.4% 1.4% 1.3% 1.2% 1.6% 1.4% 1.4% 1.4%
Postpaid mobile 1.2% 1.1% 1.2% 1.2% 1.2% 1.2% 1.2% 1.3% 1.1% 1.2%
Fibre share of broadband base
Superfast 57.8% 59.7% 61.8% 64.0% 64.0% 65.6% 68.4% 70.5% 72.9% 72.9%
Ultrafast 0.1% 0.2% 0.2% 0.2% 0.2% 0.3% 0.4% 0.6% 0.8% 0.8%
Revenue generating units per address
Revenue generating units per address - - 2.36 2.37 2.37 2.37 2.37 2.37 2.37 2.37
FINANCIAL 2017/18 2017/18 2017/18 2018/19 2018/19 2018/19
£m unless otherwise stated H1 H2 Full year H1 H2 Full year
Revenue 5,119 5,196 10,315 5,224 5,367 10,591
YoY - - - 2.1% 3.3% 2.7%
EBITDA 1,069 1,129 2,198 1,123 1,208 2,331
YoY - - - 5.1% 7.0% 6.1%
Margin 20.9% 21.7% 21.3% 21.5% 22.5% 22.0%
Operating profit 570 617 1,187 608 693 1,301
YoY - - - 6.7% 12.3% 9.6%
Reported capex 400 414 814 373 571 944
YoY - - - (6.8)% 37.9% 16.0%
Normalised free cash flow 671 616 1,287 617 549 1,166
YoY - - - (8.0)% (10.9)% (9.4)%
Please see the Glossary pages for relevant definitions

Enterprise (pro forma KPIs A)
FINANCIAL 2017/18 2017/18 2017/18 2017/18 2017/18 2018/19 2018/19 2018/19 2018/19 2018/19
£m unless otherwise stated Q1 Q2 Q3 Q4 Full year Q1 Q2 Q3 Q4 Full year
Revenue
Fixed 750 747 731 729 2,957 697 687 676 652 2,712
YoY (4.8)% (4.4)% (5.2)% (7.3)% (5.4)% (7.1)% (8.0)% (7.5)% (10.6)% (8.3)%
Of which voice 368 362 353 349 1,432 331 319 313 296 1,259
YoY (5.6)% (5.0)% (5.6)% (9.1)% (6.3)% (10.1)% (11.9)% (11.3)% (15.2)% (12.1)%
Of which broadband 126 125 124 124 499 121 115 123 119 478
YoY 1.6% 0.8% (2.4)% (3.1)% (0.8)% (4.0)% (8.0)% (0.8)% (4.0)% (4.2)%
Of which WAN and Ethernet 108 114 111 114 447 116 118 116 116 466
YoY 5.9% 4.6% 2.8% 3.6% 4.2% 7.4% 3.5% 4.5% 1.8% 4.3%
Mobile 312 315 318 304 1,249 303 321 323 321 1,268
YoY 5.1% 5.7% (0.6)% (3.2)% 1.6% (2.9)% 1.9% 1.6% 5.6% 1.5%
Of which retail mobile 255 255 263 248 1,021 252 267 267 263 1,049
YoY 5.4% 4.5% 0.4% (3.5)% 1.6% (1.2)% 4.7% 1.5% 6.0% 2.7%
Of which wholesale mobile 57 60 55 56 228 51 54 56 58 219
YoY 3.6% 11.1% (5.2)% (1.8)% 1.8% (10.5)% (10.0)% 1.8% 3.6% (3.9)%
Managed services 279 294 312 321 1,206 285 296 288 297 1,166
YoY - - - - - 2.2% 0.7% (7.7)% (7.5)% (3.3)%
Republic of Ireland 87 89 93 101 370 88 104 91 86 369
YoY 1.2% (8.2)% (8.8)% 4.1% (3.1)% 1.1% 16.9% (2.2)% (14.9)% (0.3)%
Ventures 123 136 141 145 545 136 145 141 145 567
YoY (3.9)% (4.9)% 2.2% 0.0% (1.4)% 10.6% 6.6% 0.0% 0.0% 4.0%
Other 97 99 86 108 390 79 80 64 91 314
Total 1,648 1,680 1,681 1,708 6,717 1,588 1,633 1,583 1,592 6,396
Underlying YoY - - - - - (3.6)% (2.8)% (5.8)% (6.8)% (4.8)%
Of which Internal 94 99 91 96 380 94 94 85 86 359
Revenue by channel
Retail (ex RoI) 1,010 1,030 1,028 1,045 4,113 987 1,002 984 988 3,961
YoY - - - - - (2.3)% (2.7)% (4.3)% (5.5)% (3.7)%
Wholesale 429 430 425 424 1,708 380 384 383 376 1,523
YoY (5.3)% (2.3)% (5.1)% (6.6)% (4.8)% (11.4)% (10.7)% (9.9)% (11.3)% (10.8)%
EBITDA 458 491 502 527 1,978 455 486 483 486 1,910
Underlying YoY - - - - - (0.7)% (1.0)% (3.8)% (7.8)% (3.4)%
Margin 27.8% 29.2% 29.9% 30.9% 29.4% 28.7% 29.8% 30.5% 30.5% 29.9%
Of which Ventures 43 52 54 69 218 45 55 54 60 214
YoY (8.5)% (13.3)% (5.3)% 7.8% (4.4)% 4.7% 5.8% 0.0% (13.0)% (1.8)%
Margin 35.0% 38.2% 38.3% 47.6% 40.0% 33.1% 37.9% 38.3% 41.4% 37.7%
Orders
Total retail orders 1,180 732 665 814 3,391 657 650 777 805 2,889
YoY 81.0% (13.6)% (22.3)% (19.7)% 0.7% (44.3)% (11.2)% 16.8% (1.1)% (14.8)%
Of which new business 872 470 435 518 2,295 395 430 514 553 1,892
YoY 87.1% (9.1)% (24.6)% (21.6)% 3.3% (54.7)% (8.5)% 18.2% 6.8% (17.6)%
Of which renewals 308 262 230 296 1,096 262 220 263 253 998
YoY 66.5% (20.4)% (17.6)% (16.1)% (4.4)% (14.9)% (16.0)% 14.3% (14.5)% (8.9)%
Total wholesale orders (excluding IoT) 167 348 322 475 1,312 139 197 202 479 1,017
YoY (47.3)% 17.6% (54.3)% 49.4% (19.8)% (16.8)% (43.4)% (37.3)% 0.8% (22.5)%
N.B. All operational metrics refer to Enterprise and exclude UK customers served by Global
Please see the Glossary pages for relevant definitions
Enterprise page 1 of 2
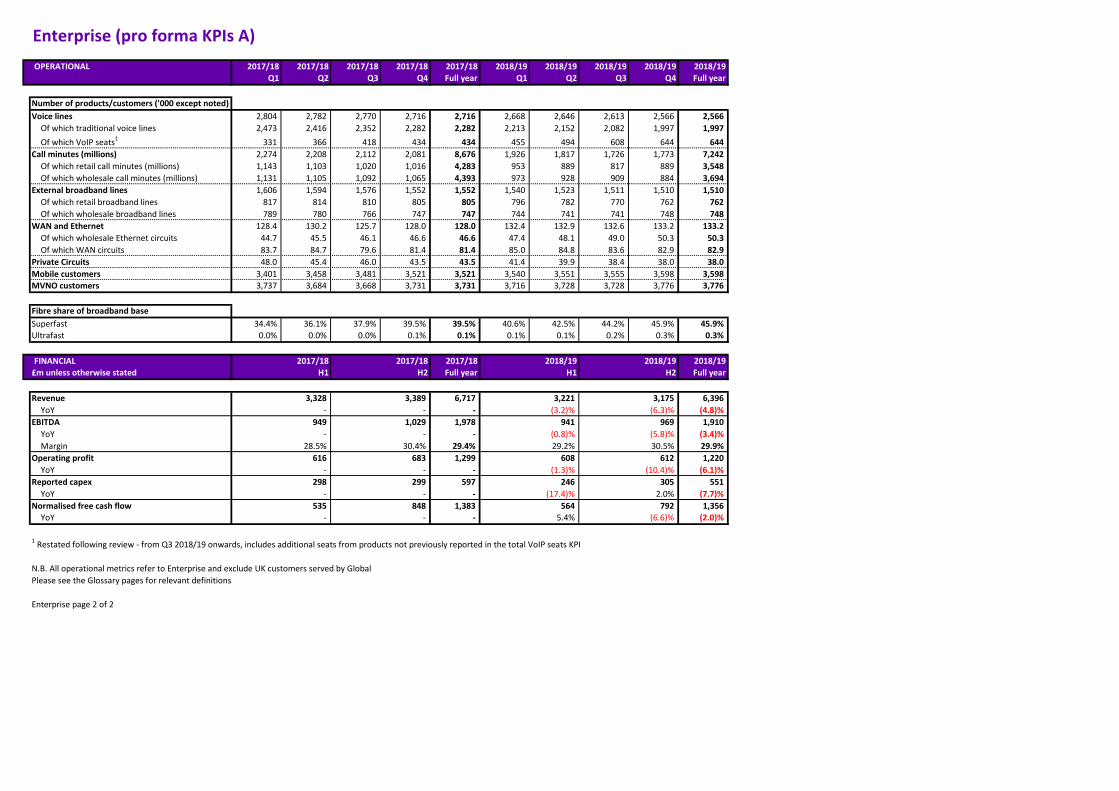
Enterprise (pro forma KPIs A)
OPERATIONAL 2017/18 2017/18 2017/18 2017/18 2017/18 2018/19 2018/19 2018/19 2018/19 2018/19
Q1 Q2 Q3 Q4 Full year Q1 Q2 Q3 Q4 Full year
Number of products/customers ('000 except noted)
Voice lines 2,804 2,782 2,770 2,716 2,716 2,668 2,646 2,613 2,566 2,566
Of which traditional voice lines 2,473 2,416 2,352 2,282 2,282 2,213 2,152 2,082 1,997 1,997
Of which VoIP seats1
331 366 418 434 434 455 494 608 644 644
Call minutes (millions) 2,274 2,208 2,112 2,081 8,676 1,926 1,817 1,726 1,773 7,242
Of which retail call minutes (millions) 1,143 1,103 1,020 1,016 4,283 953 889 817 889 3,548
Of which wholesale call minutes (millions) 1,131 1,105 1,092 1,065 4,393 973 928 909 884 3,694
External broadband lines 1,606 1,594 1,576 1,552 1,552 1,540 1,523 1,511 1,510 1,510
Of which retail broadband lines 817 814 810 805 805 796 782 770 762 762
Of which wholesale broadband lines 789 780 766 747 747 744 741 741 748 748
WAN and Ethernet 128.4 130.2 125.7 128.0 128.0 132.4 132.9 132.6 133.2 133.2
Of which wholesale Ethernet circuits 44.7 45.5 46.1 46.6 46.6 47.4 48.1 49.0 50.3 50.3
Of which WAN circuits 83.7 84.7 79.6 81.4 81.4 85.0 84.8 83.6 82.9 82.9
Private Circuits 48.0 45.4 46.0 43.5 43.5 41.4 39.9 38.4 38.0 38.0
Mobile customers 3,401 3,458 3,481 3,521 3,521 3,540 3,551 3,555 3,598 3,598
MVNO customers 3,737 3,684 3,668 3,731 3,731 3,716 3,728 3,728 3,776 3,776
Fibre share of broadband base
Superfast 34.4% 36.1% 37.9% 39.5% 39.5% 40.6% 42.5% 44.2% 45.9% 45.9%
Ultrafast 0.0% 0.0% 0.0% 0.1% 0.1% 0.1% 0.1% 0.2% 0.3% 0.3%
FINANCIAL 2017/18 2017/18 2017/18 2018/19 2018/19 2018/19
£m unless otherwise stated H1 H2 Full year H1 H2 Full year
Revenue 3,328 3,389 6,717 3,221 3,175 6,396
YoY - - - (3.2)% (6.3)% (4.8)%
EBITDA 949 1,029 1,978 941 969 1,910
YoY - - - (0.8)% (5.8)% (3.4)%
Margin 28.5% 30.4% 29.4% 29.2% 30.5% 29.9%
Operating profit 616 683 1,299 608 612 1,220
YoY - - - (1.3)% (10.4)% (6.1)%
Reported capex 298 299 597 246 305 551
YoY - - - (17.4)% 2.0% (7.7)%
Normalised free cash flow 535 848 1,383 564 792 1,356
YoY - - - 5.4% (6.6)% (2.0)%
1 Restated following review - from Q3 2018/19 onwards, includes additional seats from products not previously reported in the total VoIP seats KPI
N.B. All operational metrics refer to Enterprise and exclude UK customers served by Global
Please see the Glossary pages for relevant definitions
Enterprise page 2 of 2

Global (pro forma KPIs A)
FINANCIAL 2017/18 2017/18 2017/18 2017/18 2017/18 2018/19 2018/19 2018/19 2018/19 2018/19
£m unless otherwise stated Q1 Q2 Q3 Q4 Full year Q1 Q2 Q3 Q4 Full year
Revenue by industry segmentation
Banking and Financial Services - - - - - 309 332 334 325 1,300
YoY - - - - - - - - - -
Resources, Manufacturing and Logistics - - - - - 325 335 350 328 1,338
YoY - - - - - - - - - -
Technology, Life Sciences and Business Services - - - - - 327 335 330 362 1,354
YoY - - - - - - - - - -
Regional Enterprise - - - - - 186 183 188 186 743
YoY - - - - - - - - - -
Total 1,246 1,265 1,265 1,243 5,019 1,147 1,185 1,202 1,201 4,735
Underlying YoY (7.8)% (12.6)% (8.3)% (10.1)% (9.7)% (6.1)% (5.0)% (4.4)% (2.3)% (4.5)%
Revenue by product group
Growth - - - - - 197 202 251 255 905
YoY - - - - - - - - - -
Mature - - - - - 666 711 704 706 2,787
YoY - - - - - - - - - -
Legacy - - - - - 284 272 247 240 1,043
YoY - - - - - - - - - -
EBITDA 58 66 126 120 370 80 98 132 134 444
Underlying YoY - - - - - 46.6% 50.0% 5.6% 12.6% 22.2%
Margin 4.7% 5.2% 10.0% 9.7% 7.4% 7.0% 8.3% 11.0% 11.2% 9.4%
Orders 804 924 1,091 1,026 3,845 628 797 866 995 3,286
YoY (16.3)% (38.4)% (11.3)% 12.4% (16.5)% (21.9)% (13.7)% (20.6)% (3.0)% (14.5)%
FINANCIAL 2017/18 2017/18 2017/18 2018/19 2018/19 2018/19
£m unless otherwise stated H1 H2 Full year H1 H2 Full year
Revenue 2,511 2,508 5,019 2,332 2,403 4,735
YoY (5.6)% (11.1)% (8.4)% (7.1)% (4.2)% (5.7)%
EBITDA 124 246 370 178 266 444
YoY - - - 43.5% 8.1% 20.0%
Margin 4.9% 9.8% 7.4% 7.6% 11.1% 9.4%
Operating profit (101) 39 (62) (12) 78 66
YoY - - - 88.1% 100.0% (206.5)%
Reported capex 128 150 278 99 146 245
YoY (33.0)% (11.8)% (23.0)% (22.7)% (2.7)% (11.9)%
Normalised free cash flow (163) 218 55 (74) 309 235
YoY - - - 54.6% 41.7% 327.3%
Please see the Glossary pages for relevant definitions

Openreach (pro forma KPIs A)
FINANCIAL 2017/18 2017/18 2017/18 2017/18 2017/18 2018/19 2018/19 2018/19 2018/19 2018/19
£m unless otherwise stated Q1 Q2 Q3 Q4 Full year Q1 Q2 Q3 Q4 Full year
Revenue
Wholesale Line Rental (WLR) 469 462 456 452 1,839 445 455 449 442 1,791
YoY (0.6)% (3.1)% (4.2)% (3.6)% (2.9)% (5.1)% (1.5)% (1.5)% (2.2)% (2.6)%
Local Loop Unbundling (LLU) 281 284 283 279 1,127 276 287 290 292 1,145
YoY (3.8)% (0.7)% (2.7)% (2.1)% (2.3)% (1.8)% 1.1% 2.5% 4.7% 1.6%
Fibre to the Cabinet (FTTC) 227 237 337 270 1,071 251 271 237 248 1,007
YoY 24.7% 22.2% 64.4% 23.9% 34.0% 10.6% 14.3% (29.7)% (8.1)% (6.0)%
Gfast 0 0 0 0 0 0 0 1 1 2
YoY - - - - - - - - - -
Fibre to the Premises (FTTP) 5 6 7 9 27 9 12 16 17 54
YoY 66.7% 50.0% 133.3% 80.0% 80.0% 80.0% 100.0% 128.6% 88.9% 100.0%
Ethernet 188 194 187 200 769 179 183 184 179 725
YoY (4.1)% 8.4% (0.5)% 4.2% 1.9% (4.8)% (5.7)% (1.6)% (10.5)% (5.7)%
Other 117 116 109 110 452 95 85 79 92 351
Total 1,287 1,299 1,379 1,320 5,285 1,255 1,293 1,256 1,271 5,075
Underlying YoY 1.0% 2.4% 6.4% 1.8% 2.9% (2.4)% (0.5)% (8.9)% (3.7)% (4.0)%
Of which Internal 767 770 796 768 3,101 727 736 706 706 2,875
YoY 0.8% (0.1)% 2.4% (1.2)% 0.5% (5.2)% (4.4)% (11.3)% (8.1)% (7.3)%
EBITDA 723 732 827 755 3,037 671 714 683 676 2,744
Underlying YoY - - - - - (7.2)% (2.5)% (17.4)% (10.5)% (9.6)%
Margin 56.2% 56.4% 60.0% 57.2% 57.5% 53.5% 55.2% 54.4% 53.2% 54.1%
OPERATIONAL 2017/18 2017/18 2017/18 2017/18 2017/18 2018/19 2018/19 2018/19 2018/19 2018/19
Q1 Q2 Q3 Q4 Full year Q1 Q2 Q3 Q4 Full year
Network deployment ('000 premises passed)
Superfast126,114 26,382 26,749 26,944 26,944 27,087 27,220 27,280 27,479 27,479
Of which Ultrafast Gfast 84 214 393 1,015 1,015 1,117 1,290 1,708 2,020 2,020
Of which Ultrafast FTTP 398 431 493 567 567 631 682 893 1,247 1,247
Network usage ('000 premises connected)
Total physical lines 25,169 25,121 25,163 25,142 25,142 25,044 25,004 25,040 25,039 25,039
Of which WLR 16,009 15,931 15,863 15,781 15,781 15,508 15,358 15,276 15,189 15,189
Of which LLU 9,049 9,062 9,154 9,191 9,191 9,336 9,413 9,496 9,542 9,542
Of which FTTP 111 127 146 169 169 197 230 267 306 306
Of which other 0 0 0 0 0 2 3 1 2 2
Total broadband connections 20,451 20,516 20,668 20,766 20,766 20,906 20,948 21,043 21,119 21,119
Of which non-fibre 12,316 11,875 11,427 10,970 10,970 10,662 10,090 9,506 8,895 8,895
Of which FTTC 8,023 8,512 9,094 9,624 9,624 10,041 10,619 11,254 11,891 11,891
Of which Gfast 1 1 2 3 3 4 7 15 25 25
Of which FTTP 111 127 146 169 169 197 230 267 306 306
Of which other 0 0 0 0 0 2 3 1 2 2
Ethernet 254 262 268 276 276 283 288 293 300 300
FINANCIAL 2017/18 2017/18 2017/18 2018/19 2018/19 2018/19
£m unless otherwise stated H1 H2 Full year H1 H2 Full year
Revenue 2,586 2,699 5,285 2,548 2,527 5,075
YoY 1.7% 4.0% 2.9% (1.5)% (6.4)% (4.0)%
EBITDA 1,455 1,582 3,037 1,385 1,359 2,744
YoY - - - (4.8)% (14.1)% (9.6)%
Margin 56.3% 58.6% 57.5% 54.4% 53.8% 54.1%
Operating profit 777 930 1,707 721 625 1,346
YoY - - - (7.2)% (32.8)% (21.1)%
Reported capex 808 891 1,699 1,055 1,026 2,081
YoY 13.3% (1.8)% 4.9% 30.6% 15.2% 22.5%
Normalised free cash flow 682 798 1,480 448 558 1,006
YoY - - - 34.3% (30.1)% (32.0)%
1 Q3 2018/19 network deployment restated following review
Please see the Glossary pages for relevant definitions

Glossary
GROUP: COSTS
Operating costs
Direct labour costsTotal gross costs associated with wages and salaries, social security costs, pension costs, employee profit share and share based
payments.
Indirect labour costs Labour costs that relate to agency and subcontracted employees.
Leaver costs
Also called 'Termination benefits'. Costs payable when, in the normal course of business, employment is terminated before an
employee's normal retirement date, or when an employee accepts voluntary redundancy in exchange for these benefits. The Group
recognises termination benefits when it is demonstrably committed to the affected employees leaving the Group. Leavers costs
related to a major restructuring programme are treated as a specific item (defined below).
Capitalised labour Labour costs associated with the construction, modification, or installation of capital expenditure programmes (defined below).
Product costs and sales commissionsCosts incurred in the creation of products, including the purchase of equipment and services for resale, and commission paid to third
parties for selling the Group’s products and services.
Payments to telecommunications operatorsCosts typically including payments to other communications providers (CPs) when terminating voice traffic on its network to carry a
call to the customer receiving the call. Also called 'payments to other licensed operators' (POLOs).
TV programme rights charges The cost of TV programme rights, mainly relating to sport (particularly football) broadcast rights.
Provision and InstallationCosts incurred in providing the products and network services to customers. Includes the cost of installation, equipment stock level
changes and valuation adjustments, and equipment consumed by the Group for its own use.
Marketing & sales Costs incurred for publicising and presenting products and services to customers, and to secure potential orders for products and
services.
Other operatings costs Costs not included in any other category, such as those relating to travel and subsistence, transport, consultancy and bad debts.
Other operating income
Income that the Group generates from activities outside the provision of communication services and equipment sales. Includes
income from repayment works, income from government grants and profits and losses on the disposals of businesses, property, plant
and equipment.
Specific items
Costs separately disclosed to improve the relevance of other costs to understanding the Group’s financial performance. Specific items
are identified by virtue of their size, nature or incidence with management considering quantitative as well as qualitative factors such
as the frequency or predictability of occurrence.
Examples include acquisitions/disposals of businesses and investments, regulatory settlements, historical insurance or litigation claims,
business restructuring programmes, asset impairment charges, property rationalisation programmes, net interest on pensions and the
settlement of multiple tax years.
Reported capital expenditure
Of which capacity/network
Investment in our integrated network to improve the coverage and reliability of our superfast broadband network, increase the
deployment of ultrafast broadband, enhance and expand our mobile network, and deliver a truly integrated network that supports
converged products/services. Includes Broadband Delivery UK (BDUK) grant funding deferrals.
Of which customer driven
Investment that directly generates revenue from continued development of customer contract-specific infrastructure for our UK and
global clients, deployment of Ethernet and broadband connections for homes and businesses, including reduction of the existing
workstacks.
Of which systems/ITInvestments in systems and information technology to develop differentiated customer experiences, new products and services, or
transformation initiatives to drive cost savings.
Of which non-network InfrastructureInvestment that covers, for example, investment in our property estate, power and cooling investments to drive energy savings,
specialist vehicle replacement.
Roles
Full-time equivalentThe number of full time equivalent (FTE) roles at the end of the period, directly employed by the company rather than by agencies or
subcontractors. FTE counts all full and part-time employees expressed as if every role was full-time.
UNITS
General terms
YoY An abbreviation of 'year on year' i.e. the change compared to the equivalent period in the previous year.
Underlying YoY
As above, excluding the impact of acquisitions or disposals, foreign exchange movements and specific items. This measure includes
transit traffic which now has an immaterial impact. The underlying measure seeks to reflect performance that will contribute to long-
term sustainable profitable growth.
Financial
Internal revenue
Intra-group revenue generated from the sale of regulated products and services, based on market price. Intra-group revenue from the
sale of other products and services is agreed between the relevant customer-facing units (CFUs) and therefore CFU profitability may
be impacted by transfer pricing levels.
Reported capex Capital expenditure recorded in accounts but for which cash has not necessarily yet been paid.
Normalised free cash flow
The net increase in cash and cash equivalents less cash flows from financing activities (except net interest paid), the
acquisition/disposal of group undertakings and the net sale of short-term investments, and excluding the cash impact of specific items,
purchases of telecommunications licences, and the cash tax benefit of pension deficit payments. Non-tax related adjustments are
made on a pre-tax basis.

Glossary
CONSUMER
Revenue
FixedEarned from products/services delivered using only fixed network connectivity, including broadband, calls, line rental, TV, and
residential BT Sport subscriptions.
MobileEarned from products/services delivered using only mobile network connectivity, including data connectivity, incoming and outgoing
calls and roaming by customers of overseas networks.
Of which postpaid mobile Earned from customers paying monthly subscriptions for mobile network connectivity.
Equipment Earned from mobile and fixed equipment sales, such as mobile handsets or TV set top boxes.
Other Earned from advertising, commercial and wholesale BT Sport customers, and Wi-fi services.
Of which internal Mainly BT Wi-fi revenue from services sold by Global on certain contracts, and services and applications sold by Plusnet to Global.
Operational
Fixed average revenue per customerFixed revenue (defined above) during the period divided by the average number of line rental customers during the period, and
presented as a monthly amount.
Postpaid mobile average revenue per
customer
Postpaid mobile revenue (defined above) during the period divided by the average number of postpaid mobile customers during the
period, and presented as a monthly amount.
Prepaid mobile average revenue per
customer
Prepaid mobile revenue (not disclosed but earned from customers pre-paying for mobile connectivity) during the period divided by the
average number of prepaid mobile customers during the period, and presented as a monthly amount. Prepaid customers at any point
in time are counted as those which have used their connection during the preceding 30 days.
Fixed monthly churnNumber of line rental customers who disconnect from the network, voluntarily or involuntarily, during the period, divided by the
average number of line rental customers during the period, presented as a monthly figure.
Postpaid mobile monthly churn
Number of postpaid mobile customers who disconnect from the network, voluntarily or involuntarily (excluding money-back return,
fraudulent connections and inter-brand migrations) during the period, divided by the average number of postpaid customers during
the period, presented as a monthly figure.
Superfast fibre share of broadband baseThe proportion of broadband lines purchasing a superfast connection i.e. with a maximum download speed of up to 76Mbps. These
connections are supplied to customers by Consumer purchasing an FTTC/FTTP wholesale product from Openreach.
Ultrafast fibre share of broadband baseThe proportion of broadband lines purchasing a ultrafast connection i.e. with a maximum download speed above 100Mbps. These
connections are supplied to customers by Consumer purchasing a Gfast/FTTP wholesale product from Openreach.
Revenue Generating Units per address Number of chargeable products per separate address measured across the BT, EE and Plusnet brands, aggregated to give a total for
the Consumer CFU.

Glossary
ENTERPRISE
Revenue
Fixed Earned from products/services across our brands that use only fixed network connectivity.
Of which voice Earned from products/services that provide our customers with voice connectivity.
Of which broadband Earned from products/services that provide our customers with broadband internet connectivity.
Of which WAN and EthernetEarned from products/services that provide our customers Wide Area Network (WAN) connectivity i.e. network connections linking a
number of sites, including BT Net sales, and Ethernet connectivity, i.e. a dedicated high bandwidth connection.
Mobile Earned from products/services across our brands that use only our mobile network connectivity.
Of which retail mobileEarned from products/services sold to retail customers for mobile network connectivity, including that from the Emergency Services
Network (ESN).
Of which wholesale mobileEarned from products/services predominantly sold to Mobile Virtual Network Operators (MVNOs) for mobile network connectivity
which they use to provide products/services to their end customers. Includes mobile data analytics, and M2M (i.e. IoT).
Managed services Earned from bespoke contracts that is not directly apportioned to either fixed or mobile connectivity.
Republic of Ireland All revenue of any type earned from customers in the Republic of Ireland, received in euros but reported in sterling.
VenturesEarned from the Ventures portfolio of standalone businesses that include Tikit, Redcare, Fleet Solutions, Pelipod, Phone Book,
Payphones, and Supply Chain.
Other Any revenue not included within any of the above categories, e.g. revenue from converged products/services such as BT One Phone.
Of which InternalContains internal charges to other parts of BT. Mainly revenue arising from Consumer for mobile Ethernet access and BT Technology
unit for transmission planning services, but may include other internal revenue.
Revenue by channel
Retail (ex RoI)Revenue from corporations and small/medium enterprises (SMEs) that are UK focused, including from the Public Sector, from
products under the BT and EE brands, including, but not exclusively, calls, lines, broadband, mobile, ICT, and managed network
WholesaleRevenue from Wholesale products/services, sold to communications providers (CPs) which use them to provide products/services to
their end customers.
Orders
Total retail orders
Retail orders of products and services sold in the period to the unit’s customers in Great Britain, Northern Ireland, and the Republic of
Ireland, including all one-off charges and all recurring charges expected over the term of the contract. Orders are recorded on a sales
order value (SOV) basis, i.e. the total amount of revenue expected from the contact over its life.
Of which new businessThe amount of revenue expected to be earned over the life of a contract for new business contracts signed in the period e.g. a new 5-
year contract worth £10m a year equates to a SOV order of £50m.
Of which renewalsThe amount of revenue expected to be earned over the life of a contract recorded on the renewal or extension of an existing contract
with a current customer in the period.
Total wholesale orders (excluding IoT)
Wholesale orders in the period, sold to communications providers (CPs), for all business types including new business, growth,
renewals and extensions. Where a renewal or extension overlaps with a previous contract value reported as Order intake, only the
incremental contract value (ICV) increase is included. This includes all one-off charges, plus all recurring charges for the term of the
contract. Wholesale orders only relate to orders that have been contracted for future periods.
Operational
Voice linesThe total number of revenue-generating voice connections on our fixed network, across all external customers, measured at the end
of the period. The revenue generated by these connections is included within ‘Fixed of which voice’ revenue.
Of which traditional voice lines
The total number of revenue-generating voice connections on our fixed network that use legacy analogue technology, across all
external customers, measured at the end of the period. The revenue generated by these connections is included within ‘Fixed of which
voice’ revenue.
Of which VoIP seats
The total number of revenue-generating voice connections on our fixed network that use Voice over Internet Protocol (VoIP)
technology, across all external customers, measured at the end of the period. The revenue generated by these connections is included
within ‘Fixed of which voice’ revenue.
Call minutes (millions)The number of calling minutes used during the period by all external customers. The revenue earned by these connections is included
within ‘Fixed of which voice’ revenue.
Of which retail call minutes (millions)The number of calling minutes used during the period by external retail customers. The revenue earned by these connections is
included within ‘Fixed of which voice’ revenue.
Of which wholesale call minutes (millions)The number of calling minutes used during the period by external wholesale customers (communications providers (CPs)) using the
Wholesale Calls product. The revenue earned by these connections is included within ‘Fixed of which voice’ revenue.
External broadband linesThe closing base of broadband live circuits (including copper & fibre) sold to external customers on our fixed network. The revenue
generated by these connections is included within ‘Fixed – Broadband’ revenue.
Of which retail broadband linesThe closing base of broadband live circuits (including copper & fibre) sold to external retail customers on our fixed network. The
revenue generated by these connections is included within ‘Fixed – Broadband’ revenue.
Of which wholesale broadband linesThe closing base of broadband live circuits (including copper & fibre) sold to external wholesale customers (communications providers
(CPs)) on our fixed networks. The revenue earned by these connections is included within ‘Fixed – Broadband’ revenue.
WAN and EthernetThe closing base of data circuits excluding broadband lines sold to all external customers. The revenue generated by these networks is
included within ‘Fixed of which WAN and Ethernet' revenue.
Of which wholesale Ethernet circuitsThe closing base of Ethernet circuits sold to external wholesale customers (communications providers (CPs)) that are not Mobile
Network Operators (MNOs). The revenue earned by these connections is included within ‘Fixed of which WAN and Ethernet' revenue.
Of which WAN circuitsThe closing base of active circuit connections on Wide Area Networks (WAN), including BT Net products, across all external customers.
The revenue generated by these networks is included within ‘Fixed of which WAN and Ethernet' revenue.
Private CircuitsThe closing base of Private Circuits, including Partial Private Circuits, sold to external retail customers. The revenue earned by these
connections is included within Fixed revenue excluding voice, broadband, and Ethernet (i.e. it is not explicitly separately disclosed).
Mobile customersThe total number of revenue-generating connections on our mobile network, across external retail customers and all our brands,
measured at the end of the period. The revenue generated by these connections is included within 'Mobile - Retail mobile' revenue.
MVNO customers
The closing base of billable subscribers (reported a quarter in arrears) on our mobile network through mobile virtual network
operators (MVNO) purchasing access from Enterprise. The revenue generated by these connections is included within 'Mobile -
Wholesale mobile' revenue.
Superfast fibre share of broadband base
The proportion of measurable broadband lines (>90% of the figure defined above) purchasing a superfast connection i.e. with a
maximum download speed of up to 76Mbps. These connections are supplied to external customers by Enterprise purchasing an
FTTC/FTTP wholesale product from Openreach.
Ultrafast fibre share of broadband base
The proportion of measurable broadband lines (>90% of the figure defined above) purchasing an ultrafast connection i.e. with a
maximum download speed above 100Mbps. These connections are supplied to external customers by Enterprise purchasing a
Gfast/FTTP wholesale product from Openreach.
Glossary
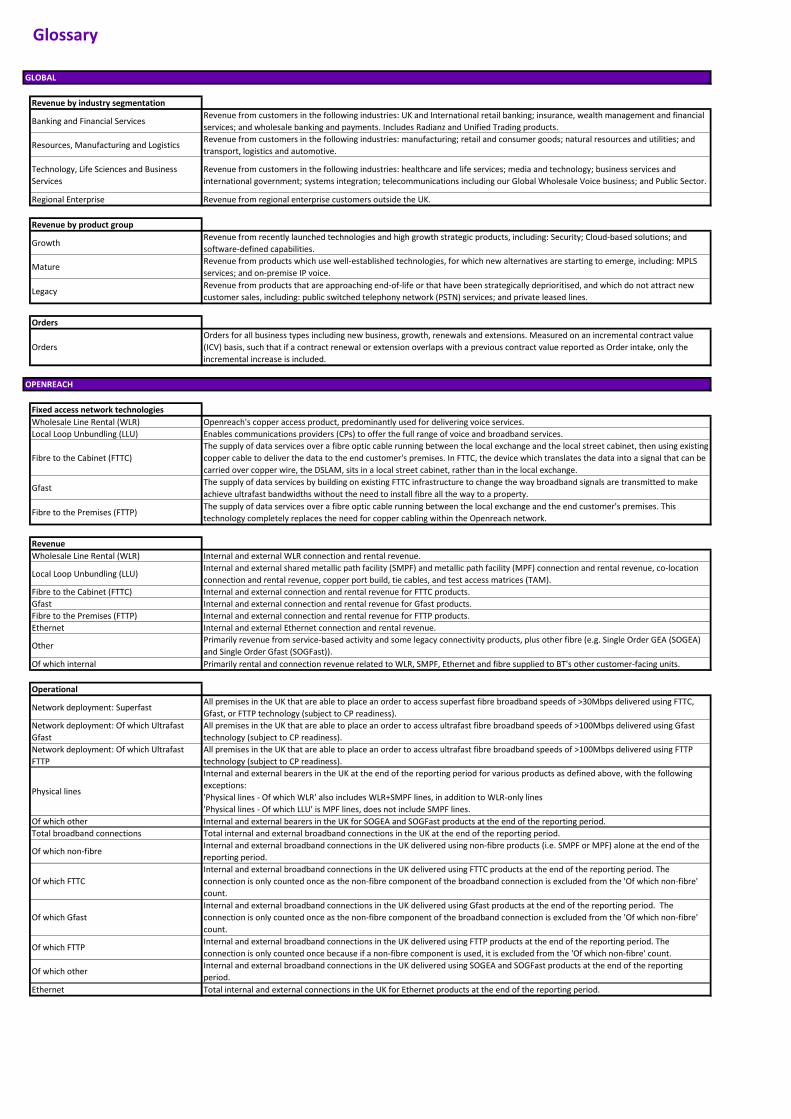
GLOBAL
Revenue by industry segmentation
Banking and Financial ServicesRevenue from customers in the following industries: UK and International retail banking; insurance, wealth management and financial
services; and wholesale banking and payments. Includes Radianz and Unified Trading products.
Resources, Manufacturing and LogisticsRevenue from customers in the following industries: manufacturing; retail and consumer goods; natural resources and utilities; and
transport, logistics and automotive.
Technology, Life Sciences and Business
Services
Revenue from customers in the following industries: healthcare and life services; media and technology; business services and
international government; systems integration; telecommunications including our Global Wholesale Voice business; and Public Sector.
Regional Enterprise Revenue from regional enterprise customers outside the UK.
Revenue by product group
GrowthRevenue from recently launched technologies and high growth strategic products, including: Security; Cloud-based solutions; and
software-defined capabilities.
MatureRevenue from products which use well-established technologies, for which new alternatives are starting to emerge, including: MPLS
services; and on-premise IP voice.
LegacyRevenue from products that are approaching end-of-life or that have been strategically deprioritised, and which do not attract new
customer sales, including: public switched telephony network (PSTN) services; and private leased lines.
Orders
Orders
Orders for all business types including new business, growth, renewals and extensions. Measured on an incremental contract value
(ICV) basis, such that if a contract renewal or extension overlaps with a previous contract value reported as Order intake, only the
incremental increase is included.
OPENREACH
Fixed access network technologies
Wholesale Line Rental (WLR) Openreach's copper access product, predominantly used for delivering voice services.
Local Loop Unbundling (LLU) Enables communications providers (CPs) to offer the full range of voice and broadband services.
Fibre to the Cabinet (FTTC)
The supply of data services over a fibre optic cable running between the local exchange and the local street cabinet, then using existing
copper cable to deliver the data to the end customer's premises. In FTTC, the device which translates the data into a signal that can be
carried over copper wire, the DSLAM, sits in a local street cabinet, rather than in the local exchange.
GfastThe supply of data services by building on existing FTTC infrastructure to change the way broadband signals are transmitted to make
achieve ultrafast bandwidths without the need to install fibre all the way to a property.
Fibre to the Premises (FTTP)The supply of data services over a fibre optic cable running between the local exchange and the end customer's premises. This
technology completely replaces the need for copper cabling within the Openreach network.
Revenue
Wholesale Line Rental (WLR) Internal and external WLR connection and rental revenue.
Local Loop Unbundling (LLU)Internal and external shared metallic path facility (SMPF) and metallic path facility (MPF) connection and rental revenue, co-location
connection and rental revenue, copper port build, tie cables, and test access matrices (TAM).
Fibre to the Cabinet (FTTC) Internal and external connection and rental revenue for FTTC products.
Gfast Internal and external connection and rental revenue for Gfast products.
Fibre to the Premises (FTTP) Internal and external connection and rental revenue for FTTP products.
Ethernet Internal and external Ethernet connection and rental revenue.
OtherPrimarily revenue from service-based activity and some legacy connectivity products, plus other fibre (e.g. Single Order GEA (SOGEA)
and Single Order Gfast (SOGFast)).
Of which internal Primarily rental and connection revenue related to WLR, SMPF, Ethernet and fibre supplied to BT's other customer-facing units.
Operational
Network deployment: SuperfastAll premises in the UK that are able to place an order to access superfast fibre broadband speeds of >30Mbps delivered using FTTC,
Gfast, or FTTP technology (subject to CP readiness).
Network deployment: Of which Ultrafast
Gfast
All premises in the UK that are able to place an order to access ultrafast fibre broadband speeds of >100Mbps delivered using Gfast
technology (subject to CP readiness).
Network deployment: Of which Ultrafast
FTTP
All premises in the UK that are able to place an order to access ultrafast fibre broadband speeds of >100Mbps delivered using FTTP
technology (subject to CP readiness).
Physical lines
Internal and external bearers in the UK at the end of the reporting period for various products as defined above, with the following
exceptions:
'Physical lines - Of which WLR' also includes WLR+SMPF lines, in addition to WLR-only lines
'Physical lines - Of which LLU' is MPF lines, does not include SMPF lines.
Of which other Internal and external bearers in the UK for SOGEA and SOGFast products at the end of the reporting period.
Total broadband connections Total internal and external broadband connections in the UK at the end of the reporting period.
Of which non-fibreInternal and external broadband connections in the UK delivered using non-fibre products (i.e. SMPF or MPF) alone at the end of the
reporting period.
Of which FTTC
Internal and external broadband connections in the UK delivered using FTTC products at the end of the reporting period. The
connection is only counted once as the non-fibre component of the broadband connection is excluded from the 'Of which non-fibre'
count.
Of which Gfast
Internal and external broadband connections in the UK delivered using Gfast products at the end of the reporting period. The
connection is only counted once as the non-fibre component of the broadband connection is excluded from the 'Of which non-fibre'
count.
Of which FTTPInternal and external broadband connections in the UK delivered using FTTP products at the end of the reporting period. The
connection is only counted once because if a non-fibre component is used, it is excluded from the 'Of which non-fibre' count.
Of which otherInternal and external broadband connections in the UK delivered using SOGEA and SOGFast products at the end of the reporting
period.
Ethernet Total internal and external connections in the UK for Ethernet products at the end of the reporting period.


![Key performance indicators [KPIs] and](https://img.dokumen.tips/doc/110x75/619ef645effb650ca84f0124/key-performance-indicators-kpis-and.jpg)


