Embed Size (px)
Citation preview

Key issues for advancing high field superconducting magnets: quench detection & degradation limits
Justin SchwartzDepartment of Materials Science and EngineeringNorth Carolina State University
With contributions from Wan Kan Chan, Gene Flanagan (Muons Inc.), Sasha Ishmael, Pei Li (FNAL), Federico Scurti, Tengming Shen (FNAL) and Liyang Ye, and also thanks to the team from National Instruments Funded by the U.S. Department of Energy through the SBIR/STTR program, FNAL and by ARPA-E
2014 Kyoto Workshop on HTS Magnet Technology for High Energy Physics – The 2nd Workshop on Accelerator Magnet in HTS (WAMHTS-2)
14 November 2014

Outline• Introduction• Recent progress on Rayleigh scattering based optical fiber
quench detection• Quench degradation limits
– Experimental study of Bi2212 round wire– Computational modeling of YBCO CC
• Conclusions
2
“Everyone believes the experiment except the experimentalist,
No one believes the theory except the theorist”.-- anon.
Goal: prevent degradation w/o overly reducing JE• A race between the time-to-degradation & the time-to-protect• Assessments in terms of a “time budget”
time-to-degradeversus
time-to-detect/protect
3
NZ initiation to signal
Signal detection time
Signal assessment &
decision
Protective actions
Dtlost DtDAQ Dtdecision Dtresponse
Must avoid false positives

Optical fiber based quench detection
• Optical fibers interrogated by Rayleigh scattering enable fully distributed temperature sensors with high spatial resolution
• Must also be fast … ultimately it’s the time budget• Cross-correlations in wavelength domain between a reference and current
scan for each sensor can be related to a change in temperature/strain• The key challenge for converting the Rayleigh scatter profile into a
distributed temperature/strain sensor is data volume and the associated signal-processing time
• Here a prototype DAQA has been built and tested by combining GPUs and FPGAs to process data from both fiber and voltage data
4

System description
• Algorithm scans fiber for segment with maximum change and the 5 neighboring around it to calculate normal zone evolution. “Focuses” on a normal zone.
• Normal zones on unused segments (i.e. not included in previous normal zone) also identified • FPGA combines fiber data with analog voltage data calculated evolution of the normal zone is
correlated spatially with voltage data (for comparison; ultimately voltage data unnecessary)
5
Data paths, analog and fiber, combined and algorithms run on FPGA
Fiber data in
Fiber “hot spot regions” for decision algorithm and combination with analog data sent to board.
Voltage/Thermocouple/Power supply info
Rayleigh interrogator
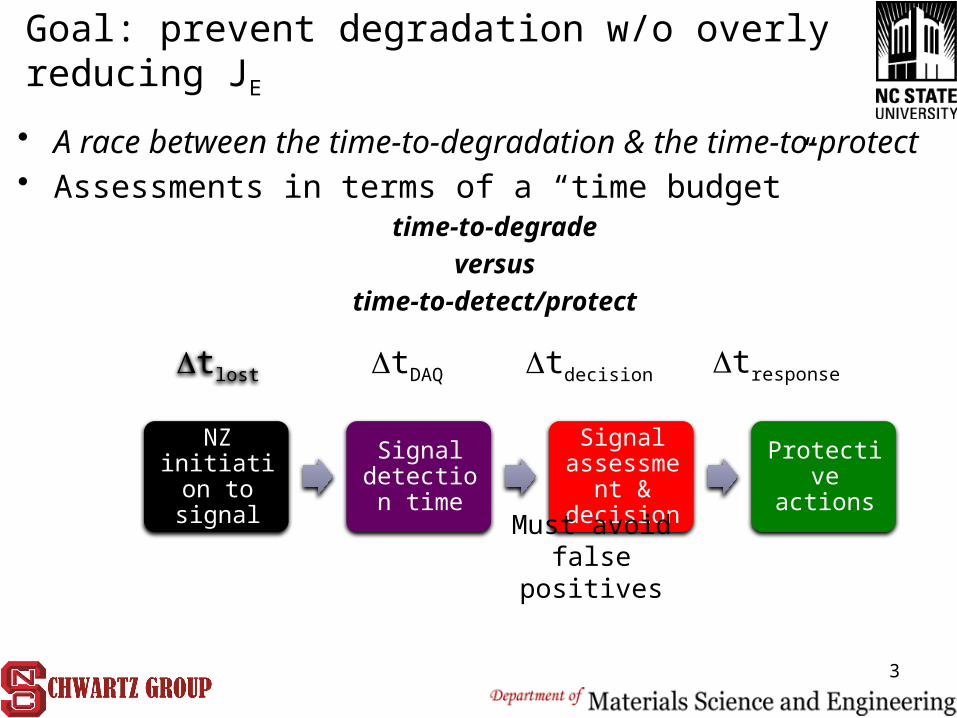
Very small disturbance recovery
• No signal seen in voltage data (T<Tcs)
• Optical fiber intrinsically more sensitive … “early notification” reduces tlost
• Can help manage data burden
• But must be wary of false positives
60 1 2 3 4 5 6
0
0.005
0.01
0.015
0.02
0.025
0.03
0.035
0.04
Hea
ter
PS
& P
S S
hunt
Vol
tage
[V]
time [s]
0 1 2 3 4 5 60
1
2
3
4
5
x 10-4
volta
ge [V
]
HeaterPS shuntSec1Sec2Sec3Sec5Sec6Sec7Sec8Sec9SecETE
Heater pulse voltage
Power supply shunt voltage
0 1 2 3 4 5 60
5
10
15
20
25
time [s]sp
ectr
al s
hift
[GH
z]
plot 0plot 1plot 2plot 3plot 4plot 5 (hottest spot)plot 6plot 7plot 8plot 9plot 10heat pulse (not to scale)
Spectral shift is detected during heat pulse
heat pulse
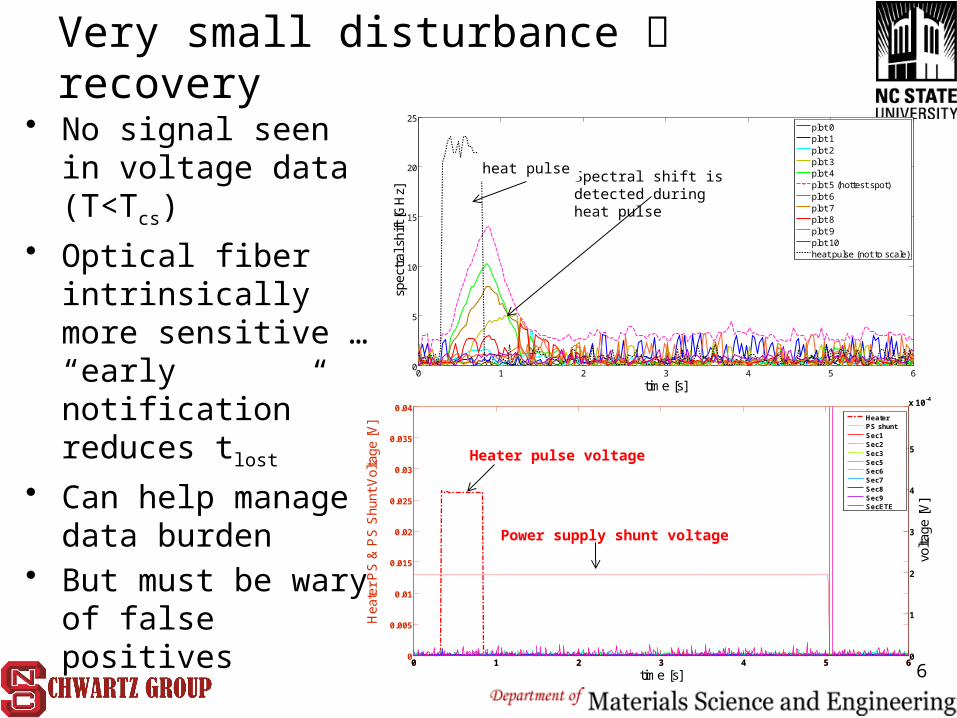
Increased heat pulse recovery
• Fiber again detects normal zone earlier than voltage taps
• Both systems show recovery
7
0 0.5 1 1.5 2 2.5 3 3.5 4 4.5 50
10
20
30
40
50
60
70
time [s]sp
ectr
al s
hift
[GH
z]
plot 0plot 1plot 2plot 3plot 4plot 5 (hottest spot)plot 6plot 7plot 8plot 9plot 10heat pulse (not to scale)
0
0.02
0.04
Hea
ter
PS
& P
S S
hunt
Vol
tage
[V]
time [s]
0 0.5 1 1.5 2 2.5 3 3.5 4 4.5 50
0.05
0.1
volta
ge [V
]
Heater PSPS shuntSec1Sec2 (heater)Sec3Sec5Sec6Sec7Sec8Sec9SecETE

Increase heat pulse quench
• Fiber again shows normal zone much earlier than voltage taps and over longer length
• Potential for high spatial resolution is clear
8
0 0.5 1 1.5 2 2.5 3 3.5 4 4.5 50
10
20
30
40
50
60
70
time [s]
spec
tral
shi
ft [G
Hz]
plot 0
plot 1
plot 2
plot 3
plot 4
plot 5 (hottest spot)
plot 6
plot 7
plot 8
plot 9
plot 10
heat pulse (not to scale)
0 0.5 1 1.5 2 2.5 3 3.5 4 4.5 50
0.005
0.01
0.015
0.02
0.025
0.03
0.035
0.04
Hea
ter
PS
& P
S S
hunt
vol
tage
[V]
time [s]
0 0.5 1 1.5 2 2.5 3 3.5 4 4.5 50
0.005
0.01
0.015
0.02
0.025
0.03
0.035
0.04
volta
ge [V
]
HeatershuntSec1Sec2Sec3Sec5Sec6Sec7Sec8Sec9

Implementation/scale-up• Scale-up: larger coil, longer fiber more data/sec• Migration to multiple GPUs working with FPGA(s) for increased data volume• Fiber integration into coils & cables, including access to ends for junctions/terminations• Cryo-optimized (enhanced) fibers further improvements in sensitivity increase can
allow decreased cycle-time or reduce front-end time-budget
9

Time-to-degradation: the other contestant in the race• Degradation limits and underlying causes of failure is where the most
significant disparity between conductors exists (LTS v Bi2212 v REBCO)
• Bi2212 round wire– Experimental forensics (relatively) straightforward; new results from Liyang Ye– Microstructural inhomogeneities modeling complexity
• REBCO CC– Experimental forensics challenging– Highly anisotropic geometry leads to modeling complexity, but these have been
overcome; emerging multiscale mechanical models
10

Quench-degradation in Bi2212 mostly wire-independent
11
OST 0.8 mm, 37*18Ic(s.f) = 450A
200 300 400 500 600 7000.80
0.82
0.84
0.86
0.88
0.90
0.92
0.94
0.96
0.98
1.00
Conductor A Conductor A Conductor A
I c a
fter
qu
en
ch /
initi
al I
c
Tmax
(K)
4.2 K, Self-field
OST 1.0 mm, 27*7Ic(s.f) = 160ALimited Bridging
200 300 400 500 600 7000.80
0.82
0.84
0.86
0.88
0.90
0.92
0.94
0.96
0.98
1.00
Conductor A Conductor A Conductor A Conductor B Conductor B
I c a
fter
qu
en
ch /
initi
al I
c
Tmax
(K)
4.2 K, Self-field
OST 1.2 mm, 85*18Ic(s.f) = 950A
200 300 400 500 600 7000.80
0.82
0.84
0.86
0.88
0.90
0.92
0.94
0.96
0.98
1.00
Conductor A Conductor A Conductor A Conductor B Conductor B Conductor C
I c a
fter
qu
en
ch /
initi
al I
c
Tmax
(K)
4.2 K, Self-field
200 300 400 500 600 7000.80
0.82
0.84
0.86
0.88
0.90
0.92
0.94
0.96
0.98
1.00
Fast degradationover 500~600 K
Slow degradationin 350~500 K
No degradationbelow 300 K
Conductor A Conductor A Conductor A Conductor B Conductor B Conductor C
I c a
fter
qu
en
ch /
initi
al I
c
Tmax
(K)
4.2 K, Self-field
L. Ye, T. Shen, J. Schwartz in progress – this entire section of the talk
What’s going on INSIDE the wires?
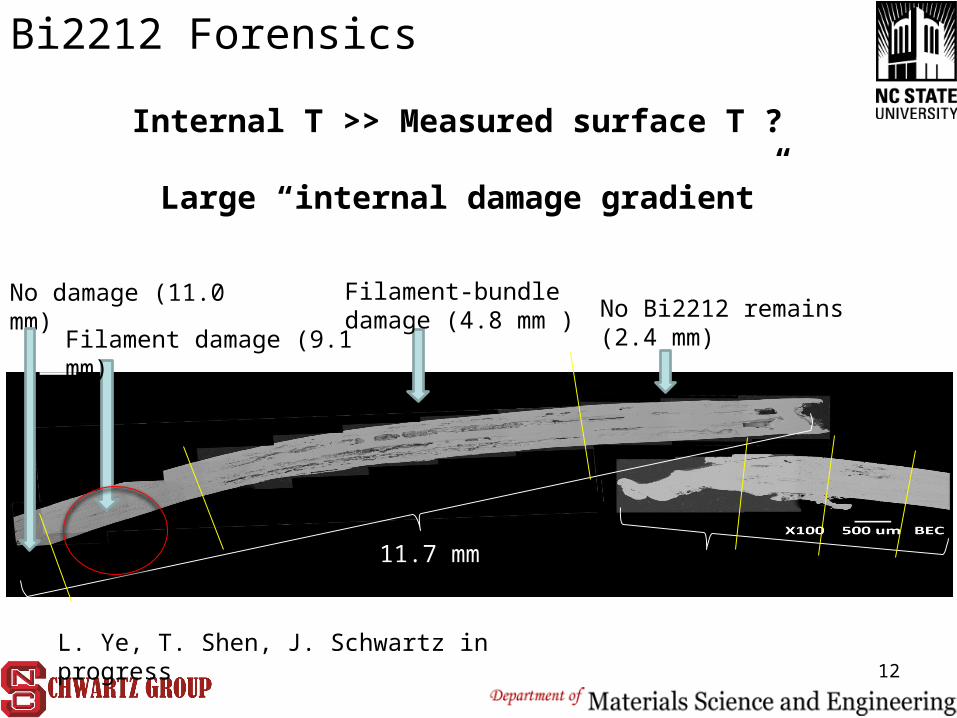
Bi2212 Forensics
12
11.7 mm
No damage (11.0 mm)
Filament damage (9.1 mm)
Filament-bundle damage (4.8 mm ) No Bi2212 remains
(2.4 mm)
L. Ye, T. Shen, J. Schwartz in progress
Internal T >> Measured surface T ?
Large “internal damage gradient”

9.1 mm spot: internal Bi2212 decomposition
13
11.7 mm 4.8 mm
9.3 mm left to burnt pointSecondary phase region observed on the Bi2212 filament
At > 862ºC, Bi2212 Liquid + AE +Cu-free
CF
Ag
AEC
Liquid
L. Ye, T. Shen, J. Schwartz in progress

Another sample… fracture observed (80% loss of Ic)
14
V1 V2 V3 V4 V5 V6 V70
100
200
300
400
500
600
700
800
I c (A
)
Position
Initial Ic Final Ic
0.0
0.2
0.4
0.6
0.8
1.0
Final Ic/Initial Ic
Initi
al I
c / F
ina
l I c
Short Sample #2
V4 V5V3V2
AB
C
B
• Fracture shows no Ag melting nor oxide phase transformations
• The distribution implies buckling due to compressive stress; wire wants to expand but is constrained
• Dynamics of these two experiments quite different due to differences in operating current

OP wire shows similar behavior
15
200 300 400 500 600 7000.80
0.82
0.84
0.86
0.88
0.90
0.92
0.94
0.96
0.98
1.00
1.02
1 Bar HT
100 Bar HT
I c af
ter q
uenc
h / i
nitia
l Ic
Tmax (K)
• Consistent with Godeke results on Ic-e of OP wire
• d(I/Ic)/dT is higher in OP wire around 450-500 K
100 200 300 400 500 600 700350
400
450
500
550
600
650
700
1Bar HT
100 Bar HT
I c a
fter
qu
en
ch (
A)
Tmax (K)
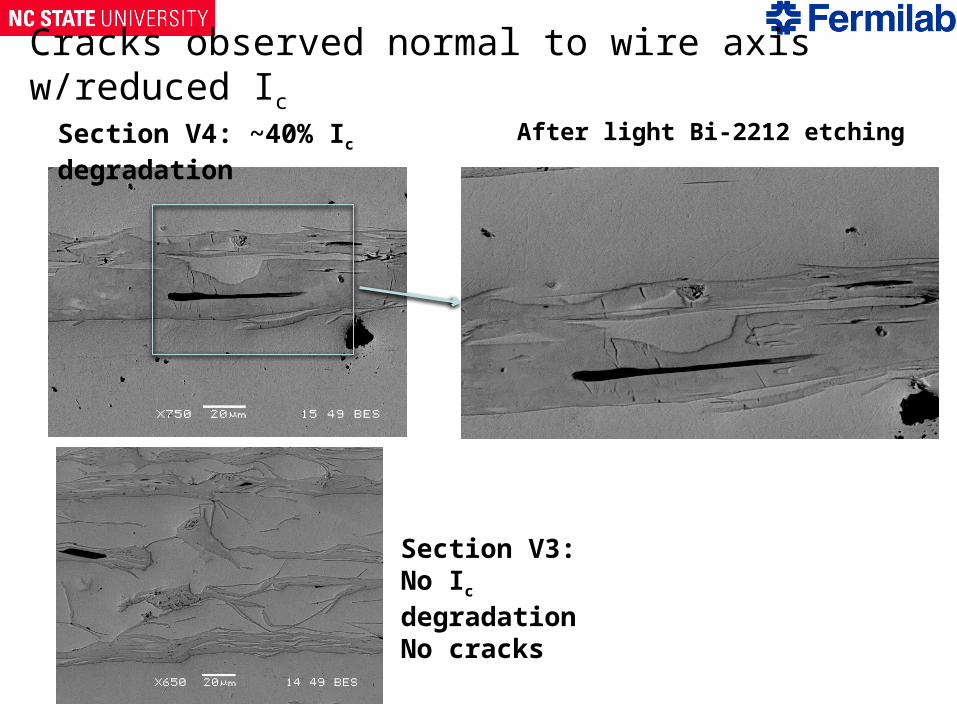
Cracks observed normal to wire axis w/reduced Ic
Section V4: ~40% Ic degradation After light Bi-2212 etching
Section V3: No Ic degradationNo cracks

Compare short wires to samples on ITER barrels of different materials
Pre-strain determines temperature limit more than wire architecture or HT process
17
200 300 400 500 600 7000.80
0.85
0.90
0.95
1.00
Ti-alloy Barrel #1
8cm sample
16cm sample
Ti-alloy Barrel #2
I c a
fte
r q
ue
nch
/I c b
efo
re q
ue
nch
Tmax
(K)
G-10 Barrel
4cm sample
Increasing constraintTi-alloy barrel
G-10 barrel

Next level questions … .
• From what pre-existing defects or artifacts due the cracks nucleate or grow?
• What is optimum strain state in the wire after cool-down?
• Pre-compression increases allowable hoop-strain from Lorentz forces, but tensile strain delays quench degradation
18

REBCO conductor degradation• Past studies showed:
– Quench degradation is defect driven (Song et al., Acta Materialia) and highly localized
– Delamination is also a failure mode• REBCO mechanical state is complex; needs understanding of
microscopic stress distributions• Accumulated stresses from conductor fabrication, cable fabrication,
bending, cooling, Lorentz forces, thermal stresses during a quench– Important to understand but difficult to measure in-situ the stress/strain profile
of each layer within a conductor
19

3D/2D electro-thermo-structural tape model• Real dimensions, from mm to device scale• Computationally efficient and experimentally validated• Coupled electrical, magnetostatic, thermal and structural mechanics• Full elastoplasticity on all layers
20
Q
TTJJc(B,θ,T)
Fm
Electric(Superconductivity)
Thermal
Magnetostatic Structural Mechanics
Contact mechanics
Bending radius
Bending model
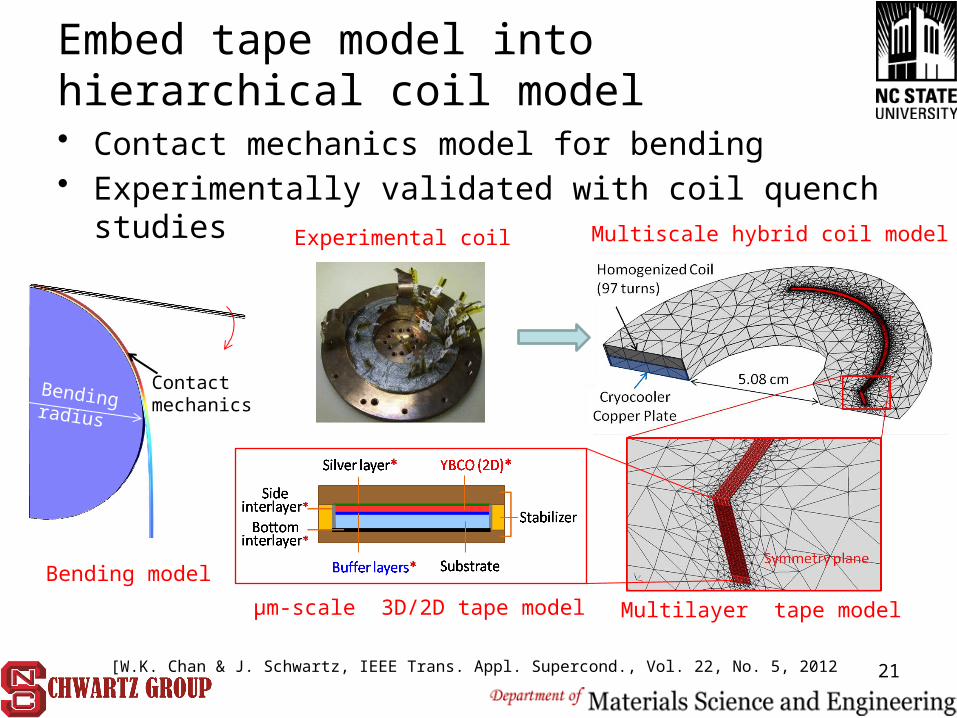
Embed tape model into hierarchical coil model• Contact mechanics model for bending• Experimentally validated with coil quench studies
21
Experimental coil
Multilayer tape modelμm-scale 3D/2D tape model
Multiscale hybrid coil model
[W.K. Chan & J. Schwartz, IEEE Trans. Appl. Supercond., Vol. 22, No. 5, 2012

Most recent - adding a structural model
22
Fabrication Cooling
FatigueAnalysis
Tension@ RT, 77 K
Bending @ 77 K
Quench @ 77 K
ExperimentalValidation
ExperimentalValidation
ComputationalValidation
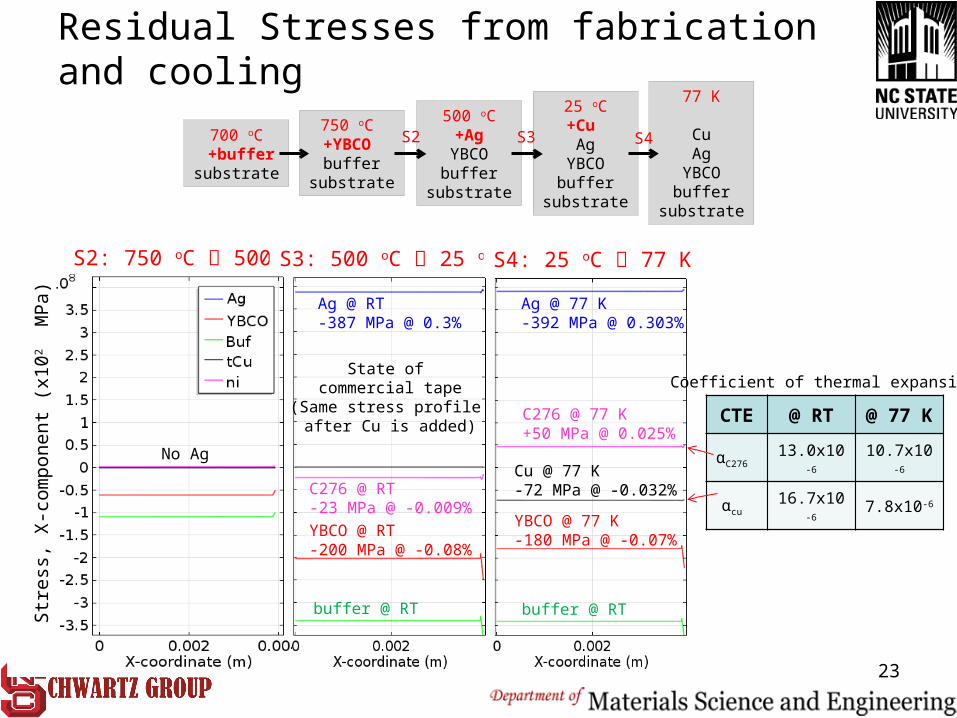
Residual Stresses from fabrication and cooling
23
700 oC +buffersubstrate
750 oC +YBCO
buffersubstrate
500 oC+Ag
YBCObuffer
substrate
25 oC+Cu Ag
YBCObuffer
substrate
77 K
CuAg
YBCObuffer
substrate
S2 S3 S4
CTE @ RT @ 77 K
αC276 13.0x10⁻⁶ 10.7x10⁻⁶
αcu 16.7x10⁻⁶ 7.8x10⁻⁶
S2: 750 oC 500 oC S3: 500 oC 25 oC S4: 25 oC 77 K
YBCO @ RT-200 MPa @ -0.08%
YBCO @ 77 K-180 MPa @ -0.07%
Cu @ 77 K-72 MPa @ -0.032%C276 @ RT
-23 MPa @ -0.009%
C276 @ 77 K+50 MPa @ 0.025%
Ag @ RT-387 MPa @ 0.3%
Ag @ 77 K-392 MPa @ 0.303%
Stre
ss, X
-com
pone
nt (x
102
MPa
)
State of commercial tape
(Same stress profile after Cu is added)
buffer @ RT buffer @ RT
No Ag
Coefficient of thermal expansion

Validation via tensile analysis v experimentsimilar validation done using bending experiments
24
1. Apply axial tensile load2. Capture key behavior:
a. Yield stresses and strains of tapei. Yield strain predominately determined by Hastelloyii. Yield stress determined by both Cu and Hastelloy
b. Critical stresses and strains on YBCO layer3. Tangent moduli (hardening slopes) are the least known data4. Yield points in YBCO and buffer are considered as fracture points
εc = 0.0045
ExperimentSimulation
YBCO
Stre
ss, X
-com
pone
nt (G
Pa)
@ 77 K
xx
εy = 0.0066
Experiment
SimulationYBCO
Stre
ss, X
-com
pone
nt (G
Pa)
@ RT
x
x
εy = 0.005 εc = 0.0065

Study bending + quench (500 K) in conductor
25Tensile bending @ 77 K, R = 8.75 mm Compressive bending @ 77 K, R = 8.75 mm
Dashed: Tpeak = 77 KSolid: Tpeak = 500 K
Stre
ss, X
-com
pone
nt (x
102
MPa
)
Stre
ss, X
-com
pone
nt (x
102
MPa
)
1. Hot-spot temperature drives stresses on YBCO and buffer to be a. More tensile on tensile bending – bad!b. Less compressive on compressive bending – good!
2. For bending radius of R = 8.75 mm, stresses still < tensile limit (588 MPa) even temperature rises to 500 K – the melting temperature of solder.a. Lower stress margin under winding tension and hoop force
in coil lower maximum, safe temperature for protection
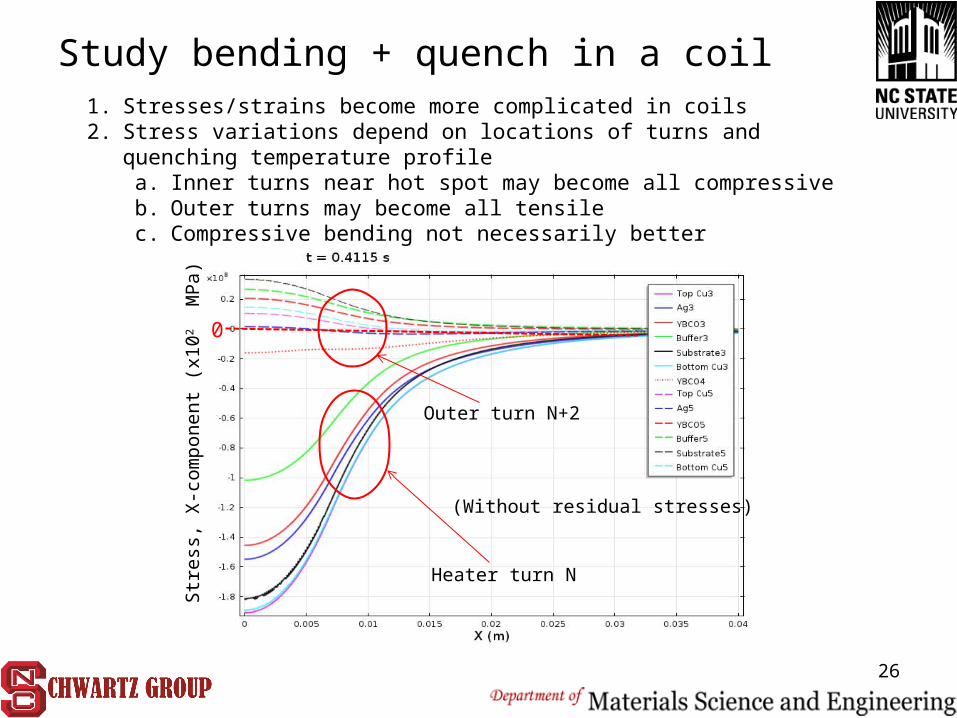
Study bending + quench in a coil
26
Outer turn N+2
Heater turn N
0
1. Stresses/strains become more complicated in coils2. Stress variations depend on locations of turns and quenching
temperature profilea. Inner turns near hot spot may become all compressiveb. Outer turns may become all tensilec. Compressive bending not necessarily better
Stre
ss, X
-com
pone
nt (x
102
MPa
)
(Without residual stresses)

Conclusions
• Optical fiber quench detection may expand time budget by detecting incipient quenches well before current sharing
• Scale-up challenges are significant but solutions are evident
• Failure limits in Bi2212 vary weakly with wire and heat treatment, but strongly with wire initial stress state
• Pre-compression trade-off between maximizing “tensile strain budget” for Lorentz forces in highest field region and quench protection in low(er) field region
• Stress state in REBCO conductors is complex; layer-by-layer analysis may be needed (at least in highest stressed region of the magnet)
27

Closing thought
“An overreliance on past successes is a sure blueprint for future failures.”
-- Henry Petroski
28
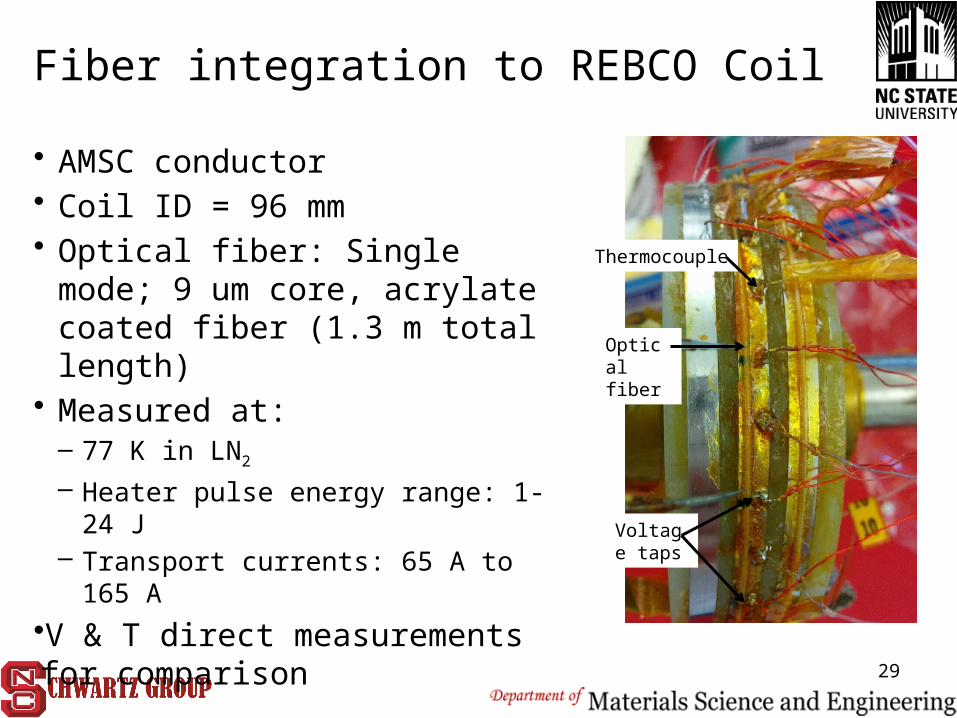
Fiber integration to REBCO Coil
• AMSC conductor• Coil ID = 96 mm• Optical fiber: Single mode; 9 um core,
acrylate coated fiber (1.3 m total length)• Measured at:
– 77 K in LN2 – Heater pulse energy range: 1- 24 J– Transport currents: 65 A to 165 A
•V & T direct measurements for comparison
29
Voltage taps
Thermocouple
Optical fiber

![MuCool Superconducting Solenoid Quench …...Index Terms— Superconducting solenoid, Magnetic field, Quench, 3D simulations, Test Stand. I. INTRODUCTION HE MUCOOL experiment [1] magnet](https://img.dokumen.tips/doc/110x75/5e92b2bd1d72c02008514bd1/mucool-superconducting-solenoid-quench-index-termsa-superconducting-solenoid.jpg)