Embed Size (px)
Citation preview

Barry Callebaut | Annual Report /
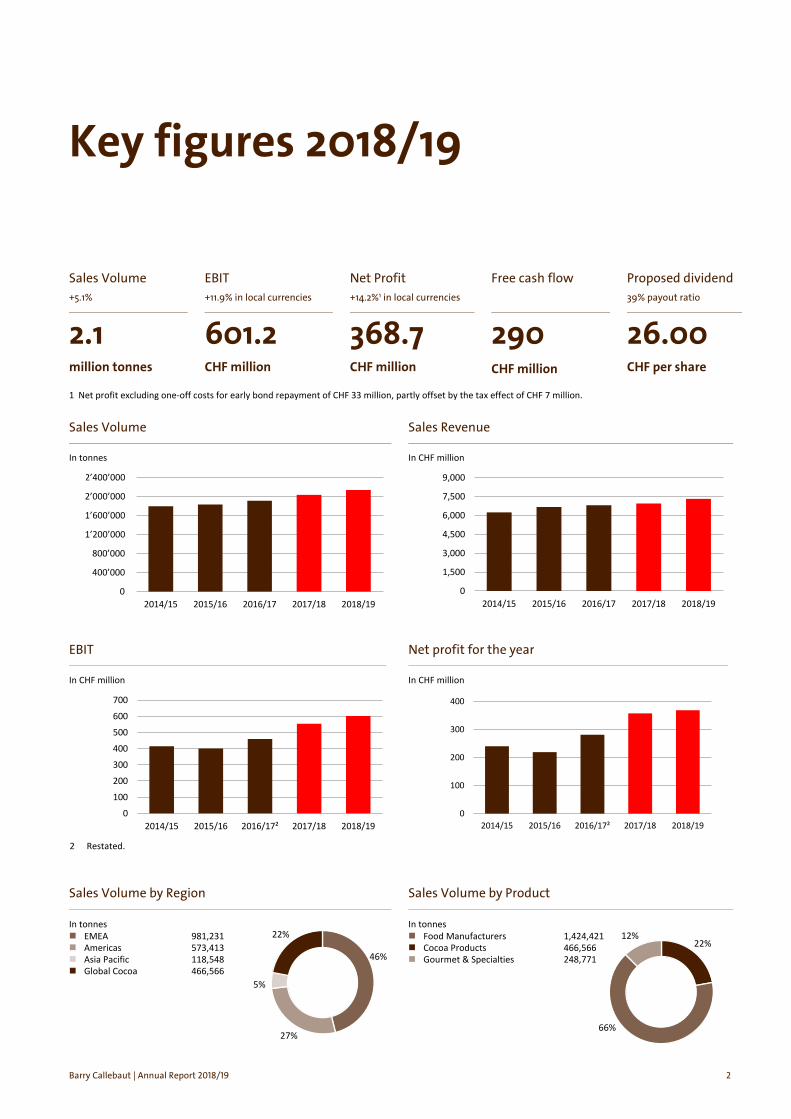
Key figures 2018/19
Sales Volume +5.1%
2.1 million tonnes
EBIT +11.9% in local currencies
601.2 CHF million
Net Profit +14.2%1 in local currencies
368.7 CHF million
Free cash flow
290 CHF million
Proposed dividend 39% payout ratio
26.00 CHF per share
1 Net profit excluding one-off costs for early bond repayment of CHF 33 million, partly offset by the tax effect of CHF 7 million.
Sales Volume
In tonnes
Sales Revenue
In CHF million
EBIT
In CHF million
Net profit for the year
In CHF million
Sales Volume by Region
In tonnes EMEA 981,231 Americas 573,413 Asia Pacific 118,548 Global Cocoa 466,566
Sales Volume by Product
In tonnes Food Manufacturers 1,424,421 Cocoa Products 466,566 Gourmet & Specialties 248,771
0
400’000
800’000
1’200’000
1’600’000
2’000’000
2’400’000
2014/15 2015/16 2016/17 2017/18 2018/190
1,500
3,000
4,500
6,000
7,500
9,000
2014/15 2015/16 2016/17 2017/18 2018/19
0
100
200
300
400
500
600
700
2014/15 2015/16 2016/17² 2017/18 2018/190
100
200
300
400
2014/15 2015/16 2016/17² 2017/18 2018/19
2 Restated.
46%
27%
5%
22%22%
66%
12%

Barry Callebaut | Annual Report /
Fiscal year 2018/19 in brief • Sales volume up +5.1%, well above the market growth1
• Sales revenue of CHF 7.3 billion, up +7.8% in local currencies (+5.2% in CHF)
• Operating profit (EBIT) up +11.9% in local currencies (+8.5% in CHF)
• Net profit2 up +14.2% in local currencies (+10.4% in CHF)
• Free cash flow of CHF 290 million
• Mid-term guidance 2015/16–2018/19 delivered3, on average +4.5% volume growth and +13.9% EBIT growth in local currencies
• Board members Jakob Baer and Juergen Steinemann will not stand for reelection
• Proposed payout to shareholders of CHF 26.00 per share, up +8.3%
EMEA Americas Asia Pacific Global Cocoa
Volume growth vs. prior year .
+6.1% +4.4% +12.1% +2.4%
EBIT growth vs. prior year in local currencies
+5.9% +9.0% +13.8% +25.0%
1 Source: Nielsen, +1.8% in volume for the period August 2018 to August 2019 – 25 countries, excluding e-commerce channels. 2 Net profit excluding one-off costs for early bond repayment of CHF 33 million, partly offset by the tax effect of CHF 7 million. 3 On average for the 4-year period 2015/16 to 2018/19: 4–6% volume growth and EBIT above volume growth in local currencies,
barring any major unforeseen events.

Barry Callebaut | Annual Report /
601.2 EBIT in CHF million
7,309.0 Sales revenue in CHF million
More than
175 years of chocolate heritage
23 CHOCOLATE ACADEMYTM Centers
More than 60,000 chocolate aficionados trained in 2018/19
62 factories worldwide
Selling to
140
countries
This is Barry Callebaut “Shaping the world of chocolate and cocoa”
Sustainably sourced cocoa beans
47%
Mid-term guidance delivered
for the 4-year period 2015/16 to 2018/19
More than
12,000 employees
on average
+4.5% Volume growth
on average
+13.9% EBIT growth in local currencies
2.1 million Sales volume in tonnes
+5.1% Volume growth
Table of Content
Barry Callebaut | Annual Report /
Letter to Shareholders Letter to Shareholders
Overview Business at a Glance
-Year Overview
Risk Overview
Business Highlights Financial Review
Business Review
Sustainability Our Approach
Prospering Farmers
Zero Child Labor
Thriving Nature
Sustainable Chocolate
Our People Employee Development
Financial Reports Consolidated Financial Statements
Notes to the Consolidated Financial Statements
Financial Statements of Barry Callebaut AG
Governance Corporate Governance
Remuneration Report
Definition of financial performance measures
Contact & Financial calendar

Letter to Shareholders Overview Business Highlights Sustainability Our People Financial Reports Governance
Letter to Shareholders
Barry Callebaut | Annual Report /
Good growth momentum continues Our proven long-term strategy and its consistent execution delivered another set of strong results, creating value for our shareholders and other stakeholders. The successful completion of our 4-year mid-term guidance gave us the confidence to renew it for the next 3-year period.
Dear Shareholders, As a company, we are committed to the long-term creation of value for our shareholders and other stakeholders. For the 4-year period 2015/16 to 2018/19 we set ourselves the ambitious target of 4–6% volume growth and EBIT above volume growth in local currencies on average per annum. Now, at the end of these four years, we are proud to have achieved an average above-market volume growth of +4.5% and EBIT growth in local currencies of +13.9%, three times faster than volumes. During the same period, our share price increased by +90.8%. These achievements confirm the strength of our long-term ‘smart growth’ strategy and gave us the confidence to renew our guidance for the next 3-year period ending on August 31, 2022.
In fiscal year 2018/19, the consistent execution of our strategy delivered another strong set of results. We achieved broad based volume growth of +5.1% to 2.1 million tonnes across all Regions and key growth drivers: Outsourcing, Emerging Markets and Gourmet. Sales volume in the chocolate business rose by +5.9%, about three times faster than the underlying global chocolate confectionery market, which grew +1.8% according to Nielsen. Sales revenue increased by +7.8% in local currencies to CHF 7,309.0 million, supported by higher raw material prices and the first-time adoption of IFRS 15. Operating profit (EBIT) increased by +11.9% in local currencies to CHF 601.2 million. EBIT growth was more than double the volume growth, supported by all Regions and product groups. Net profit for the year – excluding the one-off effect for the early bond repayment – grew by +14.2%1 in local currencies to CHF 394.7 million. Reported net profit
amounted to CHF 368.7 million, up +6.9% in local currencies. Free cash flow amounted to CHF 290 million and was impacted by the one-off effect of CHF 33 million of the early bond repayment.
To allow shareholders to participate in the Group’s success, the Board of Directors proposes a payout of CHF 26.00 per share to the Annual General Meeting of Shareholders on December 11, 2019, an increase of +8.3% on top of the strong increase last year.
In fiscal year 2018/19, we again achieved a number of strategic milestones:
Expansion. We strengthened our presence and accelerated the expansion of our capacities and capabilities in all Regions. In Russia, the integration of Inforum, a leading B2B producer of chocolate, coatings and fillings, is well on track. In Serbia, the state-of-the-art facility in Novi Sad, our first chocolate factory in Southeastern Europe, is expected to be operational by 2021. We opened CHOCOLATE ACADEMY™ Centers in Beijing and Antwerp, bringing the number of these training centers for chocolate professionals to 23. In Region Americas, we accelerated the expansion of our chocolate production capacities. In India, one of the fastest growing chocolate markets in Asia, we laid the first stone for the construction of a chocolate factory in Baramati. In Indonesia, we strengthened our partnership with Garudafood, a leading food company, by opening a second chocolate plant in Rancaekek. In Côte d’Ivoire, we inaugurated a cocoa processing unit in Abidjan, enabling us to expand our capacity there by 40% by 2022.
Innovation. The fourth type of chocolate, Ruby, was launched in the US, the world’s largest chocolate and confectionery market, and Canada in May 2019; Ruby is now available in more than 50 countries worldwide. Our sugar-reduced solutions, like the new dark and milk 1 Net profit excluding one-off costs for early bond repayment of
CHF 33 million, partly offset by the tax effect of CHF 7 million.
Letter to Shareholders Overview Business Highlights Sustainability Our People Financial Reports Governance
Letter to Shareholders
Barry Callebaut | Annual Report /
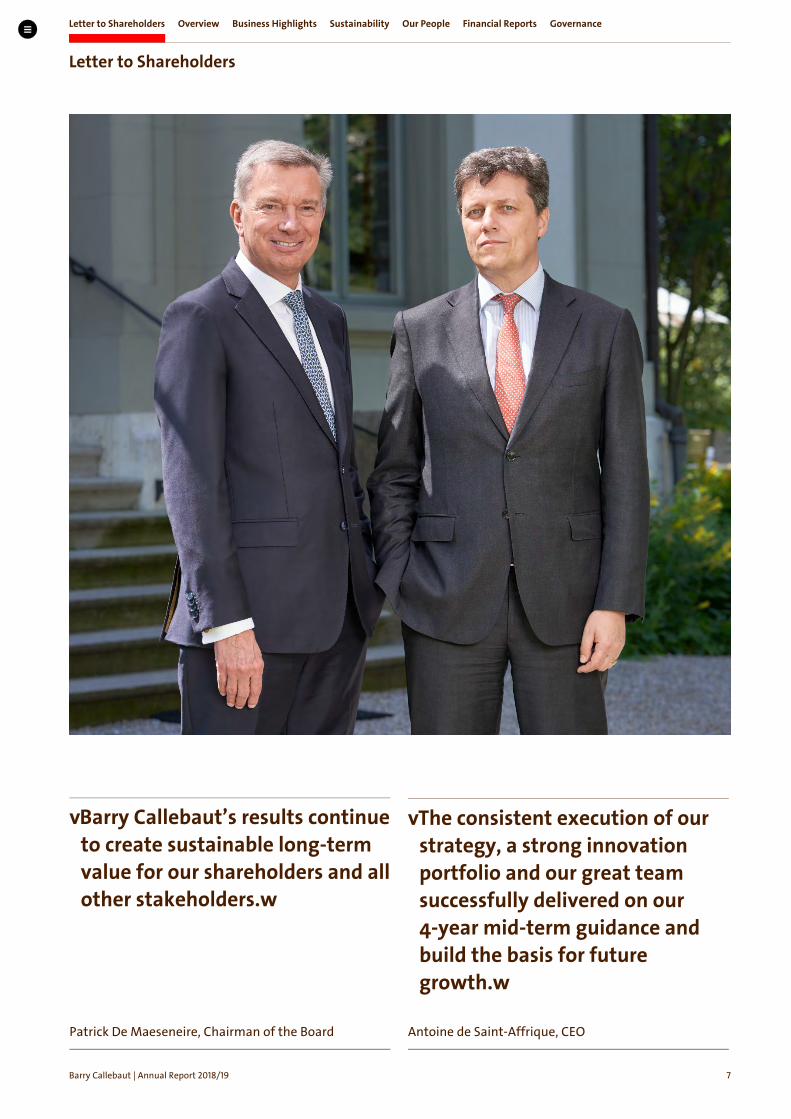
“Barry Callebaut’s results continue to create sustainable long-term value for our shareholders and all other stakeholders.”
Patrick De Maeseneire, Chairman of the Board
“The consistent execution of our strategy, a strong innovation portfolio and our great team successfully delivered on our 4-year mid-term guidance and build the basis for future growth.”
Antoine de Saint-Affrique, CEO

Letter to Shareholders Overview Business Highlights Sustainability Our People Financial Reports Governance
Letter to Shareholders
Barry Callebaut | Annual Report /
chocolate with only 1% added sugar, cater to the desires of wholesome choice consumers. Bensdorp, our premium cocoa powder brand, introduced “Natural Dark”. This 100% natural cocoa powder enables food manufacturers to deliver dark cocoa creations with an intense chocolate taste and a 100% clean label. In September 2019, we unveiled ‘Cacaofruit Experience’, a new Food & Drink category including ‘Wholefruit Chocolate’, which makes use of the entire cacaofruit.
Cost leadership: In February 2019, we successfully placed a EUR 600 million equivalent Schuldscheindarlehen that improves our debt and liquidity structure. At least two-thirds of the proceeds will finance sustainability related projects to support cocoa farmers and their communities. Given the success of our debut in the Schuldscheindarlehen market, we repaid the outstanding 5.375% Senior Note, due 2021, in the amount of EUR 250 million in August 2019. As a result, we expect a positive impact on net finance expense of around CHF 10 million as of fiscal year 2019/20. This, together with the ongoing roll-out of our SAP system and more efficient business processes, will contribute to our cost competitiveness.
Sustainability. For us, sustainability is business critical. Forever Chocolate, our plan to make sustainable chocolate the norm by 2025, is proving to be highly impactful in creating a sustainable cocoa and chocolate supply chain. We are proud that our investments in a sustainable value chain were acknowledged in July 2019, when Sustainalytics – a global leader in ESG and Corporate Governance research and ratings – ranked Forever Chocolate as the #1 sustainability strategy out of 178 food companies. In September, we joined two initiatives at the United Nations Climate Action Summit in New York: The One Planet Business for Biodiversity (OP2B) coalition, a coalition of food and agriculture companies determined to protect and restore cultivated and natural biodiversity within their value chains, and the “Just Rural Transition” initiative, which is committed to transforming by 2030 the way in which food is produced and consumed.
Ample opportunities for growth Growth opportunities can be found everywhere: in new markets, customer segments, product categories or channels. We look to the next 3-year period with confidence. Not least because of the extraordinary talent we have at Barry Callebaut. The dedication, expertise and passion of our employees, together with our strong corporate values, are the best recipe for continued business success. We would like to warmly thank our employees for another very strong performance in 2018/19.
Going forward, we remain committed to pursuing our ‘smart growth’ strategy. Good growth momentum, a strong innovation portfolio and discipline in execution make us confident of delivering on our renewed mid-term guidance, which is on average for the 3-year period 2019/20 to 2021/22: 4–6% volume growth and EBIT above volume growth in local currencies, barring any major unforeseen events.
To conclude, we would like to thank all our customers and shareholders for their trust and continued support.
Patrick De Maeseneire Antoine de Saint-Affrique Chairman of the Board Chief Executive Officer
Letter to Shareholders Overview Business Highlights Sustainability Our People Financial Reports Governance
Business at a Glance
Barry Callebaut | Annual Report /
Our vision We are the heart and engine of the chocolate and cocoa industry.
Our values Everything we do is rooted in our five core values: customer focus, passion, entrepreneurship, team spirit and integrity. We believe in doing well to do good. This is also reflected in the fact that about half of our dividends support the Jacobs Foundation, which is dedicated to education and the future of young people.
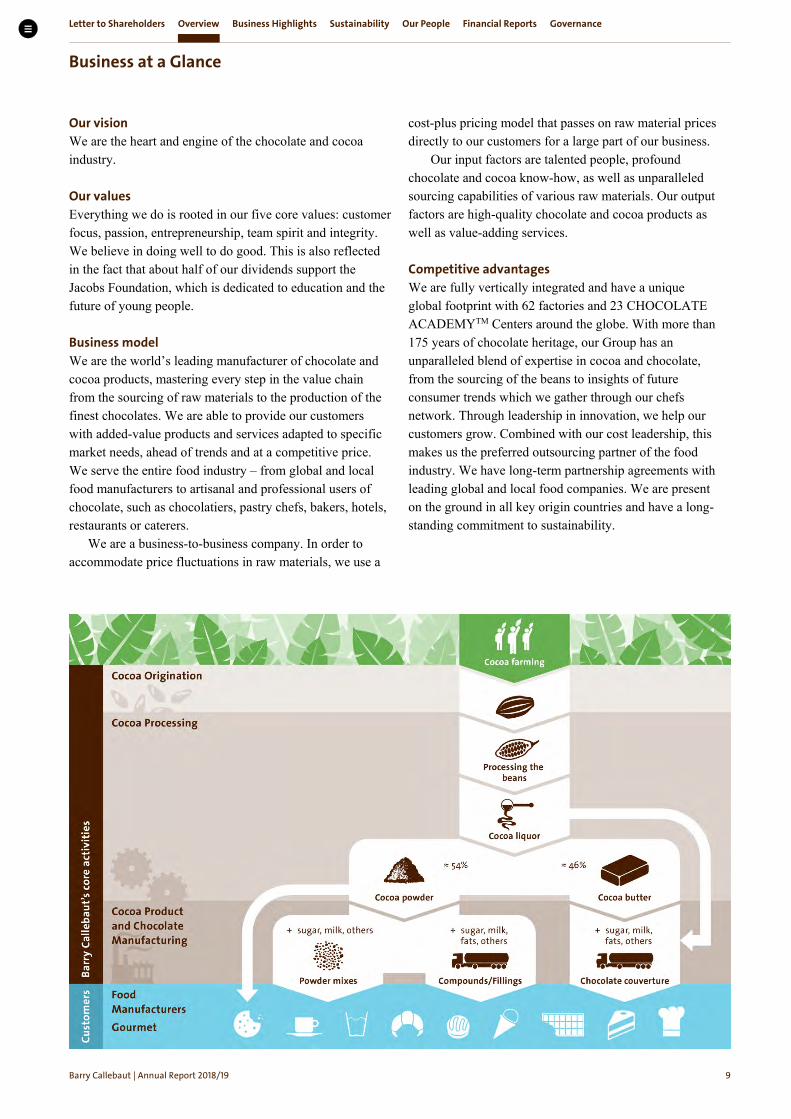
Business model We are the world’s leading manufacturer of chocolate and cocoa products, mastering every step in the value chain from the sourcing of raw materials to the production of the finest chocolates. We are able to provide our customers with added-value products and services adapted to specific market needs, ahead of trends and at a competitive price. We serve the entire food industry – from global and local food manufacturers to artisanal and professional users of chocolate, such as chocolatiers, pastry chefs, bakers, hotels, restaurants or caterers.
We are a business-to-business company. In order to accommodate price fluctuations in raw materials, we use a
cost-plus pricing model that passes on raw material prices directly to our customers for a large part of our business.
Our input factors are talented people, profound chocolate and cocoa know-how, as well as unparalleled sourcing capabilities of various raw materials. Our output factors are high-quality chocolate and cocoa products as well as value-adding services.
Competitive advantages We are fully vertically integrated and have a unique global footprint with 62 factories and 23 CHOCOLATE ACADEMYTM Centers around the globe. With more than 175 years of chocolate heritage, our Group has an unparalleled blend of expertise in cocoa and chocolate, from the sourcing of the beans to insights of future consumer trends which we gather through our chefs network. Through leadership in innovation, we help our customers grow. Combined with our cost leadership, this makes us the preferred outsourcing partner of the food industry. We have long-term partnership agreements with leading global and local food companies. We are present on the ground in all key origin countries and have a long-standing commitment to sustainability.
Letter to Shareholders Overview Business Highlights Sustainability Our People Financial Reports Governance
Business at a Glance
Barry Callebaut | Annual Report /
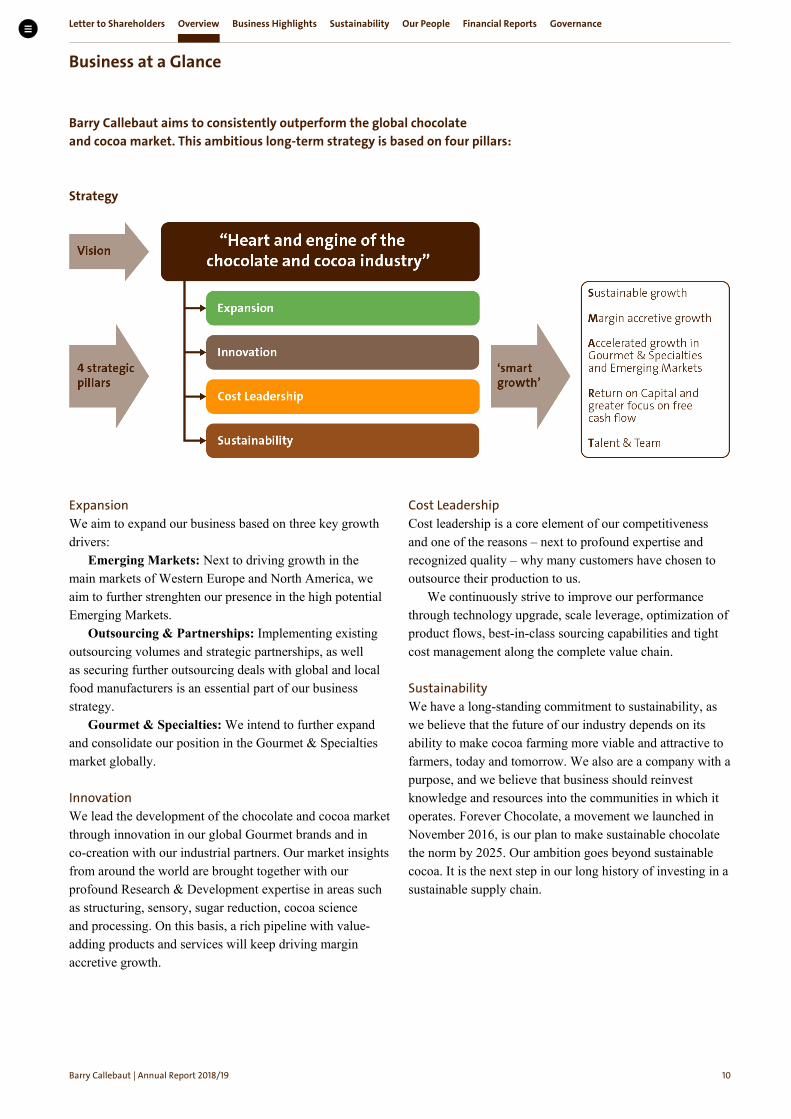
Barry Callebaut aims to consistently outperform the global chocolate and cocoa market. This ambitious long-term strategy is based on four pillars: Strategy
Expansion We aim to expand our business based on three key growth drivers:
Emerging Markets: Next to driving growth in the main markets of Western Europe and North America, we aim to further strenghten our presence in the high potential Emerging Markets.
Outsourcing & Partnerships: Implementing existing outsourcing volumes and strategic partnerships, as well as securing further outsourcing deals with global and local food manufacturers is an essential part of our business strategy.
Gourmet & Specialties: We intend to further expand and consolidate our position in the Gourmet & Specialties market globally.
Innovation We lead the development of the chocolate and cocoa market through innovation in our global Gourmet brands and in co-creation with our industrial partners. Our market insights from around the world are brought together with our profound Research & Development expertise in areas such as structuring, sensory, sugar reduction, cocoa science and processing. On this basis, a rich pipeline with value-adding products and services will keep driving margin accretive growth.
Cost Leadership Cost leadership is a core element of our competitiveness and one of the reasons – next to profound expertise and recognized quality – why many customers have chosen to outsource their production to us.
We continuously strive to improve our performance through technology upgrade, scale leverage, optimization of product flows, best-in-class sourcing capabilities and tight cost management along the complete value chain.
Sustainability We have a long-standing commitment to sustainability, as we believe that the future of our industry depends on its ability to make cocoa farming more viable and attractive to farmers, today and tomorrow. We also are a company with a purpose, and we believe that business should reinvest knowledge and resources into the communities in which it operates. Forever Chocolate, a movement we launched in November 2016, is our plan to make sustainable chocolate the norm by 2025. Our ambition goes beyond sustainable cocoa. It is the next step in our long history of investing in a sustainable supply chain.
Letter to Shareholders Overview Business Highlights Sustainability Our People Financial Reports Governance
5-Year Overview
Barry Callebaut | Annual Report /
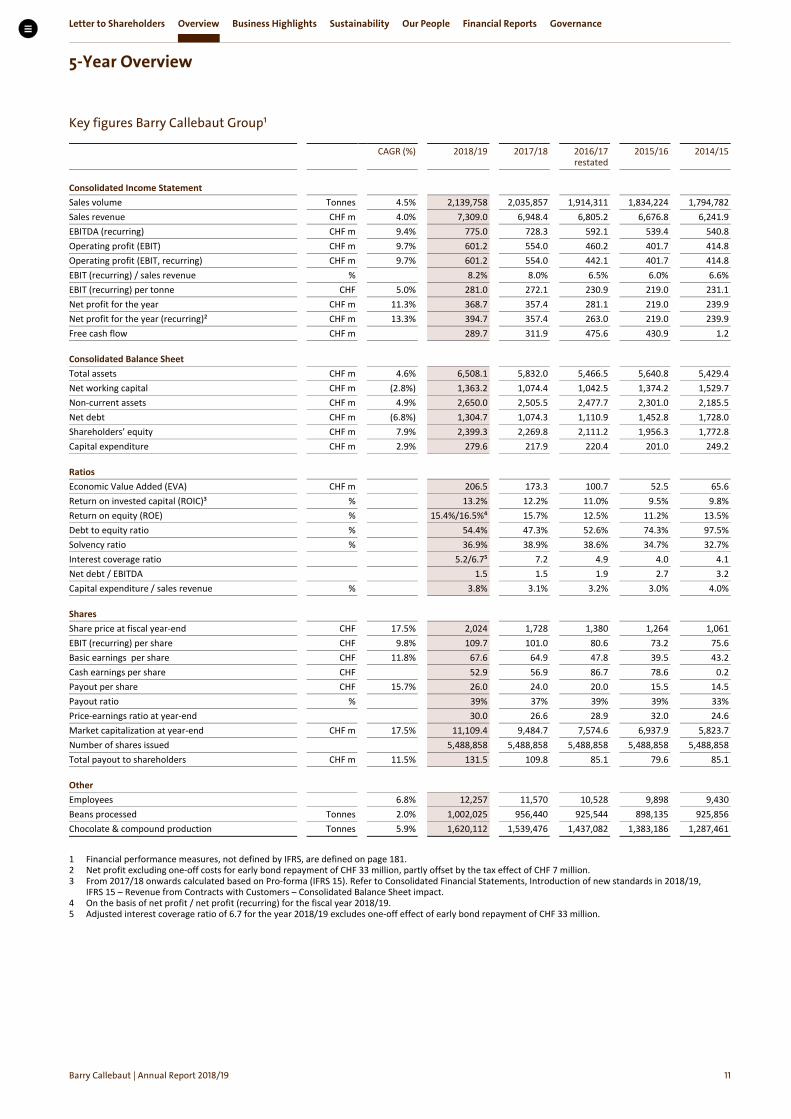
Key figures Barry Callebaut Group¹
CAGR (%)
2018/19 2017/18
2016/17 restated
2015/16
2014/15
Consolidated Income Statement
Sales volume Tonnes 4.5% 2,139,758 2,035,857 1,914,311 1,834,224 1,794,782 Sales revenue CHF m 4.0% 7,309.0 6,948.4 6,805.2 6,676.8 6,241.9 EBITDA (recurring) CHF m 9.4% 775.0 728.3 592.1 539.4 540.8 Operating profit (EBIT) CHF m 9.7% 601.2 554.0 460.2 401.7 414.8 Operating profit (EBIT, recurring) CHF m 9.7% 601.2 554.0 442.1 401.7 414.8 EBIT (recurring) / sales revenue % 8.2% 8.0% 6.5% 6.0% 6.6% EBIT (recurring) per tonne CHF 5.0% 281.0 272.1 230.9 219.0 231.1 Net profit for the year CHF m 11.3% 368.7 357.4 281.1 219.0 239.9 Net profit for the year (recurring)² CHF m 13.3% 394.7 357.4 263.0 219.0 239.9 Free cash flow CHF m 289.7 311.9 475.6 430.9 1.2 Consolidated Balance Sheet
Total assets CHF m 4.6% 6,508.1 5,832.0 5,466.5 5,640.8 5,429.4 Net working capital CHF m (2.8%) 1,363.2 1,074.4 1,042.5 1,374.2 1,529.7 Non-current assets CHF m 4.9% 2,650.0 2,505.5 2,477.7 2,301.0 2,185.5 Net debt CHF m (6.8%) 1,304.7 1,074.3 1,110.9 1,452.8 1,728.0 Shareholders’ equity CHF m 7.9% 2,399.3 2,269.8 2,111.2 1,956.3 1,772.8 Capital expenditure CHF m 2.9% 279.6 217.9 220.4 201.0 249.2 Ratios
Economic Value Added (EVA) CHF m 206.5 173.3 100.7 52.5 65.6 Return on invested capital (ROIC)³ % 13.2% 12.2% 11.0% 9.5% 9.8% Return on equity (ROE) % 15.4%/16.5%⁴ 15.7% 12.5% 11.2% 13.5% Debt to equity ratio % 54.4% 47.3% 52.6% 74.3% 97.5% Solvency ratio % 36.9% 38.9% 38.6% 34.7% 32.7% Interest coverage ratio 5.2/6.7⁵ 7.2 4.9 4.0 4.1 Net debt / EBITDA 1.5 1.5 1.9 2.7 3.2 Capital expenditure / sales revenue % 3.8% 3.1% 3.2% 3.0% 4.0% Shares
Share price at fiscal year-end CHF 17.5% 2,024 1,728 1,380 1,264 1,061 EBIT (recurring) per share CHF 9.8% 109.7 101.0 80.6 73.2 75.6 Basic earnings per share CHF 11.8% 67.6 64.9 47.8 39.5 43.2 Cash earnings per share CHF 52.9 56.9 86.7 78.6 0.2 Payout per share CHF 15.7% 26.0 24.0 20.0 15.5 14.5 Payout ratio % 39% 37% 39% 39% 33% Price-earnings ratio at year-end 30.0 26.6 28.9 32.0 24.6 Market capitalization at year-end CHF m 17.5% 11,109.4 9,484.7 7,574.6 6,937.9 5,823.7 Number of shares issued 5,488,858 5,488,858 5,488,858 5,488,858 5,488,858 Total payout to shareholders CHF m 11.5% 131.5 109.8 85.1 79.6 85.1 Other
Employees 6.8% 12,257 11,570 10,528 9,898 9,430 Beans processed Tonnes 2.0% 1,002,025 956,440 925,544 898,135 925,856 Chocolate & compound production Tonnes 5.9% 1,620,112 1,539,476 1,437,082 1,383,186 1,287,461
1 Financial performance measures, not defined by IFRS, are defined on page 181. 2 Net profit excluding one-off costs for early bond repayment of CHF 33 million, partly offset by the tax effect of CHF 7 million. 3 From 2017/18 onwards calculated based on Pro-forma (IFRS 15). Refer to Consolidated Financial Statements, Introduction of new standards in 2018/19,
IFRS 15 – Revenue from Contracts with Customers – Consolidated Balance Sheet impact. 4 On the basis of net profit / net profit (recurring) for the fiscal year 2018/19. 5 Adjusted interest coverage ratio of 6.7 for the year 2018/19 excludes one-off effect of early bond repayment of CHF 33 million.

Letter to Shareholders Overview Business Highlights Sustainability Our People Financial Reports Governance
Risk Overview
Barry Callebaut | Annual Report /
Enterprise Risk Management The Group operates in the food industry and is exposed to a variety of risks and uncertainties. The Group’s Enterprise Risk Management framework is designed to identify, assess and mitigate key risks by taking appropriate measures to ensure the achievement of the Group’s objectives.
Overall responsibility for establishing, reviewing and adapting the company-wide governance, risk management, compliance and control processes lies with the Board of Directors (Board). The Board has delegated responsibility to the Audit, Finance, Risk, Quality and Compliance Committee (AFRQCC) for evaluating the Group’s risk and control environment.
Implementation and execution of the risk management processes is delegated to the Executive Committee (ExCo) and its regional and functional management.
Group Risk Management facilitates the enterprise risk assessment process, to identify and understand the Group’s key risks, to allocate ownership to drive specific actions and take the relevant measures to address them. Group Risk
Management presents the key risks to the ExCo and the AFRQCC on an annual basis. Regional and functional management ensures that risks are managed appropriately, that the existing measures and controls are operating effectively and that the additional mitigation actions are implemented as deemed appropriate. Ongoing monitoring of the Group’s key risks and its respective risk management activities are embedded in management information channels and in dedicated committees. The AFRQCC meets as often as business requires, but at least three times per fiscal year, in order to deal with any significant issues reported by Management, Assurance functions (Group Risk Management, Compliance, Internal Audit, etc.) and/or External Regulators.
While it is acknowledged that the Group faces many risks, the Board has identified the key risks that could potentially impact the achievement of the Group’s objectives. These are outlined in the table below.
Key Risks Risk Description Mitigation/Measures
Long-term sustainable supply of cocoa
The Group is dependent on the sustainable supply of quality cocoa beans so that the Group is able to produce high-quality cocoa and chocolate products. Risk factors such as declining productivity attributable to aging trees, aging farmers and little interest from the next generation in becoming farmers, the conversion of cocoa bean fields to other, more attractive crops, and also the long-term impacts of climate change could lead to a shortfall in high-quality cocoa beans in the mid- to long-term.
Under the umbrella of its overall sustainability strategy Forever Chocolate, the Group aims to improve the productivity and livelihood of farmers. Long-term measures also include the continuous evaluation and diversification of supply sources in origin countries, developing improved agricultural practices for cocoa farms and maintaining an industry dialogue with key stakeholders in origin countries. The Group’s sustainability strategy and framework is described in more detail in the Sustainability section of the Annual Report and the annual Forever Chocolate Progress Report.
Rapidly shifting consumer trends
Rapidly shifting consumer trends may disrupt market and industry dynamics that could impact the future growth of the Group’s business.
Trend analysis by the Group’s marketing and customer insight teams, together with cross- functional commercial teams working closely with customers, aim to identify trends early in the marketplace, both positive and negative. The Group constantly invests in R&D as part of a well-structured process, enabling the Group to develop products which proactively address new trends and changing demand patterns.
Letter to Shareholders Overview Business Highlights Sustainability Our People Financial Reports Governance
Risk Overview
Barry Callebaut | Annual Report /
Key Risks Risk Description Mitigation/Measures
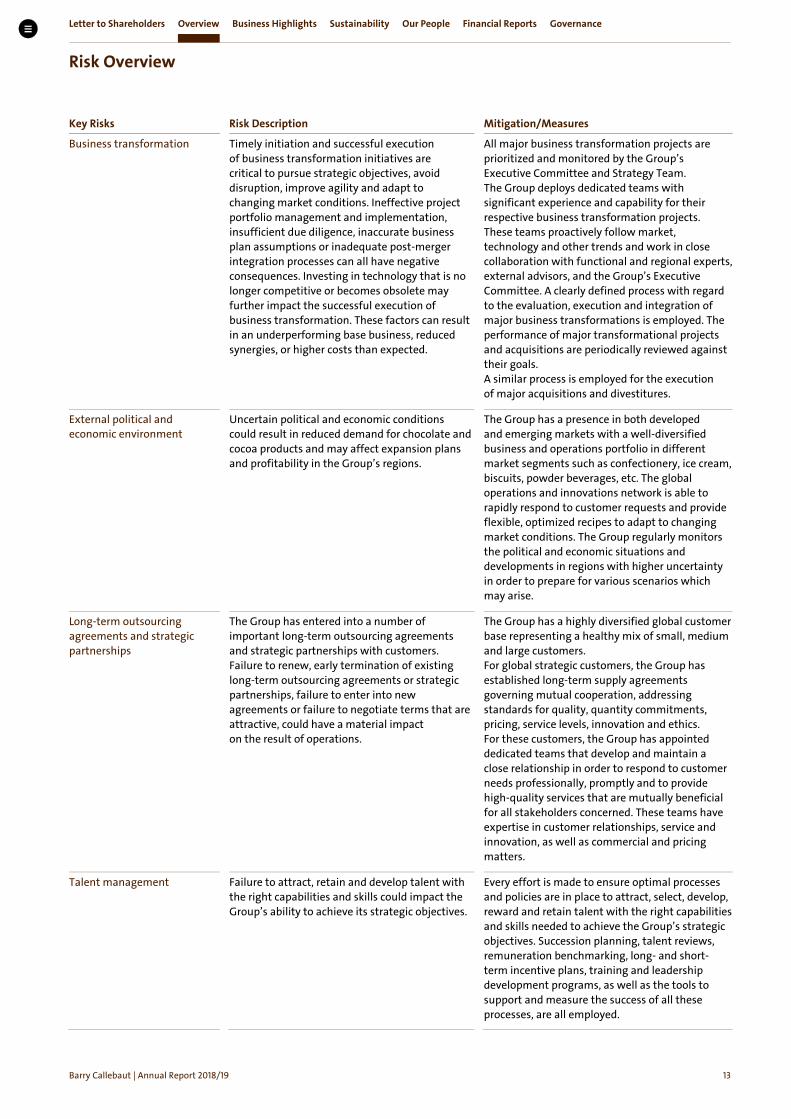
Business transformation
Timely initiation and successful execution of business transformation initiatives are critical to pursue strategic objectives, avoid disruption, improve agility and adapt to changing market conditions. Ineffective project portfolio management and implementation, insufficient due diligence, inaccurate business plan assumptions or inadequate post-merger integration processes can all have negative consequences. Investing in technology that is no longer competitive or becomes obsolete may further impact the successful execution of business transformation. These factors can result in an underperforming base business, reduced synergies, or higher costs than expected.
All major business transformation projects are prioritized and monitored by the Group’s Executive Committee and Strategy Team. The Group deploys dedicated teams with significant experience and capability for their respective business transformation projects. These teams proactively follow market, technology and other trends and work in close collaboration with functional and regional experts, external advisors, and the Group’s Executive Committee. A clearly defined process with regard to the evaluation, execution and integration of major business transformations is employed. The performance of major transformational projects and acquisitions are periodically reviewed against their goals. A similar process is employed for the execution of major acquisitions and divestitures.
External political and economic environment
Uncertain political and economic conditions could result in reduced demand for chocolate and cocoa products and may affect expansion plans and profitability in the Group’s regions.
The Group has a presence in both developed and emerging markets with a well-diversified business and operations portfolio in different market segments such as confectionery, ice cream, biscuits, powder beverages, etc. The global operations and innovations network is able to rapidly respond to customer requests and provide flexible, optimized recipes to adapt to changing market conditions. The Group regularly monitors the political and economic situations and developments in regions with higher uncertainty in order to prepare for various scenarios which may arise.
Long-term outsourcing agreements and strategic partnerships
The Group has entered into a number of important long-term outsourcing agreements and strategic partnerships with customers. Failure to renew, early termination of existing long-term outsourcing agreements or strategic partnerships, failure to enter into new agreements or failure to negotiate terms that are attractive, could have a material impact on the result of operations.
The Group has a highly diversified global customer base representing a healthy mix of small, medium and large customers. For global strategic customers, the Group has established long-term supply agreements governing mutual cooperation, addressing standards for quality, quantity commitments, pricing, service levels, innovation and ethics. For these customers, the Group has appointed dedicated teams that develop and maintain a close relationship in order to respond to customer needs professionally, promptly and to provide high-quality services that are mutually beneficial for all stakeholders concerned. These teams have expertise in customer relationships, service and innovation, as well as commercial and pricing matters.
Talent management
Failure to attract, retain and develop talent with the right capabilities and skills could impact the Group’s ability to achieve its strategic objectives.
Every effort is made to ensure optimal processes and policies are in place to attract, select, develop, reward and retain talent with the right capabilities and skills needed to achieve the Group’s strategic objectives. Succession planning, talent reviews, remuneration benchmarking, long- and short-term incentive plans, training and leadership development programs, as well as the tools to support and measure the success of all these processes, are all employed.
Letter to Shareholders Overview Business Highlights Sustainability Our People Financial Reports Governance
Risk Overview
Barry Callebaut | Annual Report /
Key Risks Risk Description Mitigation/Measures
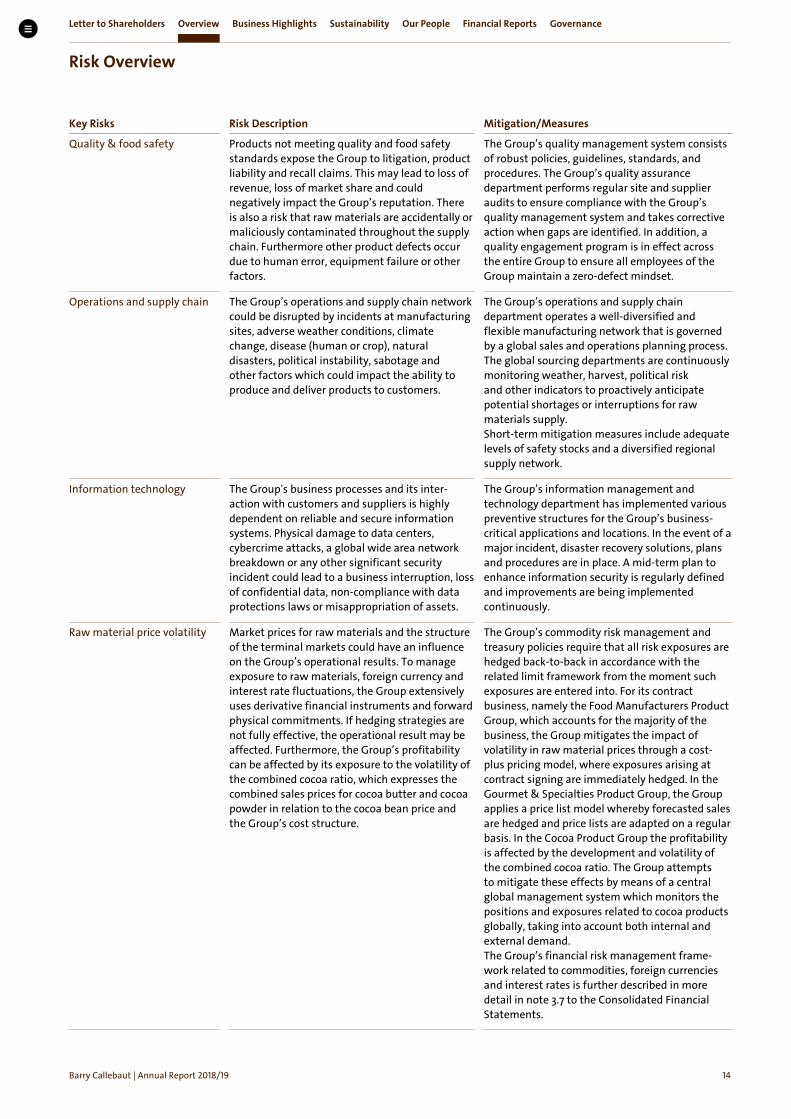
Quality & food safety Products not meeting quality and food safety standards expose the Group to litigation, product liability and recall claims. This may lead to loss of revenue, loss of market share and could negatively impact the Group’s reputation. There is also a risk that raw materials are accidentally or maliciously contaminated throughout the supply chain. Furthermore other product defects occur due to human error, equipment failure or other factors.
The Group’s quality management system consists of robust policies, guidelines, standards, and procedures. The Group’s quality assurance department performs regular site and supplier audits to ensure compliance with the Group’s quality management system and takes corrective action when gaps are identified. In addition, a quality engagement program is in effect across the entire Group to ensure all employees of the Group maintain a zero-defect mindset.
Operations and supply chain The Group’s operations and supply chain network could be disrupted by incidents at manufacturing sites, adverse weather conditions, climate change, disease (human or crop), natural disasters, political instability, sabotage and other factors which could impact the ability to produce and deliver products to customers.
The Group’s operations and supply chain department operates a well-diversified and flexible manufacturing network that is governed by a global sales and operations planning process. The global sourcing departments are continuously monitoring weather, harvest, political risk and other indicators to proactively anticipate potential shortages or interruptions for raw materials supply. Short-term mitigation measures include adequate levels of safety stocks and a diversified regional supply network.
Information technology The Group’s business processes and its inter-action with customers and suppliers is highly dependent on reliable and secure information systems. Physical damage to data centers, cybercrime attacks, a global wide area network breakdown or any other significant security incident could lead to a business interruption, loss of confidential data, non-compliance with data protections laws or misappropriation of assets.
The Group’s information management and technology department has implemented various preventive structures for the Group’s business-critical applications and locations. In the event of a major incident, disaster recovery solutions, plans and procedures are in place. A mid-term plan to enhance information security is regularly defined and improvements are being implemented continuously.
Raw material price volatility Market prices for raw materials and the structure of the terminal markets could have an influence on the Group’s operational results. To manage exposure to raw materials, foreign currency and interest rate fluctuations, the Group extensively uses derivative financial instruments and forward physical commitments. If hedging strategies are not fully effective, the operational result may be affected. Furthermore, the Group’s profitability can be affected by its exposure to the volatility of the combined cocoa ratio, which expresses the combined sales prices for cocoa butter and cocoa powder in relation to the cocoa bean price and the Group’s cost structure.
The Group’s commodity risk management and treasury policies require that all risk exposures are hedged back-to-back in accordance with the related limit framework from the moment such exposures are entered into. For its contract business, namely the Food Manufacturers Product Group, which accounts for the majority of the business, the Group mitigates the impact of volatility in raw material prices through a cost-plus pricing model, where exposures arising at contract signing are immediately hedged. In the Gourmet & Specialties Product Group, the Group applies a price list model whereby forecasted sales are hedged and price lists are adapted on a regular basis. In the Cocoa Product Group the profitability is affected by the development and volatility of the combined cocoa ratio. The Group attempts to mitigate these effects by means of a central global management system which monitors the positions and exposures related to cocoa products globally, taking into account both internal and external demand. The Group’s financial risk management frame-work related to commodities, foreign currencies and interest rates is further described in more detail in note 3.7 to the Consolidated Financial Statements.

Letter to Shareholders Overview Business Highlights Sustainability Our People Financial Reports Governance
Risk Overview
Barry Callebaut | Annual Report /
Key Risks Risk Description Mitigation/Measures
Treasury
The Group’s operations are exposed to liquidity risks, foreign currency and interest rate risks. Volatility in raw material prices affects the Group’s working capital requirements and could result in liquidity issues. Failure to deliver on key parameters including cash flow could result in a downgrade of the Group’s credit rating and restrict its access to financial markets.
The Group has established a robust financial risk management framework and governance structure. The Group’s liquidity is ensured by means of regular Group-wide monitoring and planning of liquidity coordinated by the Group’s centralized treasury department. Financing needs are covered through a combination of adequate credit lines with financial institutions and short- and long-term debt capital market products. The Group’s financial risk management framework related to financing and liquidity is further described in more detail in note 3.7 to the Consolidated Financial Statements.
Legal, regulatory and compliance
The Group is subject to both international and national laws, regulations and standards in such diverse areas as product safety, product labeling, environment, health and safety, intellectual property rights, antitrust, anti-bribery, employment, trade sanctions, data privacy, corporate transactions and taxes in all the countries in which it operates, as well as stock exchange listing and disclosure regulations in a constantly changing regulatory environment. Failure to comply with applicable laws and regulations could expose the Group to investigations, litigation, administrative and/or criminal proceedings potentially leading to significant costs, fines and/or criminal sanctions against the Group and/or its employees with possible reputational damage.
Dedicated regional and local functional managers, supported by specialized corporate functions and external advisors, ensure compliance with applicable laws and regulations. The Group has robust policies and procedures in place in the relevant areas. The Group’s legal department oversees the Group’s compliance program, which ensures awareness of the compliance risks and the Group’s compliance standards. The Code of Conduct and other Group policies set out the legal and ethical standards of behavior expected from all employees working within the Group.

Letter to Shareholders Overview Business Highlights Sustainability Our People Financial Reports Governance
Business Highlights
Barry Callebaut | Annual Report /
Financial Review
Business Review Region EMEA Region Americas Region Asia Pacific Global Cocoa

Letter to Shareholders Overview Business Highlights Sustainability Our People Financial Reports Governance
Financial Review
Barry Callebaut | Annual Report /
Business Performance Review Fiscal Year / Profitable growth and good cash generation The overall market conditions in 2018/19 were favorable with a growing global chocolate confectionery market (according to Nielsen1 +1.8%).
The Group’s volume for the fiscal year increased by +5.1% to 2,139,758 tonnes, with, as expected, a stronger contribution in the second half of the fiscal year. The good performance was broadly based across all Regions and Product Groups and supported by the key growth drivers Emerging Markets, Gourmet & Specialties and Outsourcing.
Operating profit (EBIT) increased by +11.9% in local currencies (+8.5% in CHF) to CHF 601.2 million, affected by a strong headwind from currencies of CHF –19 million. EBIT growth in local currencies was more than double the volume growth, supported by all Regions and Product Groups.
Net profit for the year2 – excluding the one-off effect of the early bond repayment of CHF 33 million net of tax impact of CHF –7 million – grew by +14.2% in local currencies (+10.4% in CHF) to CHF 394.7 million. Reported net profit amounted to CHF 368.7 million, up +6.9% in local currencies (+3.2% in CHF).
Free cash flow amounted to CHF 289.7 million compared to CHF 311.9 million in the previous fiscal year and was impacted by the one-off effect of CHF 33 million for the early bond repayment. Adjusted for this effect and for the cocoa beans considered as readily marketable inventories (RMI), the adjusted Free cash flow amounted to CHF 256.8 million compared to CHF 316.6 million in the prior year. Additionally the Group increased its capital expenditure compared to prior year by around CHF 60 million to cater for future growth.
Corporate strategy and mid-term guidance Through consistent execution of its long-term strategy based on the four pillars: Expansion, Innovation, Cost Leadership and Sustainability, Barry Callebaut successfully concluded its 4-year mid-term guidance3.
The Group delivered on average +4.5% volume growth and +13.9% EBIT growth in local currencies, for the 4-year period 2015/16 to 2018/19.
1 Source: Nielsen, August 2018 to August 2019 – 25 countries, excluding e-commerce channels.
2 Net profit excluding one-off costs for early bond repayment of CHF 33 million, partly offset by the tax effect of CHF 7 million.
3 On average for the 4-year period 2015/16 to 2018/19: 4-6% volume growth and EBIT above volume growth in local currencies, barring any major unforeseen events.
A ‘smart’ balance between consistent above-market volume growth and enhanced profitability remains a key focus. In January 2019, Barry Callebaut renewed its mid-term guidance for the 3-year period 2019/20 to 2021/22: • Average volume growth 4–6%; • Average EBIT growth above volume growth in local
currencies, barring any major unforeseen events.
Slight increase in cocoa bean prices, ongoing volatility in other raw material prices During fiscal year 2018/19 cocoa bean prices fluctuated between British pound 1,500 and British pound 1,900 per tonne and closed at British pound 1,709 per tonne on August 30, 2019. On average, cocoa bean prices increased by +4.5% versus prior year. Global bean supply and demand were balanced. The world cocoa production further expanded and the good demand for cocoa beans also continued. Côte d’Ivoire and Ghana announced in July 2019 a living income differential (LID) of USD 400 per tonne of cocoa beans, effective as of the 2020/21 crop.
The average combined ratio remained at a healthy level. The slight deterioration compared to the prior year was due to higher cocoa bean prices while there was an ongoing good demand for cocoa products.
Sugar prices in Europe increased during the year (+41.0%) due to a disappointing 2018 crop. In contrast, the world market price for sugar declined by –3.7% due to a production surplus.
Dairy prices increased during the fiscal year 2018/19 by +28.9% due to deteriorated production conditions and increased demand.
Raw material prices September 2009 to September 2019
Source: Data compiled by Barry Callebaut, based on key market price indicators.
0%
50%
100%
150%
200%
250%
2009 2010 2011 2012 2013 2014 2015 2016 2017 2018 2019
Cocoa beansMilk powderSugar worldSugar EU

Letter to Shareholders Overview Business Highlights Sustainability Our People Financial Reports Governance
Financial Review
Barry Callebaut | Annual Report /
Foreign currencies In fiscal year 2018/19, volatility in foreign exchange markets remained, mainly in emerging market currencies. The Group is naturally hedged to the extent that it produces and sells products locally and hedges any remaining currency exposure that arises from commercial transactions. The impact arising from the translation of results into the Group’s reporting currency (Swiss franc) however is not hedged.
For the fiscal year under review, the average exchange rate for the euro, which accounts for around half of the Group’s sales revenue, depreciated by –3.2% against the Swiss franc. On the other hand, the US dollar appreciated slightly by +1.9% against the Swiss franc. The development in some major emerging market currencies remained very volatile during fiscal year 2018/19, with the Brazilian real –9.9% and the Russian ruble –7.2% further depreciating against the Swiss franc.
The currency translation effects mentioned above created a strong headwind and had a negative impact of –2.6% on sales revenue and –3.4% on operating profit (EBIT).
Sales revenue in functional currencies
Solid growth in global chocolate demand The global chocolate confectionery market continued its solid growth and according to Nielsen14grew by +1.8% during the period under review.
1 Source: Nielsen, August 2018 to August 2019 – 25 countries, excluding
e-commerce channels. 2 For details on transition refer to Consolidated Financial Statements,
Introduction of new standards in 2018/19, IFRS 15 – Revenue from Contracts with Customers – Consolidated Income Statement impact.
Consolidated Income Statement Profitable growth Sales volume for the fiscal year 2018/19 increased by +5.1% to 2,139,758 tonnes with, as expected, a stronger contribution in the second half of the year.
Sales volume in the chocolate business grew by +5.9%, well above growth of the global chocolate confectionary market1. All Regions and the key growth drivers Outsourcing (+5.2%), Emerging Markets (+9.7%) and Gourmet & Specialties (excluding Beverages +6.1%) contributed to the good momentum. Global Cocoa volumes increased by +2.4%.
Sales revenue increased by +7.8% in local currencies (+5.2% in CHF) to CHF 7,309.0 million. The increase in sales revenue was supported by the first-time adoption of IFRS 152 and higher raw material price, which the Group passes on to its customers for a large part of its business. Excluding the IFRS 15 effect sales revenue grew by +5.6% in local currencies (+3.0% in CHF).
Gross profit developed in line with the growth in sales volume and amounted to CHF 1,188.4 million, up +5.1% in local currencies (+2.7% in CHF). The improvement from volume growth and product mix was offset by costs for structural improvements of the operations.
Marketing and sales expenses increased by +1.2% to CHF 151.8 million. The increase at a lower rate than the Group’s volume growth was the result of cost discipline and favourable currency effects. The Group continued to promote its innovations and margin-accretive business, which includes investments in the Emerging Markets distribution network and the global footprint of its CHOCOLATE ACADEMYTM Centers.
General and administration expenses remained stable at CHF 439.9 million (+0.3%). The increase related to the Group’s growth and the effect of acquisitions could be fully compensated thanks to the Group’s continued focus on costs and supported by favorable effects from the modification of Swiss pension plans and currency translation.
Other income amounted to CHF 29.5 million compared to CHF 19.6 million in the prior year. This position contains non-sales-related income such as income from the Group’s training center, the sale of waste products, grants obtained from governments as well as claims related to insurances and suppliers. The latter three items were largely accountable for the favourable movement year on year.
EURUSDBRLRUBCHFJPYOther
47.2%32.7%
6.1%2.4%1.3%1.2%9.1%
Letter to Shareholders Overview Business Highlights Sustainability Our People Financial Reports Governance
Financial Review
Barry Callebaut | Annual Report /
Other expenses amounted to CHF 25.1 million compared to CHF 31.7 million in prior year. This position comprises costs related to litigation and claims, losses on disposal and impairment of assets, impairment charges and some other non-recurring items. The decrease compared to prior year is mainly due to lower losses on disposals and impairments of assets partly offset by higher costs for litigation and claims.
Further improvement in EBIT and EBIT/tonne Operating profit (EBIT) increased by +11.9% in local currencies (8.5% in CHF) to CHF 601.2 million, affected by a strong headwind from currencies (CHF –19 million). EBIT growth in local currencies thus was more than double the volume growth, supported by all Regions and Product Groups.
As a result, the Group’s EBIT per tonne continued to improve to CHF 281, which represents an increase of +6.5% in local currencies (+3.3% in CHF) compared to prior year.
Finance income increased to CHF 10.9 million from CHF 6.5 million in prior year.
Finance expense amounted to CHF 159.3 million, compared to CHF 107.7 million in the previous year. The increase is mainly due to the effect of the early bond repayment of the EUR 250 million 5.375% Senior Note in August 2019 amounting to CHF 33 million1. In addition, the higher average net debt related to the first-time adoption of IFRS 152 contributed to the increase of finance expense.
Income tax expenses decreased to CHF 84.0 million from CHF 95.5 million in the prior year. The prior year was impacted by tax reforms in Belgium and the US leading to a one-time non-cash expense of CHF 12.9 million. The Group’s effective tax rate amounted to 18.6% (prior year 21.1%, respectively 18.2% excluding the aforementioned one-time tax effect).
Net profit for the year – excluding the one-off effect for the early bond repayment – grew by +14.2%1 in local currencies (+10.4%1 in CHF) to CHF 394.7 million. Reported net profit for the year amounted to CHF 368.7 million, corresponding to +6.9% in local currencies and +3.2% in CHF.
1 Net profit excluding one-off costs for early bond repayment of
CHF 33 million, partly offset by the tax effect of CHF 7 million. 2 For details on transition refer to Consolidated Financial Statements,
Introduction of new standards in 2018/19, IFRS 15 – Revenue from Contracts with Customers – Consolidated Balance Sheet impact.
Consolidated balance sheet – further improved ratios due to increased profitability Total assets increased by +11.6% to CHF 6,508.1 million at the end of August 2019, compared to CHF 5,832.0 million the year before. Inventories increased mainly due to the first-time adoption of IFRS 152. The increase in derivative financial instruments, cash and property, plant and equipment and intangible assets could only be partly offset by lower receivables.
Net working capital as of August 31, 2019 decreased to CHF 1,363.2 million from CHF 1,403.4 million in prior year (pro forma adjusted for IFRS 152). The impact of the Group’s volume growth on working capital was more than compensated for by the continued focus on working capital management and cash flow generation.
Net debt decreased to CHF 1,304.7 million at August 31, 2019, from CHF 1,409.3 million in prior year (pro forma adjusted for IFRS 152). The weighted average maturity of the long-term debt increased from 4.9 to 5.9 years.
Equity – including equity attributable to the share-holders of the parent company and non-controlling interests – increased to CHF 2,413.6 million compared to the CHF 2,285.5 million at the end of August 2018. Equity attributable to the shareholders of the parent company amounted to CHF 2,399.3 million compared to last year’s CHF 2,269.8 million. The increase mainly results from the net profit generated, partly offset by the payout to shareholders, the negative net effect of the remeasurement of defined benefit plans and negative cumulative currency translation adjustments.
The debt-to-equity ratio improved from 62.2% to 54.4%, the solvency ratio slightly improved from 36.8% to 36.9% (prior year numbers adjusted for the effect of IFRS 152 for comparability reasons), and the return on invested capital (ROIC) increased from 12.2% to 13.2%.

Letter to Shareholders Overview Business Highlights Sustainability Our People Financial Reports Governance
Financial Review
Barry Callebaut | Annual Report /
4.0%3.0% 3.2% 3.1%
3.8%
Liquidity – debt maturity profile in CHF million
--- Cash and Revolving Credit Facility (undrawn) Short/long term facilities Senior Note Schuldscheindarlehen
1 Revolving Credit Facility extended to 2024 in October 2019.
Consolidated Cash Flow Statement Cash generated from operating activities amounted to CHF 789.8 million compared to CHF 671.2 million in the prior year. Changes related to working capital amounted to CHF 33.0 million compared to CHF –54.6 million in the prior year. Cash outflow for interest increased to CHF –139.7 million compared to CHF –93.1 million in prior year, mainly due to the effect of the early bond repayment in the amount of CHF –33 million. Cash outflow for tax was CHF –94.3 million compared to CHF –62.6 million in prior year.
Overall, this resulted in a net cash from operating activities of CHF 555.7 million compared to CHF 515.5 million the year before.
Net cash flow from investing activities amounted to CHF –300.0 million (prior year: CHF –330.3 million). The amount was largely related to the Group’s investments of CHF 279.6 million in property, plant and equipment as well as in intangibles (prior year CHF –217.9 million). This increase is related to higher capital expenditures in factories and information management to cater for further growth. In addition to that, there was a cash outflow related to acquisitions in the amount of CHF –34.0 million (prior year CHF –126.7 million).
Net cash flow from financing activities amounted to CHF –192.7 million, compared to CHF –174.0 million in prior year. Net cash outflow in the current year was impacted by the repayment of debt amounting to CHF –814.5 million, of which CHF –281.4 related to the
early redemption of the EUR 250 million Senior Note. On the other hand the Group issued new debt in the amount of CHF 776.1 million – of which CHF 675.6 million related to the issuance of a Schuldscheindarlehen (prior year debt repayment of CHF –73.7 million and debt issue CHF +32.6 million). The position also contains the cash-out in the amount of CHF –131.5 million for dividends (prior year CHF –69.9 million for dividends and the nominal capital reduction CHF –39.9 million) as well as the cash outflow of CHF –22.8 million for the purchase of treasury shares (prior year CHF –22.8 million).
Free cash flow amounted to CHF 289.7 million, compared to CHF 311.9 million in the previous fiscal year. Excluding the one-off impact of CHF –33 million for the early bond repayment, Free cash flow amounted to CHF 322.7 million. Adjusted for the cocoa beans considered as readily marketable inventories (RMI), the adjusted Free cash flow amounted to CHF 256.8 million compared to CHF 316.6 million in prior. Additionally the Group increased its capital expenditure compared to prior year by CHF 61.7 million to cater for future growth.
Capital expenditure Capital expenditure reflected in the cash flow statement amounted to CHF –279.6 million (fiscal year 2017/18 CHF –217.9 million). The increased amount is to cater for future growth, while the Group maintained its focus on investments that best support its strategy of ‘smart growth’ by selectively approving capital expenditure with a high return on investment.
Capital expenditure
CAPEX as % of sales revenue Average = 3.5%
in CHF million
(558)
0
485388
137 208 275
24
11130
10
817
193
1
2
Cash 2019 2020 2021 2022 2023 2024 2025 2026 2027 2028 20291
249
201220 218
280
2014/15 2015/16 2016/17 2017/18 2018/19
Additional growthITUpgrade/efficiency gains existing sitesReplacement CAPEX

Letter to Shareholders Overview Business Highlights Sustainability Our People Financial Reports Governance
Financial Review
Barry Callebaut | Annual Report /
Outlook The Barry Callebaut Group remains committed to pursuing its successful ‘smart growth’ strategy. As announced in January 2019, the Group renewed its mid-term guidance for the 3-year period 2019/20–2021/22: on average 4–6% volume growth and EBIT growth above volume growth in local currencies, barring any major unforeseen events. The good growth momentum, a strong innovation portfolio, and discipline in execution makes Barry Callebaut confident of delivering on its renewed mid-term guidance1. Barry Callebaut share performance Barry Callebaut shares closed at CHF 2,024 on August 31, 2019, +17.1% above the previous year’s closing price, and outperforming the market. EURO STOXX Food & Beverage Index increased +13.1% and SPI by +8.9%, in the same period, while Swiss Small and Mid Caps (SMIM) decreased –5.5%. Barry Callebaut also outperformed SXI Switzerland Sustainability 25® index basket (+6.9%), which brings together the 25 most sustainable companies listed in Switzerland. Barry Callebaut has been a member of this index since 2016. The index is based on an annual assessment by Sustainalytics of all companies composing the SMI Expanded® index. In 2019 Barry Callebaut was considered by Sustainalytics the leader on sustainability among 178 assessed Food & Beverage companies2. Key share data as of August 31, 2019
Shares outstanding 5.5 million Closing share price CHF 2,024 Market capitalization CHF 11.1 billion 52-week high CHF 2,024 52-week low CHF 1,521 Average daily volume 9,710 shares
1 On average for the 3-year period 2019/20 – 2021/22: 4-6% volume growth
and EBIT above volume growth in local currencies, barring any major unforeseen events.
2 Source: Sustainalytics, Barry Callebaut AG ESG Report 2019.
The chart below illustrates the long-term performance of Barry Callebaut shares compared to the relevant indices (2009–2019): Share price development Barry Callebaut vs. indices
Over a ten-year period (2009–2019), the long-term performance of Barry Callebaut shares (+252.6%) exceeds the returns for the Swiss indices (SMIM +116.5%, SSUSTX +51.3%, SPI +66.3%). Its outperformance of the EURO STOXX Food & Beverage Index (+158.2%) is even stronger when calculating Barry Callebaut’s share price in EUR (+390.8%).
50%
100%
150%
200%
250%
300%
350%
400%
450%
500%
2009 2010 2011 2012 2013 2014 2015 2016 2017 2018 2019
Barry Callebaut AGSwiss Market Index Mid-Cap (SMIM)Swiss Performance Index (SPI)SXI Switzerland Sustainability 25 Index (SSUSTX)Barry Callebaut in EUREURO STOXX Food & Beverage Index

Letter to Shareholders Overview Business Highlights Sustainability Our People Financial Reports Governance
Financial Review
Barry Callebaut | Annual Report /
Dividend The Board of Directors will propose a payout to share-holders of CHF 26.00 per share (+8.3%) at the Annual General Meeting of Shareholders on December 11, 2019. This represents a payout ratio of 39%. The dividend will be paid to shareholders on or around January 8, 2020, subject to approval by the Annual General Meeting of Shareholders. Key share data The share capital of Barry Callebaut AG as of August 31, 2019 amounted to CHF 109,777, consisting of 5,488,858 fully paid-in shares with a nominal value of CHF 0.02 each. There is one single class of shares in which every share has the same voting power and grants the same entitlement to dividends.
The free float, excluding the majority shareholders (Jacobs Holding AG and Renata Jacobs), at the end of August 2019 was 44.9%, with the majority of the institutional shareholders (holding 70.6% of total outstanding shares) based in Switzerland, followed by the US, the UK, Norway and other countries.
Ownership structure as of August 31, 2019
1 Based on notification through the electronic publication platform of the SIX Swiss Exchange.
2 In May 2019, Invesco Ltd. closed the acquisition of all shares in Oppenheimer Funds, which was a subsidiary of Massachussets Mutual Life Insurance Company.
Country split of institutional shareholders
Analyst recommendations At the end of fiscal year 2018/19, of the eleven financial analysts covering Barry Callebaut, six had a Buy recommendation, four had a Hold recommendation and one had a Sell recommendation. At the end of August 2019, the average target price of consensus estimates was CHF 2,080. Credit rating Barry Callebaut has active relationships with Standard & Poor’s and Moody’s. The current ratings are: • Moody’s: Baa3 / stable • Standard & Poor’s: BBB- / stable
50.1%
5.0%3.1%3.0%
38.8%Jacobs Holding AG
Renata Jacobs
BlackRock Inc.¹
Invesco Ltd.¹ ̛ ²
Other
80.1%
8.0%5.6%
2.0%4.3%Switzerland
United States
United Kingdom
Norway
Other

Letter to Shareholders Overview Business Highlights Sustainability Our People Financial Reports Governance
Business Review | Region EMEA
Barry Callebaut | Annual Report /
Strong volume growth and profitability Region EMEA (Europe, Middle East, Africa) delivered strong volume growth well above the market and a good EBIT growth.
Barry Callebaut’s sales volume in Region EMEA increased by +6.1% to 981,231 tonnes, with a strong acceleration in the second half of the year. The first-time consolidation of Inforum as of February 2019 contributed to the volume increase. The Region’s organic growth of +3.9% was again clearly above the chocolate confectionery market growth (+1.1%)1. Food Manufacturers continued its healthy sales volume growth in Western Europe, including the ramp-up for Burton’s Biscuit in the UK. Eastern Europe’s organic volume growth continued to be in the double digits. Gourmet maintained its healthy growth. Gourmet & Specialties’ growth was impacted by negative Beverage volume.
Sales revenue in EMEA increased by +4.7% in local currencies (+0.5% in CHF) to CHF 3,086.8 million.
Operating profit (EBIT) amounted to CHF 359.5 million, an increase of +5.9% in local currencies (+2.1% in CHF), despite the dilutive effect of the consolidation of Inforum.
The integration of Inforum, a leading Russian B2B producer of chocolate, compound coatings and fillings, acquired in January 2019, is well on track. In July 2019, Barry Callebaut announced the construction of the Group’s first chocolate factory in Southeastern Europe. The plant in Novi Sad, expected to be operational by 2021, will serve as a regional hub. Also in July 2019, Barry Callebaut announced the expansion of its logistic activities with the construction of a new Global Distribution Center (GDC) in Lokeren, Belgium.
Source: Nielsen, Chocolate confectionery sales in volume, from Aug. to Aug. , excluding e-commerce channels.
Sales Volume per Region Sales Volume EBIT
factories
EMEA Americas Asia Pacific Global Cocoa
In tonnes in CHF m
Sales Volume
EBIT
46%
050100150200250300350400
0
200,000
400,000
600,000
800,000
1,000,000
2014/15 2015/16 2016/17 2017/18 2018/19
Key figures for Region EMEA
Change % 2018/19 2017/18
in local
currencies in CHF
Sales volume Tonnes 6.1% 981,231 925,144 Sales revenue CHF m 4.7% 0.5% 3,086.8 3,072.5 EBITDA CHF m 5.8% 2.0% 422.6 414.3 Operating profit (EBIT) CHF m 5.9% 2.1% 359.5 352.0
Letter to Shareholders Overview Business Highlights Sustainability Our People Financial Reports Governance
Business Review | Region Americas
Barry Callebaut | Annual Report /
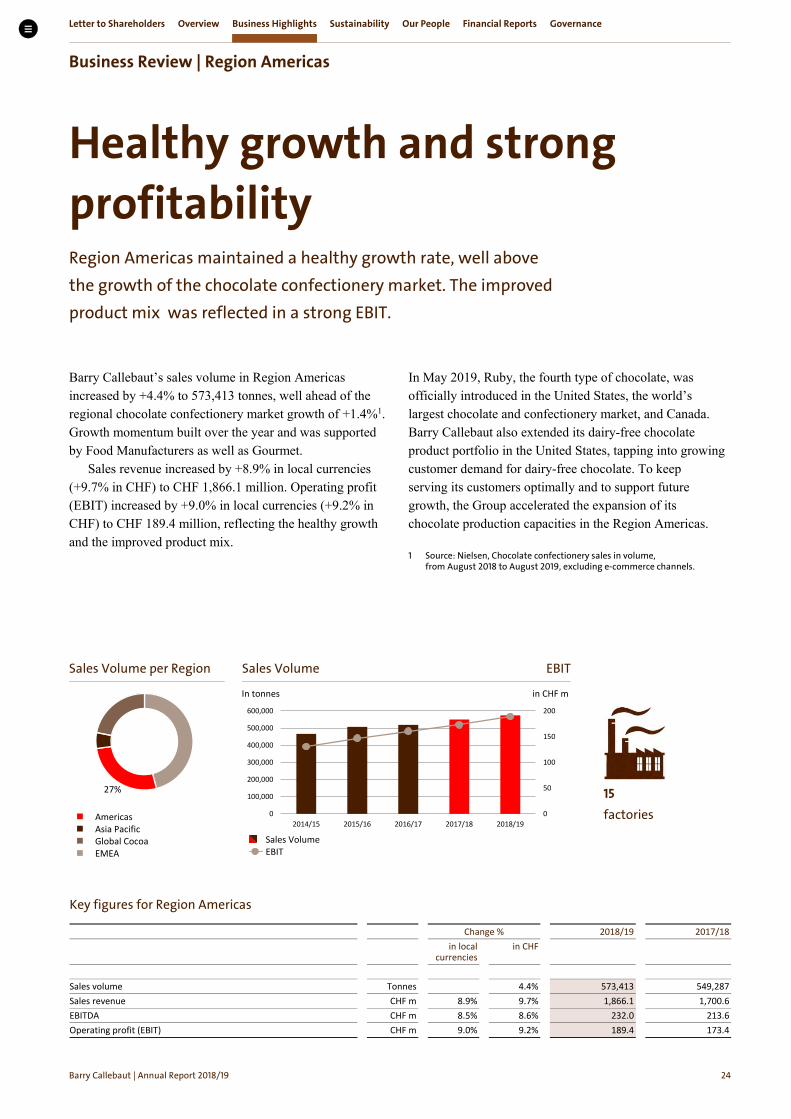
Healthy growth and strong profitability Region Americas maintained a healthy growth rate, well above the growth of the chocolate confectionery market. The improved product mix was reflected in a strong EBIT.
Barry Callebaut’s sales volume in Region Americas increased by +4.4% to 573,413 tonnes, well ahead of the regional chocolate confectionery market growth of +1.4%1. Growth momentum built over the year and was supported by Food Manufacturers as well as Gourmet.
Sales revenue increased by +8.9% in local currencies (+9.7% in CHF) to CHF 1,866.1 million. Operating profit (EBIT) increased by +9.0% in local currencies (+9.2% in CHF) to CHF 189.4 million, reflecting the healthy growth and the improved product mix.
In May 2019, Ruby, the fourth type of chocolate, was officially introduced in the United States, the world’s largest chocolate and confectionery market, and Canada. Barry Callebaut also extended its dairy-free chocolate product portfolio in the United States, tapping into growing customer demand for dairy-free chocolate. To keep serving its customers optimally and to support future growth, the Group accelerated the expansion of its chocolate production capacities in the Region Americas.
Source: Nielsen, Chocolate confectionery sales in volume, from August to August , excluding e-commerce channels.
Sales Volume per Region Sales Volume EBIT
factories
Americas Asia Pacific Global Cocoa EMEA
In tonnes in CHF m
Sales Volume
EBIT
27%
0
50
100
150
200
0
100,000
200,000
300,000
400,000
500,000
600,000
2014/15 2015/16 2016/17 2017/18 2018/19
Key figures for Region Americas
Change % 2018/19 2017/18
in local
currencies in CHF
Sales volume Tonnes 4.4% 573,413 549,287 Sales revenue CHF m 8.9% 9.7% 1,866.1 1,700.6 EBITDA CHF m 8.5% 8.6% 232.0 213.6 Operating profit (EBIT) CHF m 9.0% 9.2% 189.4 173.4

Letter to Shareholders Overview Business Highlights Sustainability Our People Financial Reports Governance
Business Review | Region Asia Pacific
Barry Callebaut | Annual Report /
Strong growth momentum Region Asia Pacific accelerated in the second half of the fiscal year, achieving double-digit volume growth and a strong profitability.
Barry Callebaut’s sales volume growth continued its strong momentum in Region Asia Pacific with an increase of +12.1% to 118,548 tonnes, again significantly ahead of the regional chocolate confectionery market (+7.7%)1. Growth was fueled by Food Manufacturers, mostly regional accounts, including the ramp-up for Garudafood. Sales revenue increased by +9.9% in local currencies (+10.2% in CHF) to CHF 407.6 million. Operating profit (EBIT) grew slightly ahead of volumes at +13.8% in local currencies (+14.8% in CHF) to CHF 53.5 million. To further fuel growth, the Group deepened its distribution footprint for Gourmet & Specialties in key countries like China.
In July 2019, the groundbreaking of Barry Callebaut’s new chocolate and compound manufacturing facility in Baramati, India, one of the fastest growing chocolate markets in Asia, was announced. Barry Callebaut also strengthened its partnership with Garudafood, one of the largest food and beverage companies in Indonesia, by opening its second chocolate manufacturing plant in Rancaekek, Indonesia, in August 2019. These transactions, together with ongoing investments in sales and operations, set the base for continued growth.
Source: Nielsen, Chocolate confectionery sales in volume, from August to August , excluding e-commerce channels.
Sales Volume per Region Sales Volume EBIT
factories
Asia Pacific Global Cocoa EMEA Americas
In tonnes in CHF m
Sales Volume
EBIT
5%
0
10
20
30
40
50
60
0
20,000
40,000
60,000
80,000
100,000
120,000
2014/15 2015/16 2016/17 2017/18 2018/19
Key figures for Region Asia Pacific
Change % 2018/19 2017/18
in local
currencies in CHF
Sales volume Tonnes 12.1% 118,548 105,777 Sales revenue CHF m 9.9% 10.2% 407.6 370.0 EBITDA CHF m 10.2% 11.1% 63.3 57.0 Operating profit (EBIT) CHF m 13.8% 14.8% 53.5 46.6

Letter to Shareholders Overview Business Highlights Sustainability Our People Financial Reports Governance
Business Review | Global Cocoa
Barry Callebaut | Annual Report /
Further improved profitability Healthy volume growth and further improved profitability, benefiting from disciplined execution.
Sales volume in Global Cocoa showed a healthy growth level of +2.4% for the fiscal year under review and amounted to 466,566 tonnes. Sales revenue increased by +11.4% in local currencies (+7.9% in CHF) to CHF 1,948.6 million, supported by, on average, increased cocoa bean prices.
Operating profit (EBIT) improved from CHF 84.8 million in the prior year period to CHF 100.8 million, supported by disciplined execution.
The Group saw strong demand for its Bensdorp branded cocoa powders. Barry Callebaut continued to focus on developing premium cocoa powders and the recent launch of Bensdorp Natural Dark strengthened its position in this segment.
In March 2019, Barry Callebaut inaugurated a new cocoa processing unit in Abidjan, Côte d’Ivoire, which will expand the Group’s capacity in the country by +40% by 2022.
Sales Volume per Region Sales Volume EBIT
factories
Global Cocoa EMEA Americas Asia Pacific
In tonnes in CHF m
Sales Volume
EBIT
22%
0
20
40
60
80
100
120
0
100,000
200,000
300,000
400,000
500,000
2014/15 2015/16 2016/17 2017/18 2018/19
Key figures for Global Cocoa
Change % 2018/19 2017/18
in local
currencies in CHF
Sales volume Tonnes 2.4% 466,566 455,649 Sales revenue CHF m 11.4% 7.9% 1,948.6 1,805.2 EBITDA CHF m 13.9% 9.9% 156.8 142.7 Operating profit (EBIT) CHF m 25.0% 18.9% 100.8 84.8
Letter to Shareholders Overview Business Highlights Sustainability Our People Financial Reports Governance
Sustainability
Barry Callebaut | Annual Report /
Our Approach
Prospering Farmers
Zero Child Labor
Thriving Nature
Sustainable Chocolate
Letter to Shareholders Overview Business Highlights Sustainability Our People Financial Reports Governance
Our Approach
Barry Callebaut | Annual Report /
Forever Chocolate progress Creating impact through the power of data, technology and scale
Sustainability is at the heart of our business. This is why in 2016 we launched Forever Chocolate, our plan to make sustainable chocolate the norm by 2025. By committing to have more than 500,000 cocoa farmers in our supply chain lifted out of poverty1, eradicating child labor from our supply chain2, becoming carbon and forest positive and by having 100% sustainable ingredients in all of our products, we will bring systemic change to the cocoa and chocolate value chain. Every year we report on the progress we are making against the Forever Chocolate targets.
Our third, most recent, progress report, covering fiscal year 2018/19 (ended August 31, 2019), shows that we are creating impact on the ground and leading change in the cocoa and chocolate value chain. We are focusing on big innovative projects which we know will create the tipping point to further a sustainable chocolate supply chain. For this we are using a combination of big data and technology as the backbone to scale our efforts. For example we are building a unique cocoa farmer database, we are providing tailor-made farm services, we are establishing traceability in our supply chain for all ingredients at risk of causing deforestation and we developed a highly innovative carbon foot print methodology for cocoa. In combination with the insights from our pilot projects in cocoa origin countries of what constitutes a sustainable cocoa farm, we are identifying the cocoa farm of the future and are getting ready to roll these out at scale.
We are very proud that our efforts were acknowledged in July 2019, when Sustainalytics, one of the leading companies assessing companies’ sustainability efforts, ranked Forever Chocolate the #1 sustainability strategy in the packaged foods industry out of 178 companies. Sustainalytics focuses on the management of environmental, social and governance risks in supply chains. Barry Callebaut is considered the leader among peers.
The power of data and technology Through the combination of data and technology we are mapping the structural sustainability challenges in the chocolate supply chain. This then forms the basis for our solutions to make sustainable chocolate the norm.
Farm mapping, combined with farmer census inter-views, provides us with key insights into the geographical location, farm size, crops grown, as well as the household composition and income of thousands of cocoa farmers and their farms.
The data from 176,984 farms where we have conducted both geographical mapping and census interviews describes the current situation of cocoa farmers, allowing us to offer more targeted advice on how to improve the productivity of cocoa farms via Farm Business Plans. These plans cover multiple years during which we offer advice on the best mix of planting cocoa seedlings, the use of fertilizers and diversifying income-generating activities and help farmers to access inputs and training on credit.
Number of cocoa farmers lifted out of poverty measured against the World Bank’s USD ./day threshold for extreme poverty.
According to the International Labour Organization, not all work done by children should be classified as child labor that is to be targeted for elimination. The term ‘child labor’ is often defined as work that deprives children of their childhood, their potential and their dignity, interferes with their schooling and is harmful to their physical and mental development. Activities such as carrying heavy loads or using chemicals are considered as ‘unacceptable forms of child labor’ because they are physically dangerous for children.
Letter to Shareholders Overview Business Highlights Sustainability Our People Financial Reports Governance
Our Approach
Barry Callebaut | Annual Report /
In addition, understanding where farms are geographically located allows us to assess if a farm is at risk of sourcing from a protected forest area. This is why farm mapping was an integral part of the Cocoa and Forests Initiative Frameworks for action, a multi-stakeholder platform to end deforestation caused by cocoa cultivation in Côte d’Ivoire and Ghana. As a result, we have mapped 47,182 cocoa farms in our direct supply chain within 25 kilometers of a protected forest area in Côte d’Ivoire and Ghana. This means that we have established traceability for the cocoa volumes coming from these mapped farms.
We also apply a similar data-driven approach for all other ingredients which we source besides cocoa, such as cane sugar, soy lecithin and palm oil. We are working within our own direct supply chain, as well as with suppliers and governments for our indirect supply chain, to introduce traceability as a matter of priority. Further, we have created a heat map to provide an overview of areas where the sourcing of agricultural raw materials poses a high risk of causing deforestation.
Our data insights also allow us to calculate our carbon footprint much more accurately. By combining farmer data with satellite data, we can calculate the carbon impact of land cleared for agriculture in those areas where the farms from which we are sourcing are located. This innovative methodology replaces average country data with farm-specific data.
Finally, the farmer census data also enables us to assess the risk of a farm being dependent on the use of child labor, by combining data such as the number of children in the household, access to quality education, and women’s income earning potential.
Scaling the insights from our pilots By combining our data insights and technology platforms with the outcomes of the pilot projects on sustainable cocoa farming we are implementing, we can truly drive systemic change at scale. We are collaborating with Wageningen University in the Netherlands, the world’s leading agricultural university, to capture and assess the findings of these pilot projects. This will allow us to roll out the learnings at a larger scale, benefiting more cocoa farmers. Just under 50,000 cocoa farmers have access to our farm services and more than 16,000 farmers have access to a Farm Business Plan. We have distributed over 1.8 million cocoa seedlings and over 750,000 shade trees. These are substantial numbers that create tangible impact on the ground. We leverage the learnings from the pilots in Cocoa Horizons, our preferred vehicle to support the implementation of our sustainability activities because of its capability to drive impact. The premiums flowing into the Cocoa Horizons Foundation increased by +40% over the last fiscal year. This growth allows the program to reach more farmers and scale impact. At the same time, Cocoa Horizons allows our customers to offer products that support the creation of self-sustaining cocoa farming communities and thereby protect children and promote biodiversity. Creating the movement Forever Chocolate is a movement. We need the expertise from academia and NGOs, the resources from our customers and partners, and an enabling policy environment from governments in order to succeed in making sustainable chocolate the norm. To drive change, and to achieve systemic impact, we require all stakeholders to come on board. Our 2018/19 Forever Chocolate Progress report clearly shows what can be achieved through a data-driven approach, rolled out at scale, with the support and resources of all relevant stakeholders. Since Forever Chocolate is a movement, we welcome all feedback and offers for support.

Letter to Shareholders Overview Business Highlights Sustainability Our People Financial Reports Governance
Prospering Farmers
Barry Callebaut | Annual Report /
Lifting cocoa farmers out of poverty Our goal By 2025, more than 500,000 cocoa farmers in our supply chain will have been lifted out of poverty. Our approach In order for more than 500,000 cocoa farmers in our supply chain to have been lifted out of poverty, it is key that we have a proper understanding of the structural challenges facing cocoa farmers. Farm-specific support is more effective in lifting farmers out of poverty than a one-size-fits-all approach. That is why we kicked off the pilot projects in key cocoa-growing countries to further our understanding of country-specific sustainable cocoa farming models. Our pilot projects, which were launched in 2017/18, were developed to understand not just the effectiveness, but also the rate of adoption by farmers of fertilizers, productivity packages, farm rehabilitation programs, shade trees and crop and livestock diversification. Partnering with Wageningen University, the world’s leading agricultural university, has provided us with initial insights into the effectiveness of our pilots.
We have now mapped the geographical location, as well as the size of 295,383 cocoa farms which are captured in our Katchilè database. We have conducted census interviews with 229,142 cocoa farmers (+75%), capturing socio-economic and household data. For 176,984 farms we conducted both geographical mapping as well as census interviews. This unprecedented collection of farmer data has allowed us to individualize our Farm Business Plans. These are designed to enable farmers to develop their cocoa farms into rehabilitated, diverse and professionally run farms over a period of several years. The Plans offer specific advice on the best mix of seedlings and fertilizers and help farmers to access labor and inputs on credit. Over 16,000 farmers have adopted Farm Business Plans. Furthermore in 2018/19 we distributed over 1.8 million cocoa seedlings and over 750,000 shade trees. We also distributed close to 13,500 productivity packages, which include training on tree pruning techniques and the use of fertilizer.
Finally, we leveraged the learnings from the pilots in Cocoa Horizons, our preferred vehicle to support the implementation of our sustainability activities. Cocoa Horizons allows our customers to offer products that support the creation of self-sustaining cocoa farming communities. The premiums from the purchase of HORIZONS products generated CHF 15 million in funds (+40%). Through these premiums more than 135,000 farmers can take part in the program focusing on improving their productivity and income. These premiums also financed child labor sensitization programs, training 27,448 farmers in the Cocoa Horizons program on Child Labor.
PROSPERING FARMERS
By 2025, more than 500,000 cocoa farmers in our supply chain will have been lifted out of poverty

Letter to Shareholders Overview Business Highlights Sustainability Our People Financial Reports Governance
Prospering Farmers
Barry Callebaut | Annual Report /
Our measured impact In 2018/19 49,909 (+303%) farmers in Côte d’Ivoire, Ghana, Cameroon, Brazil and Indonesia had access to farm services, including coaching as well as other inputs such as tools, seedlings and finance. A total of 420 hectares of cocoa were replanted. Progress here continues to be affected by the Ivorian government’s decision in 2018 to put the distribution of cocoa seedlings, and the replacing of aging cocoa trees in that country, on hold. We did see an improvement in productivity per hectare for farmers with access to farm services, but we have not been unable to demonstrate a causal link with our activities. This is foremost a methodological challenge which we hope to tackle in the coming fiscal year. Therefore we decided to refrain from reporting on this KPI for 2018/19. Measured against the World Bank’s threshold of USD 1.90/day, we estimate that 184,623 cocoa farmers in our supply chain have been lifted out of poverty.
Key Metric
184,623 Baseline measurement of the number of cocoa farmers in our supply chain out of poverty, measured against the World Bank’s USD ./day threshold for extreme poverty
Enabling KPIs
49,909 Number of cocoa farmers who have access to coaching, inputs such as tools and seedlings, or finance
420 Number of hectares of cocoa replanted
Our commitment to the UN SDGs

Letter to Shareholders Overview Business Highlights Sustainability Our People Financial Reports Governance
Zero Child Labor
Barry Callebaut | Annual Report /
Eradicating child labor Our goal By 2025, we will eradicate child labor from our supply chain. Our approach Child labor continues to be present in cocoa farming, in particular in West Africa. This is the result of both poverty and a lack of access to social infrastructure. The lack of access to quality education, for example, impacts cocoa farmers’ perspectives as to whether schooling will bring any benefits to their children. Lifting cocoa farmers out of poverty will be a game changer in the fight against child labor, but it will not be enough. Whilst continuing the roll-out of child labor monitoring and remediation systems, we are also increasing our efforts through community-based approaches, empowering cocoa-farming communities to take action against the worst forms of child labor and improve children’s rights. Adult literacy classes, the distribution of water filters at schools, health programs and the establishment or strengthening of community institutions such as Community Action Plans, Child Protection Committees and Village Savings and Loan Associations are examples of our efforts. The latter, together with income-generating activities and agroforestry projects, are particularly relevant for the economic empowerment of female cocoa farmers.
To this effect, we include information on cocoa farmer households in the data we collect. This allows us to assess the number of children in a farmer’s household and, by cross-referencing the data we have on the relevant cocoa farming community, we can assess the risk that the children on the farm will be engaged in the worst forms of child labor. The risk of a farm being dependent on the use of child labor is based on data such as the number of children in the household, access to quality education, and women’s income earning potential. The census data we have collected from 229,142 farmers, allow us to target our child labor monitoring and remediation activities towards those communities at highest risk of engaging in the worst forms of child labor. This year, we significantly expanded the range of farmer groups and communities covered by
child labor monitoring and remediation systems. Our monitoring and remediation approach is based on the industry practice as developed by the International Cocoa Initiative (ICI). Remediation activities to sensitize farmers range from household visits to encouraging the schooling of children working on the farm. This includes the provision of school kits, birth certificates and remedial schooling, as well as influencing labor practices by providing, for example, wheelbarrows and instructions on the use of non-hazardous tools. In 2018/19 we trained 80,847 farmers on child labor awareness.
Further, in 2018/19 we initiated a pilot program to establish a child protection committee in Ghana. This is a unique partnership which brings together district and local-level government agencies, social welfare specialists and community planners. The aim of the committee is to create partnerships at district level with village representatives who will sensitize the community on child labor risks and engage in monitoring.
ZERO CHILD LABOR
By 2025 we will eradicate child labor
from our supply chain

Letter to Shareholders Overview Business Highlights Sustainability Our People Financial Reports Governance
Zero Child Labor
Barry Callebaut | Annual Report /
Our measured impact We continue to implement our monitoring and remediation systems and now cover 42 farmer groups, including 16,710 farmers in Côte d’Ivoire and Ghana. This is a significant increase of +39% compared to the previous fiscal year. In total we established that in 2018/19, 26% of the farmer groups we directly sourced from have systems in place to prevent, monitor and remediate child labor, an increase of +116% compared to 2017/18. We found in the fiscal year under review 3,867 cases of child labor (–9%) which we are determined to remediate. Of the reported cases, 2,333 are in the process of being remediated1.
Our zero child labor commitment extends beyond cocoa. This year 37% of the cocoa and non-cocoa volume sourced from third party suppliers from low risk segmentations is covered by equivalent child labor monitoring systems.
Our focus in the next fiscal year will be to encourage our suppliers to develop roadmaps and targets for sourcing raw materials that are covered by a risk management system that identifies and addresses child labor risks. We will focus specifically on those suppliers of raw materials who are exposed to a high child labor risk in their supply chains, such as cane sugar.
Key Metric
3,867 Number of child labor cases identified
2,333 Number of child labor cases in the process of being remediated
Enabling KPIs
26% Farmer groups we directly source from have systems in place to prevent, monitor and remediate child labor
37%
Cocoa and non-cocoa volume sourced from third-party suppliers covered by equivalent child labor monitoring systems
Our commitment to the UN SDGs
https://cocoainitiative.org/wp-content/uploads///ICI-CLMS-Effectiveness__May.pdf. Please refer to page for an overview of remediation activities including i) individual remediation targeting the child ii) household remediation targeting the family of the identified child and iii) community level remediation.

Letter to Shareholders Overview Business Highlights Sustainability Our People Financial Reports Governance
Thriving Nature
Barry Callebaut | Annual Report /
Becoming carbon and forest positive Our goal By 2025 we will be carbon and forest positive. Our approach Climate change can have severe impacts on agricultural regions. Droughts mean farmers can no longer rely on crucial rainfall, while deforestation leads to soil degradation. If the chocolate industry does not commit to reducing its carbon footprint and achieve a deforestation free supply chain, the ecosystems that provide chocolate ingredients will erode. Carbon positive To become carbon positive by 2025, we need to understand exactly how much carbon we have to reduce or offset. This also enables us to pass on our achievements to our customers by supporting them to calculate how much carbon they can save by sourcing our cocoa and chocolate.
We are looking at the carbon footprint created by our own operations (scope 1), the carbon footprint generated by the energy we use (scope 2), as well as the carbon footprint of our entire supply chain (scope 3) which also includes the production and processing of all our sourced raw materials and related land use changes (LUC).
This is why in 2018/19 we continued the pioneering work with our partner Quantis to develop the first carbon footprint assessment for the cocoa supply chain. It is only when we fully understand where our biggest impacts lie that we can prioritize our efforts. The big step forward in this assessment is the use of satellite data in combination with our farm data to calculate the carbon impact of land cleared for agriculture for individual cocoa farms. This innovative assessment replaces average country data with farm-specific data. This will allow us to assess the carbon footprint of cocoa in our supply chain much more precisely and formulate effective strategies on how to reduce it. The aim is to make this assessment publicly available in early 2020 and we encourage the cocoa and chocolate industry to use this as the industry standard.
Another big step forward in becoming carbon positive is the work we are undertaking with our partner The Gold Standard Foundation. Through this collaboration we are the first company to develop a methodology to verify how much carbon emissions can be reduced and removed at farm level and in cocoa growing communities. We are formulating the guidelines for carbon insetting projects, such as tree planting, in scope 3 of cocoa supply chains.
An additional major contributor to our carbon footprint are our dairy ingredients. Therefore, we have been working with dairy suppliers to harmonize methodologies to measure carbon emissions on dairy farms and processing facilities. These activities allow us to better manage and account for carbon footprint reductions in the dairy supply chains.
This year also marked the launch of a pilot to test the viability of Biochar. This consists of the residue of cocoa shells which have been used to generate energy in our factories. In addition the use of Biochar supports the offsetting of our carbon footprint. We are investigating the possibility of extending the use of Biochar as a fertilizer to our Farm Services business, to improve soil quality and make cocoa production more carbon neutral. Further, Biochar can be used by dairy suppliers for cow feed production, to reduce methane production.
In 2018/19, 17 of our 62 factories are now fully powered by renewable energy. Our Kagerod factory in Sweden achieved carbon neutrality in 2019. Our efforts to reduce our carbon footprint have also been recognized by CDP, an independent organization which assesses the carbon reduction actions of industry every year. In 2018 we were awarded an A- for our activities to reduce our carbon footprint, putting us in the top 6% of the over 7,000 assessed companies.
THRIVING NATURE
By 2025 we will be carbon and forest
positive

Letter to Shareholders Overview Business Highlights Sustainability Our People Financial Reports Governance
Thriving Nature
Barry Callebaut | Annual Report /
Forest positive In order to become deforestation free and forest positive by 2025, we are working within our own direct supply chain as well as with suppliers and governments across our indirect supply chain to introduce traceability as a matter of priority. Approximately half of our sourced ingredients by volume are cocoa products and half are non-cocoa products, such as sugar, dairy, and vegetable oils.
In order to become forest positive, we have to start by eliminating deforestation from our supply chain. In 2017 we signed the Cocoa and Forests Initiative (CFI), a multi-stakeholder initiative dedicated to ending cocoa farming induced deforestation in Ghana and Côte d’Ivoire. It includes a commitment to deliver traceability in our direct cocoa supply chains in these two countries. In line with this commitment, we have mapped 47,182 cocoa farms in our direct supply chain within 25 kilometers of a protected forest area in Côte d’Ivoire and Ghana.
We have so far distributed over 1.8 million young cocoa seedlings in Côte d’Ivoire and Ghana. Furthermore, we have distributed almost 750,000 shade trees for replanting in Côte d’Ivoire and Ghana.
Furthermore, we are not only eliminating deforestation from our supply chain, we are also committing to forest restoration. The ISLA project in Côte d’Ivoire helps to protect the forest reserve of Cavally, a forest of high biodiversity value. It aims to sensitize the local community on sustainable natural resource management. Together with the Dutch Sustainable Trade Initiative (IDH), Barry Callebaut has supported several monitoring missions by the Wild Chimpanzee Foundation and the Ivorian national forestry agency SODEFOR in the area. These missions have helped to protect 6,280 hectares of primary forest and restore 3,800 hectares of forest by removing illegal cocoa and allowing natural forest regeneration. Furthermore, in order to prevent the infiltration of cocoa farms into Cavally, ISLA aims to make cocoa production outside of protected areas more sustainable and productive.
In the coming year, we will work with industry partners and cocoa origin governments to expand such initiatives to regenerate degraded forests, as well as explore exciting new technologies to promote reforestation.
In addition to cocoa, we source other ingredients from tropical agriculture for our chocolate, such as cane sugar, soy lecithin and palm oil. We have created a heat map to provide an overview of areas where the sourcing of agricultural raw materials can pose a high risk of causing deforestation. For those ingredients and geographies at risk of causing deforestation, we are working with our suppliers to establish traceability. For those volumes where traceability has already been established or provenance has been ensured through third parties, i.e. certification, we will not source ingredients from High Conservation Value land, High Carbon Stock land (level 1 and 2), or any land identified by relevant stakeholders as important for conservation, nor from land defined as National Park, state or local reserve, or protected status, by national or sub-national governments.
Furthermore, we are also engaged in several multi-stakeholder initiatives such as the Palm Oil Innovation Group (POIG) or the Cerrado Manifesto to drive sustainable practices in areas at risk of deforestation. Through these types of initiatives we are continuously championing more ambitious industry standards for sustainable commodity sourcing.

Letter to Shareholders Overview Business Highlights Sustainability Our People Financial Reports Governance
Thriving Nature
Barry Callebaut | Annual Report /
Our measured impact Due to our combined carbon reduction efforts, our corporate CO2 equivalent (CO2e) footprint decreased from 9.10 million tonnes to 8.49 million tonnes in fiscal year 2018/19. This represents a reduction of –6.7%, despite an increase in production. The main drivers of this achievement are the reduced CO2e emissions from land use change, reduced CO2e intensity in factories and the reduced CO2e intensity in dairy products. The CO2e intensity per tonne of product also decreased from 4.45 to 3.92, and with the additional contributions from scope 3 insetting projects, was further reduced to 3.88. This is a decrease of –12.8% compared to the previous fiscal year.
The percentage of sourced raw materials demonstrated not to be contributing to deforestation is 37.6%. Looking ahead, we will continue to utilize our heat map to identify where the sourcing of agricultural raw materials poses a high risk of causing deforestation. This valuable data will help us to work with suppliers to improve traceability and support out partnerships. Through our support of the ISLA project 3,800 hectares of forest were regenerated.
Key Metric The carbon footprint of our supply chain from farm to customer and number of hectares of forest regenerated
8.49 Million tonnes COe
3,800 Number of hectares of forest regenerated
Enabling KPIs
3.88 COe intensity per tonne of product
37.6% Sourced raw materials demonstrated not to be contributing to deforestation
Our commitment to the UN SDGs

Letter to Shareholders Overview Business Highlights Sustainability Our People Financial Reports Governance
Sustainable Chocolate
Barry Callebaut | Annual Report /
Sustainable Chocolate Our goal By 2025, we will have 100% sustainable ingredients in all of our products. Our approach
At Barry Callebaut we source a wide range of ingre-dients including dairy, palm oil, coconut oil, soy lecithin, vanilla, cane sugar, beet sugar and nuts for inclusion in our chocolate products. We recognize that each of these raw materials has its own complex supply chain that can also vary across different geographical regions. We are therefore working with our suppliers and certification and sustainability programs, to define and implement sustainability standards for each ingredient.
For the sustainable sourcing of raw materials, establishing common industry standards on sustainability is key. Barry Callebaut is at the forefront of the development of such standards for our priority ingredients. We have been a member of the Roundtable on Sustainable Palm Oil (RSPO) since 2011. We are also a member of the Palm Oil Innovation Group (POIG), in order to build upon the efforts of RSPO to further advance sustainable palm oil requirements. Working with Conservation International, we also undertook a palm oil risk assessment to identify and prioritize deforestation risks in our supply chains. As a part of our strategy to proactively promote sustainable ingredient production, we joined the Coalition for Sustainable Livelihoods, led by Conservation International, to promote smallholders prosperity, eliminate deforestation, and promote forest restoration in Indonesia.
Our sustainable soy is sourced via ProTerra. In January 2019, we also became members of the newly formed ProTerra Stakeholder Council to drive further improvements in standards and governance. ProTerra is the industry leader in certified sustainable soy cultivation, which is mainly sourced from Brazil.
Dairy production is a major contributor to greenhouse gas emissions in our carbon footprint. Achieving sustainable dairy production is a big challenge, which is why we are a member of industry platforms such as the Sustainable Agriculture Initiative Platform (SAI) and part of the Dairy Working Group. In addition, in 2018, Barry Callebaut established the VisionDairy program to develop a Dairy
Sustainability Charter, the aim of which is to set a global benchmark for sustainable dairy production. In 2018/19, we collected a first set of outcome measures from suppliers, and continued to expand VisionDairy by benchmarking it against some of our suppliers’ sustainability programs in order to streamline data collection and reporting processes.
In 2017, we joined Bonsucro, whose mission is to ensure responsible cane sugar production that creates lasting value for the people, communities, economies and eco-systems in all cane-growing regions. In fiscal year 2018/19 we received the Bonsucro Chain of Custody certification ensuring that we are diligently applying the Bonsucro sustainability standards for the cane sugar products in our supply chain.
Barry Callebaut is a member of the crops working group at the SAI. We benchmark and monitor our beet sugar suppliers against the SAI Farm Sustainability Assessment and expect them to reach, at a minimum, silver level. For sustainable beet sugar production, pesticide and fertilizer levels are optimized, soil health is maintained, carbon sinks are protected and energy use is optimized. In fiscal year 2018/19 we worked with Russian beet sugar suppliers who have now all reached the silver level with their selected farmers and plants. Going forward, we aim to achieve this success with our suppliers in Turkey.
Similar to cocoa farmers, coconut farmers face low yields due to ageing trees and poor farming practices, and are not achieving sustainable livelihoods. For this reason, in April 2019, Barry Callebaut initiated and organized the first Roundtable on Sustainable Coconut and Coconut Oil together with the US Agency for International Development (USAID) and Green Invest Asia. The roundtable, which was attended by 80 representatives, including buyers and processors representing over 50% of the global coconut oil supply, aims to establish a sustainable coconut and coconut oil supply chain in the Philippines and Indonesia, the world’s largest producers of coconut oil. Following this event, we are now working with key stakeholders to institutionalize the Coconut Roundtable and create a forum for collaboration in coconut sustainability.
SUSTAINABLE CHOCOLATE
By 2025 we will have 100% sustainable ingredients
in all of our products

Letter to Shareholders Overview Business Highlights Sustainability Our People Financial Reports Governance
Sustainable Chocolate
Barry Callebaut | Annual Report /
Our measured impact 51% of all the raw materials we source originate from sustainable sources. This is an increase of almost +16% compared to the previous fiscal year. In 2018/19 we increased our volume of sustainably sourced cocoa to 47%. In the coming fiscal year we will start to focus more efforts on further building the market pull for sustainably sourced cocoa. 54% of our non-cocoa ingredients are now coming from sustainable sources, an increase of almost +23% compared to 2017/18.
Key Metric
51% Percentage of agricultural raw materials sustainably sourced
Enabling KPIs
47% of sustainably sourced cocoa beans
54% of sustainably sourced non-cocoa raw materials
Our commitment to the UN SDGs

Letter to Shareholders Overview Business Highlights Sustainability Our People Financial Reports Governance
Our People
Barry Callebaut | Annual Report /
Employee Development

Letter to Shareholders Overview Business Highlights Sustainability Our People Financial Reports Governance
Employee Development
Barry Callebaut | Annual Report /
Our People Empowering our diverse talent to shape the future
Our people are at the heart of our success. Our history is based on passion for cocoa and chocolate, entrepreneurship and growth. Our strength stems from the contribution of every Barry Callebaut employee living the company values – customer focus, passion, entrepreneurship, team spirit and integrity – and being empowered to apply their talents to the fullest. We therefore maintain a strong focus on fostering our unique company culture by attracting, developing and retaining diverse talent from all over the world to grow our business in an entrepreneurial and sustainable way. Leveraging diversity, inclusion and engagement A diverse workforce and an inclusive culture are key to our Company’s success and uniqueness. We are committed to harnessing the power of diversity to achieve business success, in an environment where every employee is engaged, empowered and capable of achieving their very best and full potential.
Through the Chairman’s Awards we recognize our colleagues who embody the Barry Callebaut values of customer focus, passion, entrepreneurship, team spirit and integrity. This year saw 13 employees recognized for outstanding work performance and a strong social commitment in their local communities.
At the end of 2018, we introduced Seeds for Change, a global employee engagement program for sustainability, enabling all employees to contribute to our Forever Chocolate commitments. It arose from the need and desire of our employees to play their part in achieving the objectives of Forever Chocolate, Barry Callebaut’s plan to make sustainable chocolate the norm by 2025. Seeds for Change is now led by 162 Ambassadors across all our sites worldwide. The Seeds for Change Ambassadors are leading activities that enable colleagues on site to have a positive impact, by initiating creative solutions to reduce our carbon footprint, greening our offices and factories, cleaning and brightening up our surroundings. Through these activities employees are earning Pod Points which are used to buy seedlings for cocoa farmers participating in our sustainability initiatives. Seedlings have the triple benefit of improving farmers’ livelihoods, capturing carbon, and increasing crop diversity at the farm level. Seeds for Change has generated considerable momentum and enthusiasm
among all employees and has quickly become a key source for hands-on sustainable solutions throughout our offices and organization and a fantastic engagement opportunity for all.
Bringing in and developing the best talents Attracting talent is key to support our growth ambition, and last year we focused on strengthening our recruitment capability, referral program and our reach through social media.
The One Young World Summit was one of many activities designed to promote dialogue and engagement with young talent. Held in The Hague, the Netherlands, in October 2018, this summit provided a platform for our senior leaders to engage with millennials on a number of topics relevant to Barry Callebaut, which is crucial for attracting future talent.
We have increased our efforts to onboard our new employees with a full-immersion program that allows them to develop a sense of belonging, connect with every part of the business, get up to speed on our Company’s values and begin building a network with colleagues all over the world.
Over the past year we also invested in an online learning platform focusing on technical and professional skills, fostering a continuous learning culture. We continued to grow our leaders through the Marbach Academy. We welcomed 213 participants to the Academy. In 2018/19 we launched five new programs, bringing the total number of available programs to nine. The Marbach Programme is using a blended learning methodology, combining on-line trainings, classroom courses and experiential learning.
Rewarding employees for their performance Our performance management philosophy strengthens the strategic alignment throughout the organization while promoting desirable behaviors and a culture of continuous development. Our employees are rewarded for their performance and for demonstrating behaviors that are in line with Barry Callebaut’s core values. Our employees performance is measured against focus on creating a unique customer experience, being passionate about chocolate and cocoa, taking personal initiative to explore new trends and innovate, collaborate in teams beyond the company

Letter to Shareholders Overview Business Highlights Sustainability Our People Financial Reports Governance
Employee Development
Barry Callebaut | Annual Report /
(including producers, suppliers, customers and consumers) and having very high standards of integrity and honesty. Our employees are incentivized to generate sustainable and long-term value for all of our stakeholders. Fostering a safe and unique workplace After revising our corporate policies on Labor, Health & Safety and Environment last year, we focused in 2018/19 on further enhancing our practices and standards in line with industry best practice. We adhere to the Ethical Trading Initiative (ETI) Base Code, local and national legislation and our customers' expectations and requirements.
Our ongoing effort to enhance best practices for our people, the environment and the communities we operate in resulted in attractive performance improvements during the
past year. Our Lost Time Accidents (LTA) in 2018/19, the indicator registering each accident resulting in absence from work, was 102, a reduction of 28% compared to the previous fiscal year. Our annual (Lost Time) accidents rate was 0,99 per 100 FTE's. This is an improvement of 35% compared to the previous year.
Of our sites, 91% are now fully SMETA compliant, a 10% increase compared to the previous fiscal year.
We are proud that Barry Callebaut’s plan to make sustainable chocolate the norm, Forever Chocolate, is considered the #1 sustainability strategy in the packaged foods industry by Sustainalytics. This result was achieved thanks to our people’s commitment to the management of the environmental, social and governance risks in our supply chain.
As
Employees per Region1
EMEA (excl. Africa) 5,582 Americas 3,362 Asia Pacific 1,893 Africa 1,420 Number of employees 12,257
Employees per function1
Management 1,656 Office 3,728 Production 6,873 Number of employees 12,257
Gender of employees by function1
Female Male
Age of employees by function1
< 30 30–50 > 50
Average seniority by Region in year
2018/19 EMEA (excl. Africa) 10.8 Americas 8.1 Asia Pacific 5.7 Africa 7.0
0
1000
2000
3000
4000
5000
6000
7000
14%
30%56%
0
1000
2000
3000
4000
5000
6000
7000
1 As of August 31, 2019
46%
27%
15%
12%

Letter to Shareholders Overview Business Highlights Sustainability Our People Financial Reports Governance
Financial Reports
Barry Callebaut | Annual Report /
Consolidated Financial Statements
Consolidated Income Statement Consolidated Statement of Comprehensive Income Consolidated Balance Sheet Consolidated Cash Flow Statement Consolidated Statement of Changes in Equity
Notes to the Consolidated Financial Statements Basis of Preparation Operating Performance Operating Assets and Liabilities Capital and Financial Risk Management Employees Group Structure and Related Parties Taxes Other Disclosures
Financial Statements of Barry Callebaut AG

Letter to Shareholders Overview Business Highlights Sustainability Our People Financial Reports Governance
Consolidated Financial Statements
Barry Callebaut | Annual Report /
Consolidated Income Statement
for the fiscal year 2018/19 2017/18 in thousands of CHF Notes Revenue from sales and services 1.1 / 1.2 7,309,036 6,948,411 Cost of goods sold (6,120,612) (5,791,331) Gross profit 1,188,424 1,157,080 Marketing and sales expenses (151,773) (149,956) General and administration expenses (439,899) (441,040) Other income 1.4 29,520 19,595 Other expense 1.4 (25,084) (31,655) Operating profit (EBIT)1 601,188 554,024 Finance income 3.8 10,879 6,539 Finance expense 3.8 (159,299) (107,687) Profit before income tax 452,768 452,876 Income tax expense 6.1 (84,037) (95,517) Net profit for the year 368,731 357,359
of which attributable to: shareholders of Barry Callebaut AG 370,280 356,133 non-controlling interests 3.2 (1,549) 1,226
Earnings per share Basic earnings per share (CHF/share) 3.3 67.57 64.93 Diluted earnings per share (CHF/share) 3.3 67.21 64.55
1 Operating profit (EBIT) as used by the Group is defined as profit before finance income, finance expense and income tax expense.
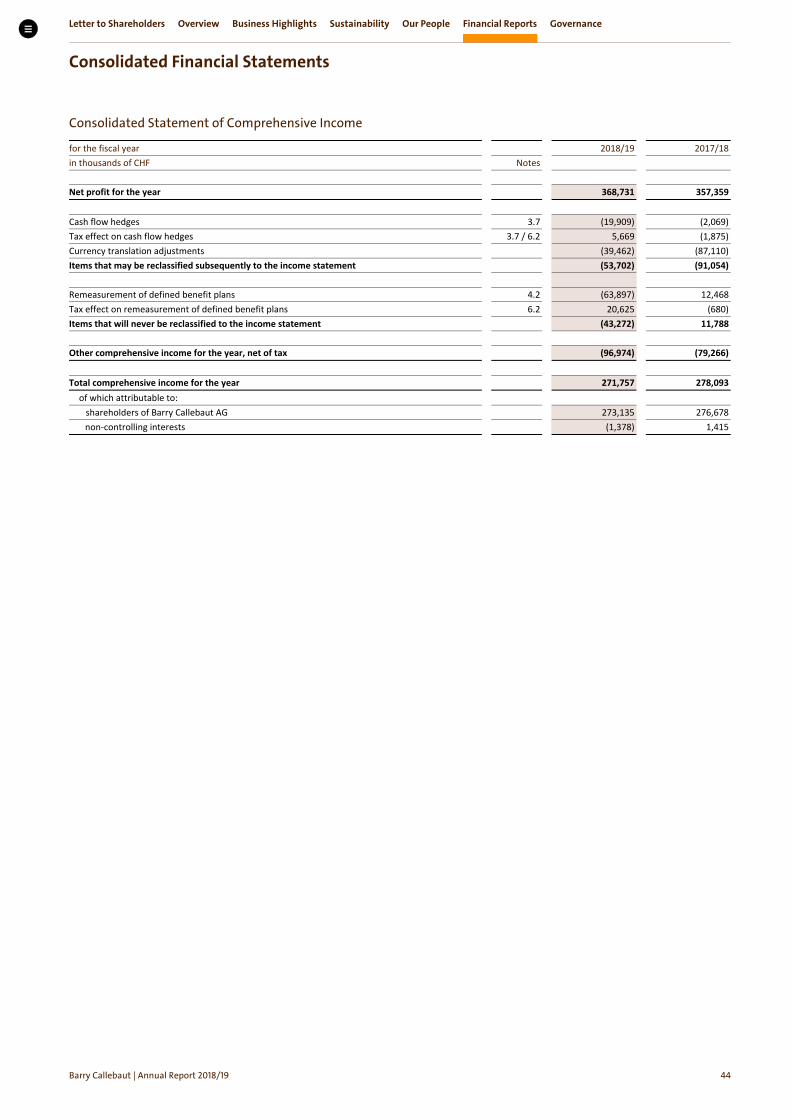
Letter to Shareholders Overview Business Highlights Sustainability Our People Financial Reports Governance
Consolidated Financial Statements
Barry Callebaut | Annual Report /
Consolidated Statement of Comprehensive Income
for the fiscal year 2018/19 2017/18 in thousands of CHF Notes Net profit for the year 368,731 357,359 Cash flow hedges 3.7 (19,909) (2,069) Tax effect on cash flow hedges 3.7 / 6.2 5,669 (1,875) Currency translation adjustments (39,462) (87,110) Items that may be reclassified subsequently to the income statement (53,702) (91,054) Remeasurement of defined benefit plans 4.2 (63,897) 12,468 Tax effect on remeasurement of defined benefit plans 6.2 20,625 (680) Items that will never be reclassified to the income statement (43,272) 11,788 Other comprehensive income for the year, net of tax (96,974) (79,266) Total comprehensive income for the year 271,757 278,093
of which attributable to: shareholders of Barry Callebaut AG 273,135 276,678 non-controlling interests (1,378) 1,415

Letter to Shareholders Overview Business Highlights Sustainability Our People Financial Reports Governance
Consolidated Financial Statements
Barry Callebaut | Annual Report /
Consolidated Balance Sheet
Assets as of August 31, 2019 2018 in thousands of CHF Notes Current assets Cash and cash equivalents 3.4 557,827 404,183 Short-term deposits 1,549 1,656 Trade receivables and other current assets 2.4 815,783 911,904 Inventories 2.3 1,803,674 1,476,667 Income tax receivables 62,977 29,685 Derivative financial assets 3.7 616,284 502,471 Total current assets 3,858,094 3,326,566 Non-current assets Property, plant and equipment 2.1 1,498,878 1,420,885 Intangible assets 2.2 1,026,331 991,510 Employee benefit assets 4.2 4,924 5,558 Deferred tax assets 6.2 86,869 65,679 Other non-current assets 33,036 21,844 Total non-current assets 2,650,038 2,505,476 Total assets 6,508,132 5,832,042
Liabilities and equity as of August 31, 2019 2018 in thousands of CHF Notes Current liabilities Bank overdrafts 3.5 132,638 26,267 Short-term debt 3.5 197,003 285,048 Trade payables and other current liabilities 2.5 1,127,511 1,121,082 Income tax liabilities 60,079 52,518 Derivative financial liabilities 3.7 741,383 641,997 Provisions 2.6 20,381 26,015 Total current liabilities 2,278,995 2,152,927 Non-current liabilities Long-term debt 3.5 1,534,453 1,168,797 Employee benefit liabilities 4.2 184,562 130,826 Provisions 2.6 4,929 8,735 Deferred tax liabilities 6.2 80,283 70,892 Other non-current liabilities 11,298 14,354 Total non-current liabilities 1,815,525 1,393,604 Total liabilities 4,094,520 3,546,531 Equity Share capital 3.2 110 110 Retained earnings and other reserves 2,399,182 2,269,686 Total equity attributable to the shareholders of Barry Callebaut AG 2,399,292 2,269,796 Non-controlling interests 3.2 14,320 15,715 Total equity 2,413,612 2,285,511 Total liabilities and equity 6,508,132 5,832,042

Letter to Shareholders Overview Business Highlights Sustainability Our People Financial Reports Governance
Consolidated Financial Statements
Barry Callebaut | Annual Report /
Consolidated Cash Flow Statement
Cash flows from operating activities for the fiscal year 2018/19 2017/18 in thousands of CHF Notes Net profit for the year 368,731 357,359 Income tax expense 6.1 84,037 95,517 Depreciation, amortization and impairment 2.1 / 2.2 176,384 181,259 Interest expense 3.8 137,752 93,469 Loss on sale of property, plant and equipment, net 1.4 1,241 7,479 Decrease of employee benefit obligations (10,766) (19,065) Equity-settled share-based payments 4.1 15,043 14,464 Change in working capital: 33,013 (54,556)
Inventories (94,145) (194,897) Write down of inventories 2.3 44,600 33,500 Inventory fair value adjustment 57,017 (52,886)
Derivative financial assets/liabilities (36,998) 395,867 Trade receivables and other current assets 80,568 (197,163) Trade payables and other current liabilities (18,029) (38,977)
Provisions less payments 2.6 (8,669) (14,938) Other non-cash effective items (7,014) 10,196 Cash generated from operating activities 789,752 671,184 Interest paid (139,657) (93,120) Income taxes paid (94,347) (62,557) Net cash flow from operating activities 555,748 515,507

Letter to Shareholders Overview Business Highlights Sustainability Our People Financial Reports Governance
Consolidated Financial Statements
Barry Callebaut | Annual Report /
Consolidated Cash Flow Statement
Cash flows from investing activities for the fiscal year 2018/19 2017/18 in thousands of CHF Notes Purchase of property, plant and equipment 2.1 (218,360) (180,821) Proceeds from sale of property, plant and equipment 4,970 4,422 Purchase of intangible assets 2.2 (61,216) (37,111) Proceeds from sale of intangible assets 322 3,731 Acquisition of subsidiaries/businesses net of cash acquired 5.1 (33,983) (126,655) Purchase of short-term deposits (536) (1,588) Proceeds from sale of short-term deposits 245 551 Sale/(purchase) of other non-current assets (1,933) 983 Dividends received from equity-accounted investees – 239 Interest received 10,479 5,959 Net cash flow from investing activities (300,012) (330,290)
Cash flows from financing activities for the fiscal year 2018/19 2017/18 in thousands of CHF Notes Proceeds from the issue of short-term debt 3.5 98,530 31,362 Repayment of short-term debt 3.5 (533,033) (65,177) Proceeds from the issue of long-term debt 3.5 677,579 1,200 Repayment of long-term debt 3.5 (281,459) (8,534) Dividend paid to shareholders of Barry Callebaut AG 3.2 (131,501) (69,873) Capital reduction and repayment 3.2 – (39,904) Purchase of treasury shares (22,781) (22,783) Dividends paid to non-controlling interests 3.2 (17) (247) Net cash flow from financing activities 3.5.3 (192,682) (173,956) Effect of exchange rate changes on cash and cash equivalents (15,781) (11,373) Net increase/(decrease) in cash and cash equivalents 47,273 (112) Cash and cash equivalents at beginning of year 377,916 378,028 Cash and cash equivalents at end of year 425,189 377,916 Net increase/(decrease) in cash and cash equivalents 47,273 (112) Cash and cash equivalents 557,827 404,183 Bank overdrafts 3.5 (132,638) (26,267) Cash and cash equivalents as defined for the cash flow statement 3.4 425,189 377,916

Letter to Shareholders Overview Business Highlights Sustainability Our People Financial Reports Governance
Consolidated Financial Statements
Barry Callebaut | Annual Report /
Consolidated Statement of Changes in Equity
Attributable to the shareholders of Barry Callebaut AG
Share capital
Treasury shares
Retained earnings
Hedging reserves
Cumulative translation
adjustment
Total¹ Non- controlling
interests
Total equity
in thousands of CHF as of September 1, 2017 40,014 (15,105) 2,629,403 (12,312) (530,813) 2,111,187 14,925 2,126,112
Currency translation adjustments – – – – (87,263) (87,263) 153 (87,110) Effect of cash flow hedges – – – (2,069) – (2,069) – (2,069) Tax effect on cash flow hedges – – – (1,875) – (1,875) – (1,875)
Items that may be reclassified subsequently to the income statement
–
–
–
(3,944)
(87,263)
(91,207)
153
(91,054)
Remeasurement of defined benefit plans – – 12,420 – – 12,420 48 12,468 Tax effect on remeasurement of defined benefit plans
–
–
(668)
–
–
(668)
(12)
(680)
Items that will never be reclassified to the income statement
–
–
11,752
–
–
11,752
36
11,788
Other comprehensive income, net of tax – – 11,752 (3,944) (87,263) (79,455) 189 (79,266) Net profit for the year – – 356,133 – – 356,133 1,226 357,359 Total comprehensive income for the year – – 367,885 (3,944) (87,263) 276,678 1,415 278,093 Hedge reserve transferred to initial carrying amount of the hedged item
–
–
–
–
–
–
–
–
Payout to shareholders (39,904) – (69,873) – – (109,777) (247) (110,024) Purchase of treasury shares – (22,783) – – – (22,783) – (22,783) Equity-settled share-based payments – 16,968 (2,477) – – 14,491 – 14,491 Total contributions and distributions (39,904) (5,815) (72,350) – – (118,069) (247) (118,316) Movements of non-controlling interest – – – – – – (378) (378) Total changes in ownership interests – – – – – – (378) (378) as of August 31, 2018 110 (20,920) 2,924,938 (16,256) (618,076) 2,269,796 15,715 2,285,511 Adjustment on initial application of IFRS 15² – – (4,121) – – (4,121) – (4,121) as of September 1, 2018 110 (20,920) 2,920,817 (16,256) (618,076) 2,265,675 15,715 2,281,390
Currency translation adjustments – – – – (39,622) (39,622) 160 (39,462) Effect of cash flow hedges – – – (19,909) – (19,909) – (19,909) Tax effect on cash flow hedges – – – 5,669 – 5,669 – 5,669
Items that may be reclassified subsequently to the income statement
–
–
–
(14,240)
(39,622)
(53,862)
160
(53,702)
Remeasurement of defined benefit plans – – (63,907) – – (63,907) 10 (63,897) Tax effect on remeasurement of defined benefit plans
–
–
20,624
–
–
20,624
1
20,625
Items that will never be reclassified to the income statement
–
–
(43,283) –
–
(43,283)
11
(43,272)
Other comprehensive income, net of tax – – (43,283) (14,240) (39,622) (97,145) 171 (96,974) Net profit for the year – – 370,280 – – 370,280 (1,549) 368,731 Total comprehensive income for the year – – 326,997 (14,240) (39,622) 273,135 (1,378) 271,757 Hedge reserve transferred to initial carrying amount of the hedged item
–
–
–
(279)
–
(279)
–
(279)
Payout to shareholders – – (131,501) – – (131,501) (17) (131,518) Purchase of treasury shares – (22,781) – – – (22,781) – (22,781) Equity-settled share-based payments – 24,195 (9,152) – – 15,043 – 15,043 Total contributions and distributions – 1,414 (140,653) – – (139,239) (17) (139,256) as of August 31, 2019 110 (19,506) 3,107,161 (30,775) (657,698) 2,399,292 14,320 2,413,612
1 Attributable to the shareholders of Barry Callebaut AG. 2 Refer to Introduction of new standards in 2018/19, IFRS 15 – Revenue from Contracts with Customers page 50.

Letter to Shareholders Overview Business Highlights Sustainability Our People Financial Reports Governance
Notes to the Consolidated Financial Statements
Barry Callebaut | Annual Report /
Basis of Preparation
A. Organization and business activity Barry Callebaut AG (the “Company”) was incorporated on December 13, 1994, under Swiss law, having its head office in Zurich, Switzerland, at Pfingstweidstrasse 60. Barry Callebaut AG is registered in Switzerland and has been listed on the SIX Swiss Exchange (BARN, ISIN Number: CH0009002962) since 1998. These Consolidated Financial Statements comprise the Company and its subsidiaries (together referred to as the “Group”). The Group’s ultimate parent is Jacobs Holding AG which holds 50.1% of the shares issued (August 31, 2018: 50.1%).
The Group is primarily involved in the manufacturing of high-quality chocolate and cocoa products as well as providing value-adding services to serve the entire food industry.
B. Basis of presentation The Consolidated Financial Statements of the Group have been prepared in accordance with International Financial Reporting Standards (IFRS) and comply with Swiss law.
The Consolidated Financial Statements have been prepared on the historical cost basis except for certain items for which IFRS requires another measurement basis, in which case this is explicitly stated in the accounting policies. Significant accounting policies relevant to the understanding of the Consolidated Financial Statements are included in the corresponding notes. The Group has consistently applied its accounting policies to all periods presented in these Consolidated Financial Statements, except if mentioned otherwise (see section “D. Introduction of new standards in 2018/19”).
The Consolidated Financial Statements are presented in Swiss francs, which is the Company’s functional currency.
All amounts have been rounded to the nearest thousand, unless otherwise indicated. Due to rounding, the figures presented in the tables may not add up precisely to the totals provided.
C. Use of judgment and estimates The preparation of financial statements requires management to make judgments, estimates and assumptions that affect the application of accounting policies and the reported amounts of assets, liabilities, income and expenses. Actual results may differ from these estimates.
Estimates and underlying assumptions are reviewed on an ongoing basis. Revisions to accounting estimates are recognized prospectively.
Information related to judgments made in applying accounting policies that have the most significant effects on the amounts recognized in the Consolidated Financial Statements, together with assumptions and estimation uncertainties that have a significant risk of resulting in a material adjustment in the year-ending August 31, 2019, are included in the following notes:
Note 5.1
Acquisitions: Fair value measurement Note 2.2 Intangible assets – Impairment testing for CGU containing goodwill:
Key assumptions used for value-in-use calculations Note 6.2 Deferred tax assets and liabilities – Recognition of deferred tax assets:
Availability of future taxable profits against which tax loss carry-forwards can be utilized Note 4.2 Employee benefit obligations – Measurement of defined benefit obligations: Actuarial assumptions Note 2.6 Provisions: Recognition of provisions

Letter to Shareholders Overview Business Highlights Sustainability Our People Financial Reports Governance
Notes to the Consolidated Financial Statements
Barry Callebaut | Annual Report /
D. Introduction of new standards in / The Group has adopted new standards and amendments to the existing International Financial Reporting Standards (IFRS) and interpretations with a date of initial application, being September 1, 2018. With the exception of the implementation of IFRS 15, which is disclosed below, these adoptions did not have any material impact on the current reporting period. IFRS 15 – Revenue from Contracts with Customers The Group has adopted the standard from September 1, 2018, using the cumulative effect method, recognizing the transitional adjustment as an adjustment to the opening balance of retained earnings of the reporting period 2018/19, which includes the date of the initial application. Accordingly, comparatives for the reporting period 2017/18 have not been restated.
The standard has been applied retrospectively only to contracts that are not completed contracts at the date of the initial application.
The Group applies the practical expedient to recognize the incremental costs of obtaining a contract as an expense when incurred as the amortization period of the asset that the Group otherwise would have recognized is less than one year.
Impact on the Consolidated Financial Statements The Group has reviewed its typical commercial arrangements with customers applying the five-step model and has concluded that the transition to IFRS 15 has the following main effects: 1. Agent vs. Principal Under the accounting guidance of IFRS 15 the Group has reassessed accounting for certain raw material sales transactions, in which under the prior standard the Group was considered “agent” and recognized the respective revenue on a net basis.
The Group concluded that under IFRS 15 it has control over the goods sold prior to the transfer to the customer and the revenue for these goods is to be recognized gross.
The reassessment of these transactions has a positive effect of CHF 171.0 million on the “Revenue from sales and services” and a negative effect of the same amount on “Cost of goods sold” of the Consolidated Income Statement.
2. Variable considerations and considerations paid to customers Under the prior standard, the Group had treated certain variable considerations (such as certain types of rebates, discounts, free products and other incentives offered to customers) and considerations payable to customers as “Cost of goods sold”.
Under the accounting guidance of IFRS 15 variable considerations are treated as a revenue deduction. Considerations payable to customers are to be accounted for as a revenue deduction unless they represent payments for distinct goods or services, which do not exceed the fair value of these goods or services.
The adoption of IFRS 15 resulted in a negative effect of CHF 18.8 million on “Revenue from sales and services” and a positive effect of the same amount on “Cost of goods sold” of the Consolidated Income Statement.

Letter to Shareholders Overview Business Highlights Sustainability Our People Financial Reports Governance
Notes to the Consolidated Financial Statements
Barry Callebaut | Annual Report /
3. Transfer of control As a result of the change in the revenue recognition principle from “transfer of risks and rewards” to “transfer of control” a one-off transition adjustment to the opening balances of the Consolidated Balance Sheet as of September 1, 2018, affecting inventories, trade payables and short-term debt has been made. These adjustments related to structured solutions that the Group had entered into for the management of working capital of exchange traded commodities (namely cocoa beans). Under IFRS 15, the inventories are now recognized in the Group’s Consolidated Balance Sheet as the Group has either obtained control over the inventories from the supplier or has not yet passed control to the customer.
A minor effect on equity and deferred tax assets results from the elimination of intercompany profits included in the carrying amount of these inventories, and related deferred taxes.
Under the prior standard, the guiding principle for revenue recognition was “transfer of risks and rewards”. Due to the Group’s business model, the point in time of “transfer of control” is identical with the point in time of “transfer of risks and rewards”.
The following table presents the effects of the IFRS 15 transition on the Group’s Consolidated Income Statement. Line items, which were not affected by the application of the new requirements, have not been included.
Consolidated Income Statement Impact
for the fiscal year ended August 31, 2019 IAS 18 Effects of IFRS 15 adoption
IFRS 15
in millions of CHF Revenue from sales and services1,2 7,157 152 7,309 Cost of goods sold1,2 (5,969) (152) (6,121) Gross profit 1,188 – 1,188 Operating profit (EBIT) 601 – 601 Profit before income taxes 453 – 453 Net profit for the period 369 – 369
1 Agent vs. Principal refer to page 50. 2 Variable considerations and considerations paid to customers refer to page 50.

Letter to Shareholders Overview Business Highlights Sustainability Our People Financial Reports Governance
Notes to the Consolidated Financial Statements
Barry Callebaut | Annual Report /
The following table presents the adjustments recognized for each individual position of the Consolidated Balance Sheet. Balance sheet positions, which were not affected by the application of the new requirements, have not been included.
Consolidated Balance Sheet Impact
Aug 31, 2018 Transition adjustment
Sep 1, 2018
in millions of CHF Inventories3 1,477 336 1,813 Total current assets 3,327 336 3,663 Deferred tax assets3 66 1 67 Total non-current assets 2,505 1 2,507 Total assets 5,832 337 6,170 Trade payables and other current liabilities3 1,121 7 1,128 Short-term debt3 285 335 620 Total current liabilities 2,153 342 2,495 Total liabilities 3,547 342 3,888 Retained earnings and other reserves3 2,270 (4) 2,266 Total equity attributable to the shareholders of the parent company
2,270 (4) 2,266
Total equity 2,286 (4) 2,281 Total liabilities and equity 5,832 337 6,170
3 Transfer of control refer to page 51.
The IFRS 15 adoption had a minor effect on the Group’s Retained earnings. The opening balance adjustment to Inventories included intercompany profit margins of CHF –5.4 million, which had to be eliminated. The deferred tax income related to this item amounted to CHF 1.3 million. Both elements had a net negative effect on the Group’s Retained earnings of CHF –4.1 million.
Retained Earnings Impact
in millions of CHF Total Retained earnings as of August 31, 2018 2,925 Elimination of intercompany profits3 (5) Deferred tax assets3 1 Opening balance Retained earnings as of September 1, 2018 2,921
3 Transfer of control refer to page 51.
Consolidated Cash Flow Statement Impact The cumulative effect method applied in the adoption of IFRS 15 resulted in adjustments to the opening Balance Sheet as of September 1, 2018. As there has been no change in timing of revenue recognition, the Group’s Consolidated Cash Flow Statement for the period ended August 31, 2019, has not been affected by the transition to IFRS 15.

Letter to Shareholders Overview Business Highlights Sustainability Our People Financial Reports Governance
Notes to the Consolidated Financial Statements
Barry Callebaut | Annual Report /
Revenue recognition – accounting policies applied from September 1, 2018 The details of the new significant accounting policies and the nature of the changes to previous accounting policies in relation to the Group’s main Product Groups are set out below.
The amount of revenues in the cocoa and chocolate industry is highly dependent on the prices of cocoa and other commodities. Therefore, the price-setting mechanism is mainly based on the cost-plus model. The Group’s commercial agreements with customers follow either of the below commercial background scenarios:
Type of commercial agreement
Commercial principle
Contract business Scenario 1: Partnership agreements
Typical for commercial transactions with Group's significant global customers. The Group enters into long-term agreements up to 10 years. A framework agreement between the Group and the customer governs the conduct of business, defines payment terms, rights to goods and services and typically includes legally enforceable annual volume purchase commitments. Legally enforceable firm purchase commitments are agreed for delivery periods of typically 3 months. Scenario 2: Umbrella agreements Typical for commercial transactions with the Group's significant regional or local customers. The Group enters into mid-term agreement of 3–5 years. An umbrella agreement governs the conduct of business, defines payment terms and rights to goods and services, but does not include any legally binding volume commitments. Legally enforceable firm purchase commitments are agreed for delivery periods of typically 3 and up to 6 months. Scenario 3: Volume agreements Typical for commercial transactions with Group's regional or local customers. The customer commits to legally enforceable firm purchase commitments for certain volumes of specified goods. The conduct of business is governed by Group's general terms and conditions.
Price List business Based on forecasted sales and raw materials prices, the Group establishes a price list for the products in its portfolio. The price list then applies to spot sales for a period of typically 6 months and up to 1 year.
Revenues from sales of goods and services represent the net sales revenue from raw materials, semi-processed and processed goods transferred to customers and for services related to food processing. Revenue is measured based on the contractually agreed transaction price at the amount, which the Group expects to receive in exchange for transferring promised goods or services to the customer. Revenue is recognized at the point in time, when control of the goods has been transferred to the customer which is upon delivery of the goods, according to the applicable Incoterms. Appropriate provisions are made for all additional costs to be incurred in connection with the sales, including the cost related to returns of goods, which do not meet agreed specifications and quality-related claims.
In some cases, the Group may sell highly customized products to customers, for which the Group has no alternative use. In accordance with the underlying standard, the revenue recognition for these goods is “over time”. The revenue is measured based on the output method “units delivered”. However, this does not represent a change in the timing of revenue recognition compared to the prior standard.
Under the prior standard the guiding principle for revenue recognition was “transfer of risks and rewards”. Due to the Group’s business model the point in time of “transfer of control” is identical with the point in time of “transfer of risks and rewards”.
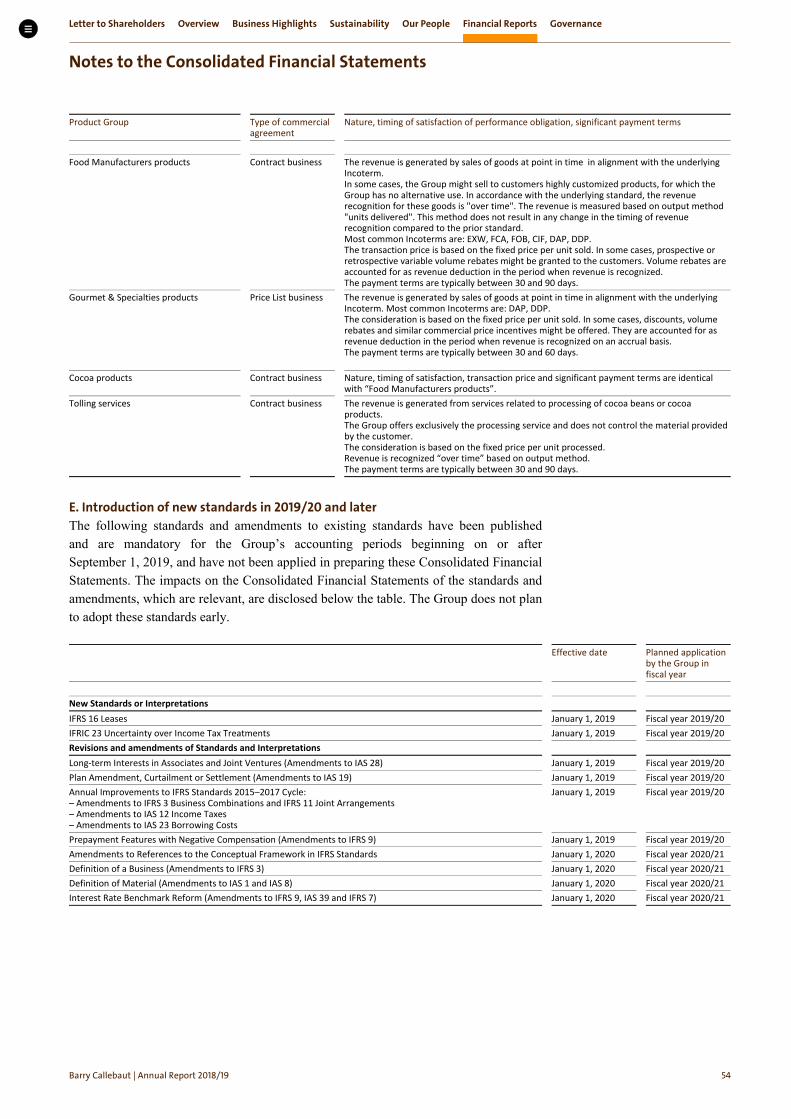
Letter to Shareholders Overview Business Highlights Sustainability Our People Financial Reports Governance
Notes to the Consolidated Financial Statements
Barry Callebaut | Annual Report /
Product Group Type of commercial agreement
Nature, timing of satisfaction of performance obligation, significant payment terms
Food Manufacturers products Contract business The revenue is generated by sales of goods at point in time in alignment with the underlying
Incoterm. In some cases, the Group might sell to customers highly customized products, for which the Group has no alternative use. In accordance with the underlying standard, the revenue recognition for these goods is "over time". The revenue is measured based on output method "units delivered". This method does not result in any change in the timing of revenue recognition compared to the prior standard. Most common Incoterms are: EXW, FCA, FOB, CIF, DAP, DDP. The transaction price is based on the fixed price per unit sold. In some cases, prospective or retrospective variable volume rebates might be granted to the customers. Volume rebates are accounted for as revenue deduction in the period when revenue is recognized. The payment terms are typically between 30 and 90 days.
Gourmet & Specialties products Price List business
The revenue is generated by sales of goods at point in time in alignment with the underlying Incoterm. Most common Incoterms are: DAP, DDP. The consideration is based on the fixed price per unit sold. In some cases, discounts, volume rebates and similar commercial price incentives might be offered. They are accounted for as revenue deduction in the period when revenue is recognized on an accrual basis. The payment terms are typically between 30 and 60 days.
Cocoa products Contract business
Nature, timing of satisfaction, transaction price and significant payment terms are identical with “Food Manufacturers products”.
Tolling services Contract business
The revenue is generated from services related to processing of cocoa beans or cocoa products. The Group offers exclusively the processing service and does not control the material provided by the customer. The consideration is based on the fixed price per unit processed. Revenue is recognized “over time” based on output method. The payment terms are typically between 30 and 90 days.
E. Introduction of new standards in / and later The following standards and amendments to existing standards have been published and are mandatory for the Group’s accounting periods beginning on or after September 1, 2019, and have not been applied in preparing these Consolidated Financial Statements. The impacts on the Consolidated Financial Statements of the standards and amendments, which are relevant, are disclosed below the table. The Group does not plan to adopt these standards early.
Effective date
Planned application by the Group in fiscal year
New Standards or Interpretations IFRS 16 Leases January 1, 2019 Fiscal year 2019/20 IFRIC 23 Uncertainty over Income Tax Treatments January 1, 2019 Fiscal year 2019/20 Revisions and amendments of Standards and Interpretations Long-term Interests in Associates and Joint Ventures (Amendments to IAS 28) January 1, 2019 Fiscal year 2019/20 Plan Amendment, Curtailment or Settlement (Amendments to IAS 19) January 1, 2019 Fiscal year 2019/20 Annual Improvements to IFRS Standards 2015–2017 Cycle: – Amendments to IFRS 3 Business Combinations and IFRS 11 Joint Arrangements – Amendments to IAS 12 Income Taxes – Amendments to IAS 23 Borrowing Costs
January 1, 2019 Fiscal year 2019/20
Prepayment Features with Negative Compensation (Amendments to IFRS 9) January 1, 2019 Fiscal year 2019/20 Amendments to References to the Conceptual Framework in IFRS Standards January 1, 2020 Fiscal year 2020/21 Definition of a Business (Amendments to IFRS 3) January 1, 2020 Fiscal year 2020/21 Definition of Material (Amendments to IAS 1 and IAS 8) January 1, 2020 Fiscal year 2020/21 Interest Rate Benchmark Reform (Amendments to IFRS 9, IAS 39 and IFRS 7) January 1, 2020 Fiscal year 2020/21

Letter to Shareholders Overview Business Highlights Sustainability Our People Financial Reports Governance
Notes to the Consolidated Financial Statements
Barry Callebaut | Annual Report /
IFRS 16 – Leases The new lease accounting standard was issued on January 13, 2016, and will replace “IAS 17 – Leases”, “IFRIC 4 – Determing whether an Arrangement contains a Lease”, “SIC-15 – Operating Leases – Incentive” and “SIC-27 – Evaluating the Substance of Transactions in the Legal Form of a Lease”. The Group adopts “IFRS 16 – Leases” with effect from September 1, 2019. The new accounting standard requires the recognition of a lease liability and a corresponding right-of-use asset in the balance sheet for the majority of leases in which the company is the lessee. The nature of expenses related to those leases will change, as the Group will recognize depreciation expenses for right-of-use assets and interest expenses for lease liabilities. Previously, the Group recognized operating lease expense on a straight-line basis over the lease term. Assets and liabilities were only recognized to the extent that there was a timing difference between actual lease payments amd the expense recognized. In the current cash flow statement, lease payments are presented as cash flows from operating activities. Under IFRS 16, lease payments will be reflected as cash flows from financing activities. Interest payments will continue to be reported as cash flows from operating activities.
The Group enters lease arrangements mainly for land, warehouses, offices, factory facilities and motor vehicles. The Group will apply the modified retrospective method, with right-of-use assets measured at an amount equal to the lease liability, adjusted by the amount of prepaid or accrued lease payments recognized in the balance sheet immediately before the date of initial application, and will not restate prior years.
The undiscounted future operating lease commitments disclosed in the Consolidated Financial Statements 2018/19 amount to CHF 150.8 million (see Note 3.6 – “Capital and lease commitments & guarantees”). This includes short-term leases as well as low-value asset leases that will be recognized on a straight-line basis as an expense in the income statement under IFRS 16. For the remaining lease commitments, the group expects to recognize lease liabilities and leased assets in the range of CHF 180 to CHF 200 million. This does not include assets and liabilities under finance lease agreements in the amount of CHF 4.7 million and CHF 1.2 million (see Note 3.5.4 – “Obligations under finance leases”). Furthermore, operating expenses will decrease by approximately CHF 3 million and finance expenses will increase by approximately CHF 5 million in the year of initial application. No impact is expected on equity as of September 1, 2019.
IFRIC 23 – Uncertainty over Income Tax Treatments “IFRIC 23 – Uncertainty over Income Tax Treatments” includes requirements that improve the consistency and transparency of accounting for uncertain income tax treatments.
The Group will adopt IFRIC 23 for the financial year starting September 1, 2019. Uncertain tax positions in the Group have been identified and the most appropriate provisions have been measured based on the best estimated and most likely single outcome or on the expected value based on the weighted average approach. The underlying assumption that the tax authorities have full knowledge of all relevant information has been considered. Based on the provisions for uncertain tax positions applied for fiscal year 2018/2019, the Group does not expect a material impact on the effective tax rate of the Group's Consolidated Financial Statements from the implementation of IFRIC 23 in fiscal year 2019/20.
Any adjustments to the existing current and deferred tax assets and liabilities resulting from the transition to IFRIC 23 as per September 1, 2019, will be reflected as an adjustment to the opening equity for fiscal year 2019/20 and the corresponding adjustments will be reflected in the respective current or deferred tax assets and liabilities to which the changes in measurements for uncertain tax positions relate.

Letter to Shareholders Overview Business Highlights Sustainability Our People Financial Reports Governance
Notes to the Consolidated Financial Statements
Barry Callebaut | Annual Report /
Operating Performance
. Revenues The Group has adopted IFRS 15 – Revenue from contracts with customers from September 1, 2018. Details on the new significant accounting policies and the nature of the changes to previous accounting policies in relation to the Group’s main product groups are set out in the section “D. Introduction of new standards in 2018/19” of the Notes to the Consolidated Financial Statements.
. Segment information External segment reporting is based on the internal organizational and management structure, as well as on the internal information reviewed regularly by the Chief Operating Decision Maker. Barry Callebaut’s Chief Operating Decision Maker has been identified as the Executive Committee.
The Executive Committee manages the business from a geographic view. Hence, Presidents were appointed for each region. Since the Group’s cocoa activities operate independently from the Regions, the Global Cocoa business is reviewed by the Chief Operating Decision Maker as an own segment in addition to the geographical Regions EMEA (Europe, Middle East and Africa), Americas and Asia Pacific. Furthermore, the Executive Committee also views the Corporate functions independently. The function “Corporate” consists mainly of headquarter services (including the Group’s centralized Treasury department) to other segments. Thus, the Group reports Corporate separately.
The segment Global Cocoa is responsible for the procurement of ingredients for chocolate production (mainly cocoa; sugar, dairy and nuts are also common ingredients) and the Group’s cocoa-processing business. Approximately 55% of the revenues of Global Cocoa are generated with the other segments of the Group.
The regional chocolate businesses consist of chocolate production related to the Product Groups “Food Manufacturers” focusing on industrial customers and “Gourmet & Specialties” focusing on products for artisans and professional users of chocolate such as chocolatiers, pastry chefs or bakers as well as products for vending machines.
Financial information by reportable segments
2018/19 in thousands of CHF
EMEA
Americas
Asia Pacific
Global Cocoa
Total segments
Corporate Eliminations
Group
Revenue from external customers 3,086,777 1,866,077 407,601 1,948,581 7,309,036 – – 7,309,036 Revenue from transactions with other operating segments of the Group
134,274
3,295
91
2,368,943
2,506,603
–
(2,506,603)
–
Revenue from sales and services 3,221,051 1,869,372 407,692 4,317,524 9,815,639 – (2,506,603) 7,309,036 Operating profit (EBIT) 359,480 189,374 53,493 100,802 703,149 (101,961) – 601,188 Depreciation and amortization (63,120) (42,676) (9,776) (55,965) (171,537) (2,323) – (173,860) Impairment (1,223) (364) – (793) (2,380) (144) – (2,524) Interest income 10,644 10,644 Interest expense (137,806) (137,806) Total assets 1,976,881 1,116,979 235,294 3,059,740 6,388,894 556,796 (437,558) 6,508,132 Additions to property, plant, equipment and intangible assets, excluding acquisitions of subsidiaries/businesses
(98,718)
(63,622)
(16,117)
(98,370)
(276,827)
(1,019)
–
(277,846)

Letter to Shareholders Overview Business Highlights Sustainability Our People Financial Reports Governance
Notes to the Consolidated Financial Statements
Barry Callebaut | Annual Report /
2017/18 in thousands of CHF
EMEA
Americas
Asia Pacific
Global Cocoa
Total segments
Corporate Eliminations
Group
Revenue from external customers 3,072,528 1,700,610 370,026 1,805,246 6,948,411 – – 6,948,411 Revenue from transactions with other operating segments of the Group1
122,179
510
–
2,024,057
2,146,746
–
(2,146,746)
–
Revenue from sales and services 3,194,707 1,701,120 370,026 3,829,303 9,095,157 – (2,146,746) 6,948,411 Operating profit (EBIT) 351,954 173,399 46,587 84,816 656,756 (102,732) – 554,024 Depreciation and amortization (62,303) (40,242) (10,450) (57,899) (170,894) (3,354) – (174,248) Impairment (1,129) (140) – (5,730) (6,999) (12) – (7,011) Interest income 6,368 6,368 Interest expense (89,638) (89,638) Total assets1 1,666,841 1,122,088 229,311 2,864,791 5,883,031 554,285 (605,274) 5,832,042 Additions to property, plant, equipment and intangible assets, excluding acquisitions of subsidiaries/businesses
(72,986)
(55,006)
(13,207)
(76,575)
(217,774)
(2,279)
–
(220,053)
1 As a result of a Group finance operational excellence project aimed at harmonization and automation, the segment reporting structure has changed to better reflect the Group's intersegment revenues and total assets. The fiscal year 2017/18 comparatives were adjusted for comparability.
Global Cocoa comprises Group-wide sourcing and Global Cocoa processing functions for the benefit of all the regions. Therefore, the major part of its operating profit (EBIT) is allocated to the regions.
Segment revenue, segment results (operating profit) and segment assets are measured based on IFRS principles.
Finance income and expense, the Group’s share of result of equity-accounted investees and income taxes are not allocated to the respective segment for internal management purposes.
Additional entity-wide disclosures Information on geographical regions Barry Callebaut is domiciled in Switzerland, however, its major revenues are generated in other countries. The following table shows revenues reported based on the geographic location of customers and non-current assets other than financial instruments, deferred tax assets, employee benefit assets.
2018/19 2017/18 2018/19 2017/18 in thousands of CHF Revenue Non-current assets US 1,376,449 1,204,923 390,463 392,804 Germany 502,727 490,277 85,089 87,222 UK 461,950 441,932 47,606 43,252 Belgium 439,929 450,367 480,588 448,086 France 429,903 465,099 74,869 75,258 Mexico 407,361 354,035 17,660 18,670 Brazil 395,753 376,338 75,566 82,365 Italy 303,976 304,187 84,298 88,227 Switzerland 65,848 48,366 43,527 46,349 Rest of Europe 1,734,267 1,510,583 540,926 471,853 Rest of Americas 346,183 527,287 156,438 142,820 Asia Pacific 844,690 775,017 545,118 532,963 Total 7,309,036 6,948,411 2,542,148 2,429,869

Letter to Shareholders Overview Business Highlights Sustainability Our People Financial Reports Governance
Notes to the Consolidated Financial Statements
Barry Callebaut | Annual Report /
Information on Product Groups The Group has numerous products that are sold to external customers. Therefore, for internal review by the Chief Operating Decision Maker, information on products is aggregated on a Product Group level. The following table breaks down external revenues into Product Groups:
Segment Information by Product Group
in thousands of CHF 2018/19 2017/18 Cocoa Products 1,948,581 1,805,246 Food Manufacturers 4,200,619 3,979,929 Gourmet & Specialties 1,159,836 1,163,236 Revenue from external customers 7,309,036 6,948,411
In fiscal year 2018/19, the biggest single customer contributed CHF 761.0 million or 10.4 % of total revenues reported across various regions (2017/18: CHF 755.4 million or 10.9%). No other single customer contributed more than 10% of total consolidated revenue. Accounting policies
Segment reporting
Operating segments are reported in a manner consistent with the internal reporting provided to the Chief Operating Decision Maker. The Chief Operating Decision Maker, who is responsible for allocating resources and assessing performance of the operating segments, has been identified as the Group’s Executive Committee, consisting of the Group Chief Executive Officer, the Chief Financial Officer and the Presidents of the Regions Europe, Americas and Global Cocoa as well as the Chief Operations Officer, the Chief Innovation & Quality Officer and the Chief Human Resources Officer.
. Research and Development expenses
in thousands of CHF 2018/19 2017/18 Total Research and Development expenses (30,029) (28,635)
Research and Development expenses not qualifying for capitalization are directly charged to the Consolidated Income Statement and are reported under “Marketing and sales expenses” and “General and administration expenses”. The part qualifying for capitalization is reported as addition under internally generated assets in Note 2.2 – “Intangible assets”.

Letter to Shareholders Overview Business Highlights Sustainability Our People Financial Reports Governance
Notes to the Consolidated Financial Statements
Barry Callebaut | Annual Report /
. Other income and expense
Composition of other income in thousands of CHF 2018/19 2017/18 Group training centers, museums, outlets and rental income 4,377 5,999 Sale of shells of cocoa beans, waste and sundry sales 11,008 7,822 Litigations, claims and insurance 5,815 3,344 Release of unused provisions (Note 2.6) 298 389 Income from government grants 4,452 – Other 3,570 2,041 Total other income 29,520 19,595
In the fiscal year 2018/19, the gain on disposal of property, plant and equipment in the amount of CHF 0.2 million (2017/18: CHF 0.6 million) was netted against the loss on disposal of property, plant and equipment presented in the table “Composition of other expense”.
Composition of other expense in thousands of CHF 2018/19 2017/18 Restructuring costs – (65) Litigations and claims, including government claims (11,015) (6,356) Loss on sale of property, plant and equipment (1,241) (7,479) Impairment of property, plant and equipment (Note 2.1) (1,240) (5,655) Impairment of intangibles (Note 2.2) (1,284) (1,356) Impairment of financial instruments (3,095) (4,018) Acquisition related costs (Note 5.1) (1,270) (425) Other (5,939) (6,302) Total other expense (25,084) (31,655)
Other expenses include costs related to loss on sale of waste and asset dismantling costs.

Letter to Shareholders Overview Business Highlights Sustainability Our People Financial Reports Governance
Notes to the Consolidated Financial Statements
Barry Callebaut | Annual Report /
Operating Assets and Liabilities
. Property, plant and equipment
2018/19
Land and buildings
Plant and machinery
Office equipment, furniture and
motor vehicles
Under construction
Total
in thousands of CHF At cost
as of September 1, 2018 589,088 1,875,655 161,481 140,298 2,766,523 Business combinations 2,524 8,558 270 154 11,506 Additions1 19,697 80,606 6,417 109,910 216,630 Disposals (2,082) (5,254) (4,620) (2,055) (14,011) Currency translation adjustments (10,191) (29,118) (2,279) (1,668) (43,256) Reclassifications from under construction 22,536 102,036 4,039 (128,611) – Other reclassifications2 55,783 (30,673) (24,782) (6,907) (6,579) as of August 31, 2019 677,355 2,001,810 140,526 111,122 2,930,813 Accumulated depreciation and impairment losses
as of September 1, 2018 240,131 1,004,628 100,851 28 1,345,638 Depreciation 22,711 97,762 11,673 – 132,146 Impairment (Note 1.4) – 1,165 74 – 1,240 Disposals (1,623) (3,808) (2,368) – (7,800) Currency translation adjustments (4,709) (18,088) (2,404) – (25,202) Other reclassifications2 36,739 (43,162) (7,666) – (14,088) as of August 31, 2019 293,249 1,038,497 100,161 28 1,431,935 Net as of August 31, 2019 384,106 963,313 40,365 111,094 1,498,878
1 Cash outflow amounted to CHF 218.4 million. CHF 1.8 million is related to purchases of property, plant and equipment that were acquired in the prior period. 2 During fiscal year 2018/19, a Group finance operational excellence project aimed at harmonization and automation was conducted that resulted in
reclassifications within "Property, plant and equipment" and "Intangible assets" categories. The net book value of CHF -7.5 million was transferred from "Property, plant and equipment" to "Intangible assets".

Letter to Shareholders Overview Business Highlights Sustainability Our People Financial Reports Governance
Notes to the Consolidated Financial Statements
Barry Callebaut | Annual Report /
2017/18
Land and buildings
Plant and machinery
Office equipment, furniture and
motor vehicles
Under construction
Total
in thousands of CHF At cost as of September 1, 2017 562,752 1,762,896 146,226 148,312 2,620,187 Business combinations 14,421 9,809 16,297 2,004 42,531 Additions1 17,919 87,911 9,492 67,620 182,942 Disposals (5,654) (11,230) (6,897) (220) (24,001) Currency translation adjustments (18,038) (24,148) (3,513) (4,615) (50,315) Reclassifications from under construction 17,688 50,118 4,958 (72,764) – Other reclassifications2 – 300 (5,082) (40) (4,822) as of August 31, 2018 589,088 1,875,655 161,481 140,298 2,766,523 Accumulated depreciation and impairment losses
as of September 1, 2017 216,731 922,041 95,615 28 1,234,415 Depreciation 20,359 92,586 13,668 – 126,613 Impairment (Note 1.4) 1,657 3,581 417 – 5,655 Disposals (1,874) (4,173) (6,053) – (12,100) Currency translation adjustments 3,258 (11,748) (1,453) – (9,944) Other reclassifications2 – 2,342 (1,342) – 1,000 as of August 31, 2018 240,131 1,004,628 100,851 28 1,345,638 Net as of August 31, 2018 348,957 871,027 60,630 140,270 1,420,885
1 Cash outflow amounted to CHF 180.8 million. CHF 2.1 million related to purchase of property, plant and equipment have not been settled with the supplier. 2 Reclassified to “Intangible assets”.
The Group periodically reviews the remaining useful lives of assets recognized in property, plant and equipment.
Impairment losses of CHF 1.2 million were recognized in property, plant and equipment in fiscal year 2018/19 (2017/18: CHF 5.7 million).
Repair and maintenance expenses for the fiscal year 2018/19 amounted to CHF 84.8 million (2017/18: CHF 69.3 million).
As at August 31, 2019, assets held under finance leases amounted to CHF 4.7 million (2018: CHF 5.7 million). The related liabilities are reported under Note 3.5.4 – “Obligations under finance leases”.
As at August 31, 2019, no non-currents assets were pledged as security for financial liabilities (2018: CHF 0.1 million).

Letter to Shareholders Overview Business Highlights Sustainability Our People Financial Reports Governance
Notes to the Consolidated Financial Statements
Barry Callebaut | Annual Report /
Accounting policies Property, plant and equipment
Property, plant and equipment is measured at the acquisition or construction cost less accumulated depreciation and accumulated impairment losses. A straight-line method of depreciation is applied through the estimated useful life.
Estimated useful lives of major classes of depreciable assets are:
Buildings (including warehouses and installations)
20 to 50 years Plant and machinery
10 to 20 years
Office equipment, furniture and motor vehicles
3 to 10 years
Maintenance and repair expenditures are charged to the income state-ment as incurred.
The carrying amounts of property, plant and equipment are reviewed at least at each reporting date to assess whether they are recoverable in the form of future economic benefits. If the recoverable amount of an asset has declined below its carrying amount, an impairment loss is recognized to reduce the value of the assets to its recoverable amount. In determining the recoverable amount of the assets, expected cash flows are discounted to their present value.
Borrowing costs
Borrowing costs related to the acquisition, construction, or production of a qualifying asset are capitalized in accordance with IAS 23. A qualifying asset is an asset that necessarily takes a substantial period of time in order to use or sell it as intended by the Group management.

Letter to Shareholders Overview Business Highlights Sustainability Our People Financial Reports Governance
Notes to the Consolidated Financial Statements
Barry Callebaut | Annual Report /
. Intangible assets
2018/19
Goodwill
Brand names and licenses
Internally generated
intangible assets
Other
Total
in thousands of CHF At cost
as of September 1, 2018 830,974 78,700 432,917 39,917 1,382,509 Business combination 31,565 525 – – 32,091 Additions – 47 34,144 27,024 61,216 Disposals – (20) (773) (399) (1,192) Currency translation adjustments (3,024) (800) (9,784) (1,901) (15,510) Other reclassifications¹ 114 (6,632) 13,693 (5,711) 1,465 as of August 31, 2019 859,630 71,821 470,197 58,931 1,460,579 Accumulated amortization and impairment losses
as of September 1, 2018 – 57,745 304,446 28,808 390,998 Amortization – 3,457 33,678 4,579 41,714 Impairment (Note 1.4) – 16 778 490 1,284 Disposals – (16) (206) (141) (362) Currency translation adjustments – (694) (7,037) (630) (8,361) Other reclassifications¹ – (2,763) 12,396 (659) 8,974 as of August 31, 2019 – 57,745 344,055 32,448 434,248 Net as of August 31, 2019 859,630 14,076 126,142 26,482 1,026,331
1 During fiscal year 2018/19, a Group finance operational excellence project aimed at harmonization and automation was conducted that resulted in reclassifications within "Property, plant and equipment" and "Intangible assets" categories. The net book value of CHF –7.5 million was transferred from "Property, plant and equipment" to "Intangible assets".
2017/18
Goodwill
Brand names and licenses
Internally generated
intangible assets
Other
Total
in thousands of CHF At cost
as of September 1, 2017 760,813 73,500 407,836 37,216 1,279,366 Business combination 74,404 7,060 – 1,107 82,571 Additions – 132 33,353 3,626 37,111 Disposals – (1,563) (6,595) (484) (8,642) Currency translation adjustments (4,243) (429) (4,983) (3,063) (12,718) Other reclassifications¹ – – 3,307 1,516 4,822 as of August 31, 2018 830,974 78,700 432,917 39,917 1,382,509 Accumulated amortization and impairment losses
as of September 1, 2017 – 56,322 272,027 24,867 353,216 Amortization – 2,883 40,191 4,561 47,635 Impairment (Note 1.4) – – 1,331 25 1,356 Disposals – (1,247) (3,561) (104) (4,911) Currency translation adjustments – (213) (4,507) (578) (5,298) Reclassified from under development – – (1,035) 37 (1,000) as of August 31, 2018 – 57,745 304,446 28,808 390,998 Net as of August 31, 2018 830,974 20,955 128,471 11,110 991,510
1 Reclassified from “Property, plant and equipment”.
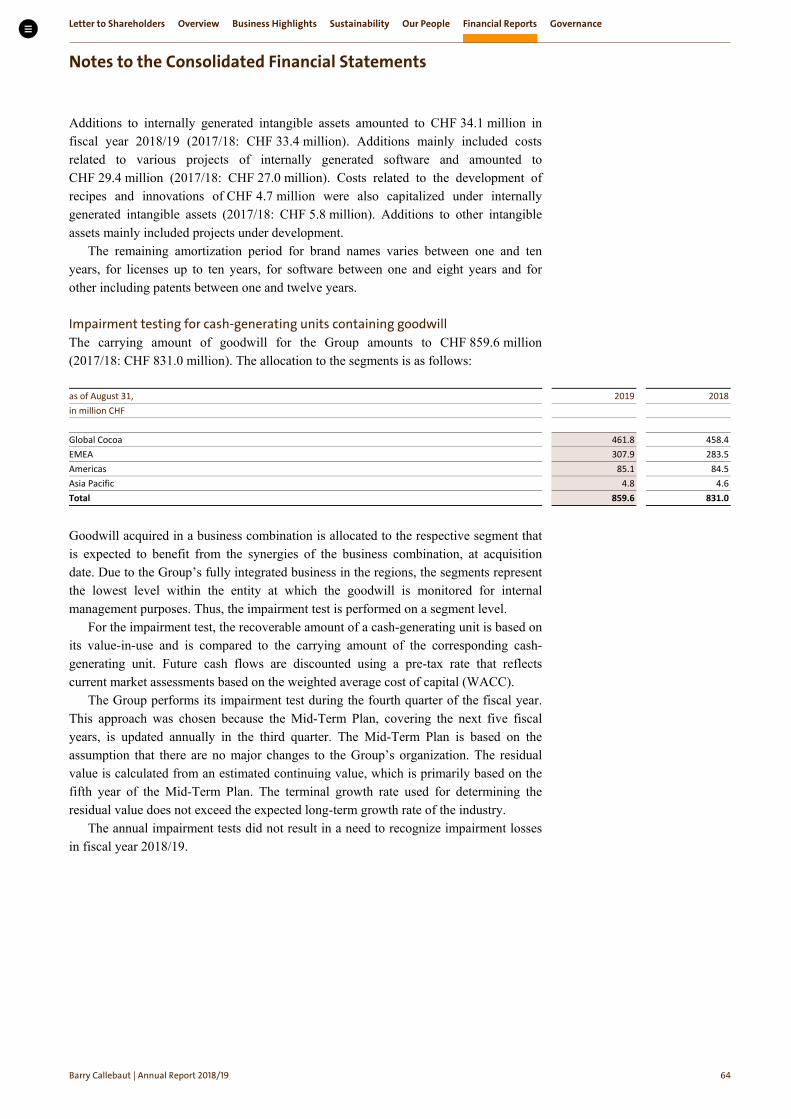
Letter to Shareholders Overview Business Highlights Sustainability Our People Financial Reports Governance
Notes to the Consolidated Financial Statements
Barry Callebaut | Annual Report /
Additions to internally generated intangible assets amounted to CHF 34.1 million in fiscal year 2018/19 (2017/18: CHF 33.4 million). Additions mainly included costs related to various projects of internally generated software and amounted to CHF 29.4 million (2017/18: CHF 27.0 million). Costs related to the development of recipes and innovations of CHF 4.7 million were also capitalized under internally generated intangible assets (2017/18: CHF 5.8 million). Additions to other intangible assets mainly included projects under development.
The remaining amortization period for brand names varies between one and ten years, for licenses up to ten years, for software between one and eight years and for other including patents between one and twelve years.
Impairment testing for cash-generating units containing goodwill The carrying amount of goodwill for the Group amounts to CHF 859.6 million (2017/18: CHF 831.0 million). The allocation to the segments is as follows:
as of August 31, 2019 2018 in million CHF Global Cocoa 461.8 458.4 EMEA 307.9 283.5 Americas 85.1 84.5 Asia Pacific 4.8 4.6 Total 859.6 831.0
Goodwill acquired in a business combination is allocated to the respective segment that is expected to benefit from the synergies of the business combination, at acquisition date. Due to the Group’s fully integrated business in the regions, the segments represent the lowest level within the entity at which the goodwill is monitored for internal management purposes. Thus, the impairment test is performed on a segment level.
For the impairment test, the recoverable amount of a cash-generating unit is based on its value-in-use and is compared to the carrying amount of the corresponding cash-generating unit. Future cash flows are discounted using a pre-tax rate that reflects current market assessments based on the weighted average cost of capital (WACC).
The Group performs its impairment test during the fourth quarter of the fiscal year. This approach was chosen because the Mid-Term Plan, covering the next five fiscal years, is updated annually in the third quarter. The Mid-Term Plan is based on the assumption that there are no major changes to the Group’s organization. The residual value is calculated from an estimated continuing value, which is primarily based on the fifth year of the Mid-Term Plan. The terminal growth rate used for determining the residual value does not exceed the expected long-term growth rate of the industry.
The annual impairment tests did not result in a need to recognize impairment losses in fiscal year 2018/19.

Letter to Shareholders Overview Business Highlights Sustainability Our People Financial Reports Governance
Notes to the Consolidated Financial Statements
Barry Callebaut | Annual Report /
The key sensitivities in the impairment test are the WACC as well as the terminal growth rate. Key assumptions used for value-in-use calculations
2019 2018 Discount rate Terminal growth rate Discount rate Terminal growth rate Global Cocoa 9.0% 1.4% 8.3% 1.2% EMEA 7.8% 1.2% 6.7% 0.9% Americas 8.4% 1.1% 7.3% 0.6% Asia Pacific 8.1% 3.0% 6.6% 3.5%
The Group has carried out a sensitivity analysis, containing various scenarios. Taking reasonable possible changes in key assumptions into account, no impairment losses have been revealed.
Accounting policies Goodwill
Goodwill on acquisitions is the excess of acquisition date fair value of the total consideration transferred plus the recognized amount of any non-controlling interest in the acquiree and the acquisition date fair value of assets acquired, liabilities and contingent liabilities assumed. Following the initial recognition, goodwill is measured at cost less any accumulated impairment losses. Goodwill is reviewed for impairment annually on the same date or more frequently if events or changes in circumstances indicate that the carrying value may be impaired. Negative goodwill is recognized directly in the Consolidated Income Statement.
At the acquisition date, any acquired goodwill is allocated to each of the cash-generating units (CGU). The Group defines its CGU for goodwill impairment testing based on the way that it monitors and derives economic benefits from the acquired goodwill. The impairment tests are performed by comparing the carrying value of the assets of these CGU with their recoverable amount, based on their value in use, which corresponds to their future projected cash flows discounted at an appropriate pre-tax rate of return. The cash flows correspond to estimates made by Group Management in financial plans and business strategies covering a period of five years after making adjustments to consider the assets in their current condition. They are then projected to perpetuity using a multiple which corresponds to a steady growth rate. The Group assesses the uncertainty of these estimates by making sensitivity analyses. Where the recoverable amount of the CGU is less than the carrying amount, an impairment loss is recognized.
Research and Development costs
Research costs are expensed as incurred.
Development costs for projects related to recipes and product innovations are capitalized as an intangible asset if it can be dem- onstrated that the project is expected to generate future economic benefits, if it is probable that those future economic benefits will flow to the entity and the costs of the asset can be measured reliably. Development costs previously recognized as an expense are not re- cognized as an asset in a subsequent period. Development costs that have been capitalized are amortized on a straight-line basis over the period of their expected useful life. The amortization periods adopted do not exceed five years.

Letter to Shareholders Overview Business Highlights Sustainability Our People Financial Reports Governance
Notes to the Consolidated Financial Statements
Barry Callebaut | Annual Report /
Brand names, licenses and other intangible assets
Other acquired intangible assets include brand names, licenses, customer relationships, patents and trademarks, software and projects to improve the processes. Patents and licenses are amortized over their period of validity. All other intangible assets are amortized on a straight-line basis over their anticipated useful life not exceeding 10 years. The amortization charge is included in the positions “General and administration expenses” and “Cost of goods sold” in the Consolidated Income Statement.
. Inventories
as of August 31, 2019 2018 in thousands of CHF Cocoa beans stocks 693,036 458,322 Semi-finished and finished products 908,770 802,070 Other raw materials and packaging materials 201,868 216,275 Total inventories 1,803,674 1,476,667
In connection with the IFRS 15 transition as of September 1, 2018, an adjustment to the opening balance of cocoa bean stocks in the amount of CHF 336.0 million has been made. Considering this adjustment the value of inventories remained on the same level. For further details about the IFRS 15 transition refer to “Introduction of new standards in 2018/19; IFRS 15 – Revenue from Contracts with Customers”.
As at August 31, 2019, the value of cocoa and chocolate inventories designated in a hedging relationship amounted to CHF 1,063.2 million (2018: CHF 691.0 million), on which a fair value hedge adjustment of CHF –60.8 million was recorded (2018: CHF –4.3 million). The increase of inventories designated in a hedging relationship as well as the decrease of fair value adjustment are mainly attributable to volume effects. For further detail about the hedged inventories refer to Note 3.7.9 – “Effect of hedge accounting on the financial position and performance”.
In 2018/19, materials used of CHF 5,108.9 million (2017/18: CHF 4,821.0 million) were recognized as an expense during the year and included in “Cost of goods sold”.
In fiscal year 2018/19, inventory write-downs of CHF 44.6 million were recognized as expenses (2017/18: CHF 33.5 million).
There were no inventories pledged in fiscal years 2018/19 and 2017/18.
Accounting policies Inventories
Inventories are measured at the lower of cost and net realizable value. The cost of inventories comprises the costs of materials, direct production costs including labor costs and an appropriate proportion of production overheads and factory depreciation. Those inventories that are allocated as hedged items in a fair value hedge relationship are adjusted for the change in the fair value attributable to the hedged cocoa price risk.
For movements in inventories, the average cost method is applied. Net realizable value is defined as the estimated selling price less costs of completion, direct selling and distribution expenses.

Letter to Shareholders Overview Business Highlights Sustainability Our People Financial Reports Governance
Notes to the Consolidated Financial Statements
Barry Callebaut | Annual Report /
. Trade receivables and other current assets
as of August 31, 2019 2018 in thousands of CHF Trade receivables 449,196 475,246 Accrued income 32,689 33,124 Loans and other receivables 63,945 47,804 Other current financial assets 18,823 10,410 Receivables representing financial assets 564,653 566,585 Prepayments 72,443 96,250 Other current non-financial assets 1,540 1,268 Other tax receivables and receivables from government 177,147 247,802 Other receivables 251,130 345,320 Total trade receivables and other current assets 815,783 911,904
The Group runs asset-backed securitization programs, whereby trade receivables are sold at their nominal value minus a discount in exchange for cash. The amount of the receivables sold net of discounts as at August 31, 2019, was CHF 365.4 million (2018: CHF 354.4 million). This amount was derecognized from the balance sheet. The amount is the combination of the gross value of the receivables sold of CHF 380.7 million (CHF 376.9 million as of August 31, 2018) and the discount applicable of CHF 15.3 million (CHF 22.5 million as of August 31, 2018).
Net amounts payable to these programs amounted to CHF 71.2 million as at August 31, 2019 (2018: CHF 66.4 million), consisting of the balance of receivables collected before the next rollover date of CHF 86.5 million (2018: CHF 88.9 million), less the discount on receivables sold of CHF 15.3 million (2018: CHF 22.5 million). These amounts are included in Note 2.5 – “Trade payables and other current liabilities” on a net basis.
The discount is retained by the programs to establish a dilution reserve, a yield reserve, and an insurance first loss reserve.
Trade receivables with the fair value of CHF 84.4 million (and CHF 84.6 million nominal amount) as at August 31, 2019 (2018: fair value CHF 111.5 million, nominal amount CHF 111.7 million), are held for realization through sale under the asset-backed securitization programs and are therefore classified as measured at fair value through profit or loss. All other trade receivables, accrued income, loans, other receivables and other current financial assets are measured at amortized cost.
Interest expense paid under the asset-backed securitization programs amounted to CHF 5.3 million in fiscal year 2018/19 (2017/18: CHF 4.7 million) and is reported under interest expenses.
For detailed information about the expected credit losses calculated on the Group’s financial assets measured at amortized cost refer to Note 3.7.4 – “Credit risk and concentration of credit risk”.

Letter to Shareholders Overview Business Highlights Sustainability Our People Financial Reports Governance
Notes to the Consolidated Financial Statements
Barry Callebaut | Annual Report /
Accounting policies Trade receivables
Trade receivables, with the exception of those receivables that are managed under the asset-backed securitization programs, are stated at amortized cost, less lifetime expected credit losses.
The Group maintains asset-backed securitization programs for trade receivables, transferring the contractual rights to the cash flows of third-party trade receivables at their nominal value minus a discount. These receivables are derecognized from the balance sheet. The net amount reported under “Other current assets” or “Other current liabilities” is the amount of the discount minus the receivables already collected at the balance sheet date, but not yet remitted to the asset-purchasing compa-ny. Before being sold, the receivables that are managed under the asset-backed securitization programs are classified as financial assets measured at fair value through profit or loss.
Other financial assets
Other financial assets are the items reported in the lines “Loans and other receivables” and “Other current financial assets”. Other financial assets are classified as measured at amortized cost less expected impairment losses. The Group’s other financial assets have contractual cash flows that are solely principal, and the Group’s interest and business model is to hold these assets to collect contractual cash flows.
All purchases and sales of financial assets are recognized on the trade date. Financial assets are recognized when the Group becomes a party to the contractual provisions and are initially measured at fair value, which represents the transferred consideration, plus transaction costs.
Financial assets are derecognized when the Group loses control of the contractual rights to the cash flows of the assets. Such control is lost when the rights and benefits specified in the contract are realized, expired, or are surrendered.
Allowance for im-pairment losses of financial assets
At each reporting date, the Group recognizes an impairment allowance for financial assets measured at amortized cost.
The impairment allowance represents the Group’s estimates of lifetime expected credit losses, which are the present value of the cash shortfalls over the expected life of the financial assets.
Impairment losses are reflected in the allowance account of the respec-tive financial asset class and recognized in the Consolidated Income Statement as followed:
Financial asset class
Line item in Consolidated Income Statement Cash and cash equivalents
Finance expense
Deposits
Other expense Trade receivables
Revenue from sales and services
Other receivables
Other expense Other financial assets
Other expense
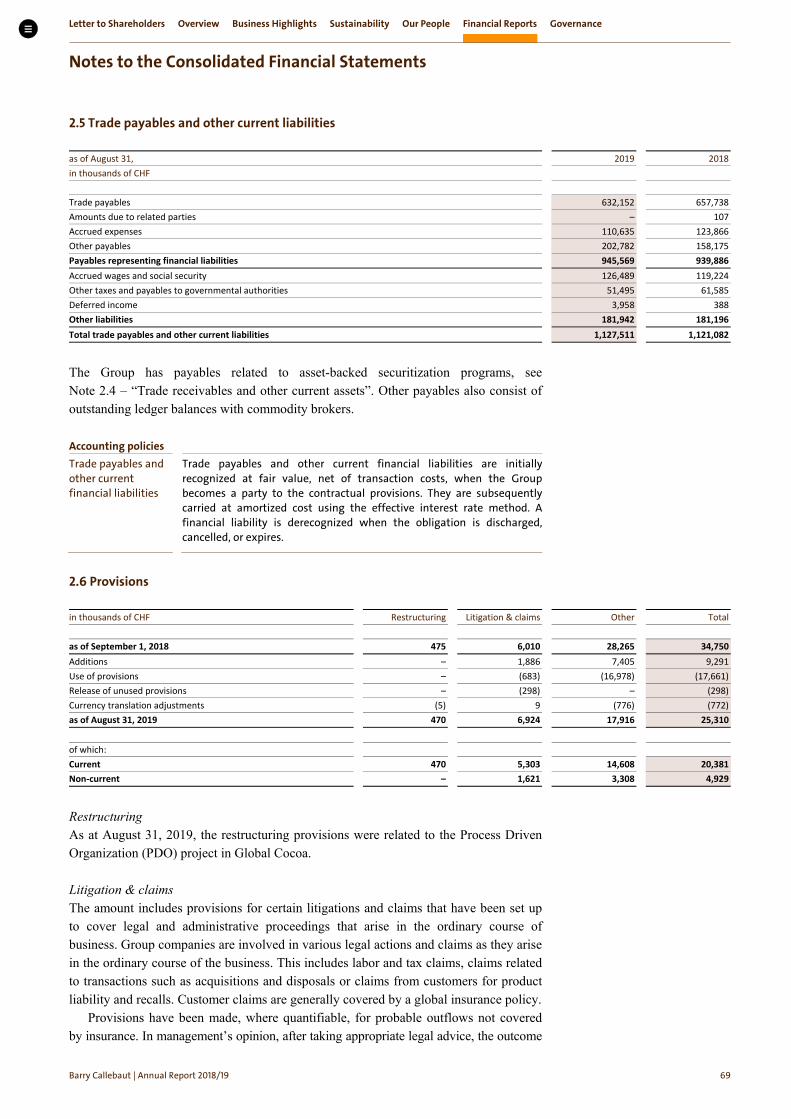
Letter to Shareholders Overview Business Highlights Sustainability Our People Financial Reports Governance
Notes to the Consolidated Financial Statements
Barry Callebaut | Annual Report /
. Trade payables and other current liabilities
as of August 31, 2019 2018 in thousands of CHF Trade payables 632,152 657,738 Amounts due to related parties – 107 Accrued expenses 110,635 123,866 Other payables 202,782 158,175 Payables representing financial liabilities 945,569 939,886 Accrued wages and social security 126,489 119,224 Other taxes and payables to governmental authorities 51,495 61,585 Deferred income 3,958 388 Other liabilities 181,942 181,196 Total trade payables and other current liabilities 1,127,511 1,121,082
The Group has payables related to asset-backed securitization programs, see Note 2.4 – “Trade receivables and other current assets”. Other payables also consist of outstanding ledger balances with commodity brokers.
Accounting policies Trade payables and other current financial liabilities
Trade payables and other current financial liabilities are initially recognized at fair value, net of transaction costs, when the Group becomes a party to the contractual provisions. They are subsequently carried at amortized cost using the effective interest rate method. A financial liability is derecognized when the obligation is discharged, cancelled, or expires.
. Provisions
in thousands of CHF Restructuring Litigation & claims Other Total as of September 1, 2018 475 6,010 28,265 34,750 Additions – 1,886 7,405 9,291 Use of provisions – (683) (16,978) (17,661) Release of unused provisions – (298) – (298) Currency translation adjustments (5) 9 (776) (772) as of August 31, 2019 470 6,924 17,916 25,310 of which: Current 470 5,303 14,608 20,381 Non-current – 1,621 3,308 4,929
Restructuring As at August 31, 2019, the restructuring provisions were related to the Process Driven Organization (PDO) project in Global Cocoa.
Litigation & claims The amount includes provisions for certain litigations and claims that have been set up to cover legal and administrative proceedings that arise in the ordinary course of business. Group companies are involved in various legal actions and claims as they arise in the ordinary course of the business. This includes labor and tax claims, claims related to transactions such as acquisitions and disposals or claims from customers for product liability and recalls. Customer claims are generally covered by a global insurance policy.
Provisions have been made, where quantifiable, for probable outflows not covered by insurance. In management’s opinion, after taking appropriate legal advice, the outcome

Letter to Shareholders Overview Business Highlights Sustainability Our People Financial Reports Governance
Notes to the Consolidated Financial Statements
Barry Callebaut | Annual Report /
of these legal claims will not give rise to any significant loss beyond the amounts provided as of August 31, 2019. Any payments to be made will depend upon the date on which legally binding decrees and decisions are issued.
Other provisions Other provisions relate mainly to amounts that have been provided to cover the negative outcome of onerous contracts. The total provision for onerous contracts amounted to CHF 10.6 million as at August 31, 2019 (2018: CHF 24.8 million), and is expected to be fully utilized during the coming twelve months. The non-current portion was provided during this fiscal year for different types of risk, and the majority is expected to be used within three years. Accounting policies Provisions
Provisions are recognized when the Group has a present legal or constructive obligation as a result of past events and it is probable that an outflow of resources will be required to settle the obligation, and a reliable estimate thereof can be made.
Provisions are recorded for identifiable claims and restructuring costs. Restructuring provisions mainly comprise employee termination payments. Specific provisions for restructuring costs are recorded at such time as the management approves the decision to restructure and a formal plan for restructuring is communicated.
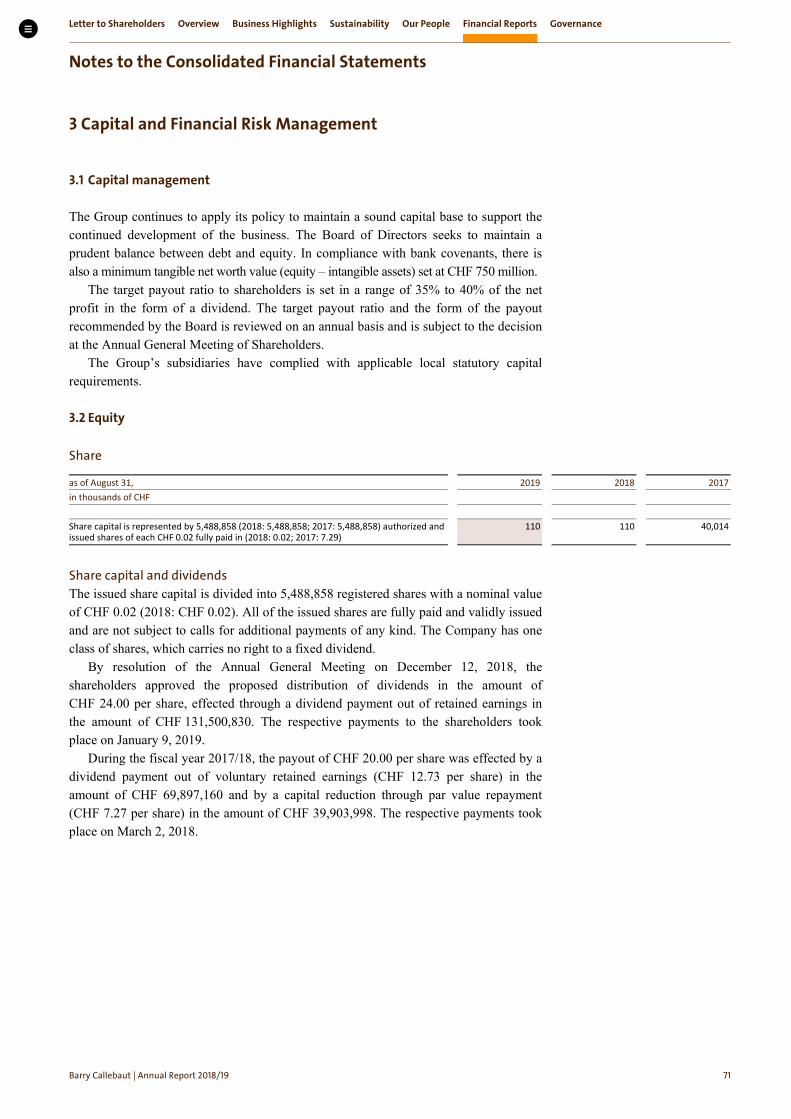
Letter to Shareholders Overview Business Highlights Sustainability Our People Financial Reports Governance
Notes to the Consolidated Financial Statements
Barry Callebaut | Annual Report /
Capital and Financial Risk Management
. Capital management
The Group continues to apply its policy to maintain a sound capital base to support the continued development of the business. The Board of Directors seeks to maintain a prudent balance between debt and equity. In compliance with bank covenants, there is also a minimum tangible net worth value (equity – intangible assets) set at CHF 750 million.
The target payout ratio to shareholders is set in a range of 35% to 40% of the net profit in the form of a dividend. The target payout ratio and the form of the payout recommended by the Board is reviewed on an annual basis and is subject to the decision at the Annual General Meeting of Shareholders.
The Group’s subsidiaries have complied with applicable local statutory capital requirements.
. Equity
Share
as of August 31, 2019 2018 2017 in thousands of CHF Share capital is represented by 5,488,858 (2018: 5,488,858; 2017: 5,488,858) authorized and issued shares of each CHF 0.02 fully paid in (2018: 0.02; 2017: 7.29)
110
110
40,014
Share capital and dividends The issued share capital is divided into 5,488,858 registered shares with a nominal value of CHF 0.02 (2018: CHF 0.02). All of the issued shares are fully paid and validly issued and are not subject to calls for additional payments of any kind. The Company has one class of shares, which carries no right to a fixed dividend.
By resolution of the Annual General Meeting on December 12, 2018, the shareholders approved the proposed distribution of dividends in the amount of CHF 24.00 per share, effected through a dividend payment out of retained earnings in the amount of CHF 131,500,830. The respective payments to the shareholders took place on January 9, 2019.
During the fiscal year 2017/18, the payout of CHF 20.00 per share was effected by a dividend payment out of voluntary retained earnings (CHF 12.73 per share) in the amount of CHF 69,897,160 and by a capital reduction through par value repayment (CHF 7.27 per share) in the amount of CHF 39,903,998. The respective payments took place on March 2, 2018.
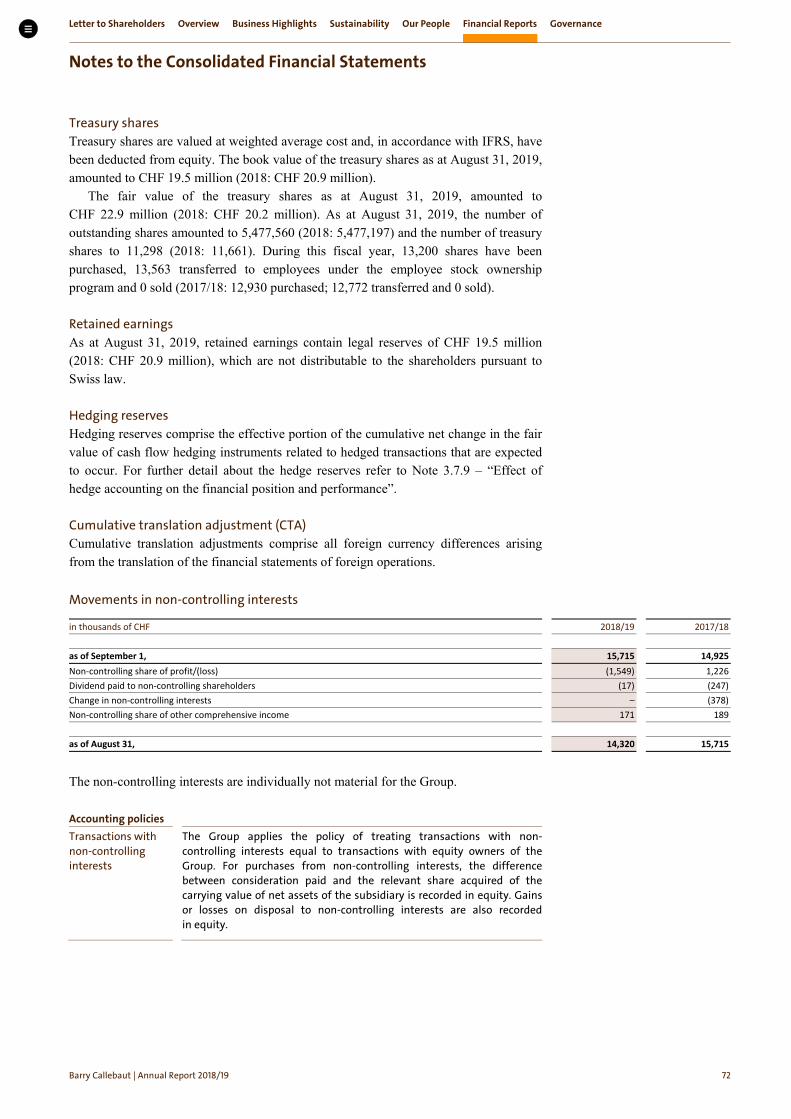
Letter to Shareholders Overview Business Highlights Sustainability Our People Financial Reports Governance
Notes to the Consolidated Financial Statements
Barry Callebaut | Annual Report /
Treasury shares Treasury shares are valued at weighted average cost and, in accordance with IFRS, have been deducted from equity. The book value of the treasury shares as at August 31, 2019, amounted to CHF 19.5 million (2018: CHF 20.9 million).
The fair value of the treasury shares as at August 31, 2019, amounted to CHF 22.9 million (2018: CHF 20.2 million). As at August 31, 2019, the number of outstanding shares amounted to 5,477,560 (2018: 5,477,197) and the number of treasury shares to 11,298 (2018: 11,661). During this fiscal year, 13,200 shares have been purchased, 13,563 transferred to employees under the employee stock ownership program and 0 sold (2017/18: 12,930 purchased; 12,772 transferred and 0 sold).
Retained earnings As at August 31, 2019, retained earnings contain legal reserves of CHF 19.5 million (2018: CHF 20.9 million), which are not distributable to the shareholders pursuant to Swiss law.
Hedging reserves Hedging reserves comprise the effective portion of the cumulative net change in the fair value of cash flow hedging instruments related to hedged transactions that are expected to occur. For further detail about the hedge reserves refer to Note 3.7.9 – “Effect of hedge accounting on the financial position and performance”.
Cumulative translation adjustment (CTA) Cumulative translation adjustments comprise all foreign currency differences arising from the translation of the financial statements of foreign operations.
Movements in non-controlling interests
in thousands of CHF 2018/19 2017/18 as of September 1, 15,715 14,925 Non-controlling share of profit/(loss) (1,549) 1,226 Dividend paid to non-controlling shareholders (17) (247) Change in non-controlling interests – (378) Non-controlling share of other comprehensive income 171 189 as of August 31, 14,320 15,715
The non-controlling interests are individually not material for the Group.
Accounting policies Transactions with non-controlling interests
The Group applies the policy of treating transactions with non-controlling interests equal to transactions with equity owners of the Group. For purchases from non-controlling interests, the difference between consideration paid and the relevant share acquired of the carrying value of net assets of the subsidiary is recorded in equity. Gains or losses on disposal to non-controlling interests are also recorded in equity.

Letter to Shareholders Overview Business Highlights Sustainability Our People Financial Reports Governance
Notes to the Consolidated Financial Statements
Barry Callebaut | Annual Report /
. Earnings per share
in CHF 2018/19 2017/18 Basic earnings per share from continuing operations (CHF/share) 67.57 64.93 Diluted earnings per share (CHF/share) 67.21 64.55
The following amounts of earnings have been used as the numerator in the calculation of basic and diluted earnings per share:
in thousands of CHF 2018/19 2017/18 Profit for the year attributable to shareholders of the parent company, used as numerator for basic earnings per share adjusted for net loss from discontinued operations
370,280
356,133
After-tax effect of income and expenses on dilutive potential ordinary shares – – Adjusted net profit for the year used as numerator for diluted earnings per share 370,280 356,133
The following numbers of shares have been used as the denominator in the calculation of basic and diluted earnings per share:
2018/19 2017/18 Number of shares issued 5,488,858 5,488,858 Weighted average number of treasury shares held (9,134) (3,970) Weighted average number of ordinary shares outstanding, used as denominator for basic earnings per share 5,479,724 5,484,888 Dilution potential of equity-settled share-based payments 29,697 32,052 Adjusted weighted average number of ordinary shares, used as denominator for diluted earnings per share 5,509,421 5,516,940
. Cash and cash equivalents
Cash and cash equivalents comprise of cash on hand, checks, bank balances and unrestricted bank deposit balances with an original maturity of 90 days or less. Bank overdrafts that are repayable on demand, forming an integral part of the Group’s cash management, are included as a component of cash and cash equivalents for the purpose of the Consolidated Cash Flow Statement.
. Financial liabilities
3.5.1 Bank overdrafts and short-term debt
as of August 31, 2019 2018 2019 2018 in thousands of CHF Carrying amounts Fair values Bank overdrafts 132,638 26,267 132,638 26,267 Commercial paper 136,702 171,837 136,702 171,837 Short-term debt 54,336 108,810 54,336 108,810 Short-term portion of long-term debt (Note 3.5.2) 5,349 3,784 5,349 3,784 Finance lease obligations (Note 3.5.4) 603 617 603 617 Other 13 – 13 – Short-term debt 197,003 285,048 197,003 285,048 Bank overdrafts and short-term debt 329,641 311,315 329,641 311,315

Letter to Shareholders Overview Business Highlights Sustainability Our People Financial Reports Governance
Notes to the Consolidated Financial Statements
Barry Callebaut | Annual Report /
Short-term financial liabilities are mainly denominated in EUR, XOF, and BRL as shown in the table below:
as of August 31, 2019 2018 Split per currency Amount Interest range Amount Interest range in thousands of CHF from to from to EUR 138,693 (0.11%) 1.50% 171,427 (0.22%) 1.60% EUR 723 3.00% 7.00% 631 3.00% 6.00% XOF 128,049 4.25% 5.25% 52,000 4.25% 5.50% BRL 42,631 6.65% 7.29% 30,744 7.50% 13.00% CLP 7,103 3.10% 4.77% 35,783 3.48% 4.10% INR 4,888 7.05% 9.19% 3,674 9.00% 10.00% XAF 3,875 5.50% 7.70% 4,546 6.00% 7.00% JPY 3,469 1.67% 1.67% 3,278 1.67% 1.67% CHF – – – 337 (0.78%) (0.78%) IDR – – – 2,457 6.50% 10.50% TRL – – – 5,050 14.75% 30.00% Other 210 1.41% 7.47% 1,388 1.04% 8.00% Total 329,641 311,315
3.5.2 Long-term debt
as of August 31, 2019 2018 2019 2018 in thousands of CHF Carrying amounts Fair values Senior Notes 872,993 1,164,047 977,244 1,270,356 Loans 665,935 7,819 665,935 7,819 Less current portion (Note 3.5.1) (5,349) (3,784) (5,349) (3,784) Other 874 715 874 716 Total long-term debt 1,534,453 1,168,797 1,638,704 1,275,107
On June 20, 2013, the Group issued a 5.5% Senior Note with maturity in 2023 for an amount of USD 400 million. The Senior Note was issued at a price of 98.122% and includes a coupon step-up clause of 0.25% (limited to 1.00% per annum) per downgraded notch per rating agency. The coupon currently amounts to 5.5% (2017/18: 5.5%)
On May 24, 2016, the Group issued a 2.375% Senior Note with maturity in 2024 for an amount of EUR 450 million. The Senior Note was issued at a price of 99.104%. The coupon amounts to 2.375%.
On June 22, 2017, the Group amended and extended its EUR 600 million Revolving Credit Facility dated June 15, 2011, into a EUR 750 million Revolving Credit Facility with maturity in 2022. On June 22, 2018, the Group extended the maturity of its EUR 750 million Revolving Credit Facility to 2023. A further extension of the maturity with one year to June 2024 has been agreed upon with the Lenders on October 3, 2019. Per August 31, 2019 there were no outstanding amounts under the Revolving Credit Facility.
On February 13, 2019, the Group issued a EUR 600 million equivalent Schuldscheindarlehen. An amount of EUR 191 million with maturity in 2026, an amount of EUR 254 million with maturity in 2027 and an amount of EUR 22 million with maturity in 2029 were raised in euros. An amount of CHF 11 million with maturity in 2026, an amount of CHF 131 million with maturity in 2027 and an amount of CHF 10 million with maturity in 2029 were raised in Swiss francs.

Letter to Shareholders Overview Business Highlights Sustainability Our People Financial Reports Governance
Notes to the Consolidated Financial Statements
Barry Callebaut | Annual Report /
On June 15, 2011, the Group issued a 5.375% Senior Note with maturity in 2021 for an amount of EUR 250 million. On August 1, 2019, the Group repaid the EUR 250 million Senior Note in full.
The USD 400 million Senior Note, the EUR 450 million Senior Note, the EUR 750 million Revolving Credit Facility and the EUR 600 million equivalent Schuldscheindarlehen all rank pari passu. The Senior Notes, the Revolving Credit Facility as well as the Schuldscheindarlehen are guaranteed by Barry Callebaut AG.
In addition, there are financial covenants related to the Revolving Credit Facility which comprise of key figures related to profitability per tonne, interest cover ratio and tangible net worth value.
As a result, the maturity profile of the long-term debt can be summarized as follows:
as of August 31, 2019 2018 in thousands of CHF 2019/20 – 3,107 2020/21 2,013 281,388 2021/22 282 338 2022/23 388,281 381,370 2023/24 (and thereafter for 2018) 485,365 502,594 2024/25 (and thereafter for 2019) 658,512 – Total long-term debt 1,534,453 1,168,797
The weighted average maturity of the long-term debt (i.e. without any portion falling due in less than 12 months) increased from 4.9 years to 5.9 years.
Long-term financial liabilities are to a major extent denominated in EUR and USD and at fixed interest rates.
as of August 31, 2019 2018 Split per currency Amount Interest range Amount Interest range in thousands of CHF from to from to EUR 994,072 0.90% 2.38% 784,826 0.80% 5.63% EUR 557 3.00% 6.00% 1,329 3.00% 7.00% USD 388,258 5.50% 5.50% 379,176 5.50% 5.50% CHF 151,480 1.10% 1.29% – – – JPY – – – 3,277 1.67% 1.67% Other 86 4.93% 5.18% 189 6.00% 7.00% Total long-term debt 1,534,453 1,168,797

Letter to Shareholders Overview Business Highlights Sustainability Our People Financial Reports Governance
Notes to the Consolidated Financial Statements
Barry Callebaut | Annual Report /
3.5.3 Changes in liabilities and equity from financing activities
Short-term debt
Long-term debt
Retained earnings
Share capital
Treasury shares
Non-controlling
interests
Total
in thousands of CHF Financial Liabilities Equity as of September 1, 2017 318,272 1,170,743 2,629,403 40,014 (15,105) 14,925 4,158,251 Cash flows from financing activities (33,815) (7,334) (69,873) (39,904) (22,783) (247) (173,957) Proceeds from the issue of short-term debt 31,362 – – – – – 31,362 Repayment of short-term debt (65,177) – – – – – (65,177) Proceeds from the issue of long-term debt – 1,200 – – – – 1,200 Repayment of long-term debt – (8,534) – – – – (8,534) Dividend payment – – (69,873) – – – (69,873) Capital reduction – – – (39,904) – – (39,904) Purchase of treasury shares – – – – (22,783) – (22,783) Dividends paid to non-controlling interests – – – – – (247) (247) Other changes related to liabilities 591 5,389 – – – – 5,981 Amortized structuring fee – 2,610 – – – – 2,610 Change in accrued finance expense other – 779 – – – – 779 Interest expense 73,928 – – – – – 73,928 Interest paid (72,493) – – – – – (72,493) Foreign exchange movements (5,404) 6,560 – – – – 1,157 Reclassification 4,560 (4,560) – – – – – Other changes related to equity – – 365,408 – 16,968 1,038 383,414 as of August 31, 2018 285,048 1,168,798 2,924,938 110 (20,920) 15,715 4,373,689 Adjustment on initial application of IFRS 151 334,750 – (4,121) – – – 330,629 as of September 1, 2018 619,797 1,168,798 2,920,817 110 (20,920) 15,715 4,704,318 Cash flows from financing activities (434,503) 396,120 (131,501) – (22,781) (17) (192,682) Proceeds from the issue of short-term debt 98,530 – – – – – 98,530 Repayment of short-term debt (533,033) – – – – – (533,033) Proceeds from the issue of long-term debt – 677,579 – – – – 677,579 Repayment of long-term debt – (281,459) – – – – (281,459) Dividend payment – – (131,501) – – – (131,501) Capital reduction – – – – – – – Purchase of treasury shares – – – – (22,781) – (22,781) Dividends paid to non-controlling interests – – – – – (17) (17) Other changes related to liabilities 11,709 (30,465) – – – – (18,756) Amortized structuring fee – 3,997 – – – – 3,997 Change in accrued finance expense other – 610 – – – – 610 Interest expense 115,697 – – – – – 115,697 Interest paid (115,549) – – – – – (115,549) Foreign exchange movements 5,774 (29,285) – – – – (23,511) Reclassification 5,787 (5,787) – – – – – Other changes related to equity – – 317,844 – 24,195 (1,378) 340,661 as of August 31, 2019 197,003 1,534,453 3,107,161 110 (19,506) 14,320 4,833,542
1 Refer to Introduction of new standards in 2018/19, IFRS 15 – Revenue from Contracts with Customers page 50.
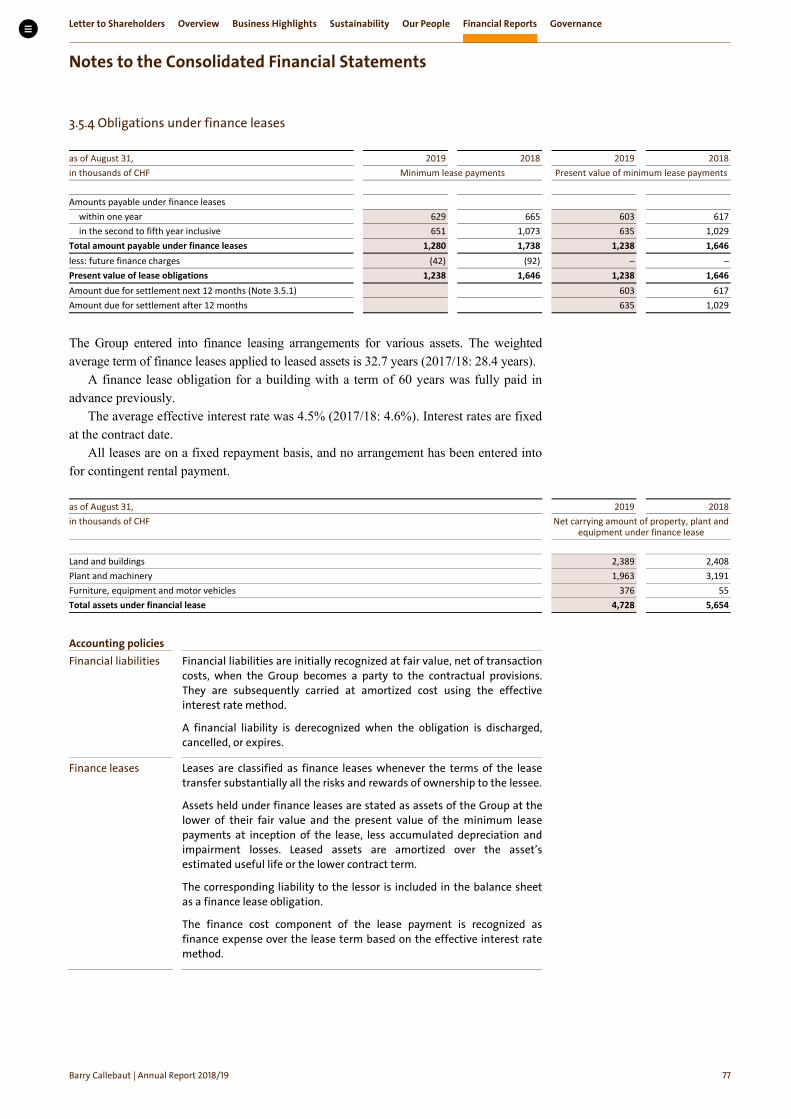
Letter to Shareholders Overview Business Highlights Sustainability Our People Financial Reports Governance
Notes to the Consolidated Financial Statements
Barry Callebaut | Annual Report /
3.5.4 Obligations under finance leases
as of August 31, 2019 2018 2019 2018 in thousands of CHF Minimum lease payments Present value of minimum lease payments Amounts payable under finance leases
within one year 629 665 603 617 in the second to fifth year inclusive 651 1,073 635 1,029
Total amount payable under finance leases 1,280 1,738 1,238 1,646 less: future finance charges (42) (92) – – Present value of lease obligations 1,238 1,646 1,238 1,646 Amount due for settlement next 12 months (Note 3.5.1) 603 617 Amount due for settlement after 12 months 635 1,029
The Group entered into finance leasing arrangements for various assets. The weighted average term of finance leases applied to leased assets is 32.7 years (2017/18: 28.4 years).
A finance lease obligation for a building with a term of 60 years was fully paid in advance previously.
The average effective interest rate was 4.5% (2017/18: 4.6%). Interest rates are fixed at the contract date.
All leases are on a fixed repayment basis, and no arrangement has been entered into for contingent rental payment.
as of August 31, 2019 2018 in thousands of CHF
Net carrying amount of property, plant and
equipment under finance lease Land and buildings 2,389 2,408 Plant and machinery 1,963 3,191 Furniture, equipment and motor vehicles 376 55 Total assets under financial lease 4,728 5,654
Accounting policies Financial liabilities
Financial liabilities are initially recognized at fair value, net of transaction costs, when the Group becomes a party to the contractual provisions. They are subsequently carried at amortized cost using the effective interest rate method.
A financial liability is derecognized when the obligation is discharged, cancelled, or expires.
Finance leases
Leases are classified as finance leases whenever the terms of the lease transfer substantially all the risks and rewards of ownership to the lessee.
Assets held under finance leases are stated as assets of the Group at the lower of their fair value and the present value of the minimum lease payments at inception of the lease, less accumulated depreciation and impairment losses. Leased assets are amortized over the asset’s estimated useful life or the lower contract term.
The corresponding liability to the lessor is included in the balance sheet as a finance lease obligation.
The finance cost component of the lease payment is recognized as finance expense over the lease term based on the effective interest rate method.

Letter to Shareholders Overview Business Highlights Sustainability Our People Financial Reports Governance
Notes to the Consolidated Financial Statements
Barry Callebaut | Annual Report /
. Capital and lease commitments and guarantees
Capital commitments
as of August 31, 2019 2018 in thousands of CHF Property, plant and equipment 4,588 5,283 Intangible assets 389 509 Total capital commitments 4,977 5,792
Guarantees in favor of third parties Group companies have issued guarantee commitments for the fiscal year 2018/19 in the amount of CHF 1.5 million (2017/18: CHF 2.5 million). These are mainly related to customs authorities and third-party suppliers.
Operating lease commitments Operating lease commitments represent rentals payable by the Group for vehicles, equipment, buildings and offices. Equipment and vehicle leases were negotiated for an average term of 2.0 years (2017/18: 3.1 years).
The future aggregate minimum lease payments under non-cancellable operating leases are due as follows:
as of August 31, 2019 2018 in thousands of CHF In the first year 39,585 26,229 In the second to the fifth year 77,221 67,023 After five years 34,016 59,864 Total future operating lease commitments 150,822 153,116 in thousands of CHF 2018/19 2017/18 Lease expenditure charged to the statement of income 45,106 27,318
Accounting policies Operating leases
Leases where a significant portion of the risks, and rewards of ownership are retained by the lessor are classified as operating leases. Rentals payable under an operating lease are charged to the income statement on a straight-line basis over the term of the lease.
. Financial risk management The nature of its business exposes the Group to a variety of financial risks including the effects of changes in market prices (commodity prices, foreign exchange rates and interest rates) as well as credit risks and liquidity risks.
The Group’s overall strategy for managing these risks is consistent with the Group’s objectives to maintain cost leadership, reduce earnings volatility in a cost-effective manner and minimize potential adverse effects of such market exposures on the financial performance of the Group. The Group’s Sourcing and Treasury department continuously monitor and hedge the exposures to commodity price risk, foreign currency risk, interest rate risk and the use of derivative instruments. The Group’s Risk Management department and Finance Committee regularly review and monitor the adherence to policies and defined risk limits.
Letter to Shareholders Overview Business Highlights Sustainability Our People Financial Reports Governance
Notes to the Consolidated Financial Statements
Barry Callebaut | Annual Report /
The Group manages its business based on the following two business models: • Contract business: sales contracts for cocoa ingredients and industrial or gourmet
chocolate, where Barry Callebaut has entered into contracts with customers to deliver fixed quantities at fixed prices. These contractually fixed prices are generally based on the forward market prices of the raw material components valid at the contract date for the forward delivery date on which the cocoa ingredients or chocolate is planned to be delivered to the customers.
• Price List business: Barry Callebaut sets price lists for certain Gourmet, Specialties & Decorations, and Beverage products. These price lists are normally updated at intervals of six to twelve months. Customers buy products based on the issued price lists without fixed commitments on quantities.
3.7.1 Commodity price risks a) Commodity risk management The manufacturing of the Group’s products requires raw materials such as cocoa beans, sugar and sweeteners, dairy, nuts, oils and fats. Therefore, the Group is exposed to commodity price risks.
The Group Commodity Risk Committee (GCRC) is a committee consisting of key risk management stakeholders of the Group who monitor the Group’s commodity risk management activities and acts as the decision-making body for the Group in this respect. The members of the GCRC include the Group’s Chief Financial Officer (CFO) who acts as Chairman of the committee, the President of Global Cocoa, the VP Group Accounting, Reporting & Risk Management (GARRM), the CFO of Global Cocoa, the VP of Global Cocoa Trading & Sourcing, the Head of Global Sourcing (for non-cocoa materials) and the VP Group Treasury & Tax.
The GCRC reports to the Group’s Audit, Finance, Risk, Quality & Compliance Committee (AFRQCC) and must inform the latter about key Group commodity risk issues and the key mitigation decisions taken. The AFRQCC reviews and approves GCRC requests and ensures that the commodity risk management strategy is consistent with the Group’s objectives. It also sets the Group’s Value at Risk (VaR) limit for the major raw material components. The AFRQCC makes recommendations to the Board of Directors and advises the Board of Directors on important risk matters and/or asks for approval.
In order to quantify and manage the Group’s consolidated exposure to commodity price risks, the concept of historical VaR is applied. The VaR concept serves as the analytical instrument for assessing the Group’s commodity price risk under normal market conditions. The VaR indicates the loss, which, within a time horizon of ten days for raw materials, will not be exceeded at a confidence level of 95%, using seven years of historical market prices for each major raw material component. The VaR is used together with a calculation of the expected shortfall and worst cases as well as the use of stress test scenarios. Liquidity and credit risks are not included in the calculation.
The GCRC allocates the Group VaR limit into VaR limits for cocoa and non-cocoa raw materials such as sugar, dairy, oils and fats. These two VaR limits are then allocated to limits in tonnes to the related risk reporting units for each of the two areas. The Board of Directors is the highest approval authority for all Group Commodity Risk Management (GCRM) matters and approves the GCRM Policy as well as the Group VaR limit.
The VaR framework of the Group is based on the standard historical VaR methodology; taking 2,000 days (equivalent to seven years) of the most recent prices, based on which the day-to-day relative price changes are calculated. This simulation of past market conditions is not predicting the future movement in commodity prices and

Letter to Shareholders Overview Business Highlights Sustainability Our People Financial Reports Governance
Notes to the Consolidated Financial Statements
Barry Callebaut | Annual Report /
therefore it does not represent actual losses. It only represents an indication of the future commodity price risks based on historical volatility. VaR is applied to materials with prices considered to exceed certain volatility levels (e.g. cocoa beans and cocoa products, dairy products, sugar and sweeteners, nuts, oils and fats). As at August 31, 2019, the Group had a total VaR for raw materials of CHF 11.9 million (2018: CHF 10.4 million), well within the Group limit. The average VaR over the fiscal year 2018/19 was CHF 8.8 million (2017/18: CHF 11.0 million).
b) Cocoa price risk and the Group’s hedging strategy The Group’s purchasing and sourcing centers make sourcing and risk management decisions for cocoa beans, semi-finished cocoa products and ingredients including hedging commodity price risk exposures. Within the overall limits as defined by the AFRQCC, the Group’s purchasing and sourcing centers can also act as a broker-trader with the objective to generate profits from fluctuations in raw material prices or broker-trader margins.
The fair value of the Group’s open sales and purchase commitments and inventory are fluctuating in line with price movements in the respective commodity markets and are therefore hedged. It is the Group’s policy to hedge its cocoa price risk resulting from its inventory, cocoa derivatives and purchase and sales contracts. The cocoa price risk component in cocoa stock, purchase and sales contracts as well as chocolate stocks and sales contracts are hedged with exchange traded or over-the-counter cocoa bean derivatives applying fair value hedge accounting. The Group also applies cash flow hedge accounting whereby the cocoa price risk and foreign exchange risk from forecasted cocoa sales are hedged with cocoa bean futures and foreign exchange forward contracts.
In order to calculate the cocoa bean price risk exposure embedded in the various cocoa ingredients and chocolate stocks, purchase and sales contracts, the cocoa- processing entities translate the various cocoa ingredient volumes in these positions into cocoa bean equivalents, using technical yields (to calculate how many cocoa beans are needed to produce those cocoa ingredient volumes). These technical ratios vary according to cocoa ingredient types and cocoa-processing units. The chocolate entities calculate the bean equivalent in their positions using the prevailing market/commercial ratios. The entities use this approach and these ratios to enter into the appropriate volume of hedging instruments in order to hedge the cocoa bean price risk component in their positions. The Group also uses the same hedging ratios in hedge accounting as described above.
The cocoa bean price risk component is contractually specified in the purchase and sales contracts of cocoa ingredients and chocolate products. Therefore, the cocoa bean price risk component is considered separately identifiable and reliably measurable in the Group’s hedged items (cocoa ingredients purchase contracts, cocoa stocks, chocolate stocks, cocoa ingredients sales contracts and chocolate sales contracts) as well as in its hedging instruments (cocoa bean futures and other contracts accounted for as derivatives).
c) Sugar price risk hedges The Group applies cash flow hedge accounting for hedging relationships when it hedges its commodity price risk and its foreign exchange risks attributable to its forecasted sugar purchases with sugar futures and with foreign exchange forward contracts, respectively. When the Group enters into agreements with sugar suppliers where the price of the forecasted sugar purchases will be indexed to the raw sugar world market price, it hedges these forecasted sugar purchases with sugar futures.

Letter to Shareholders Overview Business Highlights Sustainability Our People Financial Reports Governance
Notes to the Consolidated Financial Statements
Barry Callebaut | Annual Report /
The raw sugar world market price risk component is a contractually specified element in the hedged items. Therefore, the raw sugar world market price risk component is considered separately identifiable and reliably measurable in the Group’s hedged items (forecasted sugar purchases) as well as in its hedging instruments (sugar futures).
3.7.2 Foreign currency risks The Group operates across the world and consequently is exposed to multiple currency risks, albeit primarily in EUR, USD, CHF and GBP. The Group actively monitors its transactional currency exposures and consequently enters into foreign currency hedges with the aim of preserving the value of assets, commitments and anticipated transactions. The related accounting treatment is explained in the section “Accounting policies”.
All risks relating to foreign currency exposures of assets and liabilities, certain unrecognized firm commitments and highly probable forecasted purchases and sales are centralized as far as possible within the Group’s Treasury department, where the hedging strategies are defined.
Accordingly, the consolidated foreign currency exposures are hedged in compliance with the Group’s Treasury Policy, mainly by means of forward currency contracts entered into with financial institutions of a high credit rating. The Group’s Treasury Policy imposes a dual risk control framework of both open position limits and near-time fair valuation of net currency exposures. Both levels of control are substantially interlinked, avoiding excessive net currency exposures and substantial volatility in the Consolidated Income Statement.
The Group’s Treasury department is supervised by the Group Finance Committee, which meets on a regular basis. The Group Finance Committee monitors the Group’s foreign currency risk position and acts as a decision-taking body for the Group in this respect. The Group Finance Committee consists of the Group’s CFO, the VP Group Financial Planning & Analysis, the VP Group Treasury & Tax, the VP Group Accounting, Reporting & Risk Management, and other Group Finance stakeholders.
The Group’s Treasury Policy, giving guidance on treasury risk management including foreign currency and interest rate risks, is approved and annually reviewed by the AFRQCC. The Group’s Risk Management department reviews the consistency of the Group’s treasury management strategy with the Group’s Treasury Policy and reports the status to the Group’s CFO periodically. The AFRQCC is informed by the CFO about the status and important matters in their quarterly meetings and approves requests of the Group’s Finance Committee on important treasury risk matters including foreign currency risks for recommendation to the Board of Directors. The Board of Directors is the highest approval authority for all Group Treasury Risk Management matters.
The table below provides an overview of the net exposure of EUR, GBP, CHF and USD against the main functional currencies in the Group. According to the Group’s Treasury Policy, foreign exchange exposures are hedged as from identification on an intraday basis in line with the approved exposure limits. In case of small deviations from the agreed foreign exchange exposure limits, approval has to be sought from the Group’s Treasury and Risk Management department. For significant deviations, approval from the AFRQCC is required. Companies with the same functional currency are shown in one group. EUR exposures of the reporting units with functional currency franc CFA in Côte d’Ivoire (XOF) and Cameroon (XAF) are not included, as the franc CFA has an exchange rate pegged to the EUR, currently at a rate of CFA franc 656 per euro both for XOF and XAF (total EUR long exposures of 57 million as per August 31, 2019, and short 2 million as per August 31, 2018).

Letter to Shareholders Overview Business Highlights Sustainability Our People Financial Reports Governance
Notes to the Consolidated Financial Statements
Barry Callebaut | Annual Report /
Net foreign currency exposures
as of August 31, 2019 2018 Net exposure in thousands of EUR/GBP/USD/CHF
EUR GBP USD CHF EUR GBP USD CHF
EUR – (2,994) (2,333) 14,436 – (21,510) (1,154) 27,655 CHF 39,180 2 (34,536) – 14,830 504 (9,116) – USD (796) 54 – (645) (1,645) 5 – (1,101) CAD (1,140) – (526) 1 (91) – (453) 18 BRL 224 – 211 (118) (85) – 750 (118) RUB (96) 22 40 – (12) 118 (382) – JPY (614) (13) 65 – (756) (13) (238) – MXN (28) – (3,182) 5 – – 2,522 (544) IDR (274) – (320) – (103) – (85) – INR (316) – (1,402) – (138) – (2,106) – TRL 519 (30) (12) (8) (72) 14 (49) (7) SEK 38 – 9 (11) 3,896 (3) (4) (36) Total 36,697 (2,959) (41,986) 13,660 15,824 (20,885) (10,315) 25,867
In order to quantify and manage the Group’s consolidated exposure to foreign currency risks, the concept of historical VaR has been implemented. The VaR concept serves as the analytical instrument for assessing the Group’s foreign currency risk incurred under normal market conditions. The VaR indicates the loss which, within a time horizon of one day, will not be exceeded at a confidence level of 95% using seven years of historical market prices for each major currency pair. The VaR is used together with the calculation of the expected shortfall and worst cases as well as the use of stress test scenarios. The VaR is based on static exposures during the time horizon of the analysis. However, the simulation of past market conditions is not predicting the future movement in foreign currency rates. Therefore, it does not represent actual losses. It only represents an indication of future foreign currency risks. As of August 31, 2019, the Group had a VaR of CHF 0.4 million (2018: CHF 0.3 million). The average VaR over the fiscal year 2018/19 was CHF 0.2 million (2017/18: CHF 0.2 million).
Value at Risk per main exposure currencies
as of August 31, 2019 2018 Value at Risk on net exposures in thousands of CHF Total for the Group and per main exposure currencies
Total Group 436 250 EUR 343 94 GBP 28 217 USD 302 97 CHF 68 160 Others 62 36 Diversification effect 46% 59%
3.7.3 Interest rate risks The Group is exposed to changes in interest rates through its short- and long-term debt obligations mainly issued by the Group’s finance company and managed by the Group’s centralized Treasury department. This department manages and oversees the financing lines of the Group, and the related interest rate risks and, to the extent possible, provides the necessary liquidity in the required functional currency for the companies of the Group. Consequently, the Group’s debt obligations are adjusted with the real currency mix of the Group’s liabilities in order to reflect the correct exposure to interest rates.
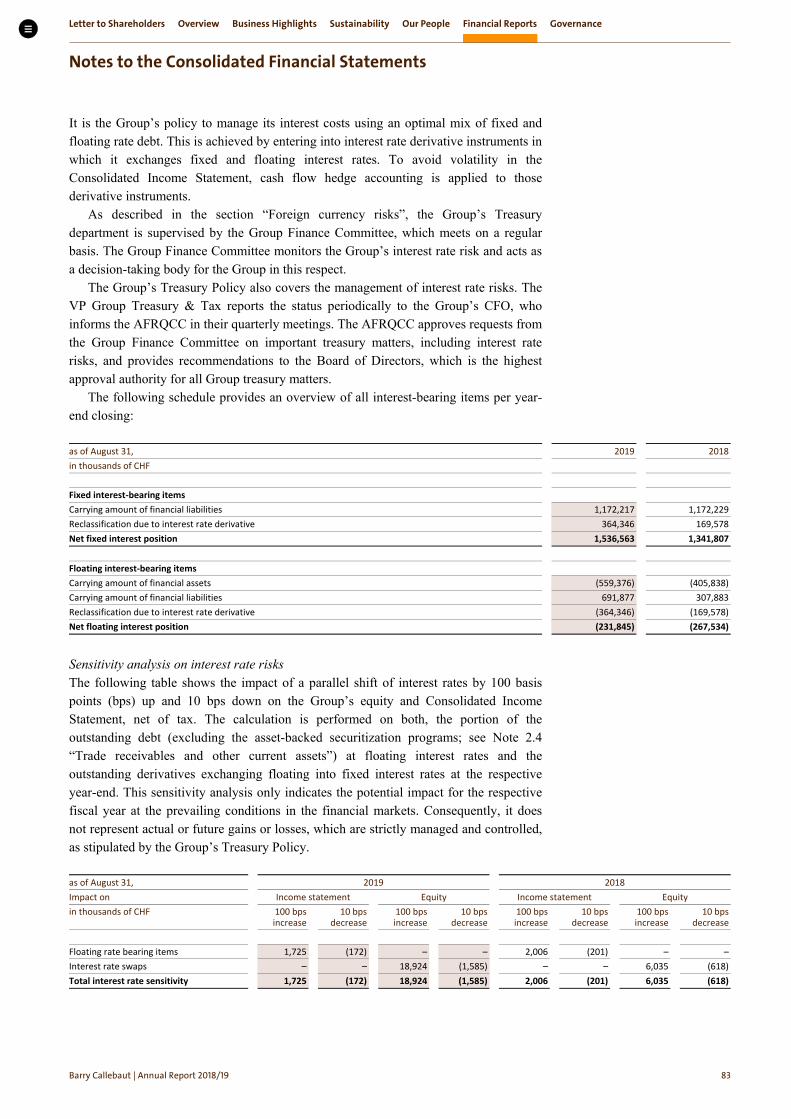
Letter to Shareholders Overview Business Highlights Sustainability Our People Financial Reports Governance
Notes to the Consolidated Financial Statements
Barry Callebaut | Annual Report /
It is the Group’s policy to manage its interest costs using an optimal mix of fixed and floating rate debt. This is achieved by entering into interest rate derivative instruments in which it exchanges fixed and floating interest rates. To avoid volatility in the Consolidated Income Statement, cash flow hedge accounting is applied to those derivative instruments.
As described in the section “Foreign currency risks”, the Group’s Treasury department is supervised by the Group Finance Committee, which meets on a regular basis. The Group Finance Committee monitors the Group’s interest rate risk and acts as a decision-taking body for the Group in this respect.
The Group’s Treasury Policy also covers the management of interest rate risks. The VP Group Treasury & Tax reports the status periodically to the Group’s CFO, who informs the AFRQCC in their quarterly meetings. The AFRQCC approves requests from the Group Finance Committee on important treasury matters, including interest rate risks, and provides recommendations to the Board of Directors, which is the highest approval authority for all Group treasury matters.
The following schedule provides an overview of all interest-bearing items per year-end closing:
as of August 31, 2019 2018 in thousands of CHF Fixed interest-bearing items Carrying amount of financial liabilities 1,172,217 1,172,229 Reclassification due to interest rate derivative 364,346 169,578 Net fixed interest position 1,536,563 1,341,807 Floating interest-bearing items Carrying amount of financial assets (559,376) (405,838) Carrying amount of financial liabilities 691,877 307,883 Reclassification due to interest rate derivative (364,346) (169,578) Net floating interest position (231,845) (267,534)
Sensitivity analysis on interest rate risks The following table shows the impact of a parallel shift of interest rates by 100 basis points (bps) up and 10 bps down on the Group’s equity and Consolidated Income Statement, net of tax. The calculation is performed on both, the portion of the outstanding debt (excluding the asset-backed securitization programs; see Note 2.4 “Trade receivables and other current assets”) at floating interest rates and the outstanding derivatives exchanging floating into fixed interest rates at the respective year-end. This sensitivity analysis only indicates the potential impact for the respective fiscal year at the prevailing conditions in the financial markets. Consequently, it does not represent actual or future gains or losses, which are strictly managed and controlled, as stipulated by the Group’s Treasury Policy.
as of August 31, 2019 2018 Impact on Income statement Equity Income statement Equity in thousands of CHF
100 bps increase
10 bps decrease
100 bps increase
10 bps decrease
100 bps increase
10 bps decrease
100 bps increase
10 bps decrease
Floating rate bearing items 1,725 (172) – – 2,006 (201) – – Interest rate swaps – – 18,924 (1,585) – – 6,035 (618) Total interest rate sensitivity 1,725 (172) 18,924 (1,585) 2,006 (201) 6,035 (618)
Letter to Shareholders Overview Business Highlights Sustainability Our People Financial Reports Governance
Notes to the Consolidated Financial Statements
Barry Callebaut | Annual Report /
3.7.4 Credit risk and concentration of credit risk Credit risk arising from customers, i.e. the risk of counter parties defaulting, is governed by the Groupʼs Credit Management Policy. This policy defines the Group's credit management process such as the roles and responsibilities of the regional credit control organization, the initial customer account approval, setting and changing credit limits and payment terms, regular monitoring controls, collection effort process, credit insurance procedures and credit allowances. System controls ensure that new customer orders and deliveries are not processed if a specific customer credit limit is exceeded due to outstanding or overdue open amounts.
Further, the Group has a credit insurance program whereby all customers with outstanding amounts larger than EUR 70,000 are insured as far as possible.
The Group’s credit risk also arises from derivative financial instruments, i.e. foreign exchange derivatives, interest rate derivatives, and commodity derivatives, which are entered into with financial institutions. The Group has foreign exchange and interest rate derivatives with 10 – 15 banks acting on an international scale and having sound credit ratings. In case of commodity derivatives, the Group enters into future deals in the New York and the London terminal markets, mainly with 5 – 6 counterparties, and the open positions per counterparty offset each other to a large extent leading to limited open balances (as also represented by the value of derivative financial assets largely offsetting the value of derivative financial liabilities on the balance sheet). Counterparty exposures towards such financial institutions, referring limit utilization, are monitored on a regular basis by the Group's centralized Treasury department and reported to the Group's Finance Committee and the AFRQCC.
As of August 31, 2019, the largest customer represents 7% (2018: 10%) whereas the ten biggest customers represent 27% (2018: 33%) of trade receivables. The Group has no material credit risk concentration as it maintains a large, geographically diverse customer base. The extent of the Group’s credit risk exposure is represented by the aggregate balance of amounts receivable, reduced by the effects of netting arrangements with counterparties. The maximum nominal credit risk exposure in the event all other parties fail to perform their obligation was CHF 1,152.9 million as of August 31, 2019 (2018: CHF 986.7 million).
All financial assets measured at amortized cost are first assessed for individual impairment. Subsequently, expected credit loss is calculated by applying the annualized Credit Default Swap rates (CDS) of the country of domicile (where available the individual CDS of the counterparty is applied) and a premium of 25 bps p.a. (pro rated in line with average payment terms). The net expenses representing additions to the allowance for impairment losses and releases of the unused allowance recognized according to the approach described above amounted to CHF 4.7 million in 2018/19 (2017/18: CHF 12.4 million).
The fair value measurement of purchase and sales contracts and non-centrally-cleared derivative instruments recognized as derivative asset has been adjusted to reflect the credit risk of the counterparty. The Credit Valuation Adjustment (CVA) has been calculated by applying the annualized Credit Default Swap rates (CDS) of the counterparty (where not available, the country specific CDS of the country of domicile and a premium of 25 bps p.a.). The expense has been recognized in the Consolidated Income Statement as “Cost of goods sold”.
The fair value measurement of purchase and sales contracts and non-centrally-cleared derivative instruments recognized as derivative liability has been adjusted to reflect the credit risk of the Group. The Debit Valuation Adjustment (DVA) has been calculated by applying the annualized CDS rate of the Group.

Letter to Shareholders Overview Business Highlights Sustainability Our People Financial Reports Governance
Notes to the Consolidated Financial Statements
Barry Callebaut | Annual Report /
The following table summarizes the expected credit losses on the Group’s trade receivables at balance sheet date:
Ageing of trade receivables
as of August 31, 2019 2018 in thousands of CHF Total trade receivables measured at amortized cost, gross 379,793 377,046
of which: insured receivables 204,333 278,576 uninsured receivables with an individual balance over CHF 1 million 87,707 7,594 uninsured receivables with an individual balance below CHF 1 million 87,753 90,876
Less lifetime expected credit losses for trade receivables (14,984) (13,256) Total trade receivables measured at amortized cost 364,809 363,790
of which:
not overdue 329,728 280,829 lifetime expected credit losses for trade receivables not overdue (7,394) (1,818) expected credit loss rate 2.24% 0.65% past due less than 90 days 39,847 69,222 lifetime expected credit losses for trade receivables past due less than 90 days (2,039) (1,139) expected credit loss rate 5.12% 1.65% past due more than 90 days 10,218 26,996 lifetime expected credit losses for trade receivables past due more than 90 days (5,551) (10,299) expected credit loss rate 54.33% 38.15%
Total trade receivables measured at amortized cost 364,809 363,790
The Group has insured certain credit risks through a credit insurance policy. The majority of customers with a material outstanding amount are credit insured by this policy.

Letter to Shareholders Overview Business Highlights Sustainability Our People Financial Reports Governance
Notes to the Consolidated Financial Statements
Barry Callebaut | Annual Report /
Movements in allowance for impairment losses of financial assets The movements in allowance for impairment losses of financial assets are as follows:
in thousands of CHF Cash and cash equivalents
Deposits Trade receivables Other receivables Other financial assets
Total
as of September 1, 2018 205 2 13,256 4,862 11 18,335 Changes to expected credit losses on financial assets already recognized at the beginning of the fiscal year
105 36 3,566 956 6 4,669
Changes to expected credit losses on new financial assets originated during the fiscal year
690 9 2,089 1,844 5 4,637
Write-offs (3) – (489) (1,073) (10) (1,575) Unused amounts reversed (19) – (4,510) (124) – (4,652) Currency translation adjustment (14) (37) 1,072 2,483 (1) 3,503 as of August 31, 2019 964 10 14,984 8,948 11 24,917 in thousands of CHF Cash and cash
equivalents Deposits Trade receivables Other receivables Other financial
assets Total
as of September 1, 2017 169 2 6,632 1,542 31 8,377 Changes to expected credit losses on financial assets already recognized at the beginning of the fiscal year
5 – 131 15 – 151
Changes to expected credit losses on new financial assets originated during the fiscal year
147 2 9,788 4,017 1 13,954
Write-offs (5) (0) (879) (554) (21) (1,459) Unused amounts reversed (92) (2) (1,599) (14) (0) (1,708) Currency translation adjustment (20) (0) (817) (143) 0 (980) as of August 31, 2018 205 2 13,256 4,862 11 18,335
3.7.5 Liquidity risk Liquidity risk arises through a surplus of financial obligations over available financial assets due at any point in time. The Group’s liquidity is ensured by means of regular Group-wide monitoring and planning of liquidity coordinated by the Group’s centralized Treasury department.
Financing needs are covered through a combination of adequate credit lines with financial institutions as well as through short-term and long-term debt capital market products (see Note 3.5 “Financial liabilities”).

Letter to Shareholders Overview Business Highlights Sustainability Our People Financial Reports Governance
Notes to the Consolidated Financial Statements
Barry Callebaut | Annual Report /
Contractual maturities The table below provides an overview of contractual maturities for financial liabilities and derivatives:
as of August 31, 2019 Carrying amount In the first year In the second to the fifth year After five years Contractual amount
in thousands of CHF Non-derivative financial liabilities
Bank overdrafts (132,638) (132,638) – – (132,638) Short-term debt (197,003) (197,003) – – (197,003) Trade payables (632,152) (649,018) – – (649,018) Long-term debt (1,534,453) (44,181) (1,039,242) (690,978) (1,774,401) Other current liabilities1 (313,416) (313,416) – – (313,416)
Derivatives Interest rate derivatives (16,455) (2,219) (9,272) (3,109) (14,600) Currency derivatives
Inflow (23,361) 3,912,524 98,194 – 4,010,718 Outflow 41,006 (4,521,749) (99,100) – (4,620,849)
Commodity derivatives (gross settled) Inflow 69,710 1,101,827 49,702 – 1,151,529 Outflow (79,154) (1,175,234) (19,560) – (1,194,795)
Commodity derivatives (net settled) Inflow 397,925 397,414 511 – 397,925 Outflow (491,897) (490,727) (1,170) – (491,897)
Total net (2,911,888) (2,114,421) (1,019,937) (694,087) (3,828,445)
as of August 31, 2018 Carrying amount In the first year In the second to the fifth year After five years Contractual amount
in thousands of CHF Non-derivative financial liabilities
Bank overdrafts (26,267) (26,267) – – (26,267) Short-term debt (285,048) (285,048) – – (285,048) Trade payables (657,738) (657,738) – – (657,738) Long-term debt (1,168,797) (52,543) (838,238) (520,816) (1,411,597) Other current liabilities1 (282,148) (282,148) – – (282,148)
Derivatives Interest rate derivatives (1,748) (887) (123) – (1,011) Currency derivatives
Inflow (190,688) 3,458,493 6,458 – 3,464,951 Outflow 180,168 (3,443,209) (6,459) – (3,449,669)
Commodity derivatives (gross settled) Inflow (12,841) 1,254,483 43,243 – 1,297,726 Outflow (62,551) (536,345) – – (536,345)
Commodity derivatives (net settled) Inflow 273,712 271,401 2,311 – 273,712 Outflow (346,062) (345,792) (270) – (346,062)
Total net (2,580,009) (645,602) (793,078) (520,816) (1,959,496)
1 Other current liabilities contained accrued expenses and other payables.

Letter to Shareholders Overview Business Highlights Sustainability Our People Financial Reports Governance
Notes to the Consolidated Financial Statements
Barry Callebaut | Annual Report /
3.7.6 Derivative financial instruments
as of August 31, 2019 2018 in thousands of CHF
Derivative financial
assets Derivative financial
liabilities Derivative financial
assets Derivative financial
liabilities Cash flow hedges Interest rate risk
Swaps – 16,455 21 1,769 Cocoa price risk
Forward and futures contracts 405 470 265 1,174 Sugar price risk
Futures contracts 564 12,214 134 8,449 Foreign exchange risk
Forward and futures contracts 2,519 30 – – Fair value hedges Cocoa price risk
Forward and futures contracts 46,038 55,014 72,212 46,908 Foreign exchange risk
Forward and futures contracts 4,450 8,051 5,135 8,726 Other – no hedge accounting Raw materials
Futures contracts and other derivatives 350,919 424,198 201,101 289,531 Forward contract at fair value using fair value option 17,672 72,633 44,037 110,217 Fair value adjustment on risk component for cocoa and chocolate sales and purchase contracts
125,838
80,321
104,004 113,216
Foreign exchange risk Fair value of hedged firm commitments 24,599 18,216 37,985 19,718 Forward and futures contracts 43,281 53,780 37,578 42,289
Total derivative financial assets 616,284 – 502,471 – Total derivative financial liabilities – 741,383 – 641,997
Derivative financial instruments consist of items used in a cash flow hedging model, items used in a fair value hedging model and derivative instruments measured at fair value, for which no hedge accounting is applied.
The position “Other – no hedge accounting” contains the fair values of derivative financial instruments of the Group’s purchasing and sourcing centers and the Group’s centralized Treasury department, which are not designated into a hedge accounting relationship. The forward and future contracts for foreign exchange risks are in an economic hedge relationship.

Letter to Shareholders Overview Business Highlights Sustainability Our People Financial Reports Governance
Notes to the Consolidated Financial Statements
Barry Callebaut | Annual Report /
3.7.7 Offsetting financial assets and financial liabilities The following financial assets and liabilities are subject to offsetting, enforceable master netting arrangements and similar agreements:
Related amounts not set off in the balance sheet as of August 31, 2019
Gross amounts of recognized
financial assets/ liabilities
Gross amounts of recognized
financial liabilities/
assets set off in the balance sheet
Net amounts of financial assets/
liabilities presented in the
balance sheet
Financial instruments
Cash collateral received or
deposited
Net amount
in thousands of CHF Derivative financial assets 616,284 – 616,284 (383,183) 35,663 268,764 Derivative financial liabilities 741,383 – 741,383 (383,183) (42,615) 315,585
Related amounts not set off in the balance sheet as of August 31, 2018
Gross amounts of recognized
financial assets/ liabilities
Gross amounts of recognized
financial liabilities/
assets set off in the balance sheet
Net amounts of financial assets/
liabilities presented in the
balance sheet
Financial instruments
Cash collateral received or
deposited
Net amount
in thousands of CHF Derivative financial assets 502,471 – 502,471 (210,497) 10,813 302,787 Derivative financial liabilities 641,997 – 641,997 (210,497) (44,464) 387,036
For the financial assets and liabilities subject to enforceable master netting arrangements or similar arrangements above, each agreement between the Group and the counterparty allows for net settlement of the relevant financial assets and liabilities when both elect to settle on a net basis. In the absence of such an election, financial assets and liabilities will be settled on a gross basis, however, each party to the master netting agreement or similar agreement will have the option to settle all such amounts on a net basis in the event of default, insolvency or bankruptcy or following other events predefined in the contract by the counterparty. The cash collateral received and deposited is reported on lines “Trade payables and other current liabilities” and “Trade receivables and other current assets” in the Consolidated Balance Sheet.
Letter to Shareholders Overview Business Highlights Sustainability Our People Financial Reports Governance
Notes to the Consolidated Financial Statements
Barry Callebaut | Annual Report /
3.7.8 Fair value of financial instruments a) Methods and assumptions The carrying value of the following financial instruments approximates fair value because of the short period to maturity: • Cash and cash equivalents • Trade receivables • Other receivables representing financial instruments • Other current assets representing financial instruments • Trade payables • Bank overdrafts • Short-term deposits • Short-term debt • Other payables representing financial instruments • Other current liabilities representing financial instruments Long-term debt In calculating the fair value of long-term debts, future principal and interest payments are discounted at market interest rates.
Derivative financial assets and liabilities The fair value measurement of some derivatives requires assumptions and management’s assessment of certain market parameters. Whenever possible, fair valuation is based on market prices. If required a valuation model which takes into consideration discounted cash flows, dealer and supplier quotes for similar instruments and recent arm’s-length transactions is used. This valuation model takes into account the specific characteristics of the underlying assets or commodities such as the cost of carry, differentials for the properties and technical ratios reflecting production yield.

Letter to Shareholders Overview Business Highlights Sustainability Our People Financial Reports Governance
Notes to the Consolidated Financial Statements
Barry Callebaut | Annual Report /
Carrying amount and fair value of each class of financial assets and liabilities are presented in the table below:
as of August 31, 2019
Financial assets (mandatorily)
measured at fair value through
profit or loss
Financial assets measured at
amortized cost
Financial liabilities (mandatorily)
measured at fair value through
profit or loss
Financial liabilities measured at
amortized cost
Total carrying amount
Fair value
in thousands of CHF Cash and cash equivalents – 557,827 – – 557,827 557,827 Short-term deposits – 1,549 – – 1,549 1,549 Trade receivables 84,387 364,809 – – 449,196 449,196 Derivative financial assets 616,284 – – – 616,284 616,284 Accrued income – 32,689 – – 32,689 32,689 Loans and other receivables – 63,945 – – 63,945 63,945 Other current financial assets – 18,823 – – 18,823 18,823 Other non-current financial assets1 – 16,049 – – 16,049 16,049 Total financial assets 700,671 1,055,690 – – 1,756,361 1,756,361 Bank overdrafts – – – 132,638 132,638 132,638 Short-term debt – – – 197,003 197,003 197,003 Trade payables – – – 632,152 632,152 632,152 Accrued expenses – – – 110,635 110,635 110,635 Other payables – – – 202,782 202,782 202,782 Derivative financial liabilities – – 741,383 – 741,383 741,383 Long-term debt – – – 1,534,453 1,534,453 1,638,705 Total financial liabilities – – 741,383 2,809,663 3,551,046 3,655,298
1 Other non-current financial assets contained long-term deposits.
as of August 31, 2018
Financial assets (mandatorily)
measured at fair value through
profit or loss
Financial assets measured at
amortized cost
Financial liabilities (mandatorily)
measured at fair value through
profit or loss
Financial liabilities measured at
amortized cost
Total carrying amount
Fair value
in thousands of CHF Cash and cash equivalents – 404,183 – – 404,183 404,183 Short-term deposits – 1,656 – – 1,656 1,656 Trade receivables 111,456 363,790 – – 475,246 475,246 Derivative financial assets 502,471 – – – 502,471 502,471 Accrued income – 33,124 – – 33,124 33,124 Loans and other receivables – 47,804 – – 47,804 47,804 Other current financial assets – 10,410 – – 10,410 10,410 Other non-current financial assets1 – 3,887 – – 3,887 3,887 Total financial assets 613,927 864,854 – – 1,478,781 1,478,781 Bank overdrafts – – – 26,267 26,267 26,267 Short-term debt – – – 285,048 285,048 285,048 Trade payables – – – 657,738 657,738 657,738 Accrued expenses – – – 123,866 123,866 123,866 Other payables – – – 158,282 158,282 158,282 Derivative financial liabilities – – 641,997 – 641,997 641,997 Long-term debt – – – 1,168,797 1,168,797 1,275,107 Total financial liabilities – – 641,997 2,419,998 3,061,995 3,168,304
1 Other non-current financial assets contained long-term deposits and financial assets related to long-term partnership agreements.

Letter to Shareholders Overview Business Highlights Sustainability Our People Financial Reports Governance
Notes to the Consolidated Financial Statements
Barry Callebaut | Annual Report /
b) Fair value hierarchy of financial instruments The fair value measurements of financial assets and liabilities are classified using a fair value hierarchy that reflects the significance of the inputs used in making the measurements. The fair value hierarchy has the following levels: • Level 1: The fair value is based on unadjusted, quoted prices in active markets which
give the best possible objective indication for the fair value of a financial asset or liability. A market is regarded as active if quoted prices are readily and regularly available from an exchange, dealer, broker or pricing service, and those prices represent actual and regularly occurring market transactions on an arm’s-length basis.
• Level 2: The estimation of the fair value is based on the results of a valuation model. The valuation model for commodity derivatives includes quoted prices in active markets, recent arm’s-length transactions or dealer and supplier quotes adjusted for the specific characteristics of the underlying commodities such as the cost of carry, differentials for the properties and conversion yields. Corroborated market data is used for the valuation of foreign exchange and interest rate derivatives. If all significant inputs required to fair value an instrument are observable, the instrument is included in Level 2.
• Level 3: The valuation models used are based on parameters and assumptions not observable on the market.
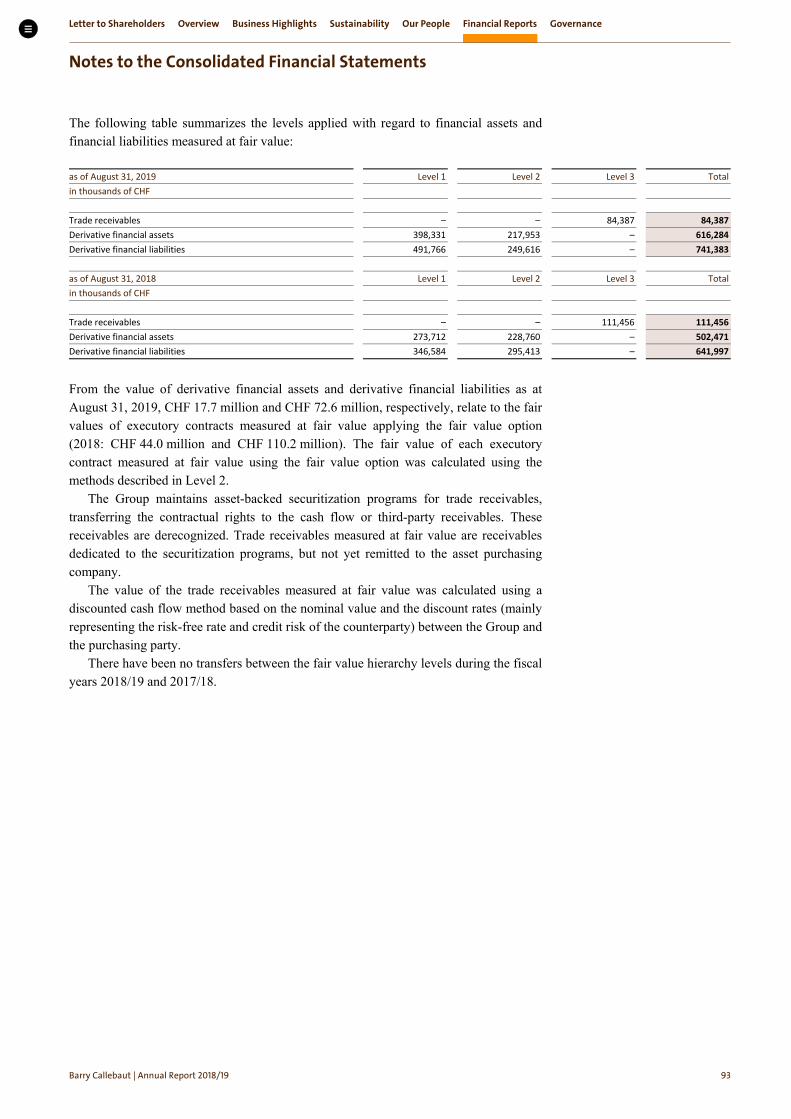
Letter to Shareholders Overview Business Highlights Sustainability Our People Financial Reports Governance
Notes to the Consolidated Financial Statements
Barry Callebaut | Annual Report /
The following table summarizes the levels applied with regard to financial assets and financial liabilities measured at fair value:
as of August 31, 2019 Level 1 Level 2 Level 3 Total in thousands of CHF Trade receivables – – 84,387 84,387 Derivative financial assets 398,331 217,953 – 616,284 Derivative financial liabilities 491,766 249,616 – 741,383 as of August 31, 2018 Level 1 Level 2 Level 3 Total in thousands of CHF Trade receivables – – 111,456 111,456 Derivative financial assets 273,712 228,760 – 502,471 Derivative financial liabilities 346,584 295,413 – 641,997
From the value of derivative financial assets and derivative financial liabilities as at August 31, 2019, CHF 17.7 million and CHF 72.6 million, respectively, relate to the fair values of executory contracts measured at fair value applying the fair value option (2018: CHF 44.0 million and CHF 110.2 million). The fair value of each executory contract measured at fair value using the fair value option was calculated using the methods described in Level 2.
The Group maintains asset-backed securitization programs for trade receivables, transferring the contractual rights to the cash flow or third-party receivables. These receivables are derecognized. Trade receivables measured at fair value are receivables dedicated to the securitization programs, but not yet remitted to the asset purchasing company.
The value of the trade receivables measured at fair value was calculated using a discounted cash flow method based on the nominal value and the discount rates (mainly representing the risk-free rate and credit risk of the counterparty) between the Group and the purchasing party.
There have been no transfers between the fair value hierarchy levels during the fiscal years 2018/19 and 2017/18.

Letter to Shareholders Overview Business Highlights Sustainability Our People Financial Reports Governance
Notes to the Consolidated Financial Statements
Barry Callebaut | Annual Report /
3.7.9 Effect of hedge accounting on the financial position and performance a) Impact of hedging instruments designated in hedging relationships The impact of hedging instruments designated in hedging relationships as of August 31, 2019, on the Group’s Consolidated Balance Sheet is as follows:
in CHF million
Nominal amount of the hedging
instrument
Carrying amount of the hedging instrument
Line item in the Consolidated
Balance Sheet where the
hedging instrument is
reported
Fair value changes of the
hedging instrument used
as a basis to calculate hedge ineffectiveness
as of August 31, 2019 Assets Liabilities Cash flow hedges Interest rate risk
Swaps
364.4
–
16.5
Derivative financial assets
Derivative financial liabilities
(23.4)
Cocoa price risk Futures contracts
(19.6)
0.4
0.5
Derivative financial assets
Derivative financial liabilities
–
Sugar price risk Futures contracts
105.5
0.6
12.2
Derivative financial assets
Derivative financial liabilities
(5.9)
Foreign exchange risk Forward and futures contracts
49.2
2.5
–
Derivative financial assets
Derivative financial liabilities
2.7
Fair value hedges Cocoa price risk
Futures contracts
(40.2)
46.0
55.0
Derivative financial assets
Derivative financial liabilities
24.6
Foreign exchange risk Forward and futures contracts
(600.5)
4.5
8.1
Derivative financial assets
Derivative financial liabilities
5.9
Receivables 235.5
235.5
–
Trade receivables and other current
assets
0.3
Payables (178.4)
–
178.4
Trade payables and other current
liabilities
0.6
Debts 2.1 – 2.1 Short-term debt 0.0
Cash instruments 4.7
4.7
–
Cash and cash equivalents
–

Letter to Shareholders Overview Business Highlights Sustainability Our People Financial Reports Governance
Notes to the Consolidated Financial Statements
Barry Callebaut | Annual Report /
in CHF million
Nominal amount of the hedging
instrument
Carrying amount of the hedging instrument
Line item in the Consolidated
Balance Sheet where the
hedging instrument is
reported
Fair value changes of the
hedging instrument used
as a basis to calculate hedge ineffectiveness
as of August 31, 2018 Assets Liabilities Cash flow hedges Interest rate risk
Swaps
339.2
–
1.8
Derivative financial assets
Derivative financial liabilities
5.0
Cocoa price risk Futures contracts
(16.6)
0.3
1.2
Derivative financial assets
Derivative financial liabilities
(2.0)
Sugar price risk Futures contracts
57.5
0.1
8.5
Derivative financial assets
Derivative financial liabilities
(8.9)
Foreign exchange risk Forward and futures contracts
(10.6)
–
–
Derivative financial assets
Derivative financial liabilities
2.4
Fair value hedges Cocoa price risk
Futures contracts
394.5
72.2
46.9
Derivative financial assets
Derivative financial liabilities
48.9
Foreign exchange risk Forward and futures contracts
16.5
5.1
8.7
Derivative financial assets
Derivative financial liabilities
(0.4)
Receivables 323.4
323.4
–
Trade receivables and other current
assets
3.1
Payables (384.7)
–
384.7
Trade payables and other current
liabilities
(4.0)
Debts 1.8 – 1.8 Short-term debt 0.0
Cash instruments 36.6
36.6
–
Cash and cash equivalents
0.7

Letter to Shareholders Overview Business Highlights Sustainability Our People Financial Reports Governance
Notes to the Consolidated Financial Statements
Barry Callebaut | Annual Report /
b) Impact of hedged items designated in hedging relationships The impact of hedged items designated in hedging relationships as of August 31, 2019, on the Group’s Consolidated Balance Sheet is as follows:
in CHF million Carrying amount of the hedged item
Accumulated amount of fair value hedge
adjustments included in the carrying amount of the
hedged item
From the accumulated amount of fair value hedge adjustments: part related
to hedged items that ceased to be adjusted for
hedging gains or losses
Line item in the
Consolida- ted Balance
Sheet where the
hedged item is
reported
Fair value changes of
the hedged item used
as a basis to calculate
hedge ineffec-
tiveness
Cash flow hedge
reserve
as of August 31, 2019 Assets Liabilities Assets Liabilities Assets Liabilities Cash flow hedges Interest rate risk
Forecasted interest payments n/a
n/a n/a
n/a n/a
n/a n/a 24.0 (23.3)
Cocoa price risk Forecasted cocoa sales n/a n/a n/a n/a n/a n/a n/a – (0.1)
Sugar price risk Forecasted sugar purchases n/a
n/a n/a
n/a n/a
n/a n/a 6.2 (9.9)
Foreign exchange risk Forecasted purchase and sales transactions denominated in foreign currency
n/a
n/a
n/a
n/a
n/a
n/a
n/a
(2.8) 2.4
Fair value hedges Cocoa price risk
Cocoa and chocolate stocks 1,063.2 (60.8) – Inventories (59.4) n/a
Risk component of cocoa and chocolate purchase and sales contracts
125.8 80.3 125.8 80.3 – – Derivative financial
assets Derivative
financial liabilities
32.7 n/a
Foreign exchange risk Firm purchase and sales commitments denominated in foreign currency
24.6 18.2 24.6 18.2 – – Derivative financial
assets Derivative
financial liabilities
(4.0) n/a

Letter to Shareholders Overview Business Highlights Sustainability Our People Financial Reports Governance
Notes to the Consolidated Financial Statements
Barry Callebaut | Annual Report /
in CHF million Carrying amount of the hedged item
Accumulated amount of fair value hedge
adjustments included in the carrying amount of the
hedged item
From the accumulated amount of fair value hedge adjustments: part related
to hedged items that ceased to be adjusted for
hedging gains or losses
Line item in the
Consolida- ted Balance
Sheet where the
hedged item is
reported
Fair value changes of
the hedged item used
as a basis to calculate
hedge ineffec-
tiveness
Cash flow hedge
reserve
as of August 31, 2018 Assets Liabilities Assets Liabilities Assets Liabilities Cash flow hedges Interest rate risk
Forecasted interest payments n/a
n/a n/a
n/a n/a
n/a n/a (5.0) (8.1)
Cocoa price risk Forecasted cocoa sales n/a n/a n/a n/a n/a n/a n/a 2.0 (1.1)
Sugar price risk Forecasted sugar purchases n/a
n/a n/a
n/a n/a
n/a n/a 8.9 (8.9)
Foreign exchange risk Forecasted purchase and sales transactions denominated in foreign currency
n/a
n/a
n/a
n/a
n/a
n/a
n/a
(2.4) 1.8
Fair value hedges Cocoa price risk
Cocoa and chocolate stocks 691.0 – (4.3) – – – Inventories (11.9) n/a
Risk component of cocoa and chocolate purchase and sales contracts
104.0 113.2 104.0 113.2 – – Derivative financial
assets Derivative
financial liabilities
(38.4) n/a
Foreign exchange risk Firm purchase and sales commitments denominated in foreign currency
38.0 19.7 38.0 19.7 – – Derivative financial
assets Derivative
financial liabilities
0.6 n/a

Letter to Shareholders Overview Business Highlights Sustainability Our People Financial Reports Governance
Notes to the Consolidated Financial Statements
Barry Callebaut | Annual Report /
c) Impact of the hedging relationships on the Consolidated Income Statement and other comprehensive income The above hedging relationships affected the Consolidated Income Statement and other comprehensive income, as follows:
Cash flow hedges
Change in the fair value of the
hedging instrument recognized
in other comprehensive
income
Hedge ineffectiveness
recognized in the Consolidated
Income Statement
Amount reclassified from
the cash flow hedge reserve to the Consolidated
Income Statement
Line item in the
Consolidated Income
Statement impacted by the
reclassification from cash flow hedge reserve
as of August 31, 2019 in CHF million Interest rate risk (23.4) – 2.1 Finance expense Cocoa price risk 0.0 – 1.1 Cost of goods sold Sugar price risk (5.9) – 4.6 Cost of goods sold Foreign exchange risk 2.7 – (2.0) Cost of goods sold
Cash flow hedges
Change in the fair value of the
hedging instrument recognized
in other comprehensive
income
Hedge ineffectiveness
recognized in the Consolidated
Income Statement
Amount reclassified from
the cash flow hedge reserve to the Consolidated
Income Statement
Line item in the
Consolidated Income
Statement impacted by the
reclassification from cash flow hedge reserve
as of August 31, 2018 in CHF million Interest rate risk 5.0 – 0.1 Finance expense Cocoa price risk (2.0) – 0.9 Cost of goods sold Sugar price risk (9.8) – (3.1) Cost of goods sold Fuel oil price risk 0.5 – 0.1 Cost of goods sold Foreign exchange risk 2.4 – 2.8 Cost of goods sold
This table includes the changes in the fair value of the hedging instruments recognized in other comprehensive income throughout the entire fiscal year 2018/19 (including hedge accounting relationships ended before August 31, 2019).
The table in section 3.7.9a “Impact of hedging instruments designated in hedging relationships” (refer to column “Fair value changes of the hedging instrument used as a basis to calculate hedge ineffectiveness”) includes the fair value changes of hedging instruments that are related to hedge accounting relationships, which were still active as at August 31, 2019.
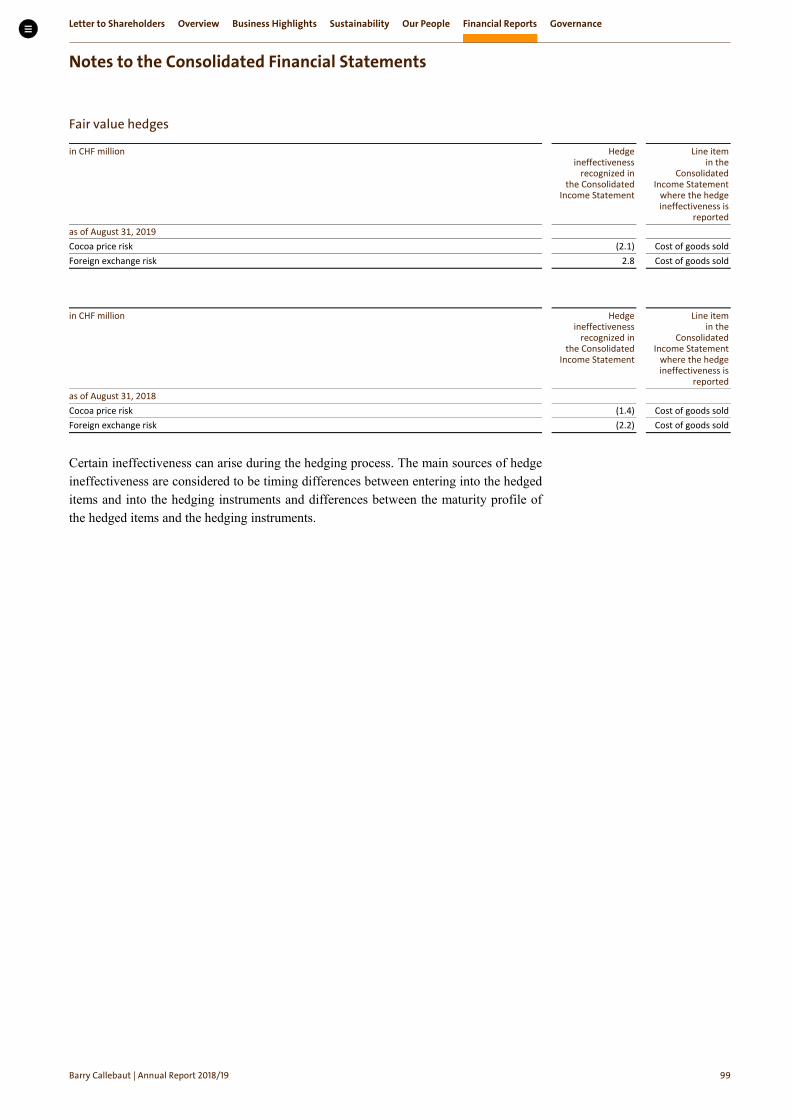
Letter to Shareholders Overview Business Highlights Sustainability Our People Financial Reports Governance
Notes to the Consolidated Financial Statements
Barry Callebaut | Annual Report /
Fair value hedges
in CHF million Hedge ineffectiveness
recognized in the Consolidated
Income Statement
Line item in the
Consolidated Income Statement
where the hedge ineffectiveness is
reported as of August 31, 2019 Cocoa price risk (2.1) Cost of goods sold Foreign exchange risk 2.8 Cost of goods sold
in CHF million Hedge ineffectiveness
recognized in the Consolidated
Income Statement
Line item in the
Consolidated Income Statement
where the hedge ineffectiveness is
reported as of August 31, 2018 Cocoa price risk (1.4) Cost of goods sold Foreign exchange risk (2.2) Cost of goods sold
Certain ineffectiveness can arise during the hedging process. The main sources of hedge ineffectiveness are considered to be timing differences between entering into the hedged items and into the hedging instruments and differences between the maturity profile of the hedged items and the hedging instruments.

Letter to Shareholders Overview Business Highlights Sustainability Our People Financial Reports Governance
Notes to the Consolidated Financial Statements
Barry Callebaut | Annual Report /
The following table provides further information about the effect of cash flow hedges on equity:
in thousands of CHF
Cocoa price risk Sugar price risk Fuel oil price risk Foreign exchange risk
Interest rate risk Total hedging reserve
as of September 1, 2017 (138) 2,238 (594) (3,136) (10,682) (12,312)
Gains/(losses) taken into equity (1,952) (9,819) 482 2,413 5,015 (3,862) Transfer to initial carrying amount of the hedged item
– 932 – 31 – 963
Transfer to the Consolidated Income Statement for the period
931 (3,124) 133 2,760 65 765
thereof: due to hedged item affected the Consolidated Income Statement
931 (3,124) 133 2,760 65 765
Tax effect on cashflow hedges 51 893 (24) (229) (2,566) (1,875) Currency translation adjustment 7 10 4 (1) 47 66
as of August 31, 2018 (1,101) (8,871) 0 1,837 (8,122) (16,256)
Gains/(losses) taken into equity 8 (5,859) – 2,747 (23,449) (26,553) Transfer to initial carrying amount of the hedged item
– (183) – (95) – (279)
Transfer to the Consolidated Income Statement for the period
1,088 4,589 – (1,958) 2,149 5,867
thereof: due to hedged item affected the Consolidated Income Statement
1,088 4,589 – (1,958) 2,149 5,867
Tax effect on cashflow hedges (37) 447 – (104) 5,363 5,669 Currency translation adjustment (16) (18) – – 811 777
as of August 31, 2019 (58) (9,896) 0 2,427 (23,247) (30,775)
3.7.10 Timing, nominal amount and pricing of hedging instruments The following table provides information about the maturity of the nominal amount and interest rates attached to the swaps held by the Group as of August 31, 2019, to hedge its interest rate risk:
as of August 31, 2019 Period of maturity
First year Second to fifth
year After five years Total
Nominal amount (CHF million) – 136.2 228.2 364.3 Average interest rate – 0.18% 0.51% n/a
as of August 31, 2018 Period of maturity
First year Second to fifth
year After five years Total
Nominal amount (CHF million) 197.8 141.3 – 339.2 Average interest rate 1.85% 0.18% – n/a
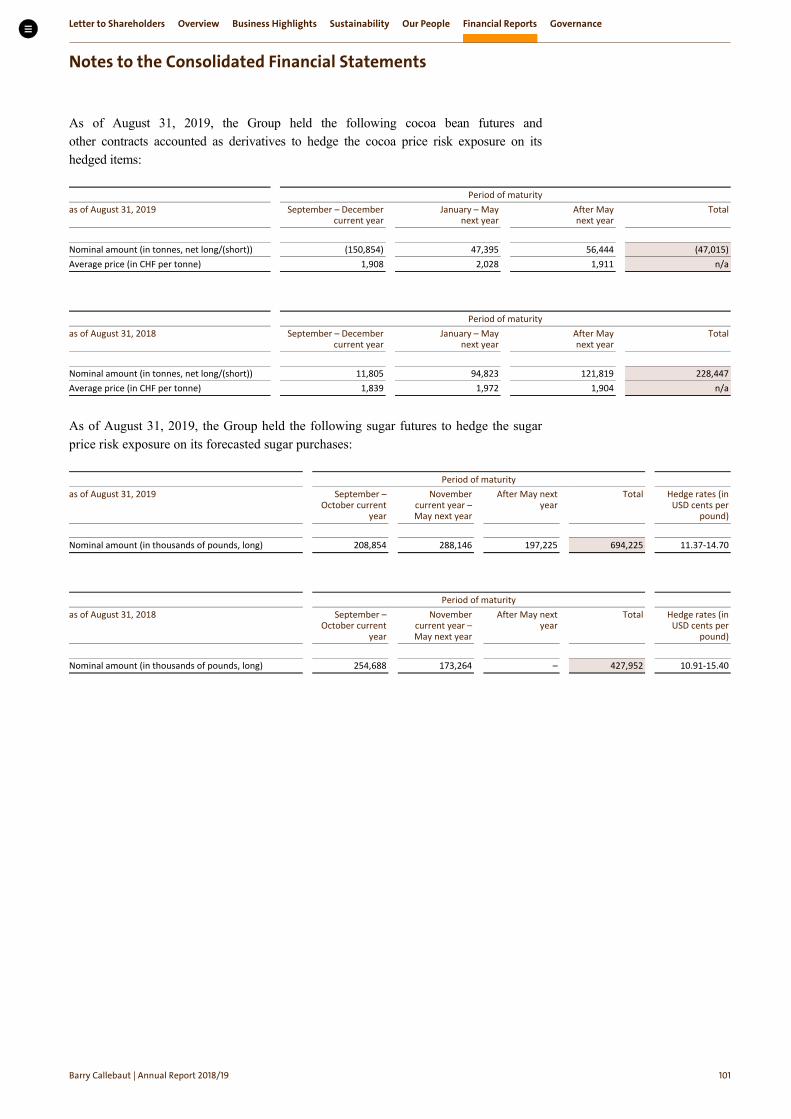
Letter to Shareholders Overview Business Highlights Sustainability Our People Financial Reports Governance
Notes to the Consolidated Financial Statements
Barry Callebaut | Annual Report /
As of August 31, 2019, the Group held the following cocoa bean futures and other contracts accounted as derivatives to hedge the cocoa price risk exposure on its hedged items:
Period of maturity as of August 31, 2019 September – December
current year January – May
next year After May next year
Total
Nominal amount (in tonnes, net long/(short)) (150,854) 47,395 56,444 (47,015) Average price (in CHF per tonne) 1,908 2,028 1,911 n/a
Period of maturity as of August 31, 2018 September – December
current year January – May
next year After May next year
Total
Nominal amount (in tonnes, net long/(short)) 11,805 94,823 121,819 228,447 Average price (in CHF per tonne) 1,839 1,972 1,904 n/a
As of August 31, 2019, the Group held the following sugar futures to hedge the sugar price risk exposure on its forecasted sugar purchases:
Period of maturity as of August 31, 2019
September –
October current year
November current year – May next year
After May next year
Total
Hedge rates (in USD cents per
pound) Nominal amount (in thousands of pounds, long) 208,854 288,146 197,225 694,225 11.37-14.70
Period of maturity as of August 31, 2018
September –
October current year
November current year – May next year
After May next year
Total
Hedge rates (in USD cents per
pound) Nominal amount (in thousands of pounds, long) 254,688 173,264 – 427,952 10.91-15.40

Letter to Shareholders Overview Business Highlights Sustainability Our People Financial Reports Governance
Notes to the Consolidated Financial Statements
Barry Callebaut | Annual Report /
Information about the foreign exchange forwards and futures in case of the major foreign currency hedging pairs held by the Group as of August 31, 2019, to hedge its foreign exchange risk:
as of August 31, 2019 Period of maturity Current year Next year After next year Total
GBP exposure hedging in entities whose functional currency is EUR
Nominal amount (CHF million, long/(short)) 48.2 (275.1) (2.0) (228.9) Average foreign exchange rate (EUR/GBP) 0.935 0.924 0.959 n/a
USD exposure hedging in entities whose functional currency is EUR Nominal amount (CHF million, long/(short)) (57.8) (41.0) (1.8) (100.6) Average foreign exchange rate (EUR/USD) 1.053 1.136 1.068 n/a
GBP exposure hedging in entities whose functional currency is USD Nominal amount (CHF million, long/(short)) 87.2 (77.1) (27.5) (17.3) Average foreign exchange rate (USD/GBP) 0.781 0.783 0.806 n/a
USD exposure hedging in entities whose functional currency is BRL Nominal amount (CHF million, long/(short)) 179.2 – – 179.2 Average foreign exchange rate (BRL/USD) 0.253 – – n/a
as of August 31, 2018 Period of maturity Current year Next year After next year Total
GBP exposure hedging in entities whose functional currency is EUR
Nominal amount (CHF million, long/(short)) 247.1 (419.5) (1.6) (174.0) Average foreign exchange rate (EUR/GBP) 0.890 0.898 0.909 n/a
USD exposure hedging in entities whose functional currency is EUR Nominal amount (CHF million, long/(short)) (113.8) 185.4 (0.1) 71.6 Average foreign exchange rate (EUR/USD) 1.186 1.227 1.180 n/a
GBP exposure hedging in entities whose functional currency is USD Nominal amount (CHF million, long/(short)) 107.5 (37.6) 1.9 71.8 Average foreign exchange rate (USD/GBP) 0.747 0.742 0.731 n/a
USD exposure hedging in entities whose functional currency is BRL Nominal amount (CHF million, long/(short)) (67.9) – – (67.9) Average foreign exchange rate (BRL/USD) 0.250 – – n/a
Accounting policies Derivative financial instruments
Derivative financial instruments are accounted for at fair value with fair value changes recognized in the Consolidated Income Statement.
As the Group also acts as a cocoa bean trader, certain cocoa bean purchase and sales contracts are net cash settled and therefore, contracts allocated to the same portfolio are treated as derivative contracts.
Additionally, the Group applies the fair value option for its third-party executory forward purchase and sales contracts (available under IFRS 9 as an alternative to the off-balance sheet treatment). These exemptions are applied for those cocoa contracts where the measurement eliminates or significantly reduces an accounting mismatch that would otherwise occur on own use contracts.
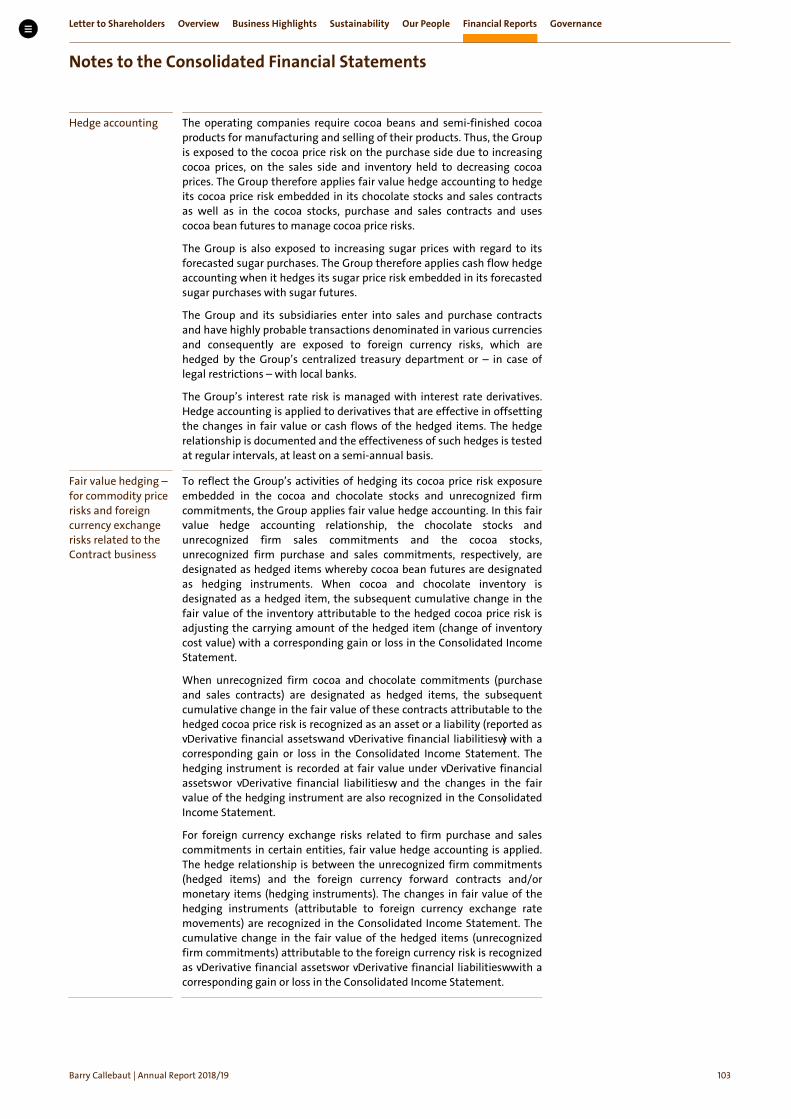
Letter to Shareholders Overview Business Highlights Sustainability Our People Financial Reports Governance
Notes to the Consolidated Financial Statements
Barry Callebaut | Annual Report /
Hedge accounting
The operating companies require cocoa beans and semi-finished cocoa products for manufacturing and selling of their products. Thus, the Group is exposed to the cocoa price risk on the purchase side due to increasing cocoa prices, on the sales side and inventory held to decreasing cocoa prices. The Group therefore applies fair value hedge accounting to hedge its cocoa price risk embedded in its chocolate stocks and sales contracts as well as in the cocoa stocks, purchase and sales contracts and uses cocoa bean futures to manage cocoa price risks.
The Group is also exposed to increasing sugar prices with regard to its forecasted sugar purchases. The Group therefore applies cash flow hedge accounting when it hedges its sugar price risk embedded in its forecasted sugar purchases with sugar futures.
The Group and its subsidiaries enter into sales and purchase contracts and have highly probable transactions denominated in various currencies and consequently are exposed to foreign currency risks, which are hedged by the Group’s centralized treasury department or – in case of legal restrictions – with local banks.
The Group’s interest rate risk is managed with interest rate derivatives. Hedge accounting is applied to derivatives that are effective in offsetting the changes in fair value or cash flows of the hedged items. The hedge relationship is documented and the effectiveness of such hedges is tested at regular intervals, at least on a semi-annual basis.
Fair value hedging – for commodity price risks and foreign currency exchange risks related to the Contract business
To reflect the Group’s activities of hedging its cocoa price risk exposure embedded in the cocoa and chocolate stocks and unrecognized firm commitments, the Group applies fair value hedge accounting. In this fair value hedge accounting relationship, the chocolate stocks and unrecognized firm sales commitments and the cocoa stocks, unrecognized firm purchase and sales commitments, respectively, are designated as hedged items whereby cocoa bean futures are designated as hedging instruments. When cocoa and chocolate inventory is designated as a hedged item, the subsequent cumulative change in the fair value of the inventory attributable to the hedged cocoa price risk is adjusting the carrying amount of the hedged item (change of inventory cost value) with a corresponding gain or loss in the Consolidated Income Statement.
When unrecognized firm cocoa and chocolate commitments (purchase and sales contracts) are designated as hedged items, the subsequent cumulative change in the fair value of these contracts attributable to the hedged cocoa price risk is recognized as an asset or a liability (reported as “Derivative financial assets” and “Derivative financial liabilities”) with a corresponding gain or loss in the Consolidated Income Statement. The hedging instrument is recorded at fair value under “Derivative financial assets” or “Derivative financial liabilities”, and the changes in the fair value of the hedging instrument are also recognized in the Consolidated Income Statement.
For foreign currency exchange risks related to firm purchase and sales commitments in certain entities, fair value hedge accounting is applied. The hedge relationship is between the unrecognized firm commitments (hedged items) and the foreign currency forward contracts and/or monetary items (hedging instruments). The changes in fair value of the hedging instruments (attributable to foreign currency exchange rate movements) are recognized in the Consolidated Income Statement. The cumulative change in the fair value of the hedged items (unrecognized firm commitments) attributable to the foreign currency risk is recognized as “Derivative financial assets” or “Derivative financial liabilities” with a corresponding gain or loss in the Consolidated Income Statement.
Letter to Shareholders Overview Business Highlights Sustainability Our People Financial Reports Governance
Notes to the Consolidated Financial Statements
Barry Callebaut | Annual Report /
Cash flow hedging – for commodity price risks (cocoa and sugar price risk) and foreign currency exchange risks arising from forecasted purchase and sales transactions
The Group enters into sugar futures to hedge the sugar price risk exposure embedded in certain forecasted sugar purchases, and into foreign exchange forwards and futures contracts to hedge the currency risk arising from these forecasted sugar purchases.
The Group applies cash flow hedge accounting for these hedging relationships whereby the sugar futures and the foreign exchange forwards and futures are designated as hedging instruments to hedge the variability in cash flows attributable to the risk of sugar price movements and to the foreign currency risk, respectively, in the hedged forecasted sugar purchases.
Where no firm commitments exist, the Group also enters into exchange traded cocoa bean futures to hedge the cocoa price risk arising from forecasted sales of cocoa ingredients, and into foreign exchange forwards and futures contracts to hedge the currency risk arising from forecasted cocoa sales transactions denominated in foreign currencies.
The related entities apply cash flow hedge accounting whereby the cocoa bean futures and the foreign exchange forwards and futures are designated as hedging instruments to the underlying forecasted sales to hedge the variability in cash flow that is attributable to the risk of cocoa price movements and to the foreign exchange risk, respectively.
Cash flow hedging – for interest rate risks
Barry Callebaut applies cash flow hedge accounting for interest rate derivatives, converting a portion of floating rate borrowings to fixed rate borrowings.
Accounting for cash flow hedges
For each cash flow hedge relationship, the effective part of any gain or loss on the derivative financial instrument is recognized directly in other comprehensive income. Gains or losses that are recognized in other comprehensive income are transferred to the Consolidated Income Statement in the same period in which the hedged exposure affects the Consolidated Income Statement. The ineffective part of any gain or loss is recognized immediately in the Consolidated Income Statement at the time hedge effectiveness is tested.
Hedge accounting is discontinued when the hedging instrument expires or is sold, terminated or exercised, or no longer qualifies for hedge accounting. At that point in time, any cumulative gain or loss on the hedging instrument recognized in other comprehensive income is kept in other comprehensive income until the forecasted transaction occurs. If a hedged transaction is no longer expected to occur, the net cumulative gain or loss recognized in other comprehensive income is immediately transferred to the Consolidated Income Statement.
No hedge accounting designation
The Group’s purchasing and sourcing centers and the Group’s centralized Treasury department have derivative financial instruments that are measured at fair value without being assigned to a hedge accounting relationship.
Price List business commodity risk hedging is based on forecasted sales volume and excluded from hedge accounting, as no derivatives can be clearly designated to the forecasted price list sales. Therefore, these derivatives are carried at fair value with fair value changes recognized in the Consolidated Income Statement.

Letter to Shareholders Overview Business Highlights Sustainability Our People Financial Reports Governance
Notes to the Consolidated Financial Statements
Barry Callebaut | Annual Report /
. Financial result
Composition of Finance income in thousands of CHF 2018/19 2017/18 Interest income 10,644 6,368 Share of result of equity-accounted investees, net of tax 235 171 Total finance income 10,879 6,539
Composition of Finance expense in thousands of CHF 2018/19 2017/18 Interest expense (137,806) (89,638) Amortization of structuring fees (3,997) (2,610) Charges on undrawn portion of committed credit facilities (2,082) (2,737) Net interest costs related to defined benefit plans (Note 4.2) (4,511) (4,852) Total interest expense (148,396) (99,837) Bank charges and other financial expense (4,640) (5,091) Foreign exchange losses, net (1,701) (1,120) Loss on derivative financial instruments (4,562) (1,640) Total finance expense (159,299) (107,687)
Interest expenses include the cost of interest rate swaps and result from paying fixed interest rates in exchange for receiving floating interest rates. All interest rate derivative financial instruments are in a cash flow hedge relationship resulting in the fact that changes in fair value are recognized in other comprehensive income.
Interest expenses for fiscal year 2018/19 increased by CHF 48.2 million mainly attributable to the early repayment on August 1, 2019 of the EUR 250 million Senior Note, issued June 2011, with an original expiry date June 15, 2021.
Structuring fees are mainly attributable to the amortization of fees capitalized for the EUR 750 million Revolving Credit Facility (as amended and extended from time to time), the USD 400 million Senior Note, issued June 2013, the EUR 450 million Senior Note, issued May 2016, and the EUR 600 million (equivalent) Schuldscheindarlehen, issued February 2019.
The foreign exchange losses are mainly attributable to price volatility in the global foreign currency markets.
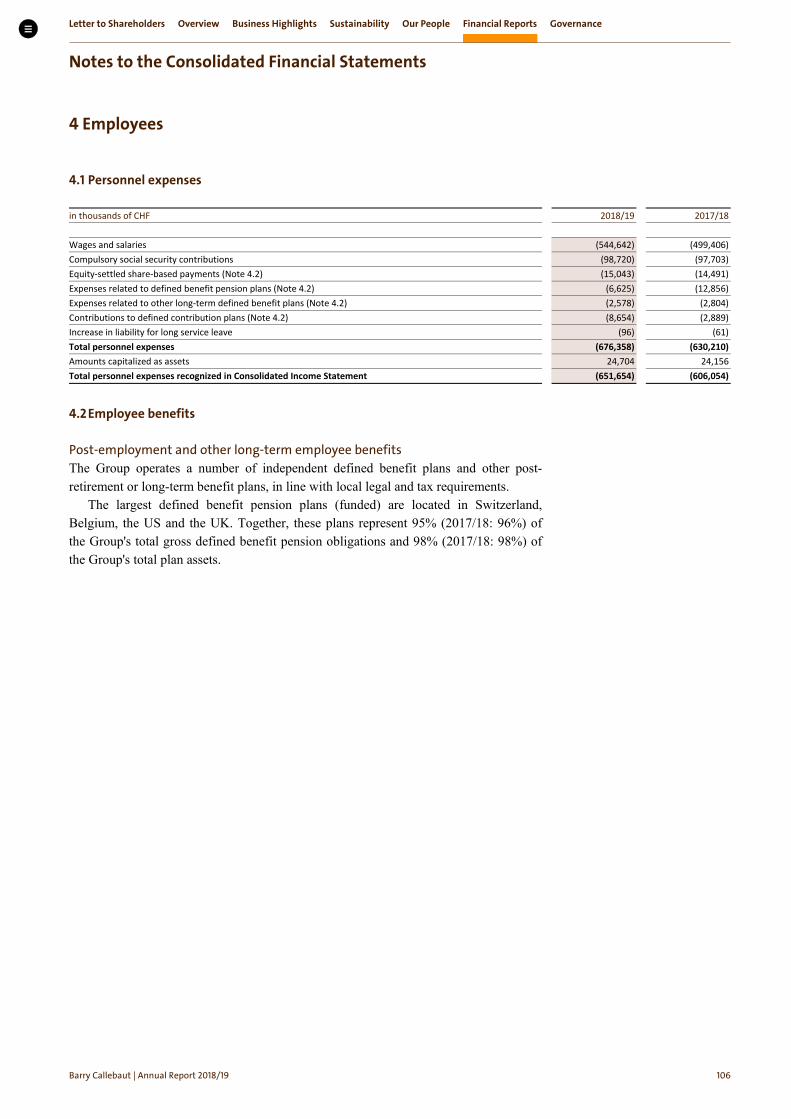
Letter to Shareholders Overview Business Highlights Sustainability Our People Financial Reports Governance
Notes to the Consolidated Financial Statements
Barry Callebaut | Annual Report /
Employees
. Personnel expenses
in thousands of CHF 2018/19 2017/18 Wages and salaries (544,642) (499,406) Compulsory social security contributions (98,720) (97,703) Equity-settled share-based payments (Note 4.2) (15,043) (14,491) Expenses related to defined benefit pension plans (Note 4.2) (6,625) (12,856) Expenses related to other long-term defined benefit plans (Note 4.2) (2,578) (2,804) Contributions to defined contribution plans (Note 4.2) (8,654) (2,889) Increase in liability for long service leave (96) (61) Total personnel expenses (676,358) (630,210) Amounts capitalized as assets 24,704 24,156 Total personnel expenses recognized in Consolidated Income Statement (651,654) (606,054)
. Employee benefits Post-employment and other long-term employee benefits The Group operates a number of independent defined benefit plans and other post-retirement or long-term benefit plans, in line with local legal and tax requirements.
The largest defined benefit pension plans (funded) are located in Switzerland, Belgium, the US and the UK. Together, these plans represent 95% (2017/18: 96%) of the Group's total gross defined benefit pension obligations and 98% (2017/18: 98%) of the Group's total plan assets.

Letter to Shareholders Overview Business Highlights Sustainability Our People Financial Reports Governance
Notes to the Consolidated Financial Statements
Barry Callebaut | Annual Report /
The amounts recognized in the Consolidated Balance Sheet are as follows:
as of August 31, 2019 2018 2019 2018 in thousands of CHF Defined benefit pension plans Other long-term benefit
plans Funded Unfunded Total Funded Unfunded Total Total Total Switzerland
Weighted average duration in years 18 Present value of obligations 107,223 – 107,223 96,585 – 96,585 – – Fair value of plan assets (69,897) – (69,897) (73,181) – (73,181) – –
Net plan liabilities (assets) – Switzerland 37,326 – 37,326 23,404 – 23,404 – – Belgium
Weighted average duration in years 15 16 Present value of obligations 101,243 – 101,243 77,838 – 77,838 11,416 9,926 Fair value of plan assets (41,182) – (41,182) (38,851) – (38,851) – –
Net plan liabilities (assets) – Belgium 60,061 – 60,061 38,987 – 38,987 11,416 9,926 US
Weighted average duration in years 11 5 Present value of obligations 89,212 – 89,212 79,383 – 79,383 133 135 Fair value of plan assets (51,308) – (51,308) (50,682) – (50,682) – –
Net plan liabilities (assets) – US 37,904 – 37,904 28,701 – 28,701 133 135 UK
Weighted average duration in years 18 Present value of obligations 78,041 – 78,041 69,632 – 69,632 – – Fair value of plan assets (82,965) – (82,965) (75,190) – (75,190) – –
Net plan liabilities (assets) – UK (4,924) – (4,924) (5,558) – (5,558) – – Rest of the world
Weighted average duration in years 18 10 14 Present value of obligations 19,007 17,408 36,415 13,578 14,554 28,132 7,124 5,837 Fair value of plan assets (5,818) – (5,818) (4,296) – (4,296) – –
Net plan liabilities (assets) – Rest of the world
13,189
17,408
30,597
9,282
14,554
23,836
7,124
5,837
Total
Present value of obligations 394,726 17,408 412,134 337,016 14,554 351,570 18,674 15,898 Fair value of plan assets (251,170) – (251,170) (242,200) – (242,200) – –
Net plan liabilities (assets) – Total 143,556 17,408 160,964 94,816 14,554 109,370 18,674 15,898 Net balances recognized in the Consolidated Balance Sheet
Net employee benefit assets – – (4,924) – – (5,558) – – Net employee benefit obligations – – 165,888 – – 114,928 18,674 15,898

Letter to Shareholders Overview Business Highlights Sustainability Our People Financial Reports Governance
Notes to the Consolidated Financial Statements
Barry Callebaut | Annual Report /
The changes in the present value of the employee benefit obligations are as follows:
2018/19 2017/18 2018/19 2017/18 in thousands of CHF Defined benefit pension plans Other long-term benefit plans Present value of defined benefit obligation as of September 1,
351,570
361,697
15,898
16,160
Currency translations 414 (128) – – Current service cost 12,729 13,993 934 1,063 Past service cost 725 (769) 142 – Remeasurement of other long-term employee benefits – – 1,501 1,740 Interest expense 7,990 7,384 573 612 Losses/(gains) on curtailment (6,826) (5,008) – – Total recognized in income statement 15,032 15,472 3,150 3,415 Actuarial losses/(gains) 72,661 (8,795) 3,109 (1,257) thereof:
arising from changes in demographic assumptions
(2,817)
(1,243)
(0)
(2)
arising from changes in financial assumptions
68,882
(9,682)
3,439
(1,122)
arising from experience adjustments 6,596 2,130 (330) (133) Exchange differences on foreign plans (8,207) 1,383 (591) (1,242) Total recognized in other comprehensive income 64,454 (7,412) 2,518 (2,499) Business combination (Note 5.1) – 195 – – Reclassifications 2,217 567 (2,217) (567) Contribution by employees 4,450 4,867 – – Benefits received 9,682 6,145 (98) (591) Benefits paid (35,271) (29,960) (577) (20) Total other (18,922) (18,187) (2,892) (1,177) Present value of defined benefit obligation as of August 31,
412,134
351,570
18,674
15,898
thereof: funded obligations 394,726 337,016 – – unfunded obligations 17,408 14,554 18,674 15,898
The Group expects to pay CHF 18.4 million in employer contributions to defined pension plans in the fiscal year 2019/20 (2018/19: CHF 19.5 million).
Actuarial losses amounted to CHF 75.8 million for the current fiscal year (2017/18: actuarial gain of CHF 10.1 million), which is mainly related to changes in the financial assumptions such as the development of discount rates. The respective amounts were recognized in other comprehensive income.
Effective January 2019, the plan regulations in Switzerland were partially modified, resulting in a change in accounting from defined benefit to defined contribution for certain components of the Swiss pension plans. This partial plan settlement resulted in a pre-tax curtailment gain of CHF 6.8 million in the fiscal year 2018/19 and a corresponding reduction of the defined benefit obligation.
In the fiscal year 2017/18 the gain on curtailment was predominantly linked to the settlement of a funded defined benefit pension plan in the Netherlands in the amount of CHF 4.6 million. The equivalent loss on curtailment is disclosed in the movement table for the fair value of plan assets.

Letter to Shareholders Overview Business Highlights Sustainability Our People Financial Reports Governance
Notes to the Consolidated Financial Statements
Barry Callebaut | Annual Report /
The movement in the fair value of plan assets is as follows:
2018/19 2017/18 in thousands of CHF Defined benefit pension plans Opening fair value of plan assets as of September 1,
242,200 226,515
Currency translations 263 61 Interest income 4,052 3,144 Gains/(losses) on curtailment 1 (4,640) Total recognized in income statement 4,316 (1,435) Return on plan assets excl. interest income 11,874 2,416 Exchange differences on foreign plans (5,515) 662 Total recognized in other comprehensive income 6,359 3,078 Contributions by employer 17,758 31,732 Contributions by employees 4,450 4,867 Benefits received 9,682 6,011 Benefits paid (33,595) (28,568) Total other (1,705) 14,042 Fair value of plan assets as of August 31, 251,170 242,200
The plan assets consist of the following categories of securities:
as of August 31, 2019 2018 in thousands of CHF Defined benefit pension plans Equities 74,557 76,027 Bonds 139,334 130,351 Insurance portfolio 11,355 9,430 Cash and other assets 25,924 26,392 Total fair value of plan assets 251,170 242,200
Most of the equity and debt securities have a quoted market price in an active market. Real estate and alternative investments, which include hedge fund, private equity, infrastructure and commodity investments, usually have a quoted market price or a regularly updated net asset value.
The plan assets do not include any ordinary shares issued by the Company nor any property occupied by the Group or one of its subsidiaries.
The amounts recognized in the Consolidated Income Statement are as follows:
2018/19 2017/18 2018/19 2017/18 in thousands of CHF Defined benefit pension plans Other long-term benefit plans Current service costs 12,729 13,993 934 1,063 Net interest expense 3,938 4,240 573 612 Net currency translations 151 (189) – – Past service cost 725 (769) 142 – Losses/(gains) on curtailments and settlements (6,827) (368) – – Remeasurement – – 1,501 1,740 Total expenses related to defined benefit plans and other long-term benefit plans recognized in income statement
10,716
16,907
3,150
3,415
in thousands of CHF 2018/19 2017/18 Total defined contribution expenses recognized in income statement (8,654) (2,889)
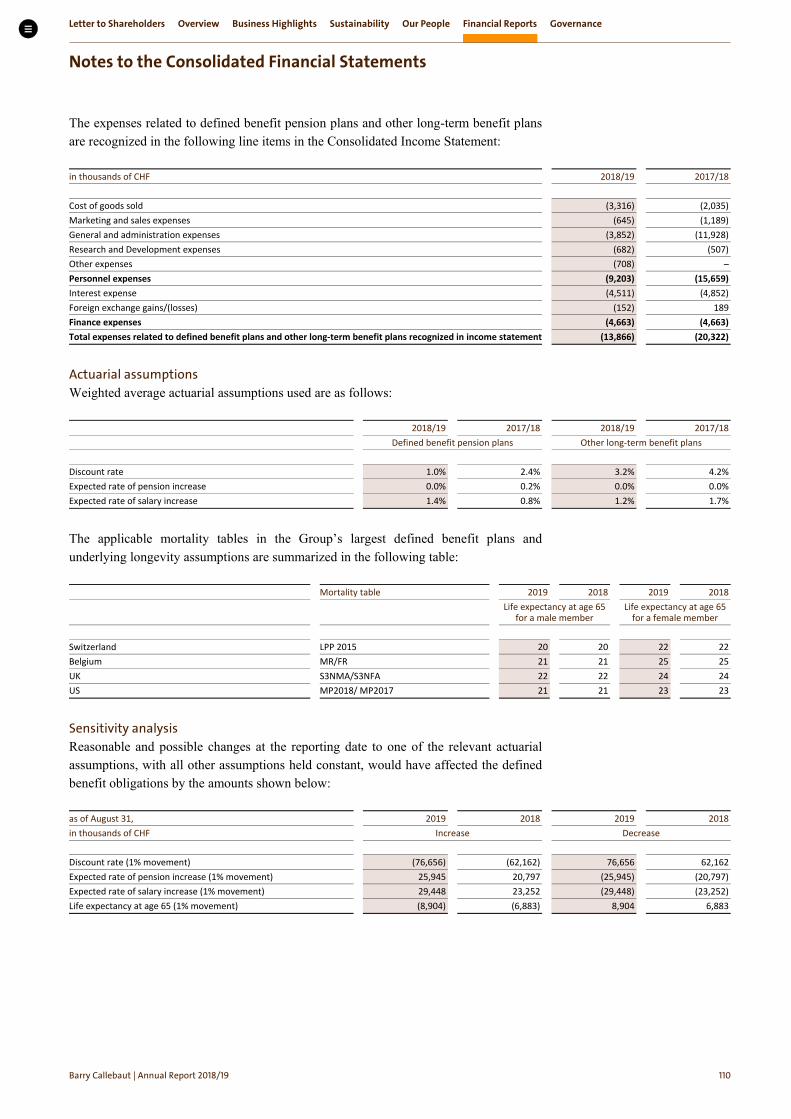
Letter to Shareholders Overview Business Highlights Sustainability Our People Financial Reports Governance
Notes to the Consolidated Financial Statements
Barry Callebaut | Annual Report /
The expenses related to defined benefit pension plans and other long-term benefit plans are recognized in the following line items in the Consolidated Income Statement:
in thousands of CHF 2018/19 2017/18 Cost of goods sold (3,316) (2,035) Marketing and sales expenses (645) (1,189) General and administration expenses (3,852) (11,928) Research and Development expenses (682) (507) Other expenses (708) – Personnel expenses (9,203) (15,659) Interest expense (4,511) (4,852) Foreign exchange gains/(losses) (152) 189 Finance expenses (4,663) (4,663) Total expenses related to defined benefit plans and other long-term benefit plans recognized in income statement (13,866) (20,322)
Actuarial assumptions Weighted average actuarial assumptions used are as follows:
2018/19 2017/18 2018/19 2017/18 Defined benefit pension plans Other long-term benefit plans Discount rate 1.0% 2.4% 3.2% 4.2% Expected rate of pension increase 0.0% 0.2% 0.0% 0.0% Expected rate of salary increase 1.4% 0.8% 1.2% 1.7%
The applicable mortality tables in the Group’s largest defined benefit plans and underlying longevity assumptions are summarized in the following table:
Mortality table 2019 2018 2019 2018
Life expectancy at age 65
for a male member Life expectancy at age 65
for a female member Switzerland LPP 2015 20 20 22 22 Belgium MR/FR 21 21 25 25 UK S3NMA/S3NFA 22 22 24 24 US MP2018/ MP2017 21 21 23 23
Sensitivity analysis Reasonable and possible changes at the reporting date to one of the relevant actuarial assumptions, with all other assumptions held constant, would have affected the defined benefit obligations by the amounts shown below:
as of August 31, 2019 2018 2019 2018 in thousands of CHF Increase Decrease Discount rate (1% movement) (76,656) (62,162) 76,656 62,162 Expected rate of pension increase (1% movement) 25,945 20,797 (25,945) (20,797) Expected rate of salary increase (1% movement) 29,448 23,252 (29,448) (23,252) Life expectancy at age 65 (1% movement) (8,904) (6,883) 8,904 6,883
Letter to Shareholders Overview Business Highlights Sustainability Our People Financial Reports Governance
Notes to the Consolidated Financial Statements
Barry Callebaut | Annual Report /
Description of the defined benefit plans The characteristics of the most significant defined benefit pension plans of the Group are further described as follows:
Defined benefit plans Switzerland The retirement benefit plans for all Swiss Group entities are mainly defined benefit plans where contributions are expressed as a percentage of the insured actual salary. The employer is affiliated to a collective foundation with full reinsurance of the actuarial risks arising from the plan with an insurance company. Members benefit from a guaranteed minimum interest on accrued savings and conversion rates at retirement in accordance with the Swiss Federal Law on Occupational Retirement, Survivors’ and Disability Pension Plans (BVG). This law defines the minimum pensionable salary and the minimum retirement credits. In addition to retirement benefits, the Swiss retirement benefit plans also provide for temporary partial or total disability benefits as well as for pre-retirement death benefits including widows’ and orphans’ benefits.
The benefit plans are outsourced to external insurance companies, which are responsible for the operation of the plan including the allocation of plan assets. The governance and the supervision as well as the responsibility to make changes in the plan lie with a Board of Trustees. It consists equally of employer and employee nominated representatives.
The applicable regulation requires the retirement benefit plans of all Swiss Group entities to be funded on the basis of employer and employee contributions, including risk premiums and savings contributions. In case of underfunding, recovery measures must be taken, such as the additional financing from the employer or from the employer and employees, or the reduction of benefits or a combination of both.
Effective January 2019, the plan regulations in Switzerland were partially modified, resulting in a change in accounting from defined benefit to defined contribution for certain components of the Swiss pension plans.
Defined benefit plans – Other countries In the US, the Group maintains a retirement benefit plan only for pensioners and deferred pensioners related to a discontinued operation. Effective July 31, 2005, all benefits in the plan were closed for new entrances and further benefit accruals. The pension plan’s funding is governed by ERISA and the applicable laws and regulations under Internal Revenue Code (IRC) sections 404, 412, and 430. Barry Callebaut is the plan sponsor and usually funds the minimum required contribution based on these regulations. The investment management is outsourced to investment management companies and the plan is governed by a Board of Trustees.
In Belgium, the Group operates defined benefit plans for events of retirement, temporary and permanent disability and death in service put in place by the employer in addition to legal retirement plans. These are company collective plans introduced on July 1, 1993. The retirement benefit plans are funded by a combination of employer and employee contributions as regulated by the Belgian Pension Act. The contributions are expressed as a percentage of the insured actual salary. The plans are fully insured. The funding of the defined benefit plans are externalized to an insurance company who is responsible for the operation of the plan including the allocation of plan assets. The governance and the supervision as well as the responsibility to make changes in the plan lie with a Board of Trustees. The legislation requires a minimum funding level. In the situation where the plan assets are not sufficient, the employer has to pay an additional contribution to the collective financing fund.
Letter to Shareholders Overview Business Highlights Sustainability Our People Financial Reports Governance
Notes to the Consolidated Financial Statements
Barry Callebaut | Annual Report /
In the UK, the Group operates a defined benefit retirement scheme in which members receive benefits based on the final salary with the contributions paid by the employer on a balance of cost basis. Effective January 31, 2014, all benefits in the plan were closed for new entrances and further benefit accruals. The plan is run by the Board of Trustees in accordance with the Trust Deed & Rules and legislation. The Trustees are required by law to fund the plan on prudent funding assumptions under the Trust Deed & Rules of the plan. The contributions payable by the Company to fund the plan are set by the Trustees after consulting the Company. The investment management is outsourced to investment management companies. Share-based payments Share awards are granted to participants according to individual contracts and the current employee stock ownership program.
Long-Term Incentive Plan (LTIP) The purpose of the LTIP is to provide the participants with an ownership interest in Barry Callebaut and to reward them for the long-term performance of the company. The LTIP thus aligns their interests to those of the shareholders.
The current LTIP is in place since fiscal year 2016/17 and has been amended for the fiscal year 2018/19.
The grant of share units under the LTIP is based on a target LTI amount determined individually for each plan participant. The individual LTI grant value is divided by the average share price of the last three months of the preceding fiscal year in order to calculate the number of share units awarded. The share units vest in three tranches over three fiscal years, i.e. 25% on the first, 25% on the second and 50% on the third anniversary of the grant date.
The first two tranches are restricted share units (RSU) that vest subject to the LTIP participant continuing to be employed by Barry Callebaut.
The third tranche consists of performance share units (PSU) that vest subject to meeting two performance criteria over the three-year vesting period.
The first performance criterion, accounting for 50% of the respective PSU grant, is the relative share price development of Barry Callebaut versus a peer group of companies in the chocolate, ingredients and FMCG sector: AAK, Aryzta, Hershey, Kellogg’s, Kerry, Lindt, Mondelēz, Nestlé, Olam, Petra Foods and Unilever. The objective (100% vesting) is to achieve median performance, e.g. to outperform half of the peer companies. There is no vesting for a performance below the first quartile of the peer group (threshold), and the vesting is capped at 300% for delivering the best performance in the peer group.
The second performance criterion, accounting for 50% of the relevant PSU grant, is Return on Invested Capital (ROIC). The ROIC performance was introduced in fiscal year 2016/17 in order to reward the sustainable management of the Company’s assets. The three-year ROIC target was set by the Board of Directors on the basis of the long-term strategic plan of the Company. The vesting also ranges from 0% to 300% of target. Consequently, the overall vesting of the LTI award (including RSU and PSU) ranges from 50% and 200% of the initially determined number of share units granted.
In addition, members of the Executive Committee (ExCo) were granted a fourth exceptional tranche, which vests subject to a four-year cliff vesting based on outperforming the Mid-Term Plan targets in terms of compound annual growth rate of volume (CAGR; 25%), EBIT (25%), cumulative Free cash flow (25%) and ROIC (25%) for the period September 2018 to August 2022. The maximum payout opportunity for this tranche is 100% of target. This fourth tranche was introduced in the reporting year
Letter to Shareholders Overview Business Highlights Sustainability Our People Financial Reports Governance
Notes to the Consolidated Financial Statements
Barry Callebaut | Annual Report /
in order to align even more closely the compensation of the ExCo with the long-term interests of the shareholders, as it extends the overall LTI plan period to four years and increases the portion of the LTI award that is subject to future performance conditions. Further, it focuses the efforts of the ExCo on outperforming the Mid-Term Plan. The targets have been set so that there is no vesting at all if the Mid-Term Plan is not achieved (Mid-Term Plan is the threshold).
The Board of Directors reserves the right to suspend or adjust the vesting of the share units in case of a negative result from continuous operations of the Barry Callebaut Group. Once the shares are vested and transferred, they are free of any sales restrictions.
The overall vesting of the LTI award (including RSU, PSU and the fourth exceptional tranche) ranges from 31.0% to 171.4% of the initially determined number of the share units granted for members of the Executive Committee (previous year: between 50% and 200% under the standard LTI plan without the exceptional fourth PSU tranche). For all other participants the overall vesting of the LTI award ranges from 50% to 200% of the initially determined number of the share units granted.
The share awards granted entitle the participants to full shareholders rights upon vesting of the share units (RSU/PSU) and their conversion into shares. In case of resignation or dismissal for cause during the vesting period (which ranges between one and three years), the initially granted, but not yet vested share units are forfeited.
The fair value of the RSU granted (no performance condition) is estimated by taking the market price at grant date less the present value of the expected dividends that will not be received on these RSU during the vesting period. 2,895 share awards were granted in fiscal year 2018/19 with an average fair value of CHF 1,699 (in fiscal year 2017/18, 3,772 share awards were granted with an average fair value of CHF 1,400).
The fair value of the PSU, of which the vesting is conditional upon the relative share price performance, is assessed as per grant date based on a valuation performed by external experts applying the “Monte Carlo simulation” method. The most relevant parameters relating to Barry Callebaut and the relevant peer group are the risk-free interest rate, annualized volatility, the share price and the dividend yields. The risk-free rates reflect three-year government bonds of the country of origin of the respective company and range from –0.7% to 2.2%. The volatilities and correlations are based on daily returns of a companyʼs share at its respective exchange of origin over a three-year period preceding the start of the vesting cycle (the annualized volatility for Barry Callebaut and its peer group ranges from 15.2% to 27.9%). The dividend yields are based on dividends paid over a three-year period preceding the start of the vesting cycle and range from 0.7% to 3.1%. The share prices are denominated in their respective currency and retrieved for the specified point in time. The base share price taken into account for Barry Callebaut is the share price at grant date and amounted to CHF 1,728.
The fair value of PSU, of which the vesting is conditional upon the Group’s ROIC performance, is taken at fair value of the Barry Callebaut share at grant date discounted for dividends until the vesting. As this part is based on the Group’s performance relating to ROIC, the relative value is adjusted periodically during the vesting period, based on an estimation of the ROIC performance at vesting date.
The fair value of the PSU, of which the vesting is conditional upon outperforming the Mid-Term Plan targets (based on the following key performance indicators: volume growth, EBIT, cumulative Free cash flow and ROIC), is taken at fair value of the Barry Callebaut share at grant date discounted for dividends until the vesting. As this part is based on the Group’s performance relating to the outperforming the Mid-Term Plan, the
Letter to Shareholders Overview Business Highlights Sustainability Our People Financial Reports Governance
Notes to the Consolidated Financial Statements
Barry Callebaut | Annual Report /
relative value is adjusted periodically during the vesting period, based on an assessment related to the outperformance of each relevant key performance indicator.
In fiscal year 2018/19, 1,862 PSU were granted to members of the ExCo with an average fair value of CHF 1,925 (in fiscal year 2017/18: 2,262 share awards with an average fair value of CHF 1,276). To the other plan participants, 1,034 share awards with an average fair value of CHF 1,925 per share were granted in fiscal year 2018/19 (in fiscal year 2017/18: 1,282 share awards with an average fair value of CHF 1,663). The lower fair value of the ExCo PSU compared to the other participants in fiscal year 2017/18 was due to the value cap applicable on the PSU awards to the ExCo.
In fiscal year 2018/19, 1,381 PSU were granted to members of the ExCo with an average value of CHF 1,640 related to the exceptional fourth tranche linked to outperforming the Mid-Term Plan targets.
Board of Directors The Board of Directors receives share awards annually for the respective service period. These share awards are not part of the share plans described above and are determined by the NCC as a fixed number of shares. The total number of shares awarded for the service period amounted to 2,190 with an average fair value of CHF 1,614 per share (2017/18: 1,830 share awards with an average fair value of CHF 1,900 per share).
Recognition in financial statements The fair value of the share awards at grant date is recognized over the vesting period as a personnel expense under either of these share plans. For 2018/19, the amount thus recognized (before taxes) was CHF 15.0 million with a corresponding increase in equity (2017/18: CHF 14.5 million). Of the amount recognized in 2018/19, CHF 11.5 million related to the Long-Term Incentive Plan (2017/18: CHF 11.3 million) and CHF 3.5 million to the BoD plan (2017/18: CHF 3.2 million).
Accounting policies Employee benefit obligations/post-employment benefits
The Group operates a number of independently defined benefit plans and other post-retirement or long-term benefit plans, which conform to local legal and tax requirements.
The Group’s net obligation in respect of defined benefit plans is calculated separately for each plan by estimating the amount of future benefit that employees have earned in the current and prior periods, applying the discount rate and deducting the fair value of any plan assets.
The calculation of defined benefit obligations is performed annually by qualified actuaries using the projected unit credit method. When the calculation results in a potential asset for the Group, the recognized asset is limited to the present value of economic benefits available in the form of any future refunds from the plan or reductions in future contributions to the plan. To calculate the present value of economic benefits, consideration is given to any applicable minimum funding requirements.
Remeasurement of the net defined benefit liability which comprise actuarial gains and losses, the return on plan assets (excluding interest) and the effect of the asset ceiling are recognized immediately in other comprehensive income. The Group determines the net interest expense (income) on the net defined benefit liability (asset) for the period by applying the discount rate used to measure the defined benefit liability (asset), taking into account any changes in the net defined benefit liability (asset) during the period as a result of contributions and benefit payments. Net interest expense and other expenses related to defined benefit plans are recognized in profit or loss.
Letter to Shareholders Overview Business Highlights Sustainability Our People Financial Reports Governance
Notes to the Consolidated Financial Statements
Barry Callebaut | Annual Report /
When the benefits of a plan are changed, or when a plan is curtailed, the resulting change in benefit that relates to past service or the gain or loss on curtailment is recognized immediately in profit or loss. The Group recognizes gains and losses on the settlement of a defined benefit plan when the settlement occurs.
The Group’s employee benefit schemes are exposed to changes in legislation and to investment return and matching risks, longevity risks and solvency risks. These risks may all require additional contributions and are therefore reviewed on a regular basis by the companies’ management or by the relevant Board of Trustees as follows:
• Changes in legislation: monitoring of country-specific legislation changes
• Investment return risk: analysis and optimization of the allocation and performance of assets as well as monitoring of compliance with investment guidelines
• Investment matching risk: analysis and optimization of asset-liability matching and periodic fair valuation of assets and liabilities
• Longevity risk: analysis of mortality assumptions and monitoring of demographic development
• Solvency risk: monitoring of solvency of external solution providers
Defined contribution plans
Obligations for contributions to defined contribution plans are expensed as the related service is provided. Prepaid contributions are recognised as an asset to the extent that a cash refund or a reduction in future payments is available. The Group has no further payment obligations once the contributions have been paid.
Post-employment benefits other than pensions
Certain subsidiaries provide health care and insurance benefits for a portion of their retired employees and their eligible dependents. The cost of these benefits is actuarially determined and included in the related function expenses over the employees’ working lives. The related liability is also included in the position “Other long-term benefit plans”.
Other long-term employee benefits
Other long-term employee benefits represent amounts due to employees under deferred compensation arrangements mandated by certain jurisdictions in which the Group conducts its operations (including jubilee plans and other long-service award plans). That benefit is discounted to determine its present value. Related remeasurement costs are recognized in the Consolidated Income Statement. The related liability is included in the position “Other long-term benefit plans”.
Termination benefits
Termination benefits are expensed at the earlier of when the Group can no longer withdraw the offer of those benefits or when the Group recognizes costs for restructuring.
Long-Term Incentive Plan
For the Long-Term Incentive Plan (LTIP), Barry Callebaut AG shares are purchased on the market and passed on to satisfy the awards. In accordance with IFRS 2, the compensation costs relating to share awards granted under this deferred share plan are recognized in the Consolidated Income Statement over the vesting period at their fair value as at the grant date.

Letter to Shareholders Overview Business Highlights Sustainability Our People Financial Reports Governance
Notes to the Consolidated Financial Statements
Barry Callebaut | Annual Report /
Group Structure and Related Parties
. Acquisitions
Acquisitions in 2018/19 Inforum On January 31, 2019, Barry Callebaut completed the acquisition of CJSC Inforum-Prom (Inforum), a leading Russian business-to-business producer of chocolate, compounds and fillings, serving many of the well-known consumer chocolate brands in Russia. Inforum was founded in 1989 and started its business selling cocoa products. The company operates a production site in Kasimov, Ryazan Oblast, and employs more than 300 people. The transaction was successfully closed and the Group acquired 100% of the outstanding shares.
This strategic acquisition will strengthen Barry Callebaut’s presence and production capacity in the high-growth Russian market, allow it to expand its market position in the Food Manufacturers business, leverage its value-adding Gourmet & Specialties business and further increase market penetration in CIS countries and export markets.
The preliminary fair value of the purchase consideration amounts to CHF 41.1 million, thereof CHF 28.3 million paid in cash. The remaining CHF 12.8 million will be paid out to the previous shareholders upon the achievement of specified criteria. The contingent consideration is included in other current and non-current liabilities.
The total acquisition-related costs amount to CHF 1.7 million. CHF 0.7 million were expensed and included in “Other expenses” for the period ended August 31, 2019, and CHF 1.0 million were already expensed in fiscal year 2017/18 included in “General and administration expenses”.
in thousands of CHF 2018/19 Recognized amounts of identifiable assets acquired and liabilities assumed Cash and cash equivalents 1,066 Trade receivables and other current assets 24,759 Property, plant and equipment 6,048 Intangible assets 525 Deferred tax assets 105 Total assets 32,503 Short-term debt (7,153) Trade payables and other current liabilities (15,197) Income tax liabilities (273) Derivative financial liabilities (197) Deferred tax liabilities (121) Total liabilities (22,941) Total identifiable net assets 9,562 Goodwill 31,565 Total consideration at fair value 41,127
thereof: Cash paid 28,349 Consideration deferred 12,778
The goodwill of CHF 31.6 million arising from the acquisition is attributable to strengthening Barry Callebaut’s presence in the high-growth Russian market as well as synergies and leverage achieved by the integration of the business into the Group’s footprint in this emerging region. The goodwill has been allocated to Region EMEA and is not deductible for income tax purposes.

Letter to Shareholders Overview Business Highlights Sustainability Our People Financial Reports Governance
Notes to the Consolidated Financial Statements
Barry Callebaut | Annual Report /
Since January 31, 2019, the acquired business contributed CHF 47.0 million to revenues from sales and services and CHF 2.7 million to net profit. Had it been consolidated from September 1, 2018, it would have contributed estimated revenues from sales and services of CHF 88.0 million and an estimated net profit for the fiscal year of CHF 4.5 million to the Consolidated Income Statement. Burton’s Biscuit Company On December 8, 2018, the Group acquired the chocolate manufacturing assets of Burton’s Biscuit Company. Burton’s Biscuit Company is based in Moreton, UK, and is the second biggest biscuit manufacturer in the UK.
As a result, the Group will be able to expand its manufacturing capacity in the UK, one of Europe’s largest chocolate confectionery markets in volume terms and an important growth area for the company.
Barry Callebaut continues to produce chocolate and compound at the Moreton site and transferred employees currently engaged in the manufacturing of chocolate at the Moreton facility to Barry Callebaut.
The consideration transferred was CHF 6.7 million, fully paid in cash. The acquisition related costs in the amount of CHF 0.8 million were expensed and included in “Other expenses” (of which CHF 0.2 million were already expensed in fiscal year 2017/18 in “General and administration expenses”). The agreements with the seller do not contain arrangements for contingent considerations.
The purchase price allocation resulted in net identified assets of CHF 6.7 million, consisting of CHF 5.6 million of property, plant and equipment and CHF 1.1 million of inventories.
Since December 8, 2018, the acquired business contributed CHF 27.8 million to revenues from sales and services and a CHF –1.2 million loss to net profit. Had it been consolidated from September 1, 2018, it would have contributed revenues from sales and services of CHF 41.7 million and a net loss of CHF –1.0 million for the fiscal year in the Consolidated Income Statement.
Acquisitions in 2017/18 D’Orsogna Dolciaria On October 4, 2017, Barry Callebaut Decorations Italy S.r.l. (“BC”, “the acquirer”) closed a transaction with D’Orsogna Real Estate S.r.l. Unipersonale (“the seller”), to acquire 100% of the share capital of D’Orsogna Dolciaria S.r.l.
The consideration transferred was CHF 48.0 million, fully paid in cash. The acquisition related costs in the amount of CHF 0.8 million were expensed and included in other expenses (of which CHF 0.6 million were already expensed in fiscal year 2016/17). The agreements with the seller did not contain arrangements for contingent considerations.

Letter to Shareholders Overview Business Highlights Sustainability Our People Financial Reports Governance
Notes to the Consolidated Financial Statements
Barry Callebaut | Annual Report /
in thousands of CHF 2017/18 Recognized amounts of identifiable assets acquired and liabilities assumed Cash and cash equivalents 2,031 Receivables and other current assets 17,833 Property, plant and equipment 16,779 Intangible assets 3,901 Other non-current assets 1,124 Total assets 41,668 Current liabilities (9,769) Current tax liability (2,013) Deferred tax liability (946) Short-term debt (12,495) Employee benefit obligations (195) Other non-current liabilities (138) Long-term debt (10,633) Total liabilities (36,189) Total identifiable net assets 5,479 Goodwill 42,536 Total consideration at fair value 48,015
thereof: Cash paid 48,015 Consideration deferred –
The goodwill of CHF 42.5 million arising from the acquisition is attributable to the synergies resulting from the integration of the business into the Group’s existing business as well as for strengthening BC’s range in its value adding Specialties & Decoration business. This allows the Group to further develop its Food Manufacturers and Gourmet & Specialties business by increasing innovation power, expanding the product offering and by leveraging the Group’s global footprint. The goodwill has been allocated to Region EMEA. The goodwill recognized is expected to be deductible for income tax purposes.
From October 4, 2017, to August 31, 2018, the acquired business contributed CHF 49.9 million to revenues from sales and services and CHF 1.5 million to net profit. Had it been consolidated from September 1, 2017, it would have contributed revenues from sales and services of CHF 54.0 million and net profit for the fiscal year of CHF 1.5 million to the Consolidated Income Statement for the period ended August 31, 2018.
Gertrude Hawk Chocolates Effective December 1, 2017, Barry Callebaut USA LLC which is a subsidiary of the Barry Callebaut Group (“BC”, “the acquirer”) closed a transaction with Gertrude Hawk Chocolates Inc. (“the seller”), to acquire the assets and liabilities of the business of Gertrude Hawk Ingredients.
The consideration was CHF 89.4 million of which CHF 8.9 million was paid to an escrow account as deferred consideration. One third (CHF 3.0 million) of the escrow amount will be released to the seller within 90 calendar days after August 31, 2018, less amounts claimed by indemnified parties. On June 1, 2019, the remaining escrow amount less amounts claimed by indemnified parties will be released to the seller.
The acquisition related costs in the amount of CHF 1.1 million were expensed and included in other expenses in the Consolidated Income Statement (of which CHF 0.9 million were already expensed in fiscal year 2016/17).
The agreements with the seller do not contain arrangements for contingent considerations.

Letter to Shareholders Overview Business Highlights Sustainability Our People Financial Reports Governance
Notes to the Consolidated Financial Statements
Barry Callebaut | Annual Report /
in thousands of CHF 2017/18 Recognized amounts of identifiable assets acquired and liabilities assumed Receivables and other current assets 28,851 Property, plant and equipment 25,752 Intangible assets 4,266 Total assets 58,869 Trade payables and other current liabilities (1,315) Total liabilities (1,315) Total identifiable net assets 57,554 Goodwill 31,868 Total consideration at fair value 89,422
thereof: Cash paid 80,571 Consideration deferred 8,851
The goodwill of CHF 31.9 million arising from the acquisition is attributable to the synergies resulting from the integration of the business into the Group’s existing business as well as for strengthening BC’s range in its value adding Specialties & Decoration business. This allows the Group to further develop its Food Manufacturers and Gourmet & Specialties business by getting access to the increasing innovation power, expanding the product offering and by leveraging the Group’s global footprint. The goodwill has been principally allocated to Region Americas. The goodwill recognized is expected to be deductible for income tax purposes.
From December 1, 2017, to August 31, 2018, the acquired business contributed CHF 73.8 million to revenues from sales and services and CHF 4.8 million to net profit. Had it been consolidated from September 1, 2017, it would have contributed revenues from sales and services of CHF 92.3 million and net profit for the fiscal year of CHF 4.6 million to the Consolidated Income Statement for the period ended August 31, 2018.
. Discontinued operations and disposal The Group did not have any discontinued operations or disposals in 2018/19 and 2017/18.

Letter to Shareholders Overview Business Highlights Sustainability Our People Financial Reports Governance
Notes to the Consolidated Financial Statements
Barry Callebaut | Annual Report /
. Group entities The principal subsidiaries of Barry Callebaut as of August 31, 2019, are as follows:1
Country Subsidiary Municipality of registration %-owned Currency Capital Switzerland Barry Callebaut Cocoa AG Zurich 100 EUR 81,515 Barry Callebaut Management Services AG Zurich 100 CHF 100,000 Barry Callebaut Schweiz AG Dübendorf 100 CHF 4,600,000 Barry Callebaut Sourcing AG Zurich 100 CHF 2,000,000 Cabosse Naturals Switzerland AG Zurich 100 CHF 1,000,000 Belgium Barry Callebaut Belgium N.V. Lebbeke-Wieze 100 EUR 61,537,705 Barry Callebaut Manufacturing Halle BVBA Halle 100 EUR 15,488,952 Barry Callebaut Services N.V. Lebbeke-Wieze 100 EUR 929,286,000 Cabosse Naturals N.V. Halle 100 EUR 61,500 International Business Company Belgium BVBA Kortrijk (Heule) 100 EUR 65,000 Pierre Iserentant SA Thimister-Clermont 100 EUR 260,908 Brazil Barry Callebaut Brasil SA São Paulo 100 BRL 451,600,810 Cameroon SEC Cacaos SA Douala 100 XAF 10,000,000 Société Industrielle Camerounaise des Cacaos SA Douala 81 XAF 1,959,531,000 Canada Barry Callebaut Canada Inc. St.-Hyacinthe 100 CAD 2,000,000 D'Orsogna Sweet Ingredients Ltd. Ontario 100 CAD 1,000,000 Chile Barry Callebaut Chile SpA Santiago 100 CLP 27,987,650,000 China Barry Callebaut (Suzhou) Chocolate Co., Ltd. Suzhou 100 CNY 219,137,532 Barry Callebaut (Suzhou) Chocolate R&D Center Co., Ltd. Suzhou 100 CNY 13,970,504 Côte d’Ivoire Barry Callebaut Négoce SA Abidjan 100 XOF 3,700,000,000 Biopartenaire SA Yamoussoukro 100 XOF 200,000,000 Société Africaine de Cacao SA Abidjan 100 XOF 25,695,651,316 Czech Republic Barry Callebaut Czech Republic s.r.o. Prague-Vinohrady 100 CZK 200,000 Denmark Barry Callebaut Denmark ApS Hostebro 100 DKK 500,000 Ecuador Barry Callebaut Ecuador SA Guayaquil 100 USD 50,000 France Barry Callebaut France SAS Hardricourt 100 EUR 67,900,000 Barry Callebaut Manufacturing France SAS Hardricourt 100 EUR 6,637,540 Barry Callebaut Nord Cacao SAS Gravelines 100 EUR 3,037,000 Germany Barry Callebaut Cocoa Germany GmbH Hamburg 100 EUR 25,000 Barry Callebaut Deutschland GmbH Cologne 100 EUR 52,000 Barry Callebaut Manufacturing Norderstedt GmbH & Co. KG Norderstedt 100 EUR 50,100 C.J. van Houten & Zoon Holding GmbH Norderstedt 100 EUR 72,092,155 Tagungs- und Seminarzentrum Schloss Marbach GmbH Öhningen 100 EUR 1,600,000 Ghana Barry Callebaut Ghana Ltd. Tema 100 USD 9,204,219 Nyonkopa Cocoa Buying Ltd. Kumasi 100 GHS 4,250,000 Great Britain Barry Callebaut (UK) Ltd. Banbury, Oxfordshire 100 GBP 3,200,000 Barry Callebaut Beverages UK Ltd. Chester 100 GBP 40,000 Barry Callebaut Manufacturing (UK) Ltd. Banbury, Oxfordshire 100 GBP 15,467,852 Greece Barry Callebaut Hellas Single Member SA Athens 100 EUR 25,000 India Barry Callebaut India Private Ltd. Maharashtra 100 INR 292,299,040 D'Orsogna Sweet Ingredients Private Ltd. Maharashtra 100 INR 93,546,460 Indonesia P.T. Barry Callebaut Comextra Indonesia Makassar 60 USD 31,460,000 P.T. Barry Callebaut Indonesia Bandung 100 IDR 66,213,000,000 P.T. Papandayan Cocoa Industries Bandung 100 USD 40,000,000 Italy Barry Callebaut Italia S.p.A. Assago 100 EUR 104,000 Barry Callebaut Manufacturing Italia S.p.A. Milano 100 EUR 2,646,841 Dolphin S.r.l. Milano 100 EUR 110,000 D'Orsogna Dolciaria S.r.l.2 San Vito Chietino 100 EUR 5,000,000 Japan Barry Callebaut Japan Ltd. Amagasaki 100 JPY 835,000,000
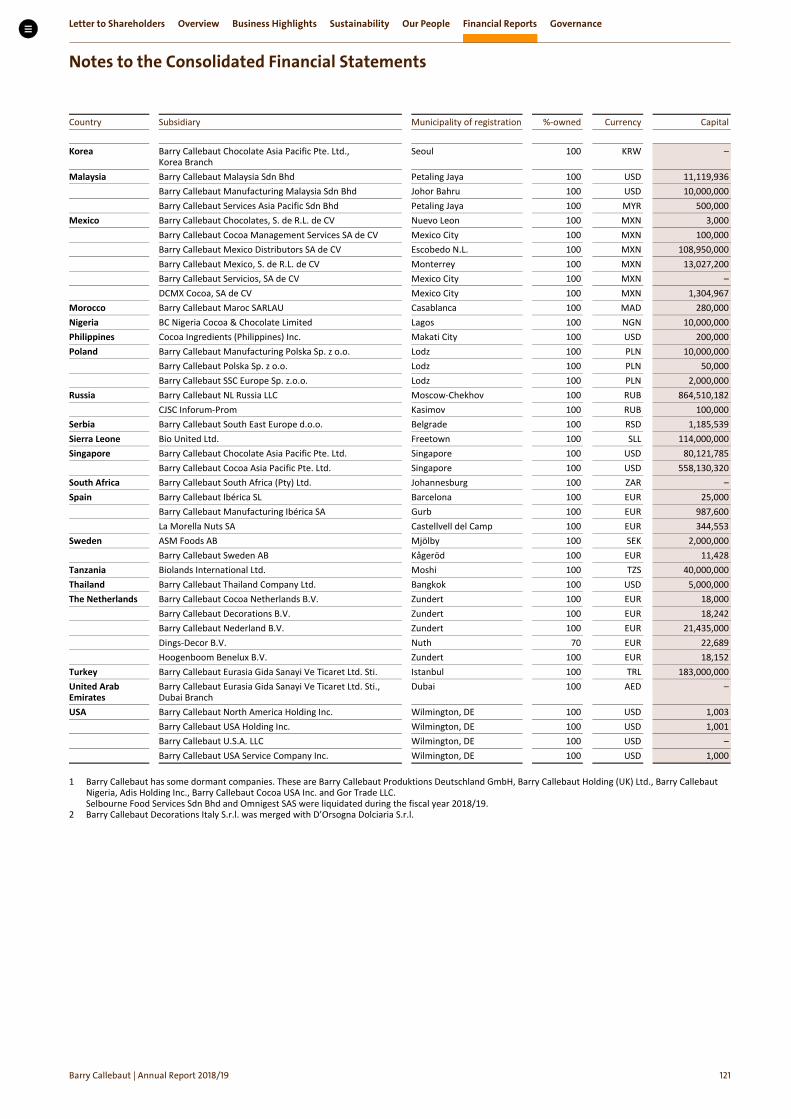
Letter to Shareholders Overview Business Highlights Sustainability Our People Financial Reports Governance
Notes to the Consolidated Financial Statements
Barry Callebaut | Annual Report /
Country Subsidiary Municipality of registration %-owned Currency Capital Korea Barry Callebaut Chocolate Asia Pacific Pte. Ltd.,
Korea Branch Seoul 100 KRW –
Malaysia Barry Callebaut Malaysia Sdn Bhd Petaling Jaya 100 USD 11,119,936 Barry Callebaut Manufacturing Malaysia Sdn Bhd Johor Bahru 100 USD 10,000,000 Barry Callebaut Services Asia Pacific Sdn Bhd Petaling Jaya 100 MYR 500,000 Mexico Barry Callebaut Chocolates, S. de R.L. de CV Nuevo Leon 100 MXN 3,000 Barry Callebaut Cocoa Management Services SA de CV Mexico City 100 MXN 100,000 Barry Callebaut Mexico Distributors SA de CV Escobedo N.L. 100 MXN 108,950,000 Barry Callebaut Mexico, S. de R.L. de CV Monterrey 100 MXN 13,027,200 Barry Callebaut Servicios, SA de CV Mexico City 100 MXN – DCMX Cocoa, SA de CV Mexico City 100 MXN 1,304,967 Morocco Barry Callebaut Maroc SARLAU Casablanca 100 MAD 280,000 Nigeria BC Nigeria Cocoa & Chocolate Limited Lagos 100 NGN 10,000,000 Philippines Cocoa Ingredients (Philippines) Inc. Makati City 100 USD 200,000 Poland Barry Callebaut Manufacturing Polska Sp. z o.o. Lodz 100 PLN 10,000,000 Barry Callebaut Polska Sp. z o.o. Lodz 100 PLN 50,000 Barry Callebaut SSC Europe Sp. z.o.o. Lodz 100 PLN 2,000,000 Russia Barry Callebaut NL Russia LLC Moscow-Chekhov 100 RUB 864,510,182 CJSC Inforum-Prom Kasimov 100 RUB 100,000 Serbia Barry Callebaut South East Europe d.o.o. Belgrade 100 RSD 1,185,539 Sierra Leone Bio United Ltd. Freetown 100 SLL 114,000,000 Singapore Barry Callebaut Chocolate Asia Pacific Pte. Ltd. Singapore 100 USD 80,121,785 Barry Callebaut Cocoa Asia Pacific Pte. Ltd. Singapore 100 USD 558,130,320 South Africa Barry Callebaut South Africa (Pty) Ltd. Johannesburg 100 ZAR – Spain Barry Callebaut Ibérica SL Barcelona 100 EUR 25,000 Barry Callebaut Manufacturing Ibérica SA Gurb 100 EUR 987,600 La Morella Nuts SA Castellvell del Camp 100 EUR 344,553 Sweden ASM Foods AB Mjölby 100 SEK 2,000,000 Barry Callebaut Sweden AB Kågeröd 100 EUR 11,428 Tanzania Biolands International Ltd. Moshi 100 TZS 40,000,000 Thailand Barry Callebaut Thailand Company Ltd. Bangkok 100 USD 5,000,000 The Netherlands Barry Callebaut Cocoa Netherlands B.V. Zundert 100 EUR 18,000 Barry Callebaut Decorations B.V. Zundert 100 EUR 18,242 Barry Callebaut Nederland B.V. Zundert 100 EUR 21,435,000 Dings-Decor B.V. Nuth 70 EUR 22,689 Hoogenboom Benelux B.V. Zundert 100 EUR 18,152 Turkey Barry Callebaut Eurasia Gida Sanayi Ve Ticaret Ltd. Sti. Istanbul 100 TRL 183,000,000 United Arab Emirates
Barry Callebaut Eurasia Gida Sanayi Ve Ticaret Ltd. Sti., Dubai Branch
Dubai 100 AED –
USA Barry Callebaut North America Holding Inc. Wilmington, DE 100 USD 1,003 Barry Callebaut USA Holding Inc. Wilmington, DE 100 USD 1,001 Barry Callebaut U.S.A. LLC Wilmington, DE 100 USD – Barry Callebaut USA Service Company Inc. Wilmington, DE 100 USD 1,000
1 Barry Callebaut has some dormant companies. These are Barry Callebaut Produktions Deutschland GmbH, Barry Callebaut Holding (UK) Ltd., Barry Callebaut Nigeria, Adis Holding Inc., Barry Callebaut Cocoa USA Inc. and Gor Trade LLC. Selbourne Food Services Sdn Bhd and Omnigest SAS were liquidated during the fiscal year 2018/19.
2 Barry Callebaut Decorations Italy S.r.l. was merged with D’Orsogna Dolciaria S.r.l.
Letter to Shareholders Overview Business Highlights Sustainability Our People Financial Reports Governance
Notes to the Consolidated Financial Statements
Barry Callebaut | Annual Report /
Accounting policies Scope of consolidation/ subsidiaries
The Consolidated Financial Statements of the Group include all the assets, liabilities, income and expenses of Barry Callebaut AG and the companies which it controls. The Group controls an entity when the Group is exposed to, or has rights to, variable returns from its involvement with the entity and has the ability to affect those returns through its power over the entity. Non-controlling interests are shown as a component of equity in the balance sheet, and the share of the net profit attributable to non-controlling interests is shown as a component of the net profit for the year in the Consolidated Income Statement. Newly acquired companies are consolidated from the date control is transferred (the effective date of acquisition), using the acquisition method. Subsidiaries disposed of are included up to the effective date of disposal.
All intragroup balances and unrealized gains and losses or income and expenses arising from intragroup transactions are eliminated in preparing the Consolidated Financial Statements. Unrealized gains arising from transactions with associates and jointly controlled entities are eliminated to the extent of the Group’s interest in the entity. Unrealized losses are eliminated in the same way as unrealized gains, but only to the extent that there is no evidence of impairment.

Letter to Shareholders Overview Business Highlights Sustainability Our People Financial Reports Governance
Notes to the Consolidated Financial Statements
Barry Callebaut | Annual Report /
. Related parties The following shareholders hold a participation of more than 3% of the issued share capital of the Group’s ultimate parent Barry Callebaut AG:
as of August 31, 2019 2018 Jacobs Holding AG 50.1% 50.1% Renata Jacobs 5.0% 8.5% BlackRock, Inc.1 3.1% 3.2% Invesco Ltd.1,2 3.0% n/a
1 Based on notifications through the electronic publication platform of the SIX Swiss Exchange. 2 In May 2019, Invesco Ltd. closed the acquisition of all shares in Oppenheimer Funds which was a subsidiary of Massachusetts Mutual Life Insurance Company.
Significant transactions and balances between the Group and related parties are as follows:
in thousands of CHF Nature of cost/revenue 2018/19 2017/18 Other operating expenses charged by related parties (817) (1,000)
Jacobs Holding AG Management services (817) (1,000)
as of August 31, 2019 2018 in thousands of CHF Other payables to related parties – 105
Jacobs Holding AG – 105
Compensation of key management personnel The key management personnel is defined as the Board of Directors and the Executive Committee. Key management compensation consists of the following:
in million CHF 2018/19 2017/18 Short-term employee benefits 16.2 17.4 Post-employment benefits 2.4 2.0 Share-based payments 11.9 10.3 Total 30.5 29.7
Further details related to the requirements of the Swiss Transparency law (Art. 663bbis
and 663c Swiss Code of Obligations) are disclosed in Notes 2.8, 3.5 and 3.6 in the Financial Statements of Barry Callebaut AG and in the Remuneration Report.

Letter to Shareholders Overview Business Highlights Sustainability Our People Financial Reports Governance
Notes to the Consolidated Financial Statements
Barry Callebaut | Annual Report /
Taxes
. Income taxes
Income tax expense
in thousands of CHF 2018/19 2017/18 Current income tax expenses (66,837) (64,696) Deferred income tax expenses (17,200) (30,821) Total income tax expenses (84,037) (95,517)
Reconciliation of income taxes
in thousands of CHF 2018/19 2017/18 Profit before income taxes 452,768 452,876 Expected income tax expenses at weighted average applicable tax rate (84,029) (93,972) Non-tax deductible expenses (9,145) (5,682) Tax-deductible items not qualifying as an expense under IFRS 4,926 6,570 Tax-exempt income 17,743 12,968 Income recognized for tax declarations purposes only (5,012) (3,863) Prior-period-related items (6,073) 5,271 Changes in tax rates (529) (9,427) Losses carried forward not yet recognized as deferred tax assets (10,233) (9,493) Tax relief on losses carried forward formerly not recognized as deferred tax assets 8,314 2,111 Total income taxes (84,037) (95,517)
For the reconciliation above the weighted average applicable tax rate was 18.6% in 2018/19 (2017/18: 20.7%).
The weighted average applicable tax rate has, year-on-year, decreased mainly due to changes in the country mix of profit before taxes and reduced corporate tax rates in certain tax jurisdictions, including Belgium and the US. The prior year income tax expense of CHF 95.5 million included a one-time, non-cash expense of CHF 12.9 million resulting from the tax reforms in Belgium and in the US, mostly related to the revaluation of the deferred tax assets and liabilities to the newly enacted tax rates at the date of enactment. The prior year one-time tax charge consisted of a deferred tax expense of CHF 9.7 million for Belgium, a deferred tax expense of CHF 2.7 million for USA and a current tax expense of CHF 0.5 million arising from the move to a territorial system in the US.
The Group’s effective tax rate in 2018/19 is 18.6% (2017/18: 18.2% on an adjusted basis, excluding the one-off negative impact from the tax reforms in Belgium and in the US).
The tax relief on losses carried forward previously not recognized as deferred tax assets of CHF 8.3 million (2017/18: CHF 2.1 million) consists of CHF 4.0 million tax relief of utilization on tax losses carried forward previously not recognized (2017/18: CHF 1.7 million) and CHF 4.3 million of tax losses recognized for the first time in 2018/19 (2017/18: CHF 0.4 million).

Letter to Shareholders Overview Business Highlights Sustainability Our People Financial Reports Governance
Notes to the Consolidated Financial Statements
Barry Callebaut | Annual Report /
. Deferred tax assets and liabilities
Movement in deferred tax assets and liabilities
Inventories
Property, plant,
equipment/ intangible
assets
Other assets
Provisions
Other liabilities
Tax loss carry-
forwards
Total
in thousands of CHF as of September 1, 2017 5,052 (51,879) (28,565) (1,339) 16,305 88,611 28,185 Charged to the income statement (9,261) (1,639) 41,594 440 (7,977) (53,978) (30,821) Recognized in other comprehensive income – – (326) – (2,243) – (2,569) Effect of acquisitions (178) (768) – – – – (946) Effect of disposals – – – – – – – Currency translation effects 375 1,003 (681) (749) 423 566 938 Reclassifications – – – – – – – as of August 31, 2018 (4,012) (53,283) 12,022 (1,648) 6,509 35,199 (5,213) Adjustment on initial application of IFRS 151 1,345 – – – – – 1,345 as of September 1, 2018 (2,667) (53,283) 12,022 (1,648) 6,509 35,199 (3,868) Charged to the income statement 61 (20,997) 13,382 1,054 (3,803) (6,898) (17,200) Recognized in other comprehensive income – – 635 (2) 25,675 – 26,308 Effect of acquisitions – (27) 39 – (29) – (17) Effect of disposals – 52 1 – 1,314 – 1,367 Currency translation effects 200 1,105 (137) (13) (485) (673) (4) Reclassifications 13,603 (5,735) (3,565) – (4,303) – (0) as of August 31, 2019 11,197 (78,885) 22,377 (609) 24,877 27,628 6,586
1 Refer to Introduction of new standards in 2018/19, IFRS 15 – Revenue from Contracts with Customers page 50.
For fiscal year 2018/19, deferred tax income recognized in other comprehensive income amounted to CHF 26.3 million (2017/18: deferred tax expenses of CHF 2.6 million) and this relates to remeasurement of defined benefit plans of CHF 20.6 million (2017/18: deferred tax expenses of CHF 0.7 million) and to cash flow hedging reserves CHF 5.7 million (2017/18: deferred tax expenses of CHF 1.9 million). Recognized deferred tax assets and liabilities The recognized deferred tax assets and liabilities, without set off of balances within the same tax jurisdiction, are attributable to the following:
as of August 31, 2019 2018 in thousands of CHF Assets Liabilities Net Assets Liabilities Net Inventories 19,560 (8,363) 11,197 8,107 (12,119) (4,012) Property, plant and equipment/Intangible assets
12,246
(91,131)
(78,885)
15,689
(68,972)
(53,283)
Other assets 33,651 (11,274) 22,377 21,382 (9,360) 12,022 Provisions 732 (1,341) (609) 781 (2,429) (1,648) Other liabilities 44,841 (19,964) 24,877 26,312 (19,803) 6,509 Tax losses carried forward 27,628 – 27,628 35,199 – 35,199 Tax assets/(liabilities) 138,658 (132,072) 6,586 107,469 (112,682) (5,213) Set off within same tax jurisdiction (51,789) 51,789 – (41,790) 41,790 – Reflected in the balance sheet 86,869 (80,283) 6,586 65,679 (70,892) (5,213)

Letter to Shareholders Overview Business Highlights Sustainability Our People Financial Reports Governance
Notes to the Consolidated Financial Statements
Barry Callebaut | Annual Report /
Tax losses carried forward excluded from recognition of related deferred tax assets Tax losses carried forward not recognized as deferred tax assets have the following expiry dates:
as of August 31, 2019 2018 in thousands of CHF Expiry: Within 1 year 981 14,043 After 1 up to 2 years 1,194 2,468 After 2 up to 3 years 597 2,937 After 3 up to 10 years 31,655 28,609 After 10 years 393 4,220 Unlimited 370,670 393,219 Total unrecognized tax losses carried forward 405,490 445,496
Tax losses carried forward utilized during the year 2018/19 were CHF 98.9 million (2017/18: CHF 153.5 million). The related tax relief amounted to CHF 20.8 million, of which CHF 16.8 million were already recognized as a deferred tax asset in the previous year (2017/18: CHF 34.8 million of which CHF 33.1 million were already recognized as a deferred tax asset in the previous year) and CHF 4.0 million that were previously not recognized (2017/18 : CHF 1.7 million).
As at August 31, 2019, the Group had unutilized tax losses carried forward of approximately CHF 542.9 million (2018: approximately CHF 586.5 million) available for offset against future taxable income.
Of the total tax losses carried forward, an amount of CHF 137.5 million has been recognized for deferred taxation purposes resulting in a deferred tax asset of CHF 27.6 million (2017/18: CHF 141.3 million recognized resulting in a deferred tax asset of CHF 35.2 million). The net decrease of CHF 7.6 million in the deferred tax asset on recognized tax losses carried forward consists of CHF 4.3 million tax relief on the first-time recognition of prior year tax losses carried forward, CHF 5.5 million recognition of current year tax losses carried forward and CHF 16.8 million utilization of tax losses already recognized as a deferred tax asset in prior year, CHF 0.1 million increase due to tax rate changes and CHF 0.7 million negative impact relating to currency translation adjustments.
Letter to Shareholders Overview Business Highlights Sustainability Our People Financial Reports Governance
Notes to the Consolidated Financial Statements
Barry Callebaut | Annual Report /
Accounting policies Taxes
Current income taxes are recognized based on taxable income, whereas other taxes such as non-recoverable taxes withheld on management fees and royalties received or paid are reported under “Other expenses.” Non-recoverable withholding taxes are only accrued if distribution by subsidiary companies is foreseen.
Income taxes are calculated in accordance with the tax regulations in effect in each country.
The Group determines the expected income tax rate by weighing the applicable tax rates in the jurisdictions concerned based on the mix of the profit before taxes per jurisdiction.
The applicable expected tax rate per company is the domestic corporate income tax rate applicable to the profit before taxes of the company for the respective fiscal year.
Deferred income taxes are recognized using the balance sheet liability method. Deferred income tax applies to all temporary differences arising between the tax values of assets and liabilities and their values in the Consolidated Financial Statements.
Deferred tax liabilities related to the investments in subsidiaries and joint ventures are not recognized to the extent the Group is able to control the timing of the reversal of these temporary differences and it is probable that these temporary differences will not reverse in the foreseeable future.

Letter to Shareholders Overview Business Highlights Sustainability Our People Financial Reports Governance
Notes to the Consolidated Financial Statements
Barry Callebaut | Annual Report /
Other Disclosures
. Subsequent events Approval of the Financial Statements The Consolidated Financial Statements were authorized for issue by the Board of Directors on November 4, 2019, and are subject to approval by the Annual General Meeting of Shareholders on December 11, 2019.
Acceptance of Swiss tax reform (TRAF) by the canton of Zurich The Swiss electorate has accepted a tax reform by majority vote at the public referendum on May 19, 2019 (TRAF). TRAF is a comprehensive reform package requiring changes to be made to tax laws on federal and cantonal level. While the changes to federal laws accepted in May set the boundaries for cantonal tax laws, cantons have significant discretion in determining their specific implementation of TRAF. Thus, the legislative procedures for both the federal reform and the cantonal reform basically need to be substantively completed for TRAF to be considered substantively enacted. Barry Callebaut’s Swiss operations are domiciled in the canton of Zurich, which has not substantively completed their cantonal tax law processes on August 31, 2019. As a result, Barry Callebaut has not considered TRAF substantively enacted as per the end of the reporting period.
On September 1, 2019, the canton of Zurich held a public referendum on the changes to the cantonal tax laws which was accepted by the electorate. Thus, the relevant cantonal tax law processes have been substantively enacted in September 2019 which is treated as a non-adjusting event for the Annual Report 2018/19.
Key changes to cantonal tax laws in Zurich are the abolition of cantonal privileges for holding companies, domicile companies and mixed companies. During a transitional phase, entities who were subject to abolished privileges have the possibility to make use of transitional measures. The canton has reduced the income tax rate to a combined rate of roughly 19.7% as of 2021. New measures such as an R&D deduction and patent box have been introduced.
Whilst there is a degree of uncertainty arising from the implementation of the comprehensive changes to the cantonal tax law, the Group does not expect a material impact on the effective tax rate of the Group’s Consolidated Financial Statements during the transition period.
Barry Callebaut will reflect the impacts of TRAF for financial reporting purposes in the first half of fiscal year 2019/20. There are no other subsequent events that would require any modification of the value of the assets and liabilities or additional disclosures.

Letter to Shareholders Overview Business Highlights Sustainability Our People Financial Reports Governance
Notes to the Consolidated Financial Statements
Barry Callebaut | Annual Report /
. Other accounting policies Foreign currency transactions The functional currency of the Group’s entities is the currency of their primary economic environment. In individual companies, transactions in foreign currencies are recorded at the rate of exchange at the date of transaction.
Monetary assets and liabilities denominated in foreign currencies are translated into respective functional currencies at the exchange rate prevailing at the reporting date. Any resulting exchange gains and losses are taken to the income statement. If related to commercial transactions or to the measurement of financial instruments in coverage of commercial transactions, such foreign currency gains and losses are classified as cost of goods sold. Otherwise, foreign currency gains and losses are classified as finance income and finance expense.
Foreign currency translation For consolidation purposes, assets and liabilities of subsidiaries reporting in currencies other than Swiss francs are translated to Swiss francs at reporting date rates of exchange. Income statement and cash flow statement are translated at the average rates of exchange for the period. Differences arising from the translation of financial statements using the above method are recorded as cumulative translation adjustments in other comprehensive income. When a foreign operation is disposed of, such that control, significant influence or joint control is lost, the cumulative amount in the translation reserve is reclassified to the Consolidated Income Statement as part of the gain or loss on disposal.
Major foreign exchange rates
2018/19 2017/18 Closing rate Average rate Closing rate Average rate BRL 0.2368 0.2573 0.2311 0.2855 EUR 1.0892 1.1254 1.1305 1.1623 GBP 1.2013 1.2733 1.2617 1.3136 RUB 0.0148 0.0151 0.0142 0.0163 USD 0.9851 0.9932 0.9709 0.9749 XOF/XAF (unit 1,000) 1.6605 1.7156 1.6789 1.7186
Government grants Provided there is reasonable assurance that they will be irrevocably received, grants relating to capital expenditure are deducted from the cost of property, plant and equipment and thus recognized in the Consolidated Income Statement on a straight-line basis over the useful life of the asset.
Other grants that compensate the Group for expenses incurred are deferred and recognized in the Consolidated Income Statement over the period necessary to match them with the costs they are intended to compensate.

To the General Meeting of Barry Callebaut AG, Zurich
Report on the Audit of the Consolidated Financial Statements
Opinion
We have audited the consolidated financial statements of Barry Callebaut AG and its subsidiaries (the Group), which comprise the consolidated balance sheet as at 31 August 2019 and the consolidated income statement, statement of comprehensive income, consolidated statement of changes in equity and consolidated cash flows statement for the year then ended, and notes to the consolidated financial statements, including a summary of significant accounting policies.
In our opinion the consolidated financial statements (pages 43 to 129) give a true and fair view of the consolidated financial position of the Group as at 31 August 2019, and its consolidated financial performance and its consolidated cash flows for the year then ended in accordance with International Financial Reporting Standards (IFRS) and comply with Swiss law.
Basis for Opinion
We conducted our audit in accordance with Swiss law, International Standards on Auditing (ISAs) and Swiss Auditing Standards. Our responsibilities under those provisions and standards are further described in the Auditor’s Responsibilities for the Audit of the Consolidated Financial Statements section of our report. We are independent of the Group in accordance with the provisions of Swiss law and the requirements of the Swiss audit profession, as well as the IESBA Code of Ethics for Professional Accountants, and we have fulfilled our other ethical responsibilities in accordance with these requirements.
We believe that the audit evidence we have obtained is sufficient and appropriate to provide a basis for our opinion.
Key Audit Matters
Existence and Valuation of Inventory
Derivative Financial Instruments and Hedge Accounting
Valuation of Goodwill
Key audit matters are those matters that, in our professional judgment, were of most significance in our audit
of the consolidated financial statements of the current period. These matters were addressed in the context of our audit of the consolidated financial statements as a whole, and in forming our opinion thereon, and we do not provide a separate opinion on these matters.
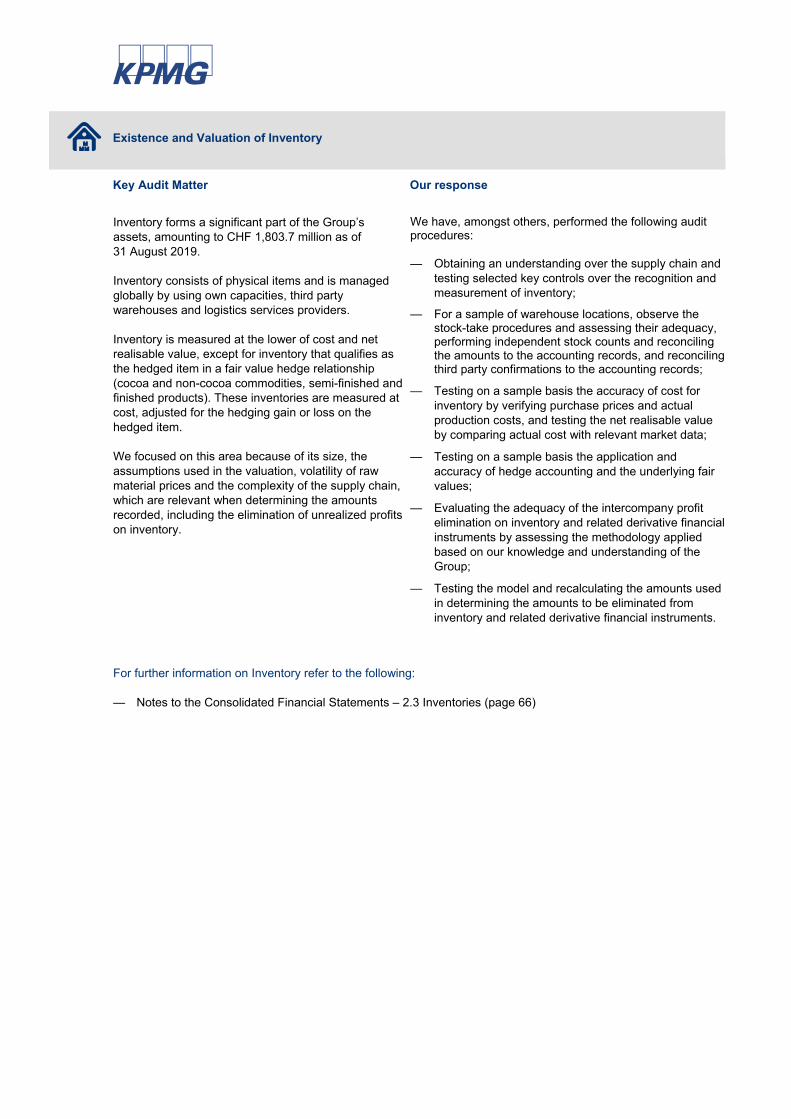
Existence and Valuation of Inventory
Key Audit Matter Our response
Inventory forms a significant part of the Group’s assets, amounting to CHF 1,803.7 million as of 31 August 2019.
Inventory consists of physical items and is managed globally by using own capacities, third party warehouses and logistics services providers.
Inventory is measured at the lower of cost and net realisable value, except for inventory that qualifies as the hedged item in a fair value hedge relationship (cocoa and non-cocoa commodities, semi-finished and finished products). These inventories are measured at cost, adjusted for the hedging gain or loss on the hedged item.
We focused on this area because of its size, the assumptions used in the valuation, volatility of raw material prices and the complexity of the supply chain, which are relevant when determining the amounts recorded, including the elimination of unrealized profits on inventory.
We have, amongst others, performed the following audit procedures: — Obtaining an understanding over the supply chain and
testing selected key controls over the recognition and measurement of inventory;
— For a sample of warehouse locations, observe the stock-take procedures and assessing their adequacy, performing independent stock counts and reconciling the amounts to the accounting records, and reconciling third party confirmations to the accounting records;
— Testing on a sample basis the accuracy of cost for inventory by verifying purchase prices and actual production costs, and testing the net realisable value by comparing actual cost with relevant market data;
— Testing on a sample basis the application and accuracy of hedge accounting and the underlying fair values;
— Evaluating the adequacy of the intercompany profit elimination on inventory and related derivative financial instruments by assessing the methodology applied based on our knowledge and understanding of the Group;
— Testing the model and recalculating the amounts used in determining the amounts to be eliminated from inventory and related derivative financial instruments.
For further information on Inventory refer to the following:
— Notes to the Consolidated Financial Statements – 2.3 Inventories (page 66)

Derivative Financial Instruments and Hedge Accounting
Key Audit Matter Our response
The Group reports derivative financial assets at fair value of CHF 616.3 million and derivative financial liabilities at fair value of CHF 741.4 million as of 31 August 2019.
Derivative financial instruments are used to manage and hedge commodity price risks, foreign currency exchange risks and interest rate risks. These instruments are typically designated in a fair value or cash flow hedge relationship. Financial instruments that are not designated in a hedging relationship and where no hedge accounting is applied are measured at fair value.
The fair value of the derivative financial instruments is based on quoted prices in active markets or on valuation models using observable input data.
We focused on this area because of the number of contracts and the complexity related their measurement and related hedge accounting.
We have, amongst other audit procedures, performed the following audit procedures: — Obtaining an understanding of the risk management
policies and testing key controls for the use, the recognition and the measurement of derivative financial instruments;
— Reconciling derivative financial instruments data to third party confirmations;
— Comparing input data used in the Group’s valuation models to independent sources and externally available market data;
— Comparing valuation of derivative financial instruments with market data or results from alternative, independent valuation models;
— Testing on a sample basis the application and accuracy of hedge accounting;
— Considering the appropriateness of disclosures in relation to financial risk management, derivative financial instruments and hedge accounting.
For our audit procedures in connection with eliminating intercompany profits on inventory and related derivative financial instruments, we refer to the Key Audit Matter “Existence and Valuation of Inventory”.
For further information on Derivative Financial Instruments and Hedge Accounting refer to the following:
— Notes to the Consolidated Financial Statements – 3.7 Financial risk management (pages 78 to 104)

Valuation of Goodwill
Key Audit Matter Our response
The Group reports goodwill totalling CHF 859.6 million as of 31 August 2019, arising from past business combinations.
Management has to assess goodwill for impairment on a yearly basis using a discounted cash flow model to determine the value in use of goodwill balances. This requires the use of a number of key assumptions and judgments, including the estimated future cash flows, long-term growth rates, profitability levels and discount rates applied.
Furthermore, in case of business combinations occurring during the reporting period, management applies judgement in allocating the goodwill to the appropriate cash-generating units (CGUs).
We focused on this area in light of the amounts involved and the level of judgement and estimation required.
Our audit procedures included, amongst others, evaluating the methodical and mathematical accuracy of the model used for the impairment testing, the appropriateness of the assumptions, and the methodology used by management to prepare its cash flow forecasts. We involved our own valuation specialists to support our procedures.
In particular, we performed the following: — Gaining an understanding and assessing the
reasonableness of business plans by comparing the assumptions to prior year;
— Comparing business plan data against budgets and the mid-term plan as approved by the Board of Directors;
— Recalculating independently the value in use;
— Challenging the robustness of the key assumptions used to determine the value in use, cash flow forecasts, long-term growth rates and the discount rates based on our understanding of the commercial prospects of the related CGUs and by comparing them with publicly available data, where possible;
— Conducting sensitivity analysis, taking into account the Group’s historical forecasting accuracy; and
— Comparing the sum of net asset value to the market capitalisation of the Group.
We also considered the appropriateness of disclosures in the consolidated financial statements.
For further information on Goodwill refer to the following:
— Notes to the Consolidated Financial Statements – 2.2 Intangible assets (pages 63 to 66)
Other Information in the Annual Report
The Board of Directors is responsible for the other information in the annual report. The other information comprises all information included in the annual report, but does not include the consolidated financial statements, the stand-alone financial statements of the company, the remuneration report and our auditor’s reports thereon.
Our opinion on the consolidated financial statements does not cover the other information in the annual report and we do not express any form of assurance conclusion thereon.
In connection with our audit of the consolidated financial statements, our responsibility is to read the other information in the annual report and, in doing so, consider whether the other information is materially inconsistent with the consolidated financial statements or our knowledge obtained in the audit, or otherwise appears to be materially misstated. If, based on the work we have performed, we conclude that there is a material misstatement of this other information, we are required to report that fact. We have nothing to report in this regard.
Responsibility of the Board of Directors for the Consolidated Financial Statements
The Board of Directors is responsible for the preparation of the consolidated financial statements that give a true and fair view in accordance with IFRS and the provisions of Swiss law, and for such internal control as the Board of Directors determines is necessary to enable the preparation of consolidated financial statements that are free from material misstatement, whether due to fraud or error.
In preparing the consolidated financial statements, the Board of Directors is responsible for assessing the Group’s ability to continue as a going concern, disclosing, as applicable, matters related to going concern and using the going concern basis of accounting unless the Board of Directors either intends to liquidate the Group or to cease operations, or has no realistic alternative but to do so.
Auditor’s Responsibilities for the Audit of the Consolidated Financial Statements
Our objectives are to obtain reasonable assurance about whether the consolidated financial statements as a whole are free from material misstatement, whether due to fraud or error, and to issue an auditor’s report that includes our opinion. Reasonable assurance is a high level of assurance, but is not a guarantee that an audit conducted in accordance with Swiss law, ISAs and Swiss Auditing Standards will always detect a material misstatement when it exists. Misstatements can arise from fraud or error and are considered material if, individually or in the aggregate, they could reasonably be expected to influence the economic decisions of users taken on the basis of these consolidated financial statements.
As part of an audit in accordance with Swiss law, ISAs and Swiss Auditing Standards, we exercise professional judgment and maintain professional skepticism throughout the audit. We also:
— Identify and assess the risks of material misstatement of the consolidated financial statements, whether due to fraud or error, design and perform audit procedures responsive to those risks, and obtain audit evidence that is sufficient and appropriate to provide a basis for our opinion. The risk of not detecting a material misstatement resulting from fraud is higher than for one resulting from error, as fraud may involve collusion, forgery, intentional omissions, misrepresentations, or the override of internal control.
— Obtain an understanding of internal control relevant to the audit in order to design audit procedures that are appropriate in the circumstances, but not for the purpose of expressing an opinion on the effectiveness of the Group’s internal control.
— Evaluate the appropriateness of accounting policies used and the reasonableness of accounting estimates and related disclosures made.
— Conclude on the appropriateness of the Board of Directors’ use of the going concern basis of accounting and, based on the audit evidence obtained, whether a material uncertainty exists related to events or conditions that may cast significant doubt on the Group’s ability to continue as a going concern. If we conclude that a material uncertainty exists, we are required to draw attention in our auditor’s report to the related disclosures in the consolidated financial statements or, if such disclosures are inadequate, to modify our opinion. Our conclusions are based on the audit evidence obtained up to the date of our auditor’s report. However, future events or conditions may cause the Group to cease to continue as a going concern.

— Evaluate the overall presentation, structure and content of the consolidated financial statements, including the disclosures, and whether the consolidated financial statements represent the underlying transactions and events in a manner that achieves fair presentation.
— Obtain sufficient appropriate audit evidence regarding the financial information of the entities or business activities within the Group to express an opinion on the consolidated financial statements. We are responsible for the direction, supervision and performance of the Group audit. We remain solely responsible for our audit opinion.
We communicate with the Board of Directors or its relevant committee regarding, among other matters, the planned scope and timing of the audit and significant audit findings, including any significant deficiencies in internal control that we identify during our audit.
We also provide the Board of Directors or its relevant committee with a statement that we have complied with relevant ethical requirements regarding independence, and to communicate with them all relationships and other matters that may reasonably be thought to bear on our independence, and where applicable, related safeguards.
From the matters communicated with the Board of Directors or its relevant committee, we determine those matters that were of most significance in the audit of the consolidated financial statements of the current period and are therefore the key audit matters. We describe these matters in our auditor’s report, unless law or regulation precludes public disclosure about the matter or when, in extremely rare circumstances, we determine that a matter should not be communicated in our report because the adverse consequences of doing so would reasonably be expected to outweigh the public interest benefits of such communication.
Report on Other Legal and Regulatory Requirements
In accordance with article 728a para. 1 item 3 CO and the Swiss Auditing Standard 890, we confirm that an internal control system exists, which has been designed for the preparation of consolidated financial statements according to the instructions of the Board of Directors.
We recommend that the consolidated financial statements submitted to you be approved.
KPMG AG
François Rouiller Regula Tobler Licensed Audit Expert Auditor in Charge
Licensed Audit Expert
Zurich, 4 November 2019
KPMG AG, Räffelstrasse 28, PO Box, CH-8036 Zurich KPMG AG is a subsidiary of KPMG Holding AG, which is a member of the KPMG network of independent firms affiliated with KPMG International Cooperative (“KPMG International”), a Swiss legal entity. All rights reserved.

Letter to Shareholders Overview Business Highlights Sustainability Our People Financial Reports Governance
Financial Statements of Barry Callebaut AG
Barry Callebaut | Annual Report /
Income Statement
for the fiscal year 2018/19 2017/18 in thousands of CHF Income Dividend income 101,300 50,000 License income 65,294 64,641 Management fees 44,513 40,074 Other finance income 2,260 4,166 Other operating income 1,113 9 Total income 214,480 158,890 Expenses Finance expense (12,719) (10,500) Personnel expense (68,689) (65,801) Other operating expense (36,550) (37,688) Depreciation of property, plant and equipment (539) (531) Amortization of intangible assets (661) (668) Total expenses (119,158) (115,188) Profit before taxes 95,322 43,702 Direct taxes 457 – Net profit for the year 95,779 43,702
Available earnings
in thousands of CHF 2018/19 2017/18 Available earnings as of September 1, 1,511,488 1,537,619 Dividends to shareholders (gross) (131,461) (69,873) Dividends on treasury shares – 40 Net profit 95,779 43,702 Available earnings as of August 31, 1,475,805 1,511,488

Letter to Shareholders Overview Business Highlights Sustainability Our People Financial Reports Governance
Financial Statements of Barry Callebaut AG
Barry Callebaut | Annual Report /
Balance Sheet
Assets as of August 31, 2019 2018 in thousands of CHF Current assets Cash and cash equivalents 307 161 Other short-term receivables
Other short-term receivables from third parties 357 – Other short-term receivables from Group companies 36,403 89,115
Short-term interest-bearing receivables from Group companies – 38 Prepaid expenses and accrued income 702 1,353 Total current assets 37,769 90,667 Non-current assets Investments in Group companies 2,257,326 2,256,326 Property, plant and equipment 1,786 1,674 Intangible assets Trademarks 261 431 Patents/R&D Development projects 1,419 1,814 Other 764 169 Total non-current assets 2,261,556 2,260,414 Total assets 2,299,325 2,351,081
Liabilities and shareholders' equity as of August 31, 2019 2018 in thousands of CHF Current liabilities Bank overdrafts 11 7 Other short-term payables
to third parties 7,871 2,836 to Group companies 14,907 12,594 to shareholders 89 137
Short-term interest-bearing loans from Group companies 578,596 755,851 Short-term provisions 45,617 40,437 Accrued expenses and deferred income
to third parties 17,843 22,902 to Group companies 276 – to shareholders 67 –
Total current liabilities 665,277 834,764 Non-current liabilities Long-term interest-bearing loans from Group companies 152,000 – Total non-current liabilities 152,000 – Total liabilities 817,277 834,764 Shareholders’ equity Share capital 1 110 110 Legal capital reserves Reserves from capital contributions 39 39 Legal retained earnings
General legal retained earnings 25,600 25,600 Voluntary retained earnings
Available earnings Profit brought forward 1,380,026 1,467,786 Net profit for the year 95,779 43,702
Treasury shares (19,506) (20,920) Total shareholders’ equity 1,482,048 1,516,317 Total liabilities and shareholders’ equity 2,299,325 2,351,081
1 The share capital as of August 31, 2019, consists of 5,488,858 fully paid-in shares at a nominal value of CHF 0.02 (prior year: 5,488,858 shares with a nominal value of CHF 0.02).
Letter to Shareholders Overview Business Highlights Sustainability Our People Financial Reports Governance
Financial Statements of Barry Callebaut AG
Barry Callebaut | Annual Report /
Notes to the Financial Statements
Principles 1.1 General aspects These financial statements have been prepared in accordance with the provisions of the Law on Accounting and Financial Reporting (32nd title of the Swiss Code of Obligations). Where not prescribed by law, the significant accounting and valuation principles applied are described below.
Due to rounding, the figures presented in the tables may not add up precisely.
1.2 Investments Investments are stated at historical costs less any allowance for impairment.
1.3 Treasury shares Treasury shares are recognized at acquisition cost and deducted from shareholders’ equity at the date of acquisition. In case of resale, the gain or loss is recognized through the income statement as financial income or financial expenses.
1.4 Share-based payments Should treasury shares be used for share-based payment programs for Board members and employees, the difference between the original acquisition costs and any consideration paid by the employees at grant date is recognized as personnel expenses.
1.5 Short-term interest-bearing loans Short-term interest-bearing loans are recognized on the balance sheet at nominal value.
1.6 Long-term interest-bearing loans Long-term interest-bearing loans are recognized on the balance sheet at nominal value.
1.7 Revenue recognition for Management fees and Licence income Management fees and license income are recorded as revenue as at the date of invoicing.
1.8 Foregoing a cash flow statement and additional disclosures in the notes As Barry Callebaut AG has prepared its Consolidated Financial Statements in accordance with International Financial Reporting Standards (IFRS), the Company elected to forego presenting additional information on interest-bearing loans and audit fees in the notes as well as a cash flow statement in accordance with the law.

Letter to Shareholders Overview Business Highlights Sustainability Our People Financial Reports Governance
Financial Statements of Barry Callebaut AG
Barry Callebaut | Annual Report /
Information on balance sheet and income statement items
2.1 Prepaid expenses and accrued income Short-term prepaid expenses and accrued income mainly consist of prepayments for licences, rents and leases. 2.2 Investments
as of August, 31 2019 2018 Name and domicile Municipality of registration Share capital Purpose Percentage of ownership1 ADIS Holding Inc., Panama
Panama City CHF 41,624,342 In liquidation
100%
100%
Barry Callebaut Belgium N.V., Belgium
Lebbeke-Wieze EUR 61,537,705 Production, sales
99.99%
99.99%
Barry Callebaut Cocoa AG, Switzerland
Zurich EUR 81,515 Sales
100%
100%
Barry Callebaut Decorations B.V., The Netherlands
Zundert EUR 18,242 Production, sales
100%
100%
Barry Callebaut Management Services AG, Switzerland
Zurich CHF 100,000 Management services
100%
100%
Barry Callebaut Manufacturing Halle B.V.B.A, Belgium
Halle EUR 15,488,952 Production
100%
100%
Barry Callebaut Nederland B.V., The Netherlands
Zundert EUR 21,435,000 Holding
100%
100%
Barry Callebaut Nigeria Ltd., Nigeria
Lagos NGN 10,000,000 Sales
1%
1%
Barry Callebaut Schweiz AG, Switzerland
Dübendorf CHF 4,600,000 Production, sales
100%
100%
Barry Callebaut Services N.V., Belgium
Lebbeke-Wieze EUR 929,286,000 Centralized treasury, management services
99.99%
99.99%
Barry Callebaut Sourcing AG, Switzerland
Zurich CHF 2,000,000 Sourcing
100%
100%
Cabosse Naturals N.V., Belgium
Halle EUR 61,500 Research and Development
99%
99%
Cabosse Naturals Switzerland AG, Switzerland
Zurich CHF 1,000,000 Research and Development
100%
0%
C.J. van Houten & Zoon Holding GmbH, Germany
Norderstedt EUR 72,092,155 Holding
100%
100%
Tagungs- und Seminarzentrum Schloss Marbach GmbH, Germany
Öhningen EUR 1,600,000 Conference and training center
100%
100%
1 Capital rights (percentage of ownership) correspond with voting rights.
Barry Callebaut AG controls all entities of the Barry Callebaut Group either directly or indirectly through the above listed companies. All subsidiaries are listed in Note 5.3 – “Group entities” to the Consolidated Financial Statements of Barry Callebaut AG. 2.3 Short-term interest-bearing loans from Group companies
as of August 31, Maturity Interest 2019 2018 in thousands of CHF Short-term loan from Group companies 20.09.2018 0.640% – 754,500 Short-term loan from Group companies 20.09.2019 0.000% 578,500 – Bank overdraft from Group companies n/a 0.315% 96 1,351 Total 578,596 755,851

Letter to Shareholders Overview Business Highlights Sustainability Our People Financial Reports Governance
Financial Statements of Barry Callebaut AG
Barry Callebaut | Annual Report /
2.4 Accrued expenses and deferred income Accrued expenses and deferred income mainly consist of capital and income tax payables and accruals related to short-term incentives to employees.
2.5 Long-term interest-bearing loans from Group companies
as of August 31, Maturity Interest 2019 2018 in thousands of CHF Loan from Group companies 13.02.2027 1.455% 21,000 – Loan from Group companies 13.02.2026 1.351% 11,000 – Loan from Group companies 13.02.2027 1.495% 110,000 – Loan from Group companies 13.02.2029 1.636% 10,000 – Total 152,000 –
2.6 Share capital and authorized capital Share capital in the amount of CHF 109,777.16 consists of 5,488,858 registered shares at a par value of CHF 0.02 each.
2.7 Reserves from capital contributions The reserves from capital contributions include the premium from capital increases minus the dividends distributed to date.
From a fiscal point of view, any distributions made from reserves from capital contributions are treated the same as a repayment of share capital. The Swiss Federal Tax Administration (SFTA) has confirmed that it will recognize disclosed reserves from capital contributions as a capital contribution as per art. 5 para. 1bis Withholding Tax Act.
2.8 Treasury shares
Number of transactions
Lowest rate in CHF Highest rate in CHF Average rate of transaction in CHF
Quantity
Inventory as of September 1, 2017 – – – – 11,503 Purchase 22 1,502 1,990 1,765 12,930 Allocations to management 4 – – 1,332 (10,762) Allocations to board members 1 – – – (2,010) Inventory as of August 31, 2018 – – – – 11,661 Purchase 8 1,702 1,952 1,726 13,200 Allocations to management 2 – – 1,784 (11,733) Allocations to board members 1 – – – (1,830) Inventory as of August 31, 2019 – – – – 11,298
As at balance sheet date, acquisition costs for directly held treasury shares amounted to CHF 19,506,220 (previous year: CHF 20,920,219).

Letter to Shareholders Overview Business Highlights Sustainability Our People Financial Reports Governance
Financial Statements of Barry Callebaut AG
Barry Callebaut | Annual Report /
2.9 Dividend income In the reporting year, dividend income amounted to CHF 101,300,000 (previous year: CHF 50,000,000). This amount included dividends distributed by Barry Callebaut Sourcing AG, Switzerland, in the amount of CHF 100,000,000 and Barry Callebaut Management Services AG, Switzerland, in the amount of CHF 1,300,000 for the fiscal year 2017/18.
2.10 Other finance income Other finance income consists mostly of foreign exchange and hedging gains.
2.11 License income License income contains royalties from Group companies that are related to the usage of brands and trademarks.
2.12 Management fees Barry Callebaut AG provides a wide variety of business support services for the benefit of its Group companies, such as management support services, information management services (i.e. information technology related services), accounting and finance, human resources, consulting, tax and legal service.
2.13 Finance expense
for the fiscal year 2018/19 2017/18 in thousands of CHF Bank interest and charges 109 182 Interest to Group companies 4,180 3,860 Foreign exchange losses 8,430 6,458 Total 12,719 10,500
2.14 Other operating expense
for the fiscal year 2018/19 2017/18 in thousands of CHF Fees lawyers and consulting 11,109 14,362 Other expenses third parties 8,689 7,568 Assistance fees related parties 817 1,000 Assistance fees Group companies 15,935 14,758 Total 36,550 37,688

Letter to Shareholders Overview Business Highlights Sustainability Our People Financial Reports Governance
Financial Statements of Barry Callebaut AG
Barry Callebaut | Annual Report /
Other information
3.1 Full-time equivalents In line with prior fiscal year, the average number of employees (full-time equivalents) of Barry Callebaut AG exceeded 50, but did not exceed 250.
3.2 Liens, guarantees and pledges in favor of third parties • The Company is a co-debtor for bank loans of max. EUR 750 million
(CHF 816.9 million; 2017/18: CHF 847.9 million) obtained by Barry Callebaut Services N.V., Belgium, on June 22, 2017, whereof the maximal liability is limited to the freely distributable retained earnings (CHF 1,475.8 million less 35% withholding tax).
• The Company is also a co-debtor to the Senior Notes of USD 400 million (CHF 394 million; 2017/18: CHF 388.4 million) issued by Barry Callebaut Services N.V., Belgium, on June 20, 2013, to the Senior Notes of EUR 450 million (CHF 490.2 million; 2017/18: CHF 508.7 million) issued by Barry Callebaut Services N.V., Belgium, on May 24, 2016, as well as to the Schuldscheindarlehen of EUR 467 million (CHF 508.7 million) and CHF 152 million issued by Barry Callebaut Services N.V., Belgium, on February 13, 2019. The maximal liability is limited to the freely distributable retained earnings (CHF 1,475.8 million less 35% withholding tax).
• The Company issued several guarantees for various credit facilities granted to direct and indirect subsidiaries for an amount of up to CHF 1,323.4 million (2017/18: CHF 1,336.3 million).
3.3 Contingent liabilities Until December 31, 2015, the Swiss Barry Callebaut entities formed a VAT subgroup. As long as respective period has not been closed by VAT authorities, liabilities among subgroup participants are still possible.
3.4 Significant shareholders The following shareholders hold a participation of more than 3% of the issued share capital of the Group’s ultimate parent Barry Callebaut AG:
as of August 31, 2019 2018 Jacobs Holding AG 50.1% 50.1% Renata Jacobs 5.0% 8.5% BlackRock, Inc.1 3.1% 3.2% Invesco Ltd.1,2 3.0% n/a
1 Based on notifications through the electronic publication platform of the SIX Swiss Exchange. 2 In May 2019, Invesco Ltd. closed the acquisition of all shares in Oppenheimer Funds which was a subsidiary of Massachusetts Mutual Life Insurance Company.

Letter to Shareholders Overview Business Highlights Sustainability Our People Financial Reports Governance
Financial Statements of Barry Callebaut AG
Barry Callebaut | Annual Report /
3.5 Shareholdings of the Board of Directors and the Executive Commitee Shareholdings of the Board of Directors
Number of shares as of August 31, 2019 2018 Name Function Patrick De Maeseneire Chairman 1,250 750 Jakob Baer Vice Chairman 1,580 1,330 Fernando Aguirre Member of the NCC 640 460 Suja Chandrasekaran Member of the AFRQCC – n/a James (Jim) Donald Chairman of the NCC (until
December 12, 2018) n/a 1,620
Nicolas Jacobs1 Member of the AFRQCC 33,246 93,066 Elio Leoni Sceti Member of the NCC 180 – Timothy Minges Chairman of the NCC (as of
December 12, 2018) 1,035 855
Markus R. Neuhaus Member of the AFRQCC – n/a Juergen Steinemann Member of the NCC 13,505 15,578 Angela Wei Dong – n/a Total shares held by Board of Directors 51,436 113,659
1 Excluding the 50.1% participation held by Jacobs Holding AG (see Note 3.4 “Significant shareholders”).
Shareholdings of the Executive Committee
Number of shares as of August 31, 2019 2018 Name Function Antoine de Saint-Affrique Chief Executive Officer 3,385 1,298 Peter Boone CEO & President Americas 300 82 Ben De Schryver President APAC 33 n/a Isabelle Esser Chief Human Resources Officer
(as of March 2019) – n/a
Massimo Garavaglia President EMEA 2,500 1,778 Carole Le Meur Chief Human Resources Officer
(until September 2018) n/a 143
Pablo Perversi Chief Innovation, Sustainability & Quality Officer; Head of Gourmet
311 82
Dirk Poelman Chief Operations Officer (until August 31, 2019)
2,028 1,282
Steven Retzlaff President Global Cocoa 2,000 1,873 Remco Steenbergen Chief Financial Officer
(as of March 2018) 281 219
Total shares held by Executive Committee 10,838 6,757
3.6 Shares granted to the Board of Directors and employees
2018/19 2018/19 2017/18 2017/18 Quantity Value (CHF) Quantity Value (CHF) Granted to Members of the Board 2,190 3,534,660 1,830 3,477,000 Granted to employees1 of Barry Callebaut AG and subsidiaries 7,056 12,547,866 7,316 10,297,743
1 Employees include all participants in the share plan of the Group including employees on the payroll of subsidiaries of which Barry Callebaut AG is the ultimate parent.

Letter to Shareholders Overview Business Highlights Sustainability Our People Financial Reports Governance
Financial Statements of Barry Callebaut AG
Barry Callebaut | Annual Report /
3.7 Significant events after the balance sheet date The Swiss electorate has accepted a tax reform by majority vote at the public referendum on May 19, 2019 (TRAF), which is a comprehensive reform package requiring changes to be made to tax laws on federal and cantonal level.
Barry Callebaut AG is domiciled in the canton of Zurich. On 1 September 2019, the canton of Zurich held a public referendum on the changes to the cantonal tax laws which was accepted by the electorate. The relevant cantonal tax law processes have been substantively enacted on September 1, 2019, and treated as a non-adjusting event for the Financial Statements of Barry Callebaut AG. Whilst there is a degree of uncertainty arising from the implementation of the comprehensive changes to the cantonal tax law, Barry Callebaut AG does not expect a material impact on the effective tax rate.
There are no other significant events that would require any modification of the value of the assets and liabilities or additional disclosures after the balance sheet date.
3.8 Proposed appropriation of available earnings
in thousands of CHF Balance carried forward as of September 1, 2018 1,511,488 Dividend to shareholders (gross) (131,461) Net income 95,779 Voluntary retained earnings as of August 31, 2019 1,475,805 Treasury shares (19,506) Available retained earnings as of August 31, 2019 1,456,299 Proposed appropriation of available earnings by the Board of Directors Dividend of CHF 26.00 per share (142,710) Balance carry forward 1,313,589
The board of directors proposes to the 2019 Annual General Meeting a dividend of CHF 26.00 per share.
The dividend is expected to be paid on or around January 8, 2020.

To the General Meeting of Barry Callebaut AG, Zurich
Report on the Audit of the Financial Statements
Opinion
We have audited the financial statements of Barry Callebaut AG, which comprise the balance sheet as at 31 August 2019, and the income statement for the year then ended, and notes to the financial statements, including a summary of significant accounting policies.
In our opinion the financial statements (pages 136 to 144) for the year ended 31 August 2019 comply with Swiss law and the company’s articles of incorporation.
Basis for Opinion
We conducted our audit in accordance with Swiss law and Swiss Auditing Standards. Our responsibilities under those provisions and standards are further described in the Auditor’s Responsibilities for the Audit of the Financial Statements section of our report. We are independent of the entity in accordance with the provisions of Swiss law and the requirements of the Swiss audit profession and we have fulfilled our other ethical responsibilities in accordance with these requirements.
We believe that the audit evidence we have obtained is sufficient and appropriate to provide a basis for our opinion.
Report on Key Audit Matters based on the circular 1/2015 of the Federal Audit Oversight Authority
Key audit matters are those matters that, in our professional judgment, were of most significance in our audit of the financial statements of the current period. We have determined that there are no key audit matters to communicate in our report.
Responsibility of the Board of Directors for the Financial Statements
The Board of Directors is responsible for the preparation of the financial statements in accordance with the provisions of Swiss law and the company’s articles of incorporation, and for such internal control as the Board of Directors determines is necessary to enable the preparation of financial statements that are free from material misstatement, whether due to fraud or error.
In preparing the financial statements, the Board of Directors is responsible for assessing the entity’s ability to continue as a going concern, disclosing, as applicable, matters related to going concern and using the going concern basis of accounting unless the Board of Directors either intends to liquidate the entity or to cease operations, or has no realistic alternative but to do so.
Auditor’s Responsibilities for the Audit of the Financial Statements
Our objectives are to obtain reasonable assurance about whether the financial statements as a whole are free from material misstatement, whether due to fraud or error, and to issue an auditor’s report that includes our opinion. Reasonable assurance is a high level of assurance, but is not a guarantee that an audit conducted in accordance with Swiss law and Swiss Auditing Standards will always detect a material misstatement when it exists. Misstatements can arise from fraud or error and are considered material if, individually or in the aggregate, they could reasonably be expected to influence the economic decisions of users taken on the basis of these financial statements.

As part of an audit in accordance with Swiss law and Swiss Auditing Standards, we exercise professional judgment and maintain professional skepticism throughout the audit. We also:
— Identify and assess the risks of material misstatement of the financial statements, whether due to fraud or error, design and perform audit procedures responsive to those risks, and obtain audit evidence that is sufficient and appropriate to provide a basis for our opinion. The risk of not detecting a material misstatement resulting from fraud is higher than for one resulting from error, as fraud may involve collusion, forgery, intentional omissions, misrepresentations, or the override of internal control.
— Obtain an understanding of internal control relevant to the audit in order to design audit procedures that are appropriate in the circumstances, but not for the purpose of expressing an opinion on the effectiveness of internal control.
— Evaluate the appropriateness of accounting policies used and the reasonableness of accounting estimates and related disclosures made.
— Conclude on the appropriateness of the Board of Directors’ use of the going concern basis of accounting and, based on the audit evidence obtained, whether a material uncertainty exists related to events or conditions that may cast significant doubt on the entity’s ability to continue as a going concern. If we conclude that a material uncertainty exists, we are required to draw attention in our auditor’s report to the related disclosures in the financial statements or, if such disclosures are inadequate, to modify our opinion. Our conclusions are based on the audit evidence obtained up to the date of our auditor’s report. However, future events or conditions may cause the entity to cease to continue as a going concern.
We communicate with the Board of Directors or its relevant committee regarding, among other matters, the planned scope and timing of the audit and significant audit findings, including any significant deficiencies in internal control that we identify during our audit.
We also provide the Board of Directors or its relevant committee with a statement that we have complied with relevant ethical requirements regarding independence, and to communicate with them all relationships and other matters that may reasonably be thought to bear on our independence, and where applicable, related safeguards.
From the matters communicated with the Board of Directors or its relevant committee, we determine those matters that were of most significance in the audit of the financial statements of the current period and are therefore the key audit matters. We describe these matters in our auditor’s report, unless law or regulation precludes public disclosure about the matter or when, in extremely rare circumstances, we determine that a matter should not be communicated in our report because the adverse consequences of doing so would reasonably be expected to outweigh the public interest benefits of such communication.
Report on Other Legal and Regulatory Requirements
In accordance with article 728a para. 1 item 3 CO and the Swiss Auditing Standard 890, we confirm that an internal control system exists, which has been designed for the preparation of financial statements according to the instructions of the Board of Directors.
We further confirm that the proposed appropriation of available earnings complies with Swiss law and the company’s articles of incorporation. We recommend that the financial statements submitted to you be approved.
KPMG AG
François Rouiller Regula Tobler Licensed Audit Expert Auditor in Charge
Licensed Audit Expert
Zurich, 4 November 2019
KPMG AG, Räffelstrasse 28, PO Box, CH-8036 Zurich KPMG AG is a subsidiary of KPMG Holding AG, which is a member of the KPMG network of independent firms affiliated with KPMG International Cooperative (“KPMG International”), a Swiss legal entity. All rights reserved.

Letter to Shareholders Overview Business Highlights Sustainability Our People Financial Reports Governance
Governance
Barry Callebaut | Annual Report /
Corporate Governance
Remuneration Report

Letter to Shareholders Overview Business Highlights Sustainability Our People Financial Reports Governance
Corporate Governance
Barry Callebaut | Annual Report /
Corporate Governance The information that follows is provided in accordance with the Directive on Information Relating to Corporate Governance (DCG) issued by the SIX Exchange Regulation division. The principles and rules of Corporate Governance as practiced by Barry Callebaut AG are laid down in the Articles of Incorporation, the Internal Regulations of the Board of Directors and the Charters of the Board Committees. These are reviewed regularly by the Board of Directors and adapted as needed.
Group structure and shareholders As of November 6, 2019, the Barry Callebaut Group has been organized into three different geographic regions: Region EMEA (including Western Europe and Eastern Europe, Middle East and Africa), Region Americas and Region Asia Pacific. The globally managed Global Cocoa is reported as a separate segment, like a Region. The figures
under the respective Regions show all chocolate sales, while the figures reported under Global Cocoa show all sales of cocoa products to third-party customers globally, i.e. in all regions.
The Group’s business can also be separated into three different Product Groups: Food Manufacturers, Gourmet & Specialties and Cocoa Products.
1 AFRQCC: Audit, Finance, Risk, Quality & Compliance Committee. 2 NCC: Nomination & Compensation Committee. 3 Member of the Executive Committee.

Letter to Shareholders Overview Business Highlights Sustainability Our People Financial Reports Governance
Corporate Governance
Barry Callebaut | Annual Report /
The structure of the financial reporting is explained in Note 1.2 to the Consolidated Financial Statements. Barry Callebaut AG (the “Company”) was incorporated on December 13, 1994, under Swiss law, with head offices located at Pfingstweidstrasse 60 in Zurich, Switzerland. The Company is registered in Switzerland and has been listed on the SIX Swiss Exchange (BARN, ISIN Number: CH0009002962) since 1998. The Company has not requested admission to trading of its shares on any other stock exchange. As at August 31, 2019, the total number of issued shares in the Company was 5,488,858 and the market capitalization based on issued shares was CHF 11,109.4 million (August 31, 2018: CHF 9,484.7 million).
The principal subsidiaries of the Company are listed in Note 5.3 to the Consolidated Financial Statements. The significant shareholders of the Company are listed in Note 5.4 to the Financial Statements of the Company, with Jacobs Holding AG as the majority shareholder holding a participation of 50.1% of the issued share capital (August 31, 2018: 50.1%).
The Company is not aware of any cross-shareholdings exceeding 5% of the capital or voting rights on both sides.
Capital structure The information required by the DCG regarding the capital structure is provided in Note 3.2 (share capital, movements in the share capital) to the Consolidated Financial Statements. The Company has no convertible bonds outstanding. The issued share capital is divided into 5,488,858 registered shares with a nominal value of CHF 0.02 each. All of the issued shares are fully paid up and validly issued and are not subject to calls for additional payments of any kind.
The Company has one class of shares, which carries no right to a fixed dividend. There are no participation certificates or dividend-right certificates.
The Company does not have authorized or conditional share capital.
Board of Directors The Board of Directors establishes the strategic, accounting, organizational and financing policies to be followed, and appoints the Executive Committee, to which the Board of Directors has delegated the operational management of the Company. Besides its non-transferable and inalienable duties pursuant to Swiss corporate law, the Board of Directors has retained certain competencies as set forth in the Company’s Internal Regulations and the Annex thereto, both of which are publicly accessible on the website of Barry Callebaut (https://www.barry-callebaut.com/about-us/investors/corporate-governance/functioning-board). As set forth in the Company’s Articles of Incorporation, no member of the Board of Directors may hold more than 15 additional mandates, of which no more than five may be in stock-exchange-listed companies.
As of August 31, 2019, the Board of Directors consisted of ten non-executive members. Each Director is elected by the shareholders of the Company at the Annual General Meeting of Shareholders for a term of office of one year and may be reelected for successive terms.
The composition of the Board of Directors of the Company as of August 31, 2019, was as follows:
Name Nationality Member since Function AFRQCC NCC Patrick De Maeseneire Belgian 2015 Chairman Jakob Baer* Swiss 2010 Vice Chairman Chairman Fernando Aguirre US/Mexican 2013 Director Member Suja Chandrasekaran Australian/Indian/US 2018 Director Member Angela Wei Dong Chinese 2018 Director Nicolas Jacobs Swiss 2012 Director Member Elio Leoni Sceti Italian 2017 Director Member Timothy Minges US 2013 Director Chairman Markus R. Neuhaus Swiss 2018 Director Member Juergen Steinemann* German 2014 Director Member
* Will not stand for reelection at the Annual General Meeting of Shareholders of December 11, 2019.

Letter to Shareholders Overview Business Highlights Sustainability Our People Financial Reports Governance
Corporate Governance
Barry Callebaut | Annual Report /
Patrick De Maeseneire Chairman, Belgian national
Patrick De Maeseneire (1957) was elected to the Board of Directors of Barry Callebaut AG as Chairman at the Annual General Meeting of Shareholders in December 2016. Previously, he had served as Vice Chairman of the Board of Directors since December 2015.
Patrick De Maeseneire started his professional career in 1980 at Arthur Andersen. Between 1980 and 1997, he held executive positions at Wang, Apple Computer, and Sun International. He joined the Adecco Group in 1998, where he held leading positions both in Europe and in the US. From 2002 to 2009, Patrick De Maeseneire served as CEO of Barry Callebaut. In 2009 he returned to Adecco to become CEO of the Adecco Group, a position he held until August 2015.
On November 4, 2015, he was named CEO of Jacobs Holding AG, the majority shareholder of Barry Callebaut AG.
Patrick De Maeseneire also serves as Chairman of Cognita, a leading global private school group, and Colosseum Dental, a leading European/US dental care provider.
Patrick De Maeseneire earned a master’s degree in Commercial Engineering at the Solvay Business School of Brussels University (VUB), Belgium, and a special license in Marketing Management at the Vlerick Leuven Gent Management School, Belgium. Patrick De Maeseneire also completed studies in Business Management at the London Business School and INSEAD, Fontainebleau, France.
In 2007, Patrick De Maeseneire was conferred the title of Baron by King Albert II of Belgium.
Jakob Baer Vice Chairman, Swiss national
Jakob Baer (1944) started his career in 1971 at the Federal Finance Administration. From 1975 to 1991, he was with Fides Group, where he held various positions including Consultant, Head of Legal Department, Branch Office Manager, Zurich, and member of the Division Management Advisory Services. During 1991/1992, Jakob Baer led the planning and execution of the management buyout of the Advisory Services unit of Fides Group, which became part of KPMG Switzerland. He was a member of the Executive Committee of KPMG Switzerland from 1992 to 1994. From 1994 to 2004 he held the position of CEO of KPMG Switzerland and was a member of KPMG’s European and International Leadership Boards.
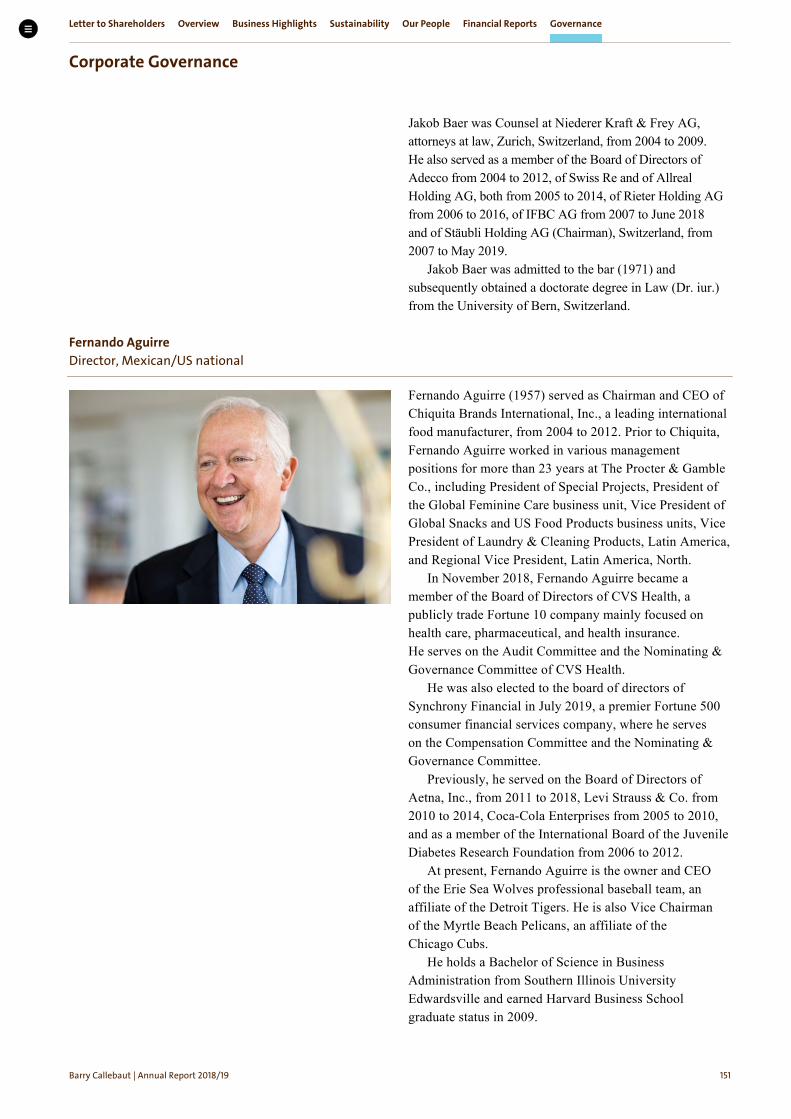
Letter to Shareholders Overview Business Highlights Sustainability Our People Financial Reports Governance
Corporate Governance
Barry Callebaut | Annual Report /
Jakob Baer was Counsel at Niederer Kraft & Frey AG, attorneys at law, Zurich, Switzerland, from 2004 to 2009. He also served as a member of the Board of Directors of Adecco from 2004 to 2012, of Swiss Re and of Allreal Holding AG, both from 2005 to 2014, of Rieter Holding AG from 2006 to 2016, of IFBC AG from 2007 to June 2018 and of Stäubli Holding AG (Chairman), Switzerland, from 2007 to May 2019.
Jakob Baer was admitted to the bar (1971) and subsequently obtained a doctorate degree in Law (Dr. iur.) from the University of Bern, Switzerland.
Fernando Aguirre Director, Mexican/US national
Fernando Aguirre (1957) served as Chairman and CEO of Chiquita Brands International, Inc., a leading international food manufacturer, from 2004 to 2012. Prior to Chiquita, Fernando Aguirre worked in various management positions for more than 23 years at The Procter & Gamble Co., including President of Special Projects, President of the Global Feminine Care business unit, Vice President of Global Snacks and US Food Products business units, Vice President of Laundry & Cleaning Products, Latin America, and Regional Vice President, Latin America, North.
In November 2018, Fernando Aguirre became a member of the Board of Directors of CVS Health, a publicly trade Fortune 10 company mainly focused on health care, pharmaceutical, and health insurance. He serves on the Audit Committee and the Nominating & Governance Committee of CVS Health.
He was also elected to the board of directors of Synchrony Financial in July 2019, a premier Fortune 500 consumer financial services company, where he serves on the Compensation Committee and the Nominating & Governance Committee.
Previously, he served on the Board of Directors of Aetna, Inc., from 2011 to 2018, Levi Strauss & Co. from 2010 to 2014, Coca-Cola Enterprises from 2005 to 2010, and as a member of the International Board of the Juvenile Diabetes Research Foundation from 2006 to 2012.
At present, Fernando Aguirre is the owner and CEO of the Erie Sea Wolves professional baseball team, an affiliate of the Detroit Tigers. He is also Vice Chairman of the Myrtle Beach Pelicans, an affiliate of the Chicago Cubs.
He holds a Bachelor of Science in Business Administration from Southern Illinois University Edwardsville and earned Harvard Business School graduate status in 2009.
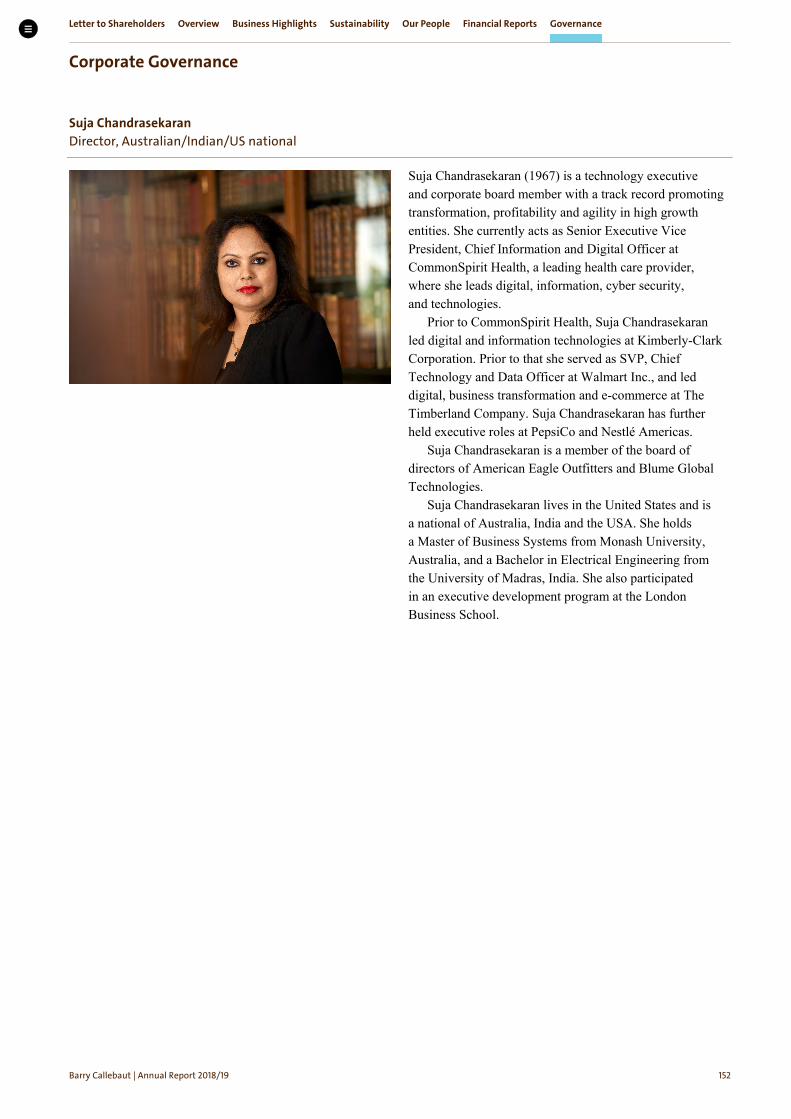
Letter to Shareholders Overview Business Highlights Sustainability Our People Financial Reports Governance
Corporate Governance
Barry Callebaut | Annual Report /
Suja Chandrasekaran Director, Australian/Indian/US national
Suja Chandrasekaran (1967) is a technology executive and corporate board member with a track record promoting transformation, profitability and agility in high growth entities. She currently acts as Senior Executive Vice President, Chief Information and Digital Officer at CommonSpirit Health, a leading health care provider, where she leads digital, information, cyber security, and technologies.
Prior to CommonSpirit Health, Suja Chandrasekaran led digital and information technologies at Kimberly-Clark Corporation. Prior to that she served as SVP, Chief Technology and Data Officer at Walmart Inc., and led digital, business transformation and e-commerce at The Timberland Company. Suja Chandrasekaran has further held executive roles at PepsiCo and Nestlé Americas.
Suja Chandrasekaran is a member of the board of directors of American Eagle Outfitters and Blume Global Technologies.
Suja Chandrasekaran lives in the United States and is a national of Australia, India and the USA. She holds a Master of Business Systems from Monash University, Australia, and a Bachelor in Electrical Engineering from the University of Madras, India. She also participated in an executive development program at the London Business School.
Letter to Shareholders Overview Business Highlights Sustainability Our People Financial Reports Governance
Corporate Governance
Barry Callebaut | Annual Report /
Angela Wei Dong Director, Chinese national
Angela Wei Dong (1973) joined the Board of Barry Callebaut in 2018.
She has served as Global Vice President and General Manager Greater China for Nike since 2015, with responsibility for a P&L of USD 5 billion revenue and 7,000 employees. She has deep expertise in finance, marketing and branding strategies for consumer goods in China and how to build a meaningful cooperation with the large Chinese e-business companies.
Angela Wei Dong joined Nike China in 2005 as a Finance Controller. From 2008 to 2011, she held several roles as Finance Planning and Analysis Director, Deputy Chief Financial Officer, Greater China, and then Global Vice President / Chief Financial Officer, Greater China. In 2015, she was named Global Vice President, Chief Financial Officer and General Manager of Territories, Greater China.
Before joining Nike, Angela Wei Dong worked in several management positions at Coca-Cola, British American Tobacco and Procter & Gamble.
Angela Wei Dong was named as one of the Most Powerful Businesswomen in China by Fortune in 2019 for the 3rd consecutive time, and also honored as one of the Top 100 Businesswomen in China by Forbes in 2018 for the 2nd consecutive time.
Angela Wei Dong obtained a bachelor’s degree in China and an MBA degree from the Kellogg School of Management, Northwestern University, in the US.

Letter to Shareholders Overview Business Highlights Sustainability Our People Financial Reports Governance
Corporate Governance
Barry Callebaut | Annual Report /
Nicolas Jacobs Director, Swiss national
Nicolas Jacobs (1982) has served as a Board member of Barry Callebaut since 2012 and was previously Managing Director for Barry Callebaut’s cocoa and chocolate operations in South America.
Nicolas Jacobs is the Managing Partner of CIP, an entrepreneurial investment company focused on investments in the consumer goods sector.
Nicolas Jacobs acts as the Executive Co-Chairman of Jacobs Holding AG, a professional investment company and majority shareholder of Barry Callebaut.
Nicolas Jacobs is a Board member of Cognita, a leading K-12 school group which is majority owned by Jacobs Holding AG.
Nicolas Jacobs started his career at Goldman Sachs and later served at Restaurant Brands International (RBI) as Senior Director for Global M&A and Development.
Nicolas Jacobs holds a Master in Law from the University of Zurich, a Master of Finance from London Business School and a Master of Business Administration from INSEAD in Fontainebleau.
Elio Leoni Sceti Director, Italian national
Elio Leoni Sceti (1966) joined the Board of Barry Callebaut in December 2017.
Elio Leoni Sceti has over 25 years of experience in the consumer goods and media sectors. He is co-founder and chief crafter of thecraftory.io, the first investment house for mission-driven challenger brands.
Elio Leoni Sceti was formerly CEO of Iglo Birdseye until June 2015, when he oversaw its sale to Nomad Foods. Previously, Elio Leoni Sceti was CEO of EMI Music from 2008 to 2010 and prior to that held senior leadership roles first at Procter & Gamble and then at Reckitt Benckiser, where he served as CMO, Global Head of Innovation and then Head of the European operations.
Elio Leoni Sceti is also Chairman of LSG Holdings and an independent non-executive director of beverage and brewing multinational Anheuser-Busch InBev.
Elio Leoni Sceti is also a Trustee and a Counsellor of One Young World and on the UK Board of Room to Read, a charity promoting education and gender equality.
Elio Leoni Sceti holds a degree in economics from LUISS in Rome, where he also passed the Dottore Commercialista post-graduate bar exam.

Letter to Shareholders Overview Business Highlights Sustainability Our People Financial Reports Governance
Corporate Governance
Barry Callebaut | Annual Report /
Timothy Minges Director, US national
Timothy Minges (1958) spent his entire career in the food industry, including 32 years at PepsiCo before retiring in 2016. Prior to retirement, Tim Minges was Executive Vice President Chief Customer Officer, PepsiCo North America Beverages, and a member of PepsiCo’s Executive Committee. Prior to 2013, he was President and CEO of PepsiCo’s operations in Greater China and President of PepsiCo Foods Asia Pacific. Prior to PepsiCo, Tim Minges worked as a CPA at Alexander Grant.
Tim Minges sat on a variety of public company boards at PepsiCo, including Calbee Foods Japan, Pepsi-Cola Philippines and Serm Suk Thailand as well as the Board of the North American Coffee Partnership (a PepsiCo joint venture with Starbucks).
Tim Minges is engaged as an early stage investor in a variety of food and beverage startups in America and co-founder and Board member of Taokaenoi USA, a joint venture with Thailand’s leading seaweed snack brand. Tim Minges is also a Board member of Master Kong (Tingyi) Beverages, China’s largest beverage company.
Tim Minges holds a Bachelor of Science in Accounting from Miami University, Oxford, Ohio, and has completed the PepsiCo Executive Development Program at Yale School of Management.
Markus R. Neuhaus Director, Swiss national
Markus Neuhaus (1958) spent his entire career at PwC, ultimately serving as Chairman of the Board of PwC Switzerland and member of the Supervisory Board of PwC Europe SE (Germany, the Netherlands, Belgium, Austria, Turkey, Switzerland) until 2019. Since 2012, he had been Chairman of the Board of Directors of PwC Switzerland. From 2007 to 2008 and 2010 to 2013, he was a member of the Global Network Executive Team and from 2013 to 2016 member of the office of the global PwC chairman. From 2005 until 2007, he was a member of the PwC Global Board. From 2007 to 2008, he was in charge of continental Europe. From 2003 until 2012, he held the position of CEO PwC Switzerland. From 1995 to 1998, he was Leader Tax and Legal Services Zurich, and in 1998 he took over the global leadership of M&A Tax Services. He joined PwC in 1985 and became a partner at PwC in 1992.
Markus Neuhaus is also a member of the Board of Galenica AG, Bâloise AG, Orior AG and Jacobs Holding AG.

Letter to Shareholders Overview Business Highlights Sustainability Our People Financial Reports Governance
Corporate Governance
Barry Callebaut | Annual Report /
Furthermore, Markus Neuhaus is Vice Chairman and a member of the Executive Committee of the Foundation Board of Avenir Suisse, Chairman of the Finance and Tax Committee of economiesuisse, a member of the Foundation Board of ETH, Vice Chairman of the Foundation Board of stars – Stein am Rhein Symposium for next generation leaders, Vice Chairman of the Zurich Chamber of Commerce and Chairman of Zürcher Volkswirtschaftliche Gesellschaft.
Markus Neuhaus studied law at the University of Zurich and received a doctorate degree in law in 1988. He completed his second qualification as Certified Tax Consultant in 1990. He also attended various management courses at international business schools (Harvard, INSEAD, IMD).
Juergen Steinemann Director, German national
Juergen Steinemann (1958) was elected to the Board of Directors of Barry Callebaut AG at the Annual General Meeting of Shareholders in December 2014. He served as CEO of Barry Callebaut from 2009 to 2015.
Before joining Barry Callebaut, he served as a member of the Executive Board of Nutreco and as Chief Operating Officer since October 2001. Nutreco is a leading global animal nutrition and aquaculture company, headquartered in the Netherlands. From 1999 to 2001, Juergen Steinemann served as CEO of Unilever’s former subsidiary Loders Croklaan, which produces and markets specialty oils and fats for the food industry. Between 1990 and 1998, he was with the former Eridania Béghin-Say Group, where he held various senior positions in business-to-business marketing and sales, ultimately in the “Corporate Plan et Stratégie” unit at the head office in Paris.
In addition, Juergen Steinemann currently serves on the following Supervisory Boards: METRO AG (Chairman), a leading international specialist in wholesale and food retail trade; Bankiva B.V. (Chairman), a leading player in the European poultry meat market; Big Dutchman AG (Vice Chairman), the market leader in feeding systems and housing equipment for pig and poultry production; and Lonza Group Ltd (member) one of the world’s leading suppliers to the Pharma & Biotech and Specialty Ingredient markets.
Juergen Steinemann is an entrepreneur who holds several investments in the food and agri industry. Furthermore, he serves as a Senior Advisor on the Advisory Board of Tower Brook Capital Partners LP.
Letter to Shareholders Overview Business Highlights Sustainability Our People Financial Reports Governance
Corporate Governance
Barry Callebaut | Annual Report /
Functioning of the Board The Board of Directors constitutes itself at its first meeting subsequent to the Company’s Annual General Meeting of Shareholders, with the exception of the Chairman and the members of the Compensation Committee, who are elected by the Annual General Meeting of Shareholders pursuant to the Articles of Incorporation and Swiss corporate law. The Board of Directors elects the Vice Chairman. It meets as often as business requires but at least four times per fiscal year. The meetings usually take place in Zurich. If possible, the Board of Directors meets once per year at one of the Barry Callebaut production sites and combines this meeting with a visit to the local operation. During fiscal year 2018/19, the Board of Directors met six times. Typically, Board meetings last one full day. The November 2018 and January 2019 meetings were shorter and took place in the form of conference calls. In fiscal year 2018/19, the Board of Directors held one of its regular meetings in combination with a three-day visit to Lodz, Poland.
The Chairman invites the members of the Board to the meetings in writing, indicating the agenda and the motions for resolution thereto. The invitations are sent out at least ten business days prior to the meeting. Each member of the Board can request that the Chairman call for a meeting without undue delay. In addition to the materials for Board meetings, the members of the Board receive monthly financial reports.
At the request of one member of the Board, members of the Executive Committee can be invited to attend Board meetings. The Board of Directors can determine that other third parties, for example external consultants, may attend part or all of the meetings. In the fiscal year under review, the Chief Executive Officer, the Chief Financial Officer and, depending on the agenda items, other members of the Executive Committee or Management of the Company were present at Board meetings and/or Committee meetings. At the end of each physical Board meeting, there is a closed Board session without the participation of the Management.
Resolutions are adopted by a simple majority of the members of the Board being present. Resolutions can also be adopted by unanimous circular decision. In the event of a tie vote, the proposal is deemed not to be resolved. Resolutions adopted at Board meetings are documented through written meeting minutes.
During Board meetings, members of the Board may request any information necessary to fulfill their duties. Outside of meetings, members of the Board may request information from members of the Executive Committee concerning the Group’s business development. Such
requests for information must be addressed to the Chairman of the Board.
The Board of Directors has formed the following Committees:
Audit, Finance, Risk, Quality & Compliance Committee Jakob Baer (Chairman), Nicolas Jacobs, Markus Neuhaus and Suja Chandrasekaran The role of the Audit, Finance, Risk, Quality & Compliance Committee (AFRQCC) is to assist the Board of Directors in carrying out its responsibilities and make recom-mendations regarding the Company’s accounting policies, financial reporting, internal control system, legal and regulatory compliance and quality management. The Board of Directors has not delegated any decision-making power to the AFRQCC.
In addition, the AFRQCC reviews the basic risk management principles and guidelines, the hedging and financing strategies as well as the bases upon which the Board of Directors determines risk tolerance levels and limits for exposures of raw material positions. For details on the financial risk management, see Note 3.7 to the Consolidated Financial Statements.
The AFRQCC further assists the Board of Directors in overseeing the external auditors. The AFRQCC recommends the external auditors for election, reviews the quality of their work, their qualification and independence, the audit fees, the external audit coverage, the reporting to the Board of Directors and/or the AFRQCC, and assesses the additional non-audit services as well as the annual financial statements and the notes thereto. The external auditors attended five meetings of the AFRQCC in fiscal year 2018/19; furthermore, the Chairman of the AFRQCC met the lead external auditor four times outside AFRQCC meetings.
The Company has its own Internal Audit Department, which reports to the Chairman of the AFRQCC. The AFRQCC reviews the performance of the Internal Audit Department. The scope of internal auditing encompasses the examination and evaluation of the adequacy and effectiveness of the organization’s internal control system and the quality of performance in carrying out assigned responsibilities. Significant findings of the Internal Audit Department as well as the respective measures of the Management are presented and reviewed in the AFRQCC meetings and, in material cases, in the meetings of the full Board. The AFRQCC reviews the annual plan of the Internal Audit Department based on a risk assessment. In the last fiscal year, the Internal Audit Department was supported on one project by third-party experts.

Letter to Shareholders Overview Business Highlights Sustainability Our People Financial Reports Governance
Corporate Governance
Barry Callebaut | Annual Report /
Pursuant to the Group’s “Compliance Committee and Whistleblowing Policy”, the Compliance Committee, chaired by the Group Compliance Officer, evaluates and, as the case may be, investigates alleged violations of the Code of Conduct under the supervision of the Chairman of the AFRQCC. The Compliance Committee reports all pending cases to the AFRQCC on a regular basis.
The AFRQCC meets as often as business requires but at least three times per fiscal year. The meetings usually take place in Zurich. In the last fiscal year, the Committee met six times, twice in the form of a conference call. The meetings lasted two to three hours. One of the meetings took place in combination with the Board of Directors’ three-day visit to Lodz, Poland.
Nomination & Compensation Committee Timothy Minges (Chairman), Fernando Aguirre, Elio Leoni Sceti and Juergen Steinemann The Company’s Nomination & Compensation Committee (NCC) is elected by the Annual General Meeting of Shareholders and advises the Board of Directors in deter-mining and verifying the compensation strategy and regulations of the Group as well as in preparing the motions for the attention of the Annual General Meeting of Shareholders regarding the compensation of the Board of Directors and the Executive Committee. It also assists the Board of Directors in defining and monitoring the performance criteria and it makes recommendations to the Board of Directors with respect to the selection, nomination, compensation, evaluation, and, when necessary,
the replacement of key executives. The Board of Directors has not delegated any decision-making power to the NCC. The NCC establishes jointly with the Chief Executive Officer a general succession planning and development policy. The NCC reviews and recommends the remuneration to be paid to members of the Board of Directors and the Executive Committee. It also ensures a transparent Board and Executive Committee nomination process and evaluates potential conflicts of interest involving Management and members of the Board. The NCC monitors the developments of the regulatory framework for compensation of the top Management and the Board of Directors on an on-going basis and develops suggestions for the respective adaptations of the Group’s compensation system.
The NCC meets as often as business requires but at least three times per fiscal year. The meetings usually take place in Zurich. Last year, the NCC met five times, once in the form of a conference call. The meetings lasted two hours. One of the meetings took place in the context of the Board of Directors’ three-day visit to Lodz, Poland. Executive Committee The Executive Committee consists of nine functions and is headed by the Chief Executive Officer. For information on the external activities of each member of the Executive Committee, see the respective curriculum vitae. No member of the Executive Committee may hold more than five additional mandates, of which no more than two may be in stock-exchange-listed companies.
Name Function Nationality Member since Antoine de Saint-Affrique Chief Executive Officer French 2015 Remco Steenbergen Chief Financial Officer Dutch 2018 Peter Boone CEO and President Americas Dutch 2012 Dirk Poelman Chief Operations Officer Belgian 2009 (until August 31, 2019) Olivier Delaunay Chief Operations Officer French September 1, 2019 Isabelle Esser Chief Human Resources Officer Belgian February 1, 2019 Massimo Garavaglia President EMEA Italian 2004 Pablo Perversi Chief Innovation, Sustainability & Quality Officer;
Head of Gourmet Spanish/Argentinean 2017
Steven Retzlaff President Global Cocoa US/Swiss 2008 Ben De Schryver President Asia Pacific Belgian 2017

Letter to Shareholders Overview Business Highlights Sustainability Our People Financial Reports Governance
Corporate Governance
Barry Callebaut | Annual Report /
Antoine de Saint-Affrique Chief Executive Officer, French national
Antoine de Saint-Affrique (1964) is Chief Executive Officer of Barry Callebaut AG and was appointed to that role as of October 1, 2015.
From September 2011 to September 2015, Antoine de Saint-Affrique served as President Unilever Foods and member of Unilever’s Group Executive Committee, where he was accountable for businesses with a combined turnover of EUR 12.4 billion.
Prior to this, Antoine de Saint-Affrique was Executive Vice President of Unilever’s Skin category – an area of the business which includes leading brands such as Dove, Lux, Lifebuoy and Pond’s. From 2005 to 2009, Antoine de Saint-Affrique was Executive Vice President for Unilever’s Central and Eastern Europe region – an area covering 21 countries. He was based in Moscow. Before joining Unilever in 2000, Antoine de Saint-Affrique was Marketing Vice President and a Partner at Amora Maille, a foods company which was acquired under a leveraged buyout from the Danone Group. He served as a reserve naval officer between 1987 and 1988.
Antoine de Saint-Affrique has lived in Africa, the US, Hungary, the Netherlands, Russia, and the United Kingdom. He is a Non-Executive Director and a member of both the CSR and the Strategy Committee at the ophthalmic company Essilor International, the world leader in corrective lenses. He has also been Conseiller du Commerce Extérieur since 2004. Further, Antoine de Saint-Affrique is a member of the board of directors of the Swiss-American Chamber of Commerce.
Antoine de Saint-Affrique has a degree in Business Administration from ESSEC (1987) in Paris, and a qualification in Executive Education from Harvard Business School. Since 2004, he has led the Marketing course at Mines ParisTech (Corps des Mines).

Letter to Shareholders Overview Business Highlights Sustainability Our People Financial Reports Governance
Corporate Governance
Barry Callebaut | Annual Report /
Remco Steenbergen Chief Financial Officer, Dutch national
Remco Steenbergen (1968) was appointed to the position of Chief Financial Officer and member of the Executive Committee of Barry Callebaut effective March 1, 2018.
Remco Steenbergen started his career with KPMG in the Netherlands in 1986. In 1993, he moved to the United Kingdom as Manager Corporate Finance with KPMG in London. From 1995 to 1998, he worked as Senior Manager in the International Practice of KPMG in Taipei, Taiwan.
Remco Steenbergen joined Royal Philips, a leader in health technology, in 1998 as CFO Television Europe and Global Industry in Bruges, Belgium. In 2002, he was promoted to Vice President, General Manager of Finance Shared Services Europe in Dublin, Ireland. From 2004 to 2009, he served as Senior Vice President, Group Chief Accountant for Philips in Amsterdam, Netherlands. In 2009, Remco Steenbergen transitioned to Boston, USA, as Senior Vice President, Sector Controller Healthcare and became Senior Vice President, CFO Business Imaging Systems in 2011. In 2014, he returned to Europe as Executive Vice President, Group Controller, in Amsterdam, Netherlands, and was subsequently appointed Executive Vice President, CFO HealthTech Businesses, Innovation & Group Functions in 2015.
Remco Steenbergen received a post-doctorate in accounting from the Erasmus University in Rotterdam, Netherlands, and holds an MBA from IMD in Lausanne, Switzerland.
Letter to Shareholders Overview Business Highlights Sustainability Our People Financial Reports Governance
Corporate Governance
Barry Callebaut | Annual Report /
Peter Boone CEO and President Americas, Dutch national
Peter Boone (1970) was appointed to the position of CEO & President Americas effective September 1, 2017. He has been a member of the Executive Committee of Barry Callebaut since 2012.
Peter Boone joined Barry Callebaut as Chief Innovation Officer and member of the Executive Committee in 2012. He assumed additional responsibility for Quality Assurance as of June 2013 and for Sustainability as of November 2015.
From 2010 to 2012, Peter Boone worked with Unilever as Chief Marketing Officer responsible for the marketing of all brands in all categories in Australia and New Zealand. He was a member of the regional Executive Board.
Peter Boone started his career at the Information Services division of ITT Corp., where he worked in various marketing roles. In 1996, he joined Unilever as a Strategy Analyst at the head office in Rotterdam, Netherlands. Peter Boone also held other positions at Unilever such as Global Vice President Brand Development at the Unilever Headquarters in Rotterdam, Netherlands, and Vice President Marketing & Sales Latin America Foods Solution based in São Paulo, Brazil.
Peter Boone studied Business Administration at Erasmus University in Rotterdam, Netherlands.
Olivier Delaunay Chief Operations Officer, French national
Olivier Delaunay (1963) was appointed to the position of Chief Operations Officer and member of the Executive Committee effective September 1, 2019. He joined Barry Callebaut in 2012 as Vice President OSCO (Operations & Supply Chain Organization) for Barry Callebaut’s largest region EMEA (Europe, Middle East, Africa). He had already worked for the Group from 1987 to1994: From 1987 to 1990 as Maintenance Manager at SIC Cacaos, the company’s subsidiary in Cameroon, then from 1990 to 1994 as Project Manager in France, the Netherlands and the United States.
From 1994 to 2008, Olivier Delaunay served Danone, the leading French food and beverage company: From 1994 to 2000, he was with the Danone Dairy division, first as Head of Engineering North Europe (France, Benelux, Nordics), then as Production Manager in Le Molay, France. In 2000, he joined the Danone Biscuit division, initially as Plant Manager for two LU production sites, then as Head of Continuous Improvement for 40 plants worldwide and last as Head OSCO for Italy, Germany, Benelux and the Nordics. In 2008, when Mondelez acquired LU from Danone,

Letter to Shareholders Overview Business Highlights Sustainability Our People Financial Reports Governance
Corporate Governance
Barry Callebaut | Annual Report /
he joined the Mondelez Biscuit division as Head OSCO for LU France until 2012.
Olivier Delaunay holds a Master of Mechanical Engineering from ICAM in Lille, France.
Isabelle Esser Chief Human Resources Officer, Belgian national
Isabelle Esser (1963) was appointed Chief Human Resources Officer and a member of the Executive Committe effective February 1, 2019.
Before joining Barry Callebaut, Isabelle Esser worked for Unilever as Executive Vice President R&D Foods Transformation in the Global Foods & Refreshment Division, leading the creation of a new global Foods Innovation Center at the campus of Wageningen University in the Netherlands and the transformation of Foods R&D into a more open and agile innovation engine.
Isabelle Esser started her career in the UK as a Scientist at Unilever Research & Development Port Sunlight Laboratory, UK, after which she served in various positions within Research & Development, in the Deodorant Innovation Center before moving on as Development Director in the European Hair Innovation Center and being promoted to member of the Global Category Leadership Team in 2004. In 2005, she was appointed Vice President R&D for Fabric Cleaning in the Global Fabric Cleaning Innovation Center. From 2007 to 2010, she served as Vice President R&D for Deodorant and was also a member of the Global Diversity Board chaired by the CEO. From 2010 to 2011, she held the role of Vice President R&D Europe, CEE and Russia, responsible for all R&D centers and facilities located in 16 countries in that region, across Unilever’s Foods and Home & Personal Care businesses. From 2011, Isabelle Esser served first as Vice President R&D Savoury and then as Executive Vice President R&D Foods in the Global Foods Division.
Isabelle Esser holds a degree as ‘Ingénieur Civil en Sciences des Matériaux, Orientation Physique’ from Louvain-La-Neuve University in Belgium and a PhD in Chemistry from the University of Birmingham in the UK.

Letter to Shareholders Overview Business Highlights Sustainability Our People Financial Reports Governance
Corporate Governance
Barry Callebaut | Annual Report /
Massimo Garavaglia President EMEA, Italian national
Massimo Garavaglia (1966) was appointed President EMEA (Europe, Middle East, Africa) as of October 1, 2015.
Since 2004, he has been an active and contributing member of the Executive Committee of Barry Callebaut AG.
Massimo Garavaglia launched his career with E. Oreggia, a large Italian food products importer, where he served as a sales manager from 1990 to 1992.
In 1992, he joined Callebaut Italia S.p.A. as the Country Manager for Italy and after the merger between Callebaut and Cacao Barry in 1996, he was appointed as Barry Callebaut’s Country Manager for Italy until 2003. From 2003 to 2004, he directed the Region consisting of South of Europe, Eastern Europe and Middle East.
In 2004, he took over the position as President of the Food Manufacturers Division.
In 2006, he moved to Chicago and assumed the responsibility of President Barry Callebaut Americas. He returned to Zurich in 2009 where he served as President Western Europe till 2015.
Massimo Garavaglia holds a master’s degree in Economics from Bocconi University, Milan, Italy.
Pablo Perversi Chief Innovation, Sustainability & Quality Officer; Global Head of Gourmet, Spanish and Argentinean national
Pablo Perversi (1970) was appointed to the position of Chief Innovation, Sustainability & Quality Officer and Head of Gourmet and member of the Executive Committee of Barry Callebaut AG effective September 1, 2018. He has been a member of the Executive Committee of Barry Callebaut AG since September 1, 2017.
Before joining Barry Callebaut, Pablo Perversi worked for Unilever as Vice President Foods Europe, a business made of 50+ brands in Europe, serving 370 million consumers. In this position, he was also a Unilever Europe Executive Team member, a Global Foods Executive Team member and a Vice President for Culinaria Europe. From 2011 to 2014, he was Vice President Foods SEAA and Unilever SEAA Executive Team member.
Pablo Perversi started his career as a Trainee at Unilever in 1993 in finance. From 1994 to 1997, he worked as Brand Manager Savoury and later Tea at Unilever UK, he then was Marketing Director Frozen Foods and Spreads at Unilever Argentina from 1997 to 2001. In 2001, he was promoted to the position of European Category Director and Spreads Unilever Europe and had the global lead for Spreads and the European lead for Dressings before he became Sales Director at Unilever Spain in 2004. From 2006 to 2009,

Letter to Shareholders Overview Business Highlights Sustainability Our People Financial Reports Governance
Corporate Governance
Barry Callebaut | Annual Report /
he served as Vice President and Managing Director at Unilever North LatAm, and from 2009 to 2011 he was Vice President Marketing Operations and Savoury Global Category and a member of the G10 Board, running all marketing operations for Foodsolutions across 10 regions and 36 countries.
Pablo Perversi studied Industrial Engineering and Economics at the University of Birmingham. He also holds an accreditation from Cambridge University in Sustainable Leadership.
Steven Retzlaff President Global Cocoa, US and Swiss national
Steven Retzlaff (1963) was appointed President Global Cocoa (until August 2013 Global Sourcing & Cocoa) and member of the Executive Committee of Barry Callebaut AG in January 2008.
He joined Barry Callebaut in 1996 and has held various senior finance and general management positions since. He is Vice Chairman and Treasurer of the World Cocoa Foundation and Chairman of the European Cocoa Association.
From 1987 to 1993, he worked for KPMG in San Francisco and Zurich, and from 1993 to 1996 at JMP Newcor in Zug, Switzerland.
Steven Retzlaff holds a Bachelor of Arts in Economics from Whitman College. He also studied at the Institute of European Studies in Madrid and at INSEAD in Fontainebleau, France.
Letter to Shareholders Overview Business Highlights Sustainability Our People Financial Reports Governance
Corporate Governance
Barry Callebaut | Annual Report /
Ben De Schryver President Asia Pacific, Belgian national
Ben De Schryver (1974) has been President of Barry Callebaut in Region Asia Pacific since September 2016 and was appointed to member of the Executive Committee of Barry Callebaut AG effective September 1, 2017.
Ben De Schryver has been with Barry Callebaut in a variety of sales and finance roles since 1999. He started with Barry Callebaut in Belgium in 1999 and transferred to Singapore in 2002 as Chief Financial Officer Region Asia Pacific. He then relocated to Canada as Director Pricing & Customer Services in 2007, before moving on to the company’s new regional head office in Chicago in 2009, where he last served as Chief Financial Officer Americas before being appointed President Asia Pacific as of September 1, 2016.
Ben De Schryver holds a bachelor’s degree in Accounting from University College in Ghent, Belgium.
Letter to Shareholders Overview Business Highlights Sustainability Our People Financial Reports Governance
Corporate Governance
Barry Callebaut | Annual Report /
Shareholders’ participation Each share of the Company carries one vote at the General Meetings of Shareholders. Voting rights may be exercised only after a shareholder has been registered in the Company’s share register as a shareholder with voting rights.
Shareholders may register their shares in the name of a nominee approved by the Company and may exercise their voting rights by giving instructions to the nominee to vote on their behalf. However, a nominee holding more than 3% of the share capital will be registered as nominee for share-holders with voting rights only if it discloses the identity of each beneficial owner of shares claiming 0.5% or more of the share capital. No nominee holding more than 8% of the share capital may be registered as a shareholder with respect to the excess shares. The Board of Directors may, however, on a case-by-case basis, permit some or all of the excess shares to be registered with voting rights. In fiscal year 2018/19, no such exception was requested.
A resolution passed at the General Meeting of Share-holders with a majority of at least two thirds of the shares represented at such meeting is required to change the restrictions on the transferability of registered shares. Shareholders may be represented at the General Meeting of Shareholders by their respective legal representative, another shareholder or the independent proxy pursuant to the “Ordinance against Excessive Compensation at Listed Companies” (OaEC). The Articles of Incorporation follow the majority rules and the provisions on convocation prescribed by the Swiss law concerning general meetings of shareholders. Shareholders with registered voting rights who together represent at least 0.25% of the share capital or of the votes may call for the inclusion of an item on the agenda. Such request for inclusion must be made in writing at least 60 days prior to the date of the General Meeting of Shareholders setting forth the items to be included on the agenda and the motions put forward by the shareholders.
Notice of the General Meeting of Shareholders is given by way of one-time publication in the Company’s official publication organ (Swiss Official Gazette of Commerce, “Schweizerisches Handelsamtsblatt”). Shareholders registered in the share register with voting rights at the date specified in the invitation may additionally receive an invitation to the General Meeting of Shareholders in writing. Furthermore, the Company offers its shareholders the opportunity to register with the online platform Sherpany and thus the possibility to submit their voting instructions to the independent proxy in an efficient manner. The published disclosures on significant share-holders of the Company are accessible via the disclosure
platform of SIX Exchange Regulation: https://www.six-exchange-regulation.com/en/home/publications/significant-shareholders.html.
Change of control and defense measures According to the Swiss Stock Exchange and Securities Trading Act, an investor who acquires 331⁄3% or more of all voting rights in the Company has to submit a take-over offer for all shares outstanding. The Company has not elected to change or opt out of this rule.
There are no change of control clauses in the employ-ment contracts with the members of the Board of Directors or of the Executive Committee.
External auditors At the Annual General Meeting of Shareholders of the Company held on December 12, 2018, the shareholders voted to reelect KPMG AG, Zurich, as statutory auditors. The statutory auditors are appointed annually by the General Meeting of Shareholders for a term of office of one year. The current lead auditor in charge has exercised this function since fiscal year 2014/15. Pursuant to the Swiss Code of Obligations, the lead auditor in charge may exercise her/his role for a maximum of seven years. The current lead auditor in charge may therefore exercise his function until and including fiscal year 2021/22.
For fiscal year 2018/19, the remuneration for the audit of the accounting records and the financial statements of the Company, and the audit of the Group’s Consolidated Financial Statements amounted to CHF 2.8 million. The remuneration was evaluated by the AFRQCC in view of the scope and the complexity of the Group. The performance of the auditors is monitored by the AFRQCC, to whom the auditors present a detailed report on the result of the audit of the Group. Prior to the presentation to the AFRQCC, the lead auditor in charge reviews the audit findings with the Chairman of the AFRQCC without the presence of any members of the Management.
KPMG received a total amount of CHF 0.8 million for additional services, i.e. for transaction and other advisory services (including due diligence). Adequate measures for the avoidance of potential conflicts of interests between the different services provided by KPMG were observed.

Letter to Shareholders Overview Business Highlights Sustainability Our People Financial Reports Governance
Corporate Governance
Barry Callebaut | Annual Report /
Information policy The Company is committed to continuous and open communication with its shareholders, potential investors and other stakeholders based on the principles of trans-parency and equal treatment, i.e. simultaneous provision of price-sensitive information and no selective disclosure.
The Group provides detailed information on its business activities and financial performance in its quarterly reports and press releases, at conferences for media and financial analysts as well as at the Annual General Meeting of Shareholders. Further, representatives of the Group regularly meet (current and potential) investors in personal
meetings and present the Company and the Group at industry events and investor conferences.
Presentations are also made available on the Group’s website, which is updated continuously. The financial calendar for fiscal year 2019/20 and related contacts are published on page 182.
The published media releases of Barry Callebaut are accessible via: https://www.barry-callebaut.com/en/group/media/news-stories.
To subscribe to the Group’s electronic news alerts, please go to: https://www.barry-callebaut.com/en/bccom-contact/person/form/996.

Letter to Shareholders Overview Business Highlights Sustainability Our People Financial Reports Governance
Remuneration Report
Barry Callebaut | Annual Report /
Remuneration Report Dear Shareholders, On behalf of the Nomination and Compensation Committee, I am pleased to share with you the Remuneration Report for the fiscal year 2018/19. This Remuneration Report has been prepared in accordance with the “Ordinance against Excessive Compensation in listed Companies” (OaEC), Art. 663c paragraph 3 of the Swiss Code of Obligations and the Corporate Governance Directive issued by SIX Exchange Regulation.
In the fiscal year 2018/19, the Group achieved strong results with profitable growth and good cash generation driven by a consistent execution of its ‘smart growth’ strategy.
This reports explains how the performance in the reporting year impacted the compensation paid to the Executive Committee under the incentive plans.
During the reporting year, the Nomination and Compensation Committee (NCC) conducted a review of the remuneration programs applicable to the Board of Directors and to the Executive Committee. On the basis of this analysis and in order to further align the remuneration programs with the long-term interests of the shareholders, the NCC decided to make the following changes, applicable as of fiscal year 2019/20: • Remuneration of the Board of Directors: a blocking
period of three years will be applied to the compensation delivered in shares;
• Remuneration of the Executive Committee: Executive Committee members will be required to hold a multiple of their annual base salary (ABS) in shares (CEO 300%; Executive Committee members 200%).
Furthermore, as communicated in last year’s Remuneration Report, the long-term incentive award granted in fiscal year 2018/19 includes an additional tranche of PSU vesting over a four-year period, conditional upon outperforming the Mid-Term Plan on four equally-weighted indicators (4 year compound annual growth rate (CAGR), EBIT, cumulative Free cash flow and ROIC).
In addition to the review of the remuneration programs, the NCC performed its regular activities throughout the year, such as the succession planning for the positions on the Board of Directors and on the Executive Committee, the performance goal setting at the beginning of the year and the performance assessment at year end for the Executive
Committee members, the determination of the remuneration of the members of Executive Committee, as well as the preparation of the Remuneration Report and of the say-on-pay vote at the Annual General Meeting.
You will find further information on the activities of the NCC and on Barry Callebaut’s remuneration programs on the following pages.
At the 2019 General Meeting, we will request your approval of the total remuneration amount to be awarded to the Board of Directors for the period until the following General Meeting, the maximum aggregate amount of fixed remuneration to be awarded to the Executive Committee in fiscal year 2020/21, and the maximum aggregate amount of variable remuneration awarded to the Executive Committee in fiscal year 2018/19. Additionally, you will have the opportunity to express your opinion on this Remuneration Report in a consultative vote. You will find in the report that the remuneration awarded to the Board of Directors for the compensation period ending with the 2019 General Meeting and the fixed remuneration awarded to the Group Executive Board in 2018/19 are within the limits approved at the 2018 General Meeting and 2017 General Meeting.
Looking ahead, we will continue to assess and review our compensation programs to ensure that they are still fulfilling their purpose in the evolving context in which the company operates. We will pursue an open and active dialogue with our shareholders as we continue to enhance the compensation system. We are confident that this report includes all relevant information and that our remuneration system rewards performance in a balanced and sustainable manner and aligns well with shareholders’ interests. Yours sincerely,
Timothy Minges Chairman of the NCC

Letter to Shareholders Overview Business Highlights Sustainability Our People Financial Reports Governance
Remuneration Report
Barry Callebaut | Annual Report /
Remuneration at a glance Summary of current remuneration system Board of Directors
In order to ensure their independence in the performance of their supervisory function, members of the Board of Directors only receive a fixed remuneration in the form of cash and shares. The remuneration system for the Board of Directors does not contain any performance-related components.
Annual fees
Cash (amount in CHF)
Shares (number of shares)
Chairman 400,000 500 Vice Chairman 200,000 250 Member 100,000 180 Committee Chair 40,000 Committee Member 25,000
Remuneration policy and principles
In order to ensure the company's success and to maintain its position as market leader, it is critical to attract, develop and retain the right talents. Barry Callebaut’s remuneration programs are designed to support this fundamental objective and are based on the following principles: • We reward performance and share the Company’s success; • We act with fairness and transparency; • We offer competitive remuneration; • We share responsibility with our employees; • We encourage employee development.
Summary of current remuneration system Executive Committee
The remuneration of the Executive Committee consists of fixed and variable elements. • Base salary and benefits form the fixed remuneration. • Variable remuneration drives and rewards best-in-class
performance based on ambitious and stretched targets. It consists of short-term and long-term elements:
Base salary Pay for the function Benefits Cover retirement, death and disability risks,
attract and retain Short-Term Incentive Drive and reward annual performance, attract
& retain Long-Term Incentive (LTIP)
Drive and reward long-term performance, align with shareholders’ interests, retain
Remuneration in 2018/19 Executive Committee
The fixed remuneration awarded to the Executive Committee in fiscal year 2018/19 is within the limits approved by the shareholders at the Annual General Meeting:
Compensation period Approved amount (CHF)
Effective amount (CHF)
Fiscal year 2018/19 6,500,000 5,701,839
Changes from fiscal year 2019/20 onwards Executive Committee members are subject to minimum shareholding requirements (CEO 300%, other 200% of ABS).
Short term performance achievement fiscal year 2018/19 CEO: 142.7% of target; other members of the Executive Committee in the range of 123.6% to 155.6% of target.
Changes from 2020 onwards Shares will be subject to a three-year blocking period.
Compensation governance
• Authority for decisions related to remuneration are governed by the Articles of Incorporation of Barry Callebaut AG • The maximum aggregate amounts of remuneration of the members of the Board of Directors and of the Executive Committee are
subject to a binding vote at the Annual General Meeting • In addition, the Remuneration Report for the preceding period is subject to a consultative vote at the Annual General Meeting • The Board of Directors is supported by the NCC in preparing all compensation-related decisions regarding the Board of Directors
and the Executive Committee
Remuneration in 2018/19 Board of Directors
The remuneration awarded to the Board of Directors in fiscal year 2018/19 is within the limits approved by the shareholders at the annual general meetings:
Compensation period Approved amount (CHF)
Effective amount (CHF)
AGM 2017 – AGM 2018 2,200,000 + 2,190 shares
1,702,513 1,830 shares
AGM 2018 – AGM 2019 2,200,000 + 2,190 shares
To be determined*
* The compensation period is not yet completed, a definitive assessment will be provided in the compensation report for fiscal year 2019/20.

Letter to Shareholders Overview Business Highlights Sustainability Our People Financial Reports Governance
Remuneration Report
Barry Callebaut | Annual Report /
This Remuneration Report describes the fundamental principles of the remuneration system at Barry Callebaut as well as the governance framework related to remuneration decisions. The report provides details on the remuneration of the members of the Board of Directors and the Executive Committee related to fiscal year 2018/19. Shareholdings of the members of the Board of Directors and the Executive Committee are also disclosed (reproduction of Note 3.5 to the Financial Statements of Barry Callebaut AG).
The Remuneration Report has been prepared in accordance with the “Ordinance against Excessive Compensation in listed Companies” (OaEC), Art. 663c paragraph 3 of the Swiss Code of Obligations and the Corporate Governance Directive issued by SIX Exchange Regulation.
Remuneration philosophy and principles The remuneration philosophy and principles are laid out in the Total Reward Policy that was adopted by the Board of Directors in fiscal year 2014/15. Reward programs strengthen the Group’s ability to attract and retain talented individuals and support the employees’ on-going career development within the company. Barry Callebaut believes that the commitment and performance of its executives, managers and employees should be rewarded, balancing both the success of Barry Callebaut as a Company and the individual contributions. Barry Callebaut fosters a performance-oriented culture and uses an annual Performance Management and Development Process (PMDP) to monitor and assess the contributions of all employees to the achievement of business results as well as to their personal and professional development.
The remuneration principles are summarized below:
We reward performance and share the Company’s success…
… by balancing a mix of short-term and long-term remuneration components as rewards for Company results, individual performance and long-term success.
We act with fairness and transparency…
… by taking remuneration decisions on the basis of the scope of the function rather than personal attributes, and thus by ensuring internal equity.
We offer competitive remuneration…
… by considering relevant market benchmarks when taking remuneration decisions.
We share responsibility with our employees…
… by providing risk benefits including retirement and health care insurances, in line with the local regulations and market practice.
We encourage employee development…
… by offering challenging work assignments and Company-sponsored training and education.
Governance related to remuneration Pursuant to the OaEC as implemented in the Company’s Articles of Incorporation (Article 30), the General Meeting of Shareholders votes on the total remuneration of the members of the Board of Directors and the Executive Committee. The General Meeting of Shareholders votes on the motions of the Board of Directors on an annual basis and with binding effect with regard to: a) The aggregate maximum amount of the remuneration
of the Board of Directors for the forthcoming term of office.
b) The aggregate maximum amount of the fixed remuneration of the Executive Committee for the forthcoming fiscal year.
c) The aggregate maximum amount of the variable remuneration of the Executive Committee for the past fiscal year.
The General Meeting of Shareholders votes separately on the aggregate remuneration of the Board of Directors and the Executive Committee.
The Board of Directors reports to the General Meeting of Shareholders on the remuneration system and the actual remuneration for the past fiscal year in the Remuneration Report. The Remuneration Report is subject to a consultative vote by the General Meeting of Shareholders.

Letter to Shareholders Overview Business Highlights Sustainability Our People Financial Reports Governance
Remuneration Report
Barry Callebaut | Annual Report /
Further, the Articles of Incorporation include the remune-ration principles applicable to the Board of Directors and to the Executive Committee. Those provisions can be found and downloaded as a PDF under: https://www.barry-callebaut.com/sites/default/files/2019-03/Barry-Callebaut-Statuten.pdf and include: • Principles of remuneration of the Board of Directors
(Articles 32 and 33); • Principles of remuneration of the Executive Committee
(Articles 32 and 34); • Additional amount for new members of the Executive
Committee (Article 31); • Credits and loans (Article 35).
The Board of Directors of Barry Callebaut has entrusted the Nomination & Compensation Committee (NCC) to provide
support in evaluating and reviewing the remuneration strategy and plans, in proposing the individual remuneration packages for the Board of Directors, the members of the Executive Committee and other key members of the Management and in preparing the remuneration proposals to the General Meeting of Shareholders. The Board of Directors has not delegated any decision-making power to the NCC, therefore remuneration decisions are taken by the full Board of Directors based on recommendations of the NCC.
In the reporting year, the NCC met five times according to the standard annual meeting schedule below. One member attended four meetings and was excused for one meeting. All other members attended all meetings.
NCC Standard agenda items Sept Nov Dec Apr July Compensation Confirmation of relevant benchmarking peer group x
Benchmarking analysis of ExCo compensation (every 2nd year) x Determination of individual LTI grants of ExCo and all other participants x Determination of performance and vesting level of LTI x Determination of individual ExCo target compensation x Determination of performance achievement under STI plan and related payouts
for CEO and ExCo members x
Determination of performance criteria for STI for ExCo x Benchmarking analysis of Board compensation (every 2nd year) x Determination of Board compensation for following term x
Nomination Review of talent management ExCo: calibration, succession planning, individual development plans
x
Update on personnel changes in key positions x x x x x Update on key human resources initiatives (diversity, engagement) x x x x x Review of structure & composition of the Board (profiles, skills sets) and review
of potential candidates to the Board x x
Governance Preparation and review of compensation report, review of shareholders’ feedback post-AGM and considerations for future disclosure
x x x
AGM preparation: preparation of say on pay votes x NCC self-evaluation x Annual governance and legislative update x Review of NCC charter and determination of NCC agenda items for term of office x
During the reporting year, the NCC conducted a review of the remuneration programs applicable to the Board of Directors and to the Executive Committee. On the basis of this analysis, the NCC decided to amend the compensation program; the changes are described in this report. Furthermore, the NCC performed its regular activities throughout the year, such as the determination of the remuneration of the Board of Directors and Executive Committee as well as the preparation of the Remuneration Report and of the say-on-pay motions for submission to the General Meeting of Shareholders.
The Chairman of the NCC reports to the Board of Directors after each meeting on the activities of the NCC. The minutes of the NCC meetings are available to all members of the Board of Directors. As a general rule, the
Chairman of the Board of Directors and the CEO attend the meetings in an advisory capacity. They do not attend the meeting when their own compensation and/or performance are being discussed.
The NCC may decide to consult an external advisor from time to time for specific compensation matters. In the reporting year, a company specialized in executive compensation in Swiss listed companies was engaged to provide independent advice on specific compensation and governance matters. This company has no other mandate with Barry Callebaut.
For further details on the NCC, please refer to the “Functioning of the Board” section in the Corporate Governance Report.
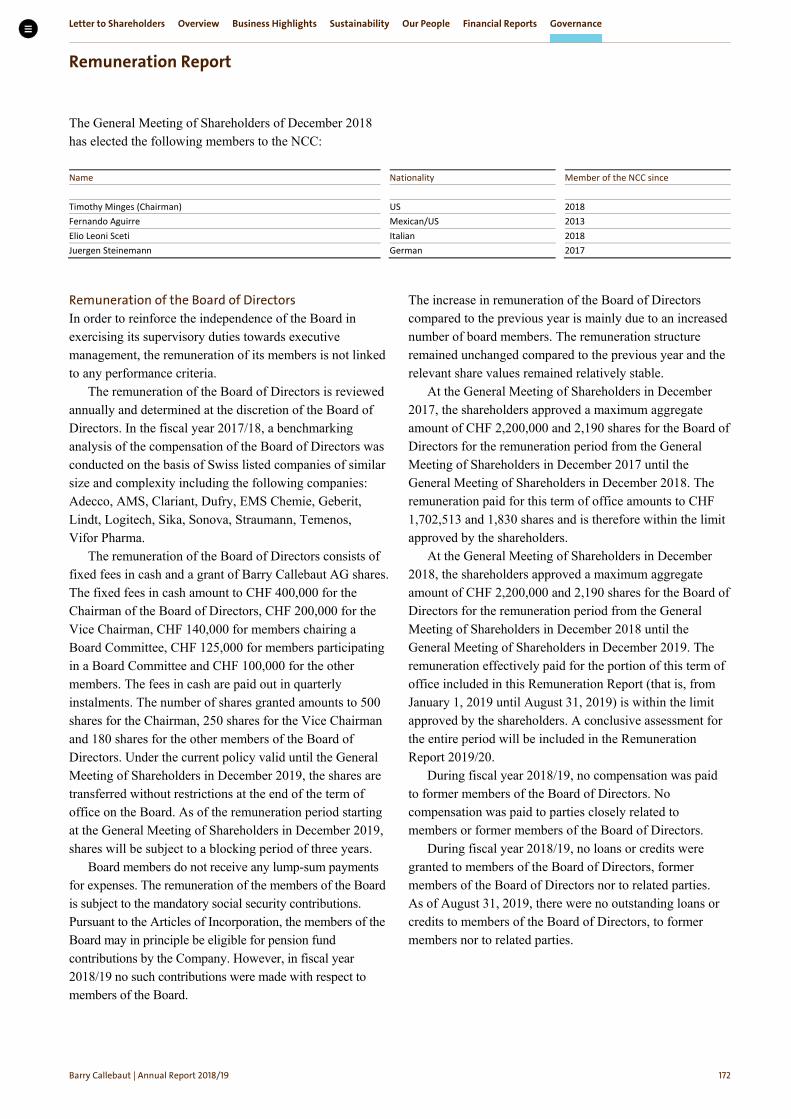
Letter to Shareholders Overview Business Highlights Sustainability Our People Financial Reports Governance
Remuneration Report
Barry Callebaut | Annual Report /
The General Meeting of Shareholders of December 2018 has elected the following members to the NCC:
Remuneration of the Board of Directors In order to reinforce the independence of the Board in exercising its supervisory duties towards executive management, the remuneration of its members is not linked to any performance criteria.
The remuneration of the Board of Directors is reviewed annually and determined at the discretion of the Board of Directors. In the fiscal year 2017/18, a benchmarking analysis of the compensation of the Board of Directors was conducted on the basis of Swiss listed companies of similar size and complexity including the following companies: Adecco, AMS, Clariant, Dufry, EMS Chemie, Geberit, Lindt, Logitech, Sika, Sonova, Straumann, Temenos, Vifor Pharma.
The remuneration of the Board of Directors consists of fixed fees in cash and a grant of Barry Callebaut AG shares. The fixed fees in cash amount to CHF 400,000 for the Chairman of the Board of Directors, CHF 200,000 for the Vice Chairman, CHF 140,000 for members chairing a Board Committee, CHF 125,000 for members participating in a Board Committee and CHF 100,000 for the other members. The fees in cash are paid out in quarterly instalments. The number of shares granted amounts to 500 shares for the Chairman, 250 shares for the Vice Chairman and 180 shares for the other members of the Board of Directors. Under the current policy valid until the General Meeting of Shareholders in December 2019, the shares are transferred without restrictions at the end of the term of office on the Board. As of the remuneration period starting at the General Meeting of Shareholders in December 2019, shares will be subject to a blocking period of three years.
Board members do not receive any lump-sum payments for expenses. The remuneration of the members of the Board is subject to the mandatory social security contributions. Pursuant to the Articles of Incorporation, the members of the Board may in principle be eligible for pension fund contributions by the Company. However, in fiscal year 2018/19 no such contributions were made with respect to members of the Board.
The increase in remuneration of the Board of Directors compared to the previous year is mainly due to an increased number of board members. The remuneration structure remained unchanged compared to the previous year and the relevant share values remained relatively stable.
At the General Meeting of Shareholders in December 2017, the shareholders approved a maximum aggregate amount of CHF 2,200,000 and 2,190 shares for the Board of Directors for the remuneration period from the General Meeting of Shareholders in December 2017 until the General Meeting of Shareholders in December 2018. The remuneration paid for this term of office amounts to CHF 1,702,513 and 1,830 shares and is therefore within the limit approved by the shareholders.
At the General Meeting of Shareholders in December 2018, the shareholders approved a maximum aggregate amount of CHF 2,200,000 and 2,190 shares for the Board of Directors for the remuneration period from the General Meeting of Shareholders in December 2018 until the General Meeting of Shareholders in December 2019. The remuneration effectively paid for the portion of this term of office included in this Remuneration Report (that is, from January 1, 2019 until August 31, 2019) is within the limit approved by the shareholders. A conclusive assessment for the entire period will be included in the Remuneration Report 2019/20.
During fiscal year 2018/19, no compensation was paid to former members of the Board of Directors. No compensation was paid to parties closely related to members or former members of the Board of Directors.
During fiscal year 2018/19, no loans or credits were granted to members of the Board of Directors, former members of the Board of Directors nor to related parties. As of August 31, 2019, there were no outstanding loans or credits to members of the Board of Directors, to former members nor to related parties.
Name
Nationality
Member of the NCC since
Timothy Minges (Chairman)
US
2018
Fernando Aguirre
Mexican/US
2013
Elio Leoni Sceti Italian 2018 Juergen Steinemann German 2017

Letter to Shareholders Overview Business Highlights Sustainability Our People Financial Reports Governance
Remuneration Report
Barry Callebaut | Annual Report /
Remuneration of the Board of Directors for fiscal year / (audited figures)
in CHF BoD Member Compensation fix Other
compensation1 Total cash-related
remuneration Number of
shares2 Value of shares3 Total
remuneration 2018/19
Patrick De Maeseneire
Chairman/Delegate 400,000 164,992 564,992 500 854,667 1,419,659
Jakob Baer Vice Chairman
Chairman of the AFRQCC4
200,000
77,754
277,754
250
427,333
705,087
Fernando Aguirre Member of the NCC5
125,000
–
125,000
180
307,680
432,680
Suja Chandrasekaran6 Member of the AFRQCC
83,333
43,684
127,017
120
193,680
320,697
James (Jim) Donald7 Chairman of the NCC
46,667
7,841
54,508
60
114,000
168,508
Nicolas Jacobs Member of the AFRQCC
125,000
72,855
197,855
180
307,680
505,535
Timothy Minges8 Chairman of the NCC
135,000
–
135,000
180
307,680
442,680
Markus Neuhaus6 Member of the AFRQCC
83,333
37,050
120,383
120
193,680
314,063
Elio Leoni Sceti Member of the NCC
125,000
125,000
180
307,680
432,680
Juergen Steinemann Member of the NCC
125,000 125,000 180 307,680
432,680
Angela Wei Dong6 Member of the Board
66,667
42,598
109,265
120
193,680
302,945
Total remuneration Board of Directors
1,515,000
446,774
1,961,774
2,070
3,515,440
5,477,214
1 Including social security contributions. 2 Number of shares granted in relation to the fiscal year under review;
vesting subject to meeting service conditions. Grants to Board are based on the service period between Annual General Meetings of Shareholders.
3 Value defined as closing share price at the beginning of the service period. 4 Audit, Finance, Risk, Quality & Compliance Committee.
5 Nomination & Compensation Committee. 6 Member of the Board since December 12, 2018. 7 Member of the Board until December 12, 2018. 8 Member of the AFRQCC until December 12, 2018; Chairman of the NCC
since December 12, 2018.
Remuneration of the Board of Directors for fiscal year / (audited figures)
in CHF BoD Member Compensation fix Other
compensation1 Total cash-related
remuneration Number of
shares2 Value of shares3 Total
remuneration 2017/18
Patrick De Maeseneire
Chairman/Delegate 400,000 149,114 549,114 500 860,125 1,409,239
Jakob Baer Vice Chairman
Chairman of the AFRQCC4
200,000
62,803
262,803
250
430,062
692,865
Fernando Aguirre Member of the NCC5
125,000
–
125,000
180
309,645
434,645
James (Jim) Donald Chairman of the NCC
140,000
–
140,000
180
309,645
449,645
Nicolas Jacobs Member of the AFRQCC
125,000
52,573
177,573
180
309,645
487,218
Wai Ling Liu6 Member of the NCC
41,667
11,093
52,760
60
70,860
123,620
Timothy Minges Member of the AFRQCC
125,000
–
125,000
180
309,645
434,645
Andreas Schmid6 Member of the AFRQCC
41,667
9,522
51,189
60
70,860
122,049
Juergen Steinemann Member of the NCC
125,000 – 125,000 180 309,645
434,645
Elio Leoni Sceti7 Member of the NCC
83,333
–
83,333
120
228,000
311,333
Total remuneration Board of Directors
1,406,667
285,105
1,691,772
1,890
3,208,132
4,899,904
1 Including social security contributions. 2 Number of shares granted in relation to the fiscal year under review;
vesting subject to meeting service conditions. Grants to Board are based on the service period between Annual General Meetings of Shareholders.
3 Value defined as closing share price at the beginning of the service period.
4 Audit, Finance, Risk, Quality & Compliance Committee. 5 Nomination & Compensation Committee. 6 Member of the Board until December 13, 2017. 7 Member of the Board since December 13, 2017.

Letter to Shareholders Overview Business Highlights Sustainability Our People Financial Reports Governance
Remuneration Report
Barry Callebaut | Annual Report /
Remuneration of the Executive Committee The individual remuneration of the members of the Executive Committee is reviewed annually and determined at the discretion of the Board of Directors, based on the proposal of the NCC, in accordance with the principles set out in the Executive Total Reward Policy, market information and data, scope and level of responsibility of the position, and profile of the incumbents in terms of qualification, experience and skills set.
The remuneration structure for the Executive Committee of Barry Callebaut consists of four main remuneration elements: a fixed annual base salary, an annual short-term cash bonus pursuant to the Company’s Short-Term Incentive Plan, share-based long-term incentives pursuant to the Company’s Long-Term Incentive Plan and other benefits.
In the reporting year, a benchmarking analysis of the remuneration of the Executive Committee was conducted with the support of an independent consultant, Willis Towers Watson. The analysis was based on a peer group of Swiss multinational companies of the industry sector listed on the SIX Swiss Exchange. The peer group consists of Adecco, Clariant, DKSH, Dufry, Emmi, Georg Fischer, Givaudan, Kühne+Nagel, Lindt, Logitech, Lonza, Schindler, SGS, Sika. For Executive Committee members who are employed under a foreign employment contract, the general industry compensation data of the country of employment were used. This analysis showed that while annual base salaries are positioned below market, incentive opportunities are above, in line with the pay-for-performance philosophy of Barry Callebaut and resulting in a competitive positioning overall. The NCC considered the
results of this analysis in making decisions related to the remuneration of the Executive Committee members for the coming fiscal year. Base salary The fixed annual gross base salary is defined at the discretion of the Board of Directors on the basis of various criteria, such as market value of the role, scope of the position, and profile of the incumbent in terms of skillset and professional experience. Short-Term Incentive Plan (STIP) The STIP is designed to reward the performance of the Company, its regions/functions and the individual contributions of the participants over a time horizon of one year.
Base salary
Annual gross base salary
• Determined at the discretion of the Board of Directors based on various criteria such as market value of the role, scope of the position and profile (experience, skills) of the incumbent
• Target weight in % of total remuneration: CEO 25%–40%, Executive Committee 25%–40%
Variable annual bonus
Barry Callebaut Short-Term Incentive Plan (STIP)
• Target 100% of annual base salary for members of the Executive Committee • Based on the achievement of financial and strategic targets • Maximum payout: 200% of target • Payout in cash annually after release of full-year results • Target weight in % of total remuneration: CEO 25%–40%, Executive Committee 25%–40%
Share awards Barry Callebaut Long-Term Incentive Plan (LTIP)
• Individual grant values approved by the Board of Directors; number of shares determined by dividing the grant value by the average share price over three months prior to the grant
• Vesting of award over a three-year vesting cycle: 25% in the first and second year each, 50% in the third year subject to performance criteria
• Performance criteria: vesting of the final tranche based on two performance critieria, 50% on the relative performance of the Barry Callebaut share price compared to a basket of benchmark companies and 50% on the ROIC performance of the Company over the three-year vesting period
• Target weight in % of total remuneration: CEO 20%–50%, Executive Committee 20%–50% • Exceptional grant of performance share units in fiscal year 2018/19, subject to a four-year
cliff vesting based on outperforming the Mid-Term Plan in terms of volume CAGR, EBIT, cumulative Free cash flow and ROIC
Other benefits
Risk benefits and perquisites
• Social security contributions by employer • Post-employment and retirement benefits • Health care and medical insurances • Executive perquisites such as company car, relocation costs, etc.
In CHF thousands Market capitalization Dec 31, 2018
Revenue Dec 31, 2018
Headcount
Dec 31, 2018 Barry Callebaut
8,290
6,948 11,500
1st quartile
5,441
4,671 14,116
Median 11,253 6,304 18,310 3rd quartile 17,232 9,737 33,493

Letter to Shareholders Overview Business Highlights Sustainability Our People Financial Reports Governance
Remuneration Report
Barry Callebaut | Annual Report /
The STIP target is expressed as percentage of the fixed annual base salary and amounts to 100% for all members of the Executive Committee.
For each participant, the STIP is based on a collective performance factor (CPF) and an individual performance factor (IPF) weighted 60% and 40%, respectively. For the members of the Executive Committee, the CPF (60% of STIP) is based on the performance of Barry Callebaut as a Group, measured as follows: • Group sales volume: 30% • Group EBIT: 30% • Group cash flow: 30% • Sustainability: 10% Those performance criteria have been chosen because they reflect the business strategy of profitable growth. The weighting of the criteria are balanced so that top line, bottom line and cash performance are equally weighted.
The IPF (40% of STIP) is based on the performance of the unit under responsibility, e.g. the respective region or function. The objectives are primarily financial in nature and support the strategy of profitable growth. They are grouped in three categories: • Growth objectives for the Region/function, including
financial objectives such as sales volume, or other quantifiable goals that support the growth of the Region/function;
• Profitability objectives for the Region/function, including financial objectives such as EBIT or cost savings, or other quantifiable goals that increase the profitability of the Region/function (operations, processes);
• Strategic initiatives that are key for the success of the Region/function and a leadership objective related to talent management and succession planning.
The weight between growth, profitability and strategic objectives in the IPF depends on the nature of the function.
For each financial objective, an expected level of performance (“target”) is defined, corresponding to a payout factor of 100%. A threshold level of performance, below which there is no payout, and a maximum level of performance, above which the payout is capped at 200% of the target have also been defined.
The CEO proposes the relevant performance criteria for the CPF and for the IPF of the Executive Committee members to the NCC. The Chairman of the Board of Directors proposes the performance objectives of the IPF for the CEO. The NCC reviews and submits the recommendations to the Board of Directors for approval.
The STIP is paid out in cash.
Long-Term Incentive Plan (LTIP) The purpose of the LTIP is to provide the participants with an ownership interest in Barry Callebaut and to reward them for the long-term performance of the company. The LTIP thus aligns their interests to those of the shareholders. The current LTIP has been place since fiscal year 2016/17 and has been amended for the fiscal year 2018/19.
The grant of share units under the LTIP is based on a target LTI amount determined individually for each plan participant. The individual LTI grant value is divided by the average share price of the last three months of the preceding fiscal year in order to calculate the number of share units awarded. The share units vest in three tranches over four fiscal years, i.e. 25% on the first, 25% on the second and 50% on the third anniversary of the grant date.
The first two tranches are restricted share units (RSU) that vest subject to the LTIP participant continuing to be employed by Barry Callebaut.
The third tranche consists of performance share units (PSU) that vest subject to meeting two performance criteria over the three-year vesting period.
The first performance criterion, accounting for 50% of the respective PSU grant, is the relative share price development of Barry Callebaut versus a peer group of companies in the chocolate, ingredients and FMCG sector: AAK, Aryzta, Hershey, Kellogg’s, Kerry, Lindt, Mondelēz, Nestlé, Olam, Petra Foods and Unilever. The objective (100% vesting) is to achieve median performance, e.g. to outperform half of the peer companies. There is no vesting for a performance below the first quartile of the peer group (threshold), and the vesting is capped at 300% for delivering the best performance in the peer group.
The second performance criterion, accounting for 50% of the relevant PSU grant, is Return on Invested Capital (ROIC). The ROIC performance was introduced in fiscal year 2016/17 in order to reward the sustainable management of the Company’s assets. The three-year ROIC target was set by the Board of Directors on the basis of the long-term strategic plan of the Company. The vesting also ranges from 0% to 300% of target. Consequently, the overall vesting of the LTI award (including RSU and PSU) ranges from 50% and 200% of the initially determined number of share units granted.
In addition, members of the Executive Committee (ExCo) were granted a fourth exceptional tranche, which vests subject to a four-year cliff vesting based on outperforming the Mid-Term Plan targets in terms of volume growth (CAGR; 25%), EBIT (25%), cumulative Free cash flow (25%) and ROIC (25%) for the period September 2018 to August 2022. The maximum payout opportunity for this tranche is 100% of target. This fourth

Letter to Shareholders Overview Business Highlights Sustainability Our People Financial Reports Governance
Remuneration Report
Barry Callebaut | Annual Report /
tranche was introduced in the reporting year in order to align even more closely the compensation of the ExCo with the long-term interests of the shareholders, as it extends the overall LTI plan period to four years and increases the portion of the LTI award that is subject to future perfor-mance conditions. Further, it focuses the efforts of the ExCo on outperforming the Mid-Term Plan. The targets have been set so that there is no vesting at all if the Mid-Term Plan is not achieved (Mid-Term Plan is the threshold).
The Board of Directors reserves the right to suspend or adjust the vesting of all share units in case of a negative result from continuous operations of the Barry Callebaut Group. Once the shares are vested and transferred, they are free of any sales restrictions.
For the CEO, the individual LTI grant value amounts to 106.3% of annual base salary (+ 53.1% for the exceptional fourth tranche granted in the reporting year), for the other members of the Executive Committee, it amounts to 110.7% (+ 46.8% for the exceptional fourth tranche granted in the reporting year) of the annual base salary on average in fiscal year 2018/19.
Any award granted under the LTIP is subject to clawback and malus provisions. In case of a material misstatement of financial results or a serious reputational damage to Barry Callebaut due to fraud of willful intent, or of a gross misconduct which would qualify as a cause for termination, the Board of Directors may forfeit or claim back vested or unvested share units, within a period of two years after the vesting of the award.
Other benefits Other benefits include risk benefits that provide for a reasonable level of income in case of retirement, death or disability. Those consist of social security contributions, post-employment benefits, pension contributions and insurance. The members of the Executive Committee with a
Swiss employment contract participate in the occupational pension plan offered to all employees in Switzerland.
Members of the Executive Committee under foreign employment contract are insured commensurately with market conditions and with their position. Each plan varies, but is in line with the local competitive and legal environment and is in accordance with the legal requirements of the respective country.
Members of the Executive Committee are also provided with certain executive perquisites such as relocation allowances, housing or other cost of living allowances, car allowances, and gross-ups for tax equalization of certain benefits. The benefits for each member of the Executive Committee are subject to their specific situation, the typical market practice and other factors after consideration of the total value of their individual remuneration package.
The monetary value of these benefits is disclosed in the remuneration tables at their fair value.
Employment contracts The members of the Executive Committee are employed under employment contracts of unlimited duration and subject to a notice period of maximum one year. They are not contractually entitled to severance payments or to change of control provisions. Special contractual agreements There is a special contractual agreement with one member of the Executive Committee providing for an annual supplementary fixed cash payment (retention award) starting in fiscal year 2018/19 and ending in fiscal year 2021/22. The accrued value of compensation amount is fully disclosed in the respective fiscal years under variable compensation.

Letter to Shareholders Overview Business Highlights Sustainability Our People Financial Reports Governance
Remuneration Report
Barry Callebaut | Annual Report /
Remuneration of the Executive Committee for fiscal year / (audited figures)
in CHF
Compen- sation
fixed
Compen- sation
variable2
Post-employ-
ment benefits3
Other compen-
sation
Total cash-related
remunera- tion
Number of shares4
Value of shares5
Total remunera-
tion 2018/19
Remuneration Executive Committee1 5,701,839 7,810,646 2,073,515 1,421,298 17,007,298 4,757 8,388,122 25,395,420 Highest individual remuneration within Executive Committee: Antoine de Saint-Affrique, CEO Barry Callebaut Group
1,600,000
2,282,880
496,860
24,000
4,403,740
1,458
2,558,440
6,962,180
1 Disclosure relates to the Executive Committee including all members during fiscal year 2018/19, i.e.: Antoine de Saint-Affrique, Peter Boone, Ben de Schryver, Isabelle Esser, Massimo Garavaglia, Carole Le Meur, Pablo Perversi, Dirk Poelman, Steven Retzlaff, Remco Steenbergen.
2 Based on best estimate of expected payout for fiscal year 2018/19 (accrual principle).
3 Including social security and pension contributions. 4 Number of shares granted in relation to the fiscal year 2018/19; vesting
subject to meeting service and/or performance conditions.
5 Value of shares is defined as fair value at grant date. For restricted share units and for ROIC and mid term plan dependent performance shares, this is the share price at grant date. For share price dependent performance share units the fair value is established based on a valuation performed by external experts applying the “Monte Carlo simulation” method. In all cases, the net present value of expected dividends that will not be received by the plan participant during the vesting period is excluded.
Remuneration of the Executive Committee for fiscal year / (audited figures)
in CHF
Compen- sation
fixed
Compen- sation
variable2
Post-employ-
ment benefits3
Other compen-
sation
Total cash-related
remunera- tion
Number of shares4
Value of shares5
Total remunera-
tion 2017/18
Remuneration Executive Committee1 5,762,851 9,364,236 1,708,241 868,190 17,703,518 4,812 6,555,745 24,259,263 Highest individual remuneration within Executive Committee: Antoine de Saint-Affrique, CEO Barry Callebaut Group
1,600,000
2,439,680
399,408
9,000
4,448,088
1,245
1,633,363
6,081,451
1 Disclosure relates to the Executive Committee including all members during fiscal year 2017/18: Antoine de Saint-Affrique, Victor Balli, Peter Boone, Massimo Garavaglia, Ben De Schryver, Carole Le Meur, Pablo Perversi, Dirk Poelman, Steven Retzlaff, Remco Steenbergen.
2 Based on best estimate of expected payout for fiscal year 2017/18 (accrual principle).
3 Including social security and pension contributions.
4 Number of shares granted in relation to the fiscal year 2017/18; vesting subject to meeting service and/or performance conditions.
5 Value of shares is defined as fair value at grant date. For restricted share units, this is the share price at grant date. For performance share units, the fair value is established based on a valuation performed by external experts applying the “Monte Carlo simulation” method. In both cases, the net present value of expected dividends that will not be received by the plan participant during the vesting period is excluded.

Letter to Shareholders Overview Business Highlights Sustainability Our People Financial Reports Governance
Remuneration Report
Barry Callebaut | Annual Report /
Comments on the remuneration tables The deviations in remuneration compared to the previous fiscal year is mainly due to the following factors: • The individual fixed remuneration and target STI
remained unchanged versus previous year except for one member who recived a moderate salary increase.
• The LTI grant values increased compared to previous year, mainly due to the exceptional fourth tranche of PSU which is subject to a four-year cliff vesting based on the outperformance of the targets of the Mid-Term Plan.
• The overall payout under the STIP was lower than in the previous year due to the stretched target setting. The performance in the reporting year was strong at Group and regional level. With a volume increase to 2,139,758 tonnes (+5.1%), an operating profit (EBIT) of CHF 601.2 million (+11.9% in local currencies), a Free cash flow of CHF 289.7 million and overall 51% of raw materials sourced sustainably, the Group targets have been clearly exceeded overall. All regions contributed strongly to the results of the Group. The STI payouts amount to 142.7% of the target for the CEO and range between 123.6% and 155.6% of the target for the other current members of the Executive Committee.
• Consequently, the ratio of fixed versus variable remuneration amounts to 23.0% versus 77.0% for the CEO, and 21.2% versus 78.8% in average for the other current members of the Executive Committee.
The PSU granted under the LTIP in 2016 vested at the end of the reporting year. Under the plan rules of the 2016 LTIP, the vesting of the first tranche of PSU was conditional upon the share price evolution of Barry
Callebaut compared to the average share price evolution of peer companies. The share price of Barry Callebaut increased by 59.5% during the plan period compared to an average of the peer group of 12.4%, which ranks Barry Callebaut as second among twelve companies and translates into a vesting level of 260%. The vesting of the second tranche of PSU related to the ROIC target translated into a vesting level of 160%. The aggregate vesting of the PSUs related to the grants in FY 2016/17 thus amounts to 210%.
The aggregate amount of remuneration for the Executive Committee is subject to the approval of the General Meeting of Shareholders. A maximum aggregate amount of fixed remuneration of CHF 6,500,000 was approved by the General Meeting of Shareholders in December 2017 prospectively for fiscal year 2018/19. Accordingly, the fixed remuneration of CHF 5,701,839 effectively paid is within the approved limits. The aggregate remuneration amount for the variable compensation for fiscal year 2018/19 will be submitted to shareholders’ vote at the upcoming General Meeting of Shareholders in December 2019.
During fiscal year 2018/19, CHF 840,793 was paid to a former member of the Executive Committee, of which CHF 110,000 in fixed compensation and CHF 730,793 in variable compensation. No compensation was paid to parties closely related to members or former members of the Executive Committee.
During fiscal year 2018/19, no loans or credits were granted to members of the Executive Committee, former members of the Executive Committee nor to related parties. As of August 31, 2019, there were no outstanding loans or credits to members of the Executive Committee, to former members nor to related parties.

Letter to Shareholders Overview Business Highlights Sustainability Our People Financial Reports Governance
Remuneration Report
Barry Callebaut | Annual Report /
Shareholdings of the Board of Directors and the Executive Committee
Shareholdings of the Board of Directors
Number of shares as of August 31, 2019 2018 Name Function Patrick De Maeseneire Chairman 1,250 750 Jakob Baer Vice Chairman 1,580 1,330 Fernando Aguirre Member of the NCC 640 460 Suja Chandrasekaran Member of the AFRQCC – n/a James (Jim) Donald Chairman of the NCC (until December 12, 2018) n/a 1,620 Nicolas Jacobs1 Member of the AFRQCC 33,246 93,066 Elio Leoni Sceti Member of the NCC 180 – Timothy Minges Chairman of the NCC (as of December 12, 2018) 1,035 855 Markus R. Neuhaus Member of the AFRQCC – n/a Juergen Steinemann Member of the NCC 13,505 15,578 Angela Wei Dong – n/a Total shares held by Board of Directors 51,436 113,659
1 Excluding the 50.1% participation held by Jacobs Holding AG (see Note 3.4 to the Financial Statements of Barry Callebaut AG).
Shareholdings of the Executive Committee
Number of shares as of August 31, 2019 2018 Name Function Antoine de Saint-Affrique Chief Executive Officer 3,385 1,298 Peter Boone CEO & President Americas 300 82 Ben De Schryver President APAC 33 n/a Isabelle Esser Chief Human Resources Officer
(as of March 2019) – n/a
Massimo Garavaglia President EMEA 2,500 1,778 Carole Le Meur Chief Human Resources Officer
(until September 2018) n/a 143
Pablo Perversi Chief Innovation, Sustainability & Quality Officer; Head of Gourmet
311 82
Dirk Poelman Chief Operations Officer (until August 31, 2019) 2,028 1,282 Steven Retzlaff President Global Cocoa 2,000 1,873 Remco Steenbergen Chief Financial Officer
(as of March 2018) 281 219
Total shares held by Executive Committee 10,838 6,757
Consideration paid for services of the majority shareholder In line with the practice of the past years, Barry Callebaut AG and Jacobs Holding AG, Zurich, have entered into an auxiliary services agreement under which Jacobs Holding AG offers certain management and consultancy services to Barry Callebaut AG. In fiscal year 2018/19, the total remuneration expense by Barry Callebaut AG under this agreement amounted to CHF 0.8 million (excl. VAT). The contract is renewable annually.
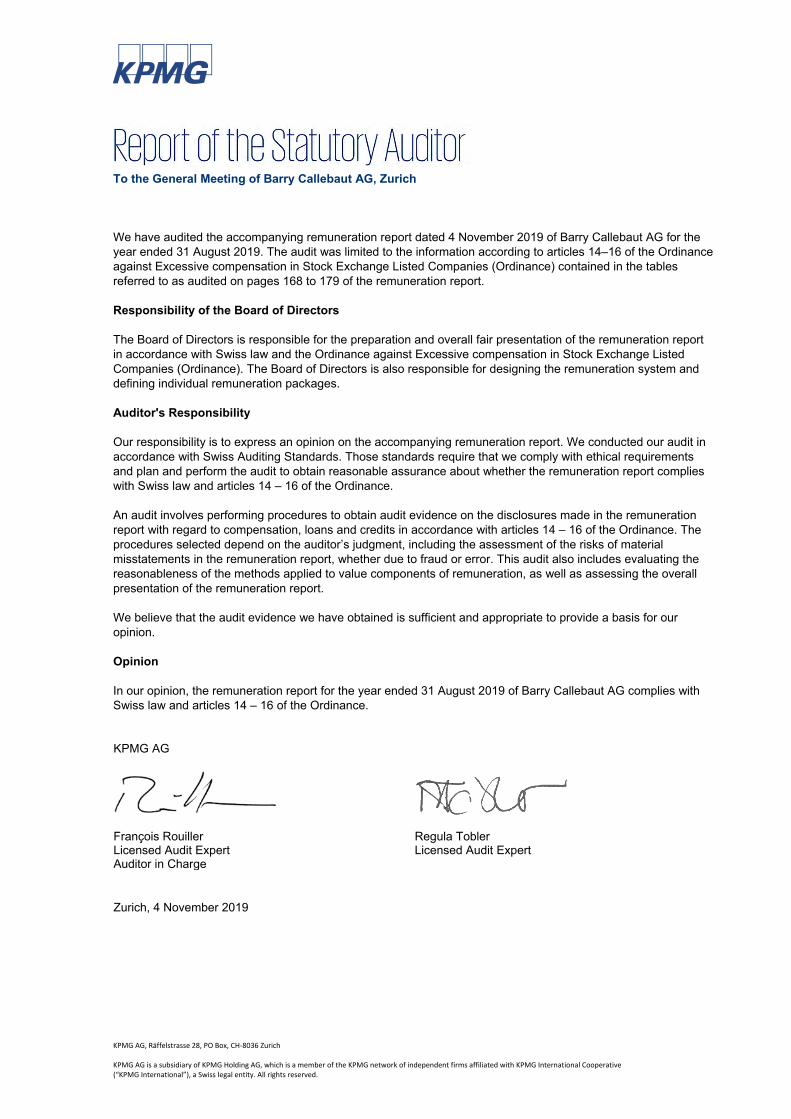
To the General Meeting of Barry Callebaut AG, Zurich
We have audited the accompanying remuneration report dated 4 November 2019 of Barry Callebaut AG for the year ended 31 August 2019. The audit was limited to the information according to articles 14–16 of the Ordinance against Excessive compensation in Stock Exchange Listed Companies (Ordinance) contained in the tables referred to as audited on pages 168 to 179 of the remuneration report.
Responsibility of the Board of Directors
The Board of Directors is responsible for the preparation and overall fair presentation of the remuneration report in accordance with Swiss law and the Ordinance against Excessive compensation in Stock Exchange Listed Companies (Ordinance). The Board of Directors is also responsible for designing the remuneration system and defining individual remuneration packages.
Auditor's Responsibility
Our responsibility is to express an opinion on the accompanying remuneration report. We conducted our audit in accordance with Swiss Auditing Standards. Those standards require that we comply with ethical requirements and plan and perform the audit to obtain reasonable assurance about whether the remuneration report complies with Swiss law and articles 14 – 16 of the Ordinance.
An audit involves performing procedures to obtain audit evidence on the disclosures made in the remuneration report with regard to compensation, loans and credits in accordance with articles 14 – 16 of the Ordinance. The procedures selected depend on the auditor’s judgment, including the assessment of the risks of material misstatements in the remuneration report, whether due to fraud or error. This audit also includes evaluating the reasonableness of the methods applied to value components of remuneration, as well as assessing the overall presentation of the remuneration report.
We believe that the audit evidence we have obtained is sufficient and appropriate to provide a basis for our opinion.
Opinion
In our opinion, the remuneration report for the year ended 31 August 2019 of Barry Callebaut AG complies with Swiss law and articles 14 – 16 of the Ordinance.
KPMG AG
François Rouiller Regula Tobler Licensed Audit Expert Auditor in Charge
Licensed Audit Expert
Zurich, 4 November 2019
KPMG AG, Räffelstrasse 28, PO Box, CH-8036 Zurich KPMG AG is a subsidiary of KPMG Holding AG, which is a member of the KPMG network of independent firms affiliated with KPMG International Cooperative (“KPMG International”), a Swiss legal entity. All rights reserved.
Definition of financial performance measures
Barry Callebaut | Annual Report /
Basic earnings per share Net profit for the year attributable to shareholders of Barry Callebaut AG divided by the number of shares issued.
Capital expenditure Capital expenditure for property, plant and equipment and intangibles assets.
Cash earnings per share Free cash flow divided by number of shares issued.
Compound annual growth rate (CAGR) Compound annual growth rate for the 5–year period.
Debt to equity ratio Net debt divided by shareholders’ equity.
Earnings before interest, taxes, depreciation and amortization (EBITDA) Operating profit (EBIT) increased by depreciation and amortization recognized for property, plant and equipment and intangible assets.
EBIT per tonne Operating profit (EBIT) divided by the sales volume in tonnes.
EBIT per share Operating profit (EBIT) divided by number of shares issued.
Economic Value Added (EVA) Operating profit (EBIT) multiplied by one minus a normalized tax rate less average capital employed multiplied by the weighted average cost of capital (WACC).
Free cash flow Net cash flow from operating activities less net cash flow from investing activities, excluding acquisitions of subsidiaries/businesses net of cash acquired.
Interest coverage ratio EBITDA divided by net finance expense.
Net debt Bank overdrafts, short-term debt, long-term debt less cash and cash equivalents less short-term deposits.
Net profit for the year Net profit for year attributable to shareholders of Barry Callebaut AG and non-controlling interests.
Net working capital Current assets less current liabilities and provisions related to commercial activities.
Operating profit (EBIT) Profit before finance income, finance expense and income tax expense.
Payout ratio Net profit for the year divided by proposed dividend multiplied by number of shares issued.
Price-earnings ratio at year-end Share price at fiscal year-end divided by basic earnings per share.
Recurring Amounts adjusted for items considered to be exceptional for the respective period.
Return on equity (ROE) Net profit for the year divided by shareholders’ equity.
Return on invested capital (ROIC) Operating profit (EBIT) multiplied by one minus a normalized tax rate divided by the average capital employed.
Shareholders’ equity Total equity attributable to the shareholders of Barry Callebaut AG.
Solvency ratio Shareholders’ equity divided by total assets.

Contact & Financial calendar
Contact
Barry Callebaut head office Barry Callebaut AG West-Park, Pfingstweidstrasse 60 8005 Zurich, Switzerland Phone +41 43 204 04 04 www.barry-callebaut.com
Investor Relations Claudia Pedretti Head of Investor Relations Phone +41 43 204 04 23 [email protected]
Media Relations Frank Keidel Head of Media Relations Phone +41 43 268 86 06 [email protected]
Address changes ShareCommServices AG Europastrasse 29 8152 Glattbrugg, Switzerland Phone +41 44 809 58 52 Fax +41 44 809 58 59
Financial calendar
December 11, 2019 Annual General Meeting of Shareholders 2018/19, Zurich January 22, 2020 3-month Key Sales Figures 2019/20 April 16, 2020 Half-Year Results 2019/20 July 9, 2020 9-month Key Sales Figures 2019/20 November 11, 2020 Full-Year Results 2019/20 December 9, 2020 Annual General Meeting of Shareholders 2019/20, Zurich Forward-looking statement Certain statements in this Annual Report regarding the business of the Barry Callebaut Group are of a forward-looking nature and are therefore based on management’s current assumptions about future developments. Such forward-looking statements are intended to be identified by words such as “believe,” “estimate,” “intend,” “may,” “will,” “expect,” “project” and similar expressions as they relate to the company. Forward-looking statements involve certain risks and uncertainties because they relate to future events. Actual results may vary materially from those targeted, expected or projected due to several factors. The factors that may affect the Barry Callebaut Group’s future financial results are discussed in the Annual Report 2018/19. Such factors are, among others, general economic conditions, foreign exchange fluctuations, competitive product and pricing pressures, as well as changes in tax regimes and regulatory developments. The reader is cautioned to not unduly rely on these forward-looking statements. The Barry Callebaut Group does not undertake to publish any update or revision of any forward-looking statements.
Impressum Publisher Barry Callebaut AG West-Park Pfingstweidstrasse Zurich Switzerland
Concept Source Associates, Zurich, Switzerland
Photography Jos Schmid Zurich, Switzerland
Prepress Linkgroup AG, Zurich, Switzerland