Embed Size (px)
Citation preview

1
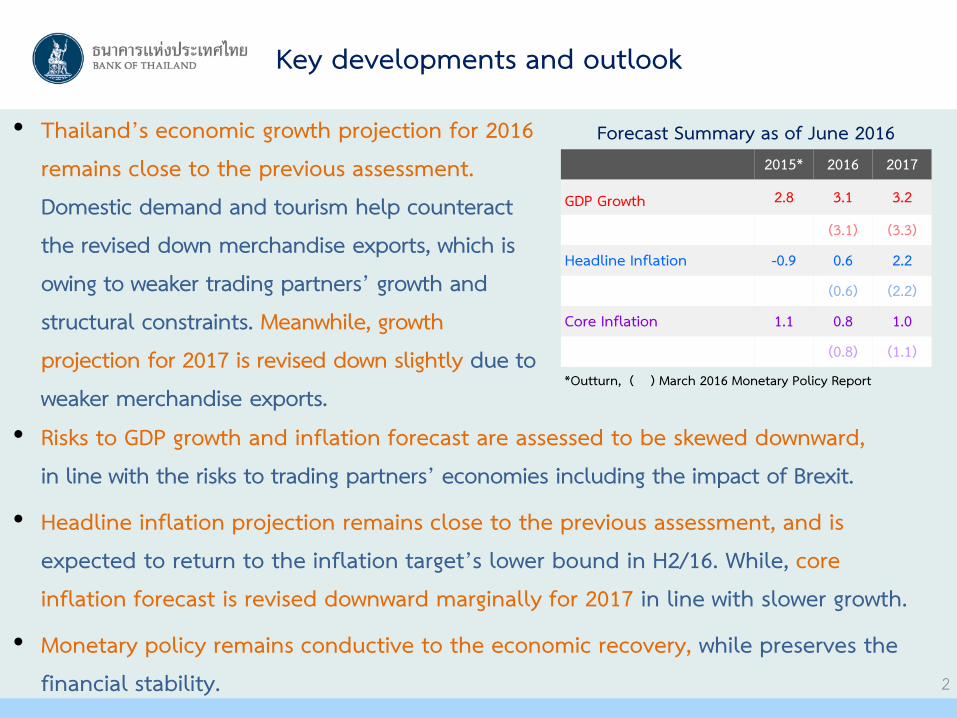
• Risks to GDP growth and inflation forecast are assessed to be skewed downward, in line with the risks to trading partners’ economies including the impact of Brexit.
• Headline inflation projection remains close to the previous assessment, and is expected to return to the inflation target’s lower bound in H2/16. While, core inflation forecast is revised downward marginally for 2017 in line with slower growth.
• Monetary policy remains conductive to the economic recovery, while preserves the financial stability.
Key developments and outlook
• Thailand’s economic growth projection for 2016 remains close to the previous assessment.Domestic demand and tourism help counteract the revised down merchandise exports, which is owing to weaker trading partners’ growth and structural constraints. Meanwhile, growth projection for 2017 is revised down slightly due to weaker merchandise exports.
2
*Outturn, ( ) March 2016 Monetary Policy Report
2015* 2016 2017
GDP Growth 2.8 3.1 3.2
(3.1) (3.3)
Headline Inflation -0.9 0.6 2.2
(0.6) (2.2)
Core Inflation 1.1 0.8 1.0
(0.8) (1.1)
Forecast Summary as of June 2016

Global economy is to recover at a slower pace than expected, especially Asian economies.
Monetary policy continues to be accommodative in many countries.
3
Asian economies are likely to grow slower due to more pronounced impact from regional trade structural shifting.
US economic growth tends to decelerate following lower-than-expected consumption in Q1/16.
Monetary policy is accommodative longer than expected.
Japan economy in 2017 is likely to expand higher than expected as the sale tax hike is postponed to 2019 (from initially scheduled for 2017).
BOJ continues to conduct accommodative monetary policy
through negative interestrate and QQE.
China economycontinues to slow down as expected.
More downside risks come from financial sector risks.
Euro area is to recover gradually after the terror attacks.
Brexit would be one of the significant risks going forward.

Oil and commodity prices are revised upward.
%YoY
-30
-20
-10
0
10
20
30
Q12014
Q12015
Q12016
Q12017
Q12018
Mar 16 Jun 1620
40
60
80
100
120
Q12014
Q12015
Q12016
Q12017
Q12018
Mar-16 Jun-16
Note: * Outturn
Assumption on Dubai oil price
Dubai price(USD/barrel)
2015* 2016 2017
Mar 16 50.8 37.3 47.0
Jun 16 50.8 43.1 53.0
USD/barrel
Assumption on non-fuel commodity prices/1
%YoY 2015* 2016 2017
Mar 16 -17.5 -6.9 2.7
Jun 16 -17.5 -5.5 2.6
Note: * Outturn/1 compose of food & beverage, agricultural material, and metal
4
Oil price trajectory is revised up due mainly to lower-than-expected OPEC’s supply, which is attributable to prolonged production constraints in many countries. Meanwhile, Non-OPEC’s production remains at low level on account of US producers having withdrawn from exploration of Shale oil.
Other commodity prices are also expected to be higher following the oil price, especially metal price.

5
Asia’s merchandise exports by country (USD term)
%YoY 2015* 2016 2017
As of Mar 16-5.6
-2.0 0.1
As of Jun 16 -2.5 0.0
Projection of merchandise exports value (USD)
• Thai exports face both internal and external structural constraints.- Global trade volume declines continuously due to lower
import dependence in many countries.
- Thailand’s competitiveness in some sectors would take time to improve.
• Slower-than-expected growth of trading partners’ economies
• Export prices are higher following the commodity prices, though the price cannot compensate a declined export quantity.
*Outturn
Index, 3mma sa (Jan 2013=100)
Source : CEICNote : Singapore and Indonesia export value excluded oil
70
80
90
100
110
120
130
Jan2013
Jul Jan2014
Aug Jan2015
Sep Jan2016
CNTH_Exgold
PH
SGMY
ID
TW
May 16
KR
Thai merchandise exports are projected to recover at a slower pace than previously forecasted due to softer trading partners’ economies
and more pronounced shifting global trade structure.

50
100
150
200
250
300
Jan2013
Jul Jan2014
Aug Jan2015
Sep Jan2016
China (27%)Asia excl. China and Malaysia(29%)Europe excl. Russia (16%)Malaysia (12%)Russia (3%)
Tourism has risen more than expected and tends to continue to expand.
Projection of foreign tourist arrivals
6
*Outturn
Million 2015* 2016 2017
As of Mar 1629.8
32.4 34.4
As of Jun 16 34.0 36.7
Number of tourists by origin
The number of Chinese tourists has grown markedly. While, the tourists from other countries showed sign of recovery, especially European and Russia.
Route expansion of low cost airlines is the essential support for Thai tourism.
May 16
Index, 3mma sa (Jan 2013=100)
Note: ( ) Share of tourists in 2015Source: Department of Tourism

29.420.6
30.0 27.7
73.3
49.4
78.8
0
20
40
60
80
100 Remaining Purchase OrderCumulative DisbursementCumulative Purchase Order
Public sector continues to support the economy through investment spending and additional stimulus measures.
7
- Government’s purchase order and disbursement are well on track.
- SOE’s investment remains close to previously forecasted, despite a slight delay of double track railway (Prachuap Khiri Khan-Chumphon) project.
note: *low cost housing scheme (Pracha Rat project) and personal income tax reform
Billion Baht
20152016 2017
Mar 16 Jun 16 ∆ Mar 16 Jun 16 ∆
Consumption 2,334 2,476 2,482 6 2,633 2,637 5
Investment 864 958 955 -3 1,034 1,035 1
Total 3,199 3,434 3,437 3 3,667 3,673 6
Central Government’s obligated contract and disbursement
Projection of public spending, at current prices (calendar year)
Public investment remains close to the previous assessment.
Additional stimulus measures* provide support to domestic expenditure
Note: Excluding transfers to local government and revolving fund Source: Comptroller General’s Department
%
Cumulative Purchase Order in May
FY 2015FY 2014FY 2013 FY 2016FY 2012

70
80
90
100
110
Jan2013
Jul Jan2014
Aug Jan2015
Sep Jan2016
Construction material salesImported capital goods quantity index
Private investment indicators in construction and machinery and equipment
Private spending is likely to grow better than expected.
8
Private consumption is expected to grow at a rate close to the previous forecast thanks to: (1) increased income from the service sector that helps compensate for lower income from the manufacturing sector, (2) improved confidence of households in the agricultural sector, thanks to higher farm prices and reduced concerns regarding the drought due to increased rainfall.
Private investment is expected to grow better than previously anticipated, especially construction related to government projects that grew significantly in Q1/16. Meanwhile, investment in machinery and equipment is projected to remain low due to weak merchandise exports
70
80
90
100
110
120
Jan2013
Jul Jan2014
Aug Jan2015
Sep Jan2016
Real farm income
Real non farm income
Real households’ income
Index, 3mma sa (Jan 2013=100)
May 1686.5
May 16105.9
Source: Office of Agricultural Economics, and calculated by BOT Source : MOC and OIE
May 1681.5
May 16100.3
Index, 3mma sa (Jan 2013=100)

%YoY 2015*2016 2017
Mar 16 Jun 16 Mar 16 Jun 16
Economic Growth 2.8 3.1 3.1 3.3 3.2
- Private Consumption 2.1 1.8 1.8 2.4 2.1
- Private Investment -2.0 2.4 3.1 4.0 2.3
- Government Consumption 2.2 3.3 3.5 2.8 2.8
- Public Investment 29.8 10.7 10.1 4.5 5.2
- Exports of Goods and Services 0.2 1.0 2.2 1.7 0.9
- Imports of Goods and Services -0.4 0.6 -1.9 1.5 2.4
Economic growth projection for 2016 remains close to the previous assessment; however, growth projection for 2017 is revised down slightly due to weaker merchandise exports.
9
Note : *Outturn

Note: The fan chart covers 90% of the probability distribution
GDP growth forecast
10
Risks to growth remain skewed downward.
Annual percentage change
• Downside risks (before Brexit referendum)– A slower growth of trading partners’ economies
due to remaining risks in Chinese financial sector – The impact of Brexit– Fragile confidence of the private sector, which
could affect private spending more than assessed
– Domestic political uncertainty, which could weigh on public spending and tourist arrivals
• Upside risks– Higher-than-expected public spending and
greater-than-expected effects of stimulus measures
– A better-than-expected number of foreign tourists
-4
0
4
8
12
-4
0
4
8
12
Q1 2014 Q1 2015 Q1 2016 Q1 2017 Q1 2018Q12014
Q12015
Q12016
Q12017
Q12018
-3
-2
-1
0
1
2
3
Jan2015
Jul Jan2016
Raw food (15.5%) Electricity fees (3.4%)
Enery price, excl. Electricity (8.0%) Core Infaltion (73.1%)
Headline Infaltion
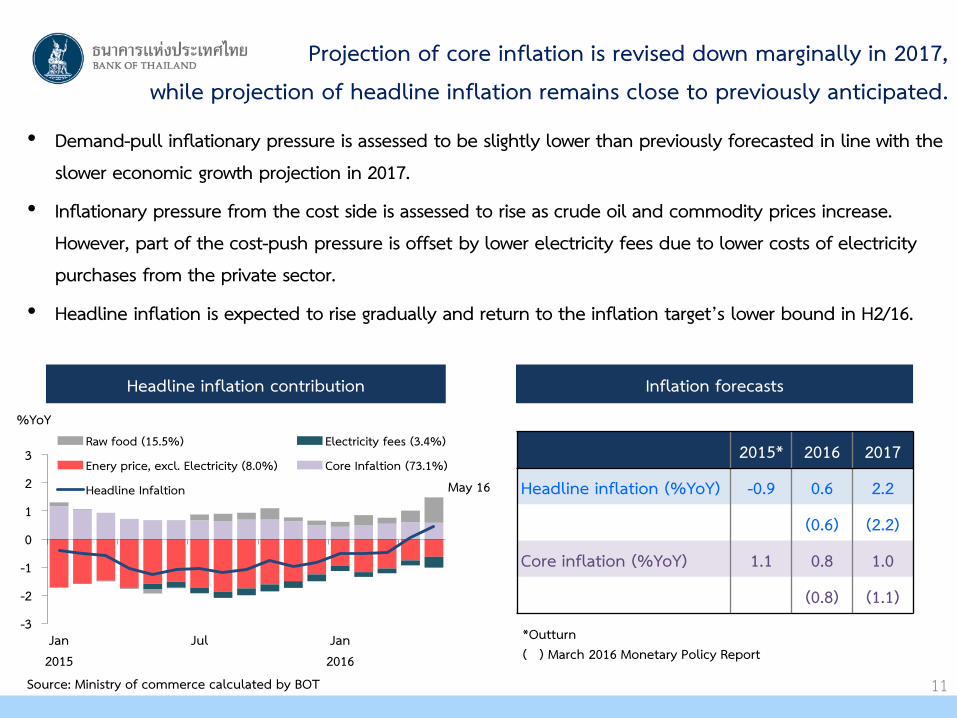
• Demand-pull inflationary pressure is assessed to be slightly lower than previously forecasted in line with the slower economic growth projection in 2017.
• Inflationary pressure from the cost side is assessed to rise as crude oil and commodity prices increase. However, part of the cost-push pressure is offset by lower electricity fees due to lower costs of electricity purchases from the private sector.
• Headline inflation is expected to rise gradually and return to the inflation target’s lower bound in H2/16.
Projection of core inflation is revised down marginally in 2017, while projection of headline inflation remains close to previously anticipated.
11
2015* 2016 2017
Headline inflation (%YoY) -0.9 0.6 2.2
(0.6) (2.2)
Core inflation (%YoY) 1.1 0.8 1.0
(0.8) (1.1)
Inflation forecastsHeadline inflation contribution
Source: Ministry of commerce calculated by BOT
%YoY
May 16
*Outturn( ) March 2016 Monetary Policy Report
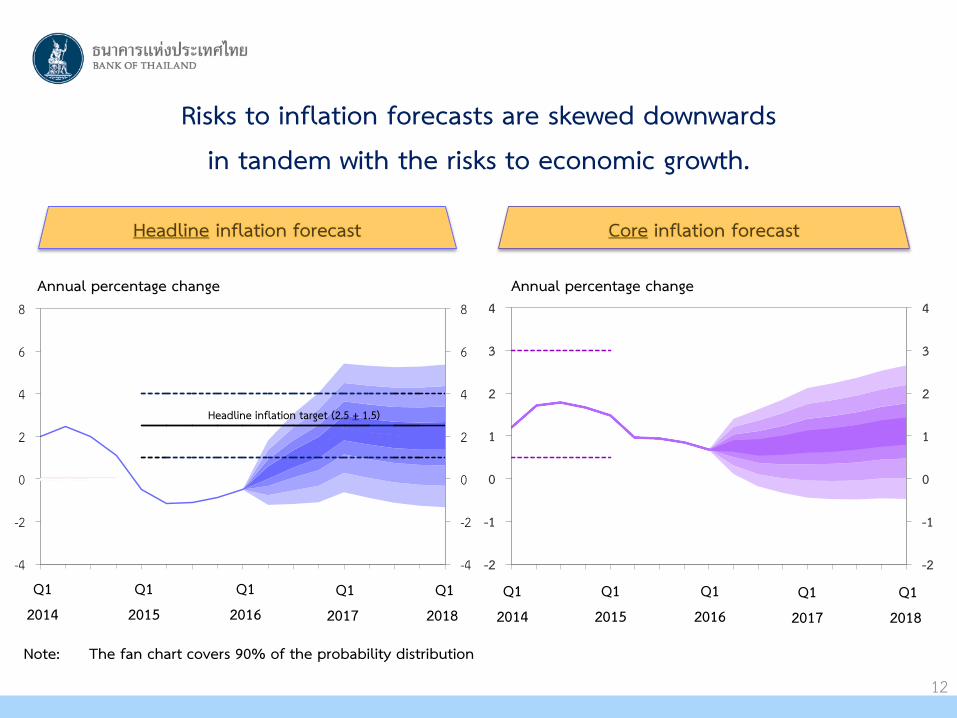
Note: The fan chart covers 90% of the probability distribution
Headline inflation forecast
Annual percentage change
Core inflation forecast
12
Annual percentage change
Risks to inflation forecasts are skewed downwards in tandem with the risks to economic growth.
-2
-1
0
1
2
3
4
-2
-1
0
1
2
3
4
Q1 2014 Q1 2015 Q1 2016 Q1 2017 Q1 2018Q12014
Q12015
Q12016
Q12017
Q12018
Q12014
Q12015
Q12016
Q12017
Q12018
-4
-2
0
2
4
6
8
-4
-2
0
2
4
6
8
Headline inflation target (2.5 + 1.5)

Monetary policy remains conducive to the economic recovery.
13
On May 11 and June 22, 2016, the MPC voted unanimously to maintain the policy rate at 1.50 percent
The committee viewed that monetary policy should remain accommodative. The MPC stands ready to utilize an appropriate mix of available policy tools to provide support to the economic recovery,
while ensuring financial stability.
(1) Economic and inflation projections do not change significantly from the previous assessment.
(2) Monetary conditions, both interest rate and exchange rate, were judged to be accommodative and conducive to economic recovery. While, headline inflation is expected to return to the inflation target’s lower bound in H2/16.
The MPC saw merit in preserving the policy space given risk factors going forwardand also monitored risks to financial stability from search-for-yield behavior.

Key issues monitored by the MPC (before Brexit referendum)
14
(1) Risks to global economic recovery, particularly from China given its domestic financial sector risks and Brexit referendum that could increase the global financial market volatility.
(2) Monetary policy divergence among advanced economies that could impact capital flows.
(3) Shifting global trade structure that could affect export performance of Thailand and Asia.
(4) The risk to financial stability from search-for-yield behavior under a prolonged period of low interest rates.
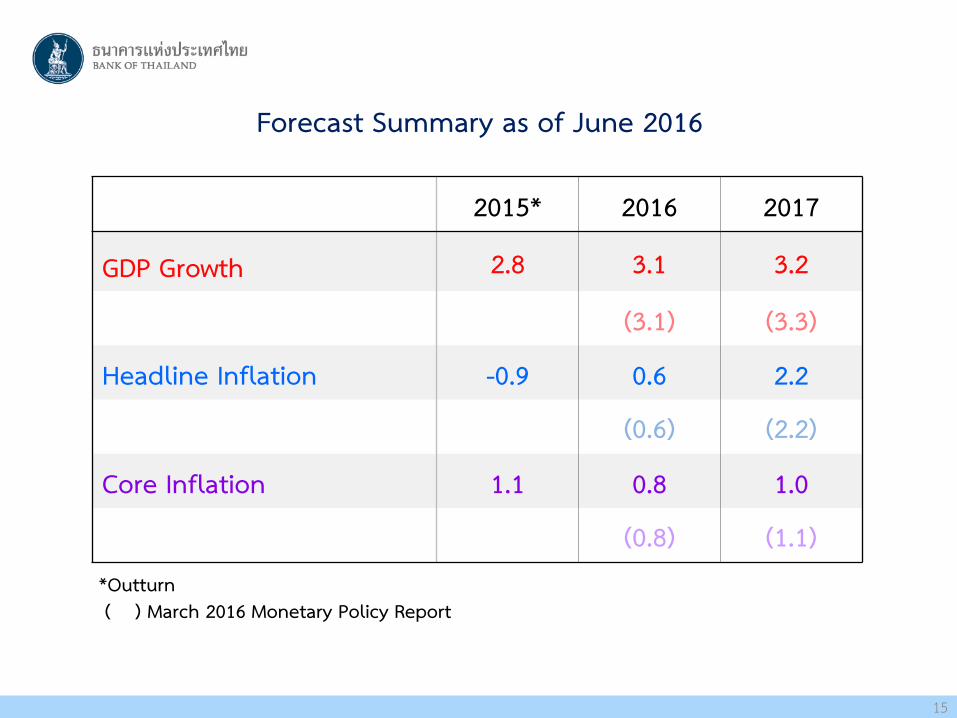
2015* 2016 2017
GDP Growth 2.8 3.1 3.2
(3.1) (3.3)
Headline Inflation -0.9 0.6 2.2
(0.6) (2.2)
Core Inflation 1.1 0.8 1.0
(0.8) (1.1)
Forecast Summary as of June 2016
*Outturn( ) March 2016 Monetary Policy Report
15

16
Website
https://www.bot.or.th/English/MonetaryPolicy/MonetPolicyComittee/MPR/Pages/default.aspx

(%YoY) 2015* 2016E 2017E
GDP Growth 2.8 3.1 3.2
- Private Consumption 2.1 1.8 2.1
- Private Investment -2.0 3.1 2.3
- Government Consumption 2.2 3.5 2.8
- Public Investment 29.8 10.1 5.2
- Exports of Goods and Services 0.2 2.2 0.9
- Imports of Goods and Services -0.4 -1.9 2.4
Current Account Balance (Billion USD) 32.0 37.8 32.3
- Value of Merchandise Exports -5.6 -2.5 0.0
- Value of Merchandise Imports -11.3 -6.0 5.3
Forecasts in Monetary Policy Report as of June 2016
Attachment
Note: E = projection* Outturn
17

2015*2016 2017
Mar 16 Jun 16 Mar 16 Jun 16
Dubai oil price (USD per barrel) 50.8 37.3 43.1 47.0 53.0
Non-fuel commodity prices (%yoy) -17.5 -6.9 -5.5 2.7 2.6
Fresh food prices (%yoy) -4.4 3.0 3.0 4.0 3.7
Public expenditure (calendar year)
Government Consumption (billion baht)1/ 2,334 2,476 2,482 2,633 2,637
Public investment (billion baht)1/ 864 958 955 1,034 1,035
Fed funds rate (% year end) 0.38 0.88 0.63 1.63 1.38
Trading partners’ GDP growth (%yoy) 3.2 3.1 3.0 3.3 3.3Regional currencies per USD (excl RMB)** 150.7 160.6 154.4 161.4 157.2
18
Attachment
Forecast Assumptions
Note: * Outturn** Higher values indicate currency depreciation against the US dollar1/ Including spending on the Water Management and Infrastructure Investment plans

(% YoY)Weight
(%)2015*
2016 2017
Mar 16 Jun 16 Mar 16 Jun 16
US 14.9 2.4 2.2 1.9 2.4 2.3
Euro area 10.0 1.6 1.4 1.7 1.6 1.6
Japan 13.6 0.6 0.8 0.6 0.4 1.0
China 15.7 6.9 6.5 6.5 6.4 6.4
Asia** 37.4 3.5 3.5 3.2 3.9 3.7
Total*** 100 3.2 3.1 3.0 3.3 3.3
Assumption on trading partners’ GDP growth
19
Attachment
Note: * Outturn** Weighted by export shares of Thailand’s major trading partners in 2014 (7 Asian countries including Singapore (6.5%),
Hong Kong (7.9%), Malaysia (8.0%), Taiwan (2.5%), Indonesia (5.9%), South Korea (2.8%), and Philippines (3.7%))*** Weighted by export shares of Thailand’s major trading partners in 2014 (13 countries)


![TMB Bank Plc. · Analysts & Investors Presentation. May 2009 [2] Operating performance and financial outlook Economic outlook and 1Q09 results review Key developments after 1Q09 Business](https://img.dokumen.tips/doc/110x75/5f7c361172bb5363dd7bd77e/tmb-bank-plc-analysts-investors-presentation-may-2009-2-operating-performance.jpg)