Embed Size (px)
Citation preview
Module 1
Key concepts & rationale: Why
mainstream climate change in
national development planning
Global Climate Change AllianceSupport Facility
national development planning
and budgeting?
Training workshops onmainstreaming climate change

Seminar objectives (1)
• You are:
– more aware of the benefits, and also the challenges, ofmainstreaming climate change in your countries’ nationalpolicies, strategies, programmes and projects
– more motivated and better equipped to contribute to thismainstreaming process
– more familiar with some of the tools available foreffectively integrating climate change adaptation andmitigation in national development planning and budgeting
Seminar objectives (2)
• In addition, you:
– share your views, knowledge and experience with eachother
– provide insights and feedback to the donor community,via the sponsor of this event
• thus contributing in future to:
– more aligned approaches to tackling climate change
– more aligned priorities between partner countries and thedonor community
Seminar programme (1)
• Day 1
– Mod. 1: Why mainstream climate change in nationaldevelopment planning and budgeting?
– Mod. 2: Planning under uncertainty and in the face of achanging climate
– Mod. 3: Adaptation and mitigation – Moving to climate-resilient, low-emission development

Seminar programme (2)
• Day 2
– Mod. 4: Strengthening institutions and capacities
– Mod. 5: Mainstreaming climate change in national, sectorand local policies/strategies
Seminar programme (3)
• Day 3
– Mod. 6: Costing, assessing and selecting adaptation andmitigation options and measures
– Mod. 7: Mainstreaming climate change in the budgetaryprocess
– Mod. 8: Mainstreaming climate change in monitoringsystems
– Mod. 9: Recap, conclusions and planned actions

Timetable
9:00 – 11:00 Session 1
11:00 – 11:30 Coffee break
11:30 – 13:00 Session 2
13:00 – 14:00 Lunch13:00 – 14:00 Lunch
14:00 – 15:30 Session 3
15:30 – 16:00 Coffee break
16:00 – 17:30 Session 4

Key topics covered by this module
• Climate change, environment and developmentlinkages
• Key concept: mainstreaming
• Rationale for mainstreaming climate change• Rationale for mainstreaming climate change

Climate change, environment and developmentClimate change, environment and development

Activity 1 – Group work:
Climate change–development linkages

Climate change and environment
• Climate constitutes a critical aspect of ‘theenvironment’
• Climate change is not a theme to be addresseddistinctly from other environmental issues:
– climate change exacerbates certain environmentaltrends and problems:
• e.g. desertification, freshwater scarcity, loss of biodiversity, airpollution
– the way we manage some environment-related issueshas an impact on climate change
• e.g. waste management, soil management, land use planningand management

Environment-developmentlinkages
Climate change:- an environ-mental issue- a developmentissue
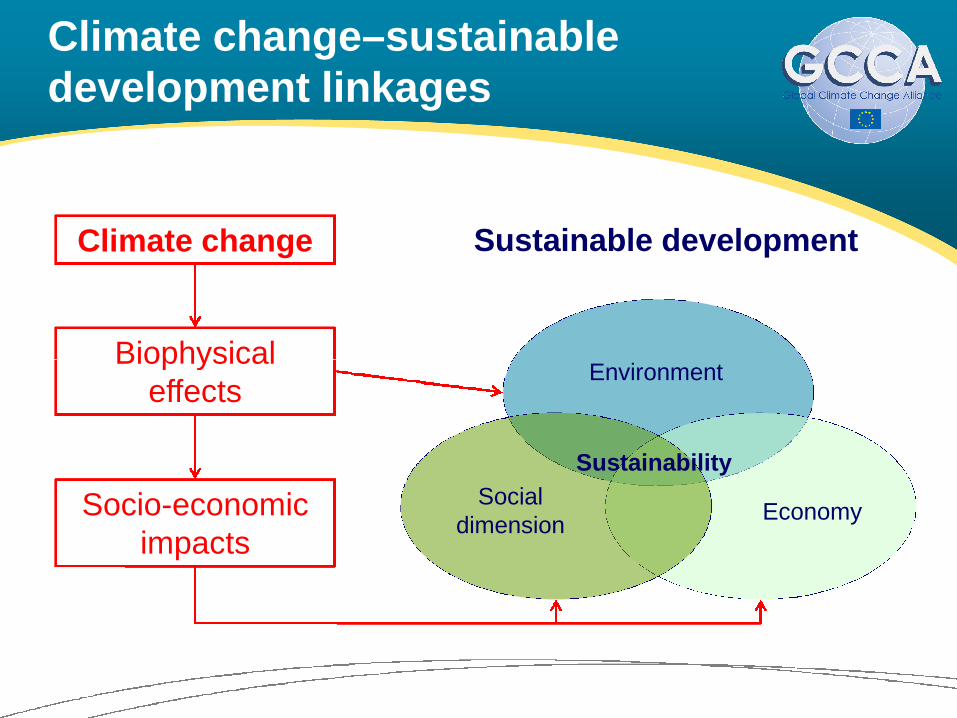
Climate change–sustainabledevelopment linkages
Environment
Sustainable developmentClimate change
BiophysicalEnvironment
Socialdimension
Economy
Sustainability
Biophysicaleffects
Socio-economicimpacts

Some key impacts of climatechange in the Pacific islands (1)
• Impacts on human settlements & infrastructure– from accelerated coastal erosion, saline intrusion into
freshwater lenses, more intense cyclones and increasedcoastal flooding
• Impacts on water resources– from accelerated sea level rise and reduced rainfall or longer
drought periods
• Impacts on food security– from crop damage, reduced agricultural productivity, impacts
on fisheries

Some key impacts of climatechange in the Pacific islands (2)
• Impacts on human health– from disaster-related injuries
– from a deterioration in water quality
– from increased risk of malnutrition
– from the spread of malaria and dengue fever– from the spread of malaria and dengue fever
– from increased risk of ciguatera poisoning
• Impacts on key coastal ecosystems– e.g. mangroves, coral reefs
• Impacts on local cultures and ways of life
• Social and economic costs– from all the above

What is mainstreaming?What is mainstreaming?

Mainstreaming
• How would you define ‘mainstreaming’?
– The mainstream: the prevailing or dominant course,current, tendency or way of thinking
– Mainstreaming: the informed integration of a relevantvalue, theme or concern into the decisions of institutionsthat drive national, local and sectoral development policy,rules, plans, investment and action (adapted from Dalal-Clayton
& Bass 2009)
– Institutional strengthening and change is at the heart ofany mainstreaming effort
Objectives of mainstreaming
• Mainstreaming is a long-term, iterative processaimed at:
– transforming ideas
– even more importantly, transforming policies and– even more importantly, transforming policies andpractices
• in order to:
– promote desired developmental outcomes (with regard togender, environment, climate change, governance,human rights, ...)
– and support the identification and implementation ofintegrated solutions to human problems

Mainstreaming environmentand climate change
Humanactivities
AdaptationMitigation
Climate,env.t & nat. resources
Impacts generated Opp., risks & constraints
activities
Adaptation mainstreaming
• The iterative process of integrating adaptationconsiderations into:
– policy making
– budgeting– budgeting
– implementation and monitoring processes
• A multi-year, multi-stakeholder effort
Source: UNDP-UNEP (2010)

Why mainstream
climate change?

Rationale for mainstreamingclimate change (1)
• Climate change is a potentially significant threatto ongoing development / poverty reduction efforts
– Developing countries face the largest risks and impacts,and have the lowest capacity/resources to address them
• Economic growth is necessary but not sufficient torespond to climate-related challenges
– Climate-resilient and low-emission developmentstrategies are needed to achieve sustainabledevelopment

Rationale for mainstreamingclimate change (2)
• Climate change impacts are complex and tendto have implications at the level of whole sectorsand across multiple sectors
– Project-based adaptation approaches such as NAPAs– Project-based adaptation approaches such as NAPAshave their limitations: more strategic and comprehensiveapproaches are required
– Coordination needed across sectors and levels ofgovernment
– Implications for resource allocation
Rationale for mainstreamingclimate change (3)
• An adequate, strategically designed responsecan bring significant developmental benefits
• On the contrary, delaying the response is likely tobe more costly than starting to act nowbe more costly than starting to act now

A framework for mainstreaming
climate change

Finding the entrypoints and making
the case
Mainstreaming CCinto policy and
planning processes
Meeting theimplementation
challenge
Preliminaryassessments
Understanding CC–development linkages
Understanding climate-related uncertainties
Raising awareness andbuilding partnershipsNational consensus and
Collecting country-specific evidence and
influencing policyprocesses
Mainstreaming CC innational, sector and local
policies, strategies,programmes/projects
Costing, assessing and
Budgeting and financingMainstreaming CC in the
budgetary process
Mainstreaming CC inmonitoring systems
Performance AssessmentFrameworks
Supporting policy
Mod1
Mod2
Mod3
Mod5 Mod7
Mod8National consensus andcommitment to moving to
climate-resilient, low-emission development
Strengtheninginstitutions / capacities
Needs assessmentWorking mechanisms
Costing, assessing andselecting adaptation andmitigation options and
measures
Strengtheninginstitutions / capacities
Learning by doing
Supporting policymeasures
National, sector and sub-national levels
Strengtheninginstitutions / capacities
Mainstreaming asstandard practice
Engaging stakeholders and coordinating within the developmentcommunity
Mod4
Mod4
Mod6
Adapted from: UNDP-UNEP (2009) Mainstreaming poverty-environment linkages into development planning. Figure 3.1, p. 15

References
• Millennium Ecosystem Assessment (2005) Ecosystems and Human Well-being: Synthesis. IslandPress, Washington, DC. Available from: http://www.maweb.org/en/Synthesis.aspx
• UNDP-UNEP (2009) Mainstreaming Poverty-Environment Linkages into Development Planning: AHandbook for Practitioners. UNDP-UNEP Poverty-Environment Initiative. Available from:http://www.unpei.org/PDF/PEI-full-handbook.pdf
• UNDP-UNEP (2010) Mainstreaming Adaptation to Climate Change into Development Planning: AGuidance Note for Practitioners. Draft version. UNDP-UNEP Poverty-Environment Initiative. Finalversion available from: http://www.unpei.org/knowledge-resources/publications.html
27

Module 2
Planning under uncertainty and
in the face of a changing
Global Climate Change AllianceSupport Facility
in the face of a changing
climate
Training workshops onmainstreaming climate change

Key topics covered by this module
• Basics of climate change science
• Sources of uncertainty
• Planning in the face of uncertainties and a changingclimateclimate
– Cost of inaction / Benefits of action
– ‘No-regrets’, ‘low-regrets’ and ‘robust’ measures
– Adaptive management
– Scenario planning

Basics of climate change scienceBasics of climate change science
Climate change is a reality
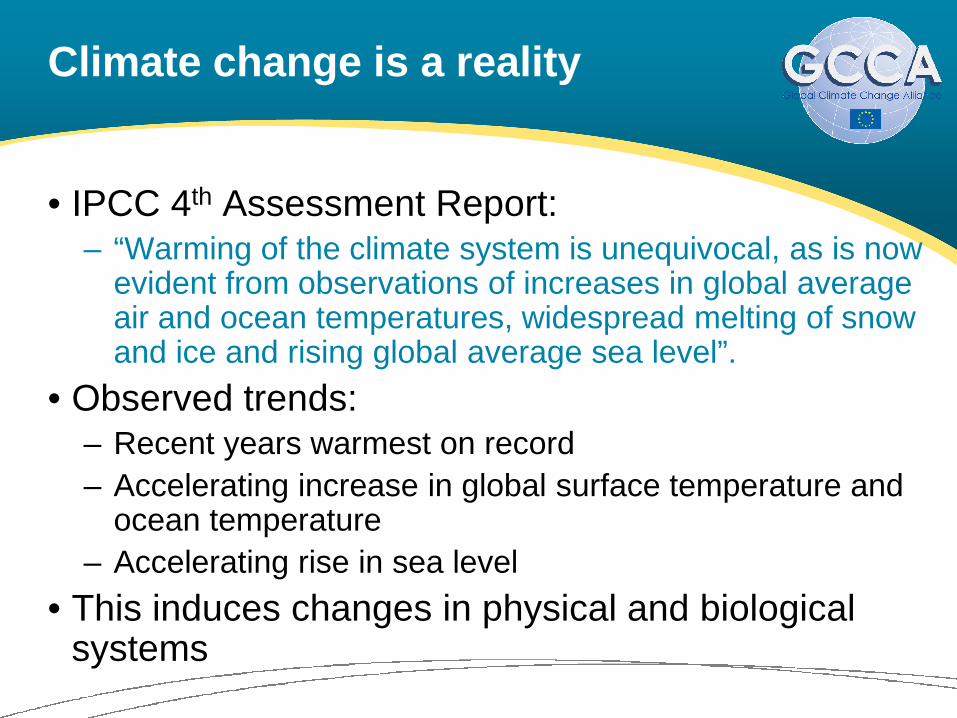
• IPCC 4th Assessment Report:– “Warming of the climate system is unequivocal, as is now
evident from observations of increases in global averageair and ocean temperatures, widespread melting of snowand ice and rising global average sea level”.and ice and rising global average sea level”.
• Observed trends:– Recent years warmest on record
– Accelerating increase in global surface temperature andocean temperature
– Accelerating rise in sea level
• This induces changes in physical and biologicalsystems

Some observations: trends inglobal mean temperature
Source: IPCC (2007b)4th Assessment Report,WG I – FAQ 3.1 Fig. 1
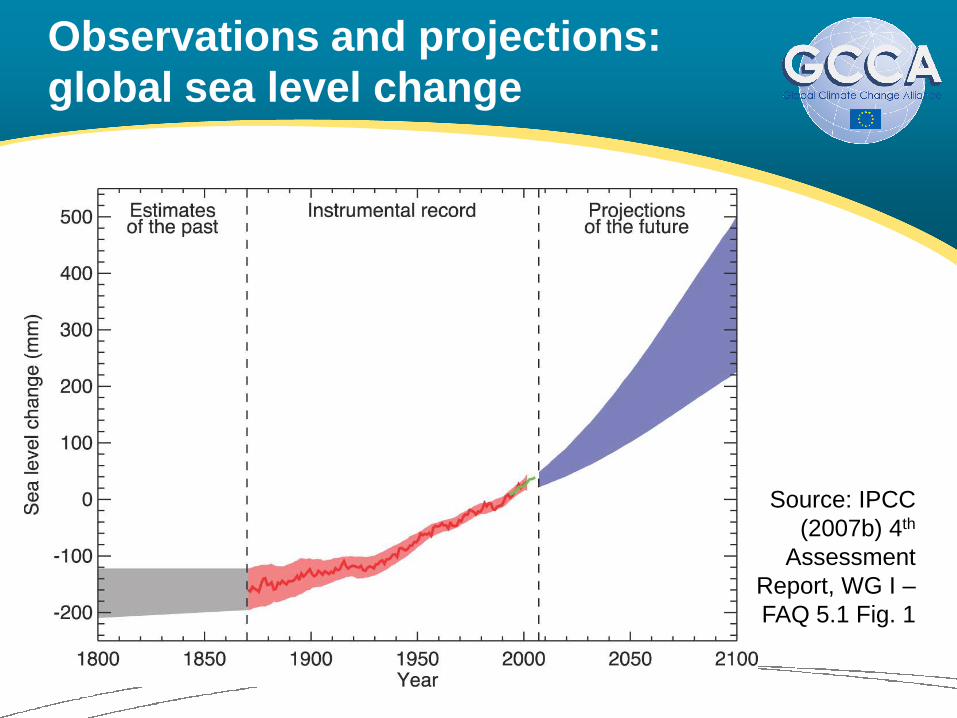
Observations and projections:global sea level change
Source: IPCC(2007b) 4th
AssessmentReport, WG I –FAQ 5.1 Fig. 1

Observations: intensity of cyclones
%age of Category 1 cyclone (blue curve), sum of Category 2 and 3 (green curve), sum ofcategory 4 and 5 (red curve) on 5 years period. Dashed lines are averages for each category
from 1970 to 2004 (Source: Petit & Prudent 2008, p. 42, from Webster et al. 2005)

Physical manifestations ofclimate change in the Pacific region
• Increased average air and oceantemperatures
• Rising sea levels
• More unpredictable rainfall patterns– e.g. increased intensity of precipitation– e.g. increased intensity of precipitation
– e.g. increased or decreased average annual precipitation(likely increase in the equatorial Pacific)
• More frequent and severe extreme weather events– Storms, droughts, floods
• Shifts in seasons– e.g. changes in monsoon season

Resulting changes in physicalsystems
• Alterations in hydrological patterns and flows
– e.g. changes in oceanic circulation patterns
– e.g. changes in water salinity, oxygen levels
• Changes in coastal processes• Changes in coastal processes
– e.g. changes in erosion patterns

Resulting changes in biologicalsystems
• Changes in terrestrial ecosystems
– e.g. shifts in the range of some species
– e.g. increased erosion and land degradation
• Changes in marine and freshwater ecosystems• Changes in marine and freshwater ecosystems
– e.g. shifts in the range and abundance of plankton andfish
• Many other changes have been documented butmay be attributable at least in part to other causes
– e.g. degradation and loss of coastal wetlands, mangroves,coral reefs
Causes of change
• Natural variation is an inherent feature of theclimate (e.g. driven by solar cycles, earth orbit, volcanoes)
• But anthropogenic emissions of long-livedgreenhouse gases in the atmosphere are a majorgreenhouse gases in the atmosphere are a majorcause of the changes now being observed
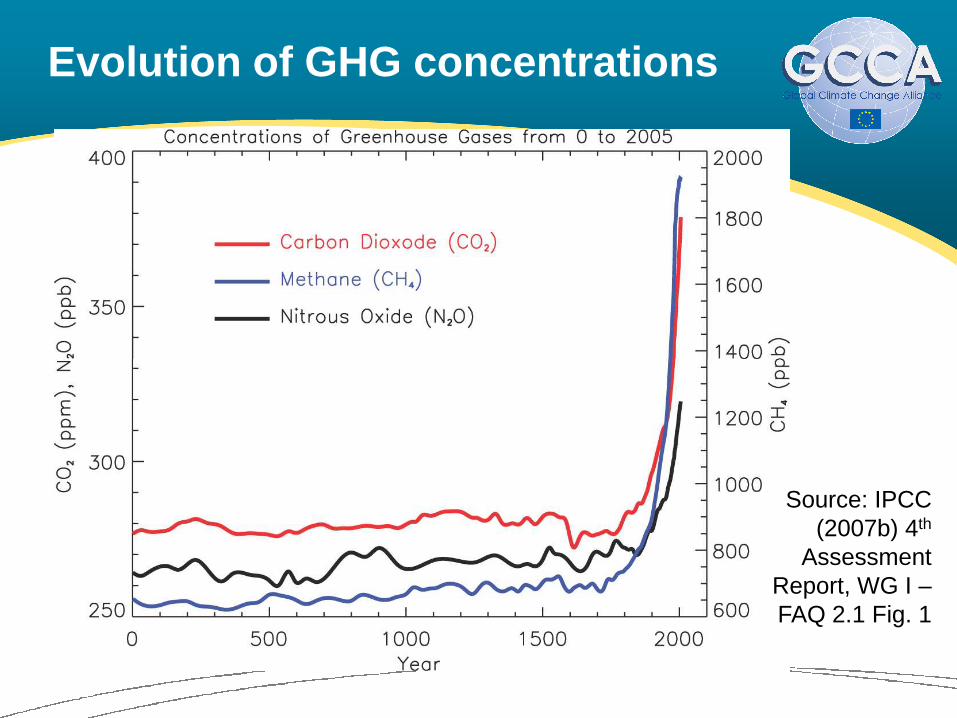
Evolution of GHG concentrations
Source: IPCC(2007b) 4th
AssessmentReport, WG I –FAQ 2.1 Fig. 1

The greenhouse effect
Source: WWF/IPCC

Main greenhouse gases
• By decreasing order of abundance:
– water vapour (H2O)
– carbon dioxide (CO2)
– methane (CH4)– methane (CH4)
– nitrous oxide (N2O)
– ozone (O3)
– chlorofluorocarbons (CFC)
– other halogenated compounds (i.e. gases containing fluorine,
chlorine, bromine or iodine) (e.g. hydrofluorocarbons – HFC,sulphur hexafluoride – SF6)

IPCC GHG emission scenarios
Source: IPCC 4thAssessment report –Synthesis report,Fig. 3.1

Projections over the 21st century –Southern Pacific
Change in t° (°C) Change in precipitation (%)
2010-2039 2040-2069 2070-2099 2010-2039 2040-2069 2070-2099
Comparison with the 1961-1990 periodProjections from 7 global models for the A1FI, A2, B1 & B2 scenarios
+0.45 to+0.82
+0.80 to+1.79
+0.99 to+3.11
-3.9 to +3.4 -8.2 to +6.7-14.0 to+14.6
Source: IPCC 4th Assessment Report – Working Group IIChapter 16, Table 16.1, p. 694
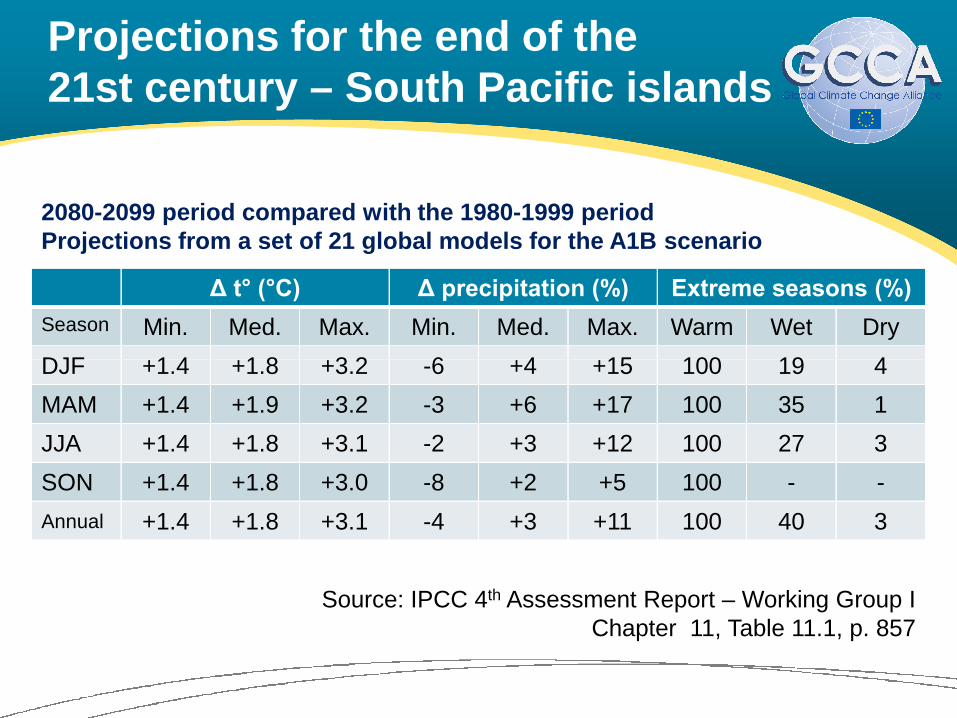
Projections for the end of the21st century – South Pacific islands
Δ t° (°C) Δ precipitation (%) Extreme seasons (%)
Season Min. Med. Max. Min. Med. Max. Warm Wet Dry
DJF +1.4 +1.8 +3.2 -6 +4 +15 100 19 4
2080-2099 period compared with the 1980-1999 periodProjections from a set of 21 global models for the A1B scenario
DJF +1.4 +1.8 +3.2 -6 +4 +15 100 19 4
MAM +1.4 +1.9 +3.2 -3 +6 +17 100 35 1
JJA +1.4 +1.8 +3.1 -2 +3 +12 100 27 3
SON +1.4 +1.8 +3.0 -8 +2 +5 100 - -
Annual +1.4 +1.8 +3.1 -4 +3 +11 100 40 3
Source: IPCC 4th Assessment Report – Working Group IChapter 11, Table 11.1, p. 857

Projections for the end of the21st century – Southeast Asia
Δ t° (°C) Δ precipitation (%) Extreme seasons (%)
Season Min. Med. Max. Min. Med. Max. Warm Wet Dry
DJF +1.6 +2.5 +3.6 -4 +6 +12 99 23 2
2080-2099 period compared with the 1980-1999 periodProjections from a set of 21 global models for the A1B scenario
DJF +1.6 +2.5 +3.6 -4 +6 +12 99 23 2
MAM +1.5 +2.7 +3.9 -4 +7 +17 100 27 1
JJA +1.5 +2.4 +3.8 -3 +7 +17 100 24 2
SON +1.6 +2.4 +3.6 -2 +6 +21 99 26 3
Annual +1.5 +2.5 +3.7 -2 +7 +15 100 44 3
Source: IPCC 4th Assessment Report – Working Group IChapter 11, Table 11.1, p. 855
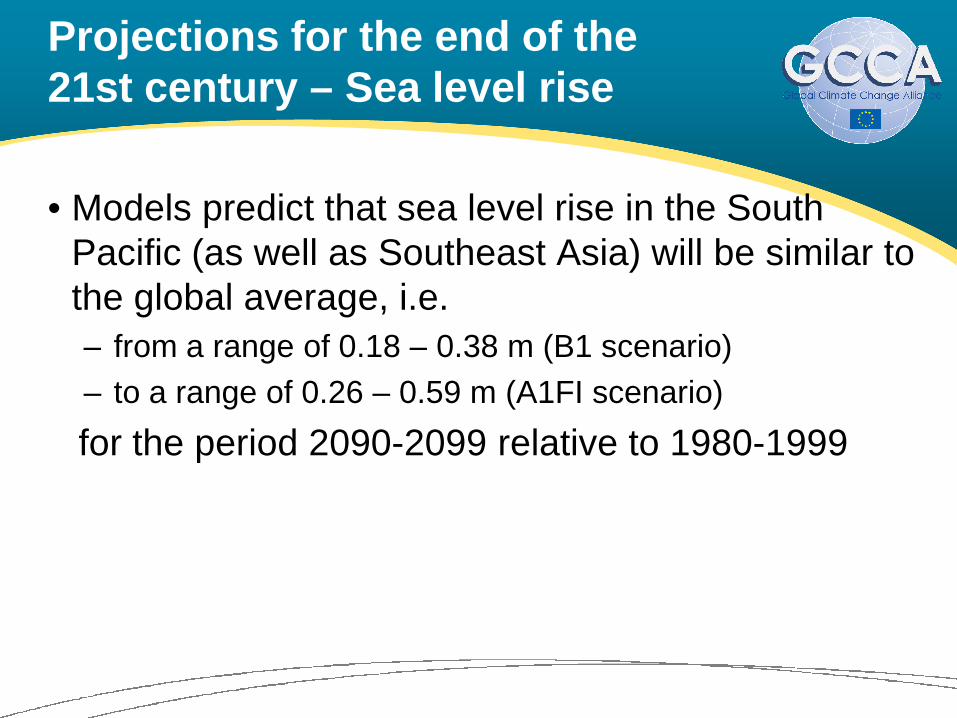
Projections for the end of the21st century – Sea level rise
• Models predict that sea level rise in the SouthPacific (as well as Southeast Asia) will be similar tothe global average, i.e.
– from a range of 0.18 – 0.38 m (B1 scenario)– from a range of 0.18 – 0.38 m (B1 scenario)
– to a range of 0.26 – 0.59 m (A1FI scenario)
for the period 2090-2099 relative to 1980-1999

Sources of uncertaintySources of uncertainty

Socio-economic uncertainties
• Socio-economic uncertainties (e.g. related to futurepopulation growth, economic growth, technological
choices, societal choices, international relations):
– influence the level of future emissions and thus the– influence the level of future emissions and thus themagnitude of climate change
– also, create uncertainties about future vulnerability toclimate change
Scientific uncertainties
• For any given emission scenario, differentatmosphere-ocean general circulation models(AOGCMs) provide different projections of futurechange – sometimes very different oneschange – sometimes very different ones
• Due to the complexity of the climate system,many uncertainties prevail and will persist overthe evolution of climate

Uncertainties in climate changeprojections
• Temperatures and sea levels:
– consensus that they will increase
– magnitude of the increase quite uncertain
• Rainfall:
– expected to increase overall
– but some regions are likely to get more and some less
– for many regions in the world, uncertainty about thedirection of change
• Changes in extreme parameters:
– average future conditions are easier to project thanextremes
Problems associated withdownscaling
• In developing countries in particular, the dataneeded to downscale higher-level projections ofclimate change to the local or regional level areoften missingoften missing
• The level of uncertainty is greater at downscaledlevels than at large scales
• Downscaling is particularly complex for small islands
– Major role of ocean–atmosphere interactions
– Uncertainty increases w/ distance from large land masses

Specific uncertainties for thePacific region
• Regional distribution of sea level rise
– Will not be geographically uniform, due to uneven oceandensity (linked to temperature, salinity) and circulationchanges
• Regional distribution of changes in tropical cyclones
– Uncertainty on future El Niño Southern Oscillationbehaviour contributes to uncertainty with regard to tropicalcyclone behaviour
• Few models address storm surges

Planning in the face of uncertaintiesPlanning in the face of uncertainties

The cost of inaction
• The uncertainties surrounding climate changeare often invoked to justify inaction
• In a medium- to long-term perspective, however,inaction now is likely to be more costly:inaction now is likely to be more costly:
– Failure to adapt => wasted investment, increasedvulnerability
– Failure to reduce emissions => greater magnitude ofclimate change, more harmful impacts, higheradaptation costs in future

The benefits of action
• Some climate adaptation and mitigationmeasures are expected to provide developmentalbenefits, whatever the scope and magnitude ofclimate change and even in the absence of changeclimate change and even in the absence of change
• Even in the face of uncertainty, some types ofmeasures are justified.

Justified measures in the face ofuncertainty (1)
• ‘No-regrets’ measures:
– those that are expected to produce net benefits for societyeven in the absence of climate change (adaptation) orindependently of any ‘reward’ for mitigation (zero ornegative net cost at a zero carbon price)negative net cost at a zero carbon price)
• ‘Low-regrets’ measures:
– those that are expected to have a cost for society, but anacceptable one in view of the benefits they would bring ifclimate change turns out to produce significant effects(adaptation), or to have a low net cost at zero or lowcarbon prices (mitigation)
Justified measures in the face ofuncertainty (2)
• ‘Robust’ measures:
– those that produce net benefits or deliver good outcomesacross various possible climate change or carbon pricescenarios and economic development scenarios (ratherthan just under the ‘most likely’ scenario)than just under the ‘most likely’ scenario)
• Robust decision making ‘involves evaluating optionsto minimize expected regret across a variety ofmodels, assumptions, and loss functions’ (World Bank,
WDR 2010)

Adaptive management
• Adaptive management: a flexible and pragmatictype of management, aimed at continuallyimproving management policies and practices, onthe basis of ‘learning by doing’the basis of ‘learning by doing’
– Uses pilot projects and experiments; results andoutcomes are analysed and lessons learnt beforescaling up or adjusting responses
– Involves robustness as a decision criterion, the inclusionof safety margins in investment and the choice ofreversible/flexible options
• Well suited to situations involving uncertainties

Scenario planning (1)
• To support the choice of adaptation measures,scenarios reflecting prevailing uncertainties can bedeveloped, e.g.
– ‘no change’ (= baseline)
– ‘moderate change’
– ‘high change’
– higher temperatures combined with an increase as well asa decrease in rainfall
Scenario planning (2)
• Besides changes in climate conditions,scenarios typically describe some of the resultingbiophysical and/or socio-economic changes
– e.g. infrastructure and populations affected by a givenrise in sea level or increase in storm intensityrise in sea level or increase in storm intensity
• Scenario development should involve:
– key experts with a suitable range of technicalcompetences
– other national stakeholders (e.g. government, civilsociety organisations), for their knowledge of localconditions
Scenario planning (3)
• Once scenarios have been designed:
– Potentially suitable adaptation or mitigation options areidentified
– The costs and benefits of these options are calculated foreach of the chosen scenarios
• A comparison of costs and benefits across thevarious scenarios allows the identification of no-regrets, low-regrets and ‘robust’ measures

Use of scenarios: illustration (1)
Exhibit 1 – Scenarios for long-term sea level rise in Samoa; in the highchange case, sea level might rise by up to ~26cm by 2030
Today’s climatescenario
2030 estimated sea level rise against 2008 levelCentimeters
0.9
Sea level rise scenarios in Samoa by 2030 compared to 2008
00 2.02.0
Yearly sea level riseMillimeters
SOURCES: IPCC 4th AR; Rahmstorf (2009); CSIRO; team analysis
Moderate changescenario based onA2 scenariowithout ice flow
High changescenario based onA2 scenario withice flow
3.5
11.9
Sea levelrise inSamoa
26.2
Geologicalsubsidencein Samoa
2.0
Correctionfor localeffect inSamoa
0
Globalseal levelrise
24.2
7.68.12.0-2.5
Source: Economics of Climate Adaptation (2009) Test case on Samoa –Focus on risks caused by sea level rise, Fig. 01, p. 121

Use of scenarios: illustration (2)
Today’sclimatescenario
Horizontal retraction of freshwater lens due to sealevel rise, in meters
2 to 3
0 to 1
3 to 5
Savai’i
Upolu
Exhibit 2 – The freshwater lens is expected to retract by ~ 30 meters inUpolu and ~10 meters in Savai'i by 2030
ΔL
),m
120
140
160
180
Currentaverage
10% decrease(minimum annualrainfall projectedby global climate
model)
10% increase(maximum annualrainfall projectedby global climate
model)
However, salinization is highly sensitive to changes inaverage annual rainfall
SOURCE: Team analysis; CMIP3 global models
Moderatechangescenario
Highchangescenario
5 to 10
3 to 5
25 to 35
10 to 15
Both depth and location,particularly distance from coast)
will affect the salinization ofindividual wells
Annual rainfall, m
Sh
ift
of
len
s(Δ
0
20
40
60
80
100
2.6 2.7 2.8 2.9 3.0 3.1 3.2 3.3 3.4
A 10% decrease in rainfall coulddouble the expected horizontal
retraction of the freshwater lens inthe high change scenario
Source: Economics of Climate Adaptation (2009) Test case on Samoa –Focus on risks caused by sea level rise, Fig. 02, p. 122

Tools supporting scenariobuilding (1)
• Data and information provision tools thatgenerate or present data/information on:
– main climate variables (observations, projections)
– secondary climate impacts (e.g. on crop yields)– secondary climate impacts (e.g. on crop yields)
– examples of adaptation options
• Examples of such tools:
– World Bank Climate Change Data Portal(http://sdwebx.worldbank.org/climateportal)
– Climate Change Explorer (http://www.weadapt.org)
Source: OECD (2010a)

Tools supporting scenariobuilding (2)
• Existing reports, studies already conducted atregional, national or sub-national level
– studies conducted by national meteorological service
– e.g. NAPAs, national Communications to the UNFCCC– e.g. NAPAs, national Communications to the UNFCCC
– e.g. region-specific chapters of IPCC 4th Assessment
• Knowledge sharing tools:
– Adaptation Learning Mechanism(http://www.adaptationlearning.net/)
• Multi-disciplinary expert opinion combined with localknowledge

Tools supporting scenariobuilding (3)
• In the Pacific region: SOPAC’s Geonetworkwebsite (http://geonetwork.sopac.org/geonetwork/srv/en/main.home)
– interactive maps
– GIS datasets– GIS datasets
– satellite images and related applications

References (1)
• Economics of Climate Adaptation Working Group (2009) Shaping climate-resilient development: aframework for decision-making. Climate Works Foundation, Global Environment Facility,European Commission, McKinsey & Company, The Rockfeller Foundation, Standard CharteredBank & Swiss Re. Available from:http://www.mckinsey.com/clientservice/Social_Sector/our_practices/Economic_Development/Knowledge_Highlights/Economics_of_climate_adaptation.aspx
• IPCC (2007a) Climate Change 2007: Synthesis Report. Contribution of Working Groups I, II and II• IPCC (2007a) Climate Change 2007: Synthesis Report. Contribution of Working Groups I, II and IIto the Fourth Assessment Report. [Core Writing Team, Pachaury R.K. & Reisinger A. (eds.)]Intergovernmental Panel on Climate Change, Geneva. Available from: www.ipcc.ch
• IPCC (2007b) Climate Change 2007: The Physical Science Basis. Contribution of Working GroupI to the Fourth Assessment Report of the Intergovernmental Panel on Climate Change [SolomonS., Qin D., Manning M., Chen Z., Marquis M., Averyt K.B. , Tignor M. & Miller H.L. (eds.)].Cambridge University Press, Cambridge, UK & New York, NY, USA. Available from: www.ipcc.ch
• IPCC (2007c) Climate Change 2007: Impacts, Adaptation and Vulnerability. Contribution ofWorking Group II to the Fourth Assessment Report of the Intergovernmental Panel on ClimateChange [Parry M.L., Canziani O.F., Palutikof J.P., van der Linden P.J. & Hanson C.E. (eds.)].Cambridge University Press, Cambridge, UK & New York, NY, USA. Available from: www.ipcc.ch
40

References (2)
• OECD (2010a) Climate Risk Screening and Assessment Tools: Making Sense of a CrowdedField. [Unpublished] Document distributed at the Meeting of the OECD DAC-EPOC Joint TaskTeam on Climate Change and Development Co-operation, 12-13 October 2010, Amsterdam.
• Petit J. & Prudent G. (eds) (2008, reprint 2010) Climate Change and Biodiversity in the EuropeanUnion Overseas Entities. IUCN, Gland, Switzerland and Brussels, Belgium. Available from:http://data.iucn.org/dbtw-wpd/edocs/2010-064.pdf
• UNDP-UNEP (2010) Mainstreaming Adaptation to Climate Change into Development Planning: AGuidance Note for Practitioners. Draft version. UNDP-UNEP Poverty-Environment Initiative. Finalversion available from: http://www.unpei.org/knowledge-resources/publications.html
• World Bank (2010a) Development and Climate Change. World Development Report 2010. WorldBank, Washington, DC. Available from: http://go.worldbank.org/ZXULQ9SCC0
• WWF – Climate change explained: http://wwf.panda.org/about_our_earth/aboutcc/how_cc_works/
41

Module 3
Adaptation & mitigation –
Moving to climate-resilient, low-
emission development
Global Climate Change AllianceSupport Facility
Training workshops onmainstreaming climate change

Key topics covered by this module
• Vulnerability, adaptation, other key concepts
• The development–adaptation continuum
• From biophysical to socio-economic impacts
• Moving to climate-resilient, low-emission• Moving to climate-resilient, low-emissiondevelopment
• Tools for raising awareness and buildingpartnerships
• Illustration: macroeconomic analysis in support ofawareness raising
Vulnerability and related conceptsVulnerability and related concepts
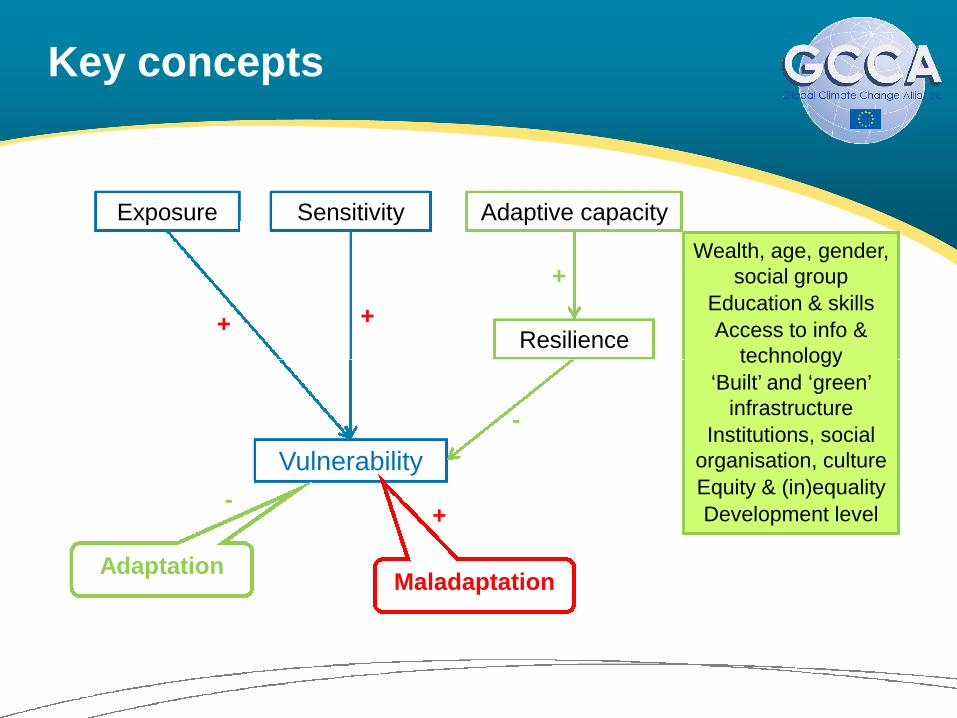
Key concepts
Exposure Sensitivity Adaptive capacity
Wealth, age, gender,social group
Education & skills
Access to info &technology
Resilience+ +
+
Vulnerability
technology
‘Built’ and ‘green’infrastructure
Institutions, socialorganisation, culture
Equity & (in)equality
Development level
AdaptationMaladaptation
-
+-
Expected lifetime, exposure andadaptation requirements
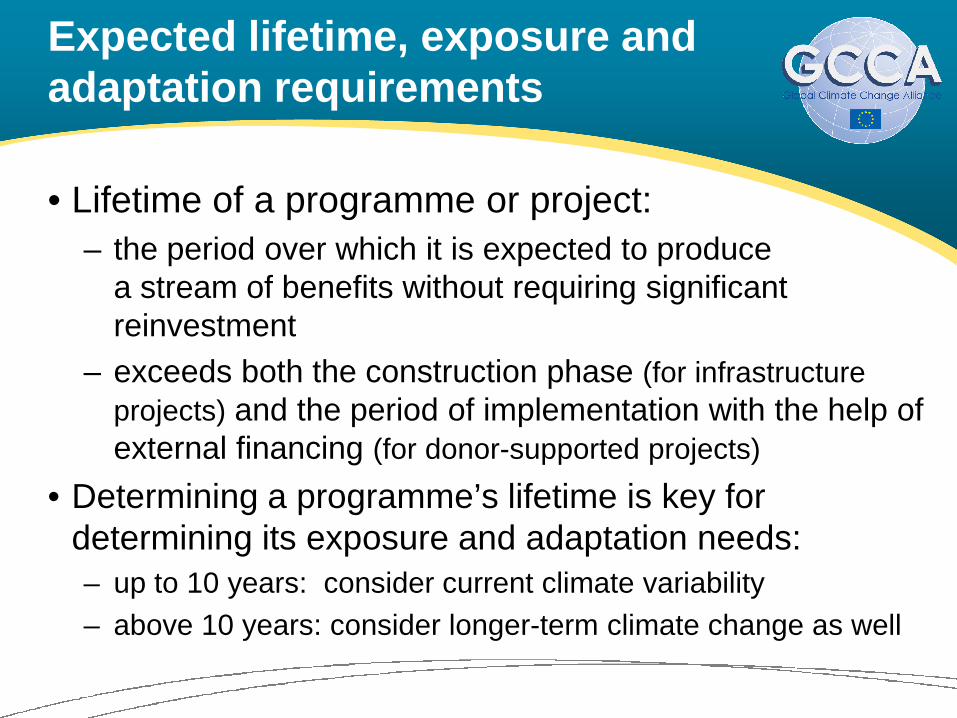
• Lifetime of a programme or project:
– the period over which it is expected to producea stream of benefits without requiring significantreinvestment
– exceeds both the construction phase (for infrastructure– exceeds both the construction phase (for infrastructure
projects) and the period of implementation with the help ofexternal financing (for donor-supported projects)
• Determining a programme’s lifetime is key fordetermining its exposure and adaptation needs:– up to 10 years: consider current climate variability
– above 10 years: consider longer-term climate change as well

The development–adaptation continuumThe development–adaptation continuum

Adaptation and development
• Development, notably through achieving theMDGs, is critical to reducing vulnerability to climatechange
– The factors that constrain or facilitate adaptation areoften the same factors that constrain or facilitateoften the same factors that constrain or facilitatedevelopment
• Most sustainable & equitable developmentprocesses can bridge the ‘adaptation deficit’
– i.e. the failures in managing current climate variability
Source: Schipper et al (2008)
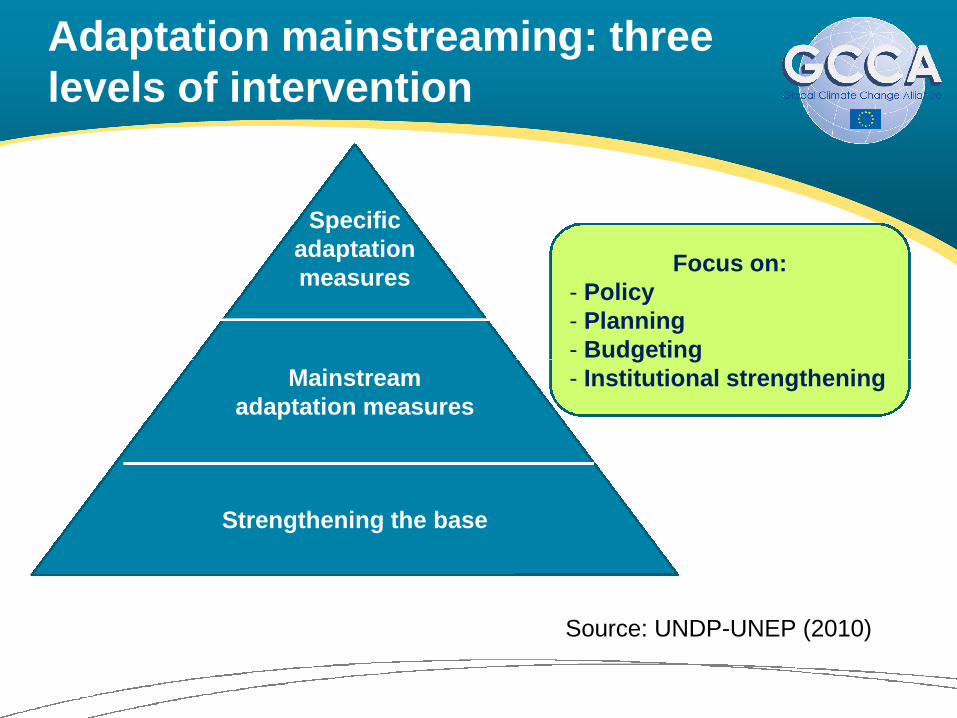
Adaptation mainstreaming: threelevels of intervention
Specificadaptationmeasures
Focus on:- Policy- Planning- Budgeting
Strengthening the base
Mainstreamadaptation measures
Source: UNDP-UNEP (2010)
- Budgeting- Institutional strengthening
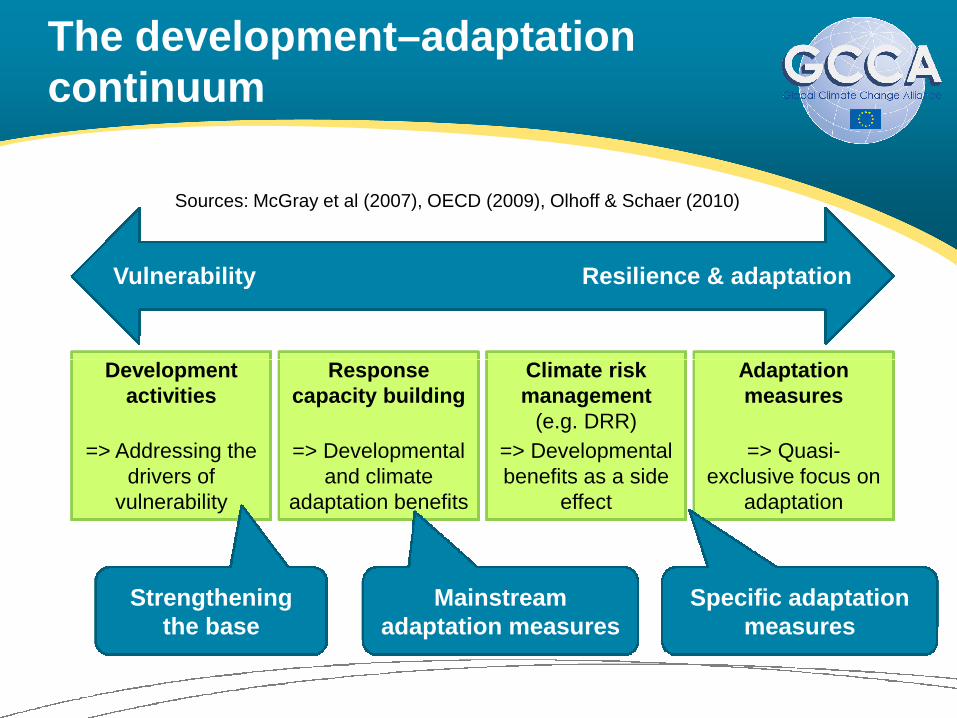
The development–adaptationcontinuum
Vulnerability Resilience & adaptation
Development Response Climate risk Adaptation
Sources: McGray et al (2007), OECD (2009), Olhoff & Schaer (2010)
Developmentactivities
=> Addressing thedrivers of
vulnerability
Responsecapacity building
=> Developmentaland climate
adaptation benefits
Climate riskmanagement
(e.g. DRR)
=> Developmentalbenefits as a side
effect
Adaptationmeasures
=> Quasi-exclusive focus on
adaptation
Strengtheningthe base
Mainstreamadaptation measures
Specific adaptationmeasures

From biophysical to socio-economic impactsFrom biophysical to socio-economic impacts

From biophysical to socioeconomicimpacts
Biophysicalimpacts
Changes in t°
Changes in rainfallpatterns
Shifts in seasons
Socioeconomicimpacts
Damage to ordestruction ofinfrastructure
Reduced availability ofhydropower
VulnerabilityMore frequent or severestorms, floods, droughts
Raised sea level
Erosion, desertification
Changes in waterquality/availability
Changes in ecosystems
Biodiversity loss
Disease & pestoutbreaks, ...
hydropower
Economic disruption,loss of livelihoods, social
disruption
Reduced food security,malnutrition
Increased mortality andmorbidity
Conflicts, populationdisplacement, human
migrations, ...
Vulnerabilityfactors

Group work:
Vulnerability factors and possible impacts

Addressing vulnerability factorsand impacts
Biophysicalimpacts
Socioeconomicimpacts
Vulnerabilityfactorsfactors
Climate riskmanagement
Specificadaptationmeasures
Developmentactivities
Responsecapacity building
Climate riskmanagement
Specificadaptationmeasures

Moving to climate-resilient developmentMoving to climate-resilient development

From project-based approaches...
• Project-based adaptation approaches such asthose developed in NAPAs are a first step in theright direction:
– Contribution to national capacity building
– Involvement of stakeholders at grassroots level– Involvement of stakeholders at grassroots level
– Identified projects usually correspond to real prioritiesand involve wider developmental benefits
• But there are also problems:
– Poor institutional arrangements for implementation
– Low capacity for adaptation planning andimplementation
Source: World Bank, WDR 2010

... to climate-resilient development
• In the medium and long term, standalone projectsare unlikely to meet all adaptation requirements in acost-effective manner
• There is a strong case for mainstreaming climate• There is a strong case for mainstreaming climatechange at a more strategic level, in developmentand poverty reduction policies/strategies and insector programmes
• Climate-resilient development results from theadaptation mainstreaming process
Climate-resilient developmentand environmental sustainability
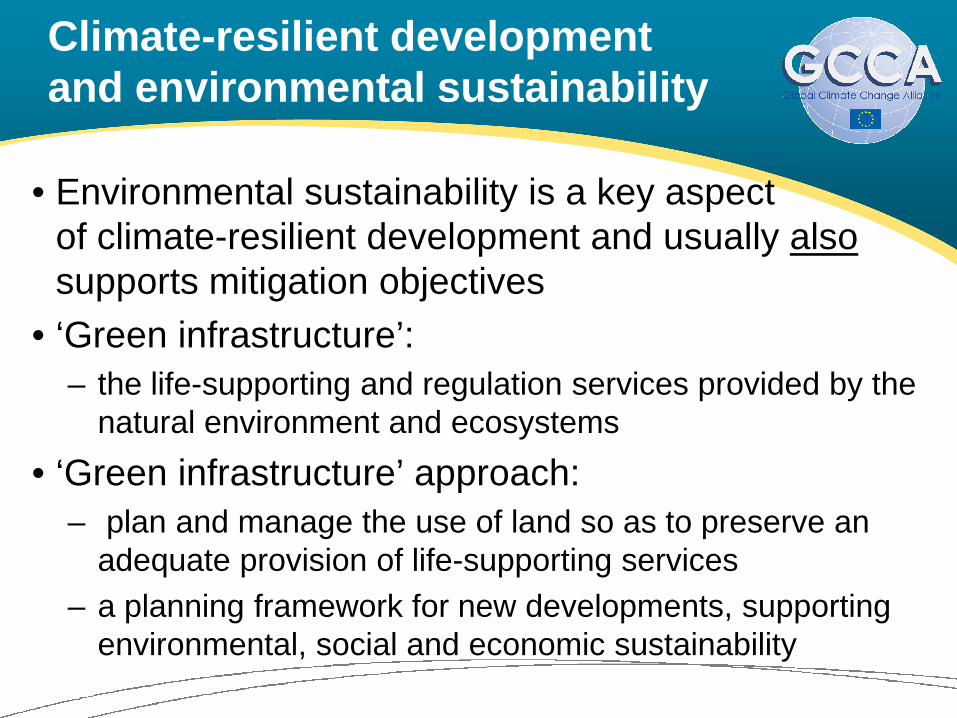
• Environmental sustainability is a key aspectof climate-resilient development and usually alsosupports mitigation objectives
• ‘Green infrastructure’:
– the life-supporting and regulation services provided by thenatural environment and ecosystems
• ‘Green infrastructure’ approach:
– plan and manage the use of land so as to preserve anadequate provision of life-supporting services
– a planning framework for new developments, supportingenvironmental, social and economic sustainability

Types of adaptation measures
• UNFCCC typology of adaptation options:
– Measures that foster behavioural change
– Technological and engineering solutions
– Risk management and vulnerability reduction strategies
– Research
– Capacity building
• For examples based on this typology, see EC (2009)Guidelines on the Integration of Environment and ClimateChange in Development Cooperation, p. 124
• Relevant measures are of course context-specificand determined by the mainstreaming process

Climate-resilient development:optimising outcomes
Climate-resilient
Priority torobust, low-or no-regretmeasures
Robust &flexible
infrastructureoptions
Start byaddressing
currentclimate risks &resilient
development
climate risks &vulnerability
Acceleratedecentralisation topromote local-level
adaptation &preparedness
Urban & land useplanning: future growth in
less exposed locations,relocate if necessary
Source: OECD (2010)

Moving to low-emission developmentMoving to low-emission development

Main sources of GHGemissions (global level)
Source of emissions % of total globalemissions (2005)
Energy, of which: 66.5%
- Electricity and heat 24.9%
- Transportation 14.3%
- Other fuel combustion (for heating buildings) 8.6%- Other fuel combustion (for heating buildings) 8.6%
- Industry 14.7%
- Fugitive emissions (oil & gas industry) 4.0%
Industrial processes 4.3%
Land use change (primarily deforestation) 12.2%
Agriculture 13.8%
Waste 3.2%
Source: Herzog (2005) – World Resources Institute, Washington, DC

Mitigation: main targets foremission reductions
• Generally, the three ‘sectors’ that are thebiggest contributors to GHG emissions are alsothe main targets for emission reductions:
– Energy (fossil fuels)– Energy (fossil fuels)
– Agriculture
– Land use change, in particular deforestation
• Country-specific patterns of emissions should beconsidered when determining national prioritiesfor contribution to the global climate mitigationeffort

Role of natural terrestrial systemsin climate mitigation
Atmosphere
CO2
CH4
Forests
Net sink (treebiomass + soilorganic matter)
Peatlands
Largest & mostefficient terrestrial
store of carbonbiomass
Grasslands
Net carbon sink ifnot degraded
Cultivatedsystems
Both a sink and asource of GHGs,
net balancedepends oncultivationmethods
4
N2O

Land-use related mitigationoptions
• According to McKinsey (2009):
– approx. 33% of total potential for reducing GHG emissionsat a cost not exceeding €60 per tCO2e is related to landuse (forestry and agriculture)
– 90% of the abatement opportunities associated with thesesectors are located in developing countries
– agriculture- and forestry-related measures generally havelow capital intensity (i.e. do not require particularly highextra upfront investment), while also entailing low(sometimes negative) abatement costs

Mitigation in the Pacific region
• Pacific island countries are responsible only fora tiny share of global GHG emissions
• Energy efficiency and renewable energy are apriority and are being pursued through a number ofpriority and are being pursued through a number ofregional initiatives
NAMAs
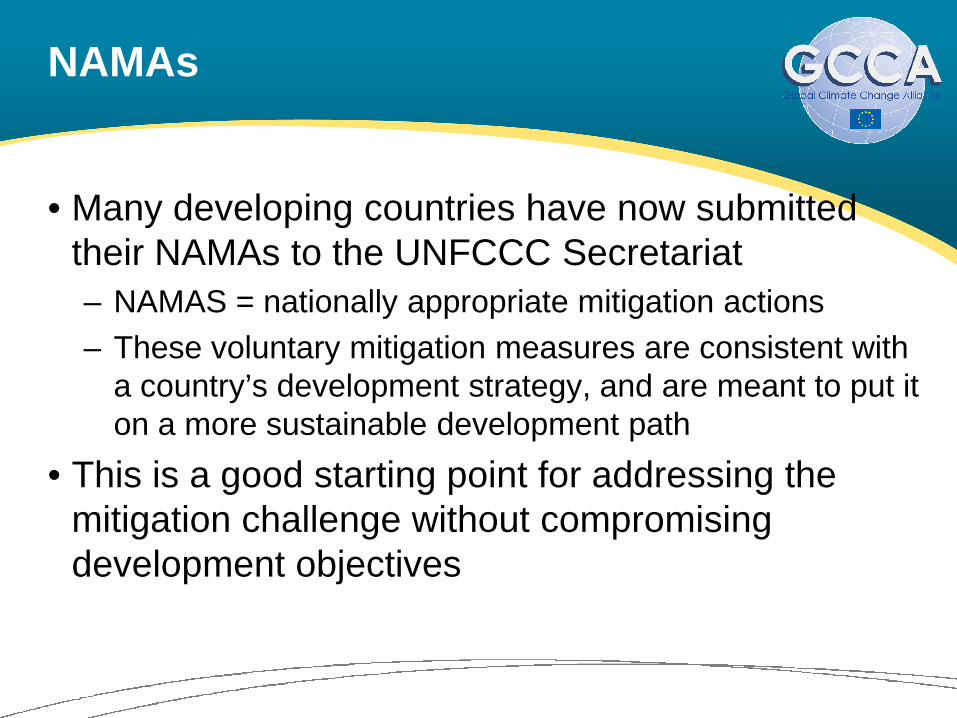
• Many developing countries have now submittedtheir NAMAs to the UNFCCC Secretariat
– NAMAS = nationally appropriate mitigation actions
– These voluntary mitigation measures are consistent with– These voluntary mitigation measures are consistent witha country’s development strategy, and are meant to put iton a more sustainable development path
• This is a good starting point for addressing themitigation challenge without compromisingdevelopment objectives

Towards low-emissiondevelopment (1)
• Climate mitigation should not be seen only asa constraint but also as a source of opportunity
– In many instances the adoption of mitigation measuresmay actually make a positive contribution to developmentobjectives (e.g. ‘co-benefits’, sounder management of naturalresources, new sources of growth)
– Countries with little developed infrastructure have aspecific opportunity to ‘leap-frog’ outdated technologiesand avoid ‘lock-in’ into carbon-intensive energy andindustrial infrastructure

Towards low-emissiondevelopment (2)
• Priorities for developing countries include:
– promoting energy efficiency• including in urban development and transport policies
• Including dismantling of fuel subsidies and other barriers/disincentives
– opting for low-emission, renewable sources of energy– opting for low-emission, renewable sources of energy
– designing policies that balance competing objectives:• sustained economic growth
• improved access to energy for the poor
• enhanced energy security
• improved environmental outcomes
– considering land-use related options, if relevant in view ofnational circumstances

Green jobs
• ‘Green jobs’:
– jobs associated with the deployment of clean technologiesand the adoption of improved environmental practices
– may be related to both adaptation and mitigation
– possible sectors include renewable energy, publictransport, clean technologies, building and constructionindustry, recycling, retail, agriculture (e.g. soilconservation, water efficiency), forestry (e.g. afforestation,reforestation, sustainable forestry, agroforestry)
– active training and capacity building policies required

Green growth (1)
• Green growth:
– ‘A way to pursue economic growth and development,while preventing environmental degradation, biodiversityloss and unsustainable natural resource use’
• Green growth strategy:
– ‘Aims at maximising the chances of exploiting cleanersources of growth, thereby leading to a moreenvironmentally sustainable growth model’
– Green growth is relevant to both developed anddeveloping countries
Source: OECD (2010)

Green growth (2)
• Green growth:
– ‘As long as the problem is perceived as a trade-offbetween improving living standards and the health of theplanet, then the ability of countries to alleviate climatechange will be severely constrained’change will be severely constrained’
– We must ‘devise strategies to revitalize the globaleconomy that can be both climate conscious and climateresilient’
– Trade-offs will always exist, but in a long-term perspective,the transition towards a low-emission economy canaccelerate sustainable growth
Source: Dervis et al., The Brookings Institution (2009)

Supporting green growth
Green
Mix of policyinstruments
creatingincentives &disincentives
Long-term,stable supportfor R&D andinnovation Diffusion of
cleantechnologies
& relatedknowledge
growthknowledge
(and removalof barriers)
Support fortechnologytransfers Management of
negativeemployment &
distribution effectsof transition
Developmentof new PAFs
Main source: OECD (2010)
Climate-resilient, low-emissiondevelopment
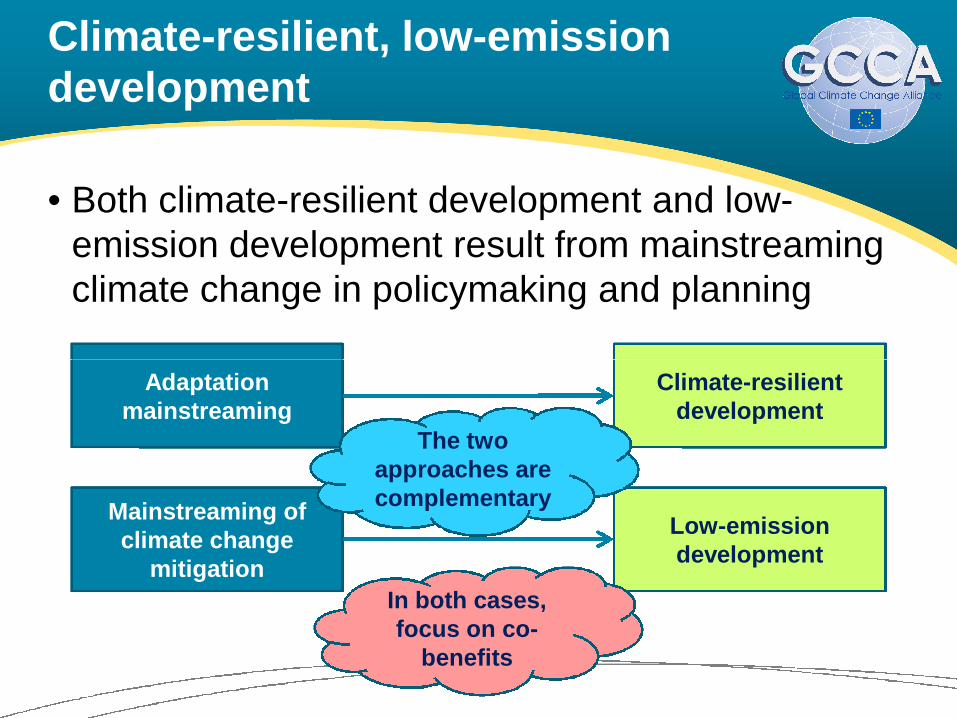
• Both climate-resilient development and low-emission development result from mainstreamingclimate change in policymaking and planning
Adaptationmainstreaming
Mainstreaming ofclimate change
mitigation
Low-emissiondevelopment
Climate-resilientdevelopment
The twoapproaches arecomplementary
In both cases,focus on co-
benefits

Adaptation and mitigation:possible conflicts
• Adaptation and mitigation are both essential; theyare the complementary elements of the response toclimate change
• Mitigation measures should not:• Mitigation measures should not:
– be incompatible with adaptation policies and requirements
– result in increased vulnerability to the effects of climatechange
– rely on environmentally unsustainable practices• e.g. agrofuels may be a threat to food security, water availability
and ecosystems

Adaptation and mitigation:synergies and complementarity
• On the other hand, quite frequently adaptation andmitigation measures are congruent, so thatmitigation produces a double stream of benefits
– e.g. reduced tillage agriculture enhances carbon– e.g. reduced tillage agriculture enhances carbonsequestration in soils while supporting soil moistureretention, thus increasing resilience to dry spells
– e.g. sustainable reforestation may simultaneouslyenhance carbon stocks and, by offering new livelihoodopportunities, enhance the adaptive capacity of localcommunities

Raising awareness and building partnershipsRaising awareness and building partnerships

Tools supporting advocacy andpartnership building
Communicationand advocacy
Nationalconsensus on
Vulnerability &impact
assessments
Macro and meso
Partnershipbuilding
consensus onand commitment
to climate-resilient, low-
emissiondevelopment
Macro and mesoeconomicanalysis
Pilot projects
Adapted from UNDP-UNEP (2010)

Vulnerability and adaptationassessment
• A vulnerability and adaptation assessmentwould typically focus on 3 units of analysis:
– Places: land, water, ecosystems, ‘natural capital’ and‘built infrastructure’
– People: individuals, communities, ‘human capital’,livelihoods
– Institutions: sectors, organisations, how they relate toeach other, ‘social capital’
• It should assess both current & future vulnerabilityto determine possible adaptation measures
Adapted from: Downing & Patwardhan (2004)

Steps in community vulnerability &adaptation assessment & action
Source: IPCC (2007c) 4th
Assessment Report, WG II- Fig. 16.3

Kiribati vulnerability andadaptation study (1999-2000)
• Without adaptation, by 2050, climate-induceddamages expected to amount to $8-16 million/year
• This finding led to the development of the KiribatiAdaptation ProgrammeAdaptation Programme
– Ph. I (2003-2005): assessment of adaptation options andinterventions, dvpt of a national vision for adaptation
– Phase II (2006-2010): pilot implementation: adaptationmainstreaming, capacity building, implementation ofadaptation measures
– Phase III (2010-2015): expanded programme for CCadaptation, incl. disaster risk reduction measures
Mapping vulnerability
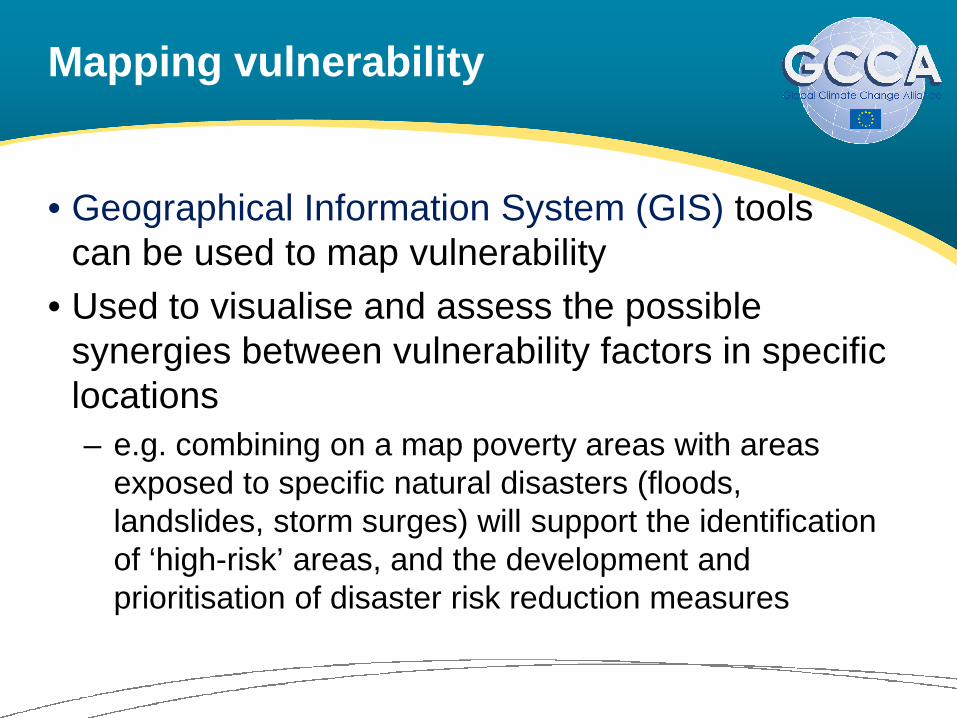
• Geographical Information System (GIS) toolscan be used to map vulnerability
• Used to visualise and assess the possiblesynergies between vulnerability factors in specificsynergies between vulnerability factors in specificlocations
– e.g. combining on a map poverty areas with areasexposed to specific natural disasters (floods,landslides, storm surges) will support the identificationof ‘high-risk’ areas, and the development andprioritisation of disaster risk reduction measures

GIS-based mapping of vulnerability:illustration (1)
Elevation map of central Apia
Elevation
0 m
1 m
Exhibit 3 – Highly granular geographic information has been used tosegment assets according to their elevation above sea level
Approach
• Starting point was adigital map ofSamoa with contourlines (2m lines incoastal areas)
• In a second step, a
Source: Economics of Climate Adaptation (2009) Test case on Samoa –Focus on risks caused by sea level rise, Fig. 03, p. 122
SOURCE: Team analysis
Building
Road
>4 m
2 m• In a second step, a
more granularsegmentation ofcoastal areas wasobtained by usingstate-of-the-art GISsoftware
• Finally, geo-coordinates ofbuildings and roads,were used todetermine the assetexposure to coastalflooding risk

GIS-based mapping of vulnerability:illustration (2)
Source: Elrick et al. (2009) Planning Manual: Supporting land usedecision making in the Republic of Kiribati, Fig. 2-3, pp. 10-11
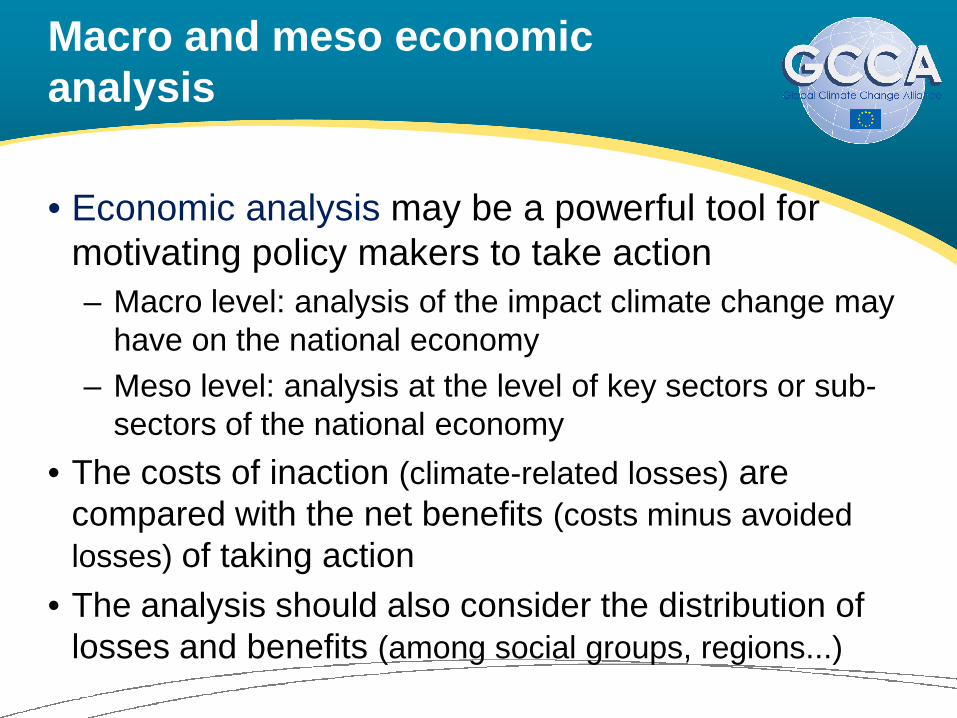
Macro and meso economicanalysis
• Economic analysis may be a powerful tool formotivating policy makers to take action
– Macro level: analysis of the impact climate change mayhave on the national economy
– Meso level: analysis at the level of key sectors or sub-sectors of the national economy
• The costs of inaction (climate-related losses) arecompared with the net benefits (costs minus avoided
losses) of taking action
• The analysis should also consider the distribution oflosses and benefits (among social groups, regions...)

Economic & social impacts ofdisasters in the Pacific (1950-2004)
Country Disastersreported
Reported losses,2004
(million USD)
Average pop.affected in
disaster years
Average impacton GDP in
disaster years
Fiji 38 $1,174.6 10.8% 7.7%Fiji 38 $1,174.6 10.8% 7.7%
Samoa 12 $743.4 42.2% 45.6%
Vanuatu 37 $384.4 15.5% 30.0%
Tonga 16 $171.1 42.0% 14.2%
Guam 11 $3,056.3 3.7% n/a
Source: UNDP-UNEP (2010),based on World Bank (2006)
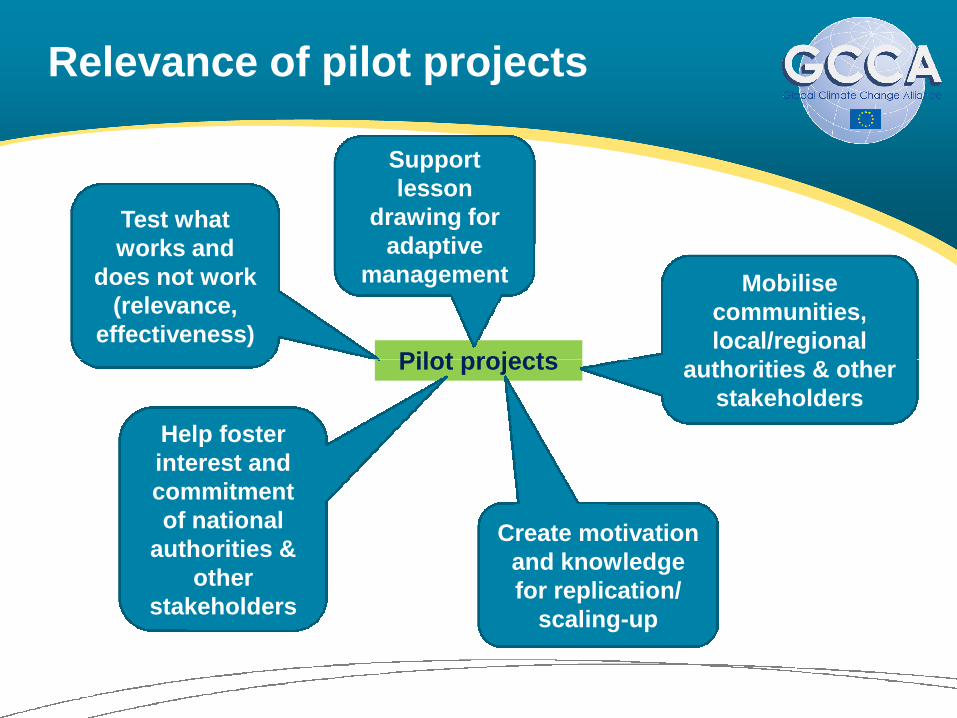
Relevance of pilot projects
Pilot projects
Test whatworks and
does not work(relevance,
effectiveness)
Supportlesson
drawing foradaptive
management Mobilisecommunities,local/regional
authorities & otherPilot projects authorities & otherstakeholders
Help fosterinterest andcommitmentof national
authorities &other
stakeholders
Create motivationand knowledgefor replication/
scaling-up

References (1)
• Dervis K., Jones A., Kornbluh K. & Puritz, S. (2009) Climate Crisis, Credit Crisis: The Quest forGreen Growth. Brookings Blum Roundtable 2009 report. The Brookings Institution, Washington,DC. Available from: http://www.brookings.edu/reports/2010/0422_climate_change_poverty.aspx
• Downing T. & Patwardhan A. (2004) Assessing Vulnerability for Climate Adaptation. In: Lim B. &Spanger-Siegfried E. (eds.) (2004) Adaptation Policy Frameworks for Climate Change:Developing Strategies, Policies and Measures. United Nations DevelopmentProgramme/Cambridge University Press, New York. Available from:Programme/Cambridge University Press, New York. Available from:http://www.undp.org/climatechange/adapt/apf.html
• Economics of Climate Adaptation Working Group (2009) Shaping climate-resilient development: aframework for decision-making. Climate Works Foundation, Global Environment Facility,European Commission, McKinsey & Company, The Rockfeller Foundation, Standard CharteredBank & Swiss Re. Available from:http://www.mckinsey.com/clientservice/Social_Sector/our_practices/Economic_Development/Knowledge_Highlights/Economics_of_climate_adaptation.aspx
• Elrick C. & Kay R. (2009a) Risk Assessment Handbook: A methodology for Coastal Hazard RiskDiagnosis for the Republic of Kiribati, Volume II. Prepared for Kiribati Adaptation Project Phase II(KAP II), Government of Kiribati. Available from:http://www.climate.gov.ki/Kiribati_climate_change_strategies.html#apm1_2
47

References (2)
• Herzog T. (2005) World Greenhouse Gas Emissions in 2005. Working paper, World ResourcesInstitute, Washington, DC. Available from: http://www.wri.org/publication/world-greenhouse-gas-emissions-in-2005
• IPCC (2007c) Climate Change 2007: Impacts, Adaptation and Vulnerability. Contribution ofWorking Group II to the Fourth Assessment Report of the Intergovernmental Panel on ClimateChange [Parry M.L., Canziani O.F., Palutikof J.P., van der Linden P.J. & Hanson C.E. (eds.)].Cambridge University Press, Cambridge, UK & New York, NY, USA. Available from: www.ipcc.chCambridge University Press, Cambridge, UK & New York, NY, USA. Available from: www.ipcc.ch
• McGray H., Hammill A. & Bradley R. (2007) Weathering the Storm: Options for FramingAdaptation and Development. World Resources Institute, Washington, DC. Available from:http://pdf.wri.org/weathering_the_storm.pdf
• McKinsey & Company (2009) Pathways to a Low-Carbon Economy: Version 2 of the GlobalGreenhouse Gas Abatement Cost Curve. Available from:http://www.mckinsey.com/globalGHGcostcurve
• OECD (2009) Integrating Climate Change Adaptation into Development Co-operation: Policyguidance. OECD Publishing, Paris. [Read-only, browse-it edition] Available from:http://browse.oecdbookshop.org/oecd/pdfs/browseit/4309171E.PDF
48

References (3)
• OECD (2010b) Interim Report of the Green Growth Strategy: Implementing our commitment for asustainable future. Meeting of the OECD Council at Ministerial Level, 27-28 May 2010.C/MIN(2010)5. Organisation for Economic Cooperation and Development, Paris. Available from:http://www.oecd.org/document/3/0,3343,en_2649_37465_45196035_1_1_1_1,00.html
• Olhoff A. & Schaer C. (2010) Screening tools and guidelines to support the mainstreaming ofclimate change adaptation into development assistance: A stocktaking report. Environment &climate change adaptation into development assistance: A stocktaking report. Environment &Energy Group, United Nations Development Programme, New York. Available from:http://www.undp.org/climatechange/library_integrating_cc.shtml
• Schipper E.L., Paz Cigarán M. & McKenzie Hedger M. (2008) Adaptation to Climate Change: Thenew challenge for development in the developing world. Environment & Energy Group, UnitedNations Development Programme, New York. Available from:http://www.undp.org/climatechange/docs/English/UNDP_Adaptation_final.pdf
• UNDP-UNEP (2010) Mainstreaming Adaptation to Climate Change into Development Planning: AGuidance Note for Practitioners. Draft version. UNDP-UNEP Poverty-Environment Initiative. Finalversion available from: http://www.unpei.org/knowledge-resources/publications.html
• World Bank (2010) Development and Climate Change. World Development Report 2010. WorldBank, Washington, DC. Available from: http://go.worldbank.org/ZXULQ9SCC0
49

Module 4
Strengthening institutions and
capacities
Global Climate Change AllianceSupport Facility
Training workshops onmainstreaming climate change
Key topics covered by this module
• Institutional aspects of mainstreaming
• The ‘ideal’ institutional setup for climate changemainstreaming
• Tools for supporting institutional and capacity• Tools for supporting institutional and capacitystrengthening

Institutional aspects of mainstreamingInstitutional aspects of mainstreaming
Main source: Dalal-Clayton & Bass (2009)

Terminology
• Institutions
– the rules, norms, structures and other social arrangementsthat shape and regulate human behaviour andinteractions, and notably support decision making
– institutions ≠ organisations
– institutions can be formal or informal
• Institutional framework
– a system made up of rules, laws, policies and institutions– in which various organisations interact with each other

Key constraints to environmental(& climate change) mainstreaming
• Lack of political will for change
• Lack of understanding and awareness
– Lack of data, institutions, capacities & resources todevelop a good understanding of environment & climate–development linkagesdevelopment linkages
• The prevailing development paradigm
– Focus on GDP, consideration of environment (andclimate) as institutional and economic ‘externalities’
• Competing needs and priorities
The principal challenge is to improve governance
Long-term societal/institutional change endeavour

Key institutional requirementsfor effective mainstreaming
Effective
Cross-sectoral& cross-levelcoordination,cooperation
Powerfulchampions atnational level Integration of
new thinking,new researchin planning &monitoring
e.g. Office of PrimeMinister, Ministries of
Finance/Budget/Planning
Effectivemainstreaming
monitoringsystems &processes
Experiencesharing,
disseminationof good
practices Timelystakeholder
participation atvarious scales
Strengtheningof capacities ofstakeholders atvarious scales

Strengthening stakeholdercapacities
Stakeholder
Informationsystems &analytical
skills
Planning &prioritisation
skillsParticipatory
engagement &empowerment
skillsStakeholder
capacitybuilding
skills
Political &communication
skills
Monitoring,evaluation &
learning skills
Specifictechnical
skills

Roles & responsibilities ofmain stakeholders
Stakeholder group Main roles & responsibilities
Central government (incl. Officeof Prime Minister, Ministries ofFinance/Budget/Planning, ...)
Leadership, performance mgnt frameworksPolicies, standards & regulationsAllocation of budget resourcesGuidance & capacity building
Local governments Implementation of national policiesIntegration with community strategiesIntegration with community strategies
Private sector Preparation for losses & opportunities, risk mngtContribution to sustainable investments &vulnerability reduction through development
Scientific & academicorganisations
Policy-oriented researchSupport for decision making
Investment promotion agencies Climate-proofing of investments, bridging of dvptgaps
Poverty reduction organisations Climate change adequately addressed
Adapted from: Schipper et al (2008)

Challenges associated withstakeholder participation
• Different meanings & approaches
– Continuum from superficial consultation to trueparticipation in planning, decision making, monitoring
• In many countries, lack of experience ofstakeholder consultation and engagementstakeholder consultation and engagement
• Time and resource requirements:
– True stakeholder engagement requires time andfinancial resources, especially at grassroots level
– For participation to be meaningful, disadvantaged andother groups may need special trust & capacity building
• Conflicting interests may paralyse processes

Benefits of stakeholderparticipation
• Better information and insight
– e.g. about autonomous adaptation strategies, acceptabilityand feasibility of adaptation & mitigation measures
• Raised awareness and capacity building• Raised awareness and capacity building
• Increased ownership and empowerment
– Likely to increase the feasibility and effectiveness ofselected options and their long-term cost-effectiveness
• More balanced, equitable and consensual solutions
• Increased transparency and accountability
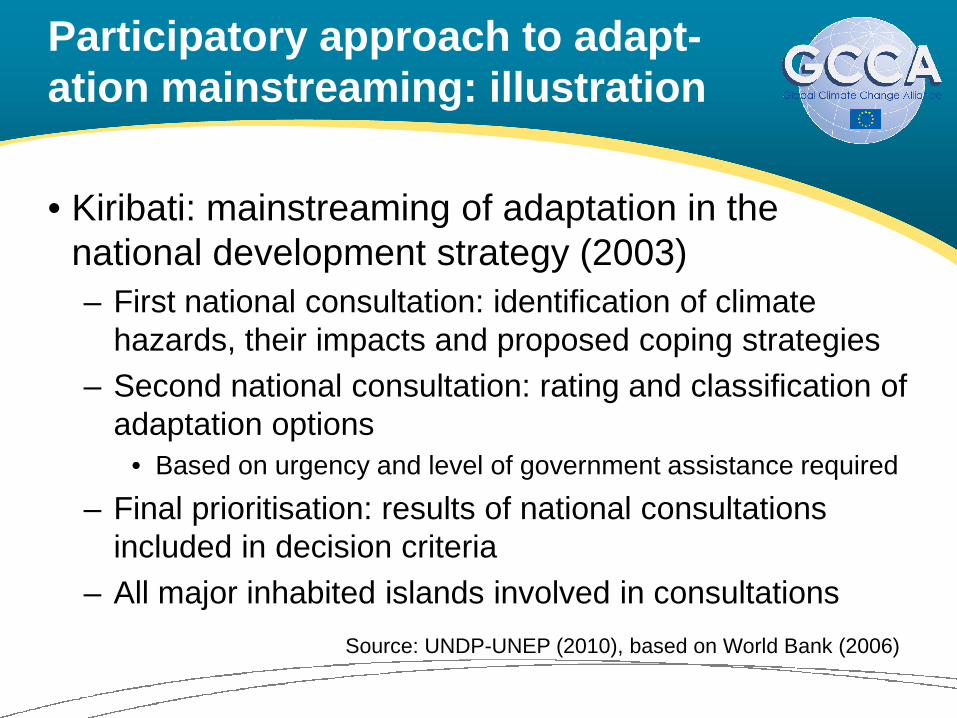
Participatory approach to adapt-ation mainstreaming: illustration
• Kiribati: mainstreaming of adaptation in thenational development strategy (2003)
– First national consultation: identification of climatehazards, their impacts and proposed coping strategies
– Second national consultation: rating and classification ofadaptation options
• Based on urgency and level of government assistance required
– Final prioritisation: results of national consultationsincluded in decision criteria
– All major inhabited islands involved in consultations
Source: UNDP-UNEP (2010), based on World Bank (2006)

The ‘ideal’ institutional setup
for mainstreaming climate change
Source: UNDP-UNEP (2010)
The ‘ideal’ institutional setup
• There is no single, ‘blueprint’ institutional modelfor effective mainstreaming of climate change
– Each country has to determine the most suitableinstitutional arrangements based on:institutional arrangements based on:
• current institutional structures
• a clear diagnosis of their strengths and weaknesses
• a clear plan for overall governance improvement
• However, there are some agreed principles andexamples of good practice

Principles for successful inst’l& capacity strengthening (1)
• Move coordination of climate adaptation/mitigationto a central body with a coordination mandate anddecision-making power over line ministries
– e.g. China: National Development and Reform– e.g. China: National Development and ReformCommission
– e.g. Kenya: Office of the President
• Establish or strengthen coordination mechanisms,with a clear allocation of responsibilities andpermanent arrangements
– e.g. Mexico: Inter Ministerial Commission on ClimateChange (CICC) with dedicated working groups

Principles for successful inst’l& capacity strengthening (2)
• Build on pre-existing intersectoral coordinationmechanisms wherever possible
– e.g. coordination structures for food security, disaster riskreduction and management, sustainable landmanagement, environmental management
• Institutionalise flexibility
– e.g. commitment to regular policy/strategy revisions andreassessment of available knowledge
• Institutionalise adaptation/mitigation mainstreaming
– e.g. in guidelines, procedures, systems, criteria forscreening and prioritising programmes and projects

Principles for successful inst’l& capacity strengthening (3)
• Develop effective national-local coordinationmechanisms, identifying the most suitable level atwhich to cooperate/coordinate
– e.g. Rwanda: annual performance contracts between– e.g. Rwanda: annual performance contracts betweenvarious levels of government, with clear definition of goals,indicators and activities
• Strengthen institutions at the sub-national level,matching the transfer of competences with thetransfer of resources

Tools for supporting institutional and capacity
strengthening

Tools for supporting institutionaland capacity strengthening (1)
• National capacity self-assessments
– Based on identified vulnerabilities and existinginstitutional assessments (where available), consider forall relevant organisations:
• Level of education and awareness of climate variability & change• Level of education and awareness of climate variability & change
• Organisations’ mandates & functions w/ regard to climate-relatedissues
• Influence of climate risks on organisations’ capacity to function
• Technical, financial, legal/regulatory capacities & informationsystems in relation to climate-related issues
• Planning, decision-making, budget allocation and programmingmechanisms
• Collaboration and coordination structures & mechanisms
Source: UNDP-UNEP (2010)

Tools for supporting institutionaland capacity strengthening (2)
• National capacity self-assessments (cont’d):
– Expected output: a ‘baseline report’, allowing the trackingof progress and achievements as a result of themainstreaming process
• Knowledge-sharing tools• Knowledge-sharing tools
– e.g. Adaptation Learning Mechanism(www.adaptationlearning.net)

Discussion: Institutional and capacity
strengthening in the Pacific region
References
• Dalal-Clayton B. & Bass S. (2009) The challenges of environmental mainstreaming: experience ofintegrating environment into development institutions and decisions. International Institute forEnvironment and Development, London. Available from: http://www.environmental-mainstreaming.org/key-lit.html
• Schipper E.L., Paz Cigarán M. & McKenzie Hedger M. (2008) Adaptation to Climate Change: Thenew challenge for development in the developing world. Environment & Energy Group, UnitedNations Development Programme, New York. Available from:Nations Development Programme, New York. Available from:http://www.undp.org/climatechange/docs/English/UNDP_Adaptation_final.pdf
• UNDP-UNEP (2010) Mainstreaming Adaptation to Climate Change into Development Planning: AGuidance Note for Practitioners. Draft version. UNDP-UNEP Poverty-Environment Initiative. Finalversion available from: http://www.unpei.org/knowledge-resources/publications.html
21