Embed Size (px)
Citation preview

Australia
AutomotiveStatistics
A U S T R A L I A
Automoti
Key Automotive Statistics —
Australia
KEY

© Commonwealth of Australia 1999
This work is copyright. Apart from any use as permitted under the Copyright Act 1968, no part may bereproduced by any process without prior written permission from the Commonwealth available throughAusinfo. Requests and inquiries concerning reproduction and rights should be addressed to the Manager,Legislative Services, Ausinfo, GPO Box 1920, Canberra ACT 2601.
Design: Big Island Graphics
ISBN 0 642 72032 0
ISR 1999/143

Australian Automotive Industry
3
Acknowledgments The Commonwealth Department of Industry, Science and Resources undertook asurvey in 1999 of firms in the automotive sector. The information contained in thisreport is sourced from the survey returns and from other organisations that collectautomotive industry data including:
• Australian Automotive Intelligence Report
• Australian Bureau of Statistics
• Australian Customs Service
• Automotive Research and Marketing Services
• Federal Chamber of Automotive Industries (VFACTS service) and
• Federation of Automotive Products Manufacturers
This report is published by the Automotive Industry Section of the Department and isavailable on the web at www.isr.gov.au/industry/auto. Please contact Phillip Dunne byphoning (02) 6213 7631 or e-mailing [email protected] for any queries.

Australian Automotive Industry
4
ContentsGlossary 6
Motor Vehicle Classifications and Definitions 8
Key indicators for 1998 9
1. The Australian vehicle market 11
1.1 The economic context 11
The economy in 1998 11
Vehicle prices and affordability 11
1.2 Retail sales - total market overview 12
Australian made and imported shares of total vehicle market 12
Fleet and private shares of total vehicle market 14
Vehicle producers' shares of total vehicle market 14
1.3 Passenger motor vehicle sales 15
Australian made and imported PMV shares 15
Fleet and private PMV shares 16
Vehicle producers' PMV shares 16
1.4 Commercial vehicle sales 17
Australian made and imported shares of commercial vehicle market 17
Fleet and private sales of commercial vehicle market 18
Vehicle producers' shares of commercial vehicle market 18
2. Australian automotive production 19
2.1 PMVs and derivatives 19
Production volumes 19
Value of production 20
Local content 21
Quality 21
2.2 Component manufacturers 22

3. Australian automotive trade 23
3.1 Exports 23
Exports by country 23
CBU exports of PMVs 24
Component exports 24
3.2 Imports 25
Imports by country 25
CBU imports of PMVs 26
Component imports 26
4. Employment and productivity 27
4.1 Automotive industry employment 27
PMV producers 27
Employment in other parts of the industry 28
4.2 Industrial relations 28
4.3 Productivity 28
5. Profitability, Investment and R&D of Vehicle producers 29
5.1 Profitability 29
5.2 Investment 30
5.3 Research and development 30
Appendix A. - Compendium of statistics 31
Australian Automotive Industry
5

GlossaryAAIR Australian Automotive Intelligence Report
ABS Australian Bureau of Statistics
ACS Australian Customs Service
AHECC Australian Harmonised Export Commodity Classification
AIA Automotive Industry Authority
AMC Automotive Manufacturing Council
ANZSIC Australia New Zealand Standard Industrial Classification
APEC Asia Pacific Economic Co-operation Forum (Australia, BruneiDarussalam, Canada, Chile, People's Republic of China, Hong Kong -China, Indonesia, Japan, Republic of Korea, Malaysia, Mexico, NewZealand, Papua New Guinea, Republic of the Philippines, Republic ofPeru, Russian Federation, Singapore, Chinese Taipei, Thailand, UnitedStates of America, Vietnam.)
ARMS Automotive Research and Marketing Services
ASIC Australian Standard Industrial Classification
ASEAN The Association of Southeast Asian Nations (Thailand, Indonesia,Singapore, Malaysia, the Philippines, Brunei Darussalam, Vietnam,Laos, Myanmar and Cambodia.)
Car Parc Total number of vehicles on register
CBU Completely Built Up (assembled vehicle)
C/C Cab Chassis
CKD Completely Knocked Down (unassembled vehicle)
CPI Consumer Price Index
CV Commercial Vehicle
DFA Duty Free Allowance
DISR Department of Industry, Science and Resources
EFS Export Facilitation Scheme
EU European Union (Belgium, Denmark, Germany, Greece, Spain,France, Ireland, Italy, Luxembourg, the Netherlands, Austria,Portugal, Finland, Sweden and the United Kingdom)
FAPM Federation of Automotive Products Manufacturers
FCAI Federal Chamber of Automotive Industries
FOB Free on Board (Term used to describe the total costs incurred inplacing goods on board a vessel at the port of export, including suchcosts as inland freight)
Australian Automotive Industry
6

GDP Gross Domestic Product
GMH General Motors-Holden’s
GVM Gross Vehicle Mass
HCV Heavy Commercial Vehicle
LCV Light Commercial Vehicle
n.e.s. Not elsewhere specified
NAFTA North American Free Trade Agreement (USA, Canada & Mexico)
OE Original Equipment
PAXUS A private firm that provided vehicle registration statistics to theautomotive industry until 1993
PMV Passenger Motor Vehicle
PU/CC Pick Up/Cab Chassis
R&D Research and Development
SOIR State of the Australian Automotive Industry Report
TCO Tariff Concession Order
TCS Tariff Concession System
VFACTS Vehicle retail sales statistics provided by the FCAI
VOP Value of Production
YTD Year to Date
4WD (& 4X4) Four Wheel Drive
Australian Automotive Industry
7

Motor Vehicle Classification and definitions
Australian Automotive Industry
8
TOTAL VEHICLE MARKET
Passenger Light Commercial Heavy Commercial Motor Vehicles (PMVs) Vehicles (LCVs) Vehicles (HCVs)
Light Passenger car, hatch or sedan 3 or Light Buses 8 Seater plus, gross vehicle mass Trucks 3,501 - 4 cyl, up to 1400cc <3500kg 7,500 kgs GVM
Small Passenger car, hatch, sedan or wagon, Vans Blind and window vans Trucks 7,501 - 4 cyl, 1401cc - 1900cc 15,000 kgs GVM
Medium Passenger car, hatch, sedan or wagon, All Terrain Four wheel drive, high ground Trucks 15,001 kgs &4 cyl, 1901cc upward wagon clearance, off road wagon Over GVM
Upper Passenger car, hatch, sedan or wagon, Pick-up/ Two driven wheels, normal control Bus 3,501 - Medium 6 cyl or 8 cyl Chassis 4x2 (bonnet), utility, cab chassis and 7,500kgs GVM
crewcabs
People Passenger usage (may incur commercial Pick-up/ Four driven wheels, normal control Bus 7,501 kgs & Movers duty rates), seating capacity > 5 people Chassis 4x4 (bonnet), utility, cab chassis and Over GVM
crewcabs
Sports Coupe or convertible, priced below the Trucks 2.5- Forward control cab, 2.5 to 3.5 luxury tax threshold 3.5 Tonne tonne GVM
Prestige Highly specified passenger cars, hatch, sedan or wagon, priced below the luxury tax threshold
Luxury Highly specified passenger cars, coupe, convertible, hatch, sedan or wagon, priced above the luxury tax threshold
Source: FCAI Indicative Segment Classifications

Australian Automotive Industry
9
Key indicators for 19981998 was a year in which the Australian automotive industry continued to build on thestrong performance of 1997. It was again a record year for vehicle sales while localproduction reached its highest level since 1990 and exports continued to performstrongly.
Another record marketMotor vehicle sales in Australia grew 12% in 1998 to a record 807,669 units -surpassing the previous record set in 1997 by 85,000 units.
The most significant growth occurred in the commercial vehicle sector (up 23%),particularly the all terrain wagons segment (up 35%). The Passenger Motor Vehicle(PMV) sector grew 8%. This included increases in the small car segment (up 10%) andthe upper medium segment (up 9%). The latter segment is dominated by locallyproduced cars.
… in which vehicles continued to become more affordableThe record market was assisted by sustained economic growth, historically lowinflation and interest rates, continued falling vehicle prices and intense domesticcompetition. These factors transpired into a 4% fall in average prices and a 9% rise inaffordability of new vehicles.
A strong export performanceWhile down 5% on a record 1997 year, the export of vehicles, engines andcomponents in 1998 was still a good result. This was particularly so given the impact ofthe economic slow down in Asia on some of our major export markets and was largelyattributable to the continued growth in exports of cars to the Middle East.
… and continued growth in imports.Imports of cars, engines and components grew 23% on 1997 levels, once again led bythe small car and all terrain wagon segments of the market. Imports originating fromJapan are the largest source and have increased 27% over the previous year.
This result reflects the fact that Australia has one of the most open markets in theworld, providing Australians with a wide range of competitively priced vehicles.
The significant growth in imports, coupled with a slight decrease in exports, led to anincreased automotive trade deficit (up 33%), reaching $10.3 billion for the year.
Strong growth in production, Local production of vehicles increased by 11% over 1997 levels and this resulted in thebest performance since 1990. Ford was the only company to introduce a new modelthrough the year. The Australian manufacturers maintained the same share of the PMVmarket (47%) as in 1997.

… employment,The number of people employed in automotive manufacturing, increased slightly over1997 levels.
... and investment.There was a 45% increase in investment by the vehicle manufacturers in the four yearsto 1998 over the preceding four year period. R&D expenditure decreased in 1998. Thismay be attributed to the recent completion of model cycles by all the vehicleproducers.
Increased productivity and profitability.The domestic vehicle producers recorded increases in both productivity and profitabilityon their manufacturing operations, over 1997 levels. A strong and consistentperformance in these indicators is essential in maintaining the momentum necessaryfor the Australian industry to increase its international competitiveness and furtherintegrate into the global market.
Australian Automotive Industry
10

1. The Australian vehicle marketIn 1998, the Australian automotive market continued to build on the strong growth of1997, achieving record sales of 807,669 vehicles.
1.1 The economic context
The economy in 1998The strong performance of the Australian economy in 1998 had a positive impact onthe vehicle market.
Key economic indicators for 1998:
• Gross Domestic Product growth 4.3%
• Employment growth 2.1%
• Wage growth 4.4%
• Inflation 0.9%
• Interest rates 5.0%
Vehicle prices and affordibilityIn 1998, the Consumer Price Index (CPI) for the motor vehicle expenditure class fell by4%. This was a result of falls in the list prices of cars and light commercials and/ormanufacturers and importers improving the specification levels of their cars without acommensurate increase in the price.
Australian Automotive Industry
11
Reference: Table 1 of Appendix A
Figure 1.1 Total retail sales of vehicles
0
100
200
300
400
500
600
700
800
900
1990 1991 1992 1993 1994 1995 1996 1997 1998
Dec
embe
r qu
arte
r
This result was somewhat surprising given the magnitude of the depreciation of theAustralian dollar between 1997 and 1998 (Reference: Table 2 of Appendix A) againstthe $US (-16%), Deutsche Mark (-15%) and Yen (-8%).
However factors which may explain the general decrease in prices include:
• a 24% decrease in the value of the Won against the AUD and the resultantcompetitive pressures which this placed on the domestic market; and
• continuing pressures on vehicle manufacturers to increase sales volumes in the faceof worldwide production over-capacity and over-supply, and decreased demand inAsian countries which faced an economic slowdown.
The 4% fall in vehicle prices, coupled with a 4% increase in average weekly earnings,resulted in a 9 % increase in vehicle affordability (ie. affordability equals averageweekly full time adult total earnings divided by the CPI motor vehicles price index.)
1.2 Retail sales - total market overview1998 saw commercial vehicle sales in Australia grow by 23%, and passenger motorvehicle sales by 8%. Passenger motor vehicles accounted for 72% of the market in1998, down from 75% in 1997.
Australian Automotive Industry
12
Reference: Table 11 of Appendix A
Figure 1.1.1 Affordability of vehicles based upon average earnings and CPI car purchase index
0
20
40
60
80
100
120
1990 1991 1992 1993 1994 1995 1996 1997 1998
Dec
embe
r qu
arte
r

Australian made and imported shares of total vehicle marketSales of Australian made vehicles increased by 7% in 1998. Most significant growthoccurred in the PMV sector (up 8%) while the sale of local commercials increased byless than 1%.
Imported vehicles recorded a 15% increase in sales. This was the result of increases inboth PMV and commercial sales by 8% and 26% respectively.
Australian Automotive Industry
13
Reference: Table 1 of Appendix A
Reference: Table 4 of Appendix A
Figure 1.2.1 Retail sales of passenger and commercial vehicles
0
100
200
300
400
500
600
700
800
900
1990 1991 1992 1993 1994 1995 1996 1997 1998
unit
s th
ousa
nds
Heavy commercial Light commercial Passenger
Figure 1.2.2 Australian made and imported total vehicle shares
0
100
200
300
400
500
600
1990 1991 1992 1993 1994 1995 1996 1997 1998
Uni
ts t
hous
ands
Local Imported
Fleet and private shares of total vehicle marketStrong growth in vehicle sales in 1998 was attributable to growth in both private (up12%) and fleet (up 11%) purchases.
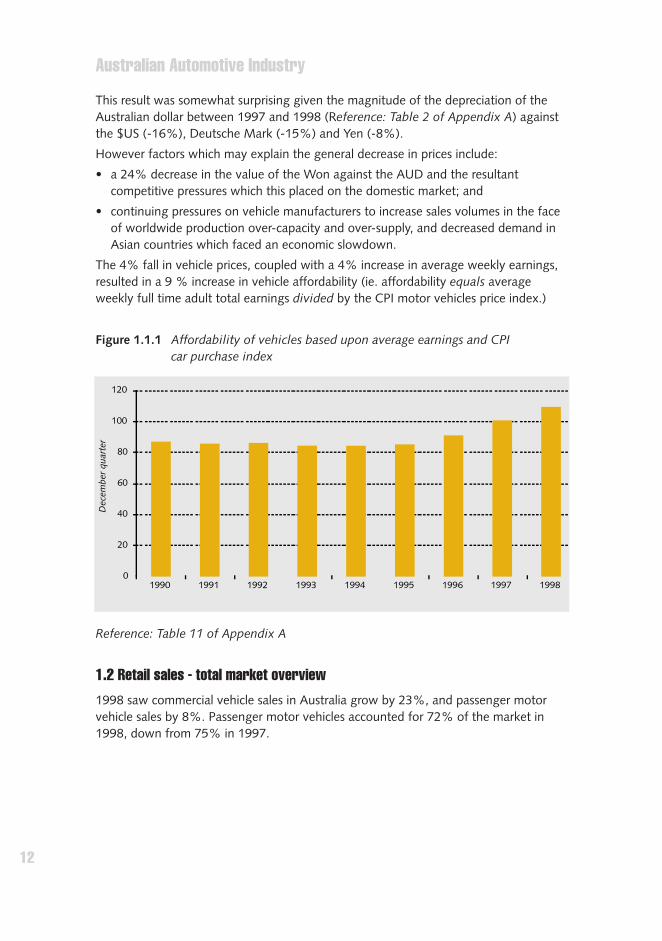
Vehicle producers' shares of total vehicle marketToyota (19.6%) took leadership of the Australian vehicle market in 1998, with Holden(19%) second, Ford (15.9%) slipping to third and Mitsubishi (10.4%) retaining fourth.Toyota's and Holden’s market share rose while Ford's and Mitsubishi’s fell. All fourcompanies are involved in local vehicle production.
Australian Automotive Industry
14
Reference: Table 2 of Appendix A
Figure 1.2.3 Share of total vehicle market by producers
Toyota 20 %
Other 10%
Chrysler 1 %
Subaru 3%
Daewoo 3%
Honda 3%
Mazda 3%
Nissan 6%
Hyundai 7%
Mitsubishi 10%
Holden 19%
Ford 16%
1998

1.3 Passenger motor vehicle salesOverall sales of passenger motor vehicles in 1998 increased by 8% from 1997.Strongest growth was in the small and upper-medium car sectors with 10% and 9%increases respectively. The medium sector grew by 4% and the luxury sector by 1%.The upper medium segment is dominated by local producers.
Australian made and imported PMV sharesSales of imported PMVs continued to display strong growth, up by 8% in 1998. As hasbeen the case in recent years, growth was again strongest in the small car segment,now dominated by 'drive away' pricing policies. The number of imported luxury carsalso increased while the medium and upper medium segments registered small declineson 1997 levels.
Sales of locally manufactured PMVs grew by 8% , the result of strong growth in themedium segment (up 12%) and upper medium segment (up 9%). This was partiallyoffset by decreases in sales of domestically produced small cars and luxury cars.
Australian Automotive Industry
15
Reference: Table 4 of Appendix A
Figure 1.3.1 Australian made and imported PMV shares
0
50
100
150
200
250
300
350
1990 1991 1992 1993 1994 1995 1996 1997 1998
Uni
ts t
hous
ands
Local Imported

Fleet and private PMV sharesFleet and private sales grew steadily between 1997 and 1998, both up by 8%.
Vehicle producers' PMV sharesThe highlights in the PMV market in 1998 included Holden’s increase in sales by 25%and Toyota’s by 24% over 1997 results. Holden regained number one spot from Fordin the PMV market in 1998 with 20.5% of the market compared with 17.7% in 1997.Ford slipped to second position, with its market share dropping from 19.6% in 1997 to18.0% in 1998. Toyota retained third position and increased its market share to 15.3%in 1998, up from 13.4% in 1997. Mitsubishi retained fourth position but its marketshare slipped slightly from 11.9% in 1997 to 10.9% in 1998.
Australian Automotive Industry
16
Reference: Tables 5 and 6 of Appendix A
Reference: Table 3 of Appendix A
Figure 1.3.2 Private and fleet PMV shares
0
50
100
150
200
250
300
350
1990 1991 1992 1993 1994 1995 1996 1997 1998
Uni
ts t
hous
ands
Fleet Private
Figure 1.3.3 Share of PMV market by local producers
0
5
10
15
20
25
1991 1992 1993 1994 1995 1996 1997 1998
Mar
ket
Shar
e (%
)
Ford Holden Mitsubishi Toyota
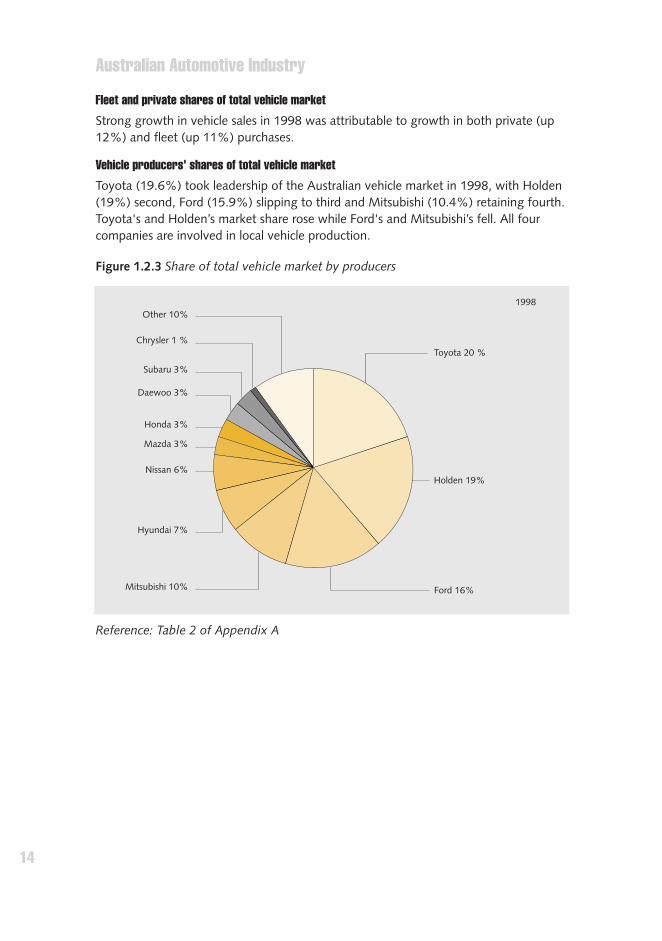
1.4 Commercial vehicles salesLight and heavy commercial vehicle sales showed significant growth from 1997, up23% and 16% respectively. Commercial vehicle sales made up 27.6% of total vehiclesales in 1998, up from 25.2% in 1997. Light commercial vehicles made up 91% oftotal commercial sales in 1998, and heavy commercial vehicles the other 9%. This wasthe same ratio as in 1997.
Australian made and imported shares of commercial vehicle market Sales of imported commercial vehicles continued their strong growth in 1998, up 25% on1997. Sales of locally manufactured commercial vehicles (eg. utes) grew by less than 1%.
Australian Automotive Industry
17
Reference: Table 1 of Appendix A
Reference: Tables 7 and 9 of Appendix A
Figure 1.4.1 Commercial vehicle sector breakup
0
20
40
60
80
100
120
140
160
180
200
220
1990 1991 1992 1993 1994 1995 1996 1997 1998
Uni
ts t
hous
ands
Light commercial vehicles Heavy commercial vehicles
Figure 1.4.2 Australian made and imported commercial vehicle shares
0
25
50
75
100
125
150
175
200
225
1990 1991 1992 1993 1994 1995 1996 1997 1998
Uni
ts t
hous
ands
Local Imported

Fleet and private shares of commercial vehicle marketFleet sales continued to dominate commercial vehicle sales in 1998 although marketshare of fleet sales fell slightly. The market shares of fleet and private sales in 1998were 65% and 35% respectively compared to 68% and 32% in 1997. This increase inprivate sales of commercial vehicles may be explained by the large growth in sales ofall terrain wagons, ie. 4WDs (up 35%).
Vehicle producers' shares of commercial vehicle marketThe commercial market was again dominated by Toyota in 1998, holding 31% of themarket. This was due to its dominance in the light commercial sector of the market(33%). Holden was second, with a 13% share and Ford was third with 11%. Holdinga dominant 24% share of the heavy commercial market, Isuzu ranked tenth overall inthe aggregate commercial market, with a 2% share.
Australian Automotive Industry
18
Reference: Table 8 of Appendix A
Reference: Table 10 of Appendix A
Figure 1.4.3 Fleet and private shares of commercial vehicle market
0
20
40
60
80
100
120
140
160
1990 1991 1992 1993 1994 1995 1996 1997 1998
Uni
ts t
hous
ands
Fleets Private
Figure 1.4.4 Vehicle producers' shares of commercial vehicle market
Toyota 30%
Holden 13%
Ford 11%Nissan 10%
Subaru 4%
Honda 4%
Mitsubishi 9%
Rover 3%
Mazda 3%
Other 13%
Australian Automotive Industry
19
2. Australian automotive production
2.1 PMVs and derivatives
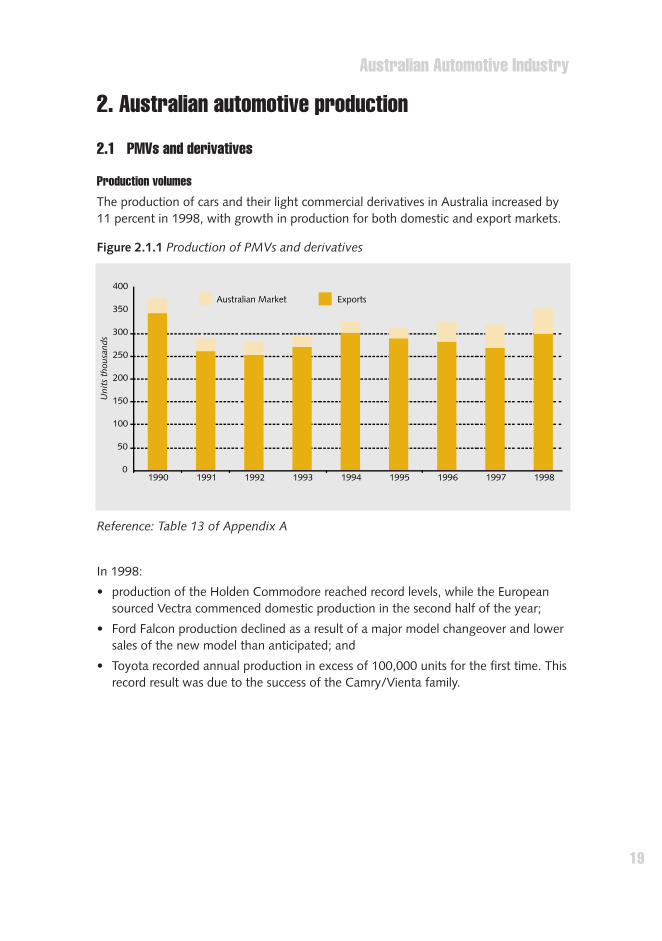
Production volumesThe production of cars and their light commercial derivatives in Australia increased by11 percent in 1998, with growth in production for both domestic and export markets.
In 1998:
• production of the Holden Commodore reached record levels, while the Europeansourced Vectra commenced domestic production in the second half of the year;
• Ford Falcon production declined as a result of a major model changeover and lowersales of the new model than anticipated; and
• Toyota recorded annual production in excess of 100,000 units for the first time. Thisrecord result was due to the success of the Camry/Vienta family.
Reference: Table 13 of Appendix A
Figure 2.1.1 Production of PMVs and derivatives
0
50
100
150
200
250
300
350
400
1990 1991 1992 1993 1994 1995 1996 1997 1998
Uni
ts t
hous
ands
Australian Market Exports

Australian Automotive Industry
20
Value of productionThe value of production (VOP) of PMVs and derivatives increased in line with higherproduction levels in 1998.
Reference: Table 13 of Appendix A
Reference: Table 34 of Appendix A
Figure 2.1.2 Production of PMVs and derivatives by local producers
0
50
100
150
200
250
300
350
400
1990 1991 1992 1993 1994 1995 1996 1997 1998
Uni
ts t
hous
ands
Ford Holden Mitsubishi Toyota
Figure 2.1.3 Value of production
0
1
2
3
4
5
6
7
8
9
1991 1992 1993 1994 1995 1996 1997 1998
Dol
lars
bill
ions

Local contentThe local content of PMVs and their derivatives, as measured by the AdministrativeArrangements, fell slightly in 1998.
QualityThe quality of Australian made cars, as measured by faults reported by private buyersin the first three months of ownership, deteriorated slightly in 1998. The introductionof a new production model can often result in a temporary increase in reported faultsand individual model results suggest that this was the reason for the minor increase.
Australian Automotive Industry
21
Reference: Table 14 of Appendix A
Reference: Tables 15 and 16 of Appendix A
Figure 2.1.4 Local content of Australian vehicles
0
10
20
30
40
50
60
70
80
90
100
1991 1992 1993 1994 1995 1996 1997 1998
Perc
enta
ge
Figure 2.1.5 Owner reported faults, highest and lowest models
0
0.5
1
1.5
2
2.5
3
1990 1991 1992 1993 1994 1995 1996 1997 1998
Ave
rage
num
ber
of f
ault
s
Locally produced Imported

2.2 Component manufacturersData on component sales from a survey by the Federation of Automotive ProductsManufacturers (FAPM) of its members showed an increase of 2.6 percent in 1998,with increases in both domestic and export sales. FAPM data is not as comprehensiveas ABS data and this could explain the discrepancies between their export results.
Australian Automotive Industry
22
Reference: Table 17 of Appendix A
Figure 2.2.1 Sales of components by FAPM member companies
-
1,000
2,000
3,000
4,000
5,000
6,000
7,000
1994 1995 1996 1997 1998
Dol
lars
tho
usan
ds
Domestic Sales Exports

Australian Automotive Industry
23
3. Australian automotive trade3.1 ExportsThe value of exports of Australian made automotive products fell slightly in 1998. Asmall increase in the value of exported motor vehicles was more than offset by adecrease in component exports.
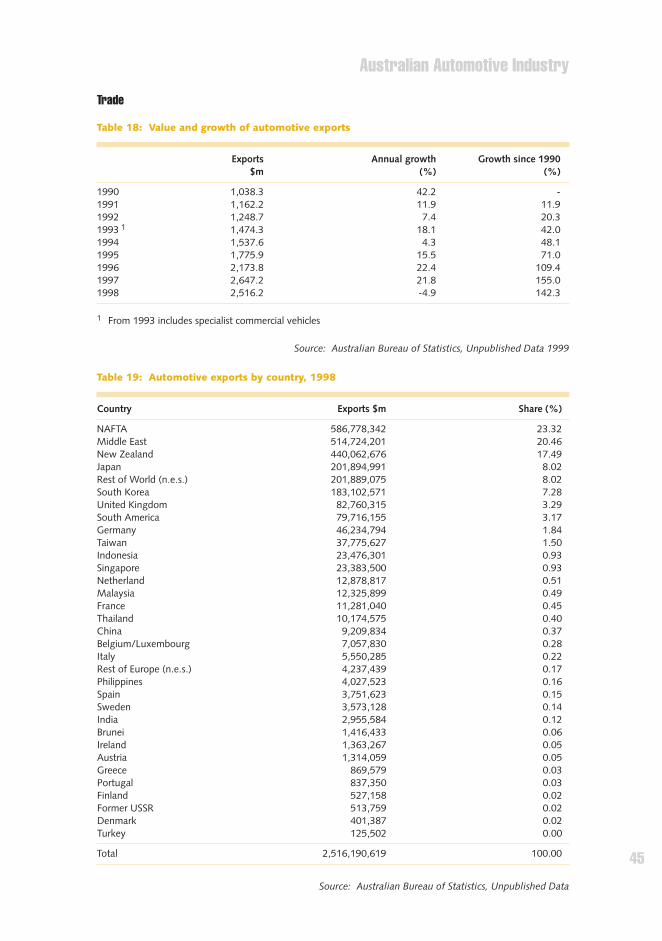
Exports by country1998 exports were down by 5 percent on a record 1997 year. This was mainlyattributable to a significant decline in exports to South Korea, a consequence of theAsian slowdown. However, the magnitude of the decrease was contained by asignificant increase in exports to the Middle East.
Reference: Table 18 of Appendix A
Reference: Table 19 of Appendix A
Figure 3.1.1 Value of automotive exports
500.0
1,500.0
2,000.0
2,500.0
3,000.0
1990 1991 1992 1993 1994 1995 1996 1997 1998
$ m
illio
n
0.0
1,000.0
Figure 3.1.2 Share of value of automotive exports by country
NAFTA 26%
Other 3%
Middle East 22%
New Zealand 19%
Japan 9%
Rest of world 9%
South Korea 8%
United Kingdom 4%

Australian Automotive Industry
24
CBU exports of PMVsThe value of exported CBU PMVs increased slightly in 1998. However the volumedecreased mainly as a result of lower sales to North America. Exports of PMVs to theMiddle East continued to increase strongly in 1998. This was a result of the continuingsuccess of the Toyota Camry and the introduction of the Chevrolet badged HoldenCommodore.
Component exports
The value of aggregate component exports fell slightly from the 1997 record year, dueto lower exports of engines and engine parts.
Reference: Table 20 of Appendix A
Reference: Table 21 of Appendix A
Figure 3.1.3 Exports of CBU PMVs
0
10
20
30
40
50
60
1990 1991 1992 1993 1994 1995 1996 1997 1998
Uni
ts t
hous
ands
Figure 3.1.4 Exports of Components
0
100
200
300
400
500
600
700
800
900
1990 1991 1992 1993 1994 1995 1996 1997 1998
Dol
lars
mill
ions
Other components
Engines Engine parts

3.2 ImportsImports of automotive products continued to grow strongly in 1998, exceeding $12billion. This was up 23 percent increase on the 1997 value. This growth was in linewith record vehicle market sales.
Imports by countryThe significant rise in the value of imports was attributable to a 26 percent increase inimports from both Japan and NAFTA. These countries maintained their relativevolumes despite the depreciation of the Australian dollar.
Australian Automotive Industry
25
Reference: Table 22 of Appendix A
Reference: Table 23 of Appendix A
Figure 3.2.1 Value of automotive imports
-
2
4
6
8
10
12
14
1990 1991 1992 1993 1994 1995 1996 1997 1998
Dol
lars
bill
ions
Figure 3.2.2 Share of value of automotive imports by country
Japan 50%
NAFTA 13%
Germany 11%
South Korea 8%
United Kingdom 4%
Sweden 1%
Other 13%

Australian Automotive Industry
26
CBU imports of PMVsThe value of CBU PMVs imported into Australia in 1998 increased by 13% in responseto the growth in demand for small cars and all terrain wagons (4WDs). Refer to tables25 and 26 for details of CBU PMV market shares by source and segment respectively.
Component importsThe value of imports of automotive components into Australia increased by 22 percentin 1998.
Reference: Tables 24 and 27 of Appendix A
Figure 3.2.3 Value of imports of CBU PMVs and components
0
0.5
1
1.5
2
2.5
3
3.5
4
4.5
5
1990 1991 1992 1993 1994 1995 1996 1997 1998
Dol
lars
bill
ions
Components CBU PMVs

4. Employment and productivity
4.1 Automotive industry employmentAustralian Bureau of Statistics data is the most comprehensive data available for theentire industry. The most recent data relates to the 1997/98 period and indicates thatemployment in automotive manufacturing increased slightly over the previous period.
Vehicle producersA survey by the Department of Industry, Science and Resources indicates thatemployment by car manufacturers increased in 1998. However, this data includesemployees of the former Holden Engine Company for the first time. If these employeeswere excluded, the result would have been very similar to the 1997 level.
Australian Automotive Industry
27
Reference: Table 28 of Appendix A
Figure 4.1.1 Employment in automotive manufacturing
0
10
20
30
40
50
60
70
1989/90 1990/91 1991/92 1992/93 1993/94 1994/95 1995/96 1996/97 1997/98
Empl
oyee
s th
ousa
nds
Motor vehicle manufacturing
Motor vehicle body manufacturing
Automotive electrical and instrument manufacturing
Automotive component manufacturing

Employment in other parts of the industryData from the Federation of Automotive Products Manufacturers survey of members,indicates that employment in the direct manufacture of components increased in 1998from 29,169 to 30,063 people.
4.2 Industrial relationsIndustrial relations data specific to the automotive industry is no longer available fromthe Australian Bureau of Statistics. Therefore the continuation of this data series is nolonger possible.
4.3 ProductivityProductivity in PMV manufacture, as measured by the output of vehicles per employee,increased slightly in 1998. This increase would have been more significant if not for theinclusion of employees of the former Holden Engine Company for the first time.
Australian Automotive Industry
28
Reference: Table 29 of Appendix A
Reference: Table 30 of Appendix A
Figure 4.1.2 Employment by Vehicle producers
0
5
10
15
20
25
30
35
1990 1991 1992 1993 1994 1995 1996 1997 1998
Pers
ons
thou
sand
s
Figure 4.3.1 PMV manufacturer labour productivity (vehicles per employee)
0
2
4
6
8
10
12
14
16
18
1990 1991 1992 1993 1994 1995 1996 1997 1998
Veh
icle
s pe
r em
ploy
ee
5. Profitability, Investment and R&D of Vehicle producers
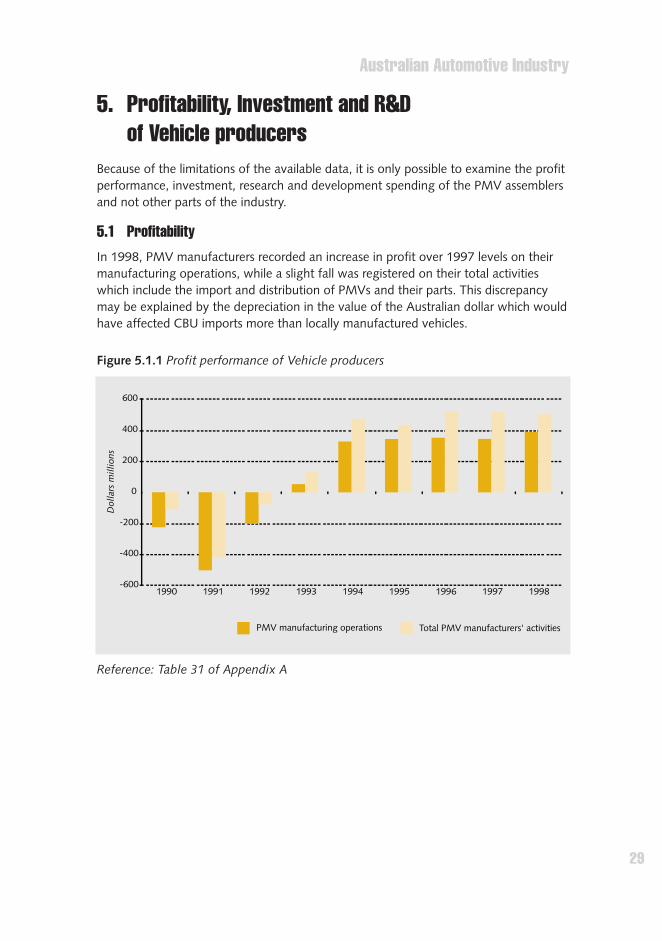
Because of the limitations of the available data, it is only possible to examine the profitperformance, investment, research and development spending of the PMV assemblersand not other parts of the industry.
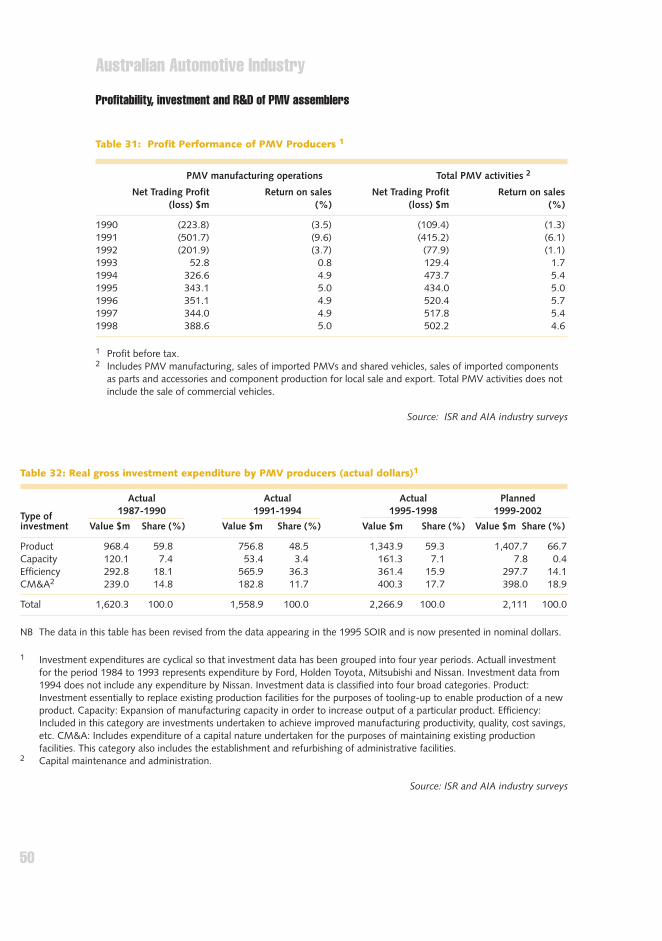
5.1 ProfitabilityIn 1998, PMV manufacturers recorded an increase in profit over 1997 levels on theirmanufacturing operations, while a slight fall was registered on their total activitieswhich include the import and distribution of PMVs and their parts. This discrepancymay be explained by the depreciation in the value of the Australian dollar which wouldhave affected CBU imports more than locally manufactured vehicles.
Australian Automotive Industry
29
Reference: Table 31 of Appendix A
Figure 5.1.1 Profit performance of Vehicle producers
-600
-400
-200
0
200
400
600
1990 1991 1992 1993 1994 1995 1996 1997 1998
Dol
lars
mill
ions
PMV manufacturing operations Total PMV manufacturers' activities

5.2 InvestmentInvestment by the four PMV manufacturers in their manufacturing activities increased inthe four years to 1998. However, a slight decrease is forecast for the four years to 2002.This decrease could be a result of all four PMV manufacturers having recently releasednew models, while model cycles usually extend to periods in excess of four years.
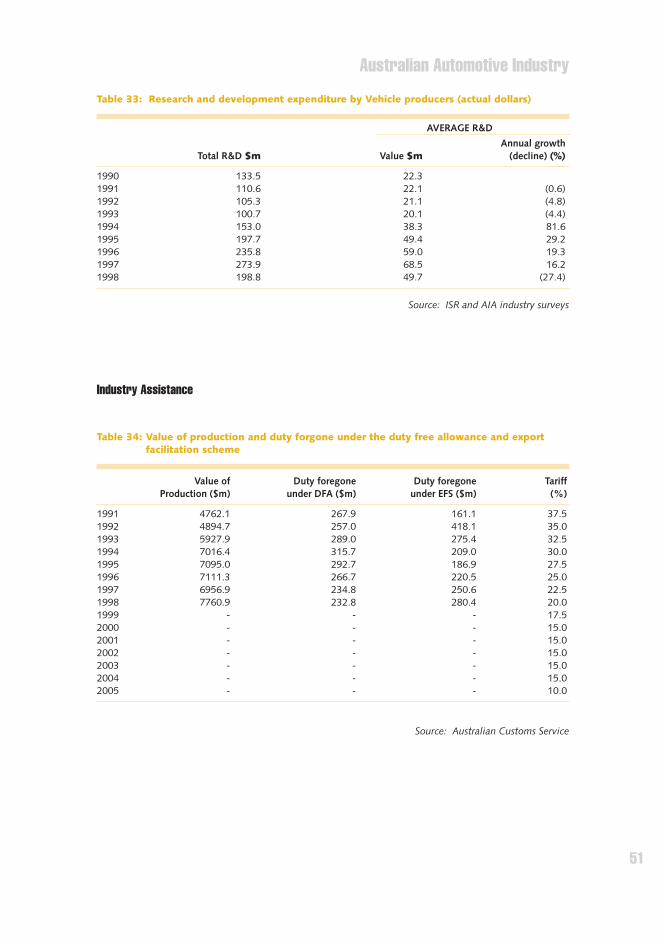
5.3 Research and developmentAfter four years of substantial growth in research and development expenditure by thePMV manufacturers, a decrease was reported in 1998. This may be attributed to thecompletion of major model releases by all the manufacturers by the end of 1998.
Australian Automotive Industry
30
Reference: Table 32 of Appendix A
Reference: Table 33 of Appendix A
Figure 5.2.1 Investment expenditure by Vehicle producers, actual and planned
0
500
1000
1500
2000
2500
1987-1990Actual
1991-1994Actual
1995-1998Actual
1999-2002Planned
Dol
lars
mill
ions
Figure 5.3.1 Research and development expenditure by Vehicle producers
0
50
100
150
200
250
300
1990 1991 1992 1993 1994 1995 1996 1997 1998
Dol
lars
mill
ions

Appendix A

Australian Automotive Industry
32
Compendium of statistics
Retail sales and market shares
Table 1: New motor vehicleregistrations/retail sales —market shares by market sectors
Table 2: Total market shares byproducer
Table 3: Local vehicle producers’ PMVmarket shares
Table 4: New passenger motor vehicleretail sales — market sharesand local/import split
Table 5: New PMV sales by type ofpurchaser
Table 6: New PMV sales volumes bymarket sectors and type ofpurchaser
Table 7: Sales volumes and market shares— commercial vehicle sector
Table 8: New CV sales volumes by typeof purchaser
Table 9: Sales volumes and marketshares of locally produced andimported CVs
Table 10: Share of CV market by producer
Price indices and exchange ratesTable 11: Quarterly index of car prices,
consumer prices, averageweekly earnings and caraffordability
Table 12: Value of Australian DollarRelative to Various Currencies
Production and QualityTable 13: Production of locally produced
PMVsTable 14: Local content by model
groupingTable 15: Quality performance of models
in local production during 1998Table 16: Owner-Reported Faults, Locally
Produced and Imported CarsTable 17: Sales of components by FAPM
member companies
TradeTable 18: Value and growth of
automotive exportsTable 19: Automotive exports by countryTable 20: Exported CBU PMVs and their
FOB valueTable 21: Australian export of
componentsTable 22: Value and growth of
automotive importsTable 23: Automotive imports by countryTable 24: Imports of CBU PMVs and
their FOB valueTable 25: Imported CBU PMVs by sourceTable 26: Imported PMV share of new
PMV market by segmentTable 27: Imports of components
Employment and productivityTable 28: Automotive industry
employmentTable 29: Employment by PMV
ProducersTable 30: PMV producers productivity
(cars per employee)
Profitability, investment and R&D of PMVassemblersTable 31: Profit Performance of PMV
producersTable 32: Real gross investment
expenditure by PMV producersTable 33: Research and development
expenditure by PMV producers
Industry AssistanceTable 34: Value of production and duty
forgone under the DFA andEFS / Tariff rates

Australian Automotive Industry
33
Table 1: New motor vehicle registrations/retail sales — market shares by market sectors
Passenger Light commercial Heavy commercial Total vehiclesUnits (%) Units (%) Units (%) Units (%)
1990 464,630 75.3 132,406 21.4 20,262 3.3 617,298 100.01991 391,529 76.1 109,894 21.3 13,143 2.6 514,566 100.01992 406,427 75.0 121,089 22.3 14,561 2.7 542,077 100.01993 414,425 74.6 125,978 22.7 14,903 2.7 555,306 100.01994 460,698 74.7 137,252 22.3 18,336 3.0 616,286 100.01995 488,372 76.0 136,449 21.2 17,736 2.8 642,557 100.01996 492,058 75.7 142,830 22.0 15,161 2.3 650,049 100.01997 540,353 74.8 165,711 22.9 16,578 2.3 722,642 100.01998 584,360 72.4 203,941 25.3 19,368 2.4 807,669 100.0
Sources: VFACTS, Vehicle Retail Sales
Table 2: Total market shares by producer
Market shares (%)1991 1992 1993 1994 1995 1996 1997 1998
Toyota 21.3 20.1 21.9 20.6 18.8 18.6 17.4 19.6Holden 16.3 17.4 17.4 18.8 19.2 19.2 16.6 19.0Ford 20.5 19.9 20.9 20.3 21.5 20.3 18.0 15.9Mitsubishi 11.4 12.8 13.7 12.2 10.1 9.4 11.4 10.4Hyundai 2.0 2.3 3.0 4.0 5.4 7.5 8.3 7.1Nissan 9.8 7.0 4.7 4.1 3.7 3.9 4.5 5.7Mazda 4.6 5.7 4.6 5.0 4.4 4.1 4.3 3.4Honda 2.3 2.3 2.3 2.6 2.2 2.5 2.4 3.2Daewoo 0.0 0.0 0.0 0.4 1.8 2.0 2.3 2.7Subaru 2.8 2.7 1.8 1.4 1.2 1.3 2.0 2.5Chrysler 0.0 0.0 0.0 0.2 0.8 1.2 1.4 0.7Other 9.0 9.7 9.6 10.5 10.9 10.0 11.4 9.8
TOTAL 100.0 100.0 100.0 100.0 100.0 100.0 100.0 100.0
Sources: VFACTS, Vehicle Retail Sales
Table 3: Local vehicle producers' PMV market shares
Market shares (%)1991 1992 1993 1994 1995 1996 1997 1998
Holden 18.2 19.5 19.8 21.5 21.3 20.9 19.6 20.5Ford 23.3 22.9 24.4 22.9 24.3 22.8 17.7 18.0Toyota 17.9 16.1 17.0 15.7 14.2 13.8 13.4 15.3Mitsubishi 10.2 11.6 13.0 11.9 9.6 9.3 11.9 10.9Other 30.4 29.9 25.8 28.0 30.6 33.2 37.4 35.3
TOTAL 100.0 100.0 100.0 100.0 100.0 100.0 100.0 100.0
Sources: VFACTS, Vehicle Retail Sales
Australian Automotive Industry
34
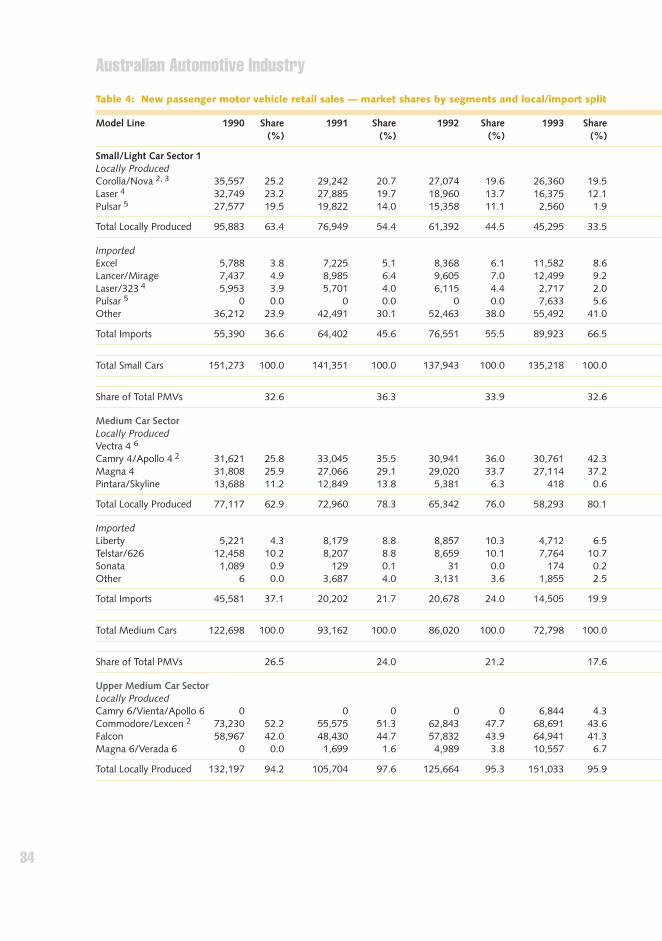
Table 4: New passenger motor vehicle retail sales — market shares by segments and local/import split
Model Line 1990 Share 1991 Share 1992 Share 1993 Share (%) (%) (%) (%)
Small/Light Car Sector 1Locally ProducedCorolla/Nova 2, 3 35,557 25.2 29,242 20.7 27,074 19.6 26,360 19.5Laser 4 32,749 23.2 27,885 19.7 18,960 13.7 16,375 12.1Pulsar 5 27,577 19.5 19,822 14.0 15,358 11.1 2,560 1.9
Total Locally Produced 95,883 63.4 76,949 54.4 61,392 44.5 45,295 33.5
ImportedExcel 5,788 3.8 7,225 5.1 8,368 6.1 11,582 8.6Lancer/Mirage 7,437 4.9 8,985 6.4 9,605 7.0 12,499 9.2Laser/323 4 5,953 3.9 5,701 4.0 6,115 4.4 2,717 2.0Pulsar 5 0 0.0 0 0.0 0 0.0 7,633 5.6Other 36,212 23.9 42,491 30.1 52,463 38.0 55,492 41.0
Total Imports 55,390 36.6 64,402 45.6 76,551 55.5 89,923 66.5
Total Small Cars 151,273 100.0 141,351 100.0 137,943 100.0 135,218 100.0
Share of Total PMVs 32.6 36.3 33.9 32.6
Medium Car SectorLocally ProducedVectra 4 6
Camry 4/Apollo 4 2 31,621 25.8 33,045 35.5 30,941 36.0 30,761 42.3Magna 4 31,808 25.9 27,066 29.1 29,020 33.7 27,114 37.2Pintara/Skyline 13,688 11.2 12,849 13.8 5,381 6.3 418 0.6
Total Locally Produced 77,117 62.9 72,960 78.3 65,342 76.0 58,293 80.1
ImportedLiberty 5,221 4.3 8,179 8.8 8,857 10.3 4,712 6.5Telstar/626 12,458 10.2 8,207 8.8 8,659 10.1 7,764 10.7Sonata 1,089 0.9 129 0.1 31 0.0 174 0.2Other 6 0.0 3,687 4.0 3,131 3.6 1,855 2.5
Total Imports 45,581 37.1 20,202 21.7 20,678 24.0 14,505 19.9
Total Medium Cars 122,698 100.0 93,162 100.0 86,020 100.0 72,798 100.0
Share of Total PMVs 26.5 24.0 21.2 17.6
Upper Medium Car Sector Locally ProducedCamry 6/Vienta/Apollo 6 0 0 0 0 0 6,844 4.3Commodore/Lexcen 2 73,230 52.2 55,575 51.3 62,843 47.7 68,691 43.6Falcon 58,967 42.0 48,430 44.7 57,832 43.9 64,941 41.3Magna 6/Verada 6 0 0.0 1,699 1.6 4,989 3.8 10,557 6.7
Total Locally Produced 132,197 94.2 105,704 97.6 125,664 95.3 151,033 95.9

Australian Automotive Industry
35
1994 Share 1995 Share 1996 Share 1997 Share 1998 Share(%) (%) (%) (%) (%)
24,830 17.1 26,020 15.2 24,452 13.3 22,348 9.8 21,889 8.711,490 7.9 0 0 0 0 0 0 0 0
0 0 0 0 0 0 0 0 0 0
36,320 25.0 26,020 15.2 24,452 13.3 22,348 9.8 21,889 8.7
17,107 11.8 25,928 15.2 35,308 19.3 38,489 16.9 44,018 17.512,098 8.3 12,091 7.1 12,489 6.8 21,669 9.5 26,715 10.610,018 6.9 18,567 10.8 15,398 8.4 19,262 8.4 19,450 7.7
7,771 5.3 6,213 3.6 7,814 4.3 14,114 6.2 19,835 7.962,192 42.7 82,313 48.1 87,916 47.9 112,296 49.2 119,482 47.5
109,186 75.0 145,112 84.8 158,925 86.7 205,830 90.2 229,500 91.3
145,506 100.0 171,132 100.0 183,377 100.0 228,178 100.0 251,389 100.0
31.6 35.0 37.3 42.2 43.0
2375 4.633,177 44.3 29,015 45.0 23,479 45.2 19,782 40.3 23,387 45.624,828 33.1 16,619 25.8 10,209 19.7 5,916 12.0 3,099 6.0
0 0 0 0 0 0 0 0 0 0
58,005 77.4 45,634 70.8 33,688 64.9 25,698 52.3 28,861 56.3
5,039 6.7 5,461 8.5 4,094 7.9 4,353 8.9 4,568 8.95,281 7.0 2,671 4.1 1,467 2.8 3,260 6.6 4,868 9.52,648 3.5 2,969 4.6 4,615 8.9 5,772 11.7 3,109 6.13,984 5.3 7,702 12.0 8,061 15.5 10,056 20.5 9,835 19.2
16,952 22.6 18,803 29.2 18,237 35.1 23,441 47.7 22,380 43.7
74,957 100.0 64,437 100.0 51,925 100.0 49,139 100.0 51,241 100.0
16.3 13.2 10.6 9.1 8.8
7,996 4.4 7,886 4.1 10,701 5.4 11,786 5.9 18,694 8.681,421 44.6 86,092 44.2 86,363 43.4 77,989 39.1 94,647 43.572,924 39.9 81,366 41.8 77,835 39.1 71,850 36.1 68,758 31.615,645 8.6 16,596 8.5 22,178 11.1 35,092 17.6 32,745 15.1
177,986 97.5 191,940 98.6 197,077 99.1 196,717 98.7 214,844 98.8

Australian Automotive Industry
36
ImportedTelstar V6/626 V6 0 0.0 0 0.0 5,524 4.2 5,501 3.5Other 370 0.3 2,583 2.4 667 0.5 879 0.6
Total Imports 8,071 5.8 2,583 2.4 6,191 4.7 6,380 4.1
Total Upper Medium Cars 140,268 100.0 108,287 100.0 131,855 100.0 157,413 100.0
Share of Total PMVs 30.3 27.8 32.4 38.0
Luxury Car Sector 7
Locally ProducedFairlane/LTD 6,522 13.2 4,195 9.1 4,441 8.8 4,750 9.7Statesman/Caprice 3,244 6.6 2,125 4.6 2,492 4.9 1,543 3.1Capri 8 4,413 9.0 1,580 3.4 1,089 2.2 1,321 2.7
Total Locally Produced 14,179 28.8 7,900 13.7 8,022 13.7 7,614 12.8
Imported3 Series 2,617 5.3 2,181 4.7 2,716 5.4 2,856 5.8Accord 3,036 6.2 2,705 5.9 2,625 5.2 3,356 6.8Celica 4,872 9.9 2,994 6.5 2,167 4.3 1,597 3.3Tarago 3,066 6.2 3,225 7.0 3,462 6.8 3,408 7.0Other 21,498 43.6 27,117 58.8 31,617 62.5 30,165 61.6
Total Imports 35,089 71.2 38,222 82.9 42,587 84.1 41,382 84.5
Total Luxury Cars 49,268 100.0 46,122 96.6 50,609 97.8 48,996 97.3
Share of Total PMVs 10.6 11.9 12.5 11.8
PMV SalesTotal Locally Produced 319,376 68.9 263,513 67.8 260,420 64.1 262,235 63.3Total Imports 144,131 31.1 125,409 32.2 146,007 35.9 152,190 36.7
Total PMV Retail Sales 463,507 100.0 388,922 100.0 406,427 100.0 414,425 100.0
1 Small car sector also includes micro/light cars.2 Production of the Nova, Apollo and Lexcen ceased in June 1996 with the dissolution of UAAI.3 Figures from 1990 to 1996 include a small number of imported units.4 Laser ceased local production in August 1994 and was there after imported.5 Local production of Pulsar ceased in October 1992 and was there after imported.6 Holden Vectra commenced local production in 1998.7 Luxury car sector includes people movers, sport, sport luxury, prestige and luxury cars.8 Capri ceased local production in May 1994.
Table 4: New passenger motor vehicle retail sales — market shares by segments and local/import split (cont’d)
Model Line 1990 Share 1991 Share 1992 Share 1993 Share (%) (%) (%) (%)

Australian Automotive Industry
37
3,508 1.9 2,033 1.0 1,262 0.6 605 0.3 1 0.01,082 0.6 603 0.3 567 0.3 1,972 1.0 2,519 1.2
4,590 2.5 2,636 1.4 1,829 0.9 2,577 1.3 2,520 1.2
182,576 100.0 194,576 100.0 198,906 100.0 199,294 100.0 217,364 100.0
39.6 39.8 40.4 36.9 37.2
3,595 6.2 5,960 10.2 4,713 8.1 4,519 7.1 3,427 5.34,870 8.4 5,201 8.9 5,016 8.7 4,387 6.9 4,340 6.7
810 1.4 0 0.0 0 0.0 0 0.0 0 0.0
9,275 14.7 11,161 19.2 9,729 16.8 8,906 14.0 7,767 12.1
2,910 5.0 3,881 6.7 3,400 5.9 2,565 4.0 3,317 5.26,446 11.2 5,323 9.1 5,029 8.7 3,482 5.5 5,165 8.01,927 3.3 2,012 3.5 1,983 3.4 1,997 3.1 1,824 2.83,011 5.2 2,667 4.6 2,451 4.2 2,257 3.5 1,861 2.9
34,090 59.1 33,183 57.0 35,258 60.9 44,535 69.9 44,432 69.0
48,384 83.9 47,066 80.8 48,121 83.2 54,836 86.0 56,599 87.9
57,659 98.6 58,227 100.0 57,850 100.0 63,742 100.0 64,366 100.0
12.5 11.9 11.8 11.8 11.0
281,586 61.1 274,755 56.3 264,946 53.8 253,669 46.9 273,361 46.8179,112 38.9 213,617 43.7 227,112 46.2 286,684 53.1 310,999 53.2
460,698 100.0 488,372 100.0 492,058 100.0 540,353 100.0 584,360 100.0
1994 Share 1995 Share 1996 Share 1997 Share 1998 Share(%) (%) (%) (%) (%)

Australian Automotive Industry
38
Table 5: New PMV sales by type of purchaser
1990 1991 1992 1993 1994 1995 1996 1997 1998
Fleets1 211,679 186,393 208,496 223,466 240,268 248,493 243,184 259,398 279,735Share (%) 45.56 47.61 51.30 53.92 52.15 50.88 49.42 48.01 47.87Private2 252,951 205,136 197,931 190,959 220,430 239,879 248,874 280,955 304,625Share (%) 54.44 52.39 48.70 46.08 47.85 49.12 50.58 51.99 52.13
1 Fleet sales include sales to private businesses and government.2 Included in Private: 1992 — 5,539 unclassified units, 1993 — 4,057 unclassified units, 1994 — 54
unclassified units, 1995 — 28 unclassified units, 1996 — 18 unclassified units, 1997 — 10 unclassified units
Sources: VFACTS, Vehicle Retail Sales
Table 6: New PMV sales volumes by market sectors and type of purchaser
1990 1991 1992 1993 1994 1995 1996 1997 1998
Fleets 1 214,069 187,853 208,496 223,466 240,268 248,494 243,184 259,398 279,735Share of PMV market % 45.79 47.78 51.30 53.92 52.15 50.88 49.42 48.01 47.87 Small 2 39,675 40,614 42,288 42,069 42,716 43,493 41,657 48,503 50,981Medium 56,779 50,017 55,729 43,856 44,100 35,749 26,523 23,793 26,132Upper medium 92,397 75,883 85,428 113,081 125,688 142,181 148,420 157,567 172,798Luxury 3 25,218 21,339 25,051 24,460 27,764 27,071 26,584 29,535 29,824
Annual growth (decline) % (10.4) (9.2) 11.9 7.2 7.5 3.4 (2.1) 6.7 7.8 Private 253,424 205,308 197,931 190,959 220,430 239,878 248,874 280,955 304,625Share of PMV market % 54.21 52.22 48.70 46.08 47.85 49.12 50.58 51.99 52.13 Small 2 117,134 103,443 96,991 89,109 102,790 127,704 141,720 179,686 200,408Medium 61,506 47,887 42,860 28,942 30,857 28,688 25,402 25,346 25,109Upper medium 50,734 35,811 35,732 44,332 56,888 52,395 50,486 41,727 44,566Luxury 3 24,050 18,167 22,348 28,576 29,895 31,063 31,248 34,186 34,533
ABS Other4 28 18 10 9Annual growth (decline) % 19 (19) (3.5) (3.5) 15.4 8.8 3.8 12.9 8.4
Total 467,493 393,161 406,427 414,425 460,698 488,372 492,058 540,353 584,360Annual Growth (%) 4.2 -15.9 3.4 2.0 11.2 6.0 0.8 9.8 8.1
1 Fleet sales include sales to private businesses and government.2 Small car sector includes micro, light and small cars3 Luxury car sector includes people movers, sport, sport luxury, prestige and luxury cars.4 ABS Other are unclassified vehicle sales
Sources: VFACTS, Vehicle Retail Sales

Australian Automotive Industry
39
Table 7: Sales volumes and market shares — commercial vehicle sector
Model Line 1995 Share 1996 Share 1997 Share 1998 Share(%) (%) (%) (%)
LightFord Falcon Van 1,391 1.0 1,144 0.8 1,004 0.6 864 0.4Ford Falcon Ute 6,922 5.1 8,094 5.7 7,311 4.4 6,769 3.3Holden Ute 7,743 5.7 9,142 6.4 8,283 5.0 8,532 4.2
Total Local # 16,056 11.8 18,380 12.9 16,598 10.0 16,165 7.9Imported 120,393 88.2 124,450 87.1 149,113 90.0 187,776 92.1
Total 136,449 100.0 142,830 100.0 165,711 100.0 203,941 100.0Share of CV Market 88.5 90.4 91.0 91.3
3.501 - 7.5 TonnesFord Trader* 728 12.4 536 10.5 545 10.2 402 6.1Mitsubishi Canter* 1,310 22.4 1,275 25.0 1,257 23.6 1,540 23.3
Total Local # 2,038 34.8 1,811 35.5 1,802 33.8 1,942 29.4Imported 3,815 65.2 3,296 64.5 3,535 66.2 4,664 70.6
Total 5,853 100.0 5,107 100.0 5,337 100.0 6,606 100.0Share of CV market 3.8 3.2 2.9 3.0
7.501 - 15 TonnesInternational 104 2.6 55 1.7 185 4.2 146 2.9Mercedes* 55 1.4 5 0.2 1 0.0 0 0.0
Total Local # 159 4.0 60 1.9 186 4.3 146 2.9Imported 3,771 96.0 3,179 98.1 4,179 95.7 4,936 97.1
Total 3,930 100.0 3,239 100.0 4,365 100.0 5,082 100.0Share of CV market 2.5 2.1 2.4 2.3
Over 15 TonnesFord Louisiville* 699 11.1 454 8.3 589 10.5 556 8.7Freightliner* 575 9.1 431 7.9 574 10.2 702 10.9International 1,403 22.2 1,254 22.8 999 17.8 1,115 17.4Kenworth 804 12.7 776 14.1 1,037 18.5 1,145 17.8Mack 733 11.6 628 11.4 664 11.8 703 10.9Man* 45 0.7 27 0.5 33 0.6 45 0.7Mercedes* 204 3.2 202 3.7 58 1.0 45 0.7Scania 293 4.6 298 5.4 279 5.0 337 5.2Volvo 766 12.1 554 10.1 578 10.3 670 10.4
Total Local # 5,522 87.4 4,624 84.2 4,811 85.6 5,318 82.8Imported 796 12.6 866 15.8 808 14.4 1,105 17.2
Total 6,318 100.0 5,490 100.0 5,619 100.0 6,423 100.0Share of CV market 4.1 3.5 3.1 2.9
BusesMan 142 8.7 125 9.4 75 6.0 36 2.9Mercedes 283 17.3 148 11.2 220 17.5 238 18.9Scania 131 8.0 121 9.1 116 9.2 130 10.3Volvo 125 7.6 70 5.3 90 7.2 80 6.4
Total Local # 681 41.7 464 35.0 501 39.9 484 38.5Imported 954 58.3 861 65.0 756 60.1 773 61.5
Total 1,635 100.0 1,325 100.0 1,257 100.0 1,257 100.0Share of CV market 1.1 0.8 0.7 0.6
Total CVs 154,185 157,991 182,289 223,309
Share of total Market 24.0 24.3 25.2 27.6
# Vehicles are assembled/manufactured locally* Vehicles are no longer manufactured/assembled locally Sources: VFACTS, Vehicle Retail Sales

Australian Automotive Industry
40
Table 8: New CV sales volumes by type of purchaser
1990 1991 1992 1993 1994 1995 1996 1997 1998
Fleets1 100,822 84,366 93,355 88,996 103,308 105,009 111,119 123,474 145,288Share (%) 66.04 68.57 68.82 63.16 66.40 68.11 70.33 67.74 65.22Private2 51,846 38,671 42,295 51,913 52,280 49,176 46,872 58,815 77,493Share (%) 33.96 31.43 31.18 36.84 33.60 31.89 29.67 32.26 34.78
1 Fleet sales include sales to private businesses and government2 Included in Private: 1995 — 845 unclassified units, 1996 — 693 unclassified units , 1997 - 551
unclassified unitsSources: VFACTS, Vehicle Retail Sales
Table 9: Sales volumes and market shares of locally produced and imported CVs
1990 1991 1992 1993 1994 1995 1996 1997 1998
Local 26,347 21,332 24,042 24,851 27,896 27,630 25,273 23,829 24,034Share (%) 17.02 16.89 17.36 17.64 17.93 17.92 16.00 13.09 10.76Imported 128,445 104,965 114,457 116,030 127,692 126,555 132,718 158,245 199,275Share (%) 82.98 83.11 82.64 82.36 82.07 82.08 84.00 86.91 89.24
Sources: VFACTS, Vehicle Retail Sales
Table 10: Share of CV Market by producer, 1998
PRODUCER Volume Share
Toyota 68296 30.6Holden 29433 13.2Ford 23452 10.5Nissan 21854 9.8Subaru 9383 4.2Honda 8166 3.7Mitsubishi 20208 9.0Rover 6535 2.9Mazda 5999 2.7Other 29983 13.4
Sources: VFACTS, Vehicle Retail Sales

Australian Automotive Industry
41
Price indices and exchange rates
Table 11: Quarterly index of car prices, consumer prices, average weekly earnings and car affordability
CARS
Quarter Locally Imported CPI1 CPI Average Affordabilityproduced (all (Motor vehicle weekly index
groups) expenditure earnings3
class)
1990 March 167.0 188.2 150.1 171.8 140.3 81.7June 169.6 190.6 152.5 171.4 143.0 83.4September 172.0 190.6 153.7 168.4 144.6 85.9December 174.3 191.3 157.7 170.9 148.4 87.0
1991 March 177.3 193.0 157.4 169.7 150.4 88.5June 178.3 194.5 157.7 173.1 148.6 85.9September 179.9 194.4 158.6 175.7 149.9 85.3December 182.1 196.3 160.1 179.1 153.4 85.7
1992 March 176.6 193.0 160.1 179.9 155.7 86.5June 179.7 194.9 159.7 177.9 155.1 87.2September 182.3 198.5 159.8 179.9 154.9 86.1December 185.7 201.2 160.6 181.1 156.0 86.1
1993 March 188.1 208.5 162.1 185.9 157.8 84.9June 193.3 211.7 162.6 189.1 158.9 84.0September 197.3 219.5 163.4 193.0 159.8 82.8December 200.2 223.3 163.7 191.3 161.4 84.4
1994 March 201.8 227.2 164.4 194.1 163.0 84.0June 202.6 227.5 165.4 194.4 164.8 84.8September 203.9 228.4 166.5 198.0 166.0 83.9December 205.1 230.0 167.8 200.1 168.7 84.3
1995 March 207.0 229.4 170.8 199.5 170.8 85.6June 216.3 239.4 172.8 203.9 172.8 84.7September 213.7 243.6 175.0 207.1 173.6 83.9December 215.7 244.2 176.3 207.2 176.6 85.2
1996 March 215.5 244.3 177.2 207.0 177.6 85.8June 218.0 242.6 178.2 207.0 179.7 86.8September 217.6 241.2 178.7 203.0 180.2 88.8December 218.4 239.2 179.0 201.6 183.4 91.0
1997 March 218.5 233.1 179.4 197.8 184.1 93.1June 219.2 232.2 178.8 192.0 185.1 96.4September 219.9 231.9 178.1 194.0 187.4 96.6December 219.2 230.5 178.5 187.8 189.2 100.7
1998 March 219.2 229.8 179.2 189.5 191.4 101.1June 219.2 229.3 180.0 185.6 192.9 104.0September 217.8 229.5 180.5 181.7 194.9 107.3December 218.5 230.0 181.4 180.2 197.2 109.4
1 Consumer Price Index, All Groups2 Average Weekly Total Earnings, full-time adults.
Sources: ABS, Consumer Prices Index, Catalogue No. 6401.0.ABS, Average Weekly Earnings, Catalogue No. 6301.0 and 6302.0.Australian Automotive Intelligence Report.Former AIA Industry Surveys.
Australian Automotive Industry
42
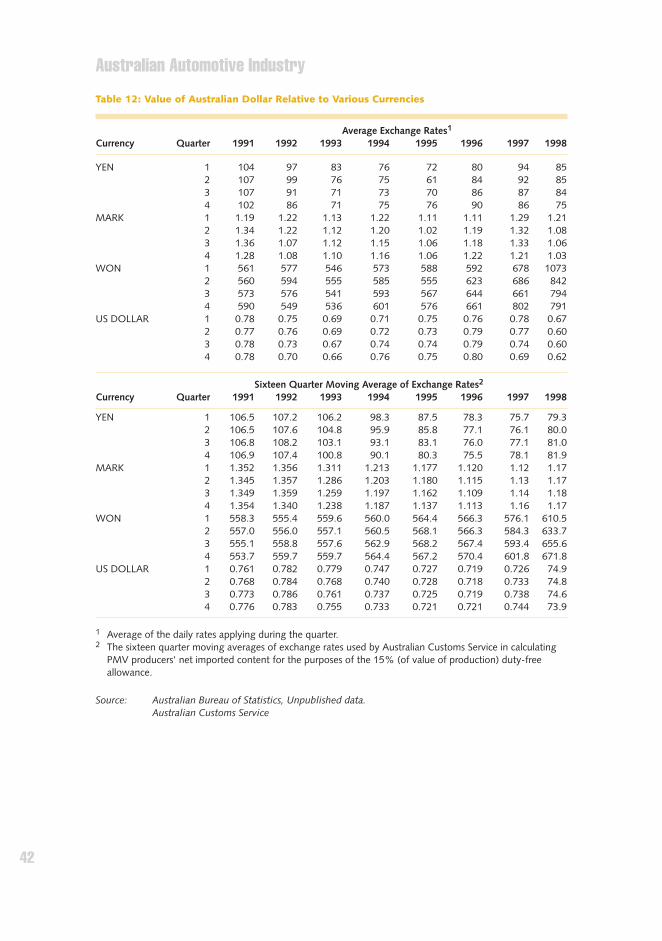
Table 12: Value of Australian Dollar Relative to Various Currencies
Average Exchange Rates1
Currency Quarter 1991 1992 1993 1994 1995 1996 1997 1998
YEN 1 104 97 83 76 72 80 94 852 107 99 76 75 61 84 92 853 107 91 71 73 70 86 87 844 102 86 71 75 76 90 86 75
MARK 1 1.19 1.22 1.13 1.22 1.11 1.11 1.29 1.212 1.34 1.22 1.12 1.20 1.02 1.19 1.32 1.083 1.36 1.07 1.12 1.15 1.06 1.18 1.33 1.064 1.28 1.08 1.10 1.16 1.06 1.22 1.21 1.03
WON 1 561 577 546 573 588 592 678 10732 560 594 555 585 555 623 686 8423 573 576 541 593 567 644 661 7944 590 549 536 601 576 661 802 791
US DOLLAR 1 0.78 0.75 0.69 0.71 0.75 0.76 0.78 0.672 0.77 0.76 0.69 0.72 0.73 0.79 0.77 0.603 0.78 0.73 0.67 0.74 0.74 0.79 0.74 0.604 0.78 0.70 0.66 0.76 0.75 0.80 0.69 0.62
Sixteen Quarter Moving Average of Exchange Rates2
Currency Quarter 1991 1992 1993 1994 1995 1996 1997 1998
YEN 1 106.5 107.2 106.2 98.3 87.5 78.3 75.7 79.32 106.5 107.6 104.8 95.9 85.8 77.1 76.1 80.03 106.8 108.2 103.1 93.1 83.1 76.0 77.1 81.04 106.9 107.4 100.8 90.1 80.3 75.5 78.1 81.9
MARK 1 1.352 1.356 1.311 1.213 1.177 1.120 1.12 1.172 1.345 1.357 1.286 1.203 1.180 1.115 1.13 1.173 1.349 1.359 1.259 1.197 1.162 1.109 1.14 1.184 1.354 1.340 1.238 1.187 1.137 1.113 1.16 1.17
WON 1 558.3 555.4 559.6 560.0 564.4 566.3 576.1 610.52 557.0 556.0 557.1 560.5 568.1 566.3 584.3 633.73 555.1 558.8 557.6 562.9 568.2 567.4 593.4 655.64 553.7 559.7 559.7 564.4 567.2 570.4 601.8 671.8
US DOLLAR 1 0.761 0.782 0.779 0.747 0.727 0.719 0.726 74.92 0.768 0.784 0.768 0.740 0.728 0.718 0.733 74.83 0.773 0.786 0.761 0.737 0.725 0.719 0.738 74.64 0.776 0.783 0.755 0.733 0.721 0.721 0.744 73.9
1 Average of the daily rates applying during the quarter.2 The sixteen quarter moving averages of exchange rates used by Australian Customs Service in calculating
PMV producers' net imported content for the purposes of the 15% (of value of production) duty-freeallowance.
Source: Australian Bureau of Statistics, Unpublished data.Australian Customs Service

Australian Automotive Industry
43
Production and Quality
Table 13: Production of locally produced PMVs
Volume (units)1990 1991 1992 1993 1994 1995 1996 1997 1998
Falcon Family 74,576 58,236 67,160 80,527 88,949 101,731 100,115 88,010 83,436 Domestic market 70,129 55,403 63,462 77,165 84,342 96,013 91,786 84,152 78,345 Export market 4,447 2,833 3,698 3,362 4,607 5,718 8,329 3,858 5,091
Laser/Capri 55,394 46,638 28,778 21,500 11,696 - - - - Domestic market 35,926 26,792 17,102 17,644 10,345 - - - - Export market 19,468 19,846 11,676 3,856 1,351 - - - -
Commodore Family 83,586 61,661 69,734 73,506 98,063 107,345 108,006 92,174 116,556 Domestic market 78,675 59,531 65,525 72,345 93,200 101,906 102,518 89,480 107,260 Export market 4,891 2,130 4,209 1,161 4,863 5,439 5,488 2,694 9,296
Vectra - - - - - - - - 2,817 Domestic market - - - - - - - - 2,375 Export market - - - - - - - - 442
Magna Family 33,663 29,074 36,715 52,446 47,856 39,724 43,916 59,275 46,506 Domestic market 32,786 27,559 32,436 38,970 40,466 34,542 31,557 41,579 36,957 Export market 877 1,515 4,279 13,476 7,390 5,182 12,359 17,696 9,549
Camry/Apollo Family 36,680 32,303 31,520 39,977 53,943 39,731 50,396 57,586 80,609 Domestic market 35,811 31,713 30,576 37,300 47,540 32,130 32,517 30,077 49,338 Export market 869 590 944 2,677 6,403 7,601 17,879 27,509 31,271
Corolla/Nova 34,558 27,399 25,908 26,864 25,333 24,377 23,198 22,221 23,968 Domestic market 34,558 27,399 25,908 26,864 25,333 24,377 23,198 22,221 23,968 Export market - - - - - - - - -
Pulsar 47,754 19,182 16,346 - - - - - - Domestic market 47,004 18,701 13,650 - - - - - - Export market 750 481 2,696 - - - - - -
Pintara 10,164 16,177 4,374 - - - - - - Domestic market 9,040 13,842 3,950 - - - - - - Export market 1,124 2,335 424 - - - - - -
Total Market 376,355 290,670 280,535 294,820 325,840 312,908 325,631 319,266 353,892Domestic market 343,929 260,940 252,609 270,288 301,226 288,968 281,576 267,509 298,243Export market 32,426 29,730 27,926 24,532 24,614 23,940 44,055 51,757 55,649
Source: ISR & AIA Industry Surveys
Table 14: Local content by model grouping 1
1991 1992 1993 1994 1995 1996 1997 1998(%) (%) (%) (%) (%) (%) (%) (%)
Falcon Family 89.3 81.6 83.3 83.3 84.5 85.9 85.9 86.6Commodore Family 80.6 83.0 81.7 81.1 80.7 81.1 84.1 82.2Magna Family 75.6 77.0 79.0 75.5 74.7 70.6 75.7 77.0Camry 76.0 52.7 69.8 69.1 65.1 67.0 70.0 69.0Corolla 77.1 58.0 76.3 73.2 58.6 68.2 72.0 71.0
Average 81.0 74.7 79.4 78.2 77.5 78.1 79.6 78.5
1 average local content before adjustments for export credits2 weighted average based on production volume (units)
Source: Australian Customs Service, Unpublished Data 1999.

Australian Automotive Industry
44
Table 15: Quality performance of models in local production during 19981
Sample Average Number of Faults2
Category Model 1990 1991 1992 1993 1994 1995 1996 1997 1998
Small Toyota Corolla 1.8 1.7 1.4 1.3 1.5 1.1 1.3 1.5 1.5Comparable fully imported models3,4 - 1.4 1.3 1.3 1.5 1.4 1.3 1.4 1.3
Medium Toyota Camry (4) 2.1 1.6 1.4 1.4 1.7 1.8 1.4 1.4 1.6Mitsubishi Magna (4) 1.8 1.9 1.8 1.7 1.8 1.6 1.5 1.4 1.4Comparable fully imported models3,4 - 1.1 1.3 1.2 1.2 1.3 1.3 1.1 1.3
Large/ Ford Falcon 2.9 2.4 2.2 2.0 2.2 2.1 1.8 1.8 2.1Luxury Holden Commodore 2.9 2.5 2.0 2.1 1.9 1.9 1.9 2.1 2.4
Toyota Camry (V6) - - - - - - 1.6 1.6 1.4Mitsubishi Magna (V6) - - - - - - 1.6 1.6 1.4
1 The ARMS faults data reported in this table is derived from responses to surveys completed by a sample ofprivate new car buyers.
2 Faults reported by private purchasers in the first three months of ownership3 Imported Models pre 1997; Small: Ford Festiva, Holden Barina, Mazda 121, Nissan Micra, Honda Civic,
Mazda 323, Mitsubishi Lancer, Nissan Pulsar Ford Laser, Toyota Sprinter, Toyota Corolla 4WD; Medium: Ford TX-5/Telstar, Ford Mondeo, Honda Accord, Maxda 626, Nissan Bluebird and MitsubishiGalant; Large/Luxury: No comparable import grouping.
4 Imported Models post 1997; Small: Ford Festiva, Ford Laser, Holden Astra, Holden Barina, Hyundi Excel,Mazda 121, Honda Civic Mazda 323, Mitsubishi Lancer, Mitsubishi Mirage and Nissan Pulsar Medium: Ford Mondeo, Honda Accord, Hyundi Sonata and Maxda 626
Source: Automotive Research and Marketing Services (ARMS), Australian New Car Buyer Survey.
Table 16: Owner-Reported Faults, Locally Produced and Imported Cars1
1990 1991 1992 1993 1994 1995 19962 1997 1998
Locally produced carsHighest 2.9 2.5 2.2 2.1 2.2 2.1 1.9 2.1 2.4Lowest 1.8 1.6 1.4 1.3 1.5 1.1 1.3 1.4 1.4
Imported carsHighest 1.6 1.7 1.6 1.6 1.9 1.9 1.7 2.1 1.9Lowest 0.9 0.9 0.9 0.8 1.0 0.8 1.0 0.8 0.9
1 Faults reported by private purchasers in the first three months of ownership.2 1996 figures have been revised to include figures for full year.
Source: Automotive Research and Marketing Services (ARMS), Australian New Car Buyer Survey.
Table 17: Sales of components by FAPM member companies
1994 1995 1996 1997 1998
Domestic Sales 4,138,670 4,722,004 4,880,751 4,977,462 5,102,341Exports 484,627 506,698 671,182 723,768 748,649
4,623,297 5,228,702 5,551,933 5,701,230 5,850,990
Source: FAPM
Australian Automotive Industry
45
Trade
Table 18: Value and growth of automotive exports
Exports Annual growth Growth since 1990$m (%) (%)
1990 1,038.3 42.2 -1991 1,162.2 11.9 11.91992 1,248.7 7.4 20.31993 1 1,474.3 18.1 42.01994 1,537.6 4.3 48.11995 1,775.9 15.5 71.01996 2,173.8 22.4 109.41997 2,647.2 21.8 155.01998 2,516.2 -4.9 142.3
1 From 1993 includes specialist commercial vehicles
Source: Australian Bureau of Statistics, Unpublished Data 1999
Table 19: Automotive exports by country, 1998
Country Exports $m Share (%)
NAFTA 586,778,342 23.32Middle East 514,724,201 20.46New Zealand 440,062,676 17.49Japan 201,894,991 8.02Rest of World (n.e.s.) 201,889,075 8.02South Korea 183,102,571 7.28United Kingdom 82,760,315 3.29South America 79,716,155 3.17Germany 46,234,794 1.84Taiwan 37,775,627 1.50Indonesia 23,476,301 0.93Singapore 23,383,500 0.93Netherland 12,878,817 0.51Malaysia 12,325,899 0.49France 11,281,040 0.45Thailand 10,174,575 0.40China 9,209,834 0.37Belgium/Luxembourg 7,057,830 0.28Italy 5,550,285 0.22Rest of Europe (n.e.s.) 4,237,439 0.17Philippines 4,027,523 0.16Spain 3,751,623 0.15Sweden 3,573,128 0.14India 2,955,584 0.12Brunei 1,416,433 0.06Ireland 1,363,267 0.05Austria 1,314,059 0.05Greece 869,579 0.03Portugal 837,350 0.03Finland 527,158 0.02Former USSR 513,759 0.02Denmark 401,387 0.02Turkey 125,502 0.00
Total 2,516,190,619 100.00
Source: Australian Bureau of Statistics, Unpublished Data

Australian Automotive Industry
46
Table 20: Exported CBU PMVs and their FOB value
Export Clearances FOB Value Annual Growth(volume) ($m) in Value (%)
1990 25,620 355.3 251.81991 27,604 390.7 9.91992 25,627 408.7 4.61993 26,328 562.3 37.61994 22,253 463.7 -17.51995 22,693 485.4 4.71996 39,693 836.6 72.41997 55,046 1,077.2 28.81998 54,360 1,132.6 5.1
Source: Australian Bureau of Statistics, Unpublished Data
Table 21: Australian export of components
1990 1991 1992 1993 1994 1995 1996 1997 1998($m) ($m) ($m) ($m) ($m) ($m) ($m) ($m) ($m)
Other components 334.5 385.7 455.2 540.3 579.1 599.7 674.6 804.6 827.7Engines 196.1 242.4 223.7 211.0 225.9 320.5 274.1 395.7 282.7Engine parts 87.8 108.2 118.9 138.2 138.2 191.7 205.6 182.6 111.3
Total 618.4 736.3 797.8 889.5 943.3 1111.9 1154.3 1382.9 1221.7
Source: Australian Bureau of Statistics, Unpublished Data
Table 22: Value and growth of automotive imports
Imports ($M) Annual growth (%) Growth since 1990 (%)
1990 5,451.5 -5.9 -1991 5,023.2 -7.9 -7.91992 6,398.8 27.4 17.41993 7,631.9 19.3 40.01994 8,881.1 16.4 62.91995 9,225.9 3.9 69.21996 9,162.1 -0.7 68.11997 10,416.0 13.7 91.11998 12,832.0 23.2 135.4
Source: Australian Bureau of Statistics, Unpublished Data

Australian Automotive Industry
47
Table 23: Automotive imports by country, 1998
Country Imports Share$ (%)
Japan 6,468,108,767 50.41NAFTA 1,702,615,805 13.27Germany 1,381,468,318 10.77South Korea 968,764,954 7.55United Kingdom 522,551,315 4.07Sweden 174,399,027 1.36Rest of World (n.e.s.) 166,826,371 1.30Spain 157,556,278 1.23Thailand 149,659,252 1.17France 143,894,813 1.12Belgium/Luxembourg 132,256,453 1.03New Zealand 123,106,425 0.96Italy 111,517,991 0.87Taiwan 93,912,762 0.73China 89,551,819 0.70Austria 83,537,732 0.65Indonesia 60,572,115 0.47Philippines 60,255,763 0.47Malaysia 54,731,371 0.43Finland 38,957,986 0.30South America 33,463,886 0.26Rest of Europe (n.e.s.) 28,887,274 0.23Netherland 26,312,837 0.21India 24,741,744 0.19Singapore 10,796,494 0.08Turkey 7,941,173 0.06Portugal 5,056,665 0.04Denmark 4,792,998 0.04Middle East 2,581,035 0.02Ireland 2,273,422 0.02Greece 523,038 0.00Former USSR 377,778 0.00Brunei 10,678 0.00
Total 12,832,004,339 100.00
Source : Australian Bureau of Statistics, Unpublished Data
Table 24: Imports of CBU PMVs and their FOB value
Import Clearances (units) Value FOB $m Annual Growth (%)
1990 115,151 1,277.7 -7.51991 123,708 1,331.5 4.21992 147,406 1,849.2 38.91993 158,663 2,178.7 17.81994 182,256 2,620.1 20.31995 214,843 2,925.1 11.61996 233,284 2,954.7 1.01997 289,184 3,552.7 20.21998 308,342 4,017.6 13.1
Source: ABS unpublished data

Australian Automotive Industry
48
Table 26: Imported PMV share of new PMV market by segment
Import Share (%)Sector 1990 1991 1992 1993 1994 1995 1996 1997 1998
Micro/Light 100.0 100.0 100.0 100.0 100.0 100.0 100.0 100.0 100.0Small 21.9 32.7 40.4 54.1 73.8 76.5 82.9 87.2 87.7Medium 20.7 22.6 27.8 23.9 17.3 27.9 35.1 47.7 45.8Upper Medium 0.0 0.0 0.0 0.0 2.0 0.5 0.9 1.3 1.2Luxury/People Movers 79.6 83.7 85.2 85.8 83.6 75.1 83.2 86.0 87.9
Total PMV Market 25.3 31.1 35.8 36.9 38.0 43.7 46.2 53.1 53.2
Sources: VFACTS, Vehicle Retail Sales
Table 25: Imported CBU PMVs market share by source
1990 1991 1992 1993 1994 1995 1996 1997 1998Share Share Share Share Share Share Share Share Share
Country of Origin (%) (%) (%) (%) (%) (%) (%) (%) (%)
Japan 71.1 77.2 70.6 69.2 60.5 47.4 41.4 43.3 40.8Germany 16.1 11.4 15.8 14.8 16.8 17.9 19.3 18.3 22.0South Korea 3.6 4.5 6.4 9.1 9.9 16.5 20.2 21.2 18.9Sweden 2.5 1.8 4.1 3.1 3.9 2.9 2.5 2.1 1.7United Kingdom 3.6 2.8 1.0 0.8 1.4 2.3 3.3 2.6 1.5Belgium 1.4 0.5 0.8 1.1 1.3 5.1 4.5 3.4 2.5Other 1.7 1.7 1.3 1.9 6.2 7.9 8.7 9.0 12.6
Total 100.0 100.0 100.0 100.0 100.0 100.0 100.0 100.0 100.0
Source: Australian Bureau of Statistics, Unpublished Data
Table 27: Imports of components
Imports $m Annual Growth (%) Growth Since 1990 (%)
1990 2,257.9 -2.7 -1991 1,988.0 -12.0 -12.01992 2,413.6 21.4 6.91993 3,069.3 27.2 35.91994 3,526.7 14.9 56.21995 3,611.2 2.4 59.91996 3,532.4 -2.2 56.41997 3,620.6 2.5 60.41998 4,421.8 22.1 95.8
Source: Australian Bureau of Statistics, Unpublished Data

Australian Automotive Industry
49
Table 28: Automotive industry employment, 1988/89 to 1997/98
1989/90 1990/91 1991/92 1992/93 1993/94 1994/95 1995/96 1996/97 1997/98
28111 34,700 27,500 26,123 22,801 22,541 23,107 21,022 20,702 19,89628122 6,400 5,500 5,128 5,682 6,300 7,154 7,265 7,773 8,54828133 8,400 6,400 4,638 4,553 3,704 4,634 5,145 5,225 4,71428144 27,800 23,900 20,541 19,453 20,247 19,447 21,384 21,771 22,357
77,300 63,300 56,430 52,489 52,792 54,342 54,816 55,471 55,515
1 Motor vehicle manufacturing2 Motor vehicle body manufacturing3 Automotiveelectricalandinstrumentmanufacturing4 Automotivecomponentmanufacturing
Source: Australian Bureau of Statistics
Table 29: Employment by PMV Producers
1990 1991 1992 1993 1994 1995 1996 1997 1998 1
PMV Producers 32,421 26,639 24,036 23,067 20,412 19,754 20,213 20,540 22,371
1 Includes employees of the former Holden Engine Company for the first time.
Source: ISR and AIA industry surveys
Employment and productivity
Table 30: PMV producers productivity (vehicles per employee)
Production units Employment no. Cars per employee
1990 377,461 32,421 11.641991 288,380 26,639 10.831992 277,725 24,036 11.551993 294,070 23,067 12.751994 322,893 20,412 15.821995 312,384 19,754 15.811996 325,631 20,213 16.111997 319,266 20,540 15.541998 1 353,892 22,371 15.82
1 Includes employees of the former Holden Engine Company for the first time.
Source: ISR and AIA Industry surveys
Australian Automotive Industry
50
Profitability, investment and R&D of PMV assemblers
Table 31: Profit Performance of PMV Producers 1
PMV manufacturing operations Total PMV activities 2
Net Trading Profit Return on sales Net Trading Profit Return on sales(loss) $m (%) (loss) $m (%)
1990 (223.8) (3.5) (109.4) (1.3)1991 (501.7) (9.6) (415.2) (6.1)1992 (201.9) (3.7) (77.9) (1.1)1993 52.8 0.8 129.4 1.7 1994 326.6 4.9 473.7 5.4 1995 343.1 5.0 434.0 5.0 1996 351.1 4.9 520.4 5.7 1997 344.0 4.9 517.8 5.4 1998 388.6 5.0 502.2 4.6
1 Profit before tax.2 Includes PMV manufacturing, sales of imported PMVs and shared vehicles, sales of imported components
as parts and accessories and component production for local sale and export. Total PMV activities does notinclude the sale of commercial vehicles.
Source: ISR and AIA industry surveys
Table 32: Real gross investment expenditure by PMV producers (actual dollars)1
Actual Actual Actual Planned
Type of 1987-1990 1991-1994 1995-1998 1999-2002
investment Value $m Share (%) Value $m Share (%) Value $m Share (%) Value $m Share (%)
Product 968.4 59.8 756.8 48.5 1,343.9 59.3 1,407.7 66.7Capacity 120.1 7.4 53.4 3.4 161.3 7.1 7.8 0.4Efficiency 292.8 18.1 565.9 36.3 361.4 15.9 297.7 14.1CM&A2 239.0 14.8 182.8 11.7 400.3 17.7 398.0 18.9
Total 1,620.3 100.0 1,558.9 100.0 2,266.9 100.0 2,111 100.0
NB The data in this table has been revised from the data appearing in the 1995 SOIR and is now presented in nominal dollars.
1 Investment expenditures are cyclical so that investment data has been grouped into four year periods. Actuall investmentfor the period 1984 to 1993 represents expenditure by Ford, Holden Toyota, Mitsubishi and Nissan. Investment data from1994 does not include any expenditure by Nissan. Investment data is classified into four broad categories. Product:Investment essentially to replace existing production facilities for the purposes of tooling-up to enable production of a newproduct. Capacity: Expansion of manufacturing capacity in order to increase output of a particular product. Efficiency:Included in this category are investments undertaken to achieve improved manufacturing productivity, quality, cost savings,etc. CM&A: Includes expenditure of a capital nature undertaken for the purposes of maintaining existing productionfacilities. This category also includes the establishment and refurbishing of administrative facilities.
2 Capital maintenance and administration.
Source: ISR and AIA industry surveys
Australian Automotive Industry
51
Industry Assistance
Table 33: Research and development expenditure by Vehicle producers (actual dollars)
AVERAGE R&D
Annual growth Total R&D $m Value $m (decline) (%)
1990 133.5 22.31991 110.6 22.1 (0.6)1992 105.3 21.1 (4.8)1993 100.7 20.1 (4.4)1994 153.0 38.3 81.6 1995 197.7 49.4 29.2 1996 235.8 59.0 19.3 1997 273.9 68.5 16.2 1998 198.8 49.7 (27.4)
Source: ISR and AIA industry surveys
Table 34: Value of production and duty forgone under the duty free allowance and exportfacilitation scheme
Value of Duty foregone Duty foregone Tariff Production ($m) under DFA ($m) under EFS ($m) (%)
1991 4762.1 267.9 161.1 37.51992 4894.7 257.0 418.1 35.01993 5927.9 289.0 275.4 32.51994 7016.4 315.7 209.0 30.01995 7095.0 292.7 186.9 27.51996 7111.3 266.7 220.5 25.01997 6956.9 234.8 250.6 22.51998 7760.9 232.8 280.4 20.01999 - - - 17.52000 - - - 15.02001 - - - 15.02002 - - - 15.02003 - - - 15.02004 - - - 15.02005 - - - 10.0
Source: Australian Customs Service


![celerkat1.3 volvo1 Pub98[1] · 4-cyl DKS 4-Cyl Seiko-Seiki 4-Cyl DKS pad 6-Cyl SD-709 6-Cyl SD7H15 #7828 6-Cyl SD7H15 #7846/7930 6-Cyl SD7H15 #7935 Kondensorer/Condenser 1991 92-93](https://img.dokumen.tips/doc/110x75/5f3a997e71773a6bab1b0fa3/celerkat13-volvo1-pub981-4-cyl-dks-4-cyl-seiko-seiki-4-cyl-dks-pad-6-cyl-sd-709.jpg)


![1.6L 4-CYL - VIN [A] & 1.8L 4-CYL - VIN [A]](https://img.dokumen.tips/doc/110x75/61789fad5dd459523072558c/16l-4-cyl-vin-a-amp-18l-4-cyl-vin-a.jpg)