Embed Size (px)
Citation preview

Kevin NeilonZhenjiao Tian
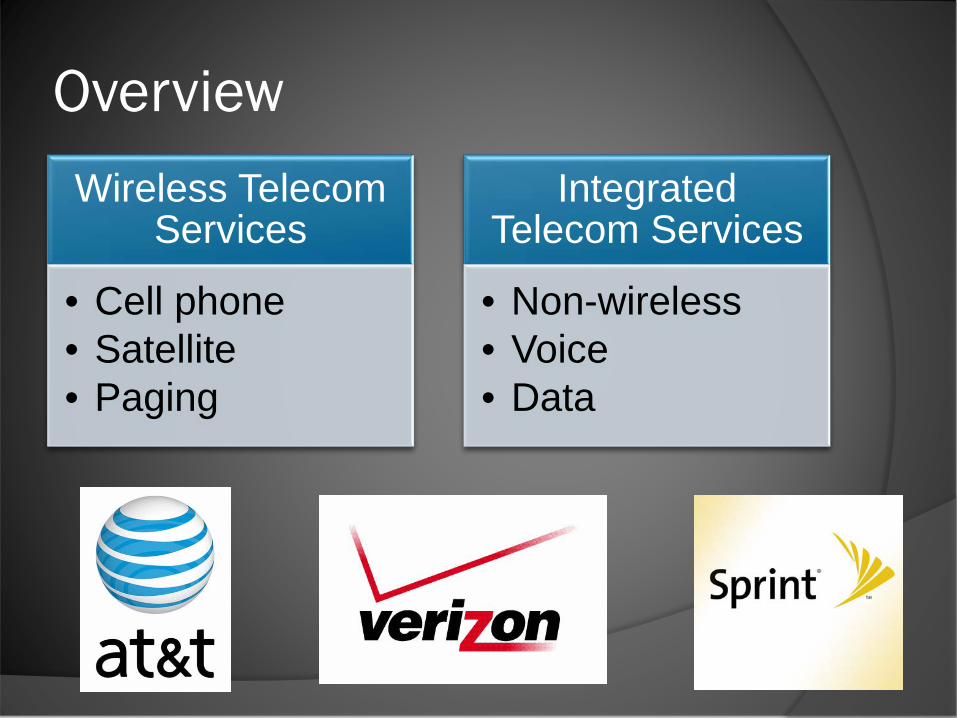
OverviewWireless Telecom
Services
• Cell phone• Satellite• Paging
Integrated Telecom Services
• Non-wireless• Voice• Data

Overview
Decided to cut 200 basis points to 1.53%
97.27%
2.73%
S&P 500 Weight
Rest of S&P 500Telecom Sector
96.47%
3.53%
SIM Weight
Rest of S&P 500Telecom Sector

Valuation Analysis
Telecom SectorAbsolute Basis High Low Median Current
P/Trailing E 24.8 9.7 16.3 16.6
P/Forward E 21.7 10.5 15.6 17.5
P/B 2.7 1.0 1.9 1.7P/S 2.0 0.9 1.4 1.2P/CF 7.0 3.5 5.2 5.0
Relative to SP500 High Low Median Current
P/Trailing E 1.4 0.7 0.9 1.2P/Forward E 1.4 0.8 1.0 1.3P/B 1.0 0.4 0.8 0.8P/S 1.4 0.8 1.0 0.9P/CF 0.6 0.4 0.5 0.5
Overview Negatives
Sector is not capturing upside of market recovery ROE & Profit margin expected to continue
underperforming Industry is not attractive based on 5 forces
Positives High dividend yield Wireless Services Industry slightly undervalued

Overview
Current Holdings
AT&T• Current Price: $30.99• Target Price: $31.50 (1.6% upside)• Current SIM Weight: 1.97%• Recommendation: SELL
NII Holdings, Inc.• Current Price: $17.50• Target Price: $22.35 (28% upside)• Current SIM Weight: 1.56%• Recommendation: HOLD
Overview
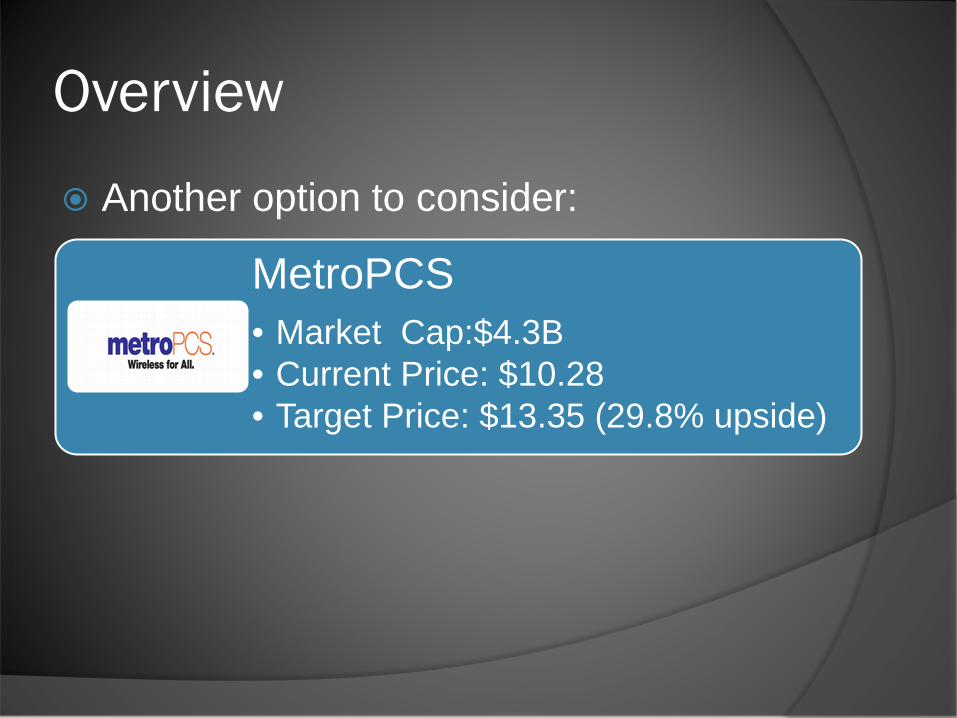
Another option to consider:
MetroPCS• Market Cap:$4.3B• Current Price: $10.28• Target Price: $13.35 (29.8% upside)


AT&T
Defensive Stock Mature Company Competitors: Verizon, Sprint
Wireless45%
Wireline51%
Advertising3%
Other1%
Revenue by Line of Business

AT&T
Private Communications Construction

AT&T
Correlation with Market

Slow, unexciting growth prospectsAT&T
AT&T
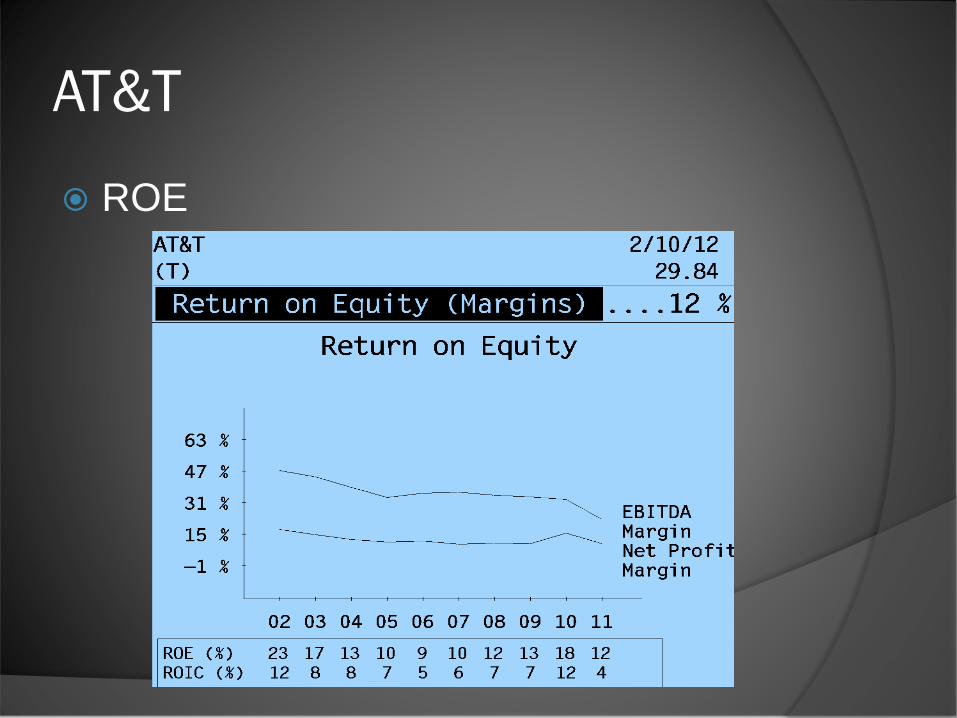
ROE

AT&T
DCF Model
AT&T
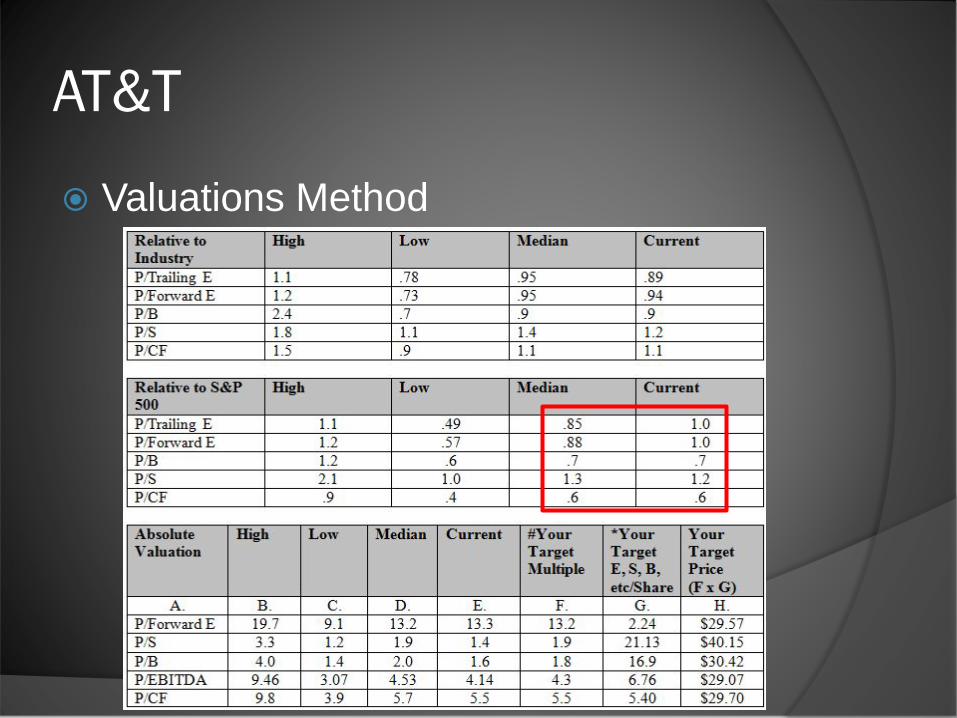
Valuations Method
Revised Target Price: $31.50Current Price: $30.34Recommendation: SELL
AT&T
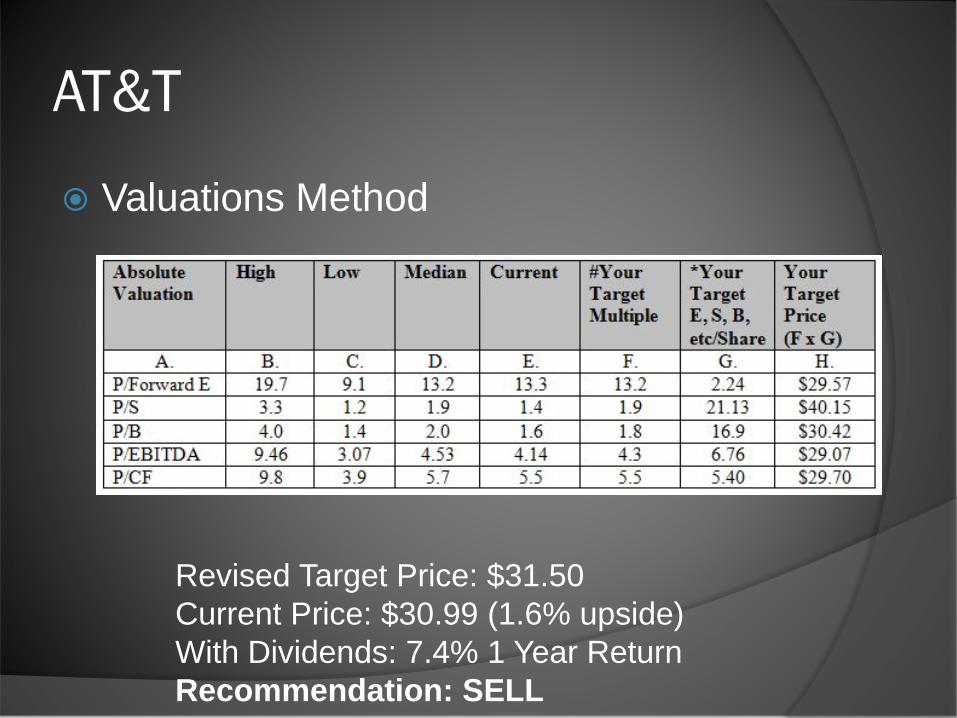
Valuations Method
Revised Target Price: $31.50Current Price: $30.99 (1.6% upside)With Dividends: 7.4% 1 Year ReturnRecommendation: SELL


NII Holdings, Inc.
Founded in 1995 and is based in Reston, Virginia. Provides wireless communication services under the Nextel brand name Primary market is Mexico, Brazil, Argentina, Peru, and Chile. Services include mobile telephone service; mobile broadband services;
Nextel Direct Connect service, which allows subscribers to talk to each other on a push-to-talk basis for private one-to-one calls or on group calls; and International Direct Connect service that allows subscribers to communicate across national borders.
Provides data services.Market Capital: 3.0 billion
Competitors: America Movil, Telefonica Moviles, Telemar’s 0i, Telecom Italia Mobile, Entel, Iusacell, Vivo, Portugal Telecom S.A, Telecom Americas, Italia Mobile

NII Holdings, Inc.
5 Year Performance:
NII Holdings, Inc.
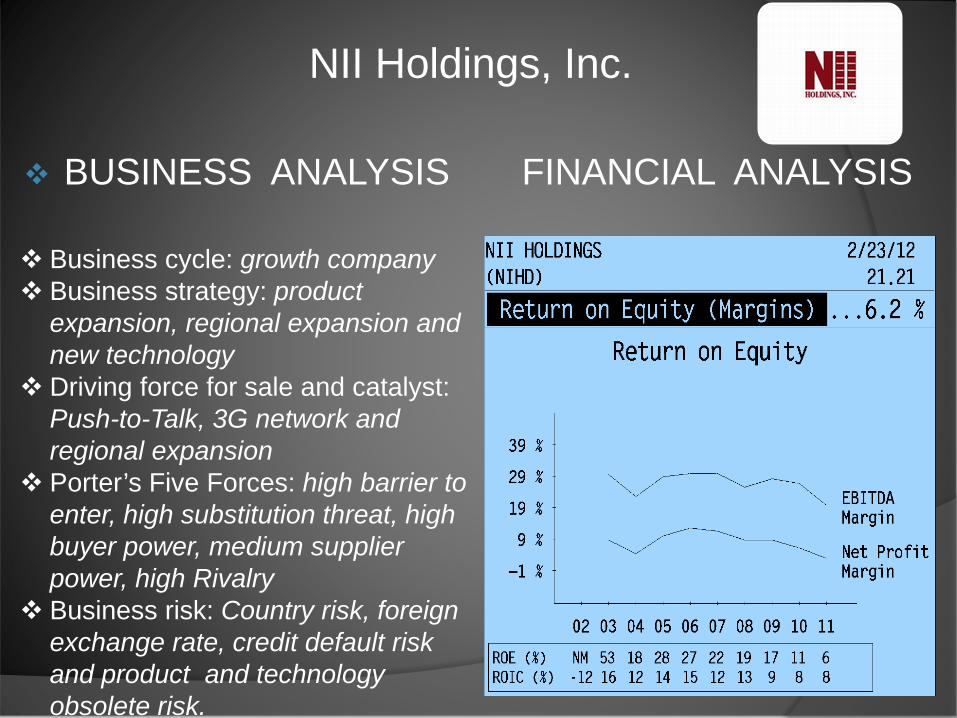
Business cycle: growth company Business strategy: product
expansion, regional expansion and new technology
Driving force for sale and catalyst: Push-to-Talk, 3G network and regional expansion
Porter’s Five Forces: high barrier to enter, high substitution threat, high buyer power, medium supplier power, high Rivalry
Business risk: Country risk, foreign exchange rate, credit default risk and product and technology obsolete risk.
BUSINESS ANALYSIS FINANCIAL ANALYSIS
NII Holdings, Inc.
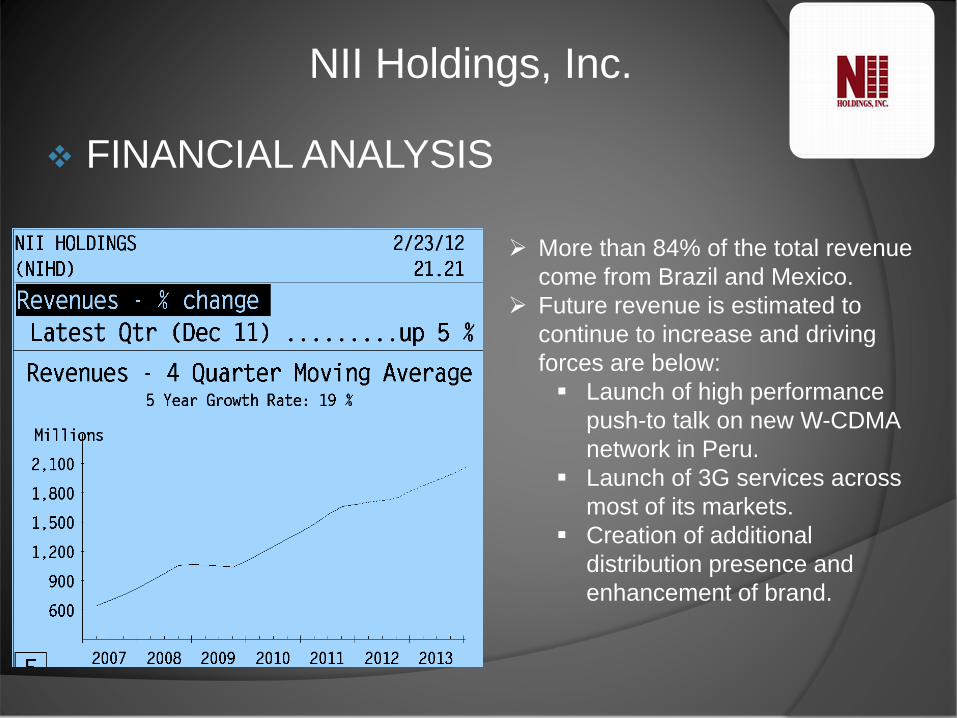
More than 84% of the total revenue come from Brazil and Mexico.
Future revenue is estimated to continue to increase and driving forces are below: Launch of high performance
push-to talk on new W-CDMA network in Peru.
Launch of 3G services across most of its markets.
Creation of additional distribution presence and enhancement of brand.
FINANCIAL ANALYSIS
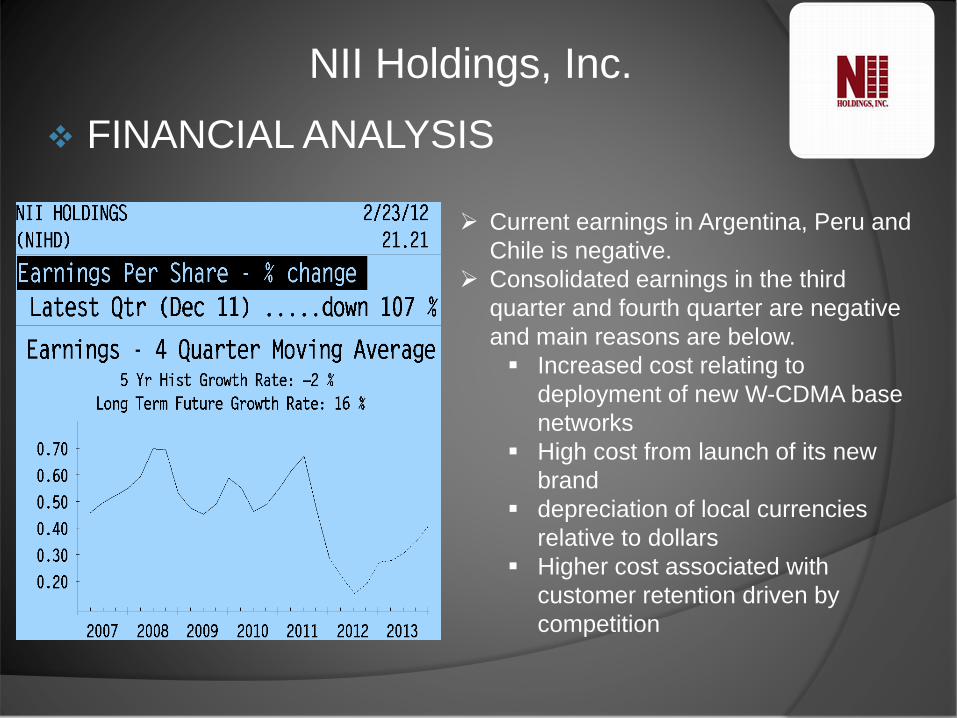
NII Holdings, Inc.
Current earnings in Argentina, Peru and Chile is negative.
Consolidated earnings in the third quarter and fourth quarter are negative and main reasons are below. Increased cost relating to
deployment of new W-CDMA base networks
High cost from launch of its new brand
depreciation of local currencies relative to dollars
Higher cost associated with customer retention driven by competition
FINANCIAL ANALYSIS

NII Holdings, Inc. FINANCIAL ANALYSIS

NII Holdings, Inc. Valuations Method

NII Holdings, Inc.

NII Holdings, Inc. DCF Model
Terminal Discount Rate = 12.0%Terminal Cash Flow Growth Rate = 4.5%
NPV of Cash Flows 2,170 58%NPV of terminal value 1,564 42%Projected Equity Value 3,734 100%Free Cash Flow Yield 13.06%
Current P/E 15.0 10.3Projected P/E 18.7 12.8
Current EV/EBITDA 3.8 3.2Projected EV/EBITDA 4.2 3.6
EBIDTA/share 9.4 11.2
Shares Outstanding 171
Current Price $ 17.50Implied equity value/share $ 21.81
Upside/(Downside) to DCF 24.7%
Terminal Discount Rate
10.5% 11.0% 11.5% 12.0% 12.5%
Terminal FCFgrowthrate
6.0% 31.3 28.5 26.2 24.3 22.6
5.5% 29.5 27.0 25.0 23.3 21.9
5.0% 27.9 25.8 24.0 22.5 21.2
4.5% 26.7 24.8 23.2 21.8 20.6
4.0% 25.6 23.9 22.5 21.2 20.1
3.5% 24.7 23.2 21.8 20.7 19.6
NII Holdings, Inc.
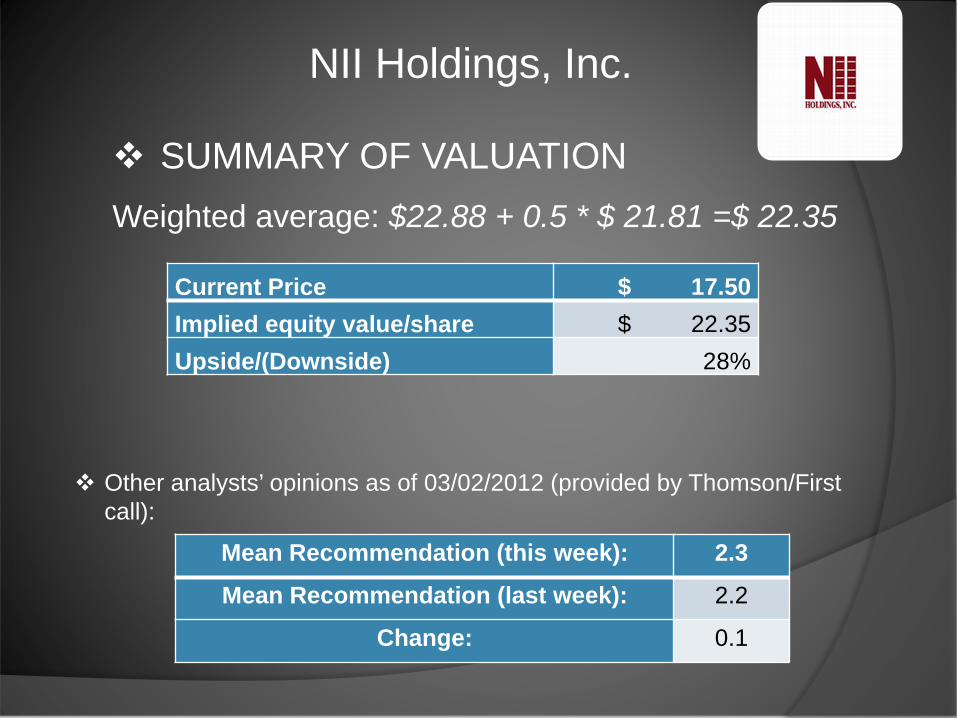
Current Price $ 17.50 Implied equity value/share $ 22.35 Upside/(Downside) 28%
Weighted average: $22.88 + 0.5 * $ 21.81 =$ 22.35
SUMMARY OF VALUATION
Other analysts’ opinions as of 03/02/2012 (provided by Thomson/First call):
Mean Recommendation (this week): 2.3
Mean Recommendation (last week): 2.2
Change: 0.1

NII Holdings, Inc.
RecommendationsNegatives: Net loss in consecutive two quarters of 2011
attributed to high costsMore intense competitive environmentDepreciating local currency values. High LT debt to total capital: 50%
PositivesThe famous Nextel brand nameHigh market shares and fast revenue growthSunk cost in 2011 related to the deployment of
3G networksHigh upside about 28%.
Recommendation: Hold


MetroPCS
Wireless telecom provider Low-cost, no-contract services Added 1m+ customers each of past 6 years
Client base expected to pass 10m in 2012 Focus on high density metropolitan areas
Competition: Boost Mobile, TracFone, and new services from AT&T and Verizon

5 Year Performance
MetroPCS

2 Year Performance
MetroPCS
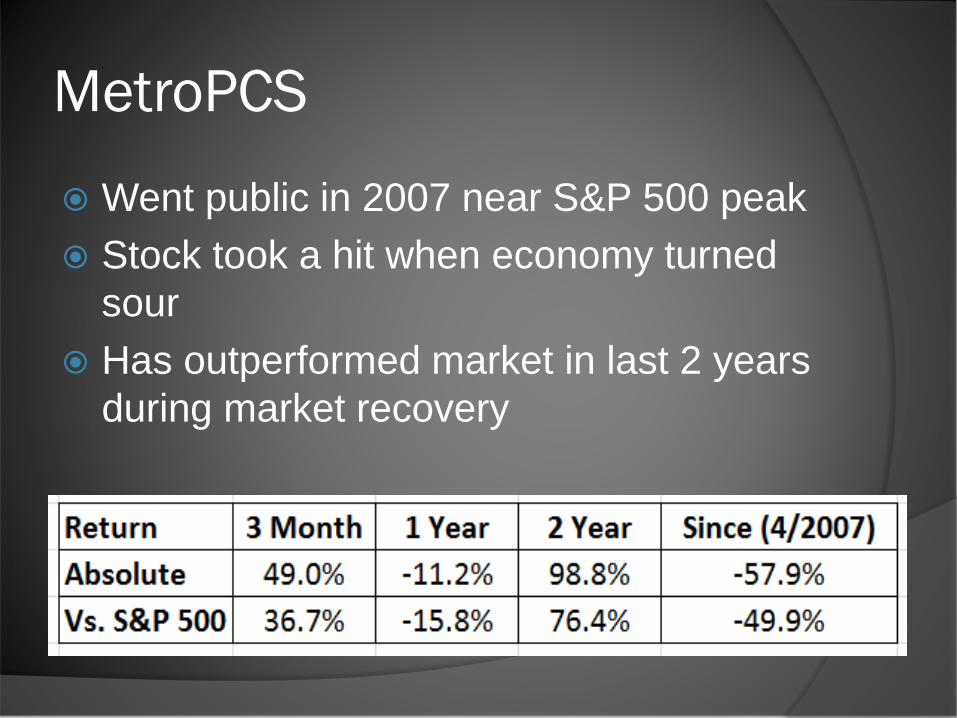
MetroPCS
Went public in 2007 near S&P 500 peak Stock took a hit when economy turned
sour Has outperformed market in last 2 years
during market recovery

ROE Absolute:
MetroPCS

ROE Relative to Sector:
MetroPCS
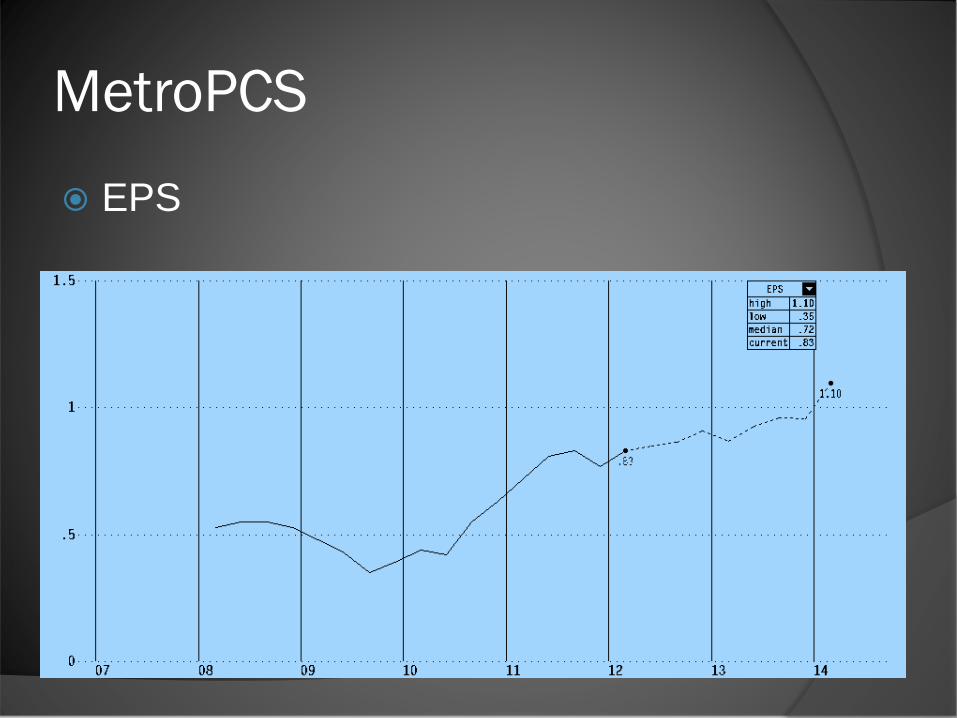
MetroPCS
EPS

MetroPCS
EPS Growth Relative to S&P 500
MetroPCS
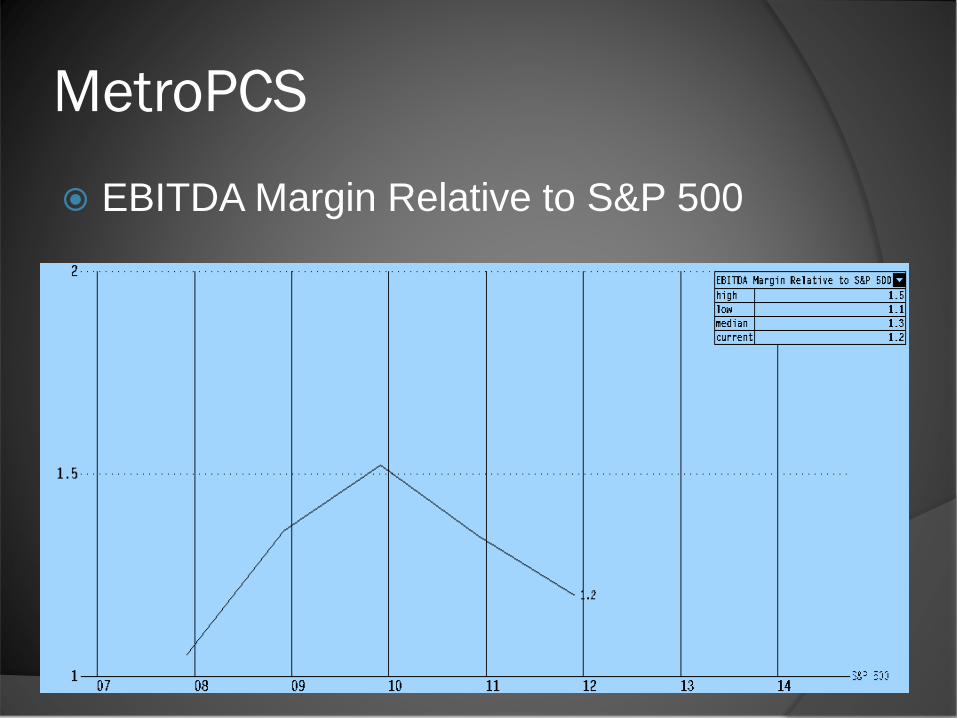
EBITDA Margin Relative to S&P 500

Positives: Strong, steady growth projected We expect ROE to outpace sector $2.2B (23%) of Assets made up of Cash and
Short Term Assets (Sector Average is 4%) Considered a top candidate for M&A deal
Risks: Increasing competition could squeeze margins New rebate program to attract new customers Government regulation and spectrum limits
MetroPCS
MetroPCS
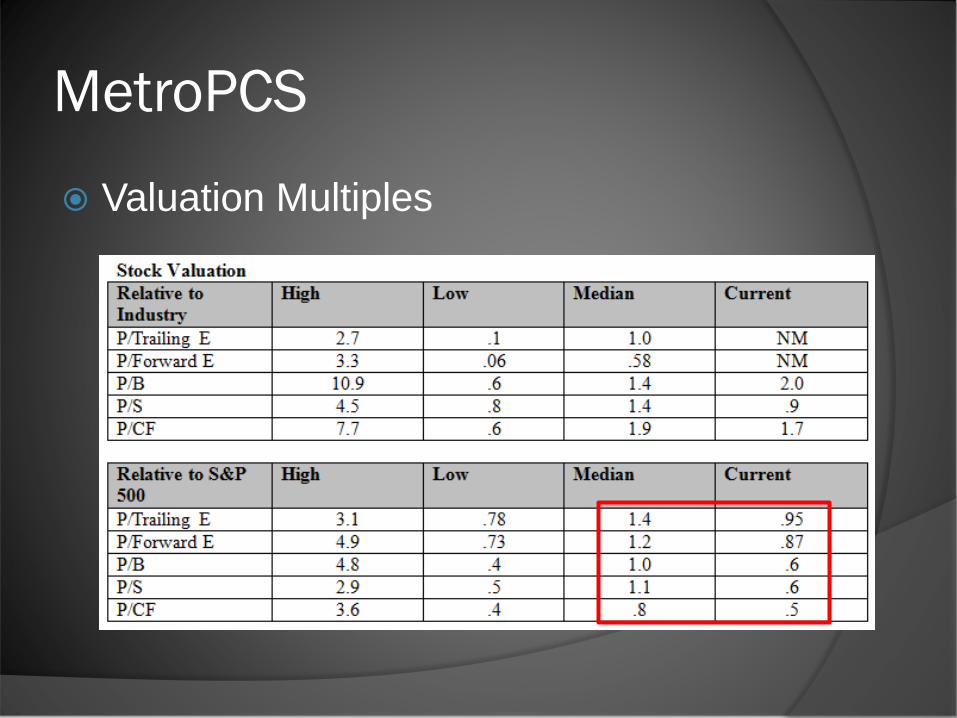
Valuation Multiples
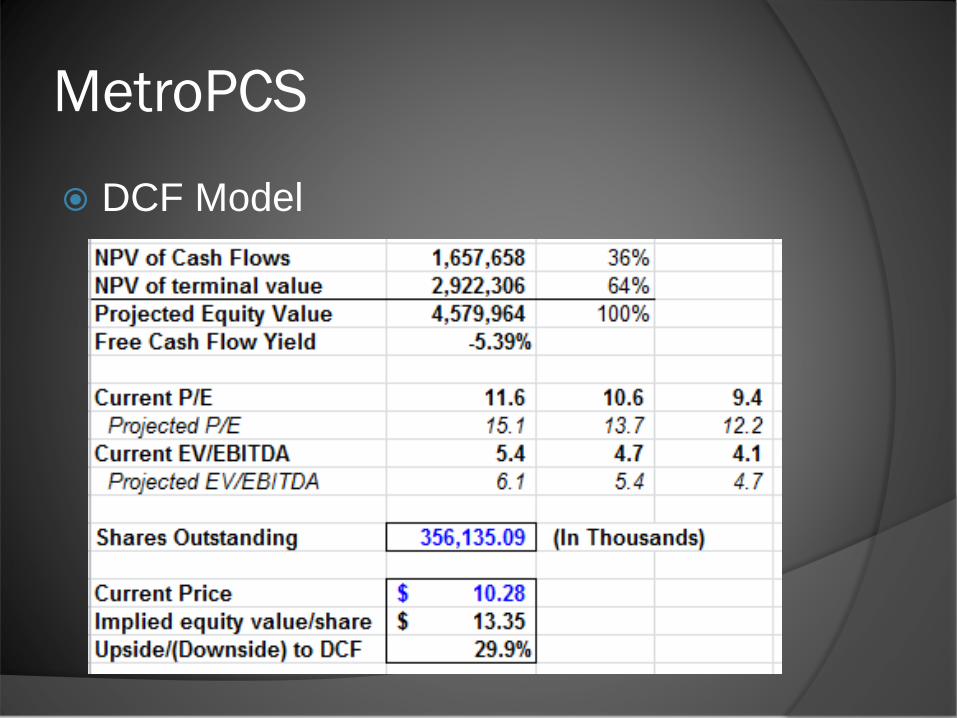
DCF Model
MetroPCS
MetroPCS
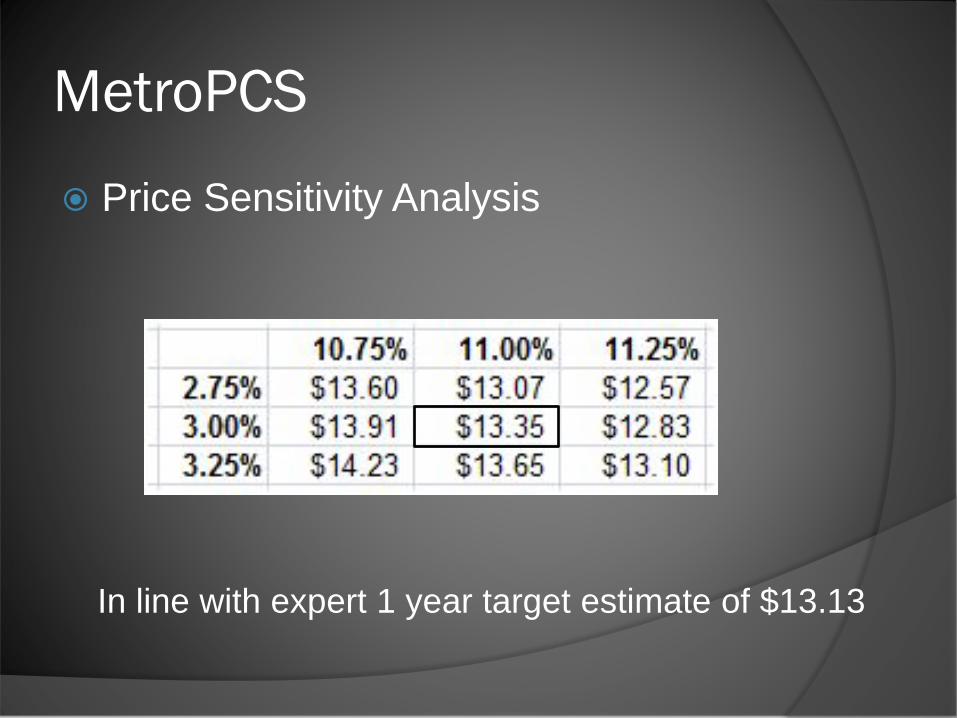
Price Sensitivity Analysis
In line with expert 1 year target estimate of $13.13

MetroPCS
Technical Analysis


Recommendations
AT&T NII Holdings Total
Current SIM Weight 1.97% 1.56% 3.53%
Recommended SIM Weight 0.00% 1.56% 1.56%
Consider adding MetroPCS in future

Questions?
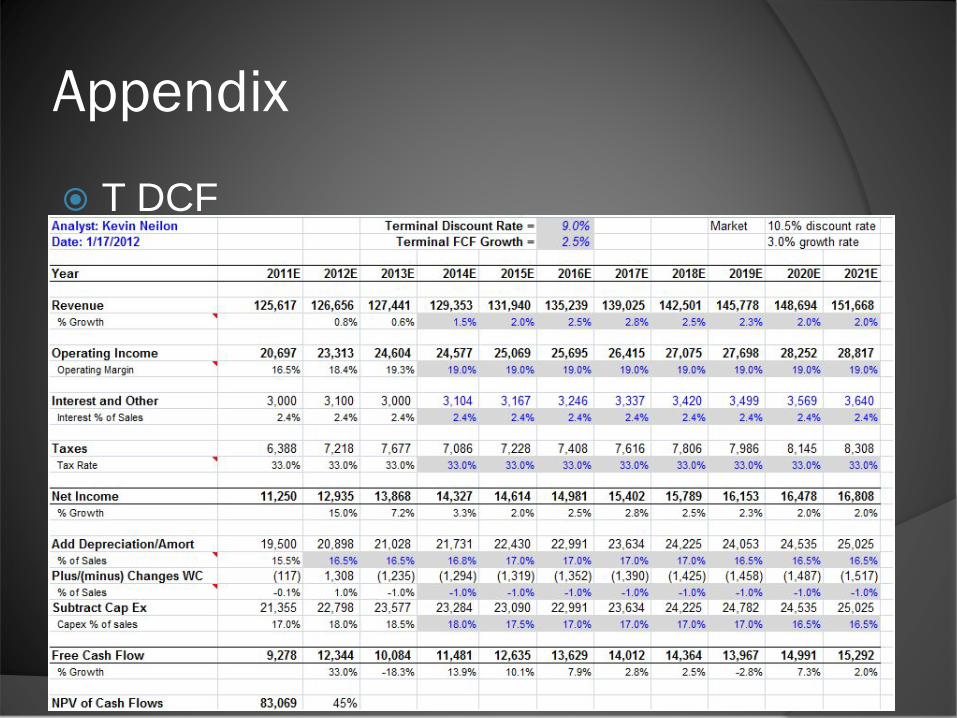
Appendix
T DCF

Year 2011E 2012E 2013E 2014E 2015E 2016E 2017E 2018E 2019E 2020E 2021E
Revenue 6,719 7,727 8,423 9,181 9,961 10,758 11,565 12,374 13,179 13,970 14,738 % Growth 15.0% 9.0% 9.0% 8.5% 8.0% 7.5% 7.0% 6.5% 6.0% 5.5%
Operating Income 831 970 1,268 1,157 1,195 1,291 1,388 1,485 1,581 1,676 1,769 Operating Margin 12.4% 12.6% 15.1% 12.6% 12.0% 12.0% 12.0% 12.0% 12.0% 12.0% 12.0%
Interest and Other 288 514 592 734 797 861 925 990 1,054 1,118 1,179 Interest % of Sales 8.8% 6.6% 7.0% 8.0% 8.0% 8.0% 8.0% 8.0% 8.0% 8.0% 8.0%
Taxes 343 164 243 152 143 155 167 178 190 201 212 Tax Rate 36.0% 36.0% 36.0% 36.0% 36.0% 36.0% 36.0% 36.0% 36.0% 36.0% 36.0%
Net Income 199 292 433 270 255 275 296 317 337 358 377 % Growth 46.6% 48.2% -37.5% -5.7% 8.0% 7.5% 7.0% 6.5% 6.0% 5.5%
Add Depreciation/Amort 786 943 1,036 1,102 1,195 1,291 1,388 1,485 1,581 1,676 1,769 % of Sales 11.7% 12.2% 12.3% 12.0% 12.0% 12.0% 12.0% 12.0% 12.0% 12.0% 12.0%
Plus/(minus) Changes WC 206 138 95 46 (40) (43) (46) (49) (53) (56) (59)% of Sales 3.1% 1.8% 1.1% 0.5% -0.4% -0.4% -0.4% -0.4% -0.4% -0.4% -0.4%
Subtract Cap Ex 800 896 943 1,102 1,195 1,291 1,388 1,485 1,581 1,676 1,769 Capex % of sales 11.9% 11.6% 11.2% 12.0% 12.0% 12.0% 12.0% 12.0% 12.0% 12.0% 12.0%
Free Cash Flow 391 476 621 316 215 232 250 267 285 302 318 % Growth 21.7% 30.3% -49.0% -32.0% 8.0% 7.5% 7.0% 6.5% 6.0% 5.5%
NPV of Cash Flows 2,060 60%
NPV of terminal value 1,394 40% Terminal Value 4,393
Projected Equity Value 3,453 100%
Free Cash Flow Yield 12.51% Free Cash Yield 7.25%
Current P/E 15.7 Terminal P/E 11.6
Projected P/E 17.3
Current EV/EBITDA 3.9 Terminal EV/EBITDA 2.1
Projected EV/EBITDA 4.1 EBIDTA/share 9.2
Shares Outstanding 175
Current Price $ 17.88 17.88Implied equity value/share $ 19.73 22.14Upside/(Downside) to DCF 10.4% 23.8%
Debt 4,870 Cash 1,770
NIHD DCF
Appendix

Appendix
PCS DCF


![NEIlON - a2p2l4daysk2lcyxv62818v6-wpengine.netdna-ssl.com · NEIlON LABORATORIES NELSON LABORATORIES, INC. QAU AUDIT STATEMENT [X] USFDA (21 CFR PART 58) [ ]USEPA (40 CFR PART 160)](https://img.dokumen.tips/doc/110x75/5f16973df9ba3a4e8d481289/neilon-a2p2l4daysk2lcyxv62818v6-neilon-laboratories-nelson-laboratories-inc.jpg)