Embed Size (px)
Citation preview

Kentucky Division of Water
2014 Annual Report
Commonwealth of Kentucky
Energy and Environment Cabinet
Department for Environmental Protection
Division of Water
water.ky.gov

1
CONTENTS
Introduction 2
Division of Water Mission Statement 4
Organizational Chart 5
Compliance and Technical Assistance Branch 6
Resource Planning and Program Support Branch 15
Surface Water Permits Branch 19
Water Infrastructure Branch 25
Watershed Management Branch 33
Water Quality Branch 41

2
Dear Reader,
The Division of Water is pleased to provide this annual report which outlines the division’s progress in its mission to manage, protect and enhance the water resources of the Commonwealth. This annual report summarizes the past year’s work of the division’s scientists and specialists toward reaching these goals. I have outlined some highlights of this year’s efforts. The Division of Water engaged stakeholder groups through its Drinking Water Advisory Committee early in 2014 to discuss proposed amendments to three drinking water regulations. The amendments require better sampling techniques, establish maximum levels of E. coli, adopt the federal Reduction of Lead and Drinking Water Act of 2011, and clarify requirements for bottle water producers to align with federal standards. The regulations should be effective by the end of 2014. The division received a Federal Emergency Management Agency (FEMA) Dam Safety grant to integrate Risk Map Program with Dam Safety models. The division is one of the first state dam safety programs to utilize these innovative dam-breach modeling programs. Additionally, the federal Natural Resources Conservation Service provided 17 Emergency Action Plans (EAPs) and Kentucky Utilities/Louisville Gas and Electric developed four EAP’s as part of its Dam Safety Mitigation Plan with FEMA. One hundred eighteen dams now have EAPs and the division continues developing EAPs for those high hazard dams lacking such plans. The division is also working to reduce the hazards of flooding by encouraging flood-prone communities to enroll in the National Flood Insurance Program, administered by FEMA. The Kentucky Wastewater Laboratory Certification program became effective September 5, 2013. This program will standardize the procedures used in obtaining and analyzing wastewater compliance samples and reporting results to help ensure the quality of analytical data used by the division for purposes of compliance with KPDES permits. In cooperation with DNR, the division performed Compliance Evaluation Inspections (CEIs) for coal facilities with regard to the water quality of runoff and receiving streams. The compliance rate was 7.8% for inspected coal facilities. Most of the documented violations pertained to the review of Discharge Monitoring Reports. Kentucky met the EPA commitment for federal fiscal year 2013 to complete 100 coal Compliance Evaluation Inspections. One hundred additional coal facilities inspections were added and expected to be completed by the end of the 2014 federal fiscal year. During fiscal year 2014, the division’s field office inspectors investigated a total of 1,600 water-related citizen complaints. This marks the seventh consecutive year the number of complaints statewide has decreased. Over that time, complaints have decreased by 37 percent. Additionally, 4,493 inspections were performed in the areas of wastewater, storm water, drinking water, animal feeding operations, coal, and oil and gas. Nutrient pollution remains a national issue with significant local impacts, and the division has developed the Kentucky Nutrient Reduction Strategy to identify sources of nutrients in Kentucky, methods of addressing nutrients, and source-specific strategies for nutrient reduction in priority watersheds.
INTRODUCTION

3
The division worked to issue six (6) general permits this year, including permits for abandoned mine lands, aviation facilities, concrete and asphalt products and paving facilities, non-coal mineral mining and processing, and coal mining and processing in the eastern and western Kentucky coal fields. I invite you to read more about these activities and other accomplishments as we work to protect and manage the waters of the Commonwealth. I look forward to continued implementation of the division’s operational plan and to meeting the challenges of the coming year. Peter T. Goodmann, Director Kentucky Division of Water

4
The Division of Water Operational Plan is intended to serve as an annual road map toward accomplishing its
mission, taking into consideration current environmental, regulatory and resource conditions. The division has
identified four major objectives in this endeavor:
1. Protect, manage and restore water resources.
a. Develop and implement Total Maximum Daily Loads (TMDLs).
b. Implement a Nutrient Reduction Strategy.
2. Conduct effective water resources planning.
a. Revise and update the guidance for Kentucky’s Watershed Approach.
b. Promote the U.S. EPA’s Sustainable Infrastructure Initiative.
c. Plan for sustainable infrastructure.
d. Participate in U.S. EPA rulemaking.
3. Meet federal and state program requirements.
a. Meet federal grant and work plan requirements.
b. Meet state requirements and maintain progress toward achieving and maintaining zero permit
backlogs.
4. Promote better management and communication of data.
a. Implement an integrated data management system for water quality data.
b. Implementation of SharePoint to educate the public and assist regulated entities with compliance
with program requirements.
c. Water Availability Tool for Environmental Resources Application (WATER) implementation on
Geographical Information System (GIS) terminal server.
d. Promote better decision making through GIS and data analysis.
e. Transition from the Permit Compliance System (PCS) to the Integrated Compliance Information
System (ICIS) to improve permit compliance, tracking and data analysis.
DIVISION OF WATER MISSION STATEMENT
To manage, protect, and enhance the quality and quantity of the Commonwealth’s water
resources for present and future generations through voluntary, regulatory and
educational programs.

5
MANAGEMENT
BRAN
ORGANIZATIONAL CHART
DIRECTOR
Peter Goodmann
SURFACE WATER
PERMITS BRANCH
Jory Becker
COMPLIANCE AND TECHNICAL ASSISTANCE
BRANCH
Tom Gabbard
CONSTRUCTION AND
COMPLIANCE SECTION
Amy VanHorne
OPERATIONAL PERMITS SECTION Jeff Pratt
PERMIT SUPPORT SECTION
Shawn Hokanson
FLORENCE SECTION
Todd Giles
LOUISVILLE SECTION
Charles Roth
FRANKFORT SECTION
Rob Daniels
HAZARD SECTION
Damon White
LONDON SECTION
Robert Miller
MADISONVILLE
SECTION
Randy
Thomas
BOWLING GREEN
SECTION Bill Baker
COLUMBIA SECTION
Brian Crump
PADUCAH SECTION
Shannon McLeary
MOREHEAD SECTION
Dan Fraley
RESOURCE
PLANNING AND
PROGRAM
SUPPORT
Diane Marcus
RESOURCE PLANNING SECTION
Karen Cronen
GRANT MANAGEMENT
SECTION
Kristie Graham
WET WEATHER SECTION
Lynne Brosius
FLOODPLAIN MANAGEMENT
SECTION
Todd Powers
WATER
INFRASTRUCTURE
BRANCH
Shafiq Amawi
WASTEWATER MUNICIPAL PLANNING
SECTION Cindy McDonald
SRF AND SPAP SECTION
Buddy Griffin
DRINKING WATER
CAPACITY DEVELOPMENT
SECTION
Cindy McDonald
(Acting)
ENGINEERING SECTION
Mark Rasche
DAM SAFETY AND FLOODPLAIN COMPLIANCE
SECTION Shane Cook
WATERSHED MANAGEMENT
BRANCH
Paulette Akers
NONPOINT SOURCE
AND BASIN TEAM
SECTION
James Roe
GIS AND DATA ANALYSIS SECTION
Jo Blanset
WATER QUANTITY
MANAGEMENT
SECTION
Chris Yeary
GROUNDWATER SECTION
David Jackson
WATER QUALITY
BRANCH
Clark Dorman
MONITORING SECTION
Rodney Pierce
WATER QUALITY CERTIFICATION
SECTION Adam Jackson
TMDL SECTION
Vacant
DRINKING WATER
COMPLIANCE
AND TECHNICAL
ASSISTANCE
SECTION
Vacant
ASSISTANT DIRECTOR Peter Goodmann (Acting)
WASTEWATER LAB CERT SECTION
Frank Hall
Department for Environmental Protection
Division of Water 200 Fair Oaks Lane
Frankfort, KY 40601 502-564-3410

6
The Compliance and Technical Assistance Branch (CTAB), staffed by 89 employees, includes ten Regional Field
Offices, and the Compliance and Technical Assistance section of the Drinking Water Program.
Regional Field Offices
The field staff in each of the Division of Water regional offices performs a wide variety of inspections and
addresses the concerns raised by the public with swift responses to complaints and emergencies. The division
requires its inspectors to have broad programmatic knowledge and experience in addressing compliance
issues. Inspectors must also be well trained and equipped in order to perform consistent inspections, provide
technical assistance and implement appropriate enforcement action.
During the Fiscal Year 2014, 41 inspectors performed 4,493 inspections in the areas of wastewater, storm
water, drinking water, animal feeding operations (AFO), coal, and oil and gas. These inspections are integral to
the protection and improvement of Kentucky’s water quality.
A U.S. EPA grant work-plan commitment requires the division to perform a specified number of inspections at
preselected facilities. The division committed to performing 1,252 inspections during the Federal Fiscal Year
2014 and as of June 30, 2014, 815 inspections were completed. Inspectors are on track to fulfill 100 percent of
the grant commitment by September 30, 2014, the end of the federal fiscal year.
Wastewater 1553
Stormwater 1309
Drinking Water
743
237 AFO/CAFO
Oil and Gas 544
DOW Inspections FY14
COMPLIANCE AND TECHNICAL ASSISTANCE BRANCH

7
Complaints Continue to Decline
Compliance regulations require permitted facilities to notify the Division of Water when certain disruptions
occur. The most common notifications are wastewater bypasses/overflows, drinking water main breaks, low
pressure or loss of pressure in a drinking water distribution system, and loss of disinfection or other treatment
disruption.
An examination of the data indicates the number of complaints steadily decreasing while the number of
notifications is increasing. The division received 9,563 required notifications in FY14, compared to 8,245
notifications during FY13. During FY14, field office inspectors investigated a total of 1,600 water-related
citizen complaints. The number of complaints statewide has decreased by 37 percent over the last six years.
Division regional office personnel expend significant resources responding to complaints and notifications,
which range from routine to the complexities that surround ice storms and flooding events. The division faces
challenges in planning for these occurrences, which are often unpredictable in nature and extent.
Nevertheless, inspectors continue to complete timely and professional responses.
Overall wastewater, stormwater, drinking water, oil and gas, and AFO/CAFO compliance improved in FY14.
Inspection data illustrates since 2009, compliance has increased approximately ten percent to an average rate
of 78 percent for inspections of wastewater (excluding coal), stormwater, drinking water, AFO/CAFO
2540
2292
2227
1937
1774
1600
0 500 1000 1500 2000 2500 3000
SFY09
SFY10
SFY11
SFR12
SFY13
SFY14
DOW Compaints Received

8
operations, and oil and gas. However, the addition of newly added inspections of coal facilities, which have a
compliance rate of 7.8 percent, reduces the average compliance rate across all programs to 67 percent.
*The number of permitted facilities does not include coal inspections.
While the compliance rate of permitted facilities increased, the number of sites receiving Notices of Violation
also increased from 431 in FY13 to 448 in FY14. The number of Letters of Warning issued to inspected facilities
increased from 85 in FY13 to 88 in FY14.
60%
62%
64%
66%
68%
70%
72%
74%
76%
78%
80%
2009 2010 2011 2012 2013 2014
Percent of Facilities in Compliance FY09 - FY13

9
The Division of Water Completes the First Year of Coal Compliance
Evaluation Inspections
In 2013, the Division of Water, in cooperation with the Department for Natural
Resources (DNR), began Compliance Evaluation Inspections (CEI) of coal facilities
with regard to water quality of outfall effluent and receiving streams. The coal
CEI process relies on the participation of DNR field inspectors, support from
division field personnel, and coordination from the central office.
The field aspects of the inspection includes the examination of the permit
holder’s record keeping and best management practices, as well as the physical
inspection of water quality at outfall locations and receiving streams. The second
part of a coal CEI involves the review of Discharge Monitoring Reports to
determine compliance with the facility’s Kentucky Pollution Discharge Elimination
System effluent limits. The results of the field inspection and the discharge data
review determine whether the facility is in overall compliance.
The compliance rate for coal facilities inspected was 7.8 percent. Most of the
documented violations for coal facilities pertained to the review of Discharge
Monitoring Reports.
Kentucky met the EPA commitment for the completion of 100 coal Compliance
Evaluation Inspections during Federal Fiscal Year 2013, and began a second
inspection cycle of 100 additional coal facilities.

10
Drinking Water Program
Approximately 95 percent of Kentuckians have access to drinking water from public water systems that are
required to meet the strict standards of the federal Safe Drinking Water Act (SDWA). In Kentucky, the division
has the administrative and regulatory authority to implement SDWA, through which the EPA sets maximum
contaminant levels (MCLs) for the amounts of metals and contaminants that may occur in finished drinking
water. The division is responsible for ensuring the water produced at public drinking water treatment plants
does not exceed those established levels.
The Division of Water also works closely with drinking water treatment plants and distribution systems to
ensure systems make good source water choices and conduct source water planning and protection, that the
systems treat and distribute water properly, and test and monitor for contaminants. Public water systems
(PWSs) must sample the finished water on a prescribed schedule to ensure treatment is removing
contamination from the source water before distribution drinking water to its customers. The division
requires all sample testing performed in laboratories be certified by the Drinking Water Program.
Drinking Water Primacy
As of June 2014, there were 456 public water systems in Kentucky, compared to 455 as of June 2013. The
Division of Water provides primary enforcement authority (“primacy”) oversight for implementing the SDWA
for these water systems. As a condition of primacy, the state must adopt and administer state rules that are at
least as stringent as federal requirements. As of December 2013, Division of Water has primacy for the entire
public water system program under the Safe Drinking Water Act. EPA finalized its Revised Total Coliform Rule
(RTCR) in early 2012 with an effective date of April 2016. In consultation with the Drinking Water Advisory
Committee, the division began revising existing state drinking water regulations in February 2014. On July 15,
2014, proposed amendments were filed to 401 KAR 8:200 (Microbiological monitoring) which adopts the
federal RTCR, 401 KAR 8:300 (Lead and copper) to adopt the Reduction of Lead in Drinking Water Act of 2011,
and 401 KAR 8:700 (Bottled water), with the Legislative Research Commission. The division anticipates
finalization of the three regulations by the end of the 2014 calendar year.
Drinking Water Compliance at Public Water Systems
Kentucky released the 2013 Annual Compliance Report in June 2014. This report summarizes drinking water
violations by category and public water system. Drinking water violations are tracked on a calendar year cycle.
The division issued 568 violations issued for calendar year 2013; the number of health-based violations rose
slightly (from 48 to 52), while monitoring and reporting violations decreased.

11
Ninety-one percent of the violations issued in 2013 were for monitoring and/or reporting (“paperwork”)
violations. The decrease was primarily due to more accurate and timely reporting.
For the 2013, Consumer Confidence Reports more than 58 percent of the community water systems opted to
use the “eCCR” format (as compared to 36 percent for 2012).
The division also participates in national discussions on drinking water issues and represents the EPA Region 4
states on the Association of State Drinking Water Administrators national board. For FY14, the division
referred seven water systems to the Division of Enforcement for formal action under the EPA’s Enforcement
Referral Policy, including one bottled water facility.
74 113 99
130 103 48 52
913
639 648
459 451
727
516
0
100
200
300
400
500
600
700
800
900
1000
2007 2008 2009 2010 2011 2012 2013
Public Water System Violation Trends 2007-2013
Health-based
M&R
0
100
200
300
400
500
600
700
800
2007 2008 2009 2010 2011 2012 2013
2007-2013 Violation History by Violation Category
MaximumContaminant Level
TreatmentTechnique
Reporting
Monitoring

12
Drinking Water Technical Assistance Improves Health-based Performance
Division technical assistance (TA) is available to all public water systems in the form of site
visits, training and sanitary surveys. Drinking Water Technical Assistance staff provided more
than 160 assistance contacts in FY14. A successful component of technical assistance continues
to be the Area-Wide Optimization Program, or AWOP. AWOP is a voluntary effort by those
drinking water systems that treat surface water and focuses on turbidity (microbial) removal and disinfection
by-product reduction. For FY13, the division recognized 61 surface water treatment plants for commitment to
AWOP and for meeting the AWOP goals for turbidity, which is a measure of particulate matter in water.
As the majority of Kentucky’s drinking water health-based violations are related to DBP formation, TA efforts
focused on resolving current violations and preventing future DBP problems. The division plans to use the
national AWOP turbidity effort as a model to develop targeted DBP training. In FY14, technical assistance staff
attended two Region 4 Comprehensive Performance Evaluations (CPE) focusing on optimizing distribution
systems for minimizing DBPs. Kentucky hosted a third CPE in August of 2014. A multi-system Performance-
Based Training event focusing on DBP control included six systems located in southeast Kentucky and will
conclude in the late summer of 2014.
222,834
475,000
1,016,347
823,146 718,530
1,114,994
1,513,897
2,165,311
2,371,781
0
500,000
1,000,000
1,500,000
2,000,000
2,500,000
2005-13 2006-24 2007-32 2008-30 2009-32 2010-39 2011-49 2012-50 2013-61Year - Number of Plants
Population Served by Microbial Optimized Water Plants
(NOTE:Consecutive systems Not Included in 2005 and 2006 figures)

13
Drinking Water Source Protection and Spill Response Activities
The Kentucky Division of Water drinking water program personnel provided assistance during the Elk River/Ohio River 4-Methylcyclohexanemehtanol spill in January 2014, which affected ten public water systems that rely on the Ohio River for source water. Response activities included sample collection, analysis coordination, water system assistance and inter-agency communication.
Division program personnel are also involved in the development of the “Harmful Algal Bloom” (HAB) strategy for state waters and public water systems. The Louisville office of the U.S. Army Corps of Engineers began to monitor HAB levels in five lakes in the summer of 2013. These HABs have not impacted drinking water quality and the division is working with public water systems using the affected lakes to monitor and properly treat affected source waters. The public water systems are familiar with algal control strategies and implement them as needed.
Wastewater Laboratory Certification Program
Wastewater
The Kentucky Wastewater Laboratory Certification Program was established this year to ensure that
compliance data for KPDES permits is compliant with sampling and analysis requirements. The Kentucky
Wastewater Laboratory Certification Program regulations became effective September 5, 2013 with tiered
compliance dates of January 1, 2014 for “General” laboratories and January 1, 2015 for “Field Only”
laboratories. The program standardizes procedures used in analyzing Kentucky Pollutant Discharge Elimination
System (KPDES) compliance samples and reporting results to help ensure the quality of analytical data used by
the division.
The Wastewater Laboratory Certification Program establishes procedures for applying for certifications,
annual fees, appropriate methods and references for evaluating and assuring laboratory meet acceptable
accuracy and precision requirements. The certification requirement will affect approximately 300 private and
public laboratories that provide wastewater-testing services associated with the KPDES permit program. Fifty-
one wastewater labs have submitted applications. Thirty-three certifications were issued and seven onsite
audits were performed.

14
Drinking Water
Similar to the Wastewater Laboratory Certification Program, the Kentucky Drinking Laboratory Certification
Program, which has existed for many years, is intended to ensure that compliance sample monitoring and
analyses meet the applicable rigorous federal standards. The Drinking Laboratory Certification Program has
three staff and one contractor all of whom are EPA certified laboratory auditors. The certified auditors
collectively maintain certification in all disciplines of drinking water certification including chemistry,
microbiology, radionuclide, and cryptosporidium.
Kentucky Certified Drinking Water Laboratories
# Chemistry Laboratories Certified in State (# Out-of-State)
# Microbiology Laboratories Certified in State (# Out-of-State)
# Radiochemistry Laboratories Certified in State (# Out-of-State)
# Cryptosporidium Laboratories Certified in State (# Out-of-State)
13 / (28)
44 / (2)
0 / (7)
2 / (2)
15
Resource Planning and Program Support Branch (RPPS) is responsible for strategic planning, grants management, and coordinating and supporting the administrative, and the financial and infrastructure functions of the division, including the development and management of the division’s budget. RPPS also facilitates the development and promulgation of division regulations and legislation. This involves drafting regulations and legislative proposals, coordinating public hearings and distributing newly filed administrative regulations to public subscribers, tracking state and federal bills generated during legislative sessions, and directing information to the appropriate division branches for comments and official response by the director.
The RPPS Branch experienced significant organizational change during FY14. Governor Beshear's Executive Order 2012-880 "Regarding the Centralization of Information Technology Infrastructure Resources across the Commonwealth" directed the executive branch to adopt a centralized Information Technology (IT) services model. The Energy and Environment Cabinet’s IT functions began consolidation in November, 2013 under the Information Technology Infrastructure Initiative (I.3) program COT now manages a variety of IT services to assist and support the needs and infrastructure of the Division of Water.
Employee positions and functions from the Data Entry and Management and Information Technology sections were reorganized and administratively moved to the Division of Environmental Program Support in January 2014. Those functions included data entry, file room management, processing open records requests, managing the Tools for Environmental Management and Protection Organizations (TEMPO) database, Safe Drinking Water Information Systems (SDWIS) and the Kentucky Water Assessment Data Exchange (K-WADE).
The Grants Management Section expanded to include two positions and functions previously in the Program Support Section. This section managed federal grant programs to support personnel costs, equipment, training, and travel. Federal funds also supported projects developed in coordination with the division and implemented by a variety of nonprofit groups, state universities, local governments, other state agencies and private sector companies. All projects focused on water quality or infrastructure. Following its expansion, the Grants Management Section also became responsible for vendor contracts and procurement, processing receipts, issuing refunds, invoice receipt and payment, tracking inventory, and ordering equipment and supplies. The RPPS Branch also coordinates Division of Water training, travel approval and reimbursement, medical monitoring, and pro card administration.
The Resource Planning Section restored three employees responsible for disseminating public information
regarding the Division of Water, responding to public inquiries, training and meeting facilitation, compilation
of the strategic operational plan and the agency annual report, monitoring permit issuances and backlog, and
NetDMR Coal data review and quality assurance.
Budget Issues
General fund appropriations, federal grants from the U.S. Environmental Protection Agency (EPA) and FEMA, fees collected for permitting and certification activities, and an annual Road Fund appropriation maintain the Division of Water’s activities. Federal funding comprised 54 percent of the division budget in FY14, a 2 percent reduction from the previous year. However, the budget from FY2010 to FY2014 reflected a 14 percent increase in overall federal funding. This trend indicates an increasing reliance on federal funds to support
RESOURCE PLANNING AND SUPPORT BRANCH

16
agency personnel and operations. General funds have steadily declined for all state agencies and are projected to decrease even further unless available revenue sources can be created or increased.
Receipts from fees collected from permits and certifications increased in FY14 with the collection of Wastewater Lab Certification. The increase in permit and certification fee receipts lessened the impact but did not completely offset the decreases in general and federal funding.
Grants Management Section
Federal receipts for FY14 consisted of the following grants:
Performance Partnership Grant
Section CWA § 319(h) Nonpoint Source Grant
0%
10%
20%
30%
40%
50%
60%
2010 2011 2012 2013 2014
General Fund
Agency Fund
Federal Fund
Road Fund
$0 $5,000,000 $10,000,000 $15,000,000 $20,000,000
FY2010
FY2011
FY2012
FY2013
FY2014
Road Agency Federal General

17
Water Quality Management Planning CWA § 604(b) Grant
Clean Water State Revolving Loan set-aside funds
Drinking Water State Revolving Loan set-aside funds
Clean Water Act Wetland Protection Grants
Section 106 Supplemental Monitoring Initiative Grant
FEMA Grants (Floodplain Mapping, Dam Safety, Community Assistance)
EPA continued to request additional reporting on unliquidated obligations of older SRF and 319(h) grant funds as well as outlay strategies on new grant funds received, especially those expended over the course of more than one year (e.g., 319(h), SRF set-aside funds). Greater congressional and Office of Management and Budget scrutiny has prompted this focus on unobligated funds. Kentucky has a very low percentage of unliquidated obligations.
Regulation Development
The Division of Water began engaging stakeholder groups through its Drinking Water Advisory Committee early in 2014 to discuss proposed amendments to three drinking water regulations. The proposed amendments were filed with the Legislative Research Commission on July 15:
401 KAR 8:200 Microbiological monitoring
401 KAR 8:300 Lead and copper
401 KAR 8:700 Bottled water
Amendments to the microbiological testing regulation adopt the federal Revised Total Coliform Rule, 40 CFR 141.851 through 861, require improved sampling techniques and establish a maximum E. Coli contaminant level. The lead and copper regulation amendment adopts the federal Reduction of Lead in Drinking Water Act of 2011 which became effective January 4, 2014 and reduces lead content in plumbing materials and fixtures used for drinking water distribution. The bottled water regulation amendments reorganize the regulation for clarity and align the requirements for bottled water producers with federal standards. Adoption of 401 KAR 8:200 and 8:300 is also required for Kentucky to maintain its primacy in administering the Safe Drinking Water Act in the Commonwealth. Barring any unforeseen delays, the regulations should take effect by the end of 2014.
Personnel
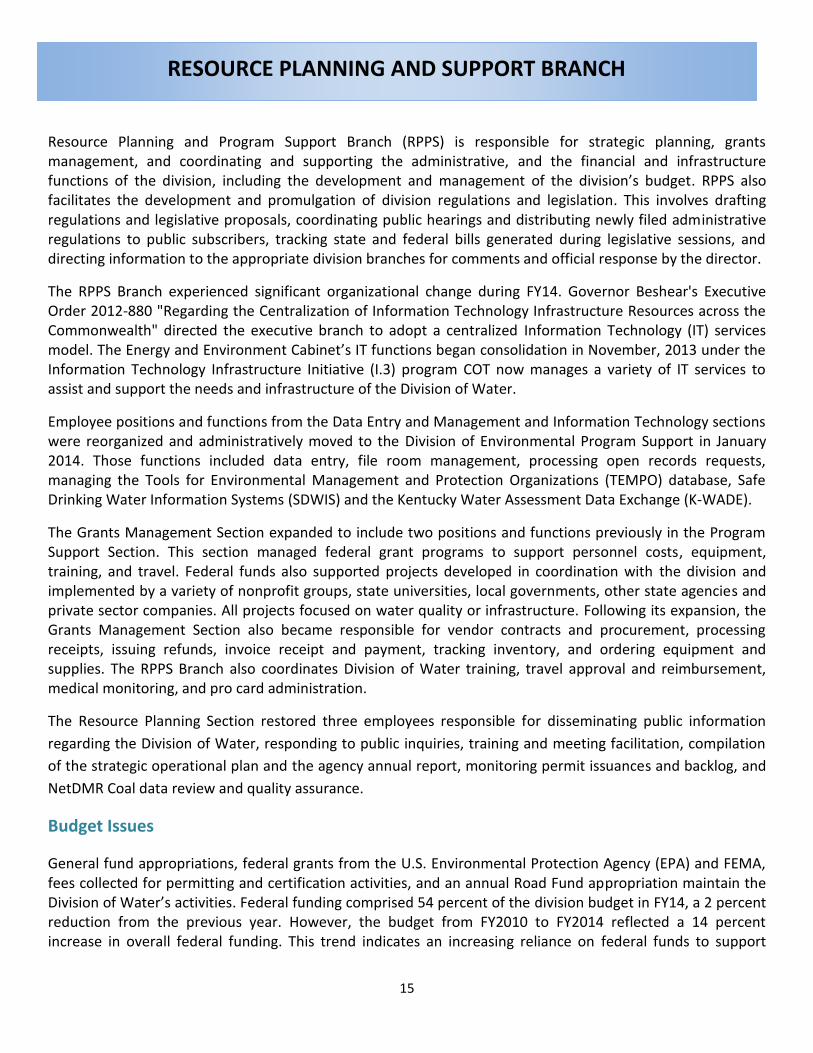
The Division of Water had a personnel cap of 264 positions at the beginning of FY14. However, the cap decreased to 252 full-time permanent positions due to organizational changes and personnel realignment in the Department for Environmental Protection. At the end of FY14, the division employed 230 employees
18
resulting from a six month hiring freeze, retirements, and other job opportunities. The personnel reductions, in both Frankfort and statewide field offices, created a challenge to provide statutorily mandated and quality services to the Commonwealth.
More than 20% of personnel have less than 5 years experience, and nearly half of the division’s employees have less than 10 years experience. As such, it is important to invest necessary resources to develop and retain current staff and to recruit and hire talented, service-oriented employees to continue and further the mission of the division.
220
230
240
250
260
270
280
290
300
2004 2005 2006 2007 2008 2009 2010 2011 2012 2013 2014
0%
5%
10%
15%
20%
25%
30%
Under 5 5 to 9 10-14 15-19 20-24 25-29 Over 30
DOW Years of Service Profile
Fiscal Year 2014

19
The Surface Water Permits Branch (SWPB) implements the National Pollutant Discharge Elimination System
(NPDES) to control surface water pollution caused by point source discharges of wastewater. These sources
include public and private sewage collection and treatment systems, commercial and industrial facilities, and
municipal and industrial landfills. The SWPB also implements the combined sewer overflow (CSO) and
separate sanitary sewer overflow (SSO) programs, the municipal separate storm sewer program, the NPDES
pretreatment program, the whole effluent toxicity (WET) program, administers the National Flood Insurance
program and issues permits for construction in a floodplain.
Permitting Progress
In FY14, the SWPB issued 3,730 permits, processed 3,675 applications, and reduced the permit backlog from
563 to 377 applications. The number of applications under review dropped from 1,008 to 852, and reached a
high point of 1,535 applications in September 2013 during the renewal cycle of the KYR00 permit. A large part
of the backlog and permit application decrease is attributed to the use of electronic application forms and
other electronic processes to decrease permit review time and data entry requirements by SWPB staff.
1802
677
350
674
163 64
Permits Issued SFY 2014 by Type
Stormwater Industrial KYR00(840), KYR10 (957) and MS4 (5)Floodplain (677)
Coal GP, Coal IP, Non-Coal IP(321, 21, 8)Sanitary, Municipal, Home Unit(95, 62, 517)
SURFACE WATER PERMITS BRANCH
20
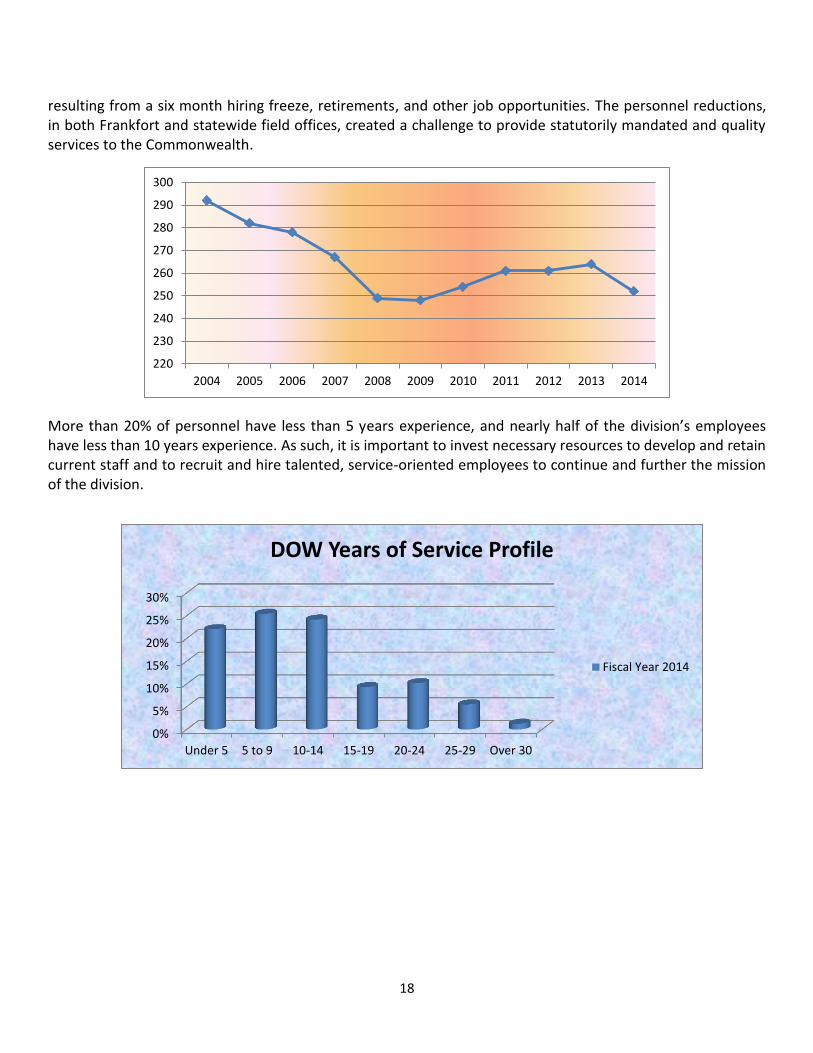
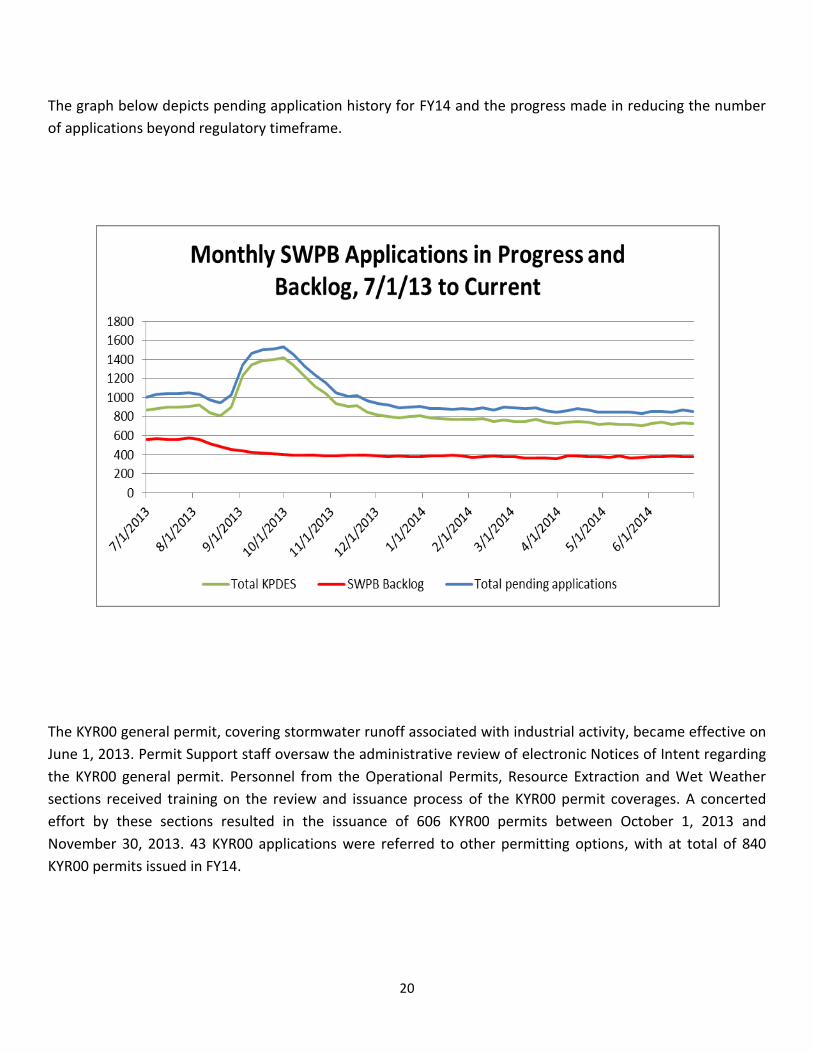
The graph below depicts pending application history for FY14 and the progress made in reducing the number
of applications beyond regulatory timeframe.
The KYR00 general permit, covering stormwater runoff associated with industrial activity, became effective on
June 1, 2013. Permit Support staff oversaw the administrative review of electronic Notices of Intent regarding
the KYR00 general permit. Personnel from the Operational Permits, Resource Extraction and Wet Weather
sections received training on the review and issuance process of the KYR00 permit coverages. A concerted
effort by these sections resulted in the issuance of 606 KYR00 permits between October 1, 2013 and
November 30, 2013. 43 KYR00 applications were referred to other permitting options, with at total of 840
KYR00 permits issued in FY14.

21
New and Reissued General Permits
In addition to processing new and renewal permit applications, SWPB drafted six general permits for public
notice in FY14 as described in the table below.
KPDES Number Description Public Notice
KYG05 Inactive Mine Lands and Associated
Structures
Closed 05/16/2014
KYG15 General Aviation Facilities Closed 05/16/2014
Becomes effective 09/01/2014
KYG11 Concrete Products, Asphalt Paving and
Ready-Mixed Concrete Operations
Closed 05/16/2014
KYG84 Mineral Mining and On-Site Processing
Activities
Closed 05/16/2014
KYGE4 Coal Mining, Processing and Associated
Activities – Eastern Kentucky Coal Field
Closed 07/01/2014
Becomes effective 10/1/2014
KYGW4 Coal Mining, Processing and Associated
Activities – Western Kentucky Coal Field
Closed 07/01/2014
Becomes effective 10/1/2014
Electronic Discharge Monitoring Report (NetDMR) Submission
Kentucky continued its status as leading the nation in NetDMR utilization with more than 2,600 permitted
facilities participating. This represents 89 percent of non-coal facilities required to submit DMRs. Further,
Kentucky has an 89 percent compliance rate with the date facilities are required to begin reporting using
NetDMR. Usage of NetDMR allowed the Permit Support section to achieve significant resource savings (60,000
sheets of paper, $15,000 in postage, 700 staff hours) and to provide better DMR compliance review with
increased reporting to regional offices and programs such as WET.
Additionally, Kentucky’s permittees have saved approximately $22,000 in postage in the first half of 2014.
Data from NetDMR submission is more readily available for public access through EPA’s Enforcement and

22
Compliance History Online website. The challenge for the coming year will be to bring approximately 2,000
coal mining facilities into the NetDMR system.
Floodplain Section
In addition to keeping permitting current, the Floodplain Section worked to increase knowledge and improve
customer service involving the National Flood Insurance Program. Three section members attended training
and received Floodplain Manager Certification adding to their knowledge base. Meetings between Dam Safety
in the Water Infrastructure Branch, Risk MAP in the Watershed Management Branch and the Floodplain
Section are held regularly to assure consistent timely responses to questions from the public and identify
program synergies.
Combined and Separate Sewer Systems
Combined sewer systems are an old design practice in civil engineering that involves the conveyance of both
storm water and sanitary wastewater in the same pipe. These systems often become inundated with storm
water flow, causing the combined sanitary and storm waters to overflow when wet weather events occur.
Combined sewer overflows (CSOs) are permitted discharges under the NPDES program required to comply
with the 1994 USEPA Combined Sewer Overflows Policy. Sanitary sewer overflows (SSOs) can result from
inflow or infiltration due to precipitation or leaky infrastructure, equipment malfunctions, power outages and
blockages even when sanitary sewage pipes are separate from storm water pipes. Sanitary sewer overflows
are illegal discharges and must be eliminated.
Kentucky communities continued to make progress updating their aging sewer systems to minimize discharges
of untreated wastewater through SSOs and SSOs. Overflows are complex and costly problems to solve. Some
communities in Kentucky lagged behind federal timetables and were placed under federal and state consent
orders to facilitate their progress addressing the issues. Communities under consent orders must comply with
remedial measures including developing early action plans, Capacity, Management, Operation and
Maintenance (CMOM) programs, long-term control plans (LTCPs) for CSOs and sanitary sewer overflow plans
(SSOPs) for SSOs. Wet Weather Section staff, in conjunction with the Kentucky Division of Enforcement and
USEPA Region 4, reviewed and approved the plans required as remedial measures.
In FY14, CMOM self-assessments for five CSO communities, four LTCPs and an amendment to a previously
approved LTCP received approval. Few required documents remained unapproved for the seventeen
communities under consent orders at the beginning of FY14. The focus for these communities now changes
from planning to implementation and evaluation. Pikeville completed all corrective actions and terminated
their consent judgment.

23
City of Pikeville Completes Consent Order
The city of Pikeville entered into a Consent Judgment with the Energy and Environment Cabinet on
October 25, 2007, to reduce the amount of untreated sanitary sewage and stormwater flowing into the
Levisa Fork of the Big Sandy River from Pikeville’s three CSO outfalls during rain events. On June 13,
2014, Franklin Circuit Court ordered termination of the Consent
Judgment because of completion of all remedial measures.
Remedial measures in the Consent Judgment included performing
investigations to identify locations where storm water was entering
the sewer systems to create combined sewage; completing a
Capacity, Management, Operation, and Maintenance self-assessment;
documenting compliance with the Nine Minimum Controls of the
1994 CSO Policy, and completing sewer separation. A Long Term
Control Plan for CSOs was not required if Pikeville completed
separation of the combined sewers into a separate sanitary sewer system.
In July 2012, Pikeville eliminated the three permitted CSO outfalls by sealing the outlets so that no
combined or sanitary sewage can discharge at those locations. As a result, the Pikeville sewer system is
a separate sewer system and future KPDES permits will not include any permitted CSO outfalls.
Municipal Separate Storm Sewer System
The Municipal Separate Storm Sewer System (MS4) program helps reduce pollution entering Kentucky’s
streams, rivers, lakes and groundwater through stormwater runoff by requiring MS4 operators to obtain an
NPDES permit and develop a stormwater management program. “Operators” include communities, the
Kentucky Transportation Cabinet, universities, local sewer districts and military bases. Wet Weather Section
personnel continue to monitor permit compliance through review of annual reports and inspections of the
MS4s.
Kentucky has individual permits covering the two large MS4s, one individual permit covering the Kentucky Transportation Cabinet, and 46 general permits covering 100 small MS4s. These include five new small MS4 permits for FY14: Berea, Eastern Kentucky University, Western Kentucky University, Lawrenceburg and Cold Springs. The current small MS4 general permit expires on March 31, 2015. Division of Water holds monthly meetings with stakeholders to seek input concerning the reissuance of the MS4 general permit.

24
25
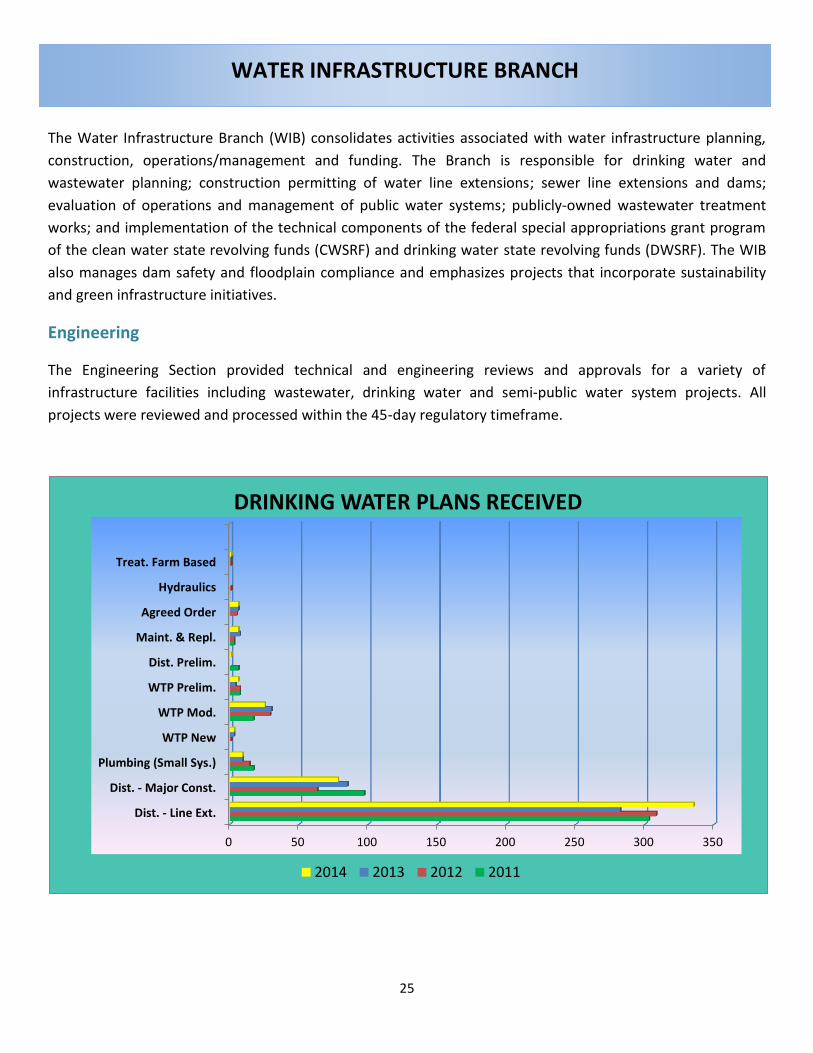
The Water Infrastructure Branch (WIB) consolidates activities associated with water infrastructure planning,
construction, operations/management and funding. The Branch is responsible for drinking water and
wastewater planning; construction permitting of water line extensions; sewer line extensions and dams;
evaluation of operations and management of public water systems; publicly-owned wastewater treatment
works; and implementation of the technical components of the federal special appropriations grant program
of the clean water state revolving funds (CWSRF) and drinking water state revolving funds (DWSRF). The WIB
also manages dam safety and floodplain compliance and emphasizes projects that incorporate sustainability
and green infrastructure initiatives.
Engineering
The Engineering Section provided technical and engineering reviews and approvals for a variety of
infrastructure facilities including wastewater, drinking water and semi-public water system projects. All
projects were reviewed and processed within the 45-day regulatory timeframe.
0 50 100 150 200 250 300 350
Dist. - Line Ext.
Dist. - Major Const.
Plumbing (Small Sys.)
WTP New
WTP Mod.
WTP Prelim.
Dist. Prelim.
Maint. & Repl.
Agreed Order
Hydraulics
Treat. Farm Based
DRINKING WATER PLANS RECEIVED
2014 2013 2012 2011
WATER INFRASTRUCTURE BRANCH
26
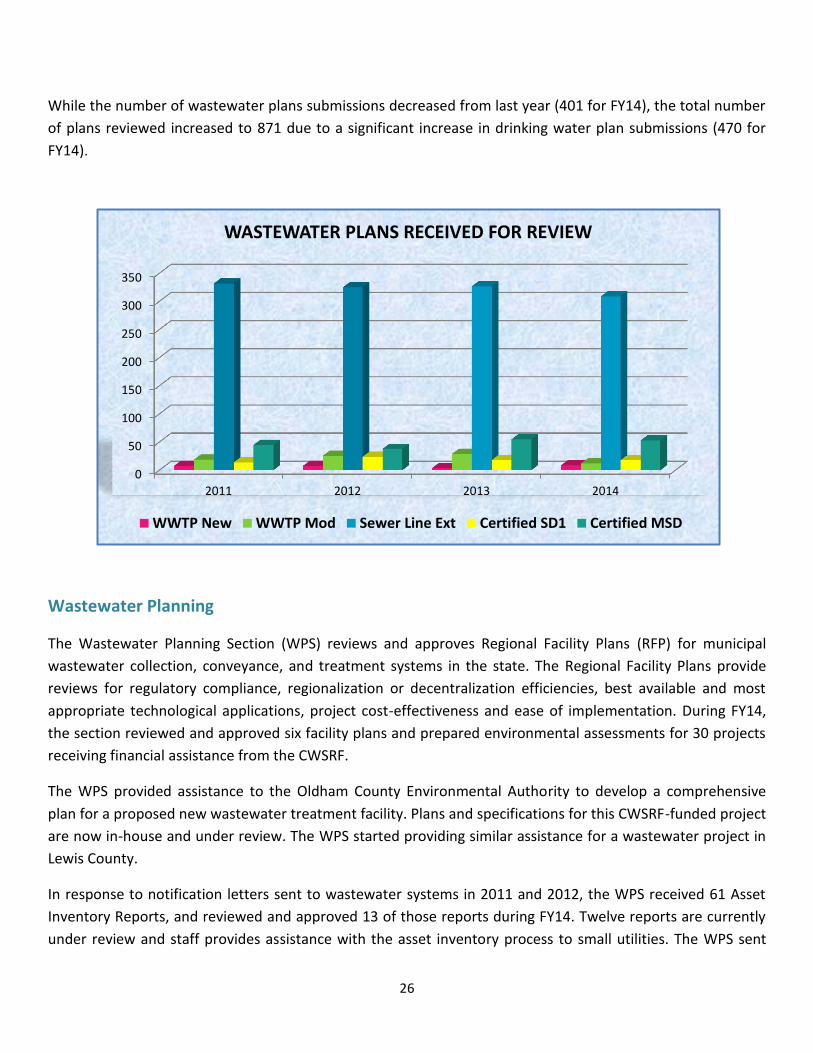
While the number of wastewater plans submissions decreased from last year (401 for FY14), the total number
of plans reviewed increased to 871 due to a significant increase in drinking water plan submissions (470 for
FY14).
Wastewater Planning
The Wastewater Planning Section (WPS) reviews and approves Regional Facility Plans (RFP) for municipal
wastewater collection, conveyance, and treatment systems in the state. The Regional Facility Plans provide
reviews for regulatory compliance, regionalization or decentralization efficiencies, best available and most
appropriate technological applications, project cost-effectiveness and ease of implementation. During FY14,
the section reviewed and approved six facility plans and prepared environmental assessments for 30 projects
receiving financial assistance from the CWSRF.
The WPS provided assistance to the Oldham County Environmental Authority to develop a comprehensive
plan for a proposed new wastewater treatment facility. Plans and specifications for this CWSRF-funded project
are now in-house and under review. The WPS started providing similar assistance for a wastewater project in
Lewis County.
In response to notification letters sent to wastewater systems in 2011 and 2012, the WPS received 61 Asset
Inventory Reports, and reviewed and approved 13 of those reports during FY14. Twelve reports are currently
under review and staff provides assistance with the asset inventory process to small utilities. The WPS sent
0
50
100
150
200
250
300
350
2011 2012 2013 2014
WASTEWATER PLANS RECEIVED FOR REVIEW
WWTP New WWTP Mod Sewer Line Ext Certified SD1 Certified MSD

27
notice to 93 wastewater systems of the requirement to complete either a Facility Plan or Asset Inventory
Report.
Capacity Development
Every community water system must meet the same water quality standards using approved treatment
processes and chemicals regardless of plant size, age, or the number of customers served. The Capacity
Development Section (CDS) takes a proactive approach in assisting drinking water systems to achieve and
maintain managerial and financial capacity while complying with state and federal requirements. A sanitary
survey is an on-site review of a public water system’s water source, facilities, equipment, operation,
maintenance, and management. Surveys point out sanitary deficiencies and assess a system’s capability to
supply safe drinking water to lower the risk of waterborne disease and identify systems that require technical,
managerial, or financial capacity development. Sanitary surveys are completed for all public water systems,
producers and purchasers.
The CDS performed 171 sanitary surveys at public drinking water plants in SFY 2014. Ninety-five of the systems
(56%) surveyed in FY14 produced potable drinking water for their retail and wholesale customers. Despite CDS
staff reductions through attrition in SFY 2014, all surveys were completed as scheduled and required.
0
20
40
60
80
100
120
140
160
180
SFY 2008 SFY 2009 SFY 2010 SFY 2011 SFY 2012 SFY 2013 SFY 2014
63
97
117
173
144 142
171
Nu
mb
er o
f Sy
stem
s
Number of Sanitary Surveys Completed
Note: Sanitary Surveys for groundwater systems were added in SFY 2010.

28
State Revolving Funds and Special Appropriation Projects
The State Revolving Funds (SRF) and Special Appropriation Projects (SPAP) Section is primarily responsible for
administrative functions associated with the division’s responsibilities in conjunction with the Clean Water and
Drinking Water SRF Programs and the EPA SPAP Grants. The Section works directly with the planning and
technical sections of the WIB to administer grant and loan funds for drinking water and wastewater projects.
SRF funds provide an excellent opportunity for small communities to improve infrastructure using the low
interest loans. SPAP grants have not seen any new congressional funding since 2010.
The SRF and SPAP section staff worked with program administrators at the Kentucky Infrastructure Authority
to administer approximately $41.2 Million in SRF funds to drinking water and clean water projects in FY14. The
section currently manages 126 active SRF and SPAP projects.
The Green Project Reserve
The Green Project Reserve (GPR) originated in the American Recovery and Reinvestment Act (ARRA) of 2009
and requires use of 10 to 20 percent of clean water and drinking water SRF capitalization grant funds for
projects including green infrastructure, water or energy efficiency improvements, or other environmentally
innovative activities. These four categories define “green projects” for GPR purposes. The division adopted the
federal GPR guidance to use in its evaluation of green infrastructure projects. Those water and wastewater
systems that claimed “green” points should submit a short business case to demonstrate eligibility under one
of the four green categories.
The SRF loan selection process requires projects to rank high on the division’s annual priority list based on a
set of ranking criteria. Kentucky added green infrastructure incentive points to the ranking criteria in FY14 for
SRF programs because of the national interest in green infrastructure.
Kentucky’s Green Project Reserve Requirements
Grant Year Drinking Water SRF Clean Water SRF
2009 ARRA Grant $4,090,000 ($20,450,000 grant) $9,975,620 ($49,878,100 grant)
2011 Capitalization Grant $2,675,800 ($13,379,000 grant) $3,758,000 ($18,794,000 grant)
2012 Capitalization Grant $0 $1,798,700 ($17,987,000 grant)
2013 Capitalization Grant $0 $1,784,500 ($17,845,000 grant)

29
As the table above shows, the 2012 and 2013 capitalization grants for the Drinking Water SRF did not include a
minimum GPR requirement. Regardless of the federal GPR provisions in the future, Kentucky plans to continue
to provide incentive points for green projects, as well as for sustainable infrastructure and asset management,
to encourage these practices.
SPAP grants support the City of Eubank as it improves its Water System
Eubank is a small, rural community (population 379) in Pulaski County. The Eubank Water System (EWS) serves over 4,900 households through approximately 180 miles of water mains and stretches across three counties: Pulaski, Lincoln, and Casey. The EWS is a public water distribution system only. It purchases a maximum of 900,000 gallons per day from the nearby city of Somerset and, in additon to supplying its own customers, sells water to the McKinney Water District (maximum of 700,000 gallons per month).
The city of Eubank recently completed a two-part water-system improvement project in response to its high water losses and increased operation and maintenance costs. A large part of Eubank’s water distribution system was undersized and constructed of gray polyvinyl chloride (PVC) and asbestos-cement pipe. Over time, the PVC pipe became brittle, was subject to leaks, and unable to sustain required flow and pressure. Additionally, the EWS outgrew its existing infrastructure. This became most evident in the summer when water consumption is high and rainfall scarce. The system could not meet local water demands.
The city of Eubank completed its proposed water system improvements in two separate projects. Project 1 (construction of the last two miles of the PVC transmission main) received a total of $4.38 Million in grant and loan assistance. The funds were provided by USDA Rural Development ($3.79 Million), Kentucky Infrastructure Authority ($75,000), and Appalachian Regional Commission ($500,000), and local contributions ($11,500).
Favorable bids for Project 1 allowed EWS to complete the project without a Special Appropriations grant it was orginally awarded. The SPAP grant ($194,000), along with assistance from USDA Rural Development ($164,000), were then available to fund Project 2.
Since the project’s implementation, Eubank has stabilized pressure and flow throughout the system. The new system can more readily meet customer demands for an adequate supply of safe, clean drinking water.

30
Dam Safety and Floodplain Compliance
The Dam Safety and Floodplain Compliance Section (DSFCS) is primarily responsible for inspecting, permitting,
and completing hydrologic and hydraulic modeling of dams, and managing the state-owned dam repair
program. Personnel inspect between 200 and 300 dams per year, and investigate and administer remedial
actions in floodplain construction cases that lack or violate appropriate permits.
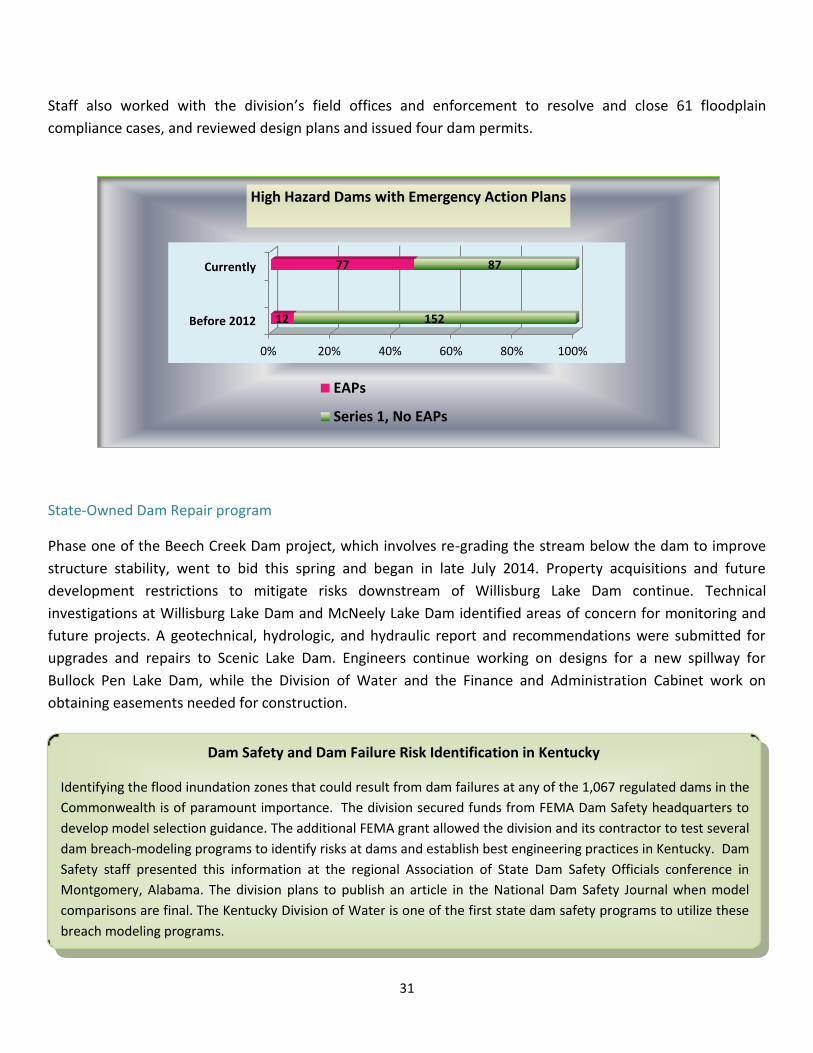
The National Dam Safety Review Board recommends Emergency Action Plans (EAPs) for all high hazard dams.
As part of its Dam Safety Mitigation Plan with the Federal Emergency Management Agency (FEMA), the
division developed simplified EAPs, which serve as a starting point for dam failure action plans, for 78 dams.
In 2014, the federal Natural Resources Conservation Service provided 17 EAP’s, and Kentucky
Utilities/Louisville Gas and Electric developed four EAP’s. One hundred eighteen dams now have EAPs and the
division continues developing plans for the remainder high hazard dams lacking EPAs. The Dam Safety and
Floodplain Compliance Section used innovative breach modeling programs to determine hazard classification,
complete 92 breach models, and create EAPs. Dam Safety and Floodplain Compliance Section staff also
completed 70 hydrologic and hydraulic dam models during its inspection process to determine if the dams
could pass model precipitation events without overtopping.
0
50
100
150
200
250
300
350
2008 2009 2010 2011 2012 2013
80
5 26
149
55
76
25
70
97
88 75
87
54
90
85
109 55
Nu
mb
er
of
Dam
s
Fiscal Year Inspections
FISCAL YEAR ANNUAL DAM INSPECTIONS High
Moderate
Low
78
243 331 186 252 208 Total 84
31
Dam Safety and Dam Failure Risk Identification in Kentucky
Identifying the flood inundation zones that could result from dam failures at any of the 1,067 regulated dams in the
Commonwealth is of paramount importance. The division secured funds from FEMA Dam Safety headquarters to
develop model selection guidance. The additional FEMA grant allowed the division and its contractor to test several
dam breach-modeling programs to identify risks at dams and establish best engineering practices in Kentucky. Dam
Safety staff presented this information at the regional Association of State Dam Safety Officials conference in
Montgomery, Alabama. The division plans to publish an article in the National Dam Safety Journal when model
comparisons are final. The Kentucky Division of Water is one of the first state dam safety programs to utilize these
breach modeling programs.
Staff also worked with the division’s field offices and enforcement to resolve and close 61 floodplain
compliance cases, and reviewed design plans and issued four dam permits.
State-Owned Dam Repair program
Phase one of the Beech Creek Dam project, which involves re-grading the stream below the dam to improve
structure stability, went to bid this spring and began in late July 2014. Property acquisitions and future
development restrictions to mitigate risks downstream of Willisburg Lake Dam continue. Technical
investigations at Willisburg Lake Dam and McNeely Lake Dam identified areas of concern for monitoring and
future projects. A geotechnical, hydrologic, and hydraulic report and recommendations were submitted for
upgrades and repairs to Scenic Lake Dam. Engineers continue working on designs for a new spillway for
Bullock Pen Lake Dam, while the Division of Water and the Finance and Administration Cabinet work on
obtaining easements needed for construction.
0% 20% 40% 60% 80% 100%
Before 2012
Currently
12
77
152
87
High Hazard Dams with Emergency Action Plans
EAPs
Series 1, No EAPs

32
Dam Safety Modernization/Risk MAP Initiative
Dam Safety continues to evolve through the Dam Safety Modernization and Risk MAP Program.
A FEMA Dam Safety grant provided funding for a collaborative effort between IT staff and Risk MAP
staff to develop an inspection report tool and a database. The new reporting process will reduce time
spent on inspections by 30 percent or more.
The Dam Safety/Risk MAP team provides presentations emphasizing the importance of recognizing and
mitigating flood risks that could severely impact human life and financial loss. Each dam owner in
Kentucky received a brochure stressing the value of Emergency Action Plans.
Innovative Methods to Resolve Floodplain Violations
Engineering costs for technical flood studies to determine floodway impact from unpermitted construction
activity are expensive, and remain the responsibility of the entity performing the activity. These activities may
encroach on the stream’s floodway, cause an undue rise in water elevation, and increase flood damage during
occurrence of the base flood discharge. Remedial costs include survey data and engineering analysis required by
401 KAR Section 4, and are commonly too expensive for the public who may have otherwise disregarded
permitting requirements. Dam Safety and Floodplain Compliance (DSFC) staff reviewed engineering and
surveying solutions to prepare flood studies where none exists.
DSFC creative engineering achievements included culvert analysis, existing hydraulic studies, and open channel
flow analysis. Data collection included the use of existing single or multiple stream cross sections, Digital
Elevation Models, Light Detection and Ranging, existing DOT roadway plans and Google Earth. In many cases,
floodplain violations were simple to resolve because the activity would have received a permit without a flood
study had the applicant applied for a permit. In other cases, the floodplain was incorrectly mapped. DSFC staff
understanding of floodplain regulations and expertise in engineering hydraulics and hydrology led to creative
and innovative resolutions to floodplain violations.

33
The Watershed Management Branch (WMB) coordinates the implementation of the watershed framework
and watershed based planning. It also implements groundwater management programs, administers the
water withdrawal permitting program and coordinates the development of Geographic Information Systems
(GIS) and quality assurance tools and products for the division and the public. The nonpoint source and
RiskMap programs are also based in this branch.
Water Quantity Management Section
Wellhead Protection Program
During FY14, the division created the Source Water Protection Assistance Program to serve as one option
communities and utilities can utilize for funds to research and implement source water protection strategies
and measures specific to their source water area(s). The Source Water Protection Assistance Program is
available to systems using groundwater or surface water for drinking water. The Source Water Protection
Assistance Program supported four projects through the first funding cycle. Projects required public water
systems (PWS) or government entities to work with local landowners, local media, watershed groups, and
many others to achieve their source water protection goals. Water systems and local communities responded
positively and raised statewide interest in source water protection activities. Approved projects included
plugging unused drinking water wells within wellhead protection areas, developing public service
announcements about drinking water, and monitoring contamination near a PWS well field.
Water Withdrawal Program
FY13-14 reports indicate a total of 861 million gallons per day (MGD) withdrawn from the major water use
sectors in Kentucky. This excludes cooling water withdrawals for thermoelectric power generation and
agriculture withdrawal for irrigation and watering of livestock. Withdrawals from surface water (rivers,
streams, lakes and ponds) accounted for nearly 76 percent of the total water withdrawn in Kentucky. Nearly
82 percent of withdrawals for public water supply came from surface sources.
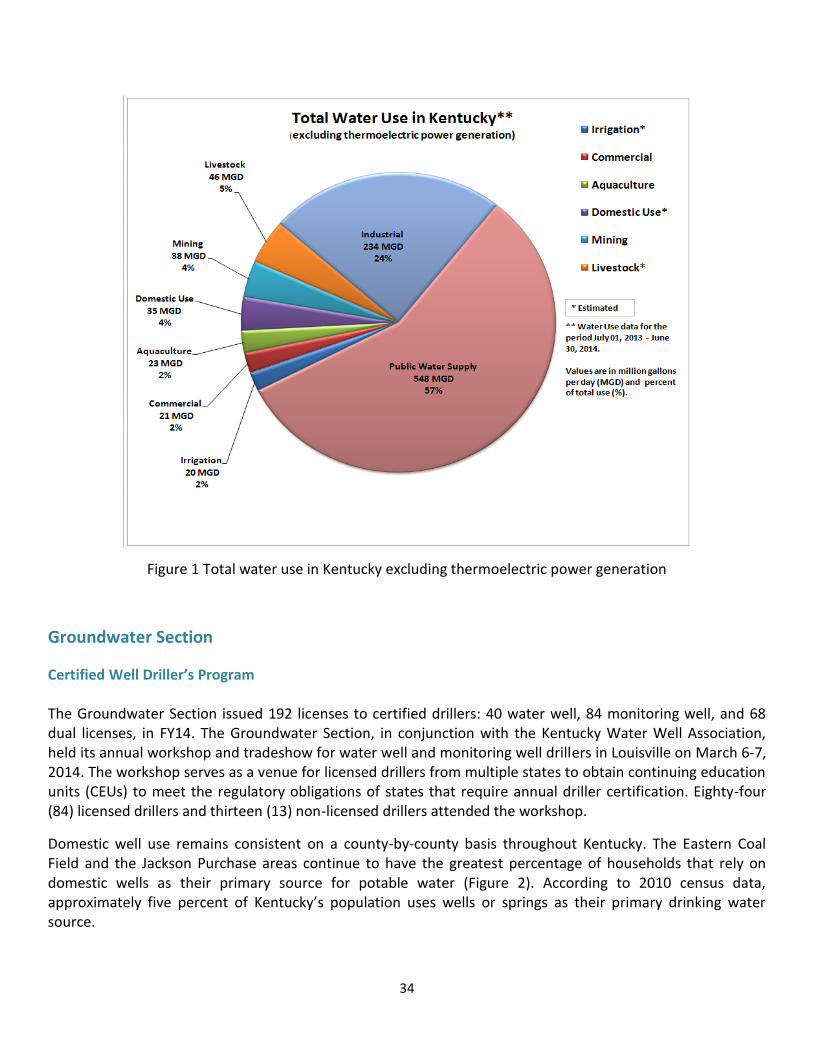
Water used for purposes of generating thermoelectric power accounted for 76 percent of the total water
withdrawn in Kentucky for the fiscal period ending June 30, 2014. Excluding thermoelectric power generation,
public water supply and industrial water use accounted for 81 percent of the total water withdrawn in
Kentucky (Figure 1) and nearly 90 percent of total water use in Kentucky through the water withdrawal-
permitting program.
WATERSHED MANAGEMENT BRANCH
34
Figure 1 Total water use in Kentucky excluding thermoelectric power generation
Groundwater Section
Certified Well Driller’s Program The Groundwater Section issued 192 licenses to certified drillers: 40 water well, 84 monitoring well, and 68 dual licenses, in FY14. The Groundwater Section, in conjunction with the Kentucky Water Well Association, held its annual workshop and tradeshow for water well and monitoring well drillers in Louisville on March 6-7, 2014. The workshop serves as a venue for licensed drillers from multiple states to obtain continuing education units (CEUs) to meet the regulatory obligations of states that require annual driller certification. Eighty-four (84) licensed drillers and thirteen (13) non-licensed drillers attended the workshop.
Domestic well use remains consistent on a county-by-county basis throughout Kentucky. The Eastern Coal Field and the Jackson Purchase areas continue to have the greatest percentage of households that rely on domestic wells as their primary source for potable water (Figure 2). According to 2010 census data, approximately five percent of Kentucky’s population uses wells or springs as their primary drinking water source.

35
Figure 2
Special Projects
The Groundwater Section conducted seven tracer tests for karst mapping projects and groundwater technical assistance and assisted eighteen county health departments, the Dam Safety program, the U.S. Office of Surface Mining, the Division of Mine Reclamation and Enforcement, the Division of Waste Management, the Division of Water Regional Offices, the Lexington-Fayette Urban County Government and the Somerset Sewer Department with dye traces relative to localized contamination and subsurface connection investigations.
36
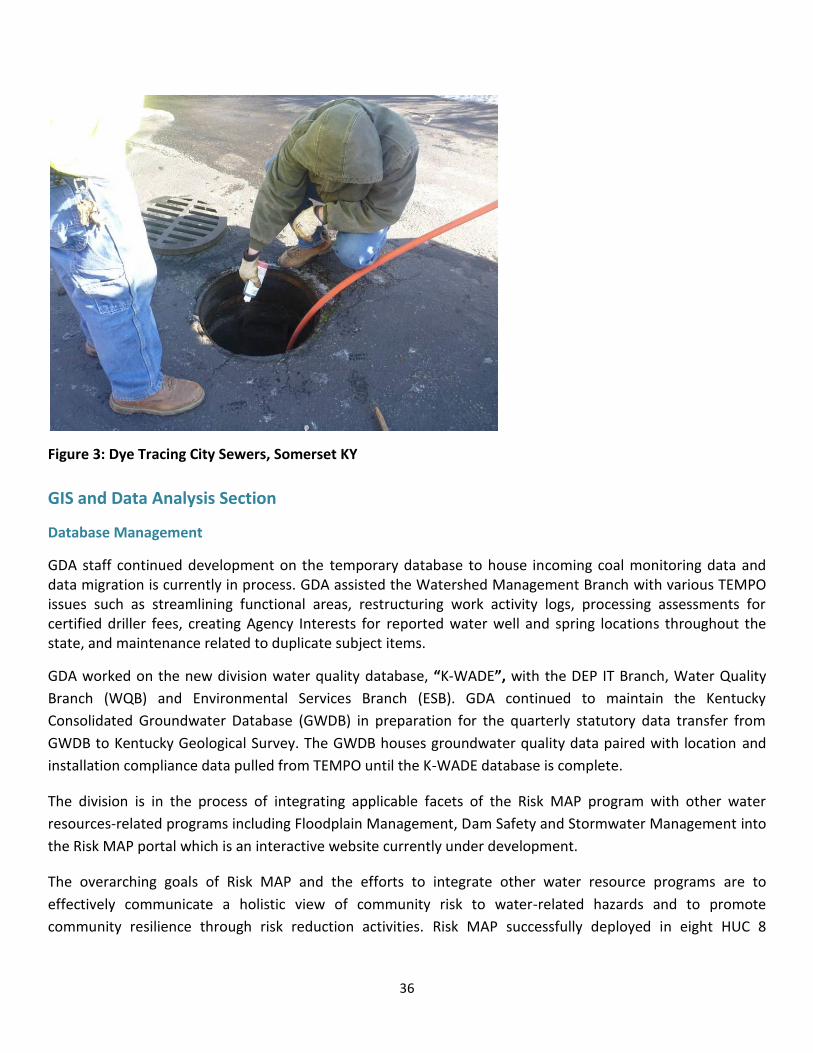
Figure 3: Dye Tracing City Sewers, Somerset KY
GIS and Data Analysis Section
Database Management
GDA staff continued development on the temporary database to house incoming coal monitoring data and data migration is currently in process. GDA assisted the Watershed Management Branch with various TEMPO issues such as streamlining functional areas, restructuring work activity logs, processing assessments for certified driller fees, creating Agency Interests for reported water well and spring locations throughout the state, and maintenance related to duplicate subject items.
GDA worked on the new division water quality database, “K-WADE”, with the DEP IT Branch, Water Quality
Branch (WQB) and Environmental Services Branch (ESB). GDA continued to maintain the Kentucky
Consolidated Groundwater Database (GWDB) in preparation for the quarterly statutory data transfer from
GWDB to Kentucky Geological Survey. The GWDB houses groundwater quality data paired with location and
installation compliance data pulled from TEMPO until the K-WADE database is complete.
The division is in the process of integrating applicable facets of the Risk MAP program with other water
resources-related programs including Floodplain Management, Dam Safety and Stormwater Management into
the Risk MAP portal which is an interactive website currently under development.
The overarching goals of Risk MAP and the efforts to integrate other water resource programs are to
effectively communicate a holistic view of community risk to water-related hazards and to promote
community resilience through risk reduction activities. Risk MAP successfully deployed in eight HUC 8

37
watersheds, encompassing approximately 55 percent of the state’s population (see graphic below). Given the
magnitude of flood risk identification, agency collaboration, and community coordination, the timeline for
completion of Risk MAP efforts is generally three to five years.
Risk MAP also promoted educational materials, including videos published through social media channels with
an anticipated completion of the online “Risk Communication Toolbox”; created and utilized PowerPoint
presentations; and distributed Publisher documents such as community factsheets, GIS maps, and FEMA
publications in paper and digital formats through in-person meetings and electronic means. Risk MAP staff
conducted a two-day “Introduction to GIS 10.1” workshop offered free of charge to local officials, such as
Floodplain Managers, PVA administrators, and Kentucky Emergency Management personnel. Additionally,
staff shared National Flood Insurance Program data with stakeholders such as the Bluegrass Area
Development District, and trained stakeholders to display and use the data in GIS programs such as ArcMAP.
Nonpoint Source and Basin Team Section
Nonpoint Source Pollution Program
The division received the FFY13 Nonpoint Source Pollution Control Grant Award in the amount of $2.54 million
to implement Kentucky’s program. The division then awarded $1.44 million to eight sub-grantee project
contractors to finalize development of three watershed plans, and fund on-the-ground implementation of five

38
watershed plans. Three projects have executed contracts and begun work. Five project contracts are under
development. The EPA recently approved the 2014 Nonpoint Source Management Plan.
Project WET
The Kentucky Division of Water is the lead agency for Project WET in Kentucky. The Project WET Foundation
(PWF) is an international non-profit water resources education program that provides scientifically accurate
and educationally sound water resources education materials, training courses and networking services to
citizens, organizations, governments, and corporations. The division formed a partnership with the Kentucky
Association for Environmental Education (KAEE) to coordinate project trainings and further promote water
education in Kentucky.
During 2013, division staff trained a total of 82 in-service (K-12) educators and a total of 190 university
educators, pre-service educators and non-formal educators. During this period, the division also reached an
estimated 2,350 students via educators, festivals and other forms of outreach. In choosing which events to

39
support, division staff endeavored to reach a wide audience, including school age children, the general public
and specialists in various fields.
River Basin Team Coordination Program
The division initiated river basin team meetings as a forum for bringing together local citizens,
nongovernmental organizations and division staff to discuss and work on water issues in their respective river
basins. A total of ten river basin team meetings were held in the Green/Tradewater, Four Rivers, Kentucky and
Licking River basins. These meetings, along with additional outreach efforts by the basin coordinators, account
for a great deal of the watershed group formation and momentum toward action on water quality issues in
Kentucky. As of FY14, approximately twenty-five watershed groups in the state receive support from basin
coordinators.
Watershed Watch Program
During 2013, 299 individuals received training to take samples and collect water chemistry in the field. A
subset of this group received training to conduct habitat assessments and biological monitoring. As a part of
their training, volunteers receive loaned equipment for field use, including Dissolved Oxygen and pH kits,
conductivity meters, thermometers, D-frame nets, forceps, reel lines and white pans. Trained volunteers also
receive color flip booklets with laminated pages containing summaries of new protocols and a benthic
macroinvertebrate key for field use, which have improved sampling collection and are a success with the
volunteers.
During 2013, Watershed Watch Kentucky (WWKY) volunteers collected 1,213 water samples and analyzed for
atrazine, triazines, E. coli, heavy metals and nutrients in May, July and September. These sampling results are
managed by KGS while the database of sampling locations and volunteers is managed by the division. The
division does not use volunteer data for making assessment or compliance determinations, but does use it to
identify areas for strategic monitoring priorities.

40

41
The Water Quality Branch (WQB) collects, analyzes, and makes scientific determinations regarding the health
of Kentucky’s waterways. Water quality standards guide the quality of Kentucky’s streams, rivers and lakes for
public consumption, recreation and aquatic life. WQB programs include Water Quality Standards, Monitoring
and Assessments, Total Maximum Daily Load (TMDL), Water Quality Certification, and the Wild Rivers
Program. Designation and classification of Exceptional Waters, Outstanding State Resource Waters, and
Outstanding National Resource Waters enable the protection of Kentucky’s highest quality waters. The TMDL
program develops TMDLs to restore impaired waters. The Water Quality Certification and Wild River programs
also protect water resources.
Branch personnel serve as advisors regarding the development and implementation of water quality
standards, permitting, spill response, sampling/training protocols, watershed-based planning and other issues
related to aquatic sciences. Additionally, WQB personnel participate in public education and outreach
initiatives regarding protection of water quality, aquatic life, and recreational use and it relevance to all
Kentuckians.
Significant endeavors for the WQB in 2013 included: tracking harmful algal blooms, conducting a Bluegrass
nutrient study, establishing a new water quality standard for selenium and a new narrative standard for
nutrients, developing the Kentucky Water Assessment Data Environmental (K-WADE) database, and creating a
web portal that lists impaired waters as defined by federal law in accordance with KRS 224.70-150
Nutrients
Next to pathogens and sediments, nutrients are a leading cause of impairment in Kentucky. Local water
quality impacts from nutrients can cause impacts to human and ecological health. High levels of nutrients in
Kentucky waters are associated with eutrophication of lakes and streams and the challenges of harmful algal
blooms (HABs). The Kentucky Nutrient Reduction Strategy represents the effort to consolidate and build upon
existing efforts in nutrient management and provide a broad review of ongoing and future activities. The
strategy describes voluntary practices and regulatory initiatives, and identifies areas needing further
development. The primary goal of the strategy is to reduce the nutrients (primarily nitrogen and phosphorus)
being lost from point and non-point sources and negatively affecting Kentucky’s waters. The collective efforts
of the states in the Mississippi River Basin will have an impact on the loading to the mainstem of the river and
ultimately the Gulf of Mexico.
Kentucky’s plan is a science- and technology-based approach that identifies sources of nutrients, builds on
programs already in place, collects data on water quality and sources of nutrients, and involves the ongoing
efforts of individuals, industry, environmentalists, agri-business, and local, state, and federal governments in
finding cost effective, flexible, and multi-faceted means to reduce nutrient loads in Kentucky waters.
WATER QUALITY BRANCH

42
Contributions from stakeholder groups have been incorporated whenever appropriate and possible. As this
strategy evolves and tasks are completed, the plan will remain dynamic and is a crucial step in improving the
waters of the Commonwealth.
Bluegrass Nutrient Studies
The division implemented two projects to increase the understanding of nutrient conditions in Bluegrass
wading streams and response of biological communities. The first project focused on the Inner Bluegrass
Ecoregion and the second project focused on the Outer Bluegrass and Hills of the Bluegrass ecoregions. Fifty-
five sites will be monitored every month for one year and the results will refine parameters for nutrient
conditions supportive of healthy aquatic communities in Bluegrass streams.
Extensive growth of Cladophora algae in Dry Run,
Scott County
Estimating canopy cover during visual algae survey in
East Fork Clear Creek, Woodford County

43
K-WADE
K-WADE is a comprehensive data system designed to accommodate the division’s water quality monitoring
data and provide tools for internal users to access, summarize and analyze the data.
Water Quality Standards
Section 303(c) of the Federal Pollution Control Act of 1972 requires states to review, adopt, or develop and
revise their water quality standards every three years relating to surface water standards. The latest
Division of Water Triennial Review resulted in significant water quality standards amendments:
Amendment of the narrative nutrient criterion as it applies to surface waters.
Establishment of state-specific water quality criteria for selenium (Se).
Designation of twenty-seven additional Outstanding State Resource Waters (OSRW) based on
biological and water quality attributes
Instream application of the dissolved oxygen (DO) criteria for the mainstream of the Ohio River
Wild Rivers Program
Parts of nine rivers and streams of exceptional quality and aesthetic character received the Kentucky “Wild
River” designation in accordance with KRS 146:200-360. The protected segments included parts of the
Cumberland River, Red River, Rockcastle River, Green River, Big South Fork of the Cumberland River, Little

44
South Fork of the Cumberland River, Martin’s Fork of the Cumberland River, and Rock Creek and Bad Branch of
Poor Fork of the Cumberland River.
Management activities included quarterly water quality monitoring in each Wild River corridor, periodic
monitoring of high traffic areas, and an annual aerial land use survey. The division managed nearly five
thousand acres of Wild Rivers inventory by eradicating invasive species, monitoring illegal activities and
property boundaries.
The Public Service Broadcasting Service at Western Kentucky University highlighted Kentucky’s Wild Rivers in
its production of the Emmy nominated 30-minute documentary entitled “Kentucky Wild Rivers: Secrets of
Discovery”.
Kentucky submits an Integrated Report (IR) on the condition and quality of its water resources to the U. S.
Environmental Protection Agency (EPA) on a biennial basis. The IR is used for rule making, budget
appropriations and program evaluation by federal legislators. This report integrates the requirements of Clean
Water Act Sections 305(b) and 303(d), which mandates state reporting on the general condition of waters, and
those not meeting water quality standards, and results in a list of “Impaired Waters”.
The division has monitored the quality of Kentucky’s rivers, streams, lakes and reservoirs for more than 30
years. There are 150,000 surface acres of open water in Kentucky comprised of 91,000 stream miles and the
three largest reservoirs. Currently, seventy-two fixed, long-term, water quality monitoring stations are located
throughout the Commonwealth, and an additional twenty to twenty-five rotating watershed monitoring sites
provide more intense scrutiny of water quality conditions. This type of monitoring focuses on determining the
long-term water quality conditions in Kentucky’s reservoirs/lakes.
The 2014 Integrated Report is currently under development. Water resources in the Green River-Tradewater
River Basin Management Unit will be the primary focus for water quality assessment for the 2014 report.
Integrated Report to Congress
on the Condition of Water
Resources in Kentucky

45
Kentucky has nearly 91,000 miles of streams. Of those, approximately 850 miles are small first and second
order intermittent or perennial streams to the Ohio and Mississippi Rivers. The division assessed 10,256
stream miles (11.3 percent) for cold and warm water aquatic habitat designated uses (collectively referred to
as aquatic life use). Of those assessed, 5,138 miles of streams, or fifty percent, fully support these designated
uses, with the remaining 5,118 miles not supporting these designated uses.
The primary contact recreation (or swimming) designation protects people from excessive risk of coming into
contact with pathogens that may cause gastric illness and maintaining a pH for safe swimming conditions. Of
Full Support,
5138
Not Supportin
g, 5118
Warmwater and Coldwater Aquatic
Habitat Use Support -- Streams
Primary Contact Recreation Use – Streams

46
the nearly 5,070 stream miles assessed for this designated use, only 30 percent fully support the use while 70
percent do not.
Percentages of assessed stream miles statewide supporting primary contact recreation between 2006 and
2012 are listed in the chart below.
This designated use provides protection to people enjoying recreation on a waterbody but anticipate only
incidental contact or less than full body immersion, such as boating, fishing, and wading.
The secondary contact recreation designation employs both bacteria and pH criteria to protect
recreationalists. The higher level of allowable bacteria, compared to primary contact recreation, reflects the
relative risk associated with the use. Of the 1,989 stream miles assessed, 1,339 miles (67 percent) fully support
this use, while 650 miles (33 percent) do not.
Secondary Contact Recreation Use- Streams

47
The division assessed 689.5 stream miles with this designation and determined that all fully support domestic
drinking water supply use.
The division analyzes fish tissue for possible contaminant residue. Of the 1,140 stream miles assessed for fish
consumption, 695 stream miles (61 percent) fully support and 447 miles (39 percent) do not. Should it become
necessary, an advisory may be issued as a precautionary alert for sensitive populations (children six years and
younger, and women of childbearing age) to consider limiting their fish consumption to no more than one
meal (a meal is considered eight ounces) per week.
Fish Consumption Advisories
In April 2000, a Level 1 fish consumption advisory was issued for Kentucky due to low levels of mercury found
in edible portions of tested fish. Since implementation of the advisory, monitoring has shown a potential for
increased mercury levels in fish across the state.
According to the results of a 2009 study, mercury bioaccumulation in fish from Kentucky waters indicated
contaminant levels exceeding the statewide consumption advisory issued in 2000. The Fish Consumption
Advisory Committee (comprised of members of the Department of Environmental Protection, Department of
Health and Family Services and Department of Fish and Wildlife Resources) encouraged further evaluation and
recommended a replicated sampling of the 2009 sites for 2013, including the collection of additional species if
available in other trophic levels. Representative species from each trophic level were selected based on their
Domestic Drinking Water Supply
Fish Consumption
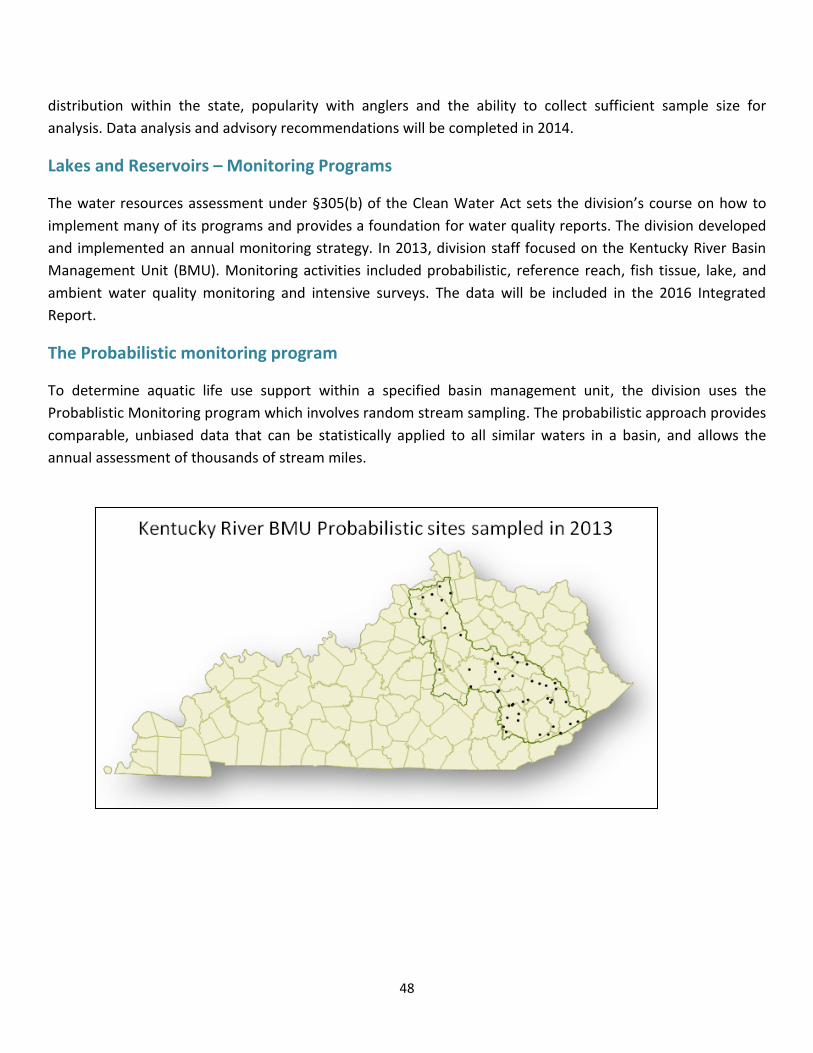
48
distribution within the state, popularity with anglers and the ability to collect sufficient sample size for
analysis. Data analysis and advisory recommendations will be completed in 2014.
Lakes and Reservoirs – Monitoring Programs
The water resources assessment under §305(b) of the Clean Water Act sets the division’s course on how to
implement many of its programs and provides a foundation for water quality reports. The division developed
and implemented an annual monitoring strategy. In 2013, division staff focused on the Kentucky River Basin
Management Unit (BMU). Monitoring activities included probabilistic, reference reach, fish tissue, lake, and
ambient water quality monitoring and intensive surveys. The data will be included in the 2016 Integrated
Report.
The Probabilistic monitoring program
To determine aquatic life use support within a specified basin management unit, the division uses the
Probablistic Monitoring program which involves random stream sampling. The probabilistic approach provides
comparable, unbiased data that can be statistically applied to all similar waters in a basin, and allows the
annual assessment of thousands of stream miles.

49
Division biologists conducted biosurveys in the Kentucky River Basin
to determine use-support designations and identify water quality
trends. The division collected macroinvertebrate, fish community,
water chemistry, and habitat data at forty-eight randomly selected
sites for later analysis.
The Reference Reach Program
This program identifies high quality waterbodies based on excellent water, habitat and landscape integrity,
compared to waterbodies of similar size within the same region. The division uses Reference Reaches (least
impacted streams) as benchmarks against which it evaluates relative impairment, and compares measures for
restoration activities. The division currently utilizes a set of stream sites rotated across a five-year stream
basin cycle, and monitors a fixed set of sites annually. The division sampled thirty-two sites in the Kentucky
River BMU as part of the five-year basin rotation cycle, four sites as part of Reference Fixed network, and
evaluated one site on Hammond Creek in Owen County as a potential Reference Reach.
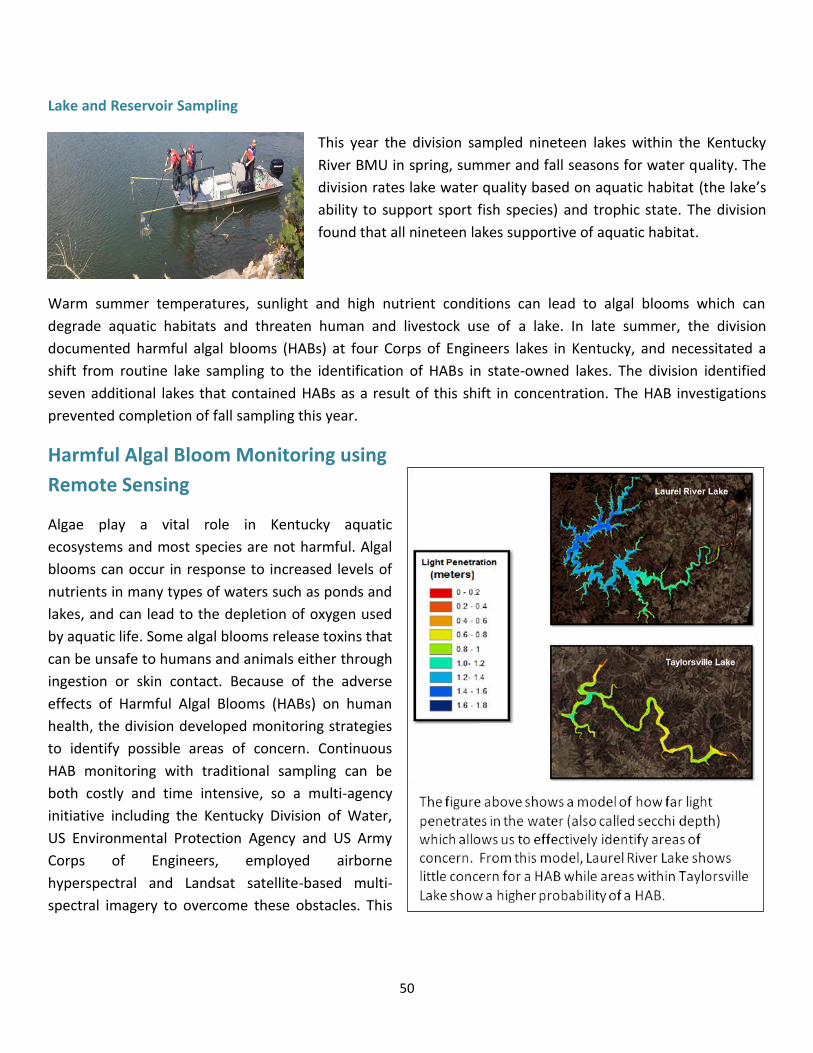
50
Lake and Reservoir Sampling
This year the division sampled nineteen lakes within the Kentucky
River BMU in spring, summer and fall seasons for water quality. The
division rates lake water quality based on aquatic habitat (the lake’s
ability to support sport fish species) and trophic state. The division
found that all nineteen lakes supportive of aquatic habitat.
Warm summer temperatures, sunlight and high nutrient conditions can lead to algal blooms which can
degrade aquatic habitats and threaten human and livestock use of a lake. In late summer, the division
documented harmful algal blooms (HABs) at four Corps of Engineers lakes in Kentucky, and necessitated a
shift from routine lake sampling to the identification of HABs in state-owned lakes. The division identified
seven additional lakes that contained HABs as a result of this shift in concentration. The HAB investigations
prevented completion of fall sampling this year.
Harmful Algal Bloom Monitoring using
Remote Sensing
Algae play a vital role in Kentucky aquatic
ecosystems and most species are not harmful. Algal
blooms can occur in response to increased levels of
nutrients in many types of waters such as ponds and
lakes, and can lead to the depletion of oxygen used
by aquatic life. Some algal blooms release toxins that
can be unsafe to humans and animals either through
ingestion or skin contact. Because of the adverse
effects of Harmful Algal Blooms (HABs) on human
health, the division developed monitoring strategies
to identify possible areas of concern. Continuous
HAB monitoring with traditional sampling can be
both costly and time intensive, so a multi-agency
initiative including the Kentucky Division of Water,
US Environmental Protection Agency and US Army
Corps of Engineers, employed airborne
hyperspectral and Landsat satellite-based multi-
spectral imagery to overcome these obstacles. This

51
imagery provides the ability to accurately predict spatial and temporal HAB trends in Kentucky lakes remotely.
In the future, the division will be able to issue HAB advisories based on these results.
The Kentucky Ambient/Watershed
The Monitoring Assessment program assesses the status and trends in the quality of Kentucky’s surface water
resources, and assists an understanding of the major factors that affect water quality conditions and use
attainment.
Watershed Monitoring Assessment - Marsh Creek (McCreary County) Intensive Survey
In 2013, the division collected fifty-seven water samples throughout the Marsh Creek watershed in McCreary
County, Kentucky. Information derived from these samples indicates that threats in the upper and middle
reaches of Marsh Creek remain problematic for mussels and other aquatic animals. Water quality improves,
particularly in lower reaches of the creek in more remote sections of the Daniel Boone National Forest,
downstream and away from heavy metals that leach into the water from abandoned or poorly reclaimed
mines in the headwater reaches.
Survey work conducted by the Kentucky State Nature Preserves Commission in the late 1980s indicated an
unreported oil spill that killed at least 500 mussels in Marsh Creek near the Kidd School Road crossing in the
middle portion of the watershed. The source of that spill remains unknown, but creek sediment analyzed in
2013 showed that high levels of oil and grease remain in the river bottom sediment at this and other locations
downstream.
Many of the smaller streams feeding directly into Marsh Creek still have excellent water quality, even in the
most polluted uppermost reaches.

52
On July 29, 2013, the Kentucky Department of Fish and Wildlife Resources placed artificially-raised juvenile
freshwater mussels, contained in concrete “mussel silos”, at nine separate study sites in Marsh Creek, Indian
Creek and in several major tributaries feeding Marsh Creek. These biological indicator organisms, which
readily store contaminants, will be retrieved during 2014 to process tissues for contaminant analyses, and test
for survival and growth.
Total Maximum Daily Loads
Section 303(d) of the Clean Water Act (CWA) requires states to identify assessed water bodies that are not
meeting their designated uses. The CWA subsequently requires the development of a Total Maximum Daily
Load (TMDL) for these water bodies.
A TMDL is a calculation of the maximum amount of a pollutant that a waterbody can naturally assimilate and
still maintain its designated use(s). A TMDL must be calculated for each pollutant impairing a lake, spring,
pond or specific reach of stream. States then establish a priority ranking for such waters, taking into account
their intended uses and the severity of the pollutant, and must provide the information in a list of “Impaired
Waters”.
A Long-Term Vision for Assessment, Restoration, and Protection under the Clean Water Act
Section 303(d) Program
Recognizing that a TMDL is just one of many tools that can be used for water quality improvement, but not
always the best choice for a watershed, EPA and state TMDL program managers began developing a new path
forward for the TMDL program in August 2011. This effort resulted in six recommended elements comprising
“A Long-Term Vision for Assessment, Restoration, and Protection under the Clean Water Act Section 303(d)
Program” (the “Vision”):
Prioritization
Assessment
Protection
Alternatives
Engagement
Integration
The “Vision” fosters multiple approaches and stakeholder engagement to enable watersheds to meet water
quality standards, and to protect healthy watersheds. The Vision allows flexible watershed management, but
requires the support of many stakeholders, including the public, federal and state agencies, to attain this
common goal.
The TMDL Section and other division programs continue assessing waterbodies based on the ongoing
collection of monitoring data. As a result, the number of 303(d) “Impaired Streams” list has increased
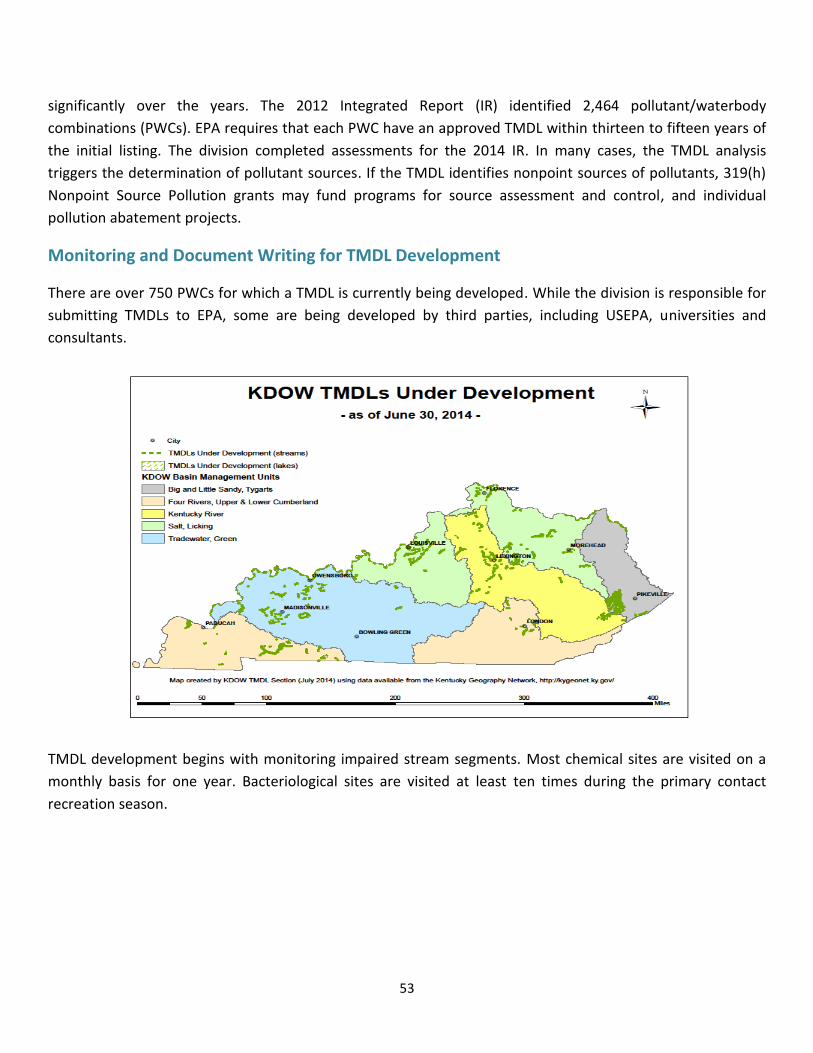
53
significantly over the years. The 2012 Integrated Report (IR) identified 2,464 pollutant/waterbody
combinations (PWCs). EPA requires that each PWC have an approved TMDL within thirteen to fifteen years of
the initial listing. The division completed assessments for the 2014 IR. In many cases, the TMDL analysis
triggers the determination of pollutant sources. If the TMDL identifies nonpoint sources of pollutants, 319(h)
Nonpoint Source Pollution grants may fund programs for source assessment and control, and individual
pollution abatement projects.
Monitoring and Document Writing for TMDL Development
There are over 750 PWCs for which a TMDL is currently being developed. While the division is responsible for
submitting TMDLs to EPA, some are being developed by third parties, including USEPA, universities and
consultants.
TMDL development begins with monitoring impaired stream segments. Most chemical sites are visited on a
monthly basis for one year. Bacteriological sites are visited at least ten times during the primary contact
recreation season.

54
TMDL writers utilize the data collected to calculate the TMDL for each pollutant/waterbody combination. The
TMDL reports must undergo internal division preliminary review, a 30-day public comment period (proposed
review) and must be approved by the EPA (final review). The TMDL reports contain load allocations for both
point and nonpoint sources of the pollutant such that a waterbody can be brought back to full support of its
designated uses.
Delisting of streams from the 303(d) list
Streams may be delisted from the impaired waters list when they have an approved TMDL or some other
pollution control, or when the state determines that water quality has sufficiently improved and the
waterbody is meeting its designated use.
In 2014, EPA formally approved TMDLs for a total of 357 PWCs and approved delisting requests for 397 PWCs.
The division has requested delistings for an additional 76 PWCs.

55
Education and Outreach
KRS224.70-150, requires the division to provide transparency and encourage more public participation in the
process of assessing waters, listing waters as impaired, and in developing TMDLs. Statutory requirements
include:
Developing a website that discloses all waters placed on the list of impaired waters reported to the
U.S. Congress every two years.
Providing information regarding the method by which the division makes “impaired waters”
determinations.
Providing information regarding the method by which the division develops TMDLs.
Creating a notification system for parties interested in the proposed listing of a waterbody on the
impaired waters (303[d]) list.
Providing public notice of the removal of water bodies from the impaired waters list.
In conjunction with the Division of Compliance Assistance, the division developed a TMDL Toolkit and posted it
to the TMDL website. The Toolkit provides a basic understanding of the TMDL program and the Clean Water
Act. Internet links are located throughout the Toolkit for the public to explore topics in greater depth. In
accordance with KRS Chapter 224.70-150, DEP was charged with creating a web-based portal that would allow
the public to easily find and determine the health of all the Commonwealth’s waterways. In conjunction with
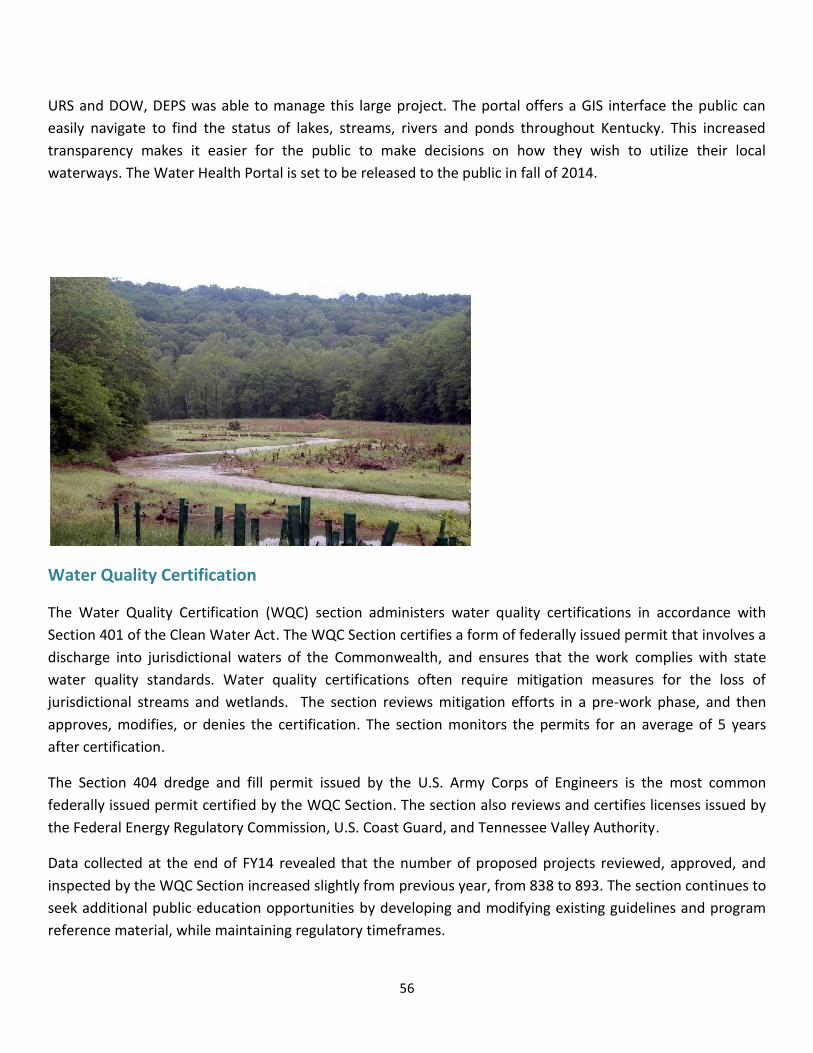
56
URS and DOW, DEPS was able to manage this large project. The portal offers a GIS interface the public can
easily navigate to find the status of lakes, streams, rivers and ponds throughout Kentucky. This increased
transparency makes it easier for the public to make decisions on how they wish to utilize their local
waterways. The Water Health Portal is set to be released to the public in fall of 2014.
Water Quality Certification
The Water Quality Certification (WQC) section administers water quality certifications in accordance with
Section 401 of the Clean Water Act. The WQC Section certifies a form of federally issued permit that involves a
discharge into jurisdictional waters of the Commonwealth, and ensures that the work complies with state
water quality standards. Water quality certifications often require mitigation measures for the loss of
jurisdictional streams and wetlands. The section reviews mitigation efforts in a pre-work phase, and then
approves, modifies, or denies the certification. The section monitors the permits for an average of 5 years
after certification.
The Section 404 dredge and fill permit issued by the U.S. Army Corps of Engineers is the most common
federally issued permit certified by the WQC Section. The section also reviews and certifies licenses issued by
the Federal Energy Regulatory Commission, U.S. Coast Guard, and Tennessee Valley Authority.
Data collected at the end of FY14 revealed that the number of proposed projects reviewed, approved, and
inspected by the WQC Section increased slightly from previous year, from 838 to 893. The section continues to
seek additional public education opportunities by developing and modifying existing guidelines and program
reference material, while maintaining regulatory timeframes.
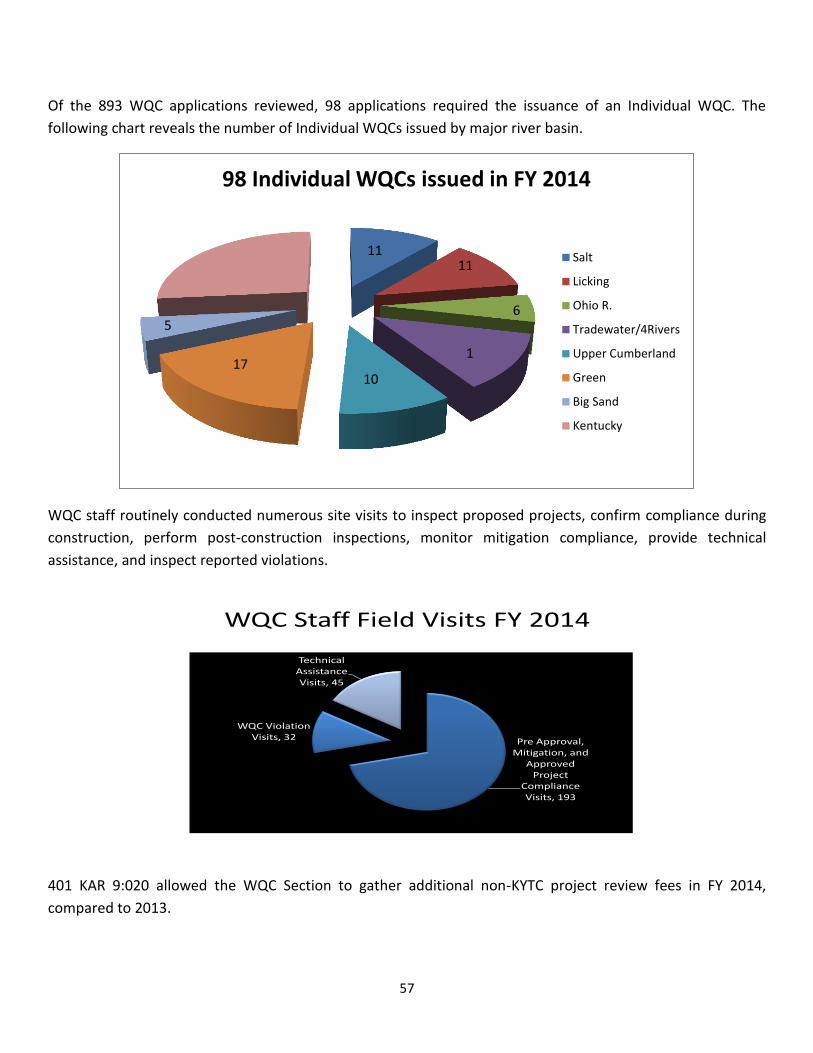
57
Of the 893 WQC applications reviewed, 98 applications required the issuance of an Individual WQC. The
following chart reveals the number of Individual WQCs issued by major river basin.
WQC staff routinely conducted numerous site visits to inspect proposed projects, confirm compliance during
construction, perform post-construction inspections, monitor mitigation compliance, provide technical
assistance, and inspect reported violations.
WQC Staff Field Visits FY 2014
Pre Approval, Mitigation, and
Approved Project
Compliance Visits, 193
WQC Violation Visits, 32
Technical Assistance Visits, 45
401 KAR 9:020 allowed the WQC Section to gather additional non-KYTC project review fees in FY 2014,
compared to 2013.
98 Individual WQCs issued in FY 2014
Salt
Licking
Ohio R.
Tradewater/4Rivers
Upper Cumberland
Green
Big Sand
Kentucky
5
17 10
1
6
11 11

58
Commonwealth of Kentucky
Governor Steven L. Beshear
Energy and Environment Cabinet
Secretary Leonard K. Peters.
Kentucky Department for Environmental Protection
Commissioner R. Bruce Scott, PE
Deputy Commissioner Aaron Keatley
Kentucky Division of Water
Director Peter Goodmann
Branch Managers
Compliance and Technical Assistance Branch Tom Gabbard
Resource Planning and Program Support Branch Diane Marcus
Surface Water Permits Branch Jory Becker
Water Infrastructure Branch Shafiq Amawi
Watershed Management Branch Paulette Akers
Water Quality Branch Clark Dorman