Embed Size (px)
Citation preview

Kennedy Wilson Europe Real Estate Limited (formerly Kennedy Wilson Europe Real Estate Plc) Audited Consolidated Financial Statements For the year ended 31 December 2017

Page | 2
Contents Page
Directors’ report 3
Independent Auditor’s report 4
Consolidated income statement 8
Consolidated statement of comprehensive income 9
Consolidated balance sheet 10
Consolidated statement of changes equity 11
Consolidated cash flow statement 13
Notes to consolidated financial statements 15

Page | 3
Director’s report The Directors of Kennedy Wilson Europe Real Estate Limited (the ‘Company’) have pleasure in presenting the Audited Consolidated Financial Statements for the year ended 31 December 2017.
Principal activities The Company (together with its subsidiary undertakings, the ‘Group’) invest in investment and development property, hotel businesses and loans secured by real estate in Europe with the objective of generating and growing long-term cash flows to pay dividends and to enhance capital values through focused asset management activities and strategic acquisitions.
Results The financial position at 31 December 2017 is set out in the Consolidated Balance Sheet.
The results of operations for the year ended 31 December 2017 are set out in the Consolidated Income Statement.
Directors The directors who held office during the year ended 31 December 2017 and up to the date of this report are:
• William McMorrow (resigned 15 November 2017) • Mary Ricks (resigned 15 November 2017) • Charlotte Valeur (resigned 15 November 2017) • Mark McNicholas (resigned 15 November 2017) • Simon Radford (resigned 15 November 2017) • Fraser Kennedy (appointed 15 November 2017) • Andrew McNulty (appointed 15 November 2017) • Ana Kekovska (appointed 15 November 2017)
Transactions involving directors There were no contracts or agreements of any significance in relation to the business of the Group in which the Directors had any interest, at any time during the year other than those set out in Note 26 to the financial statements.
Distributions Distributions declared and/or paid during the year ended 31 December 2017 are set out in Note 24 to the financial statements.
Subsequent events Significant events after the date of the Consolidated Statement of Financial Position are disclosed in Note 29 to the financial statements.
Independent auditor The Board appointed KPMG, Chartered Accountants and Registered Auditors, as independent auditor of the Group.
The independent auditor, KPMG, has indicate their willingness to continue in office.
On behalf of the Board of Directors.
Fraser Kennedy Andrew McNulty
Director Director
27 March 2018
Page | 4
Independent auditor’s report to the members of Kennedy Wilson Europe Real Estate Limited (formerly Kennedy Wilson Europe Real Estate Plc)
1. Report on the audit of the consolidated financial statements
Opinion We have audited the consolidated financial statements of Kennedy Wilson Europe Real Estate Limited (formerly Kennedy Wilson Europe Real Estate Plc) (“the Company”) and its subsidiaries (collectively “the Group”) for the year ended 31 December 2017 which comprise the consolidated income statement, consolidated statement of comprehensive income, the consolidated balance sheet, the consolidated statement of changes in equity, the consolidated cash flow statement and the related accounting policies and notes, including the accounting policies in Note 3. The financial reporting framework that has been applied in their preparation is Jersey Law and International Financial Reporting Standards (IFRS) as adopted by the European Union.
In our opinion, the consolidated financial statements give a true and fair view of, the financial position of the Group as at 31 December 2017 and its financial performance and cash flows for the year then ended, in accordance with International Financial Reporting Standards (IFRS) as adopted by the European Union.
Basis for opinion We conducted our audit in accordance with International Standards on Auditing (ISAs). Our responsibilities under those standards are further described in the Auditor's Responsibilities for the Audit of the Financial Statements section of our report. We are independent of the Group and Company in accordance with the ethical requirements that are relevant to our audit of the financial statements in Jersey, together with the International Ethics Standards Board for Accountants' Code of Ethics for Professional Accountants (IESBA Code) and we have fulfilled our other ethical responsibilities in accordance with these requirements.
We believe that the audit evidence we have obtained is sufficient and appropriate to provide a basis for our opinion.
Key audit matters Key audit matters are those matters that, in our professional judgment, were of most significance in our audit of the financial statements of the current period. These matters were addressed in the context of our audit of the consolidated financial statements as a whole, and in forming our opinion thereon, and we do not provide a separate opinion on these matters.
Valuation of the Group’s investment properties and property, plant and equipment
Refer to pages 21 to 22 (accounting policy) and pages 37 to 43 and pages 46 to 48 (financial disclosures).
(i) The key audit matter
The valuation of the Group’s investment properties and property, plant and equipment requires significant management judgments, particularly those relating to current and expected market conditions. During the financial year to 31 December 2017, macroeconomic conditions in Europe continued to recover, with growth exceeding expectations, unemployment falling, and inflation expectations moving gradually higher. In addition, the European Central Bank has indicated that the period of peak liquidity is ending and that monetary policies will now move towards interest-rate normalisation. In the UK, policy uncertainty around the decision to leave the European Union (“Brexit”) has continued to dampen UK economic growth while cautious sentiment towards the UK property market place has added to the estimation uncertainty surrounding the valuing of assets.
To assist in determining the value of the Group’s portfolio, the directors engaged external valuers, CBRE and Colliers. The directors’ estimates of the value of the portfolio were developed using the advice and input of the Valuers. Unreasonable or outdated inputs used in these judgments, such as those in respect to estimated rental value or yield, could result in material misstatement of the income statement and balance sheet.

Page | 5
(ii) How the matter was addressed
Among other procedures:
• We read the valuation reports for all properties and confirmed that the valuation approach for each was in accordance with Royal Institution of Chartered Surveyors Valuation – Professional Standards (“RICS”) and suitable for use in determining the carrying value for the purpose of the financial statements.
• We assessed the qualifications, independence and objectivity of the Valuers by reviewing their terms of engagement, fee arrangements, and the existence of any potential conflicts created if they had advised on a transaction that they were subsequently valuing. We obtained confirmation from the Valuers that they had not been subject to influence from management and we found no evidence to suggest their objectivity was compromised.
• We held several discussions with the Valuers to understand their view of market dynamics, the valuation techniques used, the performance of the portfolio, and the significant assumptions including future expected rental income and likely yields.
• We included a Chartered Surveyor on our team who considered the Valuers’ qualifications and together, we discussed with the Valuers, the valuation approaches and assumptions.
• We considered the yield assumptions used in performing the valuations to assess their reasonableness in comparison to relevant market evidence, benchmarking expected rental values and yields against comparables and other external data.
• We performed analytical procedures by reference to external market data to evaluate the appropriateness of the valuations adopted by the Group, and investigated further the valuation of those properties that were outside of our expectations.
• We conducted site visits on major properties to corroborate certain details of the external valuation reports.
• We evaluated whether sufficient disclosures were provided in relation to risks inherent in the asset valuations.
(iii) Overall findings
We found that the assumptions used by the valuers were predominantly consistent with our expectations, and were comparable to market transactions and benchmarking information relevant to the sector for each asset type. Variances outside of our expected ranges were sufficiently supported and were a result of specific circumstances relevant to individual assets. Information disclosed surrounding investment properties and property, plant and equipment was adequate and in proportion to their significance to the consolidated financial statements.
Other information The directors are responsible for preparation of other information accompanying the consolidated financial statements. The other information comprises Directors’ report.
Our opinion on the consolidated financial statements does not cover the other information and we do not express any form of assurance conclusion on that information.
In connection with our audit of the consolidated financial statements, our responsibility is to read the other information and, in doing so, consider whether that information is materially inconsistent with the consolidated financial statements or our knowledge obtained in the course of our audit, or otherwise appears to be materially misstated. If, based on the work we have performed, we conclude that there is a material misstatement of this other information, we are required to report that fact.
We have nothing to report in this regard.

Page | 6
2. Respective responsibilities and restrictions on use
Responsibilities of Those Charged with Governance for the consolidated financial statements The Directors are responsible for the preparation and fair presentation of the financial statements in accordance with applicable law and IFRSs, and for such internal control as management determines is necessary to enable the preparation of financial statements that are free from material misstatement, whether due to fraud or error.
In preparing the consolidated financial statements, the Directors are responsible for assessing the Group and Company’s ability to continue as a going concern, disclosing, as applicable, matters related to going concern and using the going concern basis of accounting unless the Directors either intends to liquidate the Group and Company or to cease operations, or has no realistic alternative but to do so.
Those charged with governance are responsible for overseeing the Group and Company’s financial reporting process.
Auditor’s responsibilities for the audit of the consolidated financial statements Our objectives are to obtain reasonable assurance about whether the consolidated financial statements as a whole are free from material misstatement, whether due to fraud or error, and to issue an auditor's report that includes our opinion. Reasonable assurance is a high level of assurance, but is not a guarantee that an audit conducted in accordance with ISAs will always detect a material misstatement when it exists. Misstatements can arise from fraud or error and are considered material if, individually or in the aggregate, they could reasonably be expected to influence the economic decisions of users taken on the basis of these consolidated financial statements.
Further details relating to our work as auditor is set out in the Scope of Responsibilities Statement contained in the appendix of this report, which is to be read as an integral part of our report.
Our report is made solely to the Company’s members, as a body, in accordance with the terms of our engagement. Our audit work has been undertaken so that we might state to members those matters we are required to state to them in an auditor’s report and for no other purpose. We do not accept or assume responsibilities to anyone other than the members as a body, for our audit work, for this report, or for the opinions we have formed.
Michael Gibbons for and on behalf of
KPMG Chartered Accountants, Statutory Audit Firm 1 Stokes Place, St Stephen’s Green, Dublin 2, Ireland
27 March 2018

Page | 7
Appendix to the Independent Auditor’s Report
Further information regarding the scope of our responsibilities as auditor As part of an audit in accordance with ISAs, we exercise professional judgment and maintain professional scepticism throughout the audit. We also:
• Identify and assess the risks of material misstatement of the financial statements, whether due to fraud or error, design and perform audit procedures responsive to those risks, and obtain audit evidence that is sufficient and appropriate to provide a basis for our opinion. The risk of not detecting a material misstatement resulting from fraud is higher than for one resulting from error, as fraud may involve collusion, forgery, intentional omissions, misrepresentations, or the override of internal control.
• Obtain an understanding of internal control relevant to the audit in order to design audit procedures that are appropriate in the circumstances, but not for the purpose of expressing an opinion on the effectiveness of the Group's internal control.
• Evaluate the appropriateness of accounting policies used and the reasonableness of accounting estimates and related disclosures made by the Directors.
• Conclude on the appropriateness of the director’s use of the going concern basis of accounting and, based on the audit evidence obtained, whether a material uncertainty exists related to events or conditions that may cast significant doubt on the Group's ability to continue as a going concern. If we conclude that a material uncertainty exists, we are required to draw attention in our auditor's report to the related disclosures in the financial statements or, if such disclosures are inadequate, to modify our opinion. Our conclusions are based on the audit evidence obtained up to the date of our auditor's report. However, future events or conditions may cause the Group to cease to continue as a going concern.
• Evaluate the overall presentation, structure and content of the financial statements, including the disclosures, and whether the financial statements represent the underlying transactions and events in a manner that achieves fair presentation.
• Obtain sufficient appropriate audit evidence regarding the financial information of the entities or business activities within the Group to express an opinion on the consolidated financial statements. We are responsible for the direction, supervision and performance of the group audit. We remain solely responsible for our audit opinion.
We communicate with those charged with governance regarding, among other matters, the planned scope and timing of the audit and significant audit findings, including any significant deficiencies in internal control that we identify during our audit.

Page | 8
Consolidated income statement For the year ended 31 December 2017
Year ended 31 December
2017
Year ended 31 December
2016
Notes £m £m Revenue
Rental income 188.7 191.5 Hotel revenue 23.5 19.4 Interest income from loans secured by real estate 8 6.9 6.3 219.1 217.2 Property related expenses (42.9) (35.8) Hotel cost of sales (19.0) (16.3) (61.9) (52.1) Gross profit 157.2 165.1
Net change in fair value of investment and development property 12,32 68.6 (10.8) Gain on sale of investment and development property and loan collateral 7 7.2 8.5 Net change in fair value of loans secured by real estate 13 3.3 0.3 236.3 163.1 Expenses
Administrative expenses (32.1) (16.4) Investment management fee 26A(i) (15.6) (16.3) (47.7) (32.7) Results from operating activities before financing income and costs 188.6 130.4 Interest income from cash and cash equivalents 8 0.4 0.6 Finance costs 9 (51.9) (57.7) Net finance expense (51.5) (57.1) Profit before taxation 137.1 73.3 Taxation 10 (5.6) (7.3) Profit for the year after taxation 131.5 66.0
The accompanying notes form an integral part of these consolidated financial statements.

Page | 9
Consolidated statement of comprehensive income For the year ended 31 December 2017
Year ended 31 December
2017
Year ended 31 December
2016 Notes £m £m
Profit for the year after taxation 131.5 66.0 Other comprehensive income: Items that may be reclassified subsequently to profit or loss:
Foreign operations – foreign currency translation differences 25A 42.4 126.2
Hedge of net investment in foreign operations 25A (33.7) (93.0)
8.7 33.2
Items that will never be reclassified to profit or loss:
Net change in fair value of property, plant and equipment 14 4.7 1.9 Other comprehensive income for the year 13.4 35.1 Total comprehensive income for the year, net of tax 144.9 101.1 Profit attributable to:
Owners of the Company
131.4 65.9
Non-controlling interests 3A(iii) 0.1 0.1 131.5 66.0 Total comprehensive income attributable to: Owners of the Company 144.8 101.0 Non-controlling interests 3A(iii) 0.1 0.1 144.9 101.1
The accompanying notes form an integral part of these consolidated financial statements.
Page | 10
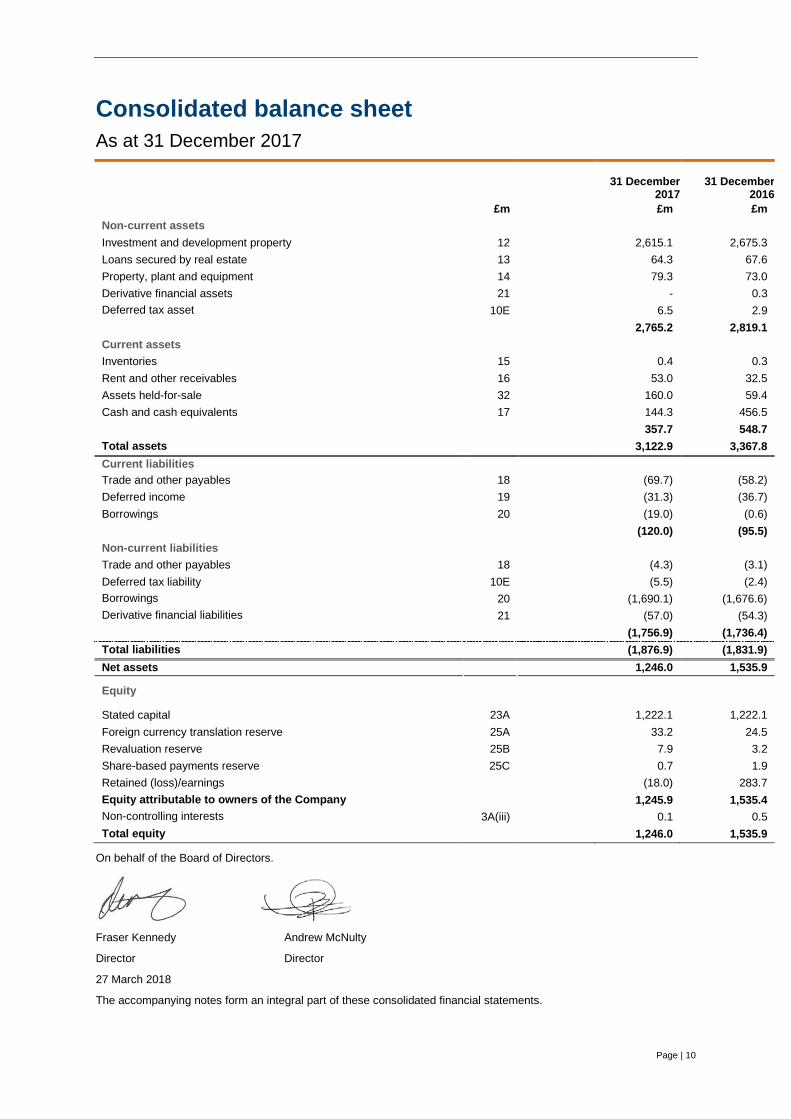
Consolidated balance sheet As at 31 December 2017
31 December
2017 31 December
2016 £m £m £m Non-current assets Investment and development property 12 2,615.1 2,675.3 Loans secured by real estate 13 64.3 67.6 Property, plant and equipment 14 79.3 73.0 Derivative financial assets 21 - 0.3 Deferred tax asset 10E 6.5 2.9 2,765.2 2,819.1 Current assets Inventories 15 0.4 0.3 Rent and other receivables 16 53.0 32.5 Assets held-for-sale 32 160.0 59.4 Cash and cash equivalents 17 144.3 456.5 357.7 548.7 Total assets 3,122.9 3,367.8 Current liabilities Trade and other payables 18 (69.7) (58.2) Deferred income 19 (31.3) (36.7) Borrowings 20 (19.0) (0.6) (120.0) (95.5) Non-current liabilities Trade and other payables 18 (4.3) (3.1) Deferred tax liability 10E (5.5) (2.4) Borrowings 20 (1,690.1) (1,676.6) Derivative financial liabilities 21 (57.0) (54.3) (1,756.9) (1,736.4) Total liabilities (1,876.9) (1,831.9) Net assets 1,246.0 1,535.9
Equity Stated capital 23A 1,222.1 1,222.1 Foreign currency translation reserve 25A 33.2 24.5 Revaluation reserve 25B 7.9 3.2 Share-based payments reserve 25C 0.7 1.9 Retained (loss)/earnings (18.0) 283.7 Equity attributable to owners of the Company 1,245.9 1,535.4 Non-controlling interests 3A(iii) 0.1 0.5 Total equity 1,246.0 1,535.9
On behalf of the Board of Directors.
Fraser Kennedy Andrew McNulty
Director Director
27 March 2018
The accompanying notes form an integral part of these consolidated financial statements.

Page | 11
Consolidated statement of changes in equity For the year ended 31 December 2017
Attributable to owners of the Company
Non- controlling
interests
Total
equity
Stated capital
Foreign currency
translation reserve
Revaluation reserve
Share- based
payments reserve
Retained earnings Total
£m £m £m £m £m £m £m £m
Balance as at 1 January 2017 1,222.1 24.5 3.2 1.9 283.7 1,535.4 0.5 1,535.9
Profit for the year - - - - 131.4 131.4 0.1 131.5
Other comprehensive income - 8.7 4.7 - - 13.4 - 13.4 Total comprehensive income for the year - 8.7 4.7 - 131.4 144.8 0.1 144.9 Transactions with owners of the Company recognised directly in equity: Contributions and distributions Share based settlement of investment management fee (Note 26A(i))1 - - - (1.2) - (1.2) - (1.2)
Dividends (Note 24)2 - - - - (433.1) (433.1) (0.5) (433.6) - - - (1.2) (433.1) (434.3) (0.5) (434.8) Balance as at 31 December 2017 1,222.1 33.2 7.9 0.7 (18.0) 1,245.9 0.1 1,246.0
The accompanying notes form an integral part of these consolidated financial statements.
Footnotes: 1. Net movement in share-based payment reserve representing reversal of £1.9 million opening reserve and recording of year end
reserve for the investment management fee payable in the amount of £0.7 million. 2. Dividends comprise amounts paid for cash during the year ended 31 December 2017 totalling £416.3 million and the closing
dividend payable in connection with the merger totalling £16.8 million.
Page | 12
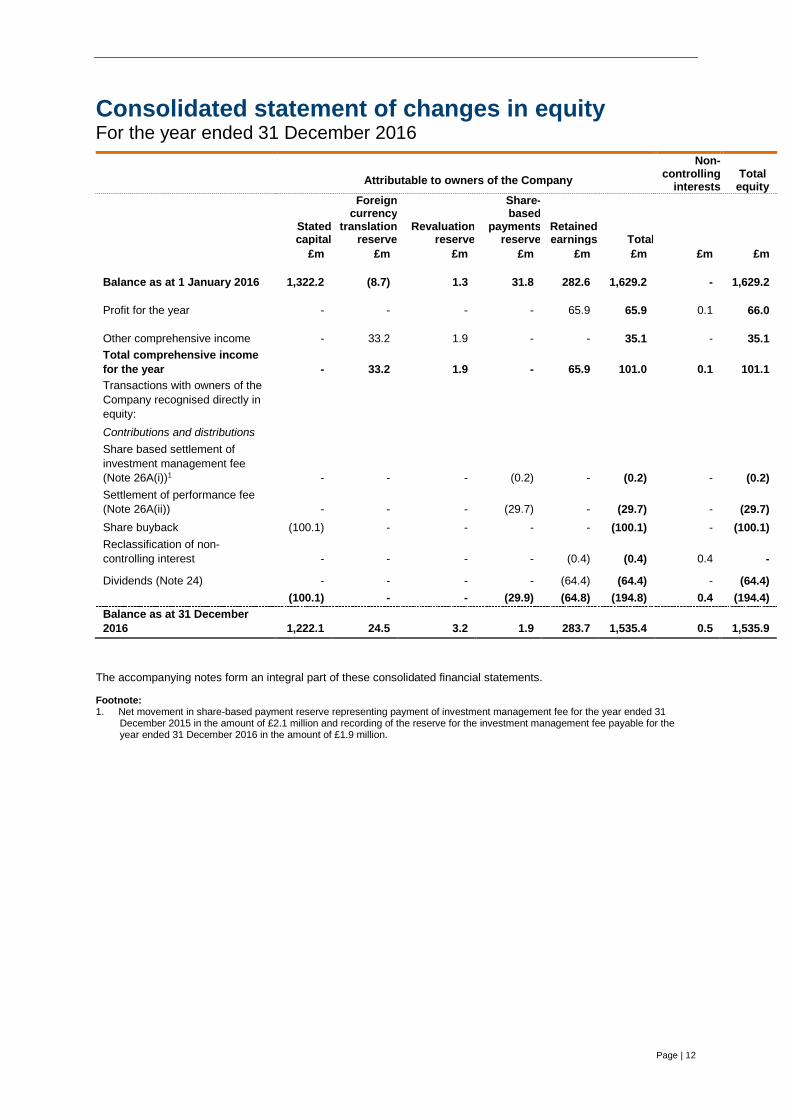
Consolidated statement of changes in equity For the year ended 31 December 2016
Attributable to owners of the Company
Non- controlling
interests
Total
equity
Stated capital
Foreign currency
translation reserve
Revaluation reserve
Share- based
payments reserve
Retained earnings Total
£m £m £m £m £m £m £m £m
Balance as at 1 January 2016 1,322.2 (8.7) 1.3 31.8 282.6 1,629.2 - 1,629.2
Profit for the year - - - - 65.9 65.9 0.1 66.0
Other comprehensive income - 33.2 1.9 - - 35.1 - 35.1 Total comprehensive income for the year - 33.2 1.9 - 65.9 101.0 0.1 101.1 Transactions with owners of the Company recognised directly in equity: Contributions and distributions Share based settlement of investment management fee (Note 26A(i))1 - - - (0.2) - (0.2) - (0.2) Settlement of performance fee (Note 26A(ii)) - - - (29.7) - (29.7) - (29.7) Share buyback (100.1) - - - - (100.1) - (100.1) Reclassification of non-controlling interest - - - - (0.4) (0.4) 0.4 -
Dividends (Note 24) - - - - (64.4) (64.4) - (64.4) (100.1) - - (29.9) (64.8) (194.8) 0.4 (194.4) Balance as at 31 December 2016 1,222.1 24.5 3.2 1.9 283.7 1,535.4 0.5 1,535.9
The accompanying notes form an integral part of these consolidated financial statements.
Footnote: 1. Net movement in share-based payment reserve representing payment of investment management fee for the year ended 31
December 2015 in the amount of £2.1 million and recording of the reserve for the investment management fee payable for the year ended 31 December 2016 in the amount of £1.9 million.

Page | 13
Consolidated cash flow statement For the year ended 31 December 2017
Year ended 31 December
2017
Year ended 31 December
2016 Notes £m £m Cash flows from operating activities Profit for the year
131.5 66.0
Adjustments for:
Net change in fair value of investment and development property 12 (68.6) 10.8 Net change in fair value of loans secured by real estate 13 (3.3) (0.3) Gain on sale of loan collateral 7 - (0.4) Gain on sale of investment property 7 (7.2) (8.1) Write-off of property, plant and equipment - (1.3) Net finance cost 42.8 43.3 Amortisation of lease incentive (8.5) (3.8) Amortisation of loan fees 9 3.7 5.5 Amortisation of bond discount, net of amortisation of bond premia 9 0.2 0.7 Taxation 10C 5.6 7.3 Depreciation 14 4.2 3.2 Provision for impairment of accounts receivable 0.8 0.7 Investment management fee (1.2) (0.2) Operating cash flows before movements in working capital 100.0 123.4 (Increase) in rent and other receivables (12.8) (3.0) (Increase) in inventories (0.1) - (Decrease)/increase in deferred rental income (5.4) 5.3 (Decrease) in trade and other payables - (21.0) Cash generated from operations before interest and taxation 81.7 104.7 Interest received 7.4 7.4 Interest paid (52.9) (44.6) Derivative instruments (11.8) (1.0) Performance fee paid 26A(ii) - (29.7) Tax paid (12.0) (7.1) Cash flows generated from operating activities 12.4 29.7 Investing activities Acquisition/improvement of investment and development property (105.5) (282.2) Disposal of investment and development property 7 191.7 256.0 Capital expenditure on property, plant and equipment 14 (4.5) (10.2) Repayment of loans secured by real estate 13 7.8 - Investment in loans secured by real estate 13 (0.4) - Disposal of loans secured by real estate - 115.6 Cash flows from/(used in) investing activities 89.1 79.2

Page | 14
Consolidated cash flow statement (continued)
Year ended 31 December
2017
Year ended 31 December
2016 Notes £m £m Financing activities Proceeds from borrowings 20A 281.9 385.7 Bond interest received in advance - 3.4 Repayments of secured borrowings 20A (281.8) (230.0) Draw down of revolving credit facility - 75.0 Repayment of revolving credit facility - (75.0) Transaction costs related to loans and borrowings (2.2) (3.5) Bond premia received 20A - 5.9 Share buyback programme, inclusive of costs - (100.1) Dividends paid 24 (416.3) (64.4) Cash flows (used in)/from financing activities (418.4) (3.0) Net increase/(decrease) in cash and cash equivalents (316.9) 105.9 Cash and cash equivalents at beginning of year 17 456.5 326.5 Foreign exchange movements 4.7 24.1 Cash and cash equivalents at the reporting date 17 144.3 456.5
The accompanying notes form an integral part of these consolidated financial statements.

Page | 15
Notes to consolidated financial statements For the year ended 31 December 2017 1. General information
The Company was incorporated as a public limited company on 23 December 2013. At the reporting date it is a limited liability, closed-ended investment company which is domiciled in Jersey. The Group comprises the Company and its subsidiaries (collectively the ‘Group’ and individually ‘Group companies’).
The registered office of the Company is 47 Esplanade, St Helier, Jersey, JE1 0BD, Channel Islands. The Company invests in investment and development property, hotel businesses and loans secured by real estate in Europe with the objective of generating and growing long-term cash flows to pay dividends and to enhance capital values through focused asset management and strategic acquisitions.
On 24 April 2017 the Company and Kennedy-Wilson Holdings, Inc (‘KW’) published an announcement setting out the terms and conditions of a recommended offer by KW to acquire all of the outstanding shares of the Company. The merger was approved on 20 October 2017 and on 23 October 2017 the Company’s shares ceased trading the premium segment of the UK Listing Authority’s Official List and from admission to trading on the main market for listed securities maintained by the London Stock Exchange. Further details are set out in Note 33.
On 23 November 2017 the Company changed it name from Kennedy Wilson Europe Real Estate Plc to Kennedy Wilson Europe Real Estate Limited.
2. Basis of preparation A. Statement of compliance
The consolidated financial statements (the ‘financial statements’) for the year ended 31 December 2017 have been prepared on the basis of the accounting policies set out below. These financial statements give a true and fair view of the assets, liabilities, financial position and profit of the Company and its subsidiaries included in the consolidation taken as a whole.
The consolidated financial statements included in this report have been prepared in accordance with International Financial Reporting Standards as adopted by the European Union (‘IFRS’). The Company has not early adopted any forthcoming IASB standards. Note 4 sets out the details of such upcoming standards.
The consolidated financial statements have been prepared on a basis consistent with the prior year, save for the re-presentation of the certain disclosures set out in Note 6 Segment Reporting. This representation was undertaken to align prior year comparatives with current year disclosures, to reflect the way that the Chief Operating Decision Maker reviews segmental information, post merger, as described above.
B. Basis of measurement
The consolidated financial statements are for the year ended 31 December 2017 and have been prepared on the going concern basis, applying the historical cost convention except for investment and development property, loans secured by real estate, property, plant and equipment and derivative financial instruments which are stated at their fair value using the accounting policies as set out in Note 3.
C. Functional and presentational currency
The consolidated financial statements are presented in Pound Sterling as this is the Company’s functional currency. All financial information presented in Pound Sterling has been rounded to the nearest million, and presented to one decimal place, except where otherwise stated.

Page | 16
D. Use of estimates and judgements
The preparation of the consolidated financial statements in conformity with IFRS requires management to make judgements, estimates and assumptions that affect the application of the Group’s accounting policies and the reported amounts of assets, liabilities, income and expenses. Actual results may differ from these estimates.
Estimates and underlying assumptions are reviewed on an ongoing basis. Revisions to accounting estimates are recognised in the period in which the estimates are revised if the revision affects only that period or in the period of revision and future periods if the revision affects both current and future periods.
Critical judgements in applying accounting policies that have the most significant effect on amounts recognised in the financial statements in the year ending 31 December 2017 include management’s estimates of the fair value of investment and development property (Note 12), loans secured by real estate (Note 13) and land and buildings within property, plant and equipment (Note 14).
3. Significant accounting policies
There are a number of new standards or amendments which are effective for the Group for the first time for the financial year beginning 1 January 2017. None of these had a matieral impact on the Group:
• Disclosure Initiative (Amendments to IAS 7);
• Recognition of Deferred Tax Assets for Unrealised Losses (Amendments to IAS 12); and
• Annual Improvements to IFRSs 2014-2016 Cycle (Amendments to IFRS 12 Disclosure of Interests in Other Entities).
A. Basis of consolidation (i). Subsidiaries
Subsidiaries are those entities controlled by the Group. The Group controls an entity when it is exposed to, or has rights to, variable returns from its involvement with the entity and has the ability to affect those returns through its power over the entity. The financial statements of subsidiaries are included in the consolidated financial statements from the date on which control commences until the date on which control ceases.
(ii). Business combinations
The Group acquires subsidiaries that may own investment and development property or carry on businesses, including the ownership of hotels or other forms of own-use assets. At the time of acquisition, the Group considers whether each acquisition represents the acquisition of a business or the acquisition of an asset. The Group accounts for an acquisition as a business combination where an integrated set of activities is acquired in addition to the property. More specifically, consideration is given as to the extent to which significant processes are acquired and, in particular, the extent of services provided by the subsidiary.
When the acquisition of subsidiaries does not represent a business, it is accounted for as an acquisition of a group of assets and liabilities. The cost of the acquisition is allocated to the assets and liabilities acquired based upon their relative fair values, and no goodwill or related deferred tax is recognised.
Any contingent consideration is measured at fair value at the date of acquisition. If an obligation to pay contingent consideration that meets the definition of a financial instrument is classified as equity, then it is not remeasured and settlement is accounted for within equity. Otherwise, other contingent consideration is remeasured at fair value at each reporting date and subsequent changes in the fair value of the contingent consideration are recognised in profit or loss.

Page | 17
(iii). Non-controlling interests
Non-controlling interests (‘NCI’) are measured at their proportionate share of the acquiree’s identifiable net assets at the date of acquisition.
Changes in the Group’s interest in a subsidiary that do not result in a loss of control are accounted for as equity transactions.
(iv). Transactions eliminated on consolidation
Intra-group balances and transactions, and any unrealised income and expenses arising from intra-group transactions, are eliminated.
B. Property acquisitions and business combinations
The consideration transferred does not include amounts related to the settlement of pre-existing relationships. Such amounts are generally recognised in profit or loss. Any excess of the purchase price of business combinations over the fair value of the assets, liabilities and contingent liabilities and resulting deferred taxes thereon is recognised as goodwill.
Where the Group judges that an acquisition is a business combination it uses the acquisition method of accounting in accordance with IFRS 3 Business Combinations at the date that control is transferred to the Group (see policy A(ii)). The consideration transferred in the acquisition is generally measured at fair value, as are the identifiable net assets acquired. Any excess of the purchase price of business combinations over the fair value of the assets and liabilities is recognised as goodwill. Any gain arising on a bargain purchase is recognised in profit or loss immediately. Transaction costs are expensed as incurred, except if related to the issue of debt or equity securities. Any goodwill that arises is tested annually for impairment.
Where such acquisitions are not judged to be an acquisition of a business, they are not accounted for as business combinations. Instead, the cost of acquisition is allocated between the identifiable assets and liabilities of the entity based on the relative fair values at the acquisition date. Accordingly, no goodwill or additional deferred taxation arises.
C. Foreign currency translation
Items included within the financial statements of each of the Group’s entities are measured using the currency of the primary economic environment in which the entity operates (its ‘functional currency’).
(i). Transactions and balances
Transactions in currencies other than an entity’s functional currency are recorded at the exchange rate prevailing at the date of the transaction. Foreign exchange gains and losses resulting from the settlement of such transactions and from the translation at year-end exchange rates of monetary assets and liabilities denominated in foreign currencies are recognised in profit or loss for the financial period (see policy C(ii)).
(ii). Foreign operations
The assets and liabilities of foreign operations are translated to Pound Sterling at the exchange rate prevailing at the reporting date. The revenues and expenses of foreign operations are translated to Pound Sterling at rates approximating to the foreign exchange rates ruling at the dates of the transactions. Foreign exchange differences arising on re-translation are taken to other comprehensive income (‘OCI’) and then accumulated in a separate foreign currency translation reserve.
When a foreign operation is disposed of in its entirety or partially such that control, significant influence or joint control is lost, the cumulative amount in the translation reserve related to that foreign operation is reclassified to profit or loss as part of the gain or loss on disposal. If the Group disposes of part of its interest in a subsidiary but retains control, then the relevant proportion of the cumulative amount is reattributed to NCIs. When the Group disposes of any part of an associate or joint venture while retaining significant influence or joint control, the relevant proportion of the cumulative amount is reclassified to profit or loss.

Page | 18
D. Revenue recognition
Revenue includes rental income and other property related revenue, service charges and management charges from properties, hotel revenue and interest income from loans secured by real estate.
(i). Rental income
Rental income from operating leases on investment property is recognised on a straight-line basis over the lease term. When the Group provides incentives to its tenants, the cost of incentives is recognised over the lease term, on a straight-line basis, as a reduction of rental income. The lease term is the non-cancellable period of the lease together with any further term for which the tenant has the option to continue the lease, where, at the inception of the lease, the directors are reasonably certain that the tenant will exercise the option.
Contingent rents, which are dependent on the turnover levels of lessees are recognised as income in the periods in which they are earned. Any financial statement impact of rent reviews are recognised when such rent reviews have been agreed with the tenants. Surrender premia received are considered a component of rental income.
Lease incentives are recognised as an integral part of the net consideration for use of the property and are amortised on a straight line basis over the term of the lease, or the period to the first tenant break, if shorter, unless there is reasonable certainty that the break will not be exercised.
Income arising from expenses recharged to tenants is recognised in the period in which the compensation becomes receivable. Service and management charges and other such receipts are included in rental income gross of the related costs, as the directors consider the Group acts as principal in this respect.
(ii). Interest income on loans secured by real estate
Interest income on loans secured by real estate is recognised in profit or loss on an effective interest rate basis over the period to expected maturity.
(iii). Hotel revenue
Hotel revenue represents sales (excluding VAT and similar taxes) of goods and services, net of discounts, provided in the normal course of business and recognised when services have been rendered. Such revenues typically include rental of rooms, food and beverage sales and other ancillary revenues from hotels owned by the Group. Revenue is recognised when rooms are occupied and food and beverages are sold.
E. Employee benefits (i). Short-term employee benefits
Short-term employee benefits are expensed as the related service is provided. A liability is recognised for the amount expected to be paid if the Group has a present legal or constructive obligation to pay this amount as a result of past service provided by the employee and the obligation can be estimated reliably.
(ii). Defined contribution plans
Obligations for contributions to defined contribution plans are expensed as the related service is provided. Prepaid contributions are recognised as an asset to the extent that a cash refund or reduction in future payments is available.
F. Interest income from cash and cash equivalents
Interest income from cash and cash equivalents is recognised as it accrues in profit or loss, using the effective interest rate method.
G. Finance costs
Finance costs comprise interest expense on borrowings (including amortisation of deferred debt issue costs, and amortisation of discounts and premia on corporate bonds) and are recognised in profit or loss using the effective interest method. All interest expense on borrowings is recognised in profit or loss in the period in which it is incurred, unless it is directly related to investment property under development in which case it is capitalised.
Page | 19
H. Taxation
Income tax expense comprises current and deferred tax. It is recognised in profit or loss except to the extent that it relates to the recording of a business combination or items recognised directly in equity or in OCI.
(i). Current tax
Current tax is calculated as the expected tax payable or receivable on the taxable income or loss for the financial period, using tax rates enacted or substantively enacted at the reporting date, with any adjustments to tax payable in respect of previous years.
(ii). Deferred tax
Deferred tax is recognised in respect of temporary differences between the carrying amounts of assets and liabilities for financial reporting purposes and the amounts used for taxation purposes. Deferred tax is not recognised for:
• temporary differences on the initial recognition of assets or liabilities in a transaction that is not a business combination and that affects neither accounting nor taxable profit or loss; and
• temporary differences related to investments in subsidiaries, associates and jointly controlled entities to the extent that the Group is able to control the timing of the reversal of the temporary differences and it is probable that they will not reverse in the foreseeable future.
The measurement of deferred tax reflects the tax consequences that follow the manner in which the Group expects, at the end of the reporting period, to recover or settle the carrying amount of its assets and liabilities. For investment and development property that is measured at fair value, the presumption that the carrying amount of investment and development property will be recovered through sale is not expected to be rebutted.
Deferred tax is measured at the tax rates that are expected to be applied to temporary differences when they reverse, using tax rates enacted or substantively enacted at the reporting date.
Deferred tax assets and liabilities are offset if there is a legally enforceable right to offset current tax liabilities and assets, and they relate to taxes levied by the same tax authority on the same taxable entity, or on different tax entities, but the Group intends to settle current tax liabilities and assets on a net basis or the Group’s tax assets and liabilities are realised simultaneously.
A deferred tax asset is recognised for unused tax losses, tax credits and deductible temporary differences to the extent that it is probable that future taxable profits will be available against which they can be utilised. Deferred tax assets are reviewed at each reporting date and reduced to the extent that it is no longer expected to be probable that the related tax benefit will be realised.
I. Dividends
Dividends are recognised as a liability in the period in which they become obligations of the Company.
J. Investment and development property
Property held for long-term rental yields or for capital appreciation or both, and that is not occupied by the Group, is classified as investment property and recorded at fair value. Investment property also includes property that is being constructed or developed for future use as investment property (see Note 5A).
Investment property is recognised when it has been acquired and future economic benefits are expected to be derived from its ownership. Investment property is measured initially at its cost, including related transaction costs and subsequently measured at fair value with any change recognised in profit or loss.
Investment property is derecognised when it has been disposed of or permanently withdrawn from use and no future economic benefit is expected from its disposal. The difference between the net disposal proceeds and the carrying amount of the asset would result in either gains or losses at the retirement or disposal of the investment property. Any gains or losses are recognised in the income statement in the year of retirement or disposal. Any gain or loss on disposal of an investment property (calculated as the difference between the proceeds from disposal, net of selling costs, and the carrying amount of the item) is recognised in profit or loss.
Properties that are currently being developed or that are to be developed in the near future are held as development properties. These properties are initially valued at cost. Any direct expenditure on development properties is capitalised and the properties are then valued by external valuers at their respective fair value at each reporting date.

Page | 20
A fair value measurement of a non-financial asset takes into account a market participant’s ability to generate economic benefits by using the asset in its highest and best use or by selling it to another market participant that would use the asset in its highest and best use.
Valuations reflect, when appropriate, the type of tenants actually in occupation or responsible for meeting lease commitments or likely to be in occupation after letting vacant accommodation, the allocation of maintenance and insurance responsibilities between the Group and the lessee, and the expected remaining economic life of the property. When rent reviews or lease renewals are pending with anticipated reversionary increases, it is assumed that all notices, and when appropriate counter-notices, have been served validly and within the appropriate time.
K. Property, plant and equipment
Land and buildings which represent hotels are initially measured at cost plus any costs that are directly attributable to acquiring, and thereafter they are measured at fair value (see Note 5C).
Revaluation gains are credited to other comprehensive income and accumulated in equity within a revaluation reserve unless representing the reversal of an impairment of the same asset previously recognised in profit or loss, in which case the reversal is recognised in profit or loss. A decrease arising as a result of a revaluation is recognised as an expense to the extent that it exceeds any amount previously credited to the revaluation surplus relating to the same asset. Any gain recognised in OCI is not re-classified into the profit or loss upon disposal of the associated asset.
Other items of property, plant and equipment are stated at cost less depreciation and any impairment. Depreciation and any impairment losses are recognised in profit or loss. Repairs and maintenance costs are expensed as incurred. Any gain or loss on disposal of an item of property, plant and equipment is recognised in profit or loss.
All property, plant and equipment (excluding land, which is not depreciated) are depreciated to residual value over their estimated useful lives, namely:
• Buildings 40 years
• Fixtures, fittings and equipment 5 – 10 years
All depreciation is charged on a straight-line basis.
L. Expenses
Expenses are recognised in the profit or loss in the period in which they are incurred on an accruals basis.
M. Inventories
Inventories are measured at the lower of cost and net realisable value. The cost of inventories is based on a first-in, first-out basis.
N. Assets held-for-sale
Non-current assets, or disposal groups comprising assets and liabilities, are classified as held-for-sale if it is highly probable that they will be recovered primarily through sale rather than through continuing use.
Such assets, or disposal groups, are generally measured at the lower of their carrying amount and fair value less costs to sell. Any impairment loss on a disposal group is allocated first to goodwill, and then to the remaining assets and liabilities on a pro rata basis, except that no loss is allocated to inventories, financial assets, deferred tax assets, employee benefit assets or investment property, which continue to be measured in accordance with the Group’s other accounting policies. Impairment losses on initial classification as held-for-sale or held-for-distribution and subsequent gains and losses on re-measurement are recognised in the profit or loss.
Once classified as held-for-sale, intangible assets and property, plant and equipment are no longer amortised or depreciated.
O. Borrowings
All borrowings are initially recognised at fair value less directly attributable transaction costs. After initial recognition, borrowings are subsequently measured at amortised cost using the effective interest method (see Note 5D).

Page | 21
P. Financial instruments (i). Non-derivative financial assets
The Group initially recognises loans secured by real estate on the date that they are purchased. All other financial assets are recognised initially on the trade date, which is the date that the Group becomes a party to the contractual provisions of the instrument.
The Group derecognises a financial asset when the contractual rights to the cash flows from the asset expire, or it transfers the rights to receive the contractual cash flows in a transaction in which substantially all the risks and rewards of ownership of the financial asset are transferred. Any interest in such transferred financial assets that is created or retained by the Group is recognised as a separate asset or liability.
The Group classifies its cash and cash equivalents and rent and other receivables as loans and receivables which are measured at amortised cost, with loans secured by real estate being designated at fair value through the profit or loss.
At 31 December 2017 the Group had the following non-derivative financial assets:
(a). Cash and cash equivalents
Cash and cash equivalents comprise cash balances and call deposits with maturities of three months or less from the acquisition date that are subject to an insignificant risk of changes in their fair value, and are used by the Group in the management of its short-term commitments. These assets are initially measured at fair value less initial direct costs and subsequently at amortised cost.
(b). Rent and other receivables
Rent and other receivables are initially recognised at fair value less initial direct costs, which is usually the original invoiced amount and subsequently carried at amortised cost using the effective interest method less provision made for impairment, if applicable.
Where there is objective evidence that an incurred impairment loss has arisen, appropriate allowances for any irrecoverable amounts are recognised through profit or loss in the statement of comprehensive income.
(c). Loans secured by real estate
Loans secured by real estate have been designated to be measured at fair value through profit or loss as the assets are managed, evaluated and reported internally on a fair value basis.
Any related initial direct costs relating to these loans are charged immediately as an expense through profit or loss.
Interest income is accreted to profit or loss separately using the effective interest rate method (see policy D(ii)).
(ii). Non-derivative financial liabilities
All non-derivative financial liabilities are recognised initially at the date that the Group becomes a party to the contractual provisions of the instrument and are measured initially at fair value less initial direct costs and subsequently measured at amortised cost. The Group derecognises a financial liability when its contractual obligations are discharged, cancelled or expire.
(iii). Derivative financial instruments and net investment hedge accounting
The Group uses a variety of derivative instruments to mitigate certain interest rate and foreign currency financial risks including interest rate caps, cross-currency swaps and foreign currency forward contracts and foreign currency zero premium options. The Group does not enter into derivative contracts for speculative purposes. Derivative instruments are used for hedging purposes to alter the risk profile of an existing underlying exposure of the Group in line with its risk management policies. All derivatives are recognised at fair value. The treatment of the change in fair value depends on whether the derivative is designated as a hedging instrument, the nature of the item being hedged and the effectiveness of the hedge (see Note 5E).
Derivative financial instruments are initially recognised at fair value on the date on which a derivative contract is entered into and are subsequently re-measured at fair value. Derivatives are carried as assets when the fair value is positive and as liabilities when the fair value is negative.
Page | 22
(a). Net investment hedges
The Group designates foreign currency forward contracts, zero-cost foreign currency options, interest rate cross-currency swaps and certain foreign currency denominated corporate debt as hedges of its net investment in foreign operations. At inception, the Group documents the relationship between the hedging instrument and the hedged items, its risk management objectives and the strategy for undertaking the transaction. The Group also documents its assessment of whether the hedging instrument is highly effective in offsetting changes in fair value or cash flows of hedged items, both at inception and future periods. Any gain or loss on the hedging instrument relating to the effective portion of the hedge is recognised in OCI. The gain or loss relating to the ineffective portion is recognised immediately in profit or loss within finance income or costs as appropriate. If the hedging instrument no longer meets the criteria for hedge accounting, expires or is sold, terminated or exercised, or if the foreign operation is sold then hedge accounting is discontinued prospectively and gains or losses accumulated in OCI are reclassified to profit or loss.
(b). Derivatives not designated as hedges
Interest rate caps are used to economically hedge the Group’s exposure to certain borrowing related interest rate risks and are not formally designated as hedges for hedge accounting purposes. Changes in the fair value of these derivatives are recognised in profit or loss within finance income or finance cost as appropriate.
The fair values of derivative instruments used for hedging purposes are disclosed in Note 21. The full fair value of a derivative is classified as a non-current asset or liability when its remaining maturity is more than one year; it is classified as a current asset or liability when its remaining maturity is less than one year.
(c). Master netting or similar agreements
The derivatives do not meet the criteria for offsetting in the balance sheet. This is because the Group does not have any currently legally enforceable right to offset recognised amounts, because the right to offset is enforceable only on the occurrence of future events such as credit events.
Q. Share-based payments
The Group enters into equity-settled share-based payment arrangements in respect of services provided to it by KW Investment Management Ltd (the ‘Investment Manager’). The Company recognised an obligation where the method of settlement of the award is dependent on the achievement of a market-based performance condition which is outside of the control of the Company, and the award may be settled either through market purchase of shares or the issue of shares.
(i). Investment management fee
In relation to the Investment Manager’s management fee at grant date, the monetary value of the award it will receive is dependent on a non-market performance condition, being the European Public Real Estate Association Net Asset Value (“EPRA NAV”) at each quarter end.
The award is accounted for as an equity settled share based payment arrangement. The cost of the services received in respect of the shares is recognised in the profit or loss over the vesting period, with a corresponding credit to equity.
(ii). Performance fee
The performance fee arrangement is accounted for as an equity settled share based payment arrangement. The grant date is 1 January and on that date, the Company estimates the grant date fair value of each equity instrument and the number of equity instruments for which the service and non-market performance conditions are expected to be satisfied, resulting in the initial estimate of the total share based payment cost which is expensed over the vesting period. Subsequent to the initial recognition and measurement, the estimate of the number of equity instruments for which the service and non-market performance conditions are expected to be satisfied is revised during the vesting period, that is, the period from 1 January to 31 December. The share based payment cost is based on the fair value of the number of equity instruments issued upon satisfaction of these conditions.
R. Stated capital (i). Ordinary shares
Ordinary shares are classified as equity. Incremental costs directly attributable to the issue of ordinary shares are recognised as a deduction from the stated capital account included in equity.
S. Provisions
Provisions are determined by discounting the expected future cash flows at a pre-tax rate that reflects current market assessments of the time value of money and the risk specific to the liability.
Page | 23
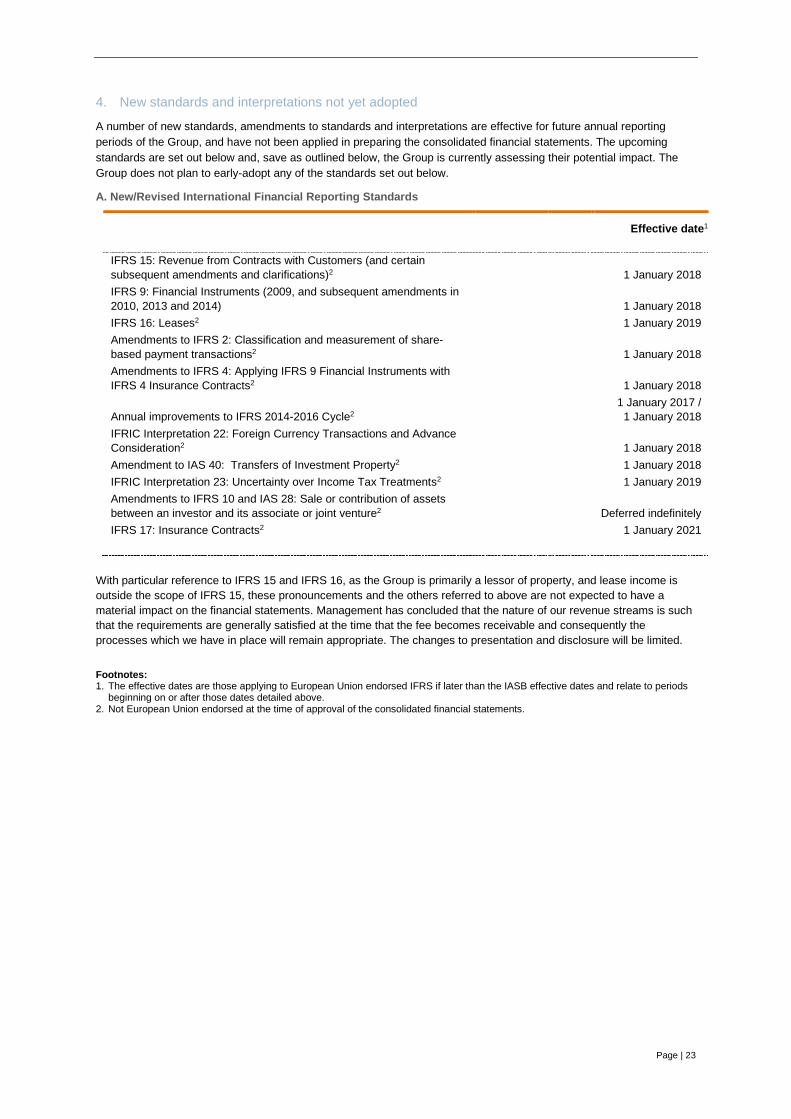
4. New standards and interpretations not yet adopted
A number of new standards, amendments to standards and interpretations are effective for future annual reporting periods of the Group, and have not been applied in preparing the consolidated financial statements. The upcoming standards are set out below and, save as outlined below, the Group is currently assessing their potential impact. The Group does not plan to early-adopt any of the standards set out below.
A. New/Revised International Financial Reporting Standards
Effective date1 IFRS 15: Revenue from Contracts with Customers (and certain subsequent amendments and clarifications)2 1 January 2018 IFRS 9: Financial Instruments (2009, and subsequent amendments in 2010, 2013 and 2014) 1 January 2018 IFRS 16: Leases2 1 January 2019 Amendments to IFRS 2: Classification and measurement of share-based payment transactions2 1 January 2018 Amendments to IFRS 4: Applying IFRS 9 Financial Instruments with IFRS 4 Insurance Contracts2 1 January 2018
Annual improvements to IFRS 2014-2016 Cycle2 1 January 2017 /
1 January 2018 IFRIC Interpretation 22: Foreign Currency Transactions and Advance Consideration2 1 January 2018 Amendment to IAS 40: Transfers of Investment Property2 1 January 2018 IFRIC Interpretation 23: Uncertainty over Income Tax Treatments2 1 January 2019 Amendments to IFRS 10 and IAS 28: Sale or contribution of assets between an investor and its associate or joint venture2 Deferred indefinitely IFRS 17: Insurance Contracts2 1 January 2021
With particular reference to IFRS 15 and IFRS 16, as the Group is primarily a lessor of property, and lease income is outside the scope of IFRS 15, these pronouncements and the others referred to above are not expected to have a material impact on the financial statements. Management has concluded that the nature of our revenue streams is such that the requirements are generally satisfied at the time that the fee becomes receivable and consequently the processes which we have in place will remain appropriate. The changes to presentation and disclosure will be limited. Footnotes: 1. The effective dates are those applying to European Union endorsed IFRS if later than the IASB effective dates and relate to periods
beginning on or after those dates detailed above. 2. Not European Union endorsed at the time of approval of the consolidated financial statements.

Page | 24
5. Determination of fair values
A number of the Group’s accounting policies and disclosures require the determination of fair value, for both financial and non-financial assets and liabilities. Fair value is defined in IFRS 13 Fair Value Measurement as the price that would be received to sell an asset or paid to transfer a liability in an orderly transaction between market participants at the measurement date. Fair values have been determined for measurement and/or disclosure purposes based on the methods described below. Where applicable, further information about the assumptions made in determining fair values is disclosed in the notes specific to that asset or liability.
The Group uses valuation techniques that are appropriate in the circumstances and for which sufficient data are available to measure fair value, maximising the use of relevant observable inputs and minimising the use of unobservable inputs significant to the fair value measurement as a whole:
• Level 1 — Quoted (unadjusted) market prices in active markets for identical assets or liabilities.
• Level 2 — Valuation techniques for which the lowest level input that is significant to the fair value measurement is directly or indirectly observable.
• Level 3 — Valuation techniques for which the lowest level input that is significant to the fair value measurement is unobservable.
For assets and liabilities that are recognised in the financial statements at fair value on a recurring basis, the Group determines whether transfers have occurred between levels in the hierarchy by re-assessing categorisation (based on the lowest level input that is significant to the fair value measurement as a whole) at the end of each reporting period.
There were no transfers between Levels 1 and 2 during the period. There were no transfers between Levels 2 and 3 during the period.
There were no changes in valuation techniques during the period.
A. Investment and development property
The fair value of investment and development property was determined by external, independent property valuers, having appropriate recognised professional qualifications and recent experience in the location and category of the property being valued. Such a valuation takes into account a market participant’s ability to generate economic benefits by using the asset in its highest and best use or by selling it to another market participant that would use the asset in its highest and best use. Independent valuers assess the fair value of the Group’s investment and development property portfolio every six months.
Further information about fair value assumptions applicable to investment and development property is set out in Note 12.
B. Loans secured by real estate
The fair value of loans secured by real estate was determined by independent valuers having appropriate and recent experience in the valuation of loans and real estate. Such independent valuers assess the fair value of the Group’s portfolio of loans secured by real estate every six months.
Further information about fair value assumptions applicable to loans secured by real estate is set out in Note 13.
C. Land and buildings
The fair value of these own-use assets was determined by external, independent valuers, having appropriate recognised professional qualifications and recent experience in the location and category of the asset being valued. Such a valuation takes into account a market participant’s ability to generate economic benefits by using the asset in its highest and best use or by selling it to another market participant that would use the asset in its highest and best use. Independent valuers assess the fair value of the Group’s land and buildings every six months.
Further information about fair value assumptions applicable to land and buildings is set out in Note 14.
D. Borrowings
The valuation technique used in the disclosures for borrowings and other debt is a comparison of debt stock to the marginal cost of debt (from main funding markets) in addition to discounting using the zero coupon discount curve of the relevant currency.
Further information about borrowings is set out in Note 20.

Page | 25
E. Derivative financial instruments
The fair value of forward foreign currency contracts is based on independent third party valuations.
Fair value is estimated by discounting the difference between the contractual forward price and the current forward price for the residual maturity of the contract using a risk-free interest rate (based on government bonds), adjusting for credit risk where appropriate.
The fair value of interest rate caps is based on independent third party valuations. Fair value is estimated using Black’s model to calculate the net present value of expected future cash flows based on observable market volatility and interest rates, adjusting for credit risk, where appropriate.
The fair value of foreign currency options is based on independent third party valuations. Fair value is estimated using a variant of the Black-Scholes model tailored for currency derivatives. The net present value of expected future cash flows is calculated based on observable market foreign exchange volatility, foreign exchange rates and interest rates, adjusting for credit risk, where appropriate.
Further information about fair value assumptions applicable to derivative financial instruments is set out in Note 21.
6. Operating segments A. Basis of segmentation
The Group is organised into three business segments, against which the Group reports its segmental information, being investment properties, loans secured by real estate and hotels. These segments are reported separately because they offer different products or services and are managed separately because they require different strategies.
Operating segments are reported in a manner consistent with the internal reporting provided to the chief operating decision makers which is updated as required by the business, who has been identified as the board of directors of the Company (the ‘Board’).
The following summary describes the operations of each reportable segment:
Segment Description Investment property Property used primarily for the purpose of generating rental income and
comprising office, retail, leisure, industrial and residential real estate assets Loans secured by real estate A loan that is in default or close to being in default, receivership or liquidation,
where the borrower is typically not making full payments and the loan to value (‘LTV’) is greater than 100%
Hotels Ownership and management of hotels, namely Fairmont St Andrews Hotel (United Kingdom) and Portmarnock Hotel (Ireland)
There are varying levels of integration between the investment property and hotel segments. This integration consists primarily of shared asset management resources.
Corporate income and expenses, and assets and liabilities are items incurred centrally which are neither directly attributable nor reasonably allocable to individual segments.
The Group’s key measure of underlying performance of investment property is net operating income as this measure illustrates and emphasises those segments’ contribution to the reported profits of the Group and the input of those segments to earnings per share. By focusing the prime performance measurement on net operating income, other statistical data such as valuation movements are separately highlighted for analysis and attention.
The Group’s key measure of underlying performance of the loans secured by real estate segment is fair value gain as this measure illustrates and emphasises that segment’s contribution to the reported profits of the Group and the input of that segment to earnings per share.
The Group’s key performance measure of underlying performance of the hotel sector is hotel revenue as this measure illustrates and emphasises that segment’s contribution to the reported profits of the Group and the input of that segment to earnings per share.
Page | 26
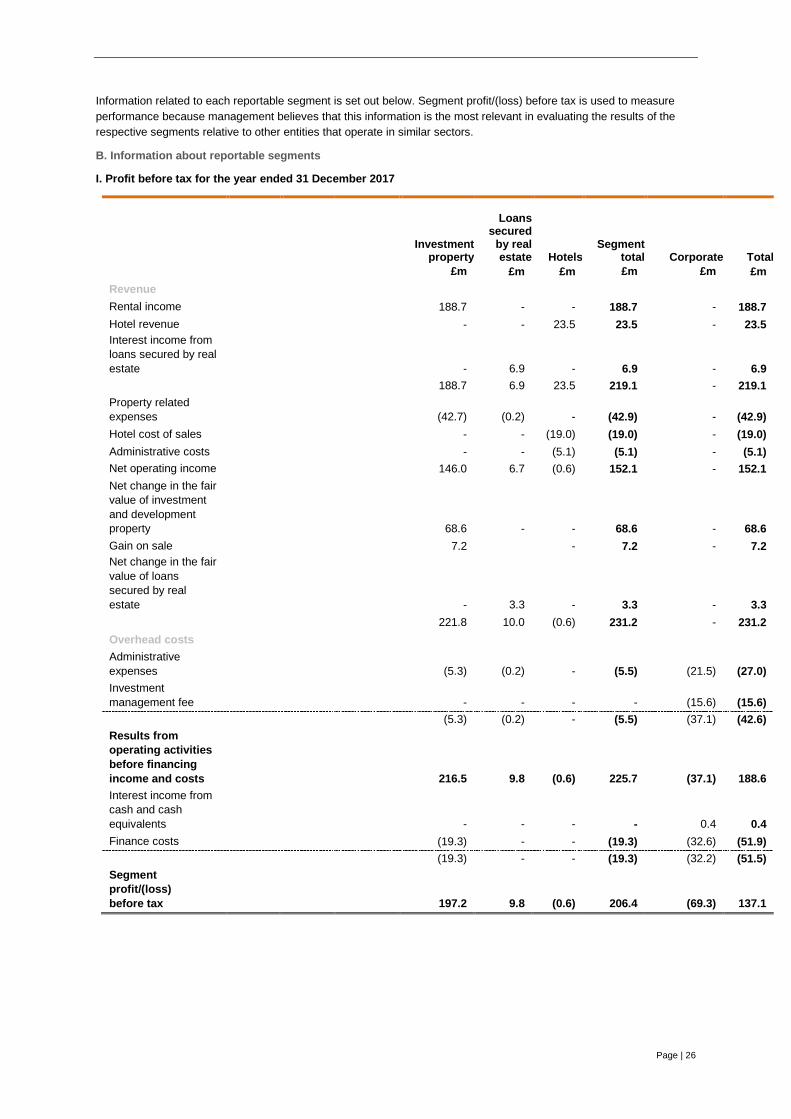
Information related to each reportable segment is set out below. Segment profit/(loss) before tax is used to measure performance because management believes that this information is the most relevant in evaluating the results of the respective segments relative to other entities that operate in similar sectors.
B. Information about reportable segments
I. Profit before tax for the year ended 31 December 2017
Investment
property
Loans
secured by real estate
Hotels
Segment
total
Corporate
Total £m £m £m £m £m £m Revenue Rental income 188.7 - - 188.7 - 188.7 Hotel revenue - - 23.5 23.5 - 23.5 Interest income from loans secured by real estate - 6.9 - 6.9 - 6.9 188.7 6.9 23.5 219.1 - 219.1 Property related expenses (42.7) (0.2) - (42.9) - (42.9) Hotel cost of sales - - (19.0) (19.0) - (19.0) Administrative costs - - (5.1) (5.1) - (5.1) Net operating income 146.0 6.7 (0.6) 152.1 - 152.1 Net change in the fair value of investment and development property 68.6 - - 68.6 - 68.6 Gain on sale 7.2 - 7.2 - 7.2 Net change in the fair value of loans secured by real estate - 3.3 - 3.3 - 3.3 221.8 10.0 (0.6) 231.2 - 231.2 Overhead costs Administrative expenses (5.3) (0.2) - (5.5) (21.5) (27.0) Investment management fee - - - - (15.6) (15.6) (5.3) (0.2) - (5.5) (37.1) (42.6) Results from operating activities before financing income and costs 216.5 9.8 (0.6) 225.7 (37.1) 188.6 Interest income from cash and cash equivalents - - - - 0.4 0.4 Finance costs (19.3) - - (19.3) (32.6) (51.9) (19.3) - - (19.3) (32.2) (51.5) Segment profit/(loss) before tax 197.2 9.8 (0.6) 206.4 (69.3) 137.1

Page | 27
II. Profit before tax for the year ended 31 December 2016
Investment
property
Loans
secured by real estate
Hotels
Segment
total
Corporate
Total Re-presented1 £m £m £m £m £m £m Revenue Rental income 191.5 - - 191.5 - 191.5 Hotel revenue - - 19.4 19.4 - 19.4 Interest income from loans secured by real estate - 6.3 - 6.3 - 6.3 191.5 6.3 19.4 217.2 - 217.2 Property related expenses (35.5) (0.3) - (35.8) - (35.8) Hotel cost of sales - - (16.3) (16.3) - (16.3) Administrative costs - - (4.8) (4.8) - (4.8) Net operating income 156.0 6.0 (1.7) 160.3 - 160.3 Net change in the fair value of investment and development property (10.8) - - (10.8) - (10.8) Gain/(loss) on sale and other gains 8.1 0.4 - 8.5 - 8.5 Net change in the fair value of loans secured by real estate - 0.3 - 0.3 - 0.3 153.3 6.7 (1.7) 158.3 - 158.3 Overhead costs Administrative expenses (4.8) (0.3) - (5.1) (6.5) (11.6) Investment management fee - - - - (16.3) (16.3) (4.8) (0.3) - (5.1) (22.8) (27.9) Results from operating activities before financing income and costs 148.5 6.4 (1.7) 153.2 (22.8) 130.4 Interest income from cash and cash equivalents - - - - 0.6 0.6 Finance costs (26.0) - - (26.0) (31.7) (57.7) (26.0) - - (26.0) (31.1) (57.1) Segment profit/(loss) before tax 122.5 6.4 (1.7) 127.2 (53.9) 73.3
Footnote: 1. Prior periods have been re-presented on a basis consistent with the presentation adopted at 31 December 2017. Such re-
representation was undertaken to condense the number of investment property segments reviewed with the Chief Operating Decision Maker, subsequent to the completion of the merger.

Page | 28
III. Assets/(liabilities) at 31 December 2017
Investment
property
Loans
secured by real estate
Hotels
Segment
total
Corporate
Total £m £m £m £m £m3 £m Assets Current assets 319.9 0.9 4.7 325.5 32.2 357.7 Total segment assets 2,940.9 65.2 84.7 3,090.8 32.1 3,122.9 Liabilities Total segment liabilities (834.8) - (12.5) (847.3) (1,029.6) (1,876.9)
IV. Assets/(liabilities) at 31 December 2016
Investment
property
Loans
secured by real estate
Hotels
Segment
total
Corporate
Total Re-presented2 £m £m £m £m £m3 £m Assets Current assets 193.8 15.9 3.7 213.4 335.3 548.7 Total segment assets 2,871.5 83.5 77.2 3,032.2 335.6 3,367.8 Liabilities Total segment liabilities (806.3) (0.2) (4.0) (810.5) (1,021.4) (1,831.9)
Footnotes: 1. Investment property under development, as identified in Note 12A(ii) is allocated into a segment based on the current expected
future use.
2. Prior periods have been re-presented on a basis consistent with the presentation adopted at 31 December 2017. Such re-representation was undertaken to condense the number of investment property segments reviewed with the Chief Operating Decision Maker, subsequent to the completion of the merger.
3. Within current assets the ‘Corporate’ category comprises primarily cash and cash equivalents and within total segment assets, the ‘Corporate’ categtory comprises primarily cash and cash equivalents and derivative financial assets. Within total segment liabilities the ‘Corporate’ category comprises primarily the unsecured borrowings and derivative financial liabilities. Intercompany transactions have been removed from the calculation of segment assets and liabilities.

Page | 29
C. Geographic information
Consistent with the prior year, the investment property segment includes assets located in the United Kingdom, the Republic of Ireland, Italy and Spain. Italy and Spain are grouped together and reported as “Rest of Europe”.
The geographic information below analyses the Group’s segment revenues, current assets and non-current assets, and total liabilities, by geography. In presenting the following information, segment revenue, current assets and non-current assets, and total liabilities were based on the geographic location of the relevant asset.
I. Revenue
Year ended 31 December
2017
Year ended 31 December
2016 £m £m United Kingdom Rental income 115.5 124.0 Hotel revenue 15.1 13.0 Interest income on loans secured by real estate 4.8 6.0 Gain on sale of investment property and loan collateral 4.5 4.1 Net change in fair value of investment and development property 33.3 (77.5) Net change in fair value of loans secured by real estate 3.2 - 176.4 69.6 Ireland Rental income 49.1 42.7 Hotel revenue 8.4 6.4 Interest income on loans secured by real estate 2.1 0.3 Gain on sale of investment property and loan collateral 2.7 2.0 Net change in fair value of investment and development property 25.1 50.7 Net change in fair value of loans secured by real estate 0.1 0.3 87.5 102.4 Rest of Europe Rental income 24.1 24.8 Hotel revenue - - Interest income on loans secured by real estate - - Gain on sale of investment property and loan collateral - 2.4 Net change in fair value of investment and development property 10.2 16.0 Net change in fair value of loans secured by real estate - - 34.3 43.2 Total Rental income 188.7 191.5 Hotel revenue 23.5 19.4 Interest income from loans secured by real estate 6.9 6.3 Gain on sale of investment property and loan collateral 7.2 8.5 Net change in fair value of investment and development property 68.6 (10.8) Net change in fair value of loans secured by real estate 3.3 0.3 298.2 215.2

Page | 30
II. Current assets
31 December 2017
31 December 2016
£m £m United Kingdom 167.1 142.8 Ireland 85.0 15.2 Rest of Europe 72.8 45.4 324.9 203.4 Corporate1 32.8 345.3 357.7 548.7
III. Non-current assets
31 December 2017
31 December 2016
£m £m United Kingdom 1,493.0 1,563.4 Ireland 928.4 899.8 Rest of Europe 343.8 355.8 2,765.2 2,819.0 Corporate1 - 0.1 2,765.2 2,819.1
IV. Total liabilities
31 December 2017
31 December 2016
£m £m United Kingdom 441.5 502.0 Ireland 295.4 216.3 Rest of Europe 85.6 85.4 822.5 803.7 Corporate1 1,054.4 1,028.2 1,876.9 1,831.9
Footnotes: 1. Within current and non-current assets, the ‘Corporate’ category comprises primarily cash and cash equivalents and derivative
financial assets. Within total liabilities the ‘Corporate’ category comprises primarily the unsecured borrowings and derivative financial liabilities. Intercompany transactions have been removed from the calculation of segment assets and liabilities.

Page | 31
7. Gain on sale of investment and development property and loan collateral
The accounting policy applicable to gain on sale of investment and development property and loan collateral is set out in Note 3J.
Year ended 31 December
2017
Year ended 31 December
2016 £m £m Investment and development property Gross proceeds on disposal 185.9 260.4 Surrender premium receivable on disposal 8.2 - Selling costs (2.4) (4.4) Net proceeds on disposal 191.7 256.0 Carrying value (184.5) (247.9) Gain on disposal 7.2 8.1 Loan collateral Gross proceeds on disposal - 117.1 Selling costs - (1.5) Net proceeds on disposal - 115.6 Carrying value - (115.2) Gain on disposal - 0.4 7.2 8.5
8. Finance income
The accounting policies applicable to finance income are set out in Note 3D(ii) and Note 3F.
Year ended 31 December
2017
Year ended 31 December
2016 £m £m Interest income from loans secured by real estate 6.9 6.3 Interest income from cash and cash equivalents 0.4 0.6 7.3 6.9

Page | 32
9. Finance costs
The accounting policies applicable to finance costs are set out in Note 3G and Note 3P(iii)(b).
Year ended 31 December
2017
Year ended 31 December
2016 £m £m Interest on secured borrowings 16.7 21.4 Interest on unsecured €550.0 million 3.25% note 15.6 13.6 Interest on standalone unsecured £500.0 million 3.95% bond 18.7 13.1 Amortisation of loan arrangement fees 3.7 5.5 Time value movement of foreign exchange zero premium options (1.9) 1.0 Commitment fee and interest charge on revolving credit facility 1.0 1.4 Bond discount amortisation, net of amortisation of bond premia 0.2 0.7 Fair value movement on derivative financial instruments 0.2 0.9 Foreign currency gain (2.5) (0.1) Bank fees and other costs 0.2 0.2 51.9 57.7

Page | 33
10. Taxation
The accounting policy applicable to taxation is set out in Note 3H.
A. Company
The Company is tax resident in Jersey. Jersey has a corporate tax rate of zero under schedule D of the Income Tax (Jersey) Law 1961 as amended, so the Company is not subject to tax in Jersey on its income or gains and is not subject to United Kingdom or other jurisdiction corporation tax on any dividend or interest income it receives. No charge to Jersey taxation will arise on capital gains.
B. Group
The Directors conduct the affairs of the Group such that the management and control of the Group is exercised in Jersey and that, except as noted below, the Group does not carry on a trade in the United Kingdom or any other jurisdiction.
The Group is liable to foreign tax on activities in its overseas subsidiaries. Outside of Jersey, the Group has subsidiaries and funds in Luxembourg, the Republic of Ireland, Isle of Man, Italy, Spain and the United Kingdom and investment and development property located in the United Kingdom, the Republic of Ireland, Italy and Spain.
Luxembourg has a corporate tax rate of 27.08% on worldwide income including capital gains. However, the Group’s future tax liability is expected to be mitigated by the Luxembourg participation exemption and debt financing.
The Group’s investment property located in Italy is held through a closed-end real estate alternative investment fund named Olimpia Investment Fund, wholly-owned by the Company and managed by Savills Investment Management Sgr Spa. Olimpia Investment Fund is exempt from Italian tax on income and gains.
The Group’s investment and development property located in the Republic of Ireland are held through two Irish Qualifying Investor Alternative Investment Funds. During the year these funds were exempt from any direct Irish taxation on income and gains.
The Group’s investment in St Andrew’s Bay Development Limited, a company domiciled in Scotland and which owns the Fairmont St Andrews Hotel, and the Group’s investment in KW Pioneer Point UK OpCo Limited, a company domiciled in the United Kingdom and which owns the operations of Pioneer Point, are subject to United Kingdom corporate tax at a rate of 19%.
The Group is subject to corporate income tax at 25% on taxable profits generated within its Spanish subsidiaries.
The Group is subject to United Kingdom income tax at 20% on rental income arising on the investment properties, after deduction of allowable debt financing and allowable expenses. The treatment of such costs and expenses is estimated in the overall tax liability for the Group and requires judgement and assumptions regarding their deductibility. The directors have considered comparable market evidence and practice in determining the extent to which such items are allowable. Taxation is currently calculated at a weighted average rate applicable to the relevant Group undertakings of 21.0% (year ended 31 December 2016: 21.5%).
C. Amounts recognised in the profit or loss
Year ended 31 December
2017
Year ended 31 December
2016 £m £m Current tax expense Current year 6.2 5.8 6.2 5.8 Deferred taxes Tax effect of losses not previously recognised (1.7) (0.7) Tax effect of previously unrecognised deductible temporary differences 1.1 2.2 (0.6) 1.5 Tax expense on continuing operations 5.6 7.3

Page | 34
D. Reconciliation of effective tax rate
The charge for the year can be reconciled to the consolidated income statement as follows:
Year ended 31 December
2017
Year ended 31 December
2016 £m £m Tax expense reconciliation Profit before tax for the year 137.1 73.3 Income tax charge using weighted average applicable tax rate of 21.0% (2016: 21.5%) 28.8 15.8 Non-taxable income (16.7) (21.4) Non-taxable net fair value (gains)/losses (6.7) 13.7 Current year losses for which no deferred tax is recognised 0.9 0.3 Tax effect of losses not previously recognised (1.7) (0.7) Tax effect of previously unrecognised deductible temporary differences 1.1 2.2 Expenses disallowed 1.4 0.8 Other adjustments (1.4) (1.5) Changes in estimates related to prior years (0.1) (1.9) Tax charge 5.6 7.3 Analysed as arising from: Investment and development property located in the United Kingdom 4.7 3.3 Investment and development property located in Spain 0.4 3.5 Luxembourg corporate taxes 0.5 0.5 5.6 7.3
E. Movement in deferred tax balances
Year ended 31 December
2017
Year ended 31 December
2016 £m £m Deferred tax asset 6.5 2.9 Deferred tax liability (5.5) (2.4) 1.0 0.5 Analysed as arising from: Investment property Opening balance (2.2) - Origination and reversal of temporary differences 0.4 (2.2) Closing balance (1.8) (2.2) Tax losses Opening balance 2.7 1.5 Origination and reversal of temporary differences 0.2 0.7 Effects of translation to presentation currency (0.1) 0.5 Closing balance 2.8 2.7 1.0 0.5
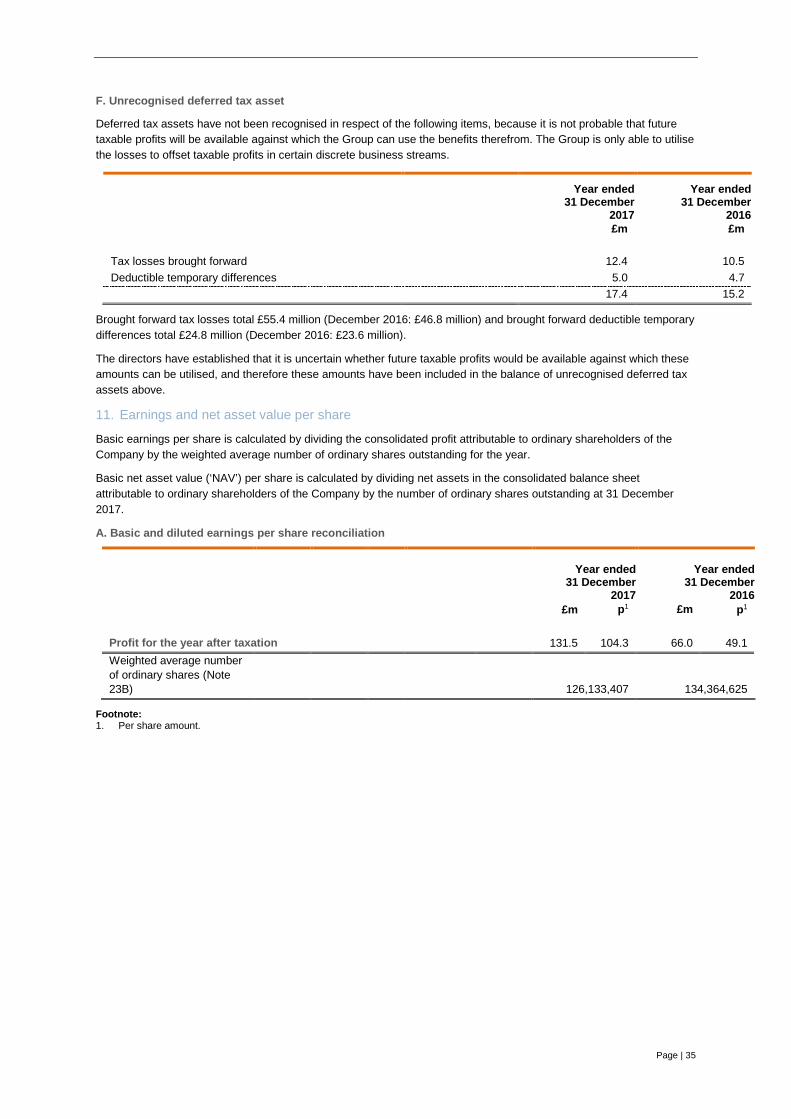
Page | 35
F. Unrecognised deferred tax asset
Deferred tax assets have not been recognised in respect of the following items, because it is not probable that future taxable profits will be available against which the Group can use the benefits therefrom. The Group is only able to utilise the losses to offset taxable profits in certain discrete business streams.
Year ended 31 December
2017
Year ended 31 December
2016 £m £m Tax losses brought forward 12.4 10.5 Deductible temporary differences 5.0 4.7 17.4 15.2
Brought forward tax losses total £55.4 million (December 2016: £46.8 million) and brought forward deductible temporary differences total £24.8 million (December 2016: £23.6 million).
The directors have established that it is uncertain whether future taxable profits would be available against which these amounts can be utilised, and therefore these amounts have been included in the balance of unrecognised deferred tax assets above.
11. Earnings and net asset value per share
Basic earnings per share is calculated by dividing the consolidated profit attributable to ordinary shareholders of the Company by the weighted average number of ordinary shares outstanding for the year.
Basic net asset value (‘NAV’) per share is calculated by dividing net assets in the consolidated balance sheet attributable to ordinary shareholders of the Company by the number of ordinary shares outstanding at 31 December 2017.
A. Basic and diluted earnings per share reconciliation
Year ended
31 December 2017
Year ended
31 December 2016
£m p1 £m p1 Profit for the year after taxation 131.5 104.3 66.0 49.1 Weighted average number of ordinary shares (Note 23B) 126,133,407 134,364,625
Footnote: 1. Per share amount.

Page | 36
12. Investment and development property
The accounting policies applicable to investment and development property are set out in Note 3J and the fair value disclosures contained in Note 5A, and the accounting policies applicable to assets held-for-sale are set out in Note 3N.
31 December 2017
31 December 2016
£m £m Investment property Opening balance 2,594.9 2,367.0 Acquisition of investment property 58.4 169.1 Disposal of investment property (134.2) (187.7) Improvements to investment property 43.6 47.0 Transfer from/(to) investment property under development 7.3 148.5 Transfer to assets held-for-sale (Note 32) (159.7) (48.3) Transfer from assets held-for-sale (Note 32) 11.3 - Net change in fair value 67.9 (35.0) Effects of translation to presentation currency 44.0 134.3 Closing balance 2,533.5 2,594.9
31 December
2017
31 December
2016 £m £m Investment property under development Opening balance 80.4 133.2 Acquisition of investment property under development 1.8 20.1 Disposal of investment property under development - (9.0) Development expenditure 3.3 47.6 Transfer from/(to) investment property (7.3) (148.5) Transfer to assets held-for-sale (Note 32) - (11.1) Net change in fair value (0.6) 24.2 Effects of translation to presentation currency 4.0 23.9 Closing balance 81.6 80.4 Disclosed as: Carrying value of investment and development property 2,615.1 2,675.3 Assets held-for-sale (Note 32) 159.7 59.4 Adjustment in respect of straight line rent (Note 16)1 15.4 6.9 Fair value of investment and development property 2,790.2 2,741.6
Footnote: 1. Included as a component of the “Rent and other receivables” balance in the consolidated balance sheet.
The cost of investment properties acquired during the year, inclusive of acquisition costs, is £58.4 million (year ended 31 December 2016: £169.1 million). The total expenditure incurred to acquire investment properties under development during the year is £1.8 million (year ended 31 December 2016: £20.1 million).
Acquisition costs which comprise primarily stamp duty, legal services and other directly attributable costs arising from the transactions, amounted to £1.5 million (year ended 31 December 2016: £4.8 million).
The net fair value gain of £68.6 million (December 2016: net fair value loss £10.8 million) comprises £67.3 million recognised in respect of investment and development property and £1.3 million recognised in respect of assets held-for-sale (Note 32) has been recognised in the consolidated income statement.
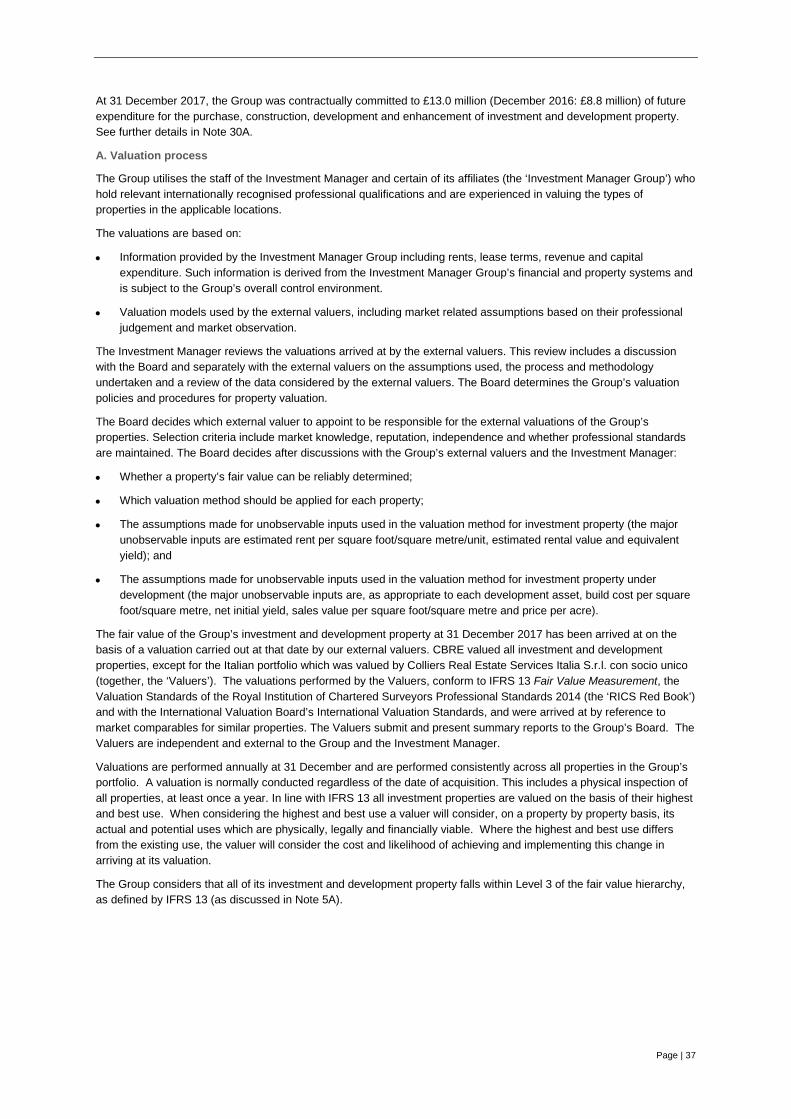
Page | 37
At 31 December 2017, the Group was contractually committed to £13.0 million (December 2016: £8.8 million) of future expenditure for the purchase, construction, development and enhancement of investment and development property. See further details in Note 30A.
A. Valuation process
The Group utilises the staff of the Investment Manager and certain of its affiliates (the ‘Investment Manager Group’) who hold relevant internationally recognised professional qualifications and are experienced in valuing the types of properties in the applicable locations.
The valuations are based on:
• Information provided by the Investment Manager Group including rents, lease terms, revenue and capital expenditure. Such information is derived from the Investment Manager Group’s financial and property systems and is subject to the Group’s overall control environment.
• Valuation models used by the external valuers, including market related assumptions based on their professional judgement and market observation.
The Investment Manager reviews the valuations arrived at by the external valuers. This review includes a discussion with the Board and separately with the external valuers on the assumptions used, the process and methodology undertaken and a review of the data considered by the external valuers. The Board determines the Group’s valuation policies and procedures for property valuation.
The Board decides which external valuer to appoint to be responsible for the external valuations of the Group’s properties. Selection criteria include market knowledge, reputation, independence and whether professional standards are maintained. The Board decides after discussions with the Group’s external valuers and the Investment Manager:
• Whether a property’s fair value can be reliably determined;
• Which valuation method should be applied for each property;
• The assumptions made for unobservable inputs used in the valuation method for investment property (the major unobservable inputs are estimated rent per square foot/square metre/unit, estimated rental value and equivalent yield); and
• The assumptions made for unobservable inputs used in the valuation method for investment property under development (the major unobservable inputs are, as appropriate to each development asset, build cost per square foot/square metre, net initial yield, sales value per square foot/square metre and price per acre).
The fair value of the Group’s investment and development property at 31 December 2017 has been arrived at on the basis of a valuation carried out at that date by our external valuers. CBRE valued all investment and development properties, except for the Italian portfolio which was valued by Colliers Real Estate Services Italia S.r.l. con socio unico (together, the ‘Valuers’). The valuations performed by the Valuers, conform to IFRS 13 Fair Value Measurement, the Valuation Standards of the Royal Institution of Chartered Surveyors Professional Standards 2014 (the ‘RICS Red Book’) and with the International Valuation Board’s International Valuation Standards, and were arrived at by reference to market comparables for similar properties. The Valuers submit and present summary reports to the Group’s Board. The Valuers are independent and external to the Group and the Investment Manager.
Valuations are performed annually at 31 December and are performed consistently across all properties in the Group’s portfolio. A valuation is normally conducted regardless of the date of acquisition. This includes a physical inspection of all properties, at least once a year. In line with IFRS 13 all investment properties are valued on the basis of their highest and best use. When considering the highest and best use a valuer will consider, on a property by property basis, its actual and potential uses which are physically, legally and financially viable. Where the highest and best use differs from the existing use, the valuer will consider the cost and likelihood of achieving and implementing this change in arriving at its valuation.
The Group considers that all of its investment and development property falls within Level 3 of the fair value hierarchy, as defined by IFRS 13 (as discussed in Note 5A).

Page | 38
The valuations have been prepared on the basis of Market Value which is defined in the RICS Valuation Standards as:
“The estimated amount for which a property should exchange on the date of valuation between a willing buyer and a willing seller in an arm’s length transaction after proper marketing wherein the parties had acted knowledgeably, prudently and without compulsion.”
Market Value as defined in the RICS Valuation Standards is the equivalent of fair value under IFRS.
(i). Investment property
To determine the value of investment property, the income approach is used. This involves applying market derived capitalisation yields to current and market derived future income streams with appropriate adjustments for income voids arising from vacancies, or rent-free periods. These capitalisation yields and future income streams are derived from comparable property and leasing transactions and are considered to be key inputs in the valuation. Other factors that are taken into account include the tenure of the property, tenancy details, planning, building and environmental factors that might affect the property. The comparison methodology is used for residential properties whereby the fair value is calculated using data from recent market transactions.
The following tables set out the valuation techniques and the key unobservable inputs used in the valuation of the Group’s investment property.
I. 31 December 2017
Asset class
Fair value at 31 December
2017 £m1,2
Range
Valuation technique Input Low High
Weighted average
United Kingdom - Commercial 1,402.7
Yield capitalisation
Annual rent per sq ft3 (£) 1.25 220.00 11.96
ERV4 per sq ft (£) 1.50 220.00 13.69 Equivalent yield % 3.2 11.7 6.3 United Kingdom - Residential 98.7
Yield capitalisation Annual rent per unit (£) 14,400.00 26,600.00 17,700.00
Equivalent yield % 3.9 3.9 3.9
Ireland – Commercial 666.7 Yield capitalisation Annual rent per sq ft (€) 6.25 255.81 31.81
ERV per sq ft (€) 6.25 255.83 37.71 Equivalent yield % 4.3 7.8 5.1
Ireland - Residential 206.4 Yield capitalisation Annual rent per unit (€) 17,717.00 24,279.00 22,390.00
Equivalent yield % 4.5 5.1 4.7
Rest of Europe 335.6 Yield capitalisation Annual rent per sq m5 (€) 34.68 1,256.33 139.77
ERV per sqm (€) 86.40 1,000.00 176.18 Equivalent yield % 5.6 9.0 7.6 Total 2,710.1
Footnotes: 1. Includes adjustment in respect of straight line leases, which is recognised in the “Rent and other receivables” component of the
consolidated balance sheet (Note 16). 2. Includes assets held-for-sale (Note 32). 3. Square feet. 4. Estimated rental value. 5. Square metres. 6. Discounted cash flow.
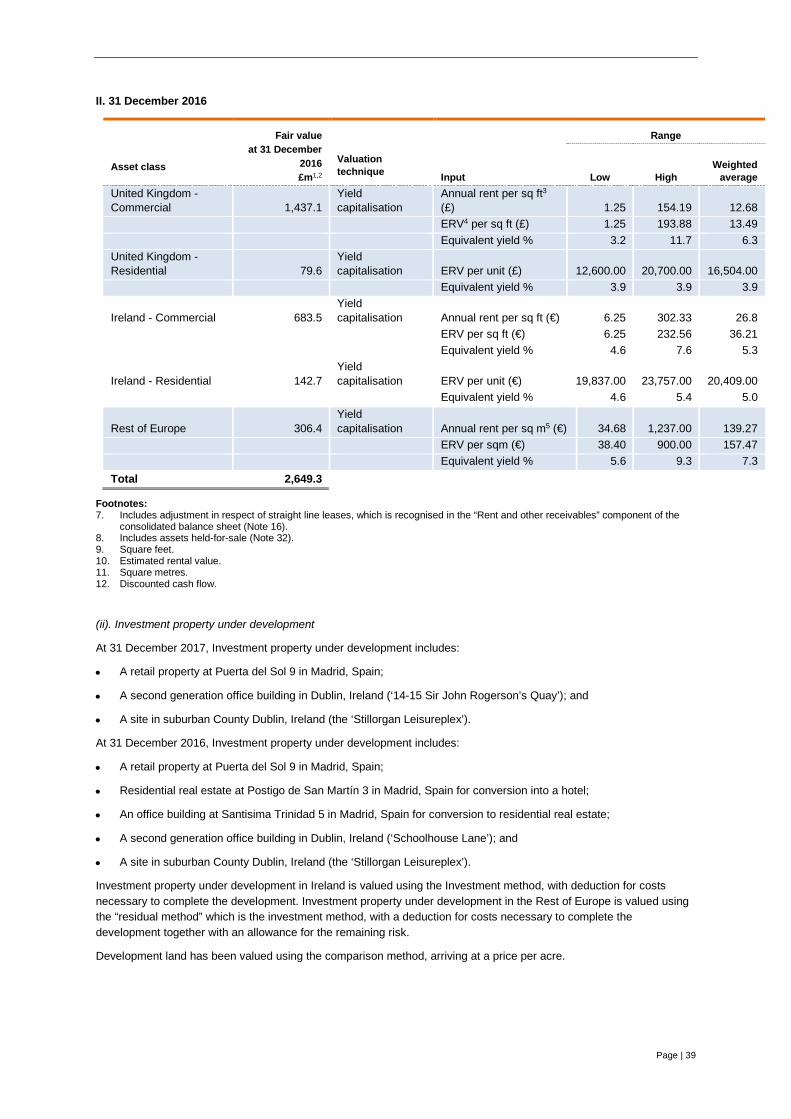
Page | 39
II. 31 December 2016
Asset class
Fair value at 31 December
2016 £m1,2
Range
Valuation technique Input Low High
Weighted average
United Kingdom - Commercial 1,437.1
Yield capitalisation
Annual rent per sq ft3 (£) 1.25 154.19 12.68
ERV4 per sq ft (£) 1.25 193.88 13.49 Equivalent yield % 3.2 11.7 6.3 United Kingdom - Residential 79.6
Yield capitalisation ERV per unit (£) 12,600.00 20,700.00 16,504.00
Equivalent yield % 3.9 3.9 3.9
Ireland - Commercial 683.5 Yield capitalisation Annual rent per sq ft (€) 6.25 302.33 26.8
ERV per sq ft (€) 6.25 232.56 36.21 Equivalent yield % 4.6 7.6 5.3
Ireland - Residential 142.7 Yield capitalisation ERV per unit (€) 19,837.00 23,757.00 20,409.00
Equivalent yield % 4.6 5.4 5.0
Rest of Europe 306.4 Yield capitalisation Annual rent per sq m5 (€) 34.68 1,237.00 139.27
ERV per sqm (€) 38.40 900.00 157.47 Equivalent yield % 5.6 9.3 7.3 Total 2,649.3
Footnotes: 7. Includes adjustment in respect of straight line leases, which is recognised in the “Rent and other receivables” component of the
consolidated balance sheet (Note 16). 8. Includes assets held-for-sale (Note 32). 9. Square feet. 10. Estimated rental value. 11. Square metres. 12. Discounted cash flow.
(ii). Investment property under development
At 31 December 2017, Investment property under development includes:
• A retail property at Puerta del Sol 9 in Madrid, Spain;
• A second generation office building in Dublin, Ireland (‘14-15 Sir John Rogerson’s Quay’); and
• A site in suburban County Dublin, Ireland (the ‘Stillorgan Leisureplex’).
At 31 December 2016, Investment property under development includes:
• A retail property at Puerta del Sol 9 in Madrid, Spain;
• Residential real estate at Postigo de San Martín 3 in Madrid, Spain for conversion into a hotel;
• An office building at Santisima Trinidad 5 in Madrid, Spain for conversion to residential real estate;
• A second generation office building in Dublin, Ireland (‘Schoolhouse Lane’); and
• A site in suburban County Dublin, Ireland (the ‘Stillorgan Leisureplex’).
Investment property under development in Ireland is valued using the Investment method, with deduction for costs necessary to complete the development. Investment property under development in the Rest of Europe is valued using the “residual method” which is the investment method, with a deduction for costs necessary to complete the development together with an allowance for the remaining risk.
Development land has been valued using the comparison method, arriving at a price per acre.

Page | 40
I. 31 December 2017
Asset class
Fair value at 31 December
2017 £m1
Range
Valuation technique Input Low High
Weighted average
Ireland Investment property under development 5.0 Investment Build cost per sq ft2 (€) 128.61 128.61 128.61 ERV per sq ft (€) 30.00 50.00 44.97 Equivalent yield % 5.3 5.3 5.3 Development land 14.7 Comparison Price per acre (€’000) 1,111 7,195 5,244 Rest of Europe Investment property under development 60.4 Residual Build cost per sq m (€) 1,015.00 1,015.00 1,015.00
Sales value per sq m3 (€) 875.00 875.00 875.00
Net initial yield % 3.8 3.8 3.8 Total 80.7
II. 31 December 2016
Asset class
Fair value at 31 December
2016 £m1
Range
Valuation technique Input Low High
Weighted average
Ireland Investment property under development 9.0 Residual Build cost per sq ft2 (€) 187.0 187.0 187.0 ERV per sq ft (€) 52.0 52.0 52.0 Equivalent yield % 5.5 5.5 5.5 Development land 14.2 Comparison Price per acre (€’000) 1,111 7,195 5,244 Rest of Europe Investment property under development 69.1 Residual Build cost per sq m3 (€) 880.00 1,015.00 945.00
Sales value per sq m (€) 3,900.00 5,300.00 4,887.00
ERV per sq m (€) 875.00 875.00 875.00 Net initial yield % 3.8 3.8 3.8 Total 92.3
Footnotes: 1. Includes assets held-for-sale (Note 32). 2. Square feet. 3. Square metres.

Page | 41
B. Sensitivity of measurement to variance of significant unobservable inputs
There are inter-relationships between all these unobservable inputs as they are determined by market conditions. The existence of an increase in more than one unobservable input would be to magnify the impact on the valuation. The impact on the valuation will be mitigated by the inter-relationship of two unobservable inputs moving in directions which have an opposite impact on value for example an increase in rent may be offset by an increase in yield, resulting in no net impact on the valuation. However if the inputs move in opposite directions (for example ERV increases and equivalent yield decreases), valuation movements can be amplified whereas if they move in the same direction, they may offset reducing the overall net valuation movement.
(i). Investment property
Rents and ERVs have a direct relationship to fair value, while equivalent yield has an inverse relationship.
The following table shows the impact on the fair value of investment property by applying a sensitivity to significant unobservable inputs.
I. 31 December 2017
Fair value at
31 December
20171,2
Impact on valuations
of a 5% change in ERV
Impact on valuations of
a 25 bps change in equivalent yield
Increase Decrease Increase Decrease £m £m £m £m £m United Kingdom 1,501.4 62.6 (60.6) (65.5) 71.5 Ireland 873.1 38.0 (28.9) (42.6) 47.2 Rest of Europe 335.6 11.1 (11.2) (10.3) 11.2 2,710.1 111.7 (100.7) (118.4) 129.9
II. 31 December 2016
Fair value at
31 December
20161,2
Impact on valuations
of a 5% change in ERV
Impact on valuations of
a 25 bps change in equivalent yield
Increase Decrease Increase Decrease £m £m £m £m £m United Kingdom 1,516.7 55.5 (54.5) (66.1) 72.2 Ireland 826.2 35.5 (34.1) (36.8) 40.5 Rest of Europe 306.4 12.2 (12.2) (11.3) 12.2 2,649.3 103.2 (100.8) (114.2) 124.9
Footnotes: 1. Includes adjustment in respect of straight line leases, which is recognised in the “Rent and other receivables” component of the
consolidated balance sheet. 2. Includes assets held-for-sale (Note 32).
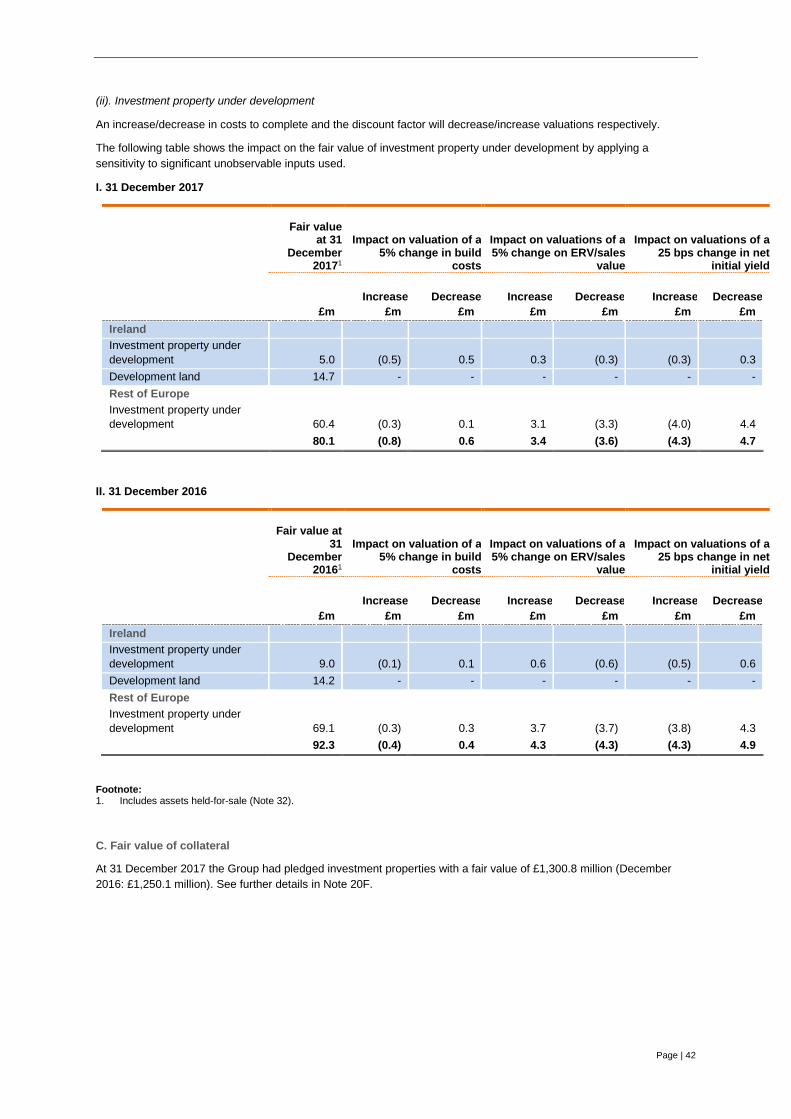
Page | 42
(ii). Investment property under development
An increase/decrease in costs to complete and the discount factor will decrease/increase valuations respectively.
The following table shows the impact on the fair value of investment property under development by applying a sensitivity to significant unobservable inputs used.
I. 31 December 2017
Fair value
at 31 December
20171
Impact on valuation of a 5% change in build
costs
Impact on valuations of a 5% change on ERV/sales
value
Impact on valuations of a 25 bps change in net
initial yield Increase Decrease Increase Decrease Increase Decrease £m £m £m £m £m £m £m Ireland Investment property under development 5.0 (0.5) 0.5 0.3 (0.3) (0.3) 0.3 Development land 14.7 - - - - - - Rest of Europe Investment property under development 60.4 (0.3) 0.1 3.1 (3.3) (4.0) 4.4 80.1 (0.8) 0.6 3.4 (3.6) (4.3) 4.7
II. 31 December 2016
Fair value at
31 December
20161
Impact on valuation of a 5% change in build
costs
Impact on valuations of a 5% change on ERV/sales
value
Impact on valuations of a 25 bps change in net
initial yield Increase Decrease Increase Decrease Increase Decrease £m £m £m £m £m £m £m Ireland Investment property under development 9.0 (0.1) 0.1 0.6 (0.6) (0.5) 0.6 Development land 14.2 - - - - - - Rest of Europe Investment property under development 69.1 (0.3) 0.3 3.7 (3.7) (3.8) 4.3 92.3 (0.4) 0.4 4.3 (4.3) (4.3) 4.9
Footnote: 1. Includes assets held-for-sale (Note 32).
C. Fair value of collateral
At 31 December 2017 the Group had pledged investment properties with a fair value of £1,300.8 million (December 2016: £1,250.1 million). See further details in Note 20F.

Page | 43
13. Loans secured by real estate
The accounting policy applicable to loans secured by real estate is set out in Note 3P(i)(c) and the fair value disclosures contained in Note 5B.
31 December 2017
31 December 2016
£m £m Opening balance 67.6 179.2 Additional lending 0.4 - Disposal of collateral - (115.2) Repayments (7.8) - Net fair value movement 3.3 0.3 Effects of translation to presentation currency 0.8 3.3 Closing balance 64.3 67.6
Loans secured by real estate are non-performing and were acquired at a discount to their nominal value reflecting their distressed state at the time of acquisition. At 31 December 2017, substantially all of the loans are past due. None of the loans are expected to be repaid by recourse to the original borrower, although income from certain underlying collateral properties is being generated. The majority of the loans were the subject of a receivership process when acquired and thus all cash flow from the property is transferred to the Group. As a result of these factors, no disclosures are made in relation to maturity, age or interest rate risk.
The Board is responsible for determining the fair value of the loans secured by real estate annually at 31 December.
The procedures included:
• Performing an analysis of general market data including economic, governmental, environmental, credit market and local property market trends as they may affect the loans secured by real estate and the collateral properties;
• Holding discussions with the Group’s Investment Manager and the Board to understand expectations and intent regarding each loan secured by real estate, and to understand investment strategy and performance;
• Reviewing third party appraisal reports of the underlying collateral properties;
• Considering observable market inputs for assets similar to each of the loans secured by real estate and to the collateral properties to support the valuation metrics, capitalisation rates and/or discount rates;
• Selecting appropriate valuation approaches based on the profile of each of the loans secured by real estate;
• Placing reliance on the cash flow models prepared by the Investment Manager on behalf of the Group which are based on the contractual terms of each of the loans secured by real estate and the Group’s expectations of proceeds from those collateral properties, together with reviewing the Group’s cash flow models for mathematical accuracy;
• Assessing the implied discount rate used to discount to present value of the cash flows to arrive at a fair value conclusion through benchmarking against similar securities and market indices;
• Performing a check of the cash flow models prepared by the Investment Manager on behalf of the Group, and confirming such models were consistent with the models used by the Investment Manager on behalf of the Group for investment purposes; and
• Analysing other facts and data considered to be pertinent to the loans secured by real estate and the collateral properties.

Page | 44
A. Valuation process
In estimating the fair value of the loans secured by real estate, the income approach was used. This is a valuation technique that provides an estimation of the fair value of an asset or business based on expectations about the cash flows that an asset or business would generate over time. The income approach begins with an estimate of the annual cash flows expected to be generated over a discrete projection period. The estimated cash flows for each of the years in the discrete projection period are then converted to their present value equivalent using a rate of return appropriate for the risk of achieving the projected cash flows. The present value of the estimated cash flows is then added to the present value equivalent of the residual value of the asset (if any) or the business at the end of the discrete projection period to arrive at an estimate of the fair value.
In assessing the fair value of the loans secured by real estate the Board have referenced valuations performed by CBRE on the underlying collateral prepared in conformity with the RICS Red Book and with the International Valuation Board’s International Valuation Standards, as described in Note 12. At 31 December 2017, the value of the underlying collateral was £72.0 million (December 2016: £69.9 million).
The Group consider that all of its loans secured by real assets fall within Level 3, of the fair value hierarchy, as defined by IFRS 13 (as discussed in Note 5B).
During the year, interest income totalling £6.9 million (year ended 31 December 2016: £6.3 million) was recognised in the consolidated income statement.
B. Sensitivity of measurement to variance of significant unobservable inputs
Yield has an inverse relationship to valuation. There are inter-relationships between the unobservable inputs as they are determined by market conditions. The existence of an increase in more than one unobservable input would be to magnify the impact on the valuation. The impact on the valuation will be mitigated by the inter-relationship of two unobservable inputs moving in directions which have an opposite impact on value. For example, cap rates, expected lease renewal dates, and/or expected disposal values, may be offset by an increase in yield, resulting in no net impact on the valuation.
The impact of sensitivity analysis on the loan portfolio has been determined by the Board to be immaterial.

Page | 45
14. Property, plant and equipment
The accounting policy applicable to property, plant and equipment is set out in Note 3K and the fair value disclosures set out in Note 5C.
A. Reconciliation of carrying amount
Land and
buildings Plant and
equipment Fixtures
and fittings
Other Total
£m £m £m £m £m Cost Balance at 1 January 2016 54.6 1.6 3.8 0.3 60.3 Additions 9.6 0.2 0.4 - 10.2 Disposals 0.3 - - (0.3) - Revaluation of land and buildings 0.3 - - - 0.3 Effects of translation to presentation currency 3.5 0.3 - - 3.8 Balance at 31 December 2016 68.3 2.1 4.2 - 74.6 Additions 2.9 0.7 1.1 - 4.7 Reclassification between categories (1.6) - 1.6 - - Revaluation of land and buildings 4.5 - - - 4.5 Effects of translation to presentation currency 1.1 - - - 1.1 Balance at 31 December 2017 75.2 2.8 6.9 - 84.9 Accumulated depreciation Balance at 1 January 2016 - (0.3) (0.8) - (1.1) Write-offs (1.6) (0.5) (1.1) - (3.2) Charge for the year - - 1.3 - 1.3 Revaluation of land and buildings 1.6 - - - 1.6 Effects of translation to presentation currency - (0.1) (0.1) - (0.2) Balance at 31 December 2016 - (0.9) (0.7) - (1.6) Charge for the year (2.4) (0.3) (1.5) - (4.2) Reclassification between categories 2.2 (0.5) (1.7) - - Revaluation of land and buildings 0.2 - - - 0.2 Balance at 31 December 2017 - (1.7) (3.9) - (5.6) Carrying amounts At 31 December 2016 68.3 1.2 3.5 - 73.0 At 31 December 2017 75.2 1.1 3.0 - 79.3
There are no restrictions on title and no property, plant and equipment has been pledged as security.
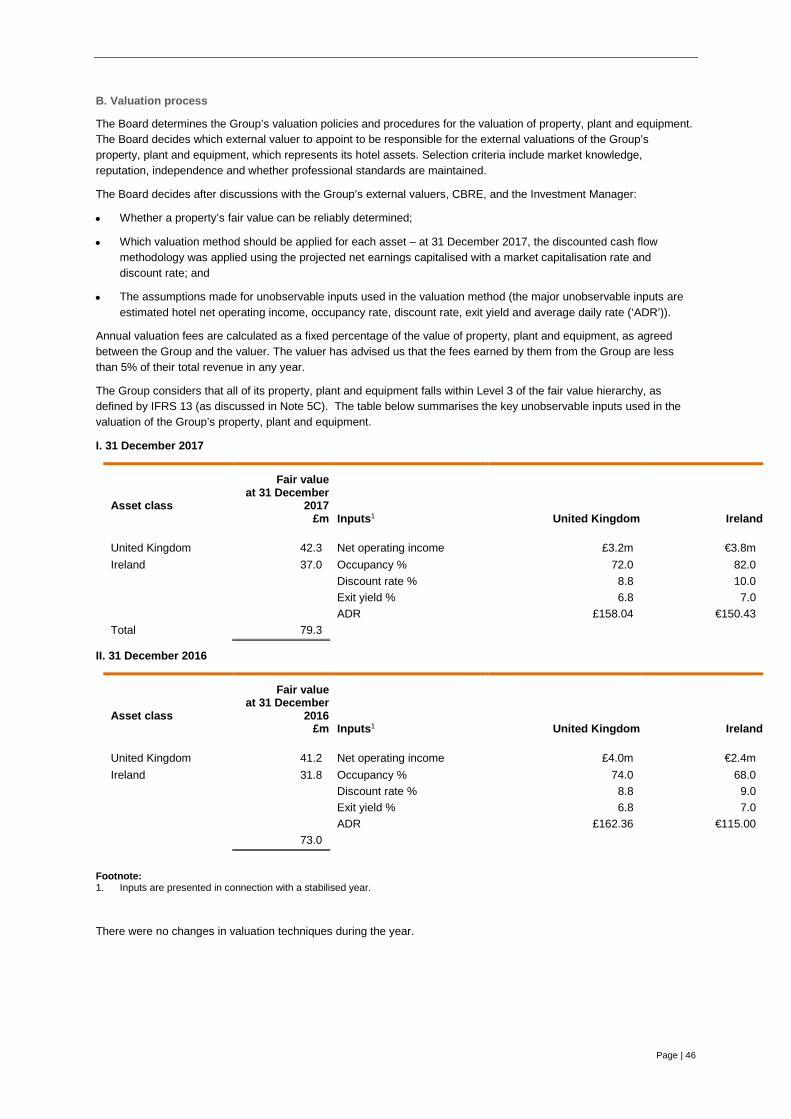
Page | 46
B. Valuation process
The Board determines the Group’s valuation policies and procedures for the valuation of property, plant and equipment. The Board decides which external valuer to appoint to be responsible for the external valuations of the Group’s property, plant and equipment, which represents its hotel assets. Selection criteria include market knowledge, reputation, independence and whether professional standards are maintained.
The Board decides after discussions with the Group’s external valuers, CBRE, and the Investment Manager:
• Whether a property’s fair value can be reliably determined;
• Which valuation method should be applied for each asset – at 31 December 2017, the discounted cash flow methodology was applied using the projected net earnings capitalised with a market capitalisation rate and discount rate; and
• The assumptions made for unobservable inputs used in the valuation method (the major unobservable inputs are estimated hotel net operating income, occupancy rate, discount rate, exit yield and average daily rate (‘ADR’)).
Annual valuation fees are calculated as a fixed percentage of the value of property, plant and equipment, as agreed between the Group and the valuer. The valuer has advised us that the fees earned by them from the Group are less than 5% of their total revenue in any year.
The Group considers that all of its property, plant and equipment falls within Level 3 of the fair value hierarchy, as defined by IFRS 13 (as discussed in Note 5C). The table below summarises the key unobservable inputs used in the valuation of the Group’s property, plant and equipment.
I. 31 December 2017
Asset class
Fair value at 31 December
2017 £m Inputs1 United Kingdom Ireland
United Kingdom 42.3 Net operating income £3.2m €3.8m Ireland 37.0 Occupancy % 72.0 82.0 Discount rate % 8.8 10.0 Exit yield % 6.8 7.0 ADR £158.04 €150.43 Total 79.3
II. 31 December 2016
Asset class
Fair value at 31 December
2016 £m Inputs1 United Kingdom Ireland
United Kingdom 41.2 Net operating income £4.0m €2.4m Ireland 31.8 Occupancy % 74.0 68.0 Discount rate % 8.8 9.0 Exit yield % 6.8 7.0 ADR £162.36 €115.00 73.0
Footnote: 1. Inputs are presented in connection with a stabilised year.
There were no changes in valuation techniques during the year.

Page | 47
C. Sensitivity of measurement to variance of significant unobservable inputs
There are inter-relationships between all these unobservable inputs as they are determined by market conditions. The existence of an increase in more than one unobservable input would be to magnify the impact on the valuation. The impact on the valuation will be mitigated by the inter-relationship of two unobservable inputs moving in directions which have an opposite impact on value. For example, an increase in hotel net operating income may be offset by an increase in exit yield, resulting in no net impact on the valuation. However, if the inputs move in opposite directions (for example ADR increases and exit yield decreases), valuation movements can be amplified whereas if they move in the same direction, they may offset reducing the overall net valuation movement.
I. 31 December 2017
Fair value
at 31 December
2017
Impact on valuations of a 10% change in estimated Hotel NOI
Impact on valuations of 10% change in
occupancy
Impact on valuations of 100 bps change in
discount rate
Impact on valuations of a 50 bps change in
exit yield Impact of a 5% change in ADR
Increase Decrease Increase Decrease Increase Decrease Increase Decrease Increase Decrease £m £m £m £m £m £m £m £m £m £m £m United Kingdom 42.3 4.2 (4.2) 11.7 (11.7) (5.5) 7.5 (2.9) 3.4 10.3 (10.3) Ireland 37.0 3.8 (3.8) 6.0 (6.0) (2.7) 3.1 (5.1) 6.7 2.6 (2.7) 79.3 8.0 (8.0) 17.7 (17.7) (8.2) 10.6 (8.0) 10.1 12.9 (13.0)
II. 31 December 2016
Fair value
at 31 December
2016
Impact on valuations of a 10% change in estimated Hotel NOI
Impact on valuations of 10% change in
occupancy
Impact on valuations of 100 bps change in
discount rate
Impact on valuations of a 50 bps change in
exit yield Impact of a 5% change in ADR
Increase Decrease Increase Decrease Increase Decrease Increase Decrease Increase Decrease £m £m £m £m £m £m £m £m £m £m £m United Kingdom 41.2 4.1 (4.1) 11.5 (11.5) (5.6) 7.6 (3.0) 3.5 9.9 (9.8) Ireland 31.8 3.3 (3.3) 6.2 (6.2) (4.2) 5.6 (2.2) 2.6 1.4 (1.4) 73.0 7.4 (7.4) 17.7 (17.7) (9.8) 13.2 (5.2) 6.1 11.3 (11.2)

Page | 48
15. Inventories
The accounting policy applicable to inventories is set out in Note 3M.
31 December 2017
31 December 2016
£m £m Current Consumable stores 0.4 0.3 0.4 0.3
Inventories of £2.3 million (December 2016: £2.4 million) were expensed during the year.
The carrying value of inventories approximates their fair value.
16. Rent and other receivables
The accounting policy applicable to rent and other receivables is set out in Note 3P(i)(b).
31 December 2017
31 December 2016
£m £m Current Rent and trade receivables 16.4 13.8 Prepayments and other receivables 17.8 9.7 Straight line rent 15.4 6.9 VAT receivable 2.9 2.1 Deposits paid 0.5 - 53.0 32.5
The Group’s exposure to credit risks and impairment losses related to rent and other receivables is disclosed in Note 22C(iii).
A. Deposits paid
At 31 December 2017 deposits totalling £0.5 million (31 December 2016: £Nil) were paid on executing purchase agreements.
B. Rent and trade receivables
The Group does not typically extend credit terms to its investment property tenants, instead requiring them to pay in advance. Consequently the Group is not exposed to a significant credit risk. Rent for investment property falls due on contractual quarter days. Rent and service charge receivables are non-interest bearing and are typically due within 30 days.
Rent on tenanted residential property falls due monthly and is also payable in advance.
The Group’s exposure to credit risk in its hotel operations is influenced mainly by the individual characteristics of each customer. There is no concentration of credit risk or dependence on individual customers. Management of the hotels has a credit policy in place and the exposure to credit risk is monitored on an ongoing basis.
At 31 December 2017 the maximum exposure to credit risk for rent and trade receivables was £18.2 million (December 2016: £14.5 million).

Page | 49
(i). Aged rent and trade receivables
I. 31 December 2017
Gross
Allowance for impaired
balances Net £m £m £m Current 13.3 (0.1) 13.2 Due 31 – 60 days 2.6 (0.4) 2.2 Due 61 – 90 days (0.4) - (0.4) Due 91 – 120 days 1.0 (0.2) 0.8 Due 121 days and more 1.7 (1.1) 0.6 18.2 (1.8) 16.4
II. 31 December 2016
Gross
Allowance for impaired
balances Net £m £m £m Current 11.5 - 11.5 Due 31 – 60 days 0.4 - 0.4 Due 61 – 90 days 0.1 - 0.1 Due 91 – 120 days 1.2 (0.2) 1.0 Due 121 days and more 1.3 (0.5) 0.8 14.5 (0.7) 13.8
Allowances for impaired balances are calculated on the basis of management’s knowledge of the tenants, business and the market.
(ii). Allowance for impaired balances
The table below provides a reconciliation of changes in allowances for impaired balances:
31 December
2017 31 December
2016 £m £m Opening balance 0.7 0.2 Additions 1.1 0.7 Written off as a bad debt (0.1) (0.1) Released (0.1) (0.1) Closing balance 1.8 0.7
The Board believes that the unimpaired amounts that are past due by more than 30 days are still collectible in full, based on historical payment behaviour.

Page | 50
17. Cash and cash equivalents
The accounting policy applicable to cash and cash equivalents is set out in Note 3P(i)(a).
31 December 2017
31 December 2016
£m £m Current Cash at bank and on hand 141.7 210.0 Short-term deposits 2.6 246.5 Cash and cash equivalents in the consolidated balance sheet 144.3 456.5 Cash and cash equivalents in the consolidated cash flow statement 144.3 456.5
The fair value of cash and cash equivalents at 31 December 2017 and 31 December 2016 approximates to its carrying value. There is no significant concentration of credit risk with respect to cash and cash equivalents, as the Group holds cash accounts with a number of major financial institutions where credit risk is not considered significant. The credit ratings of the financial institutions where the Group holds its balances are all investment grade according to Moodys’ ratings.
Cash at bank earns interest at floating rates based on daily bank deposit rates. Short-term deposits are made for varying periods of between one day and three months, depending on the immediate cash requirement of the Group and earn interest at the respective short-term deposit rates. The effective interest rate on short-term deposits was 0.324% at 31 December 2017 (December 2016: 0.197%). All deposits are immediately available.
18. Trade and other payables
The accounting policy applicable to trade and other payables is set out in Note 3P(ii).
31 December 2017
31 December 2016
£m £m Trade creditors and accruals 53.5 38.1 Corporate and income taxes 3.9 9.2 VAT payable 9.3 7.1 Security deposits 6.8 5.6 Other liabilities 0.5 1.3 74.0 61.3 Current 69.7 58.2 Non-current 4.3 3.1 74.0 61.3
Trade creditors and accruals primarily comprise amounts outstanding for trade purchases and ongoing costs. All amounts are interest-free.
Information about the Group’s exposure to currency risk is included in Note 22C(ii)(b) and liquidity risk is included in Note 22C(iv).

Page | 51
19. Deferred income
The accounting policy applicable to deferred income is set out in Note 3P(ii).
31 December 2017
31 December 2016
£m £m Current Deferred rental income 29.4 31.8 Prepaid rent 1.9 4.9 31.3 36.7
20. Borrowings
The accounting policies applicable to borrowings are set out in Notes 3C(i) – (ii), Note 3O, Note 3P(ii), Note 22 and the fair value disclosures set out in Note 5D.
31 December
2017 31 December
2016 £m £m Secured 733.3 721.8 Unsecured 988.5 969.5 1,721.8 1,691.3 Unamortised borrowing costs, bonds discounts and bond premia (12.7) (14.1) 1,709.1 1,677.2 Disclosed as: Current 19.0 0.6 Non-current 1,690.1 1,676.6 1,709.1 1,677.2

Page | 52
A. Reconciliation of carrying value
Movements in the Group’s borrowings are analysed in the following table.
31 December 2017
31 December 2016
£m £m Opening balance 1,677.2 1,414.3 Principal repayments on secured debt (281.8) (230.0) Draw down of new secured debt 281.9 67.1 Proceeds on £200.0 million tap of £300.0 million 3.95% unsecured 7 year bond - 200.0 Proceeds on €150.0 million tap of €400.0 million 3.25% unsecured 10 year bond - 118.6 Premium on bond tap and note tap - 5.9 Borrowing costs incurred (2.2) (3.3) Amortisation of borrowing costs and bond discounts, net of accretion of premia from bond and note taps 3.9 6.2 Effects of translation to presentation currency 30.1 98.4 Closing balance 1,709.1 1,677.2
The tables above, together with the analysis set out in Notes 20B, 20C and 20D include unamortised borrowing costs which will be released to the consolidated income statement over the period of the associated borrowing. The analysis set out in Notes 20E and 20H excludes the effect of deducting unamortised borrowing costs.

Page | 53
B. Secured borrowings
I. 31 December 2017
Draw down date1 Effective interest rate
Maturity Fair value2
Book value2
% £m £m £184.0 million mortgage borrowing 24 September 2014 Libor + 1.80% December 2019 126.0 126.2 £116.6 million mortgage borrowing 31 January 2015 Libor + 2.50% 30 January 2018 19.0 18.9 £70.7 million mortgage borrowing 31 January 2015 2.90% 30 January 2020 71.3 70.5 £165.0 million mortgage borrowing 31 January 2015 2.91% 30 January 2023 164.9 161.2 €37.25 million mortgage borrowing3 22 January 2016
Euribor + 1.60% 29 December 2030 32.5 31.7
€50.0 million mortgage borrowing3 1 March 2016
Euribor + 1.60% 1 March 2031 38.2 37.2
€70.38 million mortgage borrowing 4 December 2017
Euribor + 1.8% 4 December 2022 62.5 62.2
€48.0 million mortgage borrowing 4 December 2017
Euribor + 1.8% 4 December 2022 42.6 42.4
€87.0 million mortgage borrowing 4 December 2017
Euribor + 2.0% 4 December 2022 77.3 76.9
€68.52 million mortgage borrowing 4 December 2017
Euribor + 1.8% 4 December 2022 60.9 60.5
€46.0 million mortgage borrowing 21 December 2017
Euribor + 1.5% 21 December 2022 40.9 40.2
736.1 727.9 Unamortised borrowing costs (included above) 5.4 733.3
Footnotes: 1. Draw down date or date of acquisition, whichever is later. 2. The fair value of floating rate borrowings have been established using an equivalent market value established by the Investment
Manager determining the equivalent credit spread for this debt at the balance sheet date. The fair value of fixed rate borrowings have been calculated using a discounted cash flow approach.
3. Amortising loan.

Page | 54
II. 31 December 2016
Draw down date1 Effective interest rate
Maturity Fair value2
Book value2
% £m £m £184.0 million mortgage borrowing 24 September 2014 Libor + 1.80% December 2019 164.9 167.3 €264.0 million mortgage borrowing 17 December 2014
Euribor + 2.125% December 20193 205.7 205.4
£116.6 million mortgage borrowing 31 January 2015 Libor + 2.50% 30 January 2018 45.7 45.6 £70.7 million mortgage borrowing 31 January 2015 2.90% 30 January 2020 72.4 70.4 £165.0 million mortgage borrowing 31 January 2015 2.91% 30 January 2023 167.4 161.0 €37.25 million mortgage borrowing4 22 January 2016
Euribor + 1.60% 29 December 2030 31.6 30.6
€50.0 million mortgage borrowing4 1 March 2016
Euribor + 1.60% 1 March 2031 37.0 36.0
724.7 716.3 Unamortised borrowing costs (included above) 5.5 721.8
Footnotes: 1. Draw down date or date of acquisition, whichever is later. 2. The fair value of floating rate borrowings have been established using an equivalent market value established by the Investment
Manager determining the equivalent credit spread for this debt at the balance sheet date. The fair value of fixed rate borrowings have been calculated using a discounted cash flow approach.
3. This facility contains two options to extend the maturity date by one year each upon satisfaction of the conditions per the facility agreement and payment of a 0.2% extension fee.
4. Amortising loan.
The Group also has access to an €8.0 million facility in connection with a Spanish asset. This facility is currently undrawn and it will expire on 29 December 2020.
Debt service is payable quarterly on all secured borrowings.

Page | 55
C. Bonds and notes
I. 31 December 2017
Issue date Effective interest rate
Maturity Fair value1
Book value1
% £m £m £500.0 million 3.95%, 7 year unsecured bond 30 June 2015 3.95% 30 June 2022 526.8 497.8 €550.0 million 3.25%, 10 year unsecured note 12 November 2015 3.25% 12 November 2025 568.7 483.4 1,095.5 981.2 Unamortised borrowing costs, discounts and premia 7.3 988.5
II. 31 December 2016
Issue date Effective interest rate
Maturity Fair value1
Book value1
% £m £m £500.0 million 3.95%, 7 year unsecured bond 30 June 2015 3.95% 30 June 2022 509.4 497.3 €550.0 million 3.25%, 10 year unsecured note 12 November 2015 3.25% 12 November 2025 478.7 464.1 988.1 961.4 Unamortised borrowing costs, discounts and premia 8.1 969.5
Footnote: 1. The fair value of each of the unsecured bonds and notes has been calculated using the quoted market price as at 31 December
2017.
Interest on the unsecured standalone bonds is payable annually on the anniversary of draw down.

Page | 56
D. Revolving credit facility
On completion of the merger between Kennedy-Wilson Holdings Inc and the Company in October 2017, the revolving credit facility was cancelled. At 31 December 2016 unamortised borrowing costs associated with the RCF totalled £0.5 million.
E. Maturity profile of borrowings
The maturity profile of the Group’s borrowings is as follows:
31 December 2017
31 December 2016
£m £m Due within one year 19.8 0.6 Due between two and five years 992.6 498.2 Due between six and ten years 679.0 1,158.8 Due greater than ten years 30.4 33.7 Closing balance 1,721.8 1,691.3
F. Collateral
The borrowings set out in Note 20B are secured by fixed charges over certain investment and development property assets. The fair value of investment and development property over which security has been granted is £1,300.8 million (December 2016: £1,250.1 million).
The bonds are unsecured.
G. Valuation
The fair values of the Group’s mortgage debt have been estimated by calculating the present value of the future cash flows, using appropriate market discount rates and are deemed to be valued within Level 3 of the fair value hierarchy, as defined by IFRS 13 (as discussed in Note 5D).
The fair value of the Group’s bonds have been estimated with reference to the market value of these instruments at the balance sheet date and are deemed to be valued within Level 2 of the fair value hierarchy, as defined by IFRS 13 (as discussed in Note 5D).

Page | 57
H. Interest rate profile of borrowings
I. 31 December 2017
Total Floating rate Fixed rate
Weighted average
interest rate
Weighted average
period for which rate
is fixed
Weighted average
period to maturity
£m £m £m % Years Years Gross borrowings in: Pound Sterling 878.5 146.1 732.4 3.32 7.0 4.0 Euro 843.3 354.9 488.4 2.68 10.0 7.3 1,721.8 501.0 1,220.8 3.00 8.2 5.7
II. 31 December 2016
Total Floating rate Fixed rate
Weighted average
interest rate
Weighted average
period for which rate
is fixed
Weighted average
period to maturity
£m £m £m % Years Years Gross borrowings in: Pound Sterling 946.8 214.4 732.4 3.23 7.0 4.8 Euro 744.5 275.1 469.4 2.79 10.0 7.7 1,691.3 489.5 1,201.8 3.03 8.2 6.1
The Group enters into derivative financial instruments to provide an economic hedge of its interest rate risk. Further details on interest rate risk are included in Note 22C(ii)(a) and the interest rate derivatives are disclosed in Note 21.
I. Financial covenants
Under the financial covenants relating to the bonds, the Group has to ensure that:
• consolidated net indebtedness (as defined in the applicable bond prospectus) does not exceed 60% of the total asset value;
• consolidated secured indebtedness (less cash and cash equivalents) does not exceed 50% of total asset value;
• interest coverage ratio to be at least 1.5 to 1.0; and
• unencumbered assets are not less than 125% of the unsecured indebtedness (less cash and cash equivalents).
The secured borrowings are subject to various financial covenants including LTV and debt service coverage ratios, all of which were met throughout the year.

Page | 58
21. Derivative financial instruments
The accounting policy applicable to derivative financial instruments is set out in Note 3P(iii) and the fair value disclosures set out in Note 5E.
31 December 2017
31 December 2016
£m £m Non-current assets Interest rate caps not designated as hedges - 0.3 Foreign currency forward contracts designated as net investment hedges - - - 0.3 Non-current liabilities Zero cost foreign currency options designated as net investment hedges (15.6) (17.3) Interest rate cross currency swaps designated as net investment hedges (38.8) (32.4) Foreign currency forward contracts designated as net investment hedges (2.6) (4.6) (57.0) (54.3) (57.0) (54.0)
The Group has entered into interest rate cap contracts with notional amounts of £116.0 million (December 2016: £218.1 million) on Sterling-denominated debt and €70.0 million (£62.2 million) (December 2016: €297.9 million or £254.3 million) on Euro-denominated debt. The caps are used to hedge the exposure to the variable interest rate payments on mortgage borrowings.
The Group has also entered into foreign currency forward contracts and zero cost foreign currency options with notional amounts of €170.0 million (£125.4 million) to hedge its net investment in Euro operations (December 2016: €353.0 million or £296.9 million). The Group also entered into a cross currency swap to convert a portion of the proceeds from its £300.0 million debut senior unsecured bond into Euro. This transaction swapped £150.0 million of the bond into €210.8 million Euro-equivalent debt and subsequently carries an equivalent annual coupon rate of 3.76%.
A. Valuation process
All derivatives are initially measured at fair value at the date the derivative is entered into and are subsequently re-measured at fair value (Note 5E). Foreign currency forward contracts, zero premium foreign currency options and cross-currency swaps are designated as net investment hedges of the investment in foreign operations. Foreign currency forward contracts, cross currency swaps and foreign currency zero premium options have been highly effective with no ineffectiveness recorded. Therefore movements in their fair value (with the exception of the time value of zero premium options) are recognised directly in OCI rather than the income statement and offset the impact of retranslating the related foreign currency subsidiary balance sheet at appropriate closing rates at each reporting date, as required by IAS 21 The Effects of Changes in Foreign Exchange Rates. In line with IAS 39 Financial Instruments: Recognition and Measurement, movements in the fair value of zero premium foreign exchange options are recognised directly in profit or loss.
The fair values of the Group’s outstanding derivative contracts have been estimated by calculating the present value of the future cash flows, using appropriate market discount rates. This valuation technique falls within Level 2 of the fair value hierarchy, as defined by IFRS 13 (as discussed in Note 5E).
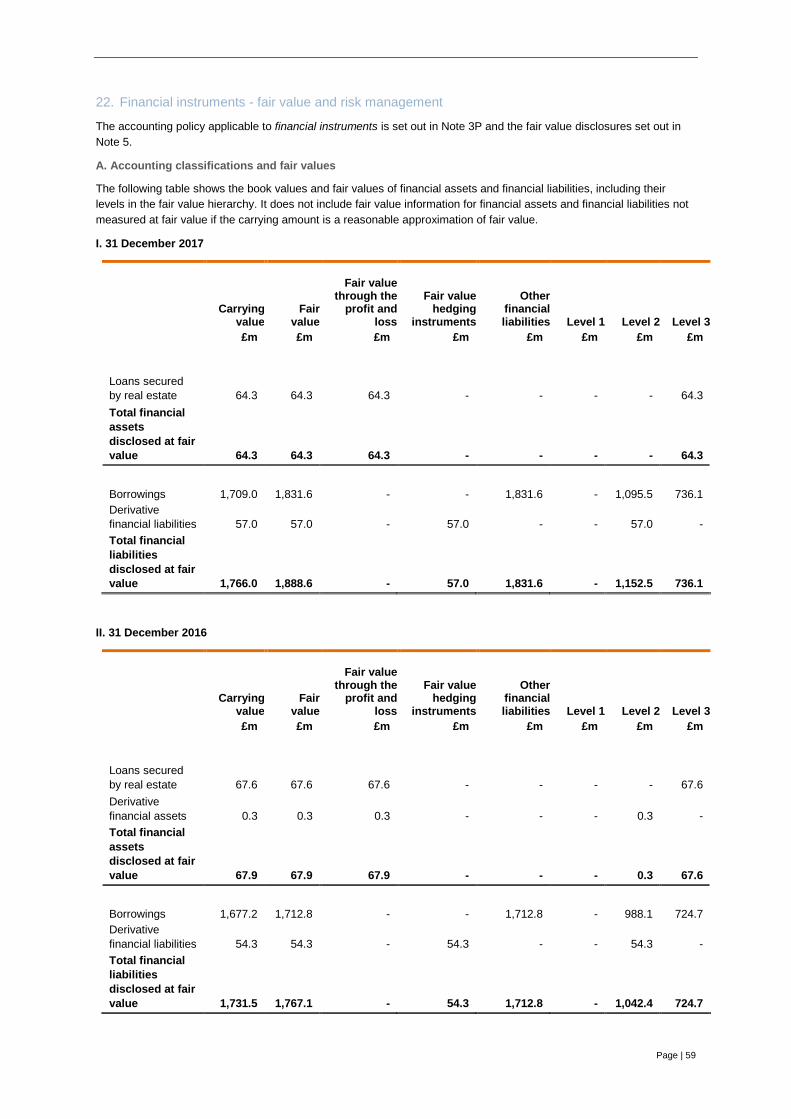
Page | 59
22. Financial instruments - fair value and risk management
The accounting policy applicable to financial instruments is set out in Note 3P and the fair value disclosures set out in Note 5.
A. Accounting classifications and fair values
The following table shows the book values and fair values of financial assets and financial liabilities, including their levels in the fair value hierarchy. It does not include fair value information for financial assets and financial liabilities not measured at fair value if the carrying amount is a reasonable approximation of fair value.
I. 31 December 2017
Carrying
value Fair
value
Fair value
through the profit and
loss
Fair value hedging
instruments
Other financial liabilities Level 1 Level 2 Level 3
£m £m £m £m £m £m £m £m
Loans secured by real estate 64.3 64.3 64.3 - - - - 64.3 Total financial assets disclosed at fair value 64.3 64.3 64.3 - - - - 64.3 Borrowings 1,709.0 1,831.6 - - 1,831.6 - 1,095.5 736.1 Derivative financial liabilities 57.0 57.0 - 57.0 - - 57.0 - Total financial liabilities disclosed at fair value 1,766.0 1,888.6 - 57.0 1,831.6 - 1,152.5 736.1
II. 31 December 2016
Carrying
value Fair
value
Fair value
through the profit and
loss
Fair value hedging
instruments
Other financial liabilities Level 1 Level 2 Level 3
£m £m £m £m £m £m £m £m
Loans secured by real estate 67.6 67.6 67.6 - - - - 67.6 Derivative financial assets 0.3 0.3 0.3 - - - 0.3 - Total financial assets disclosed at fair value 67.9 67.9 67.9 - - - 0.3 67.6 Borrowings 1,677.2 1,712.8 - - 1,712.8 - 988.1 724.7 Derivative financial liabilities 54.3 54.3 - 54.3 - - 54.3 - Total financial liabilities disclosed at fair value 1,731.5 1,767.1 - 54.3 1,712.8 - 1,042.4 724.7

Page | 60
B. Measurement of fair values
The fair value of rent and other receivables, cash and cash equivalents, and trade and other payables approximate their carrying value and they are carried at amortised cost.
C. Financial risk management
The Group’s activities expose it to a variety of financial risks:
• market risk (including interest rate risk and foreign currency risk);
• credit risk; and
• liquidity risk.
This note presents information about the Group’s exposure to each of the above risks, the Group’s objectives, policies and processes for measuring and managing risk, and the Group’s management of capital.
There have been no changes in any risk management policies since 31 December 2016.
(i). Risk management framework
The Investment Manager oversees the management of these risks. All derivative activities for risk management purposes are carried out by specialist teams that have the appropriate skills, experience and supervision.
The Board reviews and agrees policies for managing each of these risks which are summarised below. The Group’s risk management policies are established to identify and analyse the risks faced by the Group, to set appropriate risk limits and controls and to monitor risks and adherence to limits. Risk management policies and systems are reviewed regularly to reflect changes in market conditions and the Group’s activities.
(ii). Market risk
Market risk is the risk that the fair values of financial instruments will fluctuate because of changes in market prices, due to interest rate risk, foreign exchange risk and other price risks. The objective of market risk management is to manage and control market risk exposures within acceptable parameters, while optimising returns.
(a). Interest rate risk
Interest rate risk is the risk that the future cash flows or fair value of a financial instrument will fluctuate because of changes in market interest rates. Borrowings at variable rates expose the Group to cash flow interest rate risk whereas borrowings at fixed rates expose the Group to fair value interest rate risk. The Group is exposed to interest rate risk as entities within the Group borrow funds at both fixed and floating interest rates, as set out in Note 20H. The risk is managed by maintaining an appropriate mix between fixed and floating rate borrowings, and interest rate caps which it agrees to receive at specified intervals, the difference between variable rate interest amounts and the capped interest rate by reference to an agreed-upon notional principal amount, as well as cross-currency swaps. Hedging activities are evaluated regularly to align with interest rate views and defined risk appetite; ensuring optimal hedging strategies are applied by either positioning the balance sheet or protecting interest expense through different interest rate cycles.
At 31 December 2017, after taking into account the effect of interest rate caps and the cross-currency swap, 81.3% of the Group’s floating rate borrowings were hedged (December 2016: 71%).
In managing interest rate risk, the Group aims to reduce the impact of short term fluctuations on the Group’s earnings, without jeopardising its flexibility. Over the longer term, changes in interest rates may have an impact on consolidated earnings.
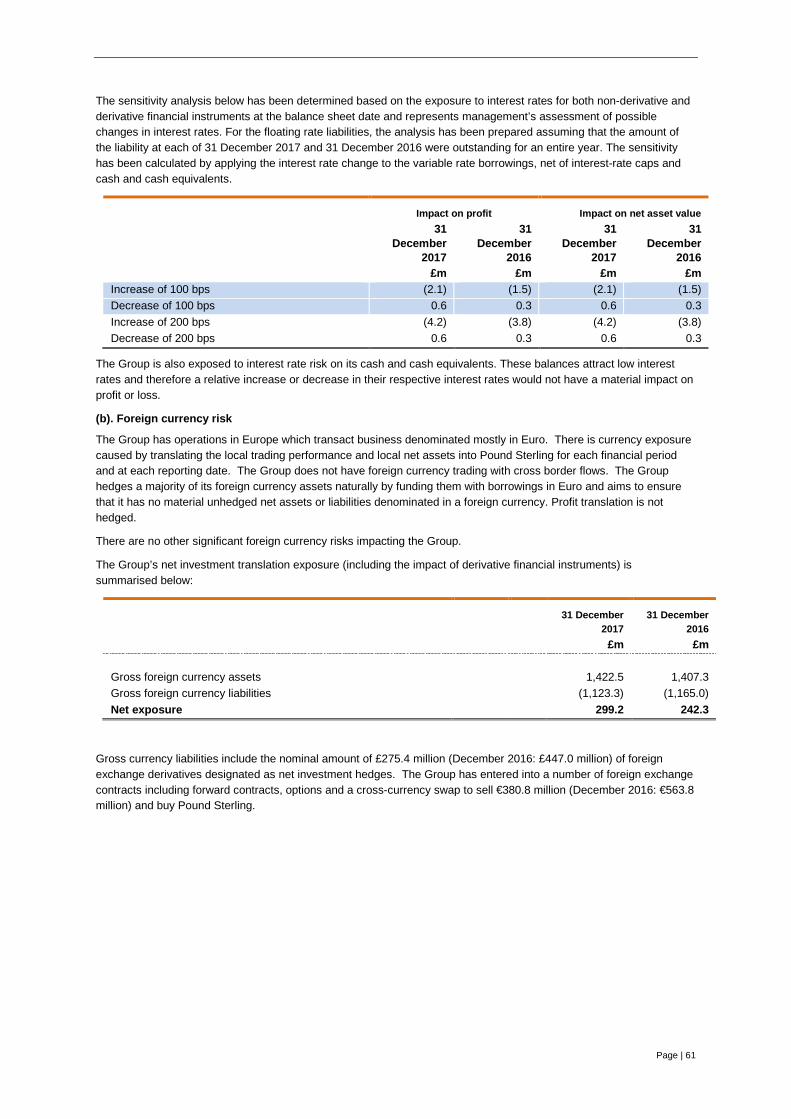
Page | 61
The sensitivity analysis below has been determined based on the exposure to interest rates for both non-derivative and derivative financial instruments at the balance sheet date and represents management’s assessment of possible changes in interest rates. For the floating rate liabilities, the analysis has been prepared assuming that the amount of the liability at each of 31 December 2017 and 31 December 2016 were outstanding for an entire year. The sensitivity has been calculated by applying the interest rate change to the variable rate borrowings, net of interest-rate caps and cash and cash equivalents.
Impact on profit Impact on net asset value 31
December 2017
31 December
2016
31 December
2017
31 December
2016 £m £m £m £m Increase of 100 bps (2.1) (1.5) (2.1) (1.5) Decrease of 100 bps 0.6 0.3 0.6 0.3 Increase of 200 bps (4.2) (3.8) (4.2) (3.8) Decrease of 200 bps 0.6 0.3 0.6 0.3
The Group is also exposed to interest rate risk on its cash and cash equivalents. These balances attract low interest rates and therefore a relative increase or decrease in their respective interest rates would not have a material impact on profit or loss.
(b). Foreign currency risk
The Group has operations in Europe which transact business denominated mostly in Euro. There is currency exposure caused by translating the local trading performance and local net assets into Pound Sterling for each financial period and at each reporting date. The Group does not have foreign currency trading with cross border flows. The Group hedges a majority of its foreign currency assets naturally by funding them with borrowings in Euro and aims to ensure that it has no material unhedged net assets or liabilities denominated in a foreign currency. Profit translation is not hedged.
There are no other significant foreign currency risks impacting the Group.
The Group’s net investment translation exposure (including the impact of derivative financial instruments) is summarised below:
31 December 2017
31 December 2016
£m £m Gross foreign currency assets 1,422.5 1,407.3 Gross foreign currency liabilities (1,123.3) (1,165.0) Net exposure 299.2 242.3
Gross currency liabilities include the nominal amount of £275.4 million (December 2016: £447.0 million) of foreign exchange derivatives designated as net investment hedges. The Group has entered into a number of foreign exchange contracts including forward contracts, options and a cross-currency swap to sell €380.8 million (December 2016: €563.8 million) and buy Pound Sterling.

Page | 62
The sensitivity below has been determined based on the exposure to foreign exchange rates for derivative financial instruments at the balance sheet date and represents management’s assessment of possible changes to the fair value of the Group’s cross-currency swaps as a result of possible changes in sterling to euro foreign exchange rates:
Impact on profit Impact on net asset value 31
December 2017
31 December
2016
31 December
2017
31 December
2016 £m £m £m £m 250 bps strengthening in exchange spot rate (0.1) (0.8) (5.9) (4.4) 250 bps weakening in exchange spot rate 0.1 0.8 5.9 4.4 500 bps strengthening in exchange spot rate (0.2) (1.5) (11.8) (8.6) 500 bps weakening in exchange spot rate 0.2 1.5 11.8 8.6
(iii) Credit risk
Credit risk is the risk that a counterparty will not meet its obligations under a financial instrument or customer contract, leading to a financial loss. The Group is exposed to credit risks from both its leasing activities and financing activities, including deposits with banks, and derivatives. The maximum exposure to credit risk at the reporting date is the carrying value of each class of financial asset.
(a). Rent and other receivables
Credit risk is managed by requiring tenants to pay rentals in advance. A credit assessment is carried out prior to the inception of a lease with a new counterparty and is used to determine the size of the deposit required from that tenant at inception. Rent collection is outsourced to managing agents who report regularly on payment performance. The Group has a diverse portfolio and there is no concentration of credit risk within the lease portfolio to any business sector or individual company.
Arrears are monitored regularly, and discussed at least monthly by the Investment Manager Group’s internal property management team and a strategy for dealing with significant potential defaults is presented on a timely basis by the property managers. The Group establishes an allowance for impairment that represents its estimate of incurred losses in respect of rent, trade and other receivables. An analysis of the movements in the allowance for impaired balances is set out in Note 16B(ii). The Group’s debtor recovery is consistently high and as such is deemed a low risk area.
The maximum exposure to credit risk of tenant and other receivables by geographic region at each balance date was as follows:
31 December 2017
31 December 2016
£m £m United Kingdom 9.6 5.2 Ireland 1.6 1.6 Rest of Europe 7.0 7.7 18.2 14.5

Page | 63
(b). Cash and cash equivalents
Credit risk from balances with banks is managed by the Investment Manager Group in accordance with the Investment Policy. Investments of surplus funds are made to avoid undue concentration of risks and therefore mitigate financial loss through potential counterparty failure. Cash deposits are held with investment grade rated banks which are rated Ba1 to A1, based on Moodys’ ratings.
The Group’s exposure and credit ratings of its counterparties are monitored by the Investment Manager Group throughout the period.
(c). Loan secured by real estate
Interest income is accreted to the profit or loss using the effective interest rate method. The security underlying these loans includes certain hotel assets in the United Kingdom, together with certain commercial buildings, retail premises and residential assets in the Republic of Ireland. Loans secured by real estate are carried at fair value. At 31 December 2016, the value of the underlying collateral was £72.0 million (December 2016: £69.9 million). See further details in Note 13A.
(d). Derivatives
The derivatives are entered into with bank and financial institution counterparties, which are rated Ba1 to A1, based on Moodys’ ratings.
(iv). Liquidity risk
Liquidity risk is the risk that the Group will not be able to meets its financial obligations as they fall due.
Prudent liquidity management implies maintaining sufficient cash, the availability of funding through adequate amounts of committed credit facilities and the ability to close out market positions. The Group’s policy is to seek to minimise its exposure to liquidity risk by managing its exposure to interest rate risk and to refinancing risk. The Group seeks to borrow for as long as possible at the lowest cost.
The Group’s approach to monitoring its liquidity includes daily cash flow review and forecasting, and monthly monitoring of the maturity profile of debt, by the Investment Manager. This is also reviewed each quarter by the Board. The Group’s objective is to maintain a balance between continuity of funding and flexibility through the use of bank deposits, borrowings and bond financing.
A key factor in ensuring existing facilities remain available to the Group is the borrowing entity’s ability to meet the relevant facility’s financial covenants. The Group has a process to monitor regularly both current and projected compliance with its financial covenants.
(a). EMTN Programme
On 5 November 2015 the Group announced the establishment of a £2,000.0 million EMTN Programme. Under the EMTN Programme, the Group may issue, from time to time, up to £2,000.0 million of various types of debt securities in certain markets and currencies.
The table below summarises the contractual undiscounted cash flows payable under financial liabilities, derivative financial instruments and trade and other payables existing at the balance sheet date. Contracted cash flows are based on the loan balances and applicable interest rates payable on these at year end.

Page | 64
I. 31 December 2017
Less than 3
months
3 to 12
months
1 to 2 years
2 to 5 years
Over 5 years Total
£m £m £m £m £m £m
Secured borrowings 3.7 32.2 145.4 571.0 57.8 810.1 £500.0 million 3.95% 7 year unsecured bond - 11.1 11.1 370.5 - 392.7 €550.0 million 3.25% 10 year unsecured note - 15.9 15.9 63.4 520.2 615.4
Derivative financial instruments - - 12.1 44.9 - 57.0
Trade and other payables 41.3 1.8 0.9 2.0 1.6 47.6
45.0 61.0 185.4 1,051.8 579.6 1,922.8
II. 31 December 2016
Less than 3
months
3 to 12
months
1 to 2 years
2 to 5 years
Over 5 years Total
£m £m £m £m £m £m
Secured borrowings1 5.5 14.4 64.3 480.8 238.1 803.1 £500.0 million 3.95% 7 year unsecured bond - 18.8 18.8 56.4 539.4 633.4 €550.0 million 3.25% 10 year unsecured note - 15.3 15.3 45.8 530.5 606.9
Derivative financial instruments - - 3.9 18.0 32.4 54.3
Trade and other payables 25.9 2.7 0.2 1.3 1.6 31.7
31.4 51.2 102.5 602.3 1,342.0 2,129.4
Footnote: 1. The Group has two, one-year options to extend the maturity date of certain of its borrowings (Note 20B).

Page | 65
(v). Capital management
The Group manages its capital to ensure that entities in the Group will be able to continue as a going concern and as such it aims to maintain a prudent mix between borrowings and equity financing. The Group’s capital structure comprises equity attributable to shareholders of the Company (Note 23), borrowings (Note 20) and cash and cash equivalents (Note 17). Equity comprises issued share capital, reserves and retained earnings as disclosed in the consolidated statement of changes in equity. Borrowings comprise term loan facilities, a revolving credit facility and unsecured bonds.
Save for the bonds, the remaining Group borrowings are secured on specific portfolios and are non–recourse to the Group as a whole
The Group is not subject to any externally imposed capital requirements.
The Board monitors the return on capital as well as the level of dividends to ordinary shareholders. Dividends are approved by the Board on an interim basis.
23. Stated capital
The accounting policy applicable to stated capital is set out in Note 3R.
A. Authorised share capital
Ordinary shares Number
Authorised Ordinary shares Unlimited Ordinary shares issued and fully paid Shares in issue at 1 January 2017 126,133,407 At 31 December 2017 126,133,407
Shares in issue at 1 January 2016 135,933,938
Ordinary shares bought back and cancelled as part of the Company’s share buyback programme (9,800,531)
At 31 December 2016 126,133,407
£m As at 1 January 2017 1,222.1 At 31 December 2017 1,222.1
The Company has unlimited authorised share capital of no par value.
The issued and fully paid-up ordinary shares rank equally. The holders of the ordinary shares are entitled to receive dividends as declared from time to time and are entitled to one vote per share at meetings of the Company.

Page | 66
B. Number of shares in issue
Number of shares Weighted average
number of shares
Year ended 31 December 2017 Number of shares in issue at 1 January 2017 126,133,407 126,133,407 Number of ordinary shares in issue at 31 December 2017 126,133,407 n/a Weighted average number of ordinary shares in issue for the year ending 31 December 2017 n/a 126,133,407
Year ended 31 December 2016 Number of shares in issue at 1 January 2016 135,933,938 135,933,938 Ordinary shares bought back and cancelled as part of the Company’s share buyback programme (9,800,531) (1,569,313) Number of ordinary shares in issue at 31 December 2016 126,133,407 n/a Weighted average number of ordinary shares in issue for the year ending 31 December 2016 n/a 134,364,625
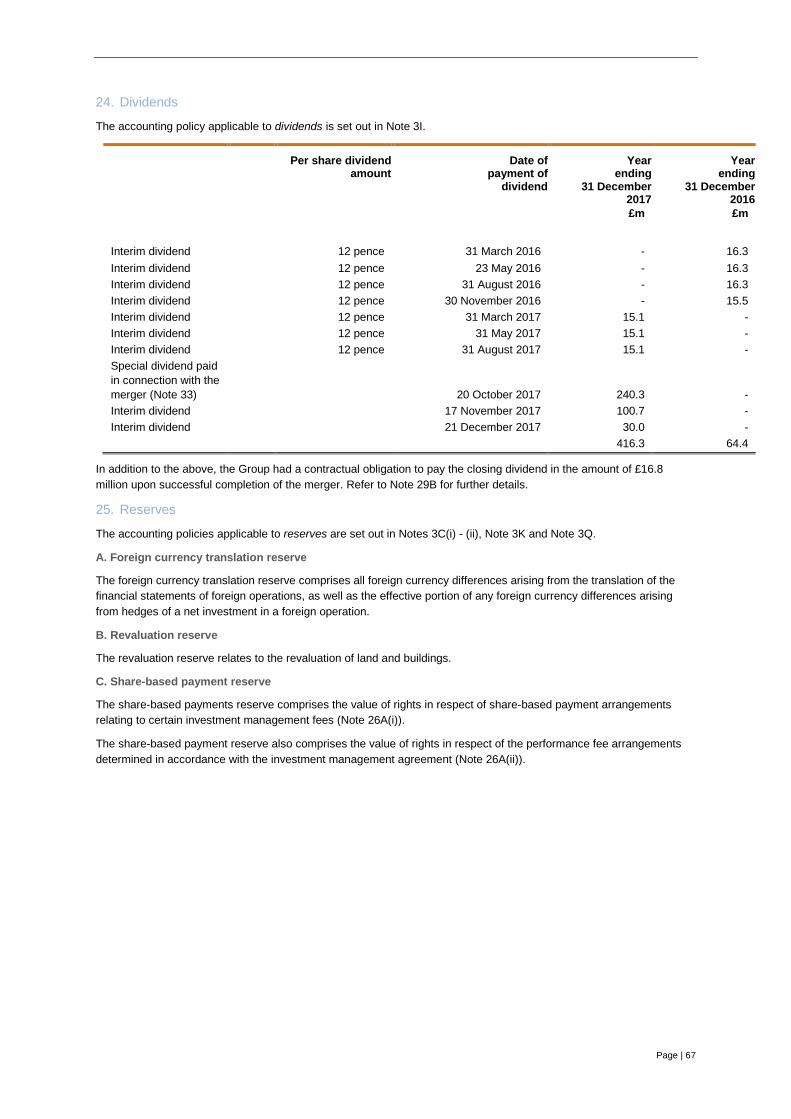
Page | 67
24. Dividends
The accounting policy applicable to dividends is set out in Note 3I.
Per share dividend amount
Date of payment of
dividend
Year ending
31 December 2017
Year ending
31 December 2016
£m £m Interim dividend 12 pence 31 March 2016 - 16.3 Interim dividend 12 pence 23 May 2016 - 16.3 Interim dividend 12 pence 31 August 2016 - 16.3 Interim dividend 12 pence 30 November 2016 - 15.5 Interim dividend 12 pence 31 March 2017 15.1 - Interim dividend 12 pence 31 May 2017 15.1 - Interim dividend 12 pence 31 August 2017 15.1 - Special dividend paid in connection with the merger (Note 33)
20 October 2017 240.3 - Interim dividend 17 November 2017 100.7 - Interim dividend 21 December 2017 30.0 - 416.3 64.4
In addition to the above, the Group had a contractual obligation to pay the closing dividend in the amount of £16.8 million upon successful completion of the merger. Refer to Note 29B for further details.
25. Reserves
The accounting policies applicable to reserves are set out in Notes 3C(i) - (ii), Note 3K and Note 3Q.
A. Foreign currency translation reserve
The foreign currency translation reserve comprises all foreign currency differences arising from the translation of the financial statements of foreign operations, as well as the effective portion of any foreign currency differences arising from hedges of a net investment in a foreign operation.
B. Revaluation reserve
The revaluation reserve relates to the revaluation of land and buildings.
C. Share-based payment reserve
The share-based payments reserve comprises the value of rights in respect of share-based payment arrangements relating to certain investment management fees (Note 26A(i)).
The share-based payment reserve also comprises the value of rights in respect of the performance fee arrangements determined in accordance with the investment management agreement (Note 26A(ii)).
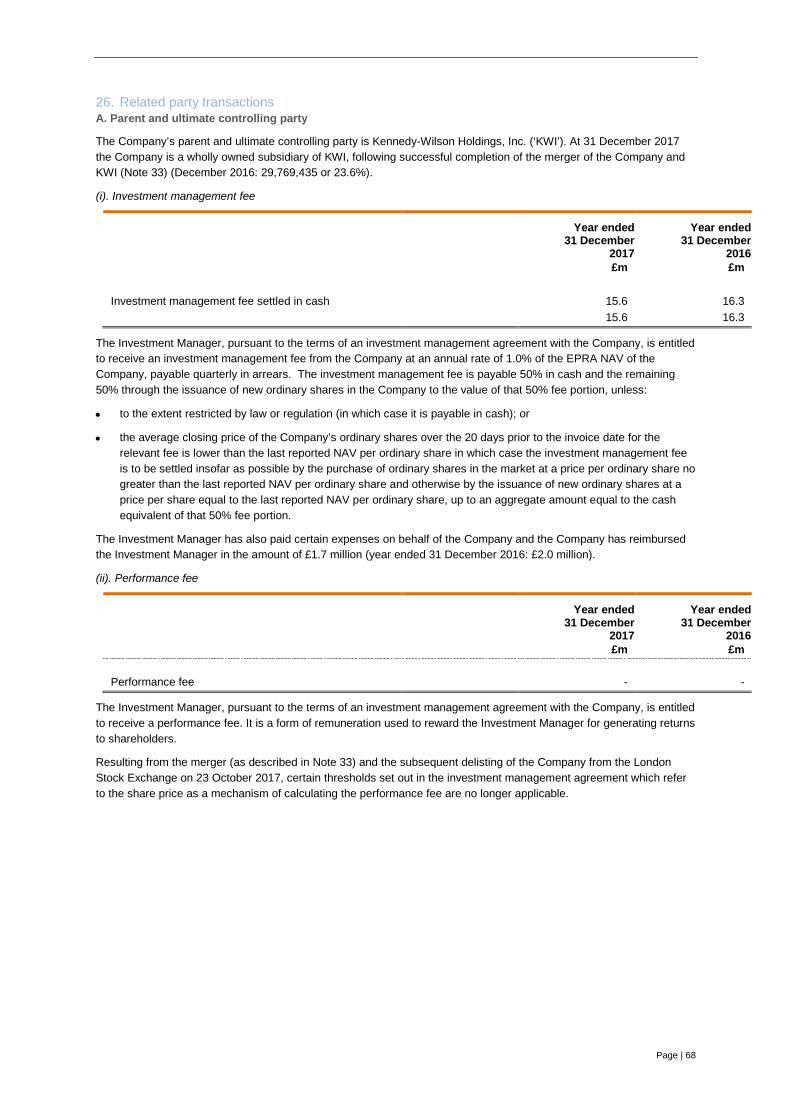
Page | 68
26. Related party transactions A. Parent and ultimate controlling party
The Company’s parent and ultimate controlling party is Kennedy-Wilson Holdings, Inc. (‘KWI’). At 31 December 2017 the Company is a wholly owned subsidiary of KWI, following successful completion of the merger of the Company and KWI (Note 33) (December 2016: 29,769,435 or 23.6%).
(i). Investment management fee
Year ended 31 December
2017
Year ended 31 December
2016 £m £m Investment management fee settled in cash 15.6 16.3 15.6 16.3
The Investment Manager, pursuant to the terms of an investment management agreement with the Company, is entitled to receive an investment management fee from the Company at an annual rate of 1.0% of the EPRA NAV of the Company, payable quarterly in arrears. The investment management fee is payable 50% in cash and the remaining 50% through the issuance of new ordinary shares in the Company to the value of that 50% fee portion, unless:
• to the extent restricted by law or regulation (in which case it is payable in cash); or
• the average closing price of the Company’s ordinary shares over the 20 days prior to the invoice date for the relevant fee is lower than the last reported NAV per ordinary share in which case the investment management fee is to be settled insofar as possible by the purchase of ordinary shares in the market at a price per ordinary share no greater than the last reported NAV per ordinary share and otherwise by the issuance of new ordinary shares at a price per share equal to the last reported NAV per ordinary share, up to an aggregate amount equal to the cash equivalent of that 50% fee portion.
The Investment Manager has also paid certain expenses on behalf of the Company and the Company has reimbursed the Investment Manager in the amount of £1.7 million (year ended 31 December 2016: £2.0 million).
(ii). Performance fee
Year ended 31 December
2017
Year ended 31 December
2016 £m £m Performance fee - -
The Investment Manager, pursuant to the terms of an investment management agreement with the Company, is entitled to receive a performance fee. It is a form of remuneration used to reward the Investment Manager for generating returns to shareholders.
Resulting from the merger (as described in Note 33) and the subsequent delisting of the Company from the London Stock Exchange on 23 October 2017, certain thresholds set out in the investment management agreement which refer to the share price as a mechanism of calculating the performance fee are no longer applicable.

Page | 69
B. Transactions with key management personnel
Total amounts paid to key management personnel are set out below:
Year ended
31 December 2017
Year ended
31 December 2016
£m £m Investment management fee 15.6 16.3 Directors’ fees 0.3 0.3 Directors’ fees related to the merger 0.9 Dividends earned by directors on shareholdings in the Company 0.2 0.2 Costs reimbursed 1.7 2.0 Performance fee - - 18.7 18.8
(i). Amounts paid to key management personnel
(a). Investment management fee
The Investment Manager is considered to be included within the definition of key management personnel. The total Investment Management fee for the year ended 31 December 2017 is £15.6 million (year ended 31 December 2016: £16.3 million), details of which are set out in Note 26A(i).
(b). Directors’ fees
The directors of the Company received total fees for the year as follows:
Year ended
31 December 2017
Year ended 31 December
2016 £ £ Charlotte Valeur1 126,875 145,000 William McMorrow1 - - Mark McNicholas1 87,500 100,000 Simon Radford1 87,500 100,000 Mary Ricks1 - - 301,875 345,000
Footnote: 1. Resigned on 15 November 2017.
Pursuant to the terms of the investment management agreement between the Investment Manager and the Company, each of William McMorrow and Mary Ricks has waived his/her fees as directors of the Company.
(c). Directors’ fees related to the merger
Pursuant to the terms of an agreement entered into between the Company and each of Charlotte Valeur, Mark McNicholas and Simon Radford dated 23 April 2017, the Company agreed to pay each independent director extra remuneration for services rendered in his/her capacity as a director in relation to the merger transaction with Kennedy-Wilson Holdings, Inc. Each director was entitled to be paid a daily fee of £3,750.00 plus reasonable out of pocket expenses incurred for each day where he/she spent two hours or more performing work in his/her capacity as a director of the Company in relation to the merger. Each of William McMorrow and Mary Ricks waived his/her right to receive any fees in his/her capacity as a director of the Company including, without limitation, in relation to the merger transaction with Kennedy-Wilson Holdings, Inc.

Page | 70
In the period from 1 March 2017 to 31 December 2017, each director has been paid the following under the terms of this letter:
Period ended 31 December
2017 £ Charlotte Valeur1 476,250 William McMorrow1 - Mark McNicholas1 206,250 Simon Radford1 168,750 Mary Ricks1 - 851,250
Footnote: 1. Resigned on 15 November 2017.
On 15 November 2017, each of William McMorrow, Mary Ricks, Charlotte Valeur, Simon Radford and Mark McNicholas resigned from as directors of the Company. On 15 November 2017, Fraser Kennedy, Andrew McNulty and Ana Kekovska were appointed to the board of the Company. Such directors are not entitled to any fee for acting as directors of the Company.
(d). Performance fee
The Investment Manager, as noted above, is considered to be included within the definition of key management personnel. The total performance fee which the Investment Manager is entitled to for the year ended 31 December 2017 is £Nil (year ended 31 December 2016: £Nil million), details of which are set out in Note 26A(ii).
(ii). Interests in share capital of the Company
The directors’ interests in the shares of the Company are detailed below:
31 December 2017 31 December 2016
Number of shares Number of shares Charlotte Valeur1 - - William McMorrow1 - 200,149 Mark McNicholas1 - - Simon Radford1 - 12,500 Mary Ricks1 - 280,149
- 492,798
Footnote: 1. Resigned on 15 November 2017.
Under the terms of the merger KWI acquired all of the outstanding shares of the Company, as described in Note 33. As such no shares in the Company are owned by the directors at 31 December 2017.
Dividends paid on ordinary shares in the Company held by directors totalled approximately £0.2 million during the year ended 31 December 2017 (year ended 31 December 2016: £0.2 million).
C. Other related parties
There were no transactions with other related parties.

Page | 71
27. Share-based payments
The accounting policy applicable to share-based payment arrangements is set out in Note 3Q.
At 31 December 2017, the Group had the following share-based payment arrangements:
A. Part-settlement of Investment Management fee
As described in Note 26A(i), the Investment Manager is entitled to receive, pursuant to the terms of an investment management agreement with the Company, a management fee from the Company at an annual rate of 1.0% of the EPRA NAV of the Company, payable quarterly in arrears. The investment management fee is payable 50% in cash and the remaining 50% through the issuance of ordinary shares in the Company.
In accordance with the investment management agreement, the fair value price for the shares issued to settle the portion of the investment management fee which is payable 50% in shares, is the average closing share price for the twenty days immediately prior to the issue date of those shares.
For the year ended 31 December 2017, the Investment Management fee payable to the Investment Manager totals £15.6 million, which was paid in cash (year ended 31 December 2016: £16.3 million paid in cash).
B. Performance fee
As described in Note 26A(ii), the Company will pay an annual performance fee calculated with reference to total shareholder return. The fee is the lesser of 20% of a) the excess over an annualised annual return hurdle of 10% or b) the excess of year end EPRA NAV per ordinary share over the relevant High Water Mark (being the closing EPRA NAV per Ordinary Share).

Page | 72
28. Group entities
The accounting policy applicable to group entities is set out in Note 3A(i).
Except where indicated the following are indirect subsidiaries of the Company. All the Company’s direct and indirect interests are in ordinary shares. Except as noted, all are wholly owned property investment companies and are included in the consolidated financial statements.
Incorporated and registered in Jersey Jupiter Argyle Ltd Jupiter Friars Ltd Jupiter Holdco Ltd Jupiter Hull Limited Jupiter Marathon Ltd Jupiter Pennine Ltd Jupiter Rubislaw Ltd Jupiter Seafield Ltd Jupiter Seafield OpCo Limited Jupiter Showroom Ltd Jupiter Tradeco Ltd Jupiter Trident Ltd KW Artemis UK Properties HoldCo Ltd KW BPR Ltd KW Croydon Limited (formerly KW Office Limited) KW Dukes Park Limited KW High Street Retail B Ltd KW Industrial B Ltd KW Industrial SPV 1 Ltd KW Industrial SPV 2 Ltd KW Ipswich Limited KW Office SPV 1 Ltd (formerly KW Dionysus Ltd) KW Office SPV 2 Ltd (formerly KW Agamemnon Ltd) KW Office SPV 3 Ltd KW MH Limited KW Niobe Ltd KW Pioneer Point GP Limited (formerly KW Ringway Limited) KW Regional Office B Ltd KW Retail SPV 1 Ltd KW Retail SPV 2 Ltd (formerly Crumbie Ltd) KW Retail Warehouse SPV 1 Ltd KW Trade Co Ltd (formerly Bengal Ltd) KW UK Assets Holdco Ltd 1 KWVF Tiger Ltd KW Towers Limited
Gatsby Aberdeen Limited Gatsby Capital 1 Limited Gatsby Capital 2 Limited Gatsby Capital 3 Limited Gatsby Chatham Limited Gatsby Croydon Limited Gatsby GIR Limited Gatsby GR Limited Gatsby Grocery Limited Gatsby Industrial Limited Gatsby INV 1 Limited Gatsby Middlewich Limited Gatsby PFS Limited Gatsby PH Limited Gatsby Retail Limited Gatsby Saltash Limited KW Gatsby Limited KW Italy Investments Holdco Limited 1 KW Olimpia Holdco Limited SEO Bartley Wood Limited SEO Bracknell Limited SEO Farnborough Limited SEO Finance Limited SEO Harlow Limited SEO Langley Limited SEO Maidenhead Limited SEO Reading Limited SEO Stockley Limited SEO Watford Limited KW Pioneer Point Limited KW Pioneer Point Limited Partnership Incorporated and registered in Republic of Ireland Cavalli Investments ICAV KW Investment Funds ICAV KW Portmarnock Ops Ltd
Incorporated and registered in Luxembourg KW Lux FinanceCo S.à.r.l. 1 KW Real Estate Lux S.à.r.l. 1 KW Investment Lux SICAV-SIF (formerly KW Investment Lux S.à.r.l.) 1 KW Investment One Lux S.à.r.l. KW Investment Five Lux S.à.r.l. KW Investment Eight Lux S.à.r.l. KW Investment Nine Lux S.à.r.l. KW Investment Ten Lux S.à.r.l. KW Investment Eleven Lux S.à.r.l. KW Investment Twelve Lux S.à.r.l. Incorporated and registered in England or Scotland St Andrews Bay Development Ltd KW Pioneer Point UK OpCo Limited Incorporated and registered in Spain Alemina Investments, S.L. 2 KW Spanish Holdco, SL KW LMG Propco 1, SL KW New Propco 1, SL KW Sol Propco, SL KW Sol Propco 2, SL KW Velazquez Propco1, SL KW Velazquez Propco 2, SL Leterana Servicios Y Gestiones, SL 2 Parque Comercial Guadalhorce, SL
Footnotes: 1. Directly owned. 2. 90% owned by the Group.

Page | 73
29. Subsequent events A. Investment management fee
On 27 March 2018 the Company approved the payment of the investment management fee of £3.1 million (for the quarter ended 31 December 2017), payable to the Investment Manager.See further details in Note 26A(i).
B. Closing dividend
On 10 January 2018 the Closing Dividend contemplated under the terms of the Merger was paid in the amount of £16.8 million.
30. Capital commitments and contingencies A. Capital expenditure commitments
At 31 December 2017 the estimated amount of authorised and contracted commitments which have not been provided for in respect of future purchases, construction and redevelopment of investment property totals £4.1 million. The estimated amount of authorised but uncontracted expenditure totals £8.9 million (December 2016: £8.8 million contracted and £6.7 million uncontracted).
31. Operating lease arrangements
The Group has determined that all tenant leases are operating leases within the meaning of IAS 17.
The Group earns rental income by leasing its investment properties to tenants under non-cancellable operating leases. Typically, single let properties are leased on terms where the tenant is responsible for repair, insurance and running costs while multi-let properties are leased on terms which include recovery of a share of service charge expenditure and insurance. Residential property is typically leased for periods of one year or less. Minimum lease rentals from residential property are not included in the table below.
At the reporting date, the Group had contracted with tenants to receive the following future minimum lease payments:
31 December
2017
31 December
2016 £m £m Not later than one year 131.1 137.6 Later than one year but not more than five years 399.6 423.5 Later than five years but not more than ten years 223.4 242.4 754.1 803.5
32. Assets held-for-sale
The accounting policy applicable to assets held-for-sale is set out in Note 3N. Details of the accounting policies applicable to investment and development property are set out in Note 3J, whilst fair value disclosures are set out in Note 5A, as well as Note 12.
The Group has identified certain of its investment properties as held-for-sale in accordance with IFRS 5. The carrying value of such assets was £160.0 million at the balance sheet date (December 2016: £59.4 million). During the year £50.3 million of assets which were classified as held-for-sale at 31 December 2016 were sold, and one asset valued at £11.3 million which had been classified as held-for-sale at 31 December 2016 was taken off the market and reclassified as investment property. At 31 December 2017 a further £160.0 million of assets held-for-sale were added to this classification. A fair value movement of £1.3 million was recorded against an asset which was included in this category at 31 December 2016 and which remains unsold at 31 December 2017. Exchange rate movements total £0.9 million.

Page | 74
33. Merger
On 24 April 2017, the Company and KW published an announcement setting out the terms and conditions of a recommended offer by KW to acquire all of the outstanding shares of the Company. The merger was to be implemented by way of a Court-sanctioned scheme of arrangement (the ‘Scheme’). On 13 September 2017 the Company published a circular in relation to the Scheme. On 10 October 2017 the Company announced that Share Shareholders and KWE Shareholders (as defined in the Scheme circular) voted to approve the Scheme and the special resolution. On 18 October 2017 the Royal Court of Jersey sanctioned the Scheme and the Scheme became effective on 20 October 2017.
On 23 October 2017 the Company announced that the cancellation of the ordinary shares of no par value of the Company from listing on the premium segment of the UK Listing Authority’s Official List and from admission to trading on the main market for listed securities maintained by the London Stock Exchange took effect.
In accordance with the terms Scheme circular, upon successful completion of the Scheme:
• A special distribution of 250 pence per Scheme Share (as defined in the Scheme circular) became payable to those Scheme Shareholders who were entitled to such a distribution under the terms of the Scheme, for a total amount of £240.3 million. This amount was paid on 20 October 2017.
• A closing dividend of £16.8 million was paid on 10 January 2018.
34. Approval of the annual financial statements
The consolidated financial statements were authorised for issue by the Company’s Board of Directors on 27 March 2018.