Embed Size (px)
Citation preview

Hydrology Report | 1
Hydrology&Hydraulics
Report
Bartett Bridge #2041
over
Kennebunk River
Kennebunk and Arundel, Maine
STP-2046(800)
WIN 20468.00
MaineDepartmentofTransportation
BridgeProgram

Hydrology Report | 2
HYDROLOGY REPORT
Bartlett Bridge (#2041) over the Kennebunk River carries US Route 1 between
Kennebunk and Arundel, Maine. The Kennebunk River watershed extends north and west from
the bridge location. The basin begins at Kennebunk Pond in Lyman to the north and Carlisle
Brook in Lyman to the west. Kennebunk Pond outlets to Lords Brook and the Kennebunk River
is formed at the confluence of Carlisle and Lord Brooks in Lyman, 10.9 miles upstream of
Bartlett Bridge. The watershed upstream of the bridge is 16% wetlands. Downstream of the
bridge, the Kennebunk River continues 6.5 miles before discharging into the Atlantic Ocean
between the towns of Kennebunk and Kennebunkport.
The drainage basin characteristics for this bridge were provided by the Maine
Department of Transportation Environmental Office, Hydrology Section. Peak flows were
calculated with techniques described in the United States Geological Survey Water-Resources
Investigations Report 99-4008 (Hodgkins, 1999). Despite the close proximity to the coast line,
the bridge location does not have tidal influences due to the steep grade of the Kennebunk
River downstream of the bridge.
The flood of record at Bartlett Bridge occurred in April of 2007 (commonly referred to as
the Patriot’s Day Flood). This event combined up to 8.5 inches of rain with snowmelt to
produced peak flows greater than the 100 year recurrence interval throughout York County.
The USGS report, “Flood of April 2007 in Southern Maine,” calculated the flow rate at the
Bartlett Bridge crossing as 5730 CFS. For comparison, the same report provided a peak flow for
the 500 year recurrence interval of 3980 CFS (see also the hydrology below provided by the
Environmental Office). Unfortunately, the USGS gage on the Kennebunk River upstream from
Bartlett Bridge (26.7 sq. mile drainage area) was installed the year after this event. Further
discussion of the flow rate during the April 2007 event can be found in the Hydraulic Report.
SUMMARY
Drainage Area 42.9 mi2
Q1.1 416 ft3/s
Q10 1,384 ft3/s
Q25 1,717 ft3/s
Q50 1,972 ft3/s
Q100 2,244 ft3/s
Q500 2,894 ft3/s
Reported by: Gustafson, Garrett A
Date: June 15, 2016

Hydraulic Report | 3
HYDRAULIC REPORT
Hydraulic Modeling
The existing and proposed bridges were analyzed in HEC-RAS 4.1.0 (Hydrologic
Engineering Center’s River Analysis System), a one-dimensional hydraulics software program
developed by the United States Army Corps of Engineers. A 450 foot long portion of the
Kennebunk River intersecting the Bartlett Bridge crossing was modeled utilizing three cross
sections upstream of the bridge and up to 6 cross sections downstream of the bridge.
This location, particularly the region immediately downstream of the bridge location,
presented modeling challenges due to the complexity of the exposed bedrock and remains of a
mill foundation. During low flow conditions, flow is restricted to the left side of the channel and
during high discharge events, flow passes over these obstacles. At moderate flows, modeling is
further complicated by secondary side channels that pass around and through the obstacles
that channelize low flow conditions. To model these conditions, two models were utilized in
order to provide cross sections perpendicular to flow at all of the appropriate flood levels. The
high flow conditions were modeled using 5 downstream cross sections while the more complex
low to intermediate flow conditions were modeled with 6 downstream cross sections.
The HEC-RAS models were based on the following assumptions:
• Steady flow
• Manning’s Roughness Coefficients
o Upstream Channel: n = 0.048
o Downstream Channel: n = 0.056
o All overbank areas: n = 0.090
• Default expansion (0.3) and contraction (0.1) values.
• Ineffective flow areas
o Existing Bridge: Utilized on 3 of 4 corners of the bridge. The upstream, left
streambank (Arundel) generally falls in line with the existing Abutment No. 2
breastwall and therefore does not experience significant flow parallel to the
cross section.
o Proposed Bridge: Utilized on all 4 corners.
o Downstream: Utilized in several secondary channels in order to model
conveyance from section to section at low flow rates.
• Flow Regime: Subcritical
• Bridge Modeling Approach: Default settings

Hydraulic Report | 4
The reach boundary conditions were calibrated based on the USGS report “Flood of
April 2007 in Southern Maine.” This report included observed water surface elevations during
the April 2007 event upstream and downstream of Bartlett Bridge and a flow rate “computed
with indirect methods.” The USGS also provided a file titled “Kennebunk River at Rte 1 near
Kennebunk, ME – Indirect Summary” which included documentation indicating location of
those water surface elevation observations relative to the existing bridge.
Hydraulic models are typically calibrated by varying the reach boundary conditions to
match a documented or assumed water surface elevation or other observed condition at a
known discharge rate. This procedure was pursued, however, calibration of the model for both
observed water surface elevations proved to be unattainable; the model showed a variance
over two feet at one observation point at the flow rate provided. Fortunately, with two
observed water surface elevations, the model could be calibrated for two unknowns, discharge
rate and reach boundary condition. Normal depth downstream streambed slope was selected
as the reach boundary condition. The calibration procedure followed a trial and error process in
which discharge rate was modified to adjust water surface elevations up and down at both
observation locations and downstream streambed slope was utilized to address error variance
between observation points. Model water surface elevations converged with the observed
water surface elevations at a discharge rate of 4,100 cubic feet per second and a downstream
streambed slope of 0.00012 ft/ft. This flow rate exceeds the 500 year recurrence interval peak
flow rate which is fairly consistent with the magnitude of the April 2007 event. Since a field
measured discharge rate corresponding to the April 2007 event was not available, the flow rate
obtained through model calibration is considered reasonable.
An independent model developed by the USGS for the Bartlett Bridge location included
a downstream streambed slope of 0.0054 ft/ft. Due to the large difference in streambed slopes
between the two models, a sensitivity analysis was conducted to evaluate the impact of
streambed slopes from 0.00012 ft/ft to 0.0054 ft/ft. This analysis yielded minimal fluctuation in
water surface elevation and discharge velocities. In the interest of conservatism, the controlling
results from streambed slopes of either 0.00012 ft/ft or 0.0054 ft/ft are reported.
Following model calibration, the site hydraulics were analyzed with both the existing
and proposed bridge geometry and the discharge rates presented in the Hydrology Report. The
proposed bridge geometry is summarized below:
• 78 foot single span
• Low chord elevation = 47.51
o Superstructure depth = 47.25” = 36” NEXT F Beam + 8” Concrete Deck + 3.25”
Bituminous Wearing Surface with High Performance Membrane.
• Exposed footings and seals

Hydraulic Report | 5
Water surface elevations and discharge velocities are reported below for the existing
and proposed structures:
SUMMARY
Note: All elevations based on North American Vertical Datum (NAVD) of 1988.
The proposed structure meets all of the applicable opening requirements. The available
freeboard exceeds the minimum freeboard depths specified in Bridge Design Guide Section
2.3.10.2.A, Structure Capacity (Riverine). The proposed profile was primarily controlled by
maintaining the existing grade at Rollins Lane and Walker Lane while providing a 1% grade
across the proposed bridge; the riverine hydraulics had little impact on the proposed profile.
Additionally, the proposed bridge span length exceeds 1.2 bankfull width, 65 feet (bankfull
width is 54 feet). There is no documented history of flooding problems, ice jams, or debris
issues at this location and pier removal will further improve these aspects.
Existing Structure
Recommended
Structure
2 Span Concrete
T-Beam
Single Span
NEXT Beam
Total Area of Waterway Opening ft2
842 940
1.1 Year Recurrence Interval ft 38.2 37.7
10 Year Recurrence Interval ft 40.8 39.8
25 Year Recurrence Interval ft 41.4 40.2
50 Year Recurrence Interval ft 41.9 40.6
100 Year Recurrence Interval ft 42.3 41.0
500 Year Recurrence Interval ft 43.5 42.4
Flood of Record (April 2007) ft 44.9 43.8
50 Year Recurrence Interval ft 5.0 6.9
100 Year Recurrence Interval ft 4.6 6.5
Flood of Record (April 2007) ft 2.0 3.7
1.1 Year Recurrence Interval ft/s 6.5 6.1
10 Year Recurrence Interval ft/s 10.0 8.2
25 Year Recurrence Interval ft/s 10.5 8.9
50 Year Recurrence Interval ft/s 10.9 9.4
100 Year Recurrence Interval ft/s 11.3 10.0
500 Year Recurrence Interval ft/s 12.2 11.9
Flood of Record (April 2007) ft/s 13.5 13.4
Discharge Velocity
Headwater Elevations
Vertical Clearance (Freeboard)

Hydraulic Report | 6
Scour Analysis
All of the proposed foundations are founded on bedrock and therefore the proposed structure
is considered stable and insusceptible to scour.
Reported by: Gustafson, Garrett A
Date: June 15, 2016
Note: Supporting documentation is provided in Appendix A of this Hydrology and Hydraulics
Report.

AppendixA
HydraulicsData


60
River, Saco River, Salmon Falls River (floodway data tables [FDT] only), Smith Brook, Spinney Creek, Spruce Creek, Stevens Brook, Webhannet River, and the York river (FIRM only) were revised for backwater elevations.
Roughness factors (Manning’s “n”) used in the hydraulic computations for this updated countywide study were determined from field observations guided by U.S. Geological Water Supply Publications (References 96 and 97).
Table 6, “Manning’s “n” Values,” shows the channel and overbank “n” values for the streams studied by detailed methods in both the pre-countywide and countywide studies. Values calculated for this countywide study have been noted in the table:
TABLE 6 – MANNING’S “n” VALUES Flooding Source Channel “n” OverbanksBatson River 0.020-0.050 0.050-0.090 Blacksmith Brook 0.050 0.090 Bridges Swamp 0.050 0.090 Bunganut Pond (at outlet) 0.030-0.045 0.055-0.110 Cape Neddick River 0.013-0.050 0.090 Cider Hill Creek 0.020-0.050 0.050-0.020 Coffin Brook1 0.045-0.05 0.09-0.11 Coffin Brook Tributary 11 0.05-0.06 0.1-0.11 Cooks Brook 0.030-0.055 0.040-0.110 Day Brook 0.013-0.050 0.050-0.090 Depot Brook 0.013-0.050 0.050-0.090 Dolly Gordon Brook 0.013-0.050 0.050-0.090 Driscoll Brook1 0.04-0.05 0.045-0.1 Ferguson Brook1 0.045-0.06 0.05-0.12 Goosefare Brook 0.013-0.050 0.050-0.090 Great Works River 0.030-0.060 0.035-0.110 Green Brook 0.030-0.050 0.030-0.090 Kennebunk Pond (at west outlet) 0.030-0.045 0.055-0.110 Kennebunk River 0.020-0.050 0.090 Keay Brook1 0.045-0.06 0.085-0.11 Little Ossipee River 0.015-0.057 0.060-0.100 Little Ossipee River (Limington) 0.020-0.060 0.045-0.125 Little River 0.020-0.050 0.050-0.090 Little River (Cornish) 0.035-0.05 0.08-0.10 Little River(Berwick)1 0.045-0.075 0.05-0.15 Littlefield River 0.030-0.045 0.055-0.110 Merriland River 0.013-0.050 0.050-0.090 Mill Brook 0.013-0.050 0.050-0.090 Moors Brook 0.020-0.050 0.050-0.090 Mousam River (Alfred) 0.030-0.070 0.070-0.080 Mousam River (Kennebunk)1 0.038-0.045 0.09-0.11 Mousam River (Lower Reach) 0.03-0.07 0.07-0.08 Mulloy Brook1 0.045-0.06 0.09 1Updated calculations for this countywide study

Table 1 27
Table 1. Peak water-surface elevations for April 2007 flood in York and Cumberland Counties, Maine.—Continued
���������� ����� ������������ ���� �������������������� ����� ����� ������������������� ������������� ���� ��! �"�����#$%&������ ���������������������������������� ���� ��'���� ��! �"�����#$%%��(�)����"����!����������� ���*���������������� ����+������ ����������� �,��-���".���� ���(��������������� �����(�)��(� �����)����������*�)��* ����((��� ��� ���/�)��0�������/���� ���/� ����������"�0������� �������������1"���23
Site number
HWM number
Easting (feet)
Northing (feet)
Elevation (feet)
Water body Location and description
16 55 2%57&78)% #%92$$)2 2&)&$ Merriland River ((�/��-�������(�)�#��!��(�#16 5; 2%57587)5 186282.3 23.50 Merriland River ((�/��-�������(�)�#��!��(�216 59 2%5729;)& 186375.3 25)## Merriland River RR Br US from Rt. 1, US RE116 57 2%5727%)7 186372.1 25)8$ Merriland River RR Br US from Rt. 1, US RE2
17 5% 2%5#$&2)9 #$$2%%)8 ;2)5% Branch Brook (�)�$ ��-��(�
18 5$ 2%;72%$)% 29587#)% 79)59 Stackpole Brook Simpson Rd., US RE18 50 2857251.1 2958&#)$ 63.72 Stackpole Brook ��.����(�)��!��(�
#$ 51 2%&;$%%)9 227721.0 #5&)59 Kennebunk River ! �� 0����(�)�&;��-��(�##$ 52 2%&;$$#)& 22779&)$ #52)9% Kennebunk River ! �� 0����(�)�&;��-��(�2#$ 53 2%&;$%$)7 227731.8 #52)77 Kennebunk River ! �� 0����(�)�&;��-��(�&20 ;5 2%&9255)& 227871.3 125.30 Kennebunk River (�)�&;��!��*�20 55 2836160.6 227768.7 133.13 Kennebunk River Rt. 35, US RE121 56 2850061.2 2#%;52)8 70.33 Kennebunk River !�����(�)��-��*�21 57 2%;88$;)2 2#%557)7 70.70 Kennebunk River !�����(�)��!��*�#22 58 2%;7#79)5 2879%&)$ 52)%% Kennebunk River (�)�#��!��(�22 ;$ 2857107.2 207786.7 55)$2 Kennebunk River Rt. 1, US RE
23 60 27$2#5$)2 212320.3 22$)58 Great Works River F�������(�)��!��*�23 61 27$2#&%)% 2#258#); 233.36 Great Works River Old Mill Rd., US LE25 62 27$;29;)5 203635.1 220.20 Great Works River � ��������(�)��!��*�25 63 27$;2#9)# 203717.6 223.82 Great Works River � ��������(�)��-��*�25 95 27$$;25)& #%9$&8)$ 188.11 Great Works River Ford Quint Rd., US LE25 65 27$$5%#)7 #%9$9%)2 188.57 Great Works River Ford Quint Rd., US RE25 66 27$$527); #%9$&&)5 187.00 Great Works River I����J"���(�)��!��(�26 67 27$72#&)5 182553.0 178.36 Great Works River Oak Woods Rd., US RE26 68 27$7#%;)5 #%25&9)$ #7;)55 Great Works River F ��������(�)��!��(�27 9$ 2800512.2 #79$$5)& #2$)5; Great Works River (�)�5��!��*�27 70 2%88&78)5 #778;7)5 131.58 Great Works River (�)�5��-��*�28 71 2800865.6 #72$%#)7 #2;)#5 Great Works River ! ������N � ����)� 0����(�)�$��-��*�2$ 72 2%8&&85)& 151303.7 $5);; Great Works River ���.����� ����(�)�����P��/�)��!��(�2$ 73 2%8&58;)7 151236.1 $7)&8 Great Works River Hoopers Sands Rd.-Emerys Br., US LE30 75 2%88$#&); 171108.5 ##&)8$ Great Works River � �������)��!��*�#30 75 2800786.8 171051.0 ##2)$9 Great Works River � �������)��!��*�231 76 27%9#58)# #588;9)7 83.80 Great Works River (�)�2&9)��!��*�31 77 27%92&&)$ #588$5)7 %5)$7 Great Works River Rt. 236., US LE32 78 27%5$8$)2 #5##8#)7 82.38 Great Works River /� �������)�! ���-��(�32 7$ 27%5%5%)& #5##;9)8 82.06 Great Works River /� �������)�! ���!��(�
33 80 277#$59)9 2;7$$7)$ ;;$)$% �"�.�/�X�/���� Rt. 11, US LE33 81 277#%7$)% 2;%855)# 555.50 �"�.�/�X�/���� (�)�##��!��*�#33 82 2771871.0 2;%85$)5 ;;5)$5 �"�.�/�X�/���� (�)�##��!��*�2
&5 83 279298;)$ 281713.5 572)&8 Little Ossipee River (�)�##��!��*�&5 %5 27925&8)$ 281752.0 57$)95 Little Ossipee River Rt. 11, US RE1&5 85 2792&;5)7 2%#7;8)5 5%;)$; Little Ossipee River Rt. 11, US RE2

Digital files located at V:\Flood Report 2007\2007 Indirect models
KennebunkRiveratRte1nearKennebunk,ME—IndirectSummary Type of Computation: Contracted opening under a bridge Type IV (vertical abutments and sloping embankments with wingwalls) HEC-RAS (version 4.0.0) Location of Site The Kennebunk River crosses Rte 1 about 1 mile north of where rte 35 crosses rte 1 in the center of Kennebunk. Survey of Site: 4/20/2007— GJS and LEF located & marked HWMs
One HWM was found 50 ft US on the RE in a 4 inch birch tree in a bunch of alders and was marked with a nail and flagging (accuracy of +/-0.1).
One HWM was found 45 ft DS 45 ft from RE at the base of a 4 in hardwood and marked with a nail and flagging (accuracy of +/-.2).
5/1/07 –JPK and LHC surveyed the HWMs 6/19/07 –JPK PJL, JMC surveyed Cross Sections for an indirect measurement, including an approach section, an US face, a low road, a DS face and an exit cross section.
Equipment Used: Leica Total Station TCR1105 Serial#: 629546 serviced 6/27/06 by Maine Tech Source High Precision GPS System 1200 Serial # Base: 460268; Serial # Rover: 460272 Discharge and HWM Elevation: Peak Discharge = 5730 cfs US LE HWM95 = 44.92 NAVD88 DS LE HWM98 = 42.88 NAVD88 Drainage Area: 42.4 mi2 at Rte 1. Drainage area determined in GIS. Unit Discharge: 135 cfsm Nature of Antecedent Conditions & Storm: The April 2007 storm, which is commonly referred to in Maine as the Patriots’ Day Storm, produced strong winds, tornadoes, high waves, beach erosion, and riverine and coastal flooding in communities from South Carolina to Maine from April 15 through 18, 2007. The storm, resulting from a major low-pressure system, reached peak intensity on April 16 off the coast of New Jersey but still produced up to 8.5 in. of rain in southern Maine. The storm produced hurricane-force winds and extreme rainfall in Maine, causing storm surges and flooding in coastal areas and extensive flooding of streams and rivers inland. The reduction in snowpack water content from April 9 to April 19 averaged 1 in. throughout most of York and Cumberland Counties and augmented runoff from storm precipitation.
0 100 200 300 400 50025
30
35
40
45
50
55
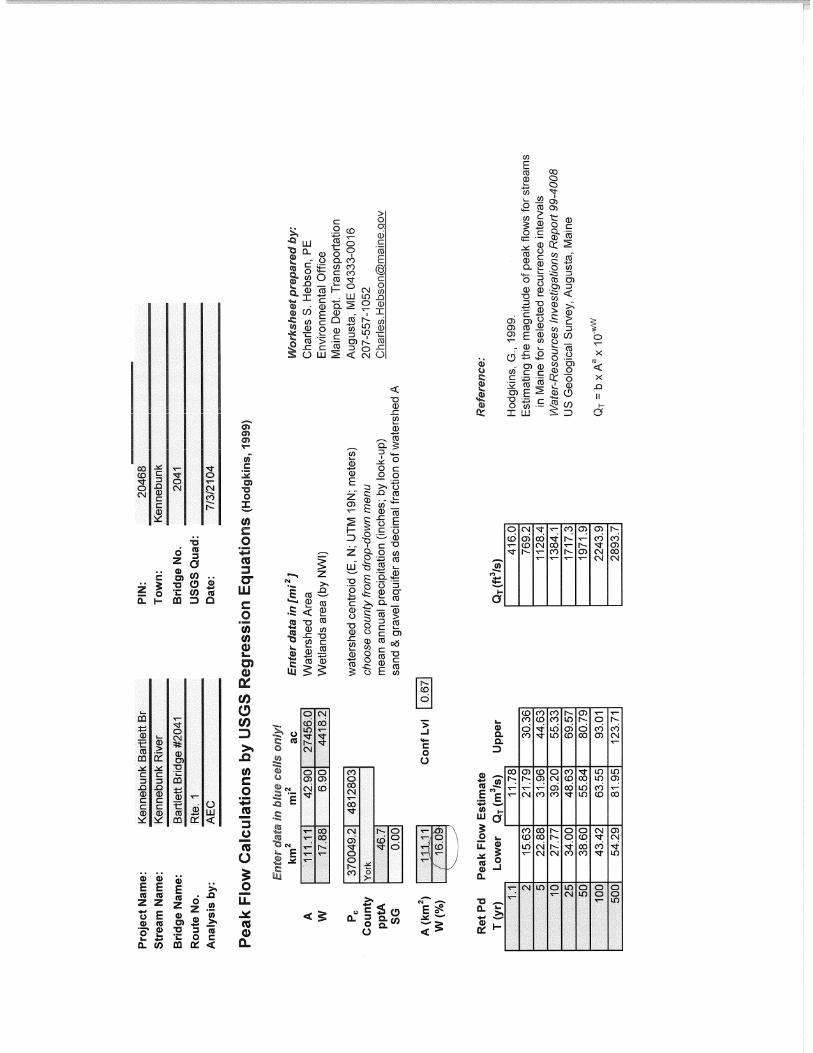
Kennebunk-Arundel, Bartlett Plan: Plan 28 5/20/2016
Main Channel Distance (ft)
Ele
vatio
n (ft
)
Legend
EG 2007
WS 2007
Crit 2007
Ground
OWS 2007
Stream Reach


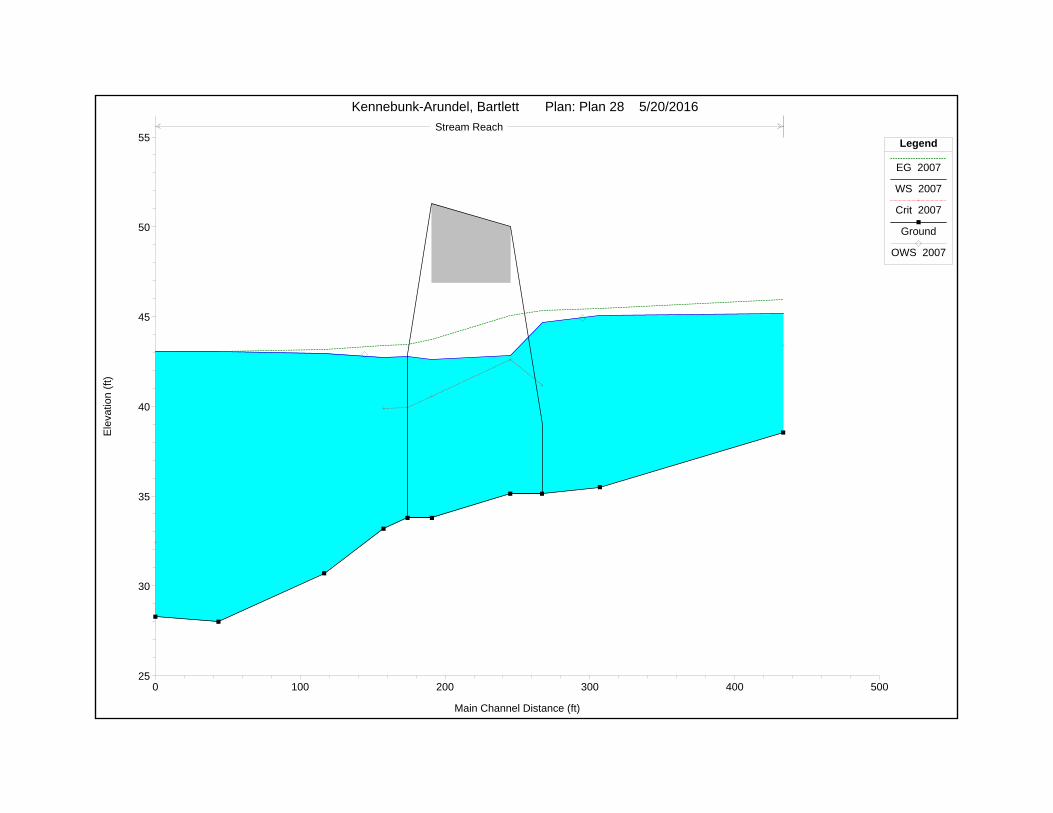
HEC-RAS Plan: Plan 24 River: Stream Reach: ReachReach River Sta Profile E.G. Elev W.S. Elev Crit W.S. Frctn Loss C & E Loss Top Width Q Left Q Channel Q Right Vel Chnl
(ft) (ft) (ft) (ft) (ft) (ft) (cfs) (cfs) (cfs) (ft/s)Reach 423.3771 1.1 yr 38.45 38.33 0.12 0.00 73.85 416.00 2.71Reach 423.3771 10 yr 41.21 40.99 0.09 0.01 109.13 19.88 1358.74 5.48 3.79Reach 423.3771 25 yr 41.90 41.65 0.09 0.01 116.13 41.56 1664.29 11.45 4.06Reach 423.3771 50 yr 42.37 42.10 0.09 0.01 119.67 61.46 1893.26 17.18 4.26Reach 423.3771 100 yr 42.85 42.55 0.09 0.01 123.21 84.83 2134.64 24.43 4.45Reach 423.3771 500 yr 43.88 43.53 0.09 0.02 130.89 147.72 2699.90 46.08 4.86Reach 423.3771 2007 45.48 45.04 0.09 0.03 145.68 282.36 3723.99 93.65 5.53
Reach 383.3732 1.1 yr 38.33 38.19 36.95 0.15 0.05 66.18 0.11 415.89 3.00Reach 383.3732 10 yr 41.11 40.80 38.41 0.14 0.12 101.54 56.46 1327.64 4.56Reach 383.3732 25 yr 41.80 41.44 38.82 0.13 0.13 107.40 91.89 1625.41 4.94Reach 383.3732 50 yr 42.27 41.87 39.13 0.13 0.13 109.82 123.32 1848.58 5.22Reach 383.3732 100 yr 42.74 42.31 39.44 0.13 0.14 112.36 158.88 2085.02 5.49Reach 383.3732 500 yr 43.77 43.24 40.13 0.14 0.16 118.51 250.45 2643.25 6.09Reach 383.3732 2007 45.36 44.65 41.13 0.14 0.15 129.01 430.82 3669.18 7.10
Reach 325 BR U 1.1 yr 38.13 37.48 37.33 1.05 0.08 37.89 416.00 6.45Reach 325 BR U 10 yr 40.85 39.32 39.32 1.09 0.25 55.88 27.10 1357.00 10.01Reach 325 BR U 25 yr 41.54 39.88 39.88 1.23 0.21 61.95 64.14 1653.16 10.53Reach 325 BR U 50 yr 42.00 40.26 40.26 1.26 0.20 64.29 104.38 1867.52 10.85Reach 325 BR U 100 yr 42.47 40.62 40.62 1.30 0.20 65.85 151.15 2092.75 11.26Reach 325 BR U 500 yr 43.47 41.37 41.37 1.18 0.29 69.59 277.35 2616.35 12.17Reach 325 BR U 2007 45.07 42.89 42.61 0.95 0.32 72.66 627.37 3472.64 12.65
Reach 325 BR D 1.1 yr 37.00 36.61 35.92 0.25 0.00 42.12 416.00 5.00Reach 325 BR D 10 yr 39.42 38.72 37.94 0.18 0.07 72.31 206.67 1177.43 7.17Reach 325 BR D 25 yr 39.88 38.93 38.35 0.23 0.10 72.33 276.18 1441.12 8.38Reach 325 BR D 50 yr 40.26 39.20 38.63 0.24 0.12 72.35 344.22 1627.69 8.93Reach 325 BR D 100 yr 40.66 39.48 38.92 0.24 0.13 72.38 421.66 1822.24 9.43Reach 325 BR D 500 yr 41.75 40.60 39.54 0.19 0.13 72.47 663.34 2230.36 9.44Reach 325 BR D 2007 43.80 42.68 40.56 0.13 0.13 72.65 1143.70 2956.30 9.33
Reach 290.5356 1.1 yr 36.74 36.36 35.83 0.17 0.04 55.39 416.00 4.93Reach 290.5356 10 yr 39.18 38.71 37.61 0.11 0.00 105.25 234.06 1141.13 8.92 5.91Reach 290.5356 25 yr 39.55 38.93 37.98 0.14 0.00 107.32 307.32 1395.81 14.16 6.86Reach 290.5356 50 yr 39.91 39.23 38.23 0.15 0.00 109.33 375.97 1575.08 20.84 7.25Reach 290.5356 100 yr 40.29 39.55 38.49 0.15 0.00 110.76 452.56 1762.34 29.00 7.60Reach 290.5356 500 yr 41.43 40.72 39.04 0.11 0.00 118.32 671.23 2164.29 58.18 7.55Reach 290.5356 2007 43.54 42.85 39.92 0.07 0.02 130.27 1081.53 2901.06 117.41 7.52
Reach 273.9258 1.1 yr 36.52 36.29 35.25 0.51 0.08 63.38 416.00 0.00 3.85Reach 273.9258 10 yr 39.06 38.61 37.03 0.36 0.06 113.67 96.21 1266.74 21.16 5.62Reach 273.9258 25 yr 39.41 38.77 37.63 0.42 0.03 115.29 130.71 1557.30 29.29 6.66Reach 273.9258 50 yr 39.76 39.05 37.93 0.47 0.04 117.92 169.66 1762.38 39.87 7.12Reach 273.9258 100 yr 40.13 39.34 38.21 0.37 0.03 120.79 215.16 1974.82 53.92 7.53Reach 273.9258 500 yr 41.32 40.61 38.84 0.21 0.08 128.08 369.27 2393.00 131.43 7.33Reach 273.9258 2007 43.45 42.82 39.86 0.12 0.09 137.68 649.05 3118.79 332.15 7.12

HEC-RAS Plan: Plan 24 River: Stream Reach: ReachReach River Sta Profile E.G. Elev W.S. Elev Crit W.S. Frctn Loss C & E Loss Top Width Q Left Q Channel Q Right Vel Chnl
(ft) (ft) (ft) (ft) (ft) (ft) (cfs) (cfs) (cfs) (ft/s)Reach 423.3771 1.1 yr 38.45 38.33 0.12 0.00 73.85 416.00 2.71Reach 423.3771 10 yr 41.21 40.99 0.09 0.01 109.13 19.88 1358.74 5.48 3.79Reach 423.3771 25 yr 41.90 41.65 0.09 0.01 116.13 41.56 1664.29 11.45 4.06Reach 423.3771 50 yr 42.37 42.10 0.09 0.01 119.67 61.46 1893.26 17.18 4.26Reach 423.3771 100 yr 42.85 42.55 0.09 0.01 123.21 84.83 2134.64 24.43 4.45Reach 423.3771 500 yr 43.88 43.53 0.09 0.02 130.89 147.72 2699.90 46.08 4.86Reach 423.3771 2007 45.74 45.33 0.08 0.03 149.10 295.13 3705.16 99.71 5.33
Reach 383.3732 1.1 yr 38.33 38.19 36.95 0.15 0.05 66.18 0.11 415.89 3.00Reach 383.3732 10 yr 41.11 40.80 38.41 0.14 0.12 101.54 56.46 1327.64 4.56Reach 383.3732 25 yr 41.80 41.44 38.84 0.13 0.13 107.40 91.89 1625.41 4.94Reach 383.3732 50 yr 42.27 41.87 39.12 0.13 0.13 109.82 123.32 1848.58 5.22Reach 383.3732 100 yr 42.74 42.31 39.44 0.13 0.14 112.36 158.88 2085.02 5.49Reach 383.3732 500 yr 43.77 43.24 40.13 0.14 0.16 118.51 250.46 2643.24 6.09Reach 383.3732 2007 45.63 44.98 41.13 131.57 446.37 3653.63 6.82
Reach 325 BR U 1.1 yr 38.13 37.48 37.33 1.05 0.08 37.89 416.00 6.45Reach 325 BR U 10 yr 40.85 39.32 39.32 1.09 0.25 55.88 27.10 1357.00 10.01Reach 325 BR U 25 yr 41.54 39.88 39.88 1.23 0.21 61.95 64.14 1653.16 10.53Reach 325 BR U 50 yr 42.00 40.26 40.26 1.26 0.20 64.29 104.38 1867.52 10.85Reach 325 BR U 100 yr 42.47 40.62 40.62 1.33 0.19 65.85 151.15 2092.75 11.26Reach 325 BR U 500 yr 43.47 41.37 41.37 1.50 0.14 69.59 277.35 2616.35 12.17Reach 325 BR U 2007 45.65 44.34 42.61 72.78 802.88 3297.12 9.96
Reach 325 BR D 1.1 yr 37.00 36.61 35.92 0.25 0.00 42.12 416.00 5.00Reach 325 BR D 10 yr 39.42 38.72 37.94 0.18 0.07 72.31 206.67 1177.43 7.17Reach 325 BR D 25 yr 39.88 38.93 38.35 0.23 0.10 72.33 276.18 1441.12 8.38Reach 325 BR D 50 yr 40.26 39.20 38.63 0.24 0.12 72.35 344.23 1627.67 8.93Reach 325 BR D 100 yr 40.64 39.42 38.92 0.25 0.14 72.37 415.20 1828.70 9.58Reach 325 BR D 500 yr 41.47 39.83 39.54 0.30 0.20 72.41 586.03 2307.67 11.16Reach 325 BR D 2007 42.92 40.56 40.56 72.47 935.54 3164.46 13.47
Reach 290.5356 1.1 yr 36.74 36.36 35.83 0.17 0.04 55.39 416.00 4.93Reach 290.5356 10 yr 39.18 38.71 37.61 0.11 0.00 105.25 234.06 1141.13 8.92 5.91Reach 290.5356 25 yr 39.55 38.93 37.98 0.14 0.00 107.32 307.32 1395.81 14.16 6.86Reach 290.5356 50 yr 39.91 39.23 38.23 0.15 0.00 109.34 375.98 1575.07 20.85 7.25Reach 290.5356 100 yr 40.25 39.48 38.49 0.16 0.01 110.46 447.67 1768.30 27.93 7.73Reach 290.5356 500 yr 40.97 39.99 39.04 0.19 0.01 112.73 621.35 2226.35 46.00 8.81Reach 290.5356 2007 42.19 40.80 39.92 0.24 0.03 118.90 958.07 3057.71 84.22 10.52
Reach 273.9258 1.1 yr 36.52 36.29 35.25 0.51 0.08 63.38 416.00 0.00 3.85Reach 273.9258 10 yr 39.06 38.61 37.03 0.36 0.06 113.67 96.21 1266.74 21.16 5.62Reach 273.9258 25 yr 39.41 38.77 37.63 0.42 0.03 115.29 130.71 1557.30 29.29 6.66Reach 273.9258 50 yr 39.76 39.05 37.93 0.47 0.04 117.92 169.67 1762.36 39.87 7.12Reach 273.9258 100 yr 40.08 39.25 38.21 0.49 0.04 119.94 208.88 1983.69 51.32 7.69Reach 273.9258 500 yr 40.77 39.65 38.84 0.57 0.02 123.74 304.46 2507.10 82.14 9.01Reach 273.9258 2007 41.92 40.19 39.86 0.72 0.05 126.48 487.23 3456.82 155.95 11.31

HEC-RAS Plan: Plan 24 River: Stream Reach: ReachReach River Sta Profile E.G. Elev W.S. Elev Crit W.S. Frctn Loss C & E Loss Top Width Q Left Q Channel Q Right Vel Chnl
(ft) (ft) (ft) (ft) (ft) (ft) (cfs) (cfs) (cfs) (ft/s)Reach 423.3771 1.1 yr 38.45 38.33 0.12 0.00 73.85 416.00 2.71Reach 423.3771 10 yr 41.21 40.99 0.09 0.01 109.13 19.88 1358.74 5.48 3.79Reach 423.3771 25 yr 41.90 41.65 0.09 0.01 116.13 41.56 1664.29 11.45 4.06Reach 423.3771 50 yr 42.37 42.10 0.09 0.01 119.67 61.46 1893.26 17.18 4.26Reach 423.3771 100 yr 42.85 42.55 0.09 0.01 123.21 84.83 2134.64 24.43 4.45Reach 423.3771 500 yr 43.88 43.53 0.09 0.02 130.89 147.72 2699.90 46.08 4.86Reach 423.3771 2007 45.48 45.04 0.09 0.03 145.66 282.27 3724.12 93.61 5.53
Reach 383.3732 1.1 yr 38.33 38.19 36.94 0.15 0.05 66.19 0.11 415.89 2.99Reach 383.3732 10 yr 41.11 40.80 38.41 0.14 0.12 101.54 56.46 1327.64 4.56Reach 383.3732 25 yr 41.80 41.44 38.82 0.13 0.13 107.40 91.89 1625.41 4.94Reach 383.3732 50 yr 42.27 41.87 39.13 0.13 0.13 109.82 123.32 1848.58 5.22Reach 383.3732 100 yr 42.74 42.31 39.44 0.13 0.14 112.36 158.88 2085.02 5.49Reach 383.3732 500 yr 43.77 43.24 40.13 0.14 0.16 118.51 250.46 2643.25 6.09Reach 383.3732 2007 45.36 44.65 41.13 0.14 0.15 128.99 430.71 3669.29 7.10
Reach 325 BR U 1.1 yr 38.13 37.49 37.33 1.11 0.07 37.90 416.00 6.43Reach 325 BR U 10 yr 40.85 39.32 39.32 1.40 0.16 55.88 27.10 1357.00 10.01Reach 325 BR U 25 yr 41.54 39.88 39.88 1.44 0.14 61.95 64.14 1653.16 10.53Reach 325 BR U 50 yr 42.00 40.26 40.26 1.46 0.12 64.29 104.38 1867.52 10.85Reach 325 BR U 100 yr 42.47 40.62 40.62 1.43 0.14 65.85 151.15 2092.75 11.26Reach 325 BR U 500 yr 43.47 41.37 41.37 1.25 0.26 69.59 277.35 2616.35 12.17Reach 325 BR U 2007 45.06 42.81 42.61 0.99 0.33 72.66 614.60 3485.40 12.86
Reach 325 BR D 1.1 yr 36.95 36.53 35.92 0.36 0.02 41.61 416.00 5.18Reach 325 BR D 10 yr 39.21 38.21 37.94 0.31 0.08 72.27 161.31 1222.79 8.46Reach 325 BR D 25 yr 39.76 38.57 38.35 0.32 0.11 72.30 240.82 1476.48 9.33Reach 325 BR D 50 yr 40.16 38.82 38.63 0.33 0.14 72.32 305.47 1666.43 9.93Reach 325 BR D 100 yr 40.58 39.20 38.92 0.30 0.15 72.35 392.75 1851.15 10.14Reach 325 BR D 500 yr 41.67 40.42 39.54 0.21 0.14 72.46 646.81 2246.89 9.80Reach 325 BR D 2007 43.73 42.59 40.56 0.14 0.13 72.64 1136.27 2963.73 9.47
Reach 290.5356 1.1 yr 36.57 35.98 35.83 0.58 0.01 52.01 416.00 6.13Reach 290.5356 10 yr 38.82 38.10 37.61 0.33 0.07 100.05 186.89 1194.34 2.87 7.25Reach 290.5356 25 yr 39.33 38.51 37.98 0.30 0.05 103.30 272.98 1436.16 8.16 7.82Reach 290.5356 50 yr 39.69 38.80 38.23 0.28 0.04 106.11 341.61 1616.13 14.16 8.19Reach 290.5356 100 yr 40.13 39.25 38.49 0.20 0.01 109.45 429.98 1789.76 24.16 8.20Reach 290.5356 500 yr 41.31 40.55 39.04 0.12 0.00 117.12 660.58 2177.61 55.51 7.82Reach 290.5356 2007 43.46 42.75 39.92 0.07 0.02 129.87 1077.33 2906.45 116.22 7.62
Reach 273.9258 1.1 yr 35.98 35.25 35.25 1.70 0.00 41.27 416.00 6.87Reach 273.9258 10 yr 38.42 37.03 37.03 0.50 0.32 79.50 1.35 1379.80 2.95 9.46Reach 273.9258 25 yr 38.98 37.63 37.63 0.35 0.32 106.32 42.80 1663.48 11.02 9.44Reach 273.9258 50 yr 39.37 38.05 37.93 0.30 0.32 108.81 88.71 1863.09 20.10 9.45Reach 273.9258 100 yr 39.91 38.91 38.21 0.25 0.23 116.63 182.43 2019.66 41.81 8.39Reach 273.9258 500 yr 41.19 40.41 38.84 0.15 0.17 127.30 357.44 2414.98 121.28 7.63Reach 273.9258 2007 43.38 42.72 39.86 0.09 0.14 136.77 645.09 3128.42 326.50 7.22

HEC-RAS Plan: Plan 24 River: Stream Reach: ReachReach River Sta Profile E.G. Elev W.S. Elev Crit W.S. Frctn Loss C & E Loss Top Width Q Left Q Channel Q Right Vel Chnl
(ft) (ft) (ft) (ft) (ft) (ft) (cfs) (cfs) (cfs) (ft/s)Reach 423.3771 1.1 yr 38.45 38.33 0.12 0.00 73.85 416.00 2.71Reach 423.3771 10 yr 41.21 40.99 0.09 0.01 109.13 19.88 1358.74 5.48 3.79Reach 423.3771 25 yr 41.90 41.65 0.09 0.01 116.13 41.56 1664.29 11.45 4.06Reach 423.3771 50 yr 42.37 42.10 0.09 0.01 119.67 61.46 1893.26 17.18 4.26Reach 423.3771 100 yr 42.85 42.55 0.09 0.01 123.21 84.83 2134.64 24.43 4.45Reach 423.3771 500 yr 44.11 43.79 0.08 0.02 132.84 157.23 2686.33 50.14 4.66Reach 423.3771 2007 45.74 45.33 0.08 0.03 149.10 295.13 3705.16 99.71 5.33
Reach 383.3732 1.1 yr 38.33 38.19 36.94 0.15 0.05 66.19 0.11 415.89 2.99Reach 383.3732 10 yr 41.11 40.80 38.41 0.14 0.12 101.54 56.46 1327.64 4.56Reach 383.3732 25 yr 41.80 41.44 38.83 0.13 0.13 107.40 91.89 1625.41 4.94Reach 383.3732 50 yr 42.27 41.87 39.14 0.13 0.13 109.82 123.32 1848.58 5.22Reach 383.3732 100 yr 42.74 42.31 39.44 0.13 0.14 112.36 158.88 2085.02 5.49Reach 383.3732 500 yr 44.01 43.53 40.13 120.42 263.14 2630.56 5.83Reach 383.3732 2007 45.63 44.98 41.15 131.57 446.37 3653.63 6.82
Reach 325 BR U 1.1 yr 38.13 37.49 37.33 1.11 0.07 37.90 416.00 6.43Reach 325 BR U 10 yr 40.85 39.32 39.32 1.40 0.16 55.88 27.10 1357.00 10.01Reach 325 BR U 25 yr 41.54 39.88 39.88 1.44 0.14 61.95 64.14 1653.16 10.53Reach 325 BR U 50 yr 42.00 40.26 40.26 1.45 0.13 64.29 104.38 1867.52 10.85Reach 325 BR U 100 yr 42.47 40.62 40.62 1.48 0.12 65.85 151.15 2092.75 11.26Reach 325 BR U 500 yr 44.03 42.99 41.37 72.67 452.22 2441.48 8.77Reach 325 BR U 2007 45.65 44.34 42.61 72.78 802.88 3297.12 9.96
Reach 325 BR D 1.1 yr 36.95 36.53 35.92 0.36 0.02 41.61 416.00 5.18Reach 325 BR D 10 yr 39.21 38.21 37.94 0.31 0.08 72.27 161.31 1222.79 8.46Reach 325 BR D 25 yr 39.76 38.57 38.35 0.32 0.11 72.30 240.82 1476.48 9.33Reach 325 BR D 50 yr 40.16 38.85 38.63 0.32 0.13 72.32 308.34 1663.57 9.85Reach 325 BR D 100 yr 40.56 39.11 38.92 0.32 0.16 72.35 382.52 1861.38 10.39Reach 325 BR D 500 yr 41.44 39.54 39.54 72.38 551.18 2342.52 11.98Reach 325 BR D 2007 42.92 40.56 40.56 72.47 935.54 3164.46 13.47
Reach 290.5356 1.1 yr 36.57 35.98 35.83 0.58 0.01 52.01 416.00 6.13Reach 290.5356 10 yr 38.82 38.10 37.61 0.33 0.07 100.05 186.89 1194.34 2.87 7.25Reach 290.5356 25 yr 39.33 38.51 37.98 0.30 0.05 103.30 272.98 1436.16 8.16 7.82Reach 290.5356 50 yr 39.70 38.83 38.23 0.29 0.06 106.41 344.39 1612.84 14.67 8.11Reach 290.5356 100 yr 40.08 39.16 38.49 0.28 0.06 109.03 422.06 1799.31 22.54 8.41Reach 290.5356 500 yr 40.90 39.84 39.04 0.27 0.07 112.08 609.60 2240.84 43.26 9.12Reach 290.5356 2007 42.21 40.86 39.92 0.26 0.07 119.26 962.23 3052.48 85.28 10.42
Reach 273.9258 1.1 yr 35.98 35.25 35.25 1.70 0.00 41.27 416.00 6.87Reach 273.9258 10 yr 38.42 37.03 37.03 1.37 0.05 79.50 1.35 1379.80 2.95 9.46Reach 273.9258 25 yr 38.98 37.63 37.63 1.18 0.00 106.32 42.80 1663.48 11.02 9.44Reach 273.9258 50 yr 39.36 37.93 37.93 1.17 0.03 108.11 77.75 1876.23 17.92 9.81Reach 273.9258 100 yr 39.74 38.21 38.21 1.17 0.04 109.96 117.62 2100.14 26.14 10.23Reach 273.9258 500 yr 40.57 38.84 38.84 1.12 0.06 115.88 226.92 2615.46 51.32 11.04Reach 273.9258 2007 41.88 39.86 39.86 1.07 0.06 125.27 454.16 3515.75 130.09 12.18

HEC-RAS Plan: Plan 24 River: Stream Reach: ReachReach River Sta Profile E.G. Elev W.S. Elev Crit W.S. Frctn Loss C & E Loss Top Width Q Left Q Channel Q Right Vel Chnl
(ft) (ft) (ft) (ft) (ft) (ft) (cfs) (cfs) (cfs) (ft/s)Reach 423.3771 1.1 yr 38.15 37.98 0.24 0.01 72.13 416.00 3.26Reach 423.3771 10 yr 40.45 40.10 0.19 0.01 95.78 7.24 1375.15 1.70 4.75Reach 423.3771 25 yr 41.02 40.62 0.19 0.02 103.51 17.31 1695.42 4.57 5.15Reach 423.3771 50 yr 41.44 41.00 0.19 0.02 109.26 28.53 1935.50 7.87 5.39Reach 423.3771 100 yr 41.87 41.39 0.18 0.02 114.08 44.98 2186.46 12.47 5.61Reach 423.3771 500 yr 42.87 42.34 0.17 0.02 121.52 100.39 2764.84 28.47 5.97Reach 423.3771 2007 44.69 44.12 0.13 0.02 135.52 239.38 3782.69 77.93 6.29
Reach 383.3732 1.1 yr 37.90 37.68 36.95 0.23 0.02 60.19 416.00 3.78Reach 383.3732 10 yr 40.24 39.75 38.40 0.17 0.03 90.98 24.71 1347.76 11.63 5.72Reach 383.3732 25 yr 40.81 40.24 38.82 0.18 0.04 96.30 49.31 1647.72 20.28 6.21Reach 383.3732 50 yr 41.23 40.61 39.11 0.18 0.05 99.85 73.03 1868.84 30.03 6.49Reach 383.3732 100 yr 41.67 41.00 39.42 0.18 0.05 103.42 100.97 2101.41 41.52 6.73Reach 383.3732 500 yr 42.68 41.95 40.09 0.16 0.06 110.27 176.80 2644.21 72.69 7.16Reach 383.3732 2007 44.54 43.74 41.07 0.12 0.06 121.91 338.23 3622.70 139.06 7.57
Reach 325 BR U 1.1 yr 37.66 37.24 36.97 0.67 0.04 53.69 416.00 5.15Reach 325 BR U 10 yr 40.04 39.23 38.50 0.58 0.04 70.46 14.72 1369.38 7.24Reach 325 BR U 25 yr 40.59 39.59 38.95 0.69 0.02 70.46 30.83 1686.47 8.07Reach 325 BR U 50 yr 41.01 39.91 39.28 0.73 0.00 70.46 47.25 1924.66 8.51Reach 325 BR U 100 yr 41.44 40.24 39.58 0.74 0.00 70.46 67.13 2176.77 8.90Reach 325 BR U 500 yr 42.47 41.15 40.23 0.65 0.00 72.46 127.55 2766.15 9.38Reach 325 BR U 2007 44.36 42.98 41.32 0.48 0.00 74.46 244.43 3855.57 9.67
Reach 325 BR D 1.1 yr 36.95 36.67 35.83 0.20 0.01 45.54 416.00 4.24Reach 325 BR D 10 yr 39.42 38.74 37.66 0.16 0.03 68.46 59.52 1314.29 10.29 6.76Reach 325 BR D 25 yr 39.88 38.94 38.11 0.21 0.05 68.46 79.95 1621.08 16.27 7.95Reach 325 BR D 50 yr 40.28 39.18 38.42 0.22 0.07 70.46 93.87 1854.76 23.27 8.63Reach 325 BR D 100 yr 40.69 39.46 38.75 0.23 0.09 70.46 117.76 2094.15 31.99 9.19Reach 325 BR D 500 yr 41.81 40.52 39.44 0.18 0.13 70.46 193.66 2637.12 62.92 9.51Reach 325 BR D 2007 43.88 42.51 40.53 0.12 0.17 74.46 324.46 3650.78 124.76 9.86
Reach 290.5356 1.1 yr 36.74 36.36 35.83 0.17 0.04 55.39 416.00 4.93Reach 290.5356 10 yr 39.22 38.66 37.69 0.13 0.02 104.70 158.36 1217.66 8.08 6.39Reach 290.5356 25 yr 39.62 38.84 38.09 0.17 0.03 106.48 210.27 1494.40 12.63 7.50Reach 290.5356 50 yr 39.98 39.11 38.35 0.18 0.03 108.77 262.54 1689.81 19.56 7.97Reach 290.5356 100 yr 40.37 39.43 38.63 0.18 0.02 110.25 323.18 1890.70 30.01 8.34Reach 290.5356 500 yr 41.51 40.64 39.24 0.13 0.02 117.75 504.83 2313.06 75.81 8.18Reach 290.5356 2007 43.59 42.80 40.17 0.08 0.02 130.05 834.17 3051.38 214.45 7.96
Reach 273.9258 1.1 yr 36.52 36.29 0.51 0.08 63.38 416.00 0.00 3.85Reach 273.9258 10 yr 39.07 38.59 0.38 0.06 113.48 68.61 1294.18 21.32 5.77Reach 273.9258 25 yr 39.42 38.74 0.45 0.03 114.94 93.45 1594.62 29.23 6.88Reach 273.9258 50 yr 39.78 39.00 0.50 0.04 117.46 122.92 1809.29 39.68 7.38Reach 273.9258 100 yr 40.17 39.31 0.39 0.05 120.48 159.29 2030.24 54.38 7.79Reach 273.9258 500 yr 41.36 40.56 0.22 0.11 127.90 282.79 2477.45 133.46 7.64Reach 273.9258 2007 43.49 42.76 0.12 0.12 137.17 512.44 3260.89 326.67 7.49
HEC-RAS Plan: Plan 24 River: Stream Reach: ReachReach River Sta Profile E.G. Elev W.S. Elev Crit W.S. Frctn Loss C & E Loss Top Width Q Left Q Channel Q Right Vel Chnl
(ft) (ft) (ft) (ft) (ft) (ft) (cfs) (cfs) (cfs) (ft/s)Reach 423.3771 1.1 yr 38.15 37.98 0.24 0.01 72.13 416.00 3.26Reach 423.3771 10 yr 40.45 40.10 0.19 0.01 95.78 7.24 1375.15 1.70 4.75Reach 423.3771 25 yr 41.02 40.62 0.19 0.02 103.51 17.31 1695.42 4.57 5.15Reach 423.3771 50 yr 41.44 41.00 0.19 0.02 109.26 28.53 1935.50 7.87 5.39Reach 423.3771 100 yr 41.87 41.39 0.18 0.02 114.06 44.90 2186.55 12.45 5.61Reach 423.3771 500 yr 43.16 42.70 0.13 0.02 124.36 115.43 2744.66 33.61 5.59Reach 423.3771 2007 44.72 44.15 0.13 0.02 135.79 240.84 3780.70 78.46 6.26
Reach 383.3732 1.1 yr 37.90 37.68 36.95 0.23 0.02 60.19 416.00 3.78Reach 383.3732 10 yr 40.24 39.75 38.40 0.17 0.03 90.98 24.71 1347.76 11.63 5.72Reach 383.3732 25 yr 40.81 40.24 38.83 0.18 0.04 96.30 49.31 1647.72 20.28 6.21Reach 383.3732 50 yr 41.23 40.61 39.11 0.18 0.05 99.85 73.03 1868.84 30.03 6.49Reach 383.3732 100 yr 41.67 41.00 39.42 0.18 0.05 103.39 100.85 2101.59 41.47 6.74Reach 383.3732 500 yr 43.01 42.39 40.09 112.94 194.84 2618.76 80.11 6.61Reach 383.3732 2007 44.57 43.77 41.06 122.19 339.62 3620.76 139.63 7.54
Reach 325 BR U 1.1 yr 37.66 37.24 36.97 0.67 0.04 53.69 416.00 5.15Reach 325 BR U 10 yr 40.04 39.23 38.50 0.58 0.04 70.46 14.72 1369.38 7.24Reach 325 BR U 25 yr 40.59 39.59 38.95 0.69 0.02 70.46 30.83 1686.47 8.07Reach 325 BR U 50 yr 41.01 39.91 39.28 0.73 0.00 70.46 47.25 1924.65 8.51Reach 325 BR U 100 yr 41.44 40.23 39.58 0.77 0.01 70.46 66.86 2177.04 8.92Reach 325 BR U 500 yr 42.96 42.01 40.23 74.46 144.33 2749.37 8.00Reach 325 BR U 2007 44.54 43.28 41.32 74.46 254.53 3845.47 9.25
Reach 325 BR D 1.1 yr 36.95 36.67 35.83 0.20 0.01 45.54 416.00 4.24Reach 325 BR D 10 yr 39.42 38.74 37.66 0.16 0.03 68.46 59.52 1314.29 10.29 6.76Reach 325 BR D 25 yr 39.88 38.94 38.11 0.21 0.05 68.46 79.95 1621.08 16.27 7.95Reach 325 BR D 50 yr 40.28 39.18 38.42 0.22 0.07 70.46 93.88 1854.75 23.27 8.63Reach 325 BR D 100 yr 40.66 39.37 38.75 0.25 0.09 70.46 114.56 2098.97 30.37 9.37Reach 325 BR D 500 yr 41.51 39.44 39.44 70.46 150.91 2702.02 40.77 11.91Reach 325 BR D 2007 43.12 40.53 40.53 70.46 275.05 3735.46 89.49 13.44
Reach 290.5356 1.1 yr 36.74 36.36 35.83 0.17 0.04 55.39 416.00 4.93Reach 290.5356 10 yr 39.22 38.66 37.69 0.13 0.02 104.70 158.36 1217.66 8.08 6.39Reach 290.5356 25 yr 39.62 38.84 38.09 0.17 0.03 106.48 210.27 1494.40 12.63 7.50Reach 290.5356 50 yr 39.98 39.11 38.35 0.18 0.03 108.77 262.55 1689.79 19.56 7.97Reach 290.5356 100 yr 40.32 39.33 38.63 0.19 0.02 109.79 315.59 1900.83 27.48 8.57Reach 290.5356 500 yr 41.07 39.75 39.24 0.24 0.01 111.65 443.85 2401.29 48.56 9.95Reach 290.5356 2007 42.38 40.62 40.17 0.30 0.02 117.63 713.86 3279.82 106.31 11.63
Reach 273.9258 1.1 yr 36.52 36.29 0.51 0.08 63.38 416.00 0.00 3.85Reach 273.9258 10 yr 39.07 38.59 0.38 0.06 113.48 68.61 1294.18 21.32 5.77Reach 273.9258 25 yr 39.42 38.74 0.45 0.03 114.94 93.45 1594.62 29.23 6.88Reach 273.9258 50 yr 39.78 39.00 0.50 0.04 117.47 122.94 1809.27 39.69 7.38Reach 273.9258 100 yr 40.11 39.19 0.53 0.03 119.33 152.08 2041.08 50.74 8.01Reach 273.9258 500 yr 40.81 39.53 0.63 0.00 122.56 221.58 2592.99 79.13 9.54Reach 273.9258 2007 42.06 40.08 39.92 0.79 0.12 126.05 364.38 3583.53 152.09 11.95

HEC-RAS Plan: Plan 24 River: Stream Reach: ReachReach River Sta Profile E.G. Elev W.S. Elev Crit W.S. Frctn Loss C & E Loss Top Width Q Left Q Channel Q Right Vel Chnl
(ft) (ft) (ft) (ft) (ft) (ft) (cfs) (cfs) (cfs) (ft/s)Reach 423.3771 1.1 yr 38.14 37.98 0.24 0.01 72.12 416.00 3.27Reach 423.3771 10 yr 40.41 40.05 0.20 0.02 95.03 6.71 1375.85 1.55 4.81Reach 423.3771 25 yr 41.01 40.60 0.20 0.02 103.29 17.04 1695.77 4.49 5.17Reach 423.3771 50 yr 41.43 40.99 0.19 0.02 109.16 28.37 1935.71 7.82 5.40Reach 423.3771 100 yr 41.87 41.39 0.18 0.02 114.09 45.04 2186.38 12.48 5.61Reach 423.3771 500 yr 42.85 42.31 0.17 0.02 121.31 99.22 2766.39 28.09 6.00Reach 423.3771 2007 44.65 44.08 0.13 0.02 135.07 237.01 3785.93 77.07 6.33
Reach 383.3732 1.1 yr 37.90 37.68 36.94 0.23 0.02 60.17 416.00 3.79Reach 383.3732 10 yr 40.19 39.68 38.40 0.19 0.04 90.11 22.89 1350.28 10.93 5.84Reach 383.3732 25 yr 40.80 40.21 38.83 0.19 0.04 96.08 48.39 1649.00 19.90 6.25Reach 383.3732 50 yr 41.23 40.60 39.11 0.18 0.05 99.77 72.64 1869.40 29.87 6.50Reach 383.3732 100 yr 41.67 41.01 39.42 0.18 0.05 103.44 101.07 2101.27 41.56 6.73Reach 383.3732 500 yr 42.66 41.92 40.09 0.17 0.06 110.06 175.29 2646.34 72.07 7.20Reach 383.3732 2007 44.50 43.68 41.07 0.13 0.06 121.48 336.03 3625.81 138.16 7.63
Reach 325 BR U 1.1 yr 37.65 37.23 36.97 0.73 0.04 53.67 416.00 5.21Reach 325 BR U 10 yr 39.96 39.06 38.50 0.77 0.01 68.88 10.94 1373.16 7.63Reach 325 BR U 25 yr 40.56 39.53 38.95 0.82 0.01 70.46 28.79 1688.51 8.20Reach 325 BR U 50 yr 41.00 39.88 39.28 0.83 0.02 70.46 46.35 1925.55 8.56Reach 325 BR U 100 yr 41.44 40.25 39.58 0.82 0.02 70.46 67.35 2176.55 8.89Reach 325 BR U 500 yr 42.43 41.08 40.23 0.71 0.00 72.46 124.79 2768.91 9.53Reach 325 BR U 2007 44.31 42.90 41.32 0.50 0.00 74.46 241.48 3858.52 9.79
Reach 325 BR D 1.1 yr 36.88 36.58 35.83 0.28 0.03 45.20 416.00 4.43Reach 325 BR D 10 yr 39.19 38.31 37.66 0.29 0.01 67.18 47.43 1331.63 5.04 7.63Reach 325 BR D 25 yr 39.73 38.61 38.11 0.31 0.00 68.46 69.45 1637.45 10.40 8.70Reach 325 BR D 50 yr 40.14 38.85 38.42 0.32 0.03 68.46 88.70 1866.33 16.87 9.35Reach 325 BR D 100 yr 40.59 39.17 38.75 0.30 0.08 70.46 106.28 2111.41 26.21 9.85Reach 325 BR D 500 yr 41.72 40.32 39.44 0.20 0.13 70.46 187.32 2646.77 59.61 9.87Reach 325 BR D 2007 43.81 42.40 40.53 0.12 0.18 74.46 320.99 3656.28 122.73 10.02
Reach 290.5356 1.1 yr 36.57 35.99 35.83 0.58 0.02 52.09 416.00 6.09Reach 290.5356 10 yr 38.88 37.90 37.69 0.42 0.04 98.80 102.28 1280.04 1.78 8.24Reach 290.5356 25 yr 39.42 38.30 38.09 0.37 0.03 101.32 166.89 1544.66 5.75 8.87Reach 290.5356 50 yr 39.80 38.59 38.35 0.35 0.03 104.05 219.46 1741.96 10.48 9.30Reach 290.5356 100 yr 40.22 39.04 38.63 0.25 0.02 108.32 292.90 1930.42 20.58 9.25Reach 290.5356 500 yr 41.39 40.43 39.24 0.14 0.02 116.35 493.16 2333.33 67.21 8.54Reach 290.5356 2007 43.51 42.69 40.17 0.08 0.02 129.60 830.09 3059.60 210.31 8.08
Reach 273.9258 1.1 yr 35.98 35.23 35.23 1.72 0.00 41.18 416.00 6.92Reach 273.9258 10 yr 38.42 36.99 36.99 0.51 0.34 77.96 1.15 1380.33 2.62 9.61Reach 273.9258 25 yr 39.02 37.59 37.59 0.36 0.35 106.08 23.83 1682.93 10.55 9.66Reach 273.9258 50 yr 39.42 37.95 37.91 0.31 0.37 108.19 53.00 1900.47 18.43 9.90Reach 273.9258 100 yr 39.95 38.84 0.26 0.26 115.96 129.47 2073.51 40.92 8.74Reach 273.9258 500 yr 41.22 40.35 0.15 0.20 127.06 271.67 2500.19 121.85 7.98Reach 273.9258 2007 43.41 42.66 0.09 0.17 136.18 508.49 3270.48 321.03 7.61

HEC-RAS Plan: Plan 24 River: Stream Reach: ReachReach River Sta Profile E.G. Elev W.S. Elev Crit W.S. Frctn Loss C & E Loss Top Width Q Left Q Channel Q Right Vel Chnl
(ft) (ft) (ft) (ft) (ft) (ft) (cfs) (cfs) (cfs) (ft/s)Reach 423.3771 1.1 yr 38.14 37.98 0.24 0.01 72.12 416.00 3.27Reach 423.3771 10 yr 40.41 40.05 0.20 0.02 95.03 6.71 1375.85 1.55 4.81Reach 423.3771 25 yr 41.01 40.60 0.20 0.02 103.29 17.04 1695.77 4.49 5.17Reach 423.3771 50 yr 41.43 40.99 0.19 0.02 109.15 28.37 1935.72 7.81 5.40Reach 423.3771 100 yr 41.87 41.40 0.18 0.02 114.11 45.14 2186.25 12.51 5.61Reach 423.3771 500 yr 43.16 42.70 0.13 0.02 124.35 115.39 2744.71 33.60 5.59Reach 423.3771 2007 44.72 44.15 0.13 0.02 135.79 240.84 3780.70 78.46 6.26
Reach 383.3732 1.1 yr 37.90 37.68 36.94 0.23 0.02 60.17 416.00 3.79Reach 383.3732 10 yr 40.19 39.68 38.40 0.19 0.04 90.11 22.89 1350.28 10.93 5.84Reach 383.3732 25 yr 40.80 40.21 38.83 0.19 0.04 96.08 48.39 1649.00 19.90 6.25Reach 383.3732 50 yr 41.23 40.60 39.11 0.18 0.05 99.76 72.62 1869.42 29.86 6.50Reach 383.3732 100 yr 41.67 41.01 39.40 0.17 0.05 103.48 101.23 2101.04 41.63 6.73Reach 383.3732 500 yr 43.01 42.39 40.09 112.93 194.79 2618.82 80.09 6.61Reach 383.3732 2007 44.57 43.77 41.06 122.19 339.62 3620.76 139.63 7.54
Reach 325 BR U 1.1 yr 37.65 37.23 36.97 0.73 0.04 53.67 416.00 5.21Reach 325 BR U 10 yr 39.96 39.06 38.50 0.77 0.01 68.88 10.94 1373.16 7.63Reach 325 BR U 25 yr 40.56 39.53 38.95 0.82 0.01 70.46 28.79 1688.51 8.20Reach 325 BR U 50 yr 40.99 39.88 39.28 0.83 0.02 70.46 46.31 1925.59 8.57Reach 325 BR U 100 yr 41.44 40.26 39.58 0.83 0.03 70.46 67.70 2176.20 8.87Reach 325 BR U 500 yr 42.96 42.01 40.23 74.46 144.28 2749.42 8.00Reach 325 BR U 2007 44.54 43.28 41.32 74.46 254.53 3845.47 9.25
Reach 325 BR D 1.1 yr 36.88 36.58 35.83 0.28 0.03 45.20 416.00 4.43Reach 325 BR D 10 yr 39.19 38.31 37.66 0.29 0.01 67.18 47.43 1331.63 5.04 7.63Reach 325 BR D 25 yr 39.73 38.61 38.11 0.31 0.00 68.46 69.45 1637.45 10.40 8.70Reach 325 BR D 50 yr 40.15 38.86 38.42 0.32 0.03 68.46 89.02 1865.82 17.06 9.32Reach 325 BR D 100 yr 40.58 39.11 38.75 0.32 0.07 70.46 103.89 2114.99 25.02 9.98Reach 325 BR D 500 yr 41.51 39.44 39.44 70.46 150.91 2702.02 40.77 11.91Reach 325 BR D 2007 43.12 40.53 40.53 70.46 275.05 3735.46 89.49 13.44
Reach 290.5356 1.1 yr 36.57 35.99 35.83 0.58 0.02 52.09 416.00 6.09Reach 290.5356 10 yr 38.88 37.90 37.69 0.42 0.04 98.80 102.28 1280.04 1.78 8.24Reach 290.5356 25 yr 39.42 38.30 38.09 0.37 0.03 101.32 166.89 1544.66 5.75 8.87Reach 290.5356 50 yr 39.80 38.61 38.35 0.36 0.03 104.25 221.34 1739.78 10.78 9.24Reach 290.5356 100 yr 40.19 38.95 38.63 0.34 0.04 107.47 284.62 1940.65 18.64 9.50Reach 290.5356 500 yr 41.04 39.64 39.24 0.32 0.04 111.18 435.14 2413.31 45.25 10.21Reach 290.5356 2007 42.39 40.66 40.17 0.31 0.04 117.90 717.00 3274.25 108.75 11.54
Reach 273.9258 1.1 yr 35.98 35.23 35.23 1.72 0.00 41.18 416.00 6.92Reach 273.9258 10 yr 38.42 36.99 36.99 1.40 0.07 77.96 1.15 1380.33 2.62 9.61Reach 273.9258 25 yr 39.02 37.59 37.59 1.21 0.03 106.08 23.83 1682.93 10.55 9.66Reach 273.9258 50 yr 39.42 37.91 37.91 1.19 0.06 107.99 50.53 1903.58 17.79 10.00Reach 273.9258 100 yr 39.82 38.20 38.20 1.19 0.07 109.84 80.86 2136.72 26.32 10.44Reach 273.9258 500 yr 40.68 38.87 38.87 1.13 0.08 116.22 169.29 2670.74 53.68 11.19Reach 273.9258 2007 42.05 39.93 39.93 1.07 0.09 125.51 351.69 3608.41 139.90 12.35