Embed Size (px)
Citation preview

KENCANA AGRI LIMITED (Registration Number: 200717793E)
1
UNAUDITED FINANCIAL STATEMENT ANNOUNCEMENT FOR THE FINANCIAL YEAR ENDED 31 DECEMBER 2015
1 (a) (i) Income statement (for the Group) together with a comparative statement for the corresponding period of the immediately preceding financial year.
Income Statement
2015 2014 Change
US$'000 US$'000 %
Revenue 131,844 176,504 -25%
Cost of sales (109,420) (136,413) -20%
Gross profit 22,424 40,091 -44%
5,614 6,976 -20%
Distribution costs (1,753) (2,953) -41%
Administrative expenses (9,908) (10,977) -10%
Other gains / (losses), net 66 (608) -111%
Operating profit 16,443 32,529 -49%
Loss on foreign exchange (16,722) (5,307) 215%
Loss on derivative financial instruments (2,013) (1,800) 12%
Financial income 2,981 2,582 15%
Financial expense (16,654) (12,503) 33%
(2,117) (2,338) -9%
(Loss)/Profit from continuing operation before income tax (18,082) 13,163 n/m
Income tax benefit/(expense) 1,037 (5,585) n/m
Net (loss)/profit for the period from continuing operation (17,045) 7,578 n/m
Loss from discontinued operation - (355) n/m
Net (loss)/profit for the period (17,045) 7,223 n/m
n/m : not meaningful
Jan - Dec
Gain from fair value changes of biological assets and other receivables,
net
Share of results of joint ventures
KENCANA AGRI LIMITED (Registration Number: 200717793E)
2
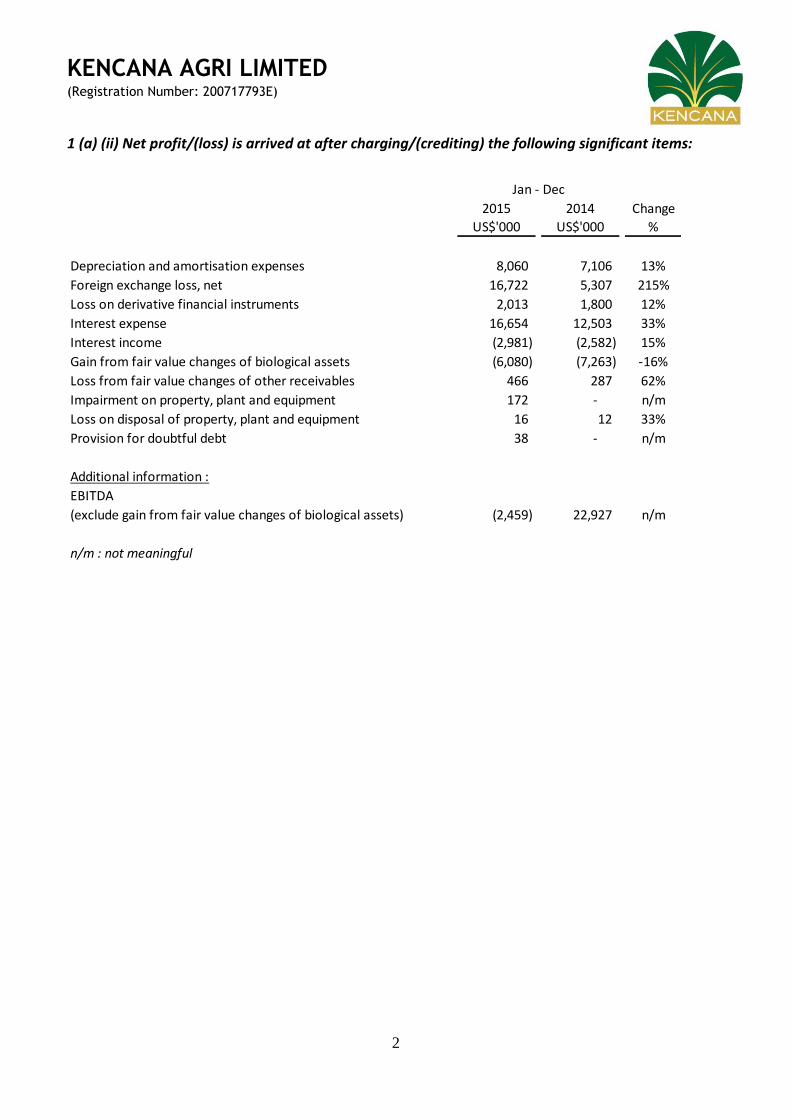
1 (a) (ii) Net profit/(loss) is arrived at after charging/(crediting) the following significant items:
2015 2014 Change
US$'000 US$'000 %
Depreciation and amortisation expenses 8,060 7,106 13%
Foreign exchange loss, net 16,722 5,307 215%
Loss on derivative financial instruments 2,013 1,800 12%
Interest expense 16,654 12,503 33%
Interest income (2,981) (2,582) 15%
(6,080) (7,263) -16%
466 287 62%
172 - n/m
Loss on disposal of property, plant and equipment 16 12 33%
Provision for doubtful debt 38 - n/m
Additional information :
(2,459) 22,927 n/m
n/m : not meaningful
Jan - Dec
EBITDA
(exclude gain from fair value changes of biological assets)
Gain from fair value changes of biological assets
Loss from fair value changes of other receivables
Impairment on property, plant and equipment
KENCANA AGRI LIMITED (Registration Number: 200717793E)
3
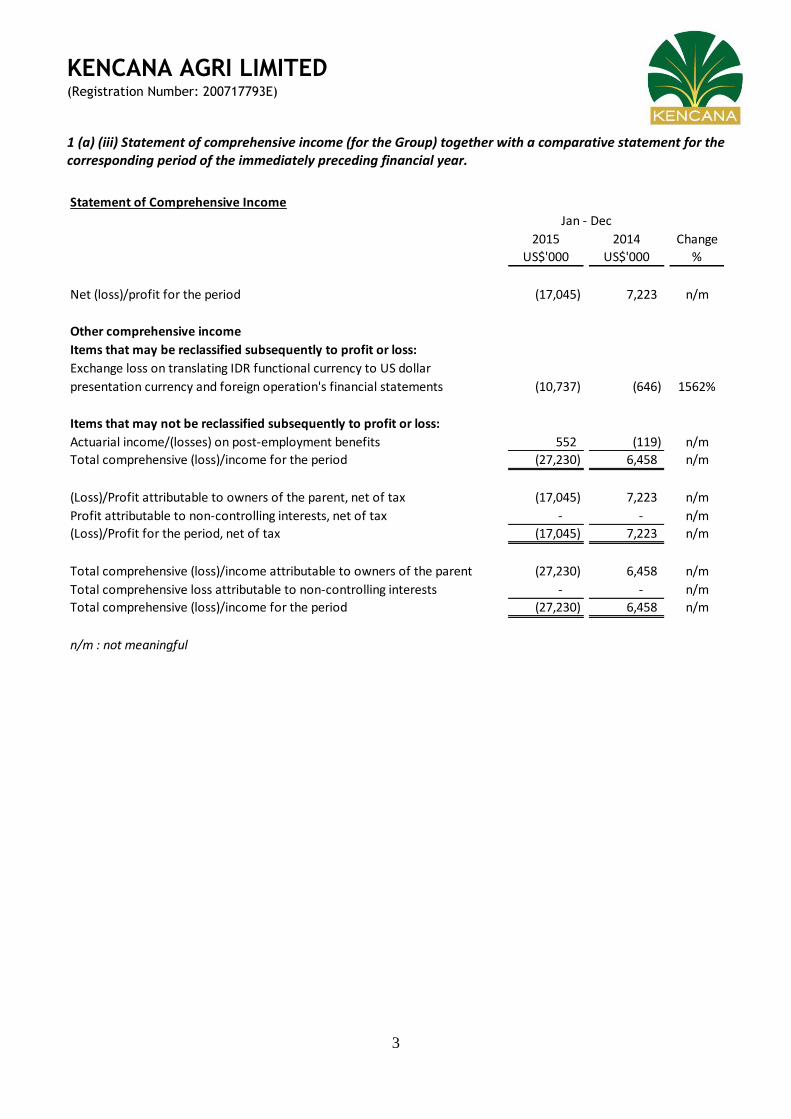
1 (a) (iii) Statement of comprehensive income (for the Group) together with a comparative statement for the corresponding period of the immediately preceding financial year.
Statement of Comprehensive Income
2015 2014 Change
US$'000 US$'000 %
Net (loss)/profit for the period (17,045) 7,223 n/m
Items that may be reclassified subsequently to profit or loss:
(10,737) (646) 1562%
Items that may not be reclassified subsequently to profit or loss:
Actuarial income/(losses) on post-employment benefits 552 (119) n/m
Total comprehensive (loss)/income for the period (27,230) 6,458 n/m
(Loss)/Profit attributable to owners of the parent, net of tax (17,045) 7,223 n/m
Profit attributable to non-controlling interests, net of tax - - n/m
(Loss)/Profit for the period, net of tax (17,045) 7,223 n/m
Total comprehensive (loss)/income attributable to owners of the parent (27,230) 6,458 n/m
Total comprehensive loss attributable to non-controlling interests - - n/m
Total comprehensive (loss)/income for the period (27,230) 6,458 n/m
n/m : not meaningful
Exchange loss on translating IDR functional currency to US dollar
presentation currency and foreign operation's financial statements
Jan - Dec
Other comprehensive income

KENCANA AGRI LIMITED (Registration Number: 200717793E)
4
1 (b) (i) A statement of financial position (for the issuer and group), together with a comparative statement as at the end of the immediately preceding financial year.
As at 31/12/2015 As at 31/12/2014 As at 31/12/2015 As at 31/12/2014
US$'000 US$'000 US$'000 US$'000
ASSETS
Current assets:
Cash and cash equivalents 8,687 14,124 724 952
Trade and other receivables 22,096 16,335 21,666 24,908
Inventories 11,161 11,729 - -
Other assets 8,814 11,382 2 -
Total current assets 50,758 53,570 22,392 25,860
Non-current assets:
Investments in subsidiaries - - 38,429 42,615
Investments in joint ventures 6,169 5,523 5,755 5,500
Other receivables 20,265 16,276 - -
Property, plant and equipment 90,985 96,767 - -
Investment property 2,430 2,460 - -
Biological assets 288,424 297,169 - -
Land use rights 35,301 38,386 - -
Other assets 761 844 - -
Total non-current assets 444,335 457,425 44,184 48,115
TOTAL ASSETS 495,093 510,995 66,576 73,975
LIABILITIES AND EQUITY
Current liabilities:
Income tax payables 1,867 2,334 - 3
Trade and other payables 52,984 53,977 2,074 2,162
Finance leases 422 1,235 - -
Other financial liabilities 49,720 40,435 - -
Total current liabilities 104,993 97,981 2,074 2,165
Non-current liabilities:
Trade and other payables 11,189 9,484 - -
Deferred tax liabilities 23,121 27,113 - -
Finance leases 188 598 - -
Other financial liabilities 206,265 198,868 - -
Other liabilities 3,832 4,216 - -
Total non-current liabilities 244,595 240,279 - -
Capital and reserves:
Share capital 93,860 93,860 93,860 93,860
Other reserves 2,485 2,485 - -
Retained earnings 123,245 139,733 (4,751) (4,487)
Translation reserves (74,085) (63,348) (24,607) (17,563)
Equity attributable to the owners of the parent 145,505 172,730 64,502 71,810
Non-controlling interests - 5 - -
Total equity 145,505 172,735 64,502 71,810
TOTAL LIABILITIES AND EQUITY 495,093 510,995 66,576 73,975
Group Company

KENCANA AGRI LIMITED (Registration Number: 200717793E)
5
1 (b) (ii) Aggregate amount of group’s borrowings and debt securities.
As at 31/12/2015 As at 31/12/2014
US$'000 US$'000
Amount due within one year
Secured 50,142 41,010
Unsecured - 660
Total 50,142 41,670
Amount due more than one year
Secured 206,453 199,466
Total 206,453 199,466
The unsecured borrowings are covered by corporate guarantees of the Company whereas the secured borrowings are secured by certain inventories, trade receivables, land rights, investment property, biological assets, and property, plant and equipment of the Group.
KENCANA AGRI LIMITED (Registration Number: 200717793E)
6
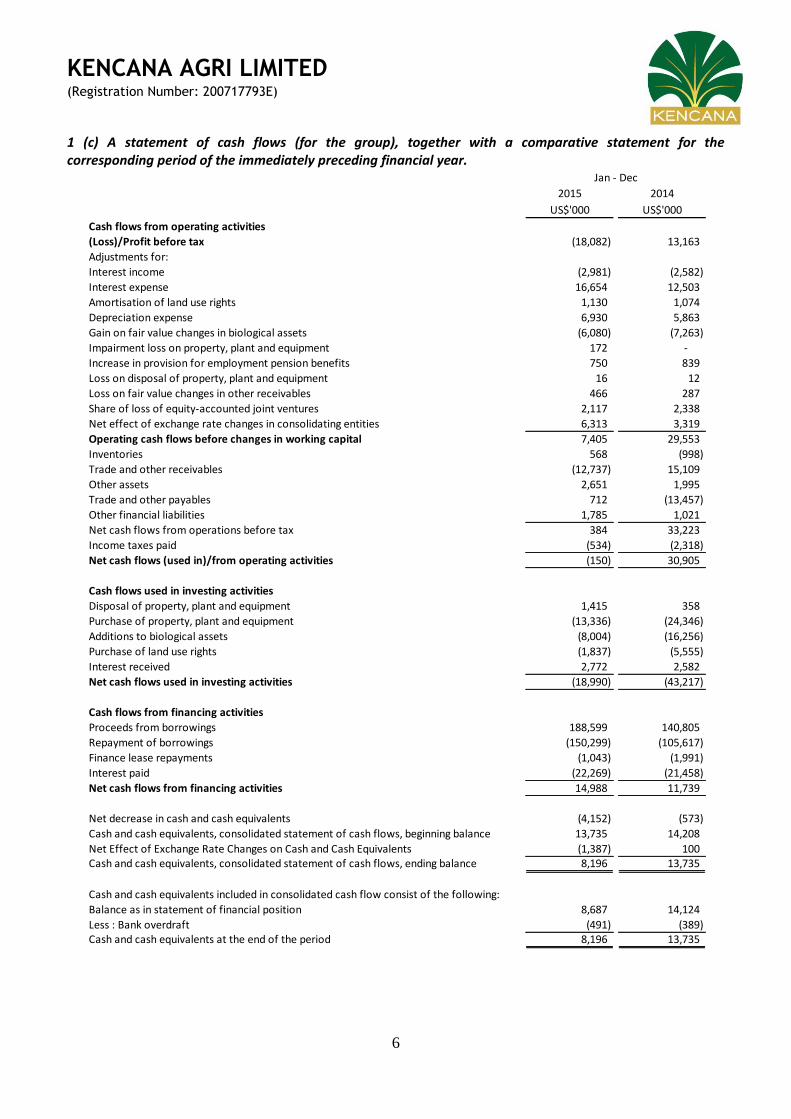
1 (c) A statement of cash flows (for the group), together with a comparative statement for the corresponding period of the immediately preceding financial year.
2015 2014
US$'000 US$'000
Cash flows from operating activities
(Loss)/Profit before tax (18,082) 13,163
Adjustments for:
Interest income (2,981) (2,582)
Interest expense 16,654 12,503
Amortisation of land use rights 1,130 1,074
Depreciation expense 6,930 5,863
Gain on fair value changes in biological assets (6,080) (7,263)
Impairment loss on property, plant and equipment 172 -
Increase in provision for employment pension benefits 750 839
Loss on disposal of property, plant and equipment 16 12
Loss on fair value changes in other receivables 466 287
Share of loss of equity-accounted joint ventures 2,117 2,338
Net effect of exchange rate changes in consolidating entities 6,313 3,319
Operating cash flows before changes in working capital 7,405 29,553
Inventories 568 (998)
Trade and other receivables (12,737) 15,109
Other assets 2,651 1,995
Trade and other payables 712 (13,457)
Other financial liabilities 1,785 1,021
Net cash flows from operations before tax 384 33,223
Income taxes paid (534) (2,318)
Net cash flows (used in)/from operating activities (150) 30,905
Cash flows used in investing activities
Disposal of property, plant and equipment 1,415 358
Purchase of property, plant and equipment (13,336) (24,346)
Additions to biological assets (8,004) (16,256)
Purchase of land use rights (1,837) (5,555)
Interest received 2,772 2,582
Net cash flows used in investing activities (18,990) (43,217)
Cash flows from financing activities
Proceeds from borrowings 188,599 140,805
Repayment of borrowings (150,299) (105,617)
Finance lease repayments (1,043) (1,991)
Interest paid (22,269) (21,458)
Net cash flows from financing activities 14,988 11,739
Net decrease in cash and cash equivalents (4,152) (573)
Cash and cash equivalents, consolidated statement of cash flows, beginning balance 13,735 14,208
Net Effect of Exchange Rate Changes on Cash and Cash Equivalents (1,387) 100 Cash and cash equivalents, consolidated statement of cash flows, ending balance 8,196 13,735
Cash and cash equivalents included in consolidated cash flow consist of the following:
Balance as in statement of financial position 8,687 14,124
Less : Bank overdraft (491) (389) Cash and cash equivalents at the end of the period 8,196 13,735
Jan - Dec

KENCANA AGRI LIMITED (Registration Number: 200717793E)
7
1 (d) (i) A statement (for the issuer and group) showing either (i) all changes in equity or (ii) changes in equity other than those arising from capitalisation issues and distributions to shareholders, together with a comparative statement for the corresponding period of the immediately preceding financial year.
GROUP Share Capital Retained Earnings Translation Reserves Other Reserves
Reserve on Post-
Employment
Benefit Total
Non-Controlling
Interests Total Equity
US$'000 US$'000 US$'000 US$'000 US$'000 US$'000 US$'000 US$'000
Balance as at 1/1/2015 93,860 139,733 (63,348) 2,485 - 172,730 5 172,735
Total comprehensive loss - (17,045) (10,737) - 552 (27,230) - (27,230)
Transferred to retained earnings - 552 - - (552) - - -
Acquisition of a non-controlling interest without
a change in control - 5 - - - 5 (5) -
Balance as at 31/12/2015 93,860 123,245 (74,085) 2,485 - 145,505 - 145,505
- - - - - - -
Balance as at 1/1/2014 93,860 132,629 (63,678) 2,628 - 165,439 105 165,544
Total comprehensive income - 7,223 (646) - (119) 6,458 - 6,458
Disposal of subsidiary with a change in control - - 976 (143) - 833 (100) 733
Transferred to retained earnings - (119) - - 119 - - -
Balance as at 31/12/2014 93,860 139,733 (63,348) 2,485 - 172,730 5 172,735
COMPANY Share Capital Retained Earnings Translation Reserves Total Equity
US$'000 US$'000 US$'000 US$'000
Balance as at 1/1/2015 93,860 (4,487) (17,563) 71,810
Total comprehensive loss - (264) (7,044) (7,308)
Balance as at 31/12/2015 93,860 (4,751) (24,607) 64,502
Balance as at 1/1/2014 93,860 994 (16,389) 78,465
Total comprehensive (loss)/income - (5,481) (1,174) (6,655)
Balance as at 31/12/2014 93,860 (4,487) (17,563) 71,810

KENCANA AGRI LIMITED (Registration Number: 200717793E)
8
1 (d) (ii) Details of any changes in the company's share capital arising from rights issue, bonus issue, share buy-backs, exercise of share options or warrants, conversion of other issues of equity securities, issue of shares for cash or as consideration for acquisition or for any other purpose since the end of the previous period reported on. State also the number of shares that may be issued on conversion of all the outstanding convertibles, as well as the number of shares held as treasury shares, if any, against the total number of issued shares excluding treasury shares of the issuer, as at the end of the current financial period reported on and as at the end of the corresponding period of the immediately preceding financial year.
Pursuant to an EGM of the Company held on 17 December 2015, the Company has completed the consolidation of every four existing share in the capital of the Company held by shareholders of the Company into one ordinary share effective at 9:00 am on 29 December 2015. As a result of the completion of the share consolidation exercise, the number of ordinary shares of the Company is now 287,011,177. 1 (d) (iii) To show the total number of issued shares excluding treasury shares as at the end of the current financial period and as at the end of the immediately preceding year.
Total number of issued shares (the Company has not held any treasury shares):
As at 31 December 2015 As at 31 December 2014
287,011,177 1,148,044,720
1 (d) (iv) A statement showing all sales, transfers, disposal, cancellation and/or use of treasury shares as at the end of the current financial period reported on.
Not applicable. 2. Whether the figures have been audited or reviewed and in accordance with which auditing standard or practice.
The financial statements have not been audited or reviewed by the auditors. 3. Where the figures have been audited or reviewed, the auditors’ report (including any qualifications or emphasis of a matter).
Not applicable.

KENCANA AGRI LIMITED (Registration Number: 200717793E)
9
4. Whether the same accounting policies and methods of computation as in the issuer’s most recently audited annual financial statements have been applied.
The same accounting policies and methods of computation have been applied in these unaudited financial statements as those applied in the most recently audited financial statements as at 31 December 2014, except for the adoption of the new revised FRS which became effective for the financial year beginning on or after 1 January 2015. The adoption of the new and revised FRS (including its consequential amendments) and interpretations have no significant impact on the Group’s and the Company’s financial statements. 5. If there are any changes in the accounting policies and methods of computation, including any required by an accounting standard, what has changed, as well as the reasons for, and the effect of the change.
Not applicable. 6. Earnings per ordinary share of the group for the current financial period reported on and the corresponding period of the immediately preceding financial year, after deducting any provision for preference dividends.
2015 2014
US Cents US Cents
(Loss)/earnings per share for the period
(a) based on weighted average number of shares (5.94) 2.52
(b) based on a fully diluted basis (5.94) 2.52
Weighted number of shares 287,011,177 287,011,177
Jan - Dec
The Company has consolidated 4 ordinary shares into 1 ordinary share in the capital of the Company and the number
of ordinary shares in issue used for the calculation of net asset value per ordinary share as at 31 December 2014 has
been adjusted for the effect of the Share Consolidation. 7. Net asset value (for the issuer and group) per ordinary share based on the total number of issued shares excluding treasury shares of the issuer at the end of the (a) current financial period reported on and (b) immediately preceding financial year.
As at 31/12/2015 As at 31/12/2014 As at 31/12/2015 As at 31/12/2014
US Cents US Cents US Cents US Cents
Net asset value per ordinary share 50.70 60.18 22.47 25.02
Number of shares outstanding 287,011,177 287,011,177 287,011,177 287,011,177
Group Company
The Company has consolidated 4 ordinary shares into 1 ordinary share in the capital of the Company and the number of
ordinary shares in issue used for the calculation of net asset value per ordinary share as at 31 December 2014 has been
adjusted for the effect of the Share Consolidation.
KENCANA AGRI LIMITED (Registration Number: 200717793E)
10
8. A review of the performance of the group, to the extent necessary for a reasonable understanding of the group’s business. It must include a discussion of the following (a) any significant factors that affected the turnover, costs, and earnings of the group for the current financial period reported on, including (where applicable) seasonal or cyclical factors; and (b) any material factors that affected the cash flow, working capital, assets or liabilities of the group during the current financial period reported on.
Review of financial performance
Revenue and profit
The Group’s revenue decreased by 25% from US$176.5 million in 2014 to US$131.8 million in 2015. The decrease was mainly due lower Average Selling Price (“ASP”) of CPO. Sales volume of CPO increased approximately 8% from 210,657 MT to 226,915 MT and ASP of CPO decreased from US$708 in 2014 to US$511 in 2015. The increase in the volume was mainly due to higher CPO production as a result of higher FFB produced for the year. The Group’s Operating Profit (“OP”) for 2015 decreased from US$32.5 million in 2014 to US$16.4 million and Net Profit After Tax (“NPAT”) decreased from US$7.2 million to a loss of US$17.0 million. The decrease in OP this year was mainly due to a significant drop in the ASP in 2015 as compared to 2014. The decrease in NPAT was similarly due to lower ASP for the year, higher foreign exchange loss in 2015 of US$16.7 million as compared to US$5.3 million in 2014 mainly due to the larger adverse movement of IDR against the USD and higher interest income, offset by higher interest expense. The increase in interest expense was mainly due to additional loans and interests expensed instead of capitalised in the biological assets as more trees matured. Included in the tax income for the year were the reversal of deferred tax assets and current year tax losses not carried forward. Cost of operation
Total cost of sales decreased by 20% from US$136.4 million in 2014 to US$109.4 million in 2015. The decrease was mainly due to the higher FFB harvested from nucleus plantation and CPO production from own mills which led to lower production cost per unit and less purchases made from third parties as compared to 2014. Gross profit margin decreased from 23% in 2014 to 17% in 2015 is mainly due to drop in ASP in 2015 as mentioned above. The Group recorded a decrease in distribution costs mainly due to the weakening of IDR against the USD conversion and less quality claims in 2015. Administrative expense also decreased due to the weakening of the IDR against the USD during the year. There is an unrealised loss on cross currency swap contracts of US$2.0 million (2014: US$1.6 million). These derivatives are used to hedge significant future cash flows. The group does not enter into derivative contracts other than for the purpose of hedging.

KENCANA AGRI LIMITED (Registration Number: 200717793E)
11
Review of financial position
The Group
Shareholders’ equity decreased from US$172.7 million as at 31 December 2014 to US$145.5 million as at 31 December 2015 mainly due to net loss for the financial year of US$17.0 million and the adverse movement in foreign translation reserve amounting to US$10.7 million. As at 31 December 2015, the Group’s total current assets decreased by US$2.8 million from US$53.6 million to US$50.8 million. Save for the movement in cash and cash equivalents as explained in cash flow section below, the movement in current assets arose due to adverse foreign exchange movement in IDR against USD and the followings:
a) Increase in trade and other receivables amounting to US$5.8 million mainly as a result of higher production and therefore sales volume towards the end of 2015 as compared to 2014;
b) Decrease in other assets amounting to US$2.6 million as a result of reclassification of prepayments to and property, plant and equipment upon realisation during the year.
Total non-current assets as at 31 December 2015 decreased by US$13.1 million from US$457.4 million to US$444.3 million. This was mainly due to adverse foreign exchange movement in IDR against USD and the followings:
a) Decrease of US$8.7 million in the value of the biological assets, attributable mainly to adverse translation from IDR to USD, partially offset by expenditure incurred on new planting and on the maintenance of immature plantations, gain of fair value changes and capitalisation of interest and depreciation;
b) Decrease of US$3.1 million in land use rights as a result of costs amortization charge for the year and the foreign exchange movement as mentioned above;
c) Decrease of US$5.8 million in property, plant and equipment. This was mainly due to depreciation charges of US$8.2 million and offset by additions of US$13.3 million during the year as well as foreign exchange movement.
As at 31 December 2015, the Group’s total current liabilities increased by US$7.0 million from US$98.0 million
to US$105.0 million. This was mainly due to the increase in financial liabilities of US$9.3 million as a result of
additional financing as well as reclassification of long term liabilities to short term liabilities.
Total non-current liabilities as at 31 December 2015 increased by US$4.3 million from US$240.3 million to
US$244.6 million. This was mainly due to the increase of long-term borrowings by US$7.4 million offset by the
reclassification of some long term liabilities to short term liabilities.
The Group reported negative working capital of US$54 million as of end of December 2015. This is mainly due
to a portion of borrowings used to invest in plantation assets.

KENCANA AGRI LIMITED (Registration Number: 200717793E)
12
Review of Group Cash flow
The closing cash and cash equivalents of the Group decreased by US$5.5 million from US$13.7 million as at 31 December 2014 to US$8.2 million as at 31 December 2015. The decrease was mainly due to net cash outflows to operating and investing activities offset by cash generated from financing activities.
The Group operating cash flow decreased from operating cash inflow to outflow mainly due to due to increase in trade and other receivables as compared to 2014. The Group reported net cash out flows from investing activities of US$19.0 million mainly due to additions to property, plant and equipment, biological assets and offset by proceeds received from disposal of plant and equipment and interest received.
Net cash flows from financing activities were positive US$15.0 million mainly due to proceeds from borrowings offset by principal and interests payments.

KENCANA AGRI LIMITED (Registration Number: 200717793E)
13
9. Where a forecast, or a prospect statement, has been previously disclosed to shareholders, any variance between it and the actual results.
Not applicable. 10. A commentary at the date of the announcement of the significant trends and competitive conditions of the industry in which the group operates and any known factors or events that may affect the group in the next reporting period and the next 12 months. 2015 was a challenging year for the palm oil industry. We expect the challenges to continue into 2016 with the impact of El Niño affecting production and weak crude oil and other vegetable oils prices limiting recovery of CPO prices in the short term. Although demand has slowed down, the palm oil industry remains fundamentally sound. Over time, demand will be supported by global growth in consumption. Our focus will remain on productivity improvements, cost control and operational efficiency.
11. Dividend
(a) Current Financial Period Reported On Nil
(b) Corresponding Period of the Immediately Preceding Financial Year Nil
(c) Date payable Not applicable.
(d) Books closure date Not applicable.
12. If no dividend has been declared/recommended, a statement to that effect.
No dividend has been declared or recommended for the financial year ended 31 December 2015.
KENCANA AGRI LIMITED (Registration Number: 200717793E)
14
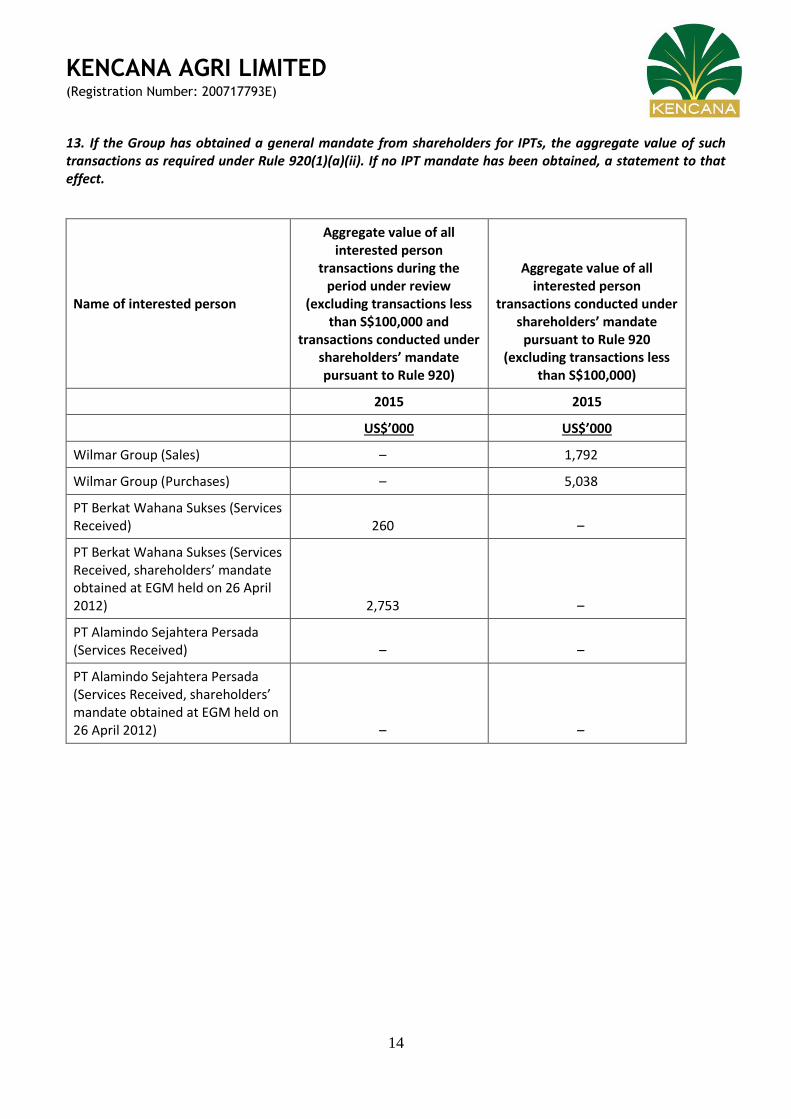
13. If the Group has obtained a general mandate from shareholders for IPTs, the aggregate value of such transactions as required under Rule 920(1)(a)(ii). If no IPT mandate has been obtained, a statement to that effect.
Name of interested person
Aggregate value of all interested person
transactions during the period under review
(excluding transactions less than S$100,000 and
transactions conducted under shareholders’ mandate pursuant to Rule 920)
Aggregate value of all interested person
transactions conducted under shareholders’ mandate
pursuant to Rule 920 (excluding transactions less
than S$100,000)
2015 2015
US$’000 US$’000
Wilmar Group (Sales) – 1,792
Wilmar Group (Purchases) – 5,038
PT Berkat Wahana Sukses (Services Received) 260 –
PT Berkat Wahana Sukses (Services Received, shareholders’ mandate obtained at EGM held on 26 April 2012) 2,753 –
PT Alamindo Sejahtera Persada (Services Received) – –
PT Alamindo Sejahtera Persada (Services Received, shareholders’ mandate obtained at EGM held on 26 April 2012) – –
KENCANA AGRI LIMITED (Registration Number: 200717793E)
15
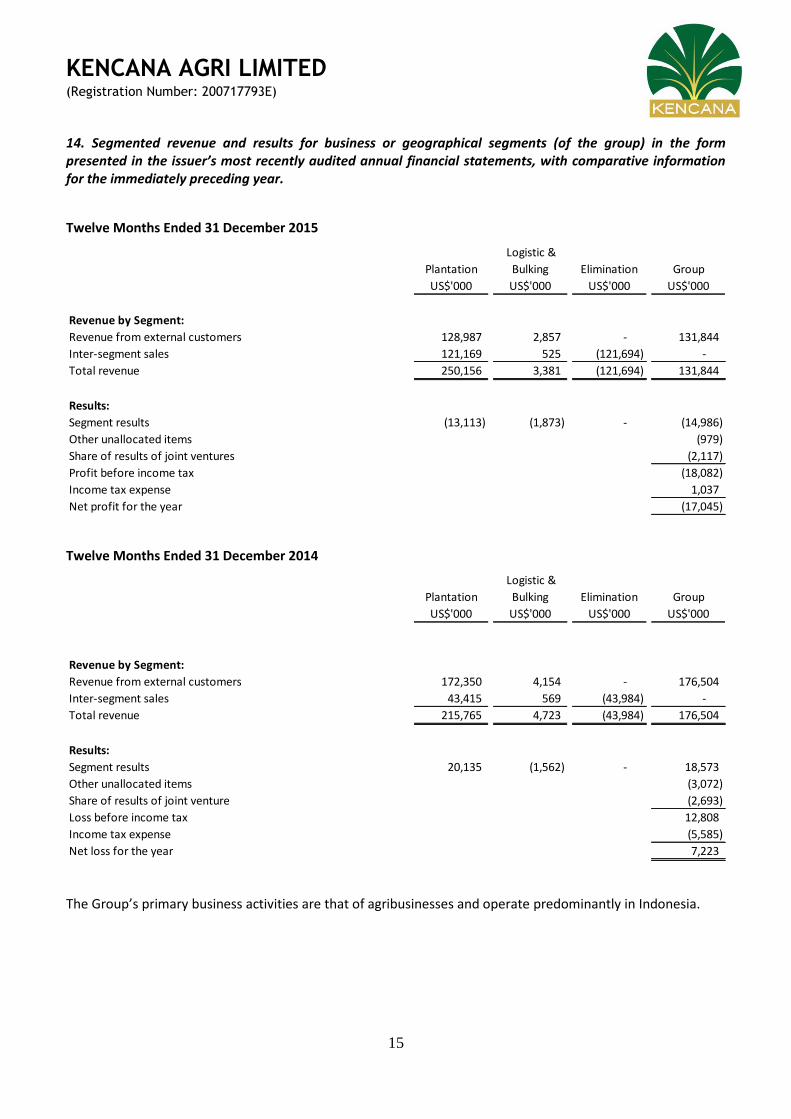
14. Segmented revenue and results for business or geographical segments (of the group) in the form presented in the issuer’s most recently audited annual financial statements, with comparative information for the immediately preceding year.
Twelve Months Ended 31 December 2015
Plantation
Logistic &
Bulking Elimination Group
US$'000 US$'000 US$'000 US$'000
Revenue by Segment:
Revenue from external customers 128,987 2,857 - 131,844
Inter-segment sales 121,169 525 (121,694) -
Total revenue 250,156 3,381 (121,694) 131,844
Results:
Segment results (13,113) (1,873) - (14,986)
Other unallocated items (13,113) (979)
Share of results of joint ventures (2,117)
Profit before income tax (18,082)
Income tax expense 1,037
Net profit for the year (17,045)
Twelve Months Ended 31 December 2014
Plantation
Logistic &
Bulking Elimination Group
US$'000 US$'000 US$'000 US$'000
Revenue by Segment:
Revenue from external customers 172,350 4,154 - 176,504
Inter-segment sales 43,415 569 (43,984) -
Total revenue 215,765 4,723 (43,984) 176,504
Results:
Segment results 20,135 (1,562) - 18,573
Other unallocated items (3,072)
Share of results of joint venture (2,693)
Loss before income tax 12,808
Income tax expense (5,585)
Net loss for the year 7,223
The Group’s primary business activities are that of agribusinesses and operate predominantly in Indonesia.
KENCANA AGRI LIMITED (Registration Number: 200717793E)
16
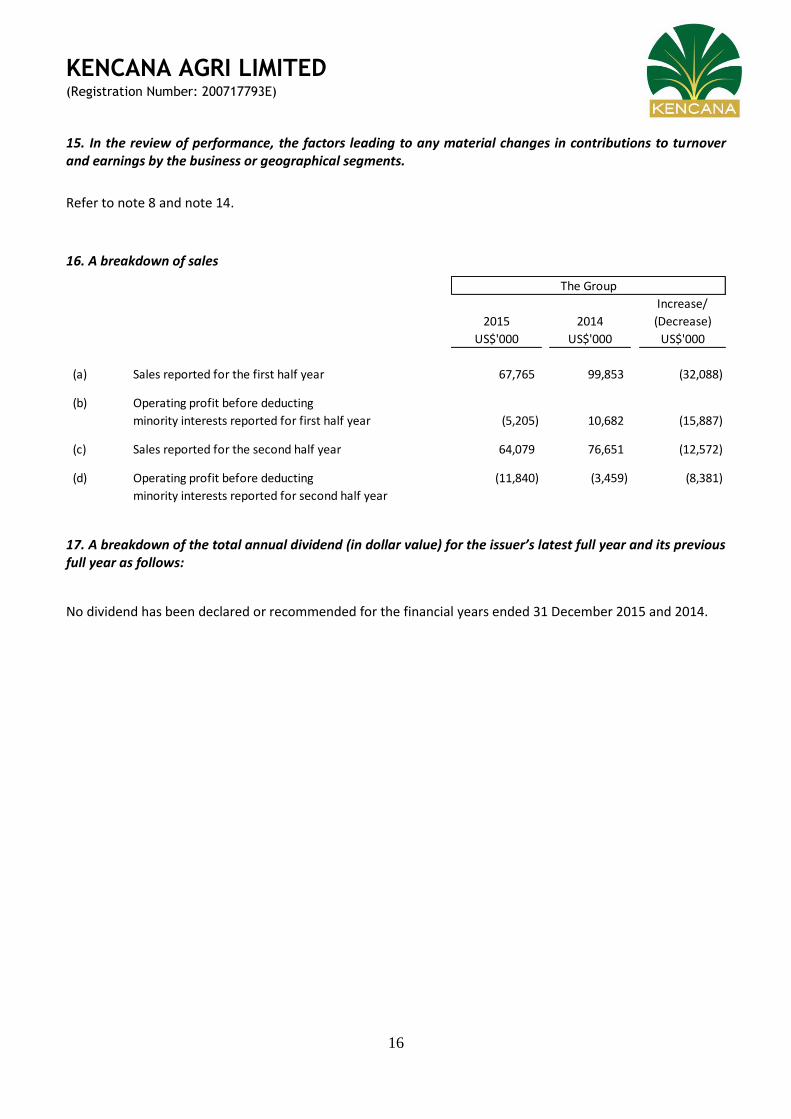
15. In the review of performance, the factors leading to any material changes in contributions to turnover and earnings by the business or geographical segments.
Refer to note 8 and note 14.
16. A breakdown of sales
Increase/
2015 2014 (Decrease)
US$'000 US$'000 US$'000
(a) Sales reported for the first half year 67,765 99,853 (32,088)
(b) Operating profit before deducting
minority interests reported for first half year (5,205) 10,682 (15,887)
(c) Sales reported for the second half year 64,079 76,651 (12,572)
(d) Operating profit before deducting (11,840) (3,459) (8,381)
minority interests reported for second half year
The Group
17. A breakdown of the total annual dividend (in dollar value) for the issuer’s latest full year and its previous full year as follows:
No dividend has been declared or recommended for the financial years ended 31 December 2015 and 2014.
KENCANA AGRI LIMITED (Registration Number: 200717793E)
17
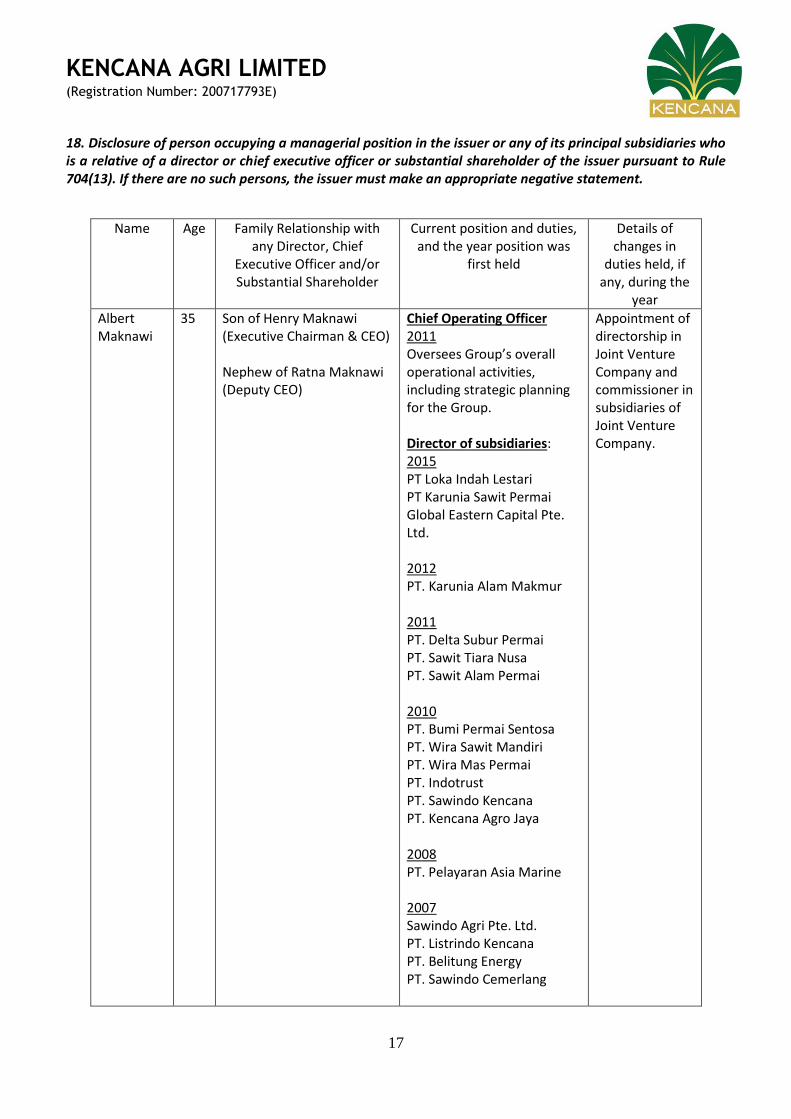
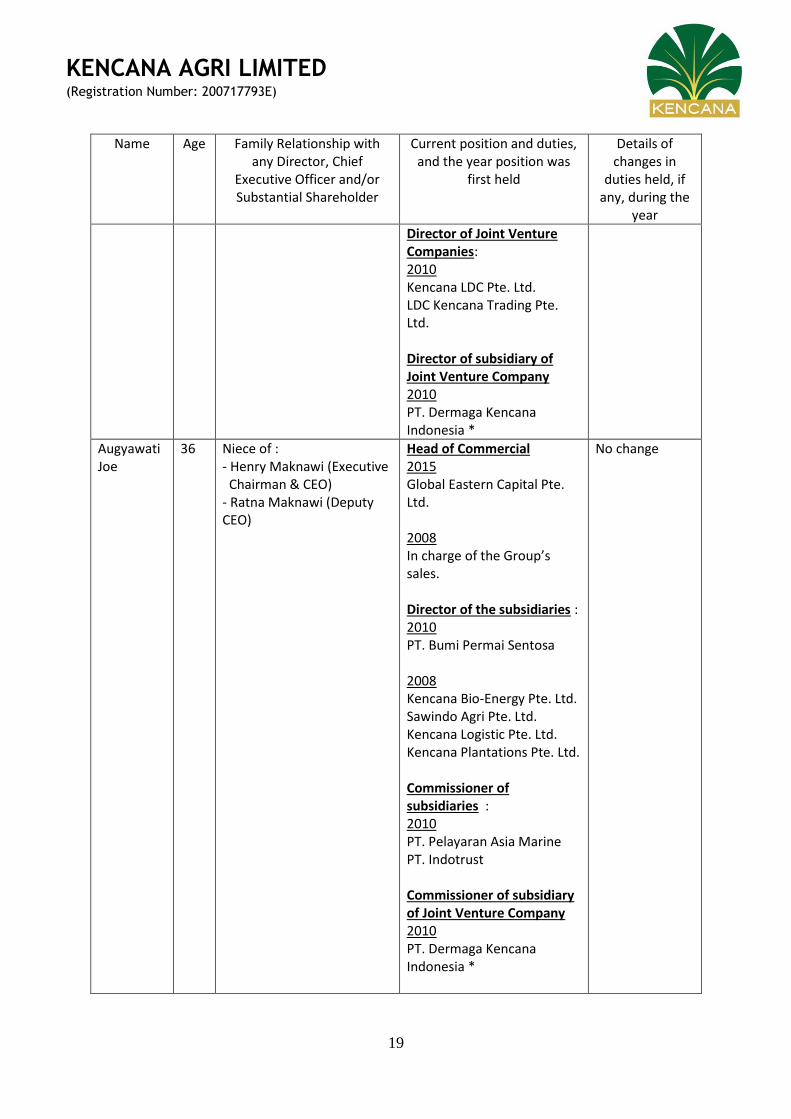
18. Disclosure of person occupying a managerial position in the issuer or any of its principal subsidiaries who is a relative of a director or chief executive officer or substantial shareholder of the issuer pursuant to Rule 704(13). If there are no such persons, the issuer must make an appropriate negative statement.
Name Age Family Relationship with any Director, Chief
Executive Officer and/or Substantial Shareholder
Current position and duties, and the year position was
first held
Details of changes in
duties held, if any, during the
year
Albert Maknawi
35 Son of Henry Maknawi (Executive Chairman & CEO) Nephew of Ratna Maknawi (Deputy CEO)
Chief Operating Officer 2011 Oversees Group’s overall operational activities, including strategic planning for the Group. Director of subsidiaries: 2015 PT Loka Indah Lestari PT Karunia Sawit Permai Global Eastern Capital Pte. Ltd. 2012 PT. Karunia Alam Makmur 2011 PT. Delta Subur Permai PT. Sawit Tiara Nusa PT. Sawit Alam Permai 2010 PT. Bumi Permai Sentosa PT. Wira Sawit Mandiri PT. Wira Mas Permai PT. Indotrust PT. Sawindo Kencana PT. Kencana Agro Jaya 2008 PT. Pelayaran Asia Marine 2007 Sawindo Agri Pte. Ltd. PT. Listrindo Kencana PT. Belitung Energy PT. Sawindo Cemerlang
Appointment of directorship in Joint Venture Company and commissioner in subsidiaries of Joint Venture Company.

KENCANA AGRI LIMITED (Registration Number: 200717793E)
18
Name Age Family Relationship with any Director, Chief
Executive Officer and/or Substantial Shareholder
Current position and duties, and the year position was
first held
Details of changes in
duties held, if any, during the
year
Director of Joint Venture Companies: 2014 Kencana Bio-Energy Pte. Ltd. 2010 Kencana LDC Pte. Ltd. LDC Kencana Trading Pte. Ltd. Director of subsidiary of Joint Venture Company 2014 PT. Cahaya Permata Gemilang 2010 PT. Dermaga Kencana Indonesia * Commissioner of subsidiaries of Joint Venture Company: 2014 PT. Energy Cipta Usaha PT. Energy Karya Persada
Ajis Chandra
52 Brother-in-law of Henry Maknawi (Executive Chairman & CEO) Husband of Ratna Maknawi (Deputy CEO)
Head of Bulking & Logistics 2002 In charge of managing the bulking & logistics segment of the Group’s operations. Director of subsidiaries : 2010 PT. Bumi Permai Sentosa 2007 Kencana Logistics Pte. Ltd. 2003 PT. Pelayaran Asia Marine 2002 PT. Indotrust
No change
KENCANA AGRI LIMITED (Registration Number: 200717793E)
19
Name Age Family Relationship with any Director, Chief
Executive Officer and/or Substantial Shareholder
Current position and duties, and the year position was
first held
Details of changes in
duties held, if any, during the
year
Director of Joint Venture Companies: 2010 Kencana LDC Pte. Ltd. LDC Kencana Trading Pte. Ltd. Director of subsidiary of Joint Venture Company 2010 PT. Dermaga Kencana Indonesia *
Augyawati Joe
36 Niece of : - Henry Maknawi (Executive Chairman & CEO) - Ratna Maknawi (Deputy CEO)
Head of Commercial 2015 Global Eastern Capital Pte. Ltd. 2008 In charge of the Group’s sales. Director of the subsidiaries : 2010 PT. Bumi Permai Sentosa 2008 Kencana Bio-Energy Pte. Ltd. Sawindo Agri Pte. Ltd. Kencana Logistic Pte. Ltd. Kencana Plantations Pte. Ltd. Commissioner of subsidiaries : 2010 PT. Pelayaran Asia Marine PT. Indotrust Commissioner of subsidiary of Joint Venture Company 2010 PT. Dermaga Kencana Indonesia *
No change

KENCANA AGRI LIMITED (Registration Number: 200717793E)
20
Name Age Family Relationship with any Director, Chief
Executive Officer and/or Substantial Shareholder
Current position and duties, and the year position was
first held
Details of changes in
duties held, if any, during the
year
Eddy Maknawi
53 Brother of Henry Maknawi (Executive Chairman & CEO) Brother of Ratna Maknawi (Deputy CEO)
Head of Procurement 2008 in charge of the Group’s procurement.
Director of subsidiaries : 2015 PT Mentari Bangun Persada PT Loka Indah Lestari PT Karunia Sawit Permai
2010 PT. Sawit Permai Lestari PT. Wira Palm Mandiri PT. Sawindo Kencana PT. Kencana Agro Jaya PT. Sawit Kaltim Lestari PT. Agro Eastborneo Kencana PT. Agrojaya Tirta Kencana PT. Indotrust PT. Pelayaran Asia Marine PT. Agro Sawitmas Lestari
2004 PT. Agro Inti Kencanamas
1997 PT. Alamraya Kencana Mas
Commissioner of subsidiaries : 2011 PT Sawit Alam Permai
2010 PT. Wira Mas Permai PT. Palm Makmur Sentosa PT. Langgeng Nusa Makmur PT. Listrindo Kencana PT. Belitung Energy PT. Agro Mas Lestari
No change

KENCANA AGRI LIMITED (Registration Number: 200717793E)
21
Name Age Family Relationship with any Director, Chief
Executive Officer and/or Substantial Shareholder
Current position and duties, and the year position was
first held
Details of changes in
duties held, if any, during the
year
2007 PT. Sawindo Cemerlang PT. Wira Sawit Mandiri
* Resigned with effect from 15 January 2016
BY ORDER OF THE BOARD
Kent Surya Finance Director 29 February 2016