Embed Size (px)
Citation preview

OAK RIDGE NATIONAL LABORATORY
DATE: June 14, 1956
Oporated By kasa-~
UNION CARBIDE NUCLEAR COMPANY
1 m - POST OFFICE BOX P CENTRAL FILES NUMBER OAK RIDGE, TENNESSEE I I
SUBJECT:
Report of Capper Decontamination Work at Federated Metals i n St. Louis
TO: J . E . Cunning ham
FROM: E..S. Bomar
- - -- _ - - 8 ' . , + . I ; ; ; k . L . . , :-. ' , . ~ q ; r - - - 7 2 . -;-Tr?---a
L E G A L N Q T I C E 1 This "*an waa pmpamd rr an acwn t of Government g a o m d work. Nei lk r the
United States, nor the Cogmidon, nor any penom acting on behalf.of the Comrnissionr
A. k k e s any warmnty or mpmntation, exp- or implied, with mspect to the ac- CU~CY, cornpletenau, or.u~efulmp of thiinforwtkn conto id in 9hb laport, or that the uce of a ny information, apparatus, method, or pmcan d i s c i d in this mport may not in- f r i m privately owned righb; or
B. A u u m any liabilities with respect to the use of, or for damages msulting from the use of any infonmtion, apparatus, method, or pmcw disclosed in this mport.
k used in tha above, "person acting on behalf of the Commission" includes any em- p l o y ~ or contmctor of tha Cammission to the extent that such enployw or contmctor pmpams, handles or distributes, or pmvipkr access to, any information pumuant to his am- ployment or contract with t h Commission.
- -- - 'i . -
Photoftat Price S 3- 3 d Microfilm Prim $ 2 A c/bl
( Avo? labie f m the ' Office of Tmhnical Services DeprSmeri? ef Commerce WarlrIrrgton 15, D. C.
-
419
sL,--e,-',--d- F-'

DISCLAIMER
This report was prepared as an account of work sponsored by an agency of the United States Government. Neither the United States Government nor any agency Thereof, nor any of their employees, makes any warranty, express or implied, or assumes any legal liability or responsibility for the accuracy, completeness, or usefulness of any information, apparatus, product, or process disclosed, or represents that its use would not infringe privately owned rights. Reference herein to any specific commercial product, process, or service by trade name, trademark, manufacturer, or otherwise does not necessarily constitute or imply its endorsement, recommendation, or favoring by the United States Government or any agency thereof. The views and opinions of authors expressed herein do not necessarily state or reflect those of the United States Government or any agency thereof.

DISCLAIMER
Portions of this document may be illegible in electronic image products. Images are produced from the best available original document.

Summary
An industrial-scale experiment involving 100-tons of scrap copper has been completed to check the results of laboratory experiments on the use of fire refining as a-means of removing uranium contamination. Samples of the refined metal were checked at ORNL for uranium content by activation analyses and found to have on the average less than 0.66-micrograms of uranium per gram of metal sample. The bulk'of thetactivity was found i n the slag. The above level of activity was considered acceptable by the OR0 of the AEC and the metal has been released for resale.
Purpose of Experiment
Large amounts of,contamination scrap are being accumulated at -the variqus atomic energy installations resulting in (1) tieing up millions of dollars in honproductive investments, (2) crowding of storage facilities, and (3) i n some cases, withholding of s2arce metal from the c~mmercial market. These facts serve as sufficient incentive to examine possible treatments which may be capable of removing the radioactive contaminants. Salvage work done or planned at ORNL concerns recovery of steel and copper being held i n the Y-12 scrap yard. The quqnti ties of materials involved are i n the hundreds-of-tons of metal . f
* . . . ' r ~ . The immediate problem i s to recover scrap containing a high.percentage 4f copper. The ,. . purpose bf the exp.eri ment i s to substantiate, on a commercial scale., labgratory expbr! men ts
conducted iointly by the Research Department of the American Smelting and Refining) 60.. and the New Burnswich Laboratory of-the AEC. Melts; amounting to aboui 30 pounds of mqtal pirepared with a soda ash flux were found to be essentially freqtof uranium following treatmeit. (<' 8..5
+ J ~ , .. micrograms of uranium/gram of sample). . . . ...
. .. ., An agreement was made with the American. Smelting and. Refining Go. for the .use of a. reverberatory f&nace at their Federated Metals Plant i n st . Louis for a series of five me1 ts. , The suitability of these facilities for the proposed experiment was confirmed upon inspectiqn by J., 6. Harttdf the Health Physics Division and J . L..,Gregg, consultant to the ~ e t a l i u i ~ ~ Division.
The oi l fired furnace to be used has a 20-ton capacity and i s equiped with g controlled off-gas system terminating i n a 125 ft. Wiederholdt stack. The steel barrels containing the
l Q scrap shipped from Oak Ridge wi l l be unloaded from the railroad carrier with a fork l i f t truck. To obtain proper distribution of the charge within the furnace, hand loading wi l l be employed. The heats wil l be tapped into a ladle having about a ton capacity and from there into small molds mounted t o permit dumping the solidified~\ngots into a water trough. The reverberatory furnace along with pots used to melt and cast lead base solders i s contained i n a building meahring about 75 ft x 150 ft. Approximately fifteen people work i n this area.
, In addition to the exhnt of desontamina:tion of large scale melts, Health Physics personnel are to monitor the.various operations i n the handling of the scrap'and its me1 t down to determine whether or not the possibility of an intolerable buildup of radioactive material wi l l occur at.some stage of the process. The point of principal concern is.any trend indicating long range build- up of contamination bpt i f any part of the operation required for the experiment lead immediately to contamination levels above tolerance, the steps necessary to correct this yill be taken.

Outline of Proposed Large Scale Experiment
The Health Physics Division wi l l supply two men to gather information,'ngSes?ar for evaluation of contamination as follows:
1. -un!oading of contaminated. scrap from shipping containers 2. loading scrap into .the furnace 3. collecting air-borne contamination samples throughout the plant. area,, , ' stack gas samples, and fallout samples several stack lengths from the plant .! area 4. personnel monitoring
The Metallurgy Division wi l l supply one man to work with the health physicists i n
1. collecting samples from the monitoring equipment 2.. gathering representative samples of slag and the metal product for chemical
analysis and activity counts 3.. obtaining Orsat analyses of the flue gas for calculations of flue gas uulume .
Mr. J.. L.. Gregg wi l l also be present during the first two days of the setting-up operation at S t ;. Louis.
Arrangements have been made to have a representcltive. of ~edeskted Metals:.to come to Oak. Ridge to supervise loading of 100-tons of scrap copper. This 100-tons.of metal, wi,ll be. processed i n f ive batches of 20-tons each. . The loading, melt down, and -casting operations wi l l require about twenty-four hours per heat, therefore, the proposed series of melts wil l requirebone week to prepare and to process.
I Actual Work Performed at St. Louis - - . . . -. I * : . . Placing Air and Flue Gas Samplers
\The -first day and a*half-was spent+placing air sampling equipment, instal ling ,a flue gas
I sampling tube through the wall of the stack about 30 f t from its base, and setting up cgunting 'and gas analysis equipment. Filter papers mounted i n the sampling equipment removed enqained particles which were checked for radioactivity. Knowing the pumping capacity of the sampler and the time
I lapse during sample collection i t was possible to determine the concentration of air-bdrne activity.
Process Sequence
' 0
Unloading of the first railroad car was begun on the afternoon of Sunday, Jan. 29. A fork-left truck moved the 55-gal drums containing the scrap i n groups of four and placed them near the chclrgiging ul-eu of the furnace. Charging of the furnace, which had been brought up to temperature slowly during the preceeding week, was begun at 4: 15 PM Jan. 29. As wi-th the remaining runs, the charging period lasted about 10 to 12 hours. Some ditficul ty was encountered
1 during the first run due to a large quantity of slag produced. This appeared to be due to cleaning out of the furnace rather than material contained i n the scrap; since subsequent heats pqioduced about half as much slag. Following slagging, the oxygen content was adjusted to an acfeptable level as indicated by test castings. This adjustment was done by introducing a green log (poling) directly into the melt. Poling was continued until the resulting gases combined with +ugh copper oxide to give satisfactory shrinkage in casting. The me1 t was then covered with a protective covering of charcoal and the casting operation begun. The amount of metal charged to the furnace averaged more than 20-tons per heat with the result that the 100-tons of scrap was
I - treated i n four heats. The original plan had been to prepare slags which would be insolpble, therefore, a high silica plus borax slag was made i n the first melt. However, difficulty k i t h the resulting high viscosity of this type of slag made i t necessary to reduie the silica addi tign to obtain more fluidity of the expense of low solubility. The material balances for the various,runs
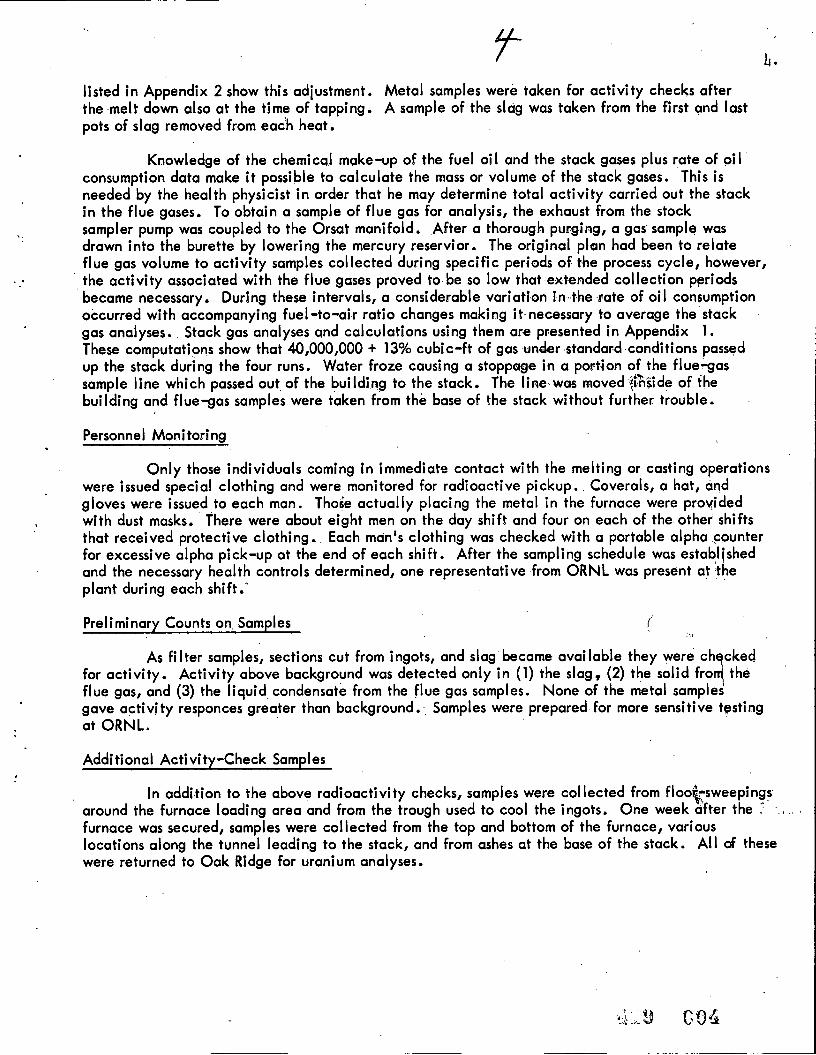
listed i n Appendix 2 show this adiustment . Metal samples were taken for activity checks after the melt down also at the time of tapping. A sample of the slag was taken from the first and last pots of slag removed from eac'h heat.
Knowledge of the chemical make-up of the fuel oi l and the stack gases plus rate of oi l consumption data make i t possible to calculate the mass or volume of the stack gases. This i s needed by the health physicist i n order that he may determine total activity carried out the stack i n the flue gases. To obtain a sample of flue gas for analysis, the exhaust from the stock sampler pump was coupled to the Orsat manifold. After a thorough purging, a gas sample was drawn into the burette by lowering the mercury reservior. The original plan had been to relate flue gas volume to activity samples collected during specific periods of the process cycle, however,
_ . the activity associated with the flue gases proved to be so low that extended collection periods became necessary. During these intervals, a considerable variation i n the rate of oi l con4umption occurred with accompanying fuel-to-air ratio changes making i t necessary to average the stack gas analyses. Stack gas analyses and calculations using them are presented i n Appendix 1. These computations show that 40,000,000 + 13% cubic-ft of gas under-standard conditions passed up the stack during the four runs. Water froze causing a stoppage in a portion of the flue-gas sample line which passed out of the building to the stack. The line was moved ~fXside of the building and flue-gas samples were taken from the base of the stack without further trouble.
Personnel Monitoring
Only those individuals coming i n immediate contact with the melting or casting operations were issued special clothing and were monitored for radioactive pickup. Coverals, a hat, and gloves were issued to each man. Thoge actually placing the metal in the furnace were provided with dust masks. There were about eight men on the day shift and four on each of the other shifts that received protective clothing. Each man's clothing was checked with a portable alpha counter for excessive alpha pick-up at the end of each shift. After the sampling schedule was established and the necessary health controls determined, one representative from ORNL was present at 'the plant during each shift.'
Preliminary Counts on, Samples
As filter samples, sections cut from ingots, and slag became available they were ch cked for activity. Activity above background was detected only i n (1) the slag, (2) the solid froA tha flue gas, and (3) the liquid. condensate from the flue gas samples. None of the metal samples' gave activity responces greater than background. ., Samples were psepared- for more sensitive testing at ORNL.
Additional Activi ty-Check Samples
In addition to the above radioactivity checks, samples were collected from floo+weepings around the furnace loading area and from the trough used to cool the ingots. One week after the f furnace was secured, samples were collected from the top and bottom of the furnace, various locations along the tunnel leading to the stack, and from ashes at the base of the stack. Al l of these were returned to Oak Ridge for uranium analyses.
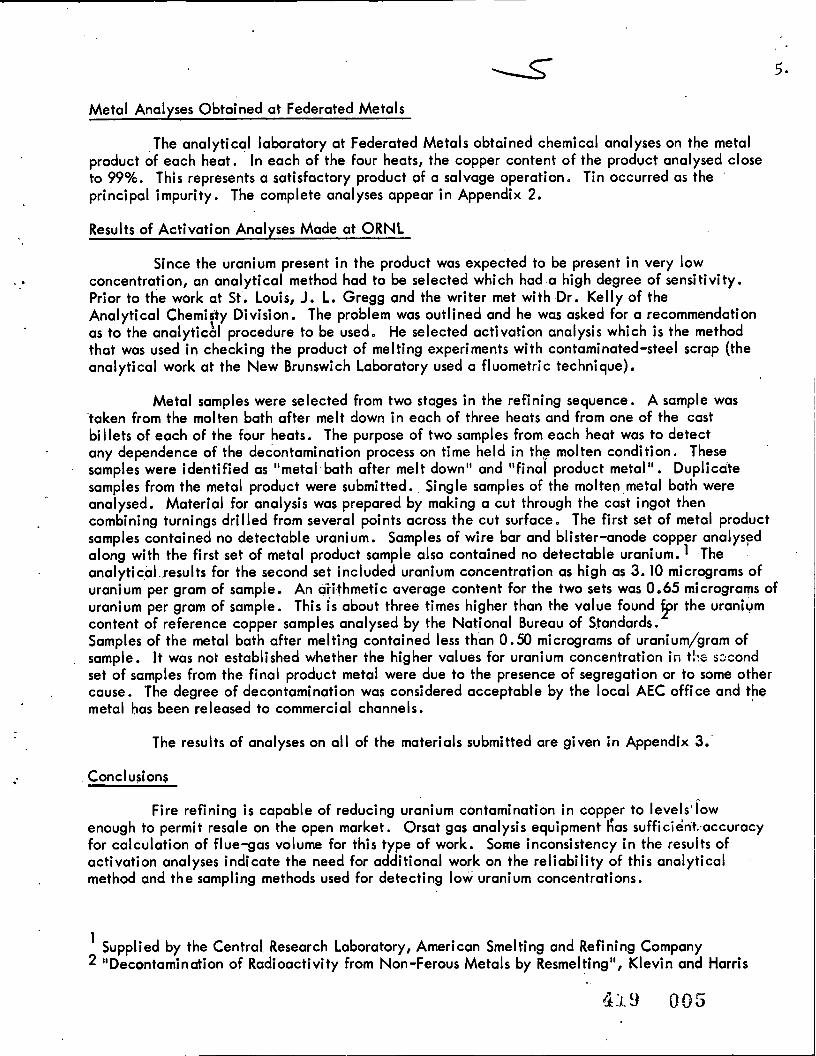
Metal Analyses Obtained at Federated Metals
The analytical laboratory at Federated Metals obtained chemical analyses on the metal product of each heat. In each of the four heats, the copper content of the product analysed close to 99%. This represents a satisfactory product of a salvage operation. Tin occurred as the '
principal impurity. The complete analyses appear i n Appendix 2.
Results of Activation Analyses Made at ORNL
Since the uranium present i n the product was expected to be present i n very low concentration, an analytical method had to be selected which had a high degree of sensitivity. Prior to the work at St. Louis, J. L. Gregg and the writer met with Dr. Kelly of the Analytical Chemifty Division. The problem was outlined and he was asked for a recommendation as to the analytical procedure to be used. He selected activation analysis which i s the method that was used in checking the product of melting experiments with contaminated-steel scrap (the analytical work at the New Brunswich Laboratory used a fluometric technique).
Metal samples were selected from two stages in the refining sequence. A sample was 'taken from the molten bath after melt down in each of three heats and from one of the cast bi I lets of each of the four heats. , The purpose of two samples from each heat was to detect any dependence of the decontamination process on time held i n the molten condition. These samples were identified as "metal. bath after me1 t down" and "final product metal". Duplicate samples from the metal product were submitted. Single samples of the molten ,metal bath were analysed. Material for analysis was prepared by making a cut through the cast ingot then combining turnings drilled from several points across the cut surface. The first set of metal product samples contained no detectable urani um . Samples ,of wire bar and bl ister-anode copper anal ysed along with the first set of metal product sample also contained no detectable uranium. 1 The
.
analyticbl .results for the second set included uranium concentration as high as 3.10 micrograms of uranium per gram of sample. An t$i.thmetic average content for the two sets was 0.65 micrograms of uranium per gram of sample. This i s about three times higher than the value found fpr the uranium content of reference copper samples analysed by the National Bureau of Standards. Samples of the metal bath after melting contained less than 0.50 micrograms of uranium/gram of sample. I t was not established whether the higher values for uranium concentration i n t!:e szcond set of samples from the final product metal were due to the -presence of segregation or to some other cause. The degree of decontamination was considered acceptable by the local AEC office and the metal has been released to commercial channels.
The results of analyses on al l of the materials submitted are given i n Appendix 3.
Fire refining i s capable of reducing uranium contamination in copper to levelsi tow enough to permit resale on the open market. Orsat gas analysis equipment h'as s~fficien't~~accuracy for calculation of flue-gas volume for this type of work. Some inconsistency i n the results of activation analyses indicate the need for additional work on the reliability of this analytical method and the sampling methods used for detecting low uranium concentrations.
1 Supplied by the Central. Research Laboratory, American Smelting and Refining Company * "Decontamination of Radioactivity from Non-Ferous Metals by Resmel ting", Klevin and Harris

APPENDIX 1
CALCULATIONS BASED ON ORSAT ANALYSES OF FLUE GASES
. . The fuel used in the furnace at Federated Metals for the copper salvage work wainumber 5 fuel oi l . A chemical composition analysis of this oi l was not available. Since there i s not.an appreciable variation i n the makeup of fuel oils, i t was assumed that a typical anal.ysis f0r.a medium- . weight-fuel . oi l . would be applicable. The data given below serves as a basis for the following calculations.
% composition by weight ---- C H S 0 N H2° ,.
85 , 12 0.8 1 .O 0.2 1 .O
Specific gravity 60°/600 ---- 0.92
Density lbjgal. ------------ 7.7 . . .
The composition of the flue gas wi l l be a combination of the analysis of the oi l and the air fed to sustain combustion. A check of the climatological data for the St. Louis area was made to find how much water wc$ld be contained i n the air. Since the experiment was to be performed in January, information for that month i n the last five years was checked. The following was reported for the Sf. Louis area by the U. S. Weather Bureau:
Jan Avg . dew point Avg . Relative Avg . Temp. Saturated Vapor
- O F Humidity '% O F Pressure H,O mm
1951 23 73 32.6 4.48
A vapor pressure of 4 mm of water vapor represents about A% change in the volume of air required for stoichiometri c burning. The moisture contribution of the air wi l l be neglected and cal~ulations of the quantity of air required wil l be based on dry air.
Chemical Engineers' Handbook, John H. Perry, Editor, 1950 . Liquid Fuels, p.. 1572
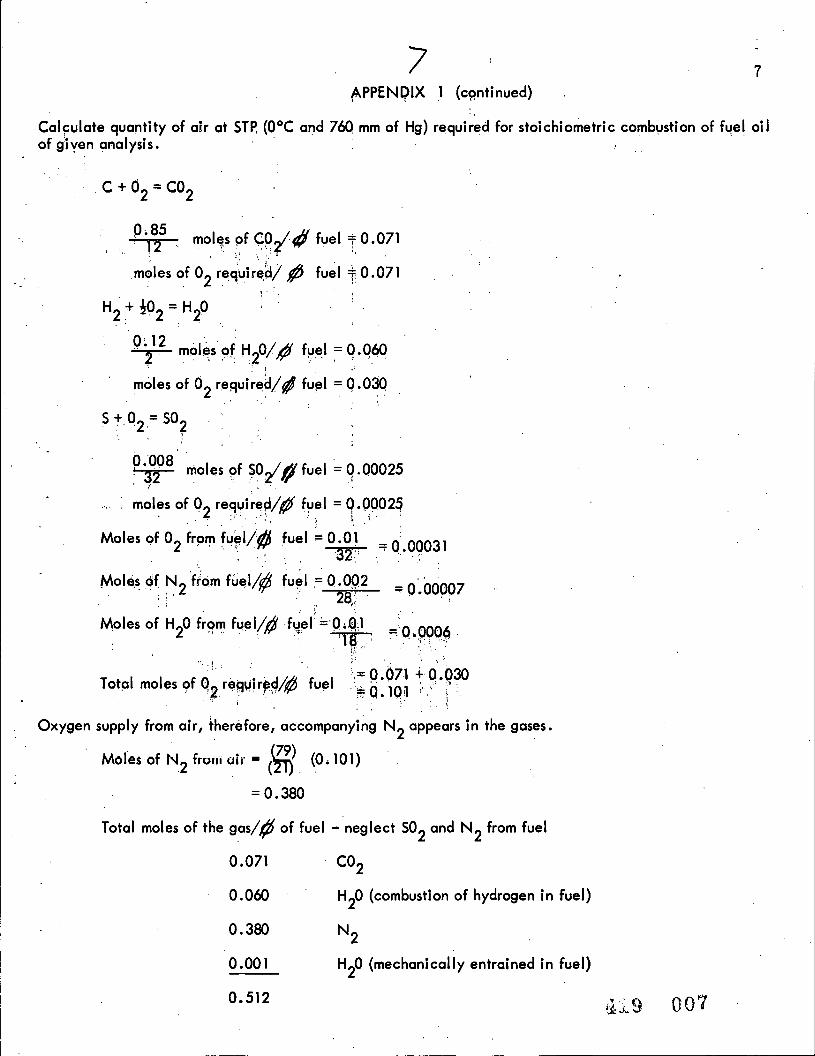
APPENDIX 1 (cpntinued)
Calculate quantity of air at STF! (O°C and 760 mm of Hg) required for stoichiometric combustion of fyel , . oi l of dven analysis. . .
, C + o2 = co2
: 'T 9185 moles pf fuel = 0.071 i : ! , . :
, :: , . ' Z . . moles of O2 requirt$/ # fual 0.071
8 ' , . .
moles of O2 required// fuel = 0.030
/ . ! moles pf 50dq fuel = 0 .(NO25
' moles of O2 required/# fuel = 9.00025 / 1
Moles of O2 from fupl/@ fuel = 0.01 % : ' . , . = 8 4.0003 1
. > , , . . Moles of H20 from ,, .. fuel / ' . , feel' "0 ~B:I =-0 0004
., . . , - ' : : . . i ' ...! i.. " . . .
. Oxygen supply from air, therefore, accompanying N appears in the gases. 2
Total moles of the gas/@ of fuel - neglect SO2 and N2 from fuel
0.071 C02
0.060 . ' H20 (combustion of hydrogen i n fuel)
0 .OO 1 H20 (mechanically entrained i n fuel)
0.512 +i19 00'7

APPENDIX 1 (continutd)
3 Since at STP, 1 mole of gars occupies 359 ft , the volume of flue gases/' fuel = (359) (0.512)
For a density of 7.7 $I /gal, the volume of flue gases/g&.fuel (183) (7.7) = 1410 ft 3
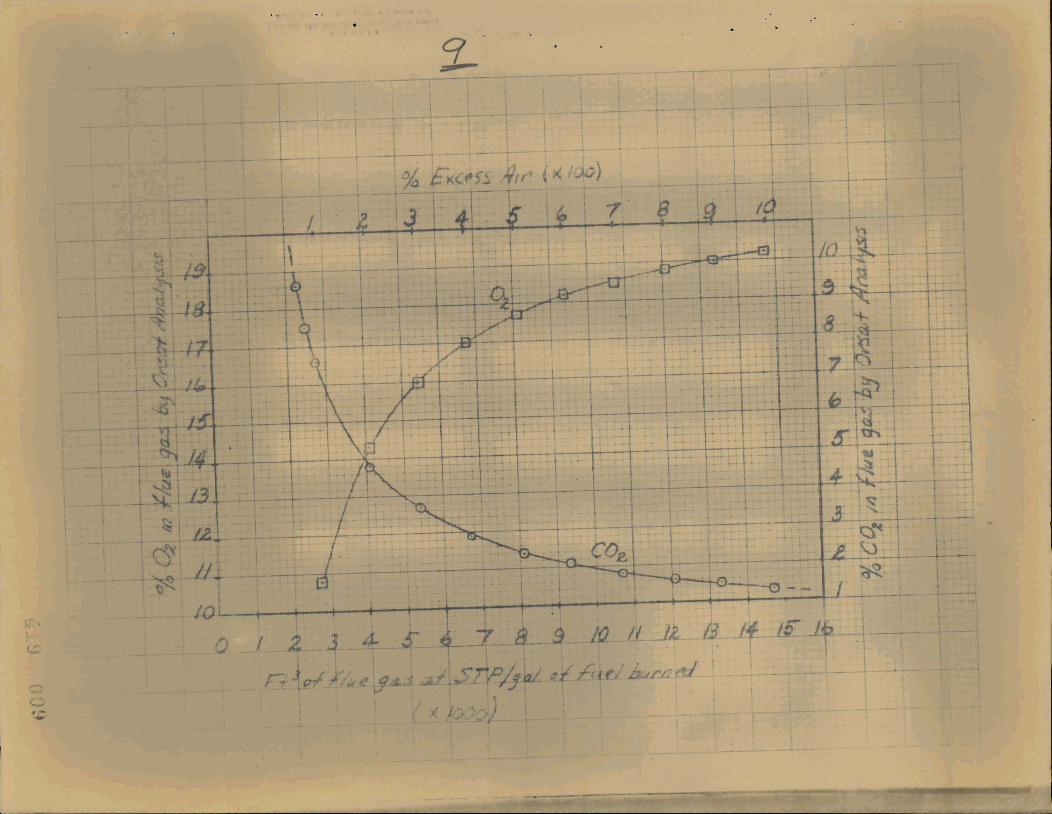
, The values necessary to show i n graphical form the volume of flue gas at STP per gal. of fuel burned ore calculated next ; These qa'l ues ore based on an assumed variation i n the amount of excess air supplied t o
- the fuel . , Correction i s made for the Ifact that an orsat analysis gives the equivalent of an anal y~ii -of the ' . dry gas.
% Excess Air .
Molesof Excess Air . .
ioo
.. '. .
Total moles ' Di-y Gas of dry -' % C02 : % O2 g a s k e l . . . -
Total moles of wet +
gashfuel
.O.. 51 2
0.607
0.702
0.803
"0;-898"--. .
0.993
1,474
1.955
2.436
2.917
3.398
3 Ft of the gas at STP gal. fuel
1410
1680
1930
2220
2470
2740
4070
5400
6740
8050
9370

1C APPENDIX 1 (continued)
, Time - . Jan 29
,1730 - 2030 2130 ,2230 2330 Jan 30 0030 0130 0230 0330 0430 0530 0630 loo0 1 700 1800 1900
2100 2200 2300 2400 Jan. 31 0 loo 0200 0300 0400 0500 0600
DATA ON USE OF 4 5 FUEL OIL
I
Oil Meter Rate of, Oil Meter Rate of; Oil Meter Rate of Reading oil used. Reading oil used Reading oil use gal. used gal/hr Ti me - gal. used gal/hr Time - gol. used gal/hr
2300 2400 Feb. 1 0 100 om 0300 0400 om oa
0909 1800 1900 2000 2100 2200 2330 Fnb. 2 0031) 0 130 0230
63 93 13 0330 8898 50 0430 8980 70 0530 9080 108
0630 9188 68 70 1800 9875 42
Total of l used 6845 gal. 121


APPENDIX 1 (continued) 10
RECORD OF ORSAT ANALYSIS
Date and , Time
Jan. 29 . . ' 1730
2122-2153
Jan .. 30 0330-0400 08 1 5-0922 -0510-0531. 0642-0657 1902- 1926 2025-2105
Feb. 2 00334048 0055-0 1 1 5 0256-0324 g535-0605
'ii. ". -: , , ,. '(,? .
.-,.z:.s.. , ( 1 _ ... . ,
.. <,:@,:;.; . . Oil meter reading . , alvnretei:r~adi + , ,! ng ,at start pf sampling a'tend'bf sahpIing Operation
3170 3387 charging
3803 c harg i ng 4147 tapping 5428 charging 4274 blowing melt with air 6258 charging 6352 melting charge
849 1 charging 8729 charging 8986 charging 9 187 c harg i ng
* Results considered unreliable because of poor agreement between measured %C02 and %02 and cb'ltul'ated values. See-graph presented i n preceding portion of this appendix relating theoret~ cal percentages of C02, 02, and di l u tion.
I
Range of values 3
Range i n ft flue gas Maximumspreadin Ag.var iat ion i n analyses per gal of oi l ft3/ga1 of oi l f t 5 /gal from avg
VOLUME OF FLUE GAS
3 The average value T~und for the f t of flue gas generated/gal. of fuel burned i s combined with the total volume of fuel consumed to obtain a value for the volume of flue gas generated during the four heats.
3 total oi l consumed, gal x f t30f flue gas at STP/gal. of fuel = f t of flue gar 6845 x 5850 * 13% = 40,000,000 * 13%
. .

/ 3 APPENDIX I (continued)
WATER CONDENSATlON 8N FLUE GAS SAMPLE LINE
Water appears i n the flue gas as a rqsult of the combustion of hydrogen In the fuel,~.water i n the . fuel, and due to the moisture contained i n the air entering the furnace. Since the stack gasfsarnple wi l l
have to be c p l e d before passing through the filter, information i s needed of the temperature at which condensation of water wi l l happen.
Moisture from combustikn
moles of H20/lb of fuel =0.060 1 Moisture from fuel
Moisture from air . .C . .
Mole fraction of moisture i n air equal to the partibl vapor pressure fraction of water i n moist air. hies of moisture/lb of fuel i s
4 (0..481. moles of dry air/lb of fuel) = 0.0025 -76o-- 0.99 volume fraction of dry air
Total moles of moisture/l b of fuel = 0 .064 ?
Partial pressure of molsaure in. flue gas = (0.064) (760) = 94.5 mm for stotchiornetaic burning Em- This corresponds to the saturated vapor pressure of water at 50°6.
Bf 300% excess air i s used, 1.894 moles of dry a! s i s consumed/l b of fuel
Partial pressure of moisture i n flue gas = (0 -064) (760) = 25 mm -l.u5'g
This corresponds to the vapor pressure of water at 26OC
The condensat%on of molsture was therefore expected and provided for i n the form of a glass bottle placed i n the sample line before the filter.

lf APPENDIX 2
MAKE-UP OF CHARGE A N D ANALYSES OF PRODUCT.. RESULTS TAKEN FROM FEDERATED METALS RECORDS OF RUNS
.f 1. Scrap - Ib # 2 Sciap - Ib Total scrap - Ib
Sand - lb Borax - I b
Ingob - Ib . Buttons and Spatters - Ib Pot Skims - Ib Slag Casting time - hr Oi l used - gal
Heat 1 Heat # 2
99.17 0 .ua 0.08 Trace 0.008 0.13 0.02
Heat # 3 Heat # 4
98.69 98.97 0.85 0.76 0.00 cD.01 Trace , Trace 0.013 . 0.018 0.. 42 0.078 0.014 0.017

APPENDIX 3
RESULTS OF ACTIVATION ANALYSES PERFORMED AT ORNL
Samples were taken from the metal product, slag by-product., and.various places ,
within the furnace or off gas system for determination of the uranium .content. The method!, selected by Dr, Kelly of the Analytical Chemistry Division for uranium determination was activation analysis .:?:The work was performed under the direction of G ; W. Leddicotte.
The metal samples were prepared by cutting through a cast ingot then drilling to obtain turnings from several points across the cut face. ingots were cast from metal taken from the bath after melting of the charge and also from the final product. Slag samples were taken from the first and last pots of slag to be removed from each heat and have been designated Pot # 1 and Pot 2 respectively. The identification of the remaining samples i n the following table shows the locations from which they were taken.
A,. Copper Metal Samples Uranlum Concentration,
Sample micrograms/gram
a . q Wire Bar a
Bllster Arrode Final Product Metal, Heat # 1 . Final Product Metal, Heat # 2 Final Product Metal, Heat 3 Final Product Metal, Heat # 4 Metal Bath After Meltdown, Heat # 1 Metal Bath After Meltdown, Heat 2
4
Metal Bath After Meltdown, Heat 1 4 Final Metal Product, e a t 1 o
Final Metal Product, Heat # 2 Final Metal Product, Heat # 3
--final- Metal Product, Heat # 4
Not Detected b
Not Detected Not Detected Not DetecteB .Not ~g tec ted Not D4tected . ';7 8'; 50-
- s a,;50:. < 0.50
0.80 (k0.05). < 0.0; < 1.30 (est. 0.80)
3. loe
Q From Central Research Laboratory, Amer . Smelting and Ref. Company
b Less than 0.022 mi ~ro~rams/~ram.
C Limit of detection for irradiation conditions used i n analysis,
d Li.mit of detection for irradiation conditions used in analysis.
e One anolysis only. uranium (as N~~~~ gamma radiations) determined by single channel gamma spectrometer.

B . slag. Samples
Uranium Concentration, m i l ligrams/gram . 1 5 ,
Sample
Heat # 1, Pot 1 * Heat # 1, Pot 2 Heat # 2, Pot 1
. - Heat # 2, Pot # 2 Meat #.3, Pot 1 Heat #3, Pot 2 . .. Heat a 4, Pot # 1 Heat # 4, Pot # 3
7 Floor sweepings, 1st batch 0.58~0.54 Floor sweepings, 2nd batch 1.59, 1.63, 1.39 Floor sweepings, 4th btach 0.21,9.22 Waste from Ingot Cooling Trough 0.0021,0.0028
C. Siliceous Materials
C
~ j b n l u m Concentrationi mi l ligrams/gram,
. T Q ~ of Furnace . b Bottom of Furnace
Ashes at Stack Botiom Start of Tunnel (at furnace s'ide) Sides of Tunnel . .'
a Tunnel