Embed Size (px)
Citation preview
1
SYNOPSIS
Kansai Nerolac Paints Ltd is the second largest coating company in India and market leader in Industrial Coatings.
The Company is a subsidiary of Japan based Kansai Paint Company Limited, which is one of the top ten coating companies in the world.
Company’s manufacturing units have received ISO 9001-2000, ISO-14001 and OHSAS-18001 for its quality management.
During the quarter, the company has reported revenue increased to Rs. 6520.50million for the quarter ended.
Net Sales and PAT of the company are expected to grow at a CAGR of 19% and 18% over 2010 to 2013E respectively.
Years Net sales EBITDA Net Profit EPS P/E
FY 11 21398.80 3393.30 2059.80 38.22 22.89
FY 12E 25250.58 3902.28 2395.97 44.46 19.68
FY 13E 28533.16 4373.82 2686.37 49.85 17.55
Stock Data:
Sector: Paints
Face Value Rs. 10.00
52 wk. High/Low (Rs.) 1055.00/720.00
Volume (2 wk. Avg.) 1642.00
BSE Code 500165
Market Cap (Rs in mn) 47153.75
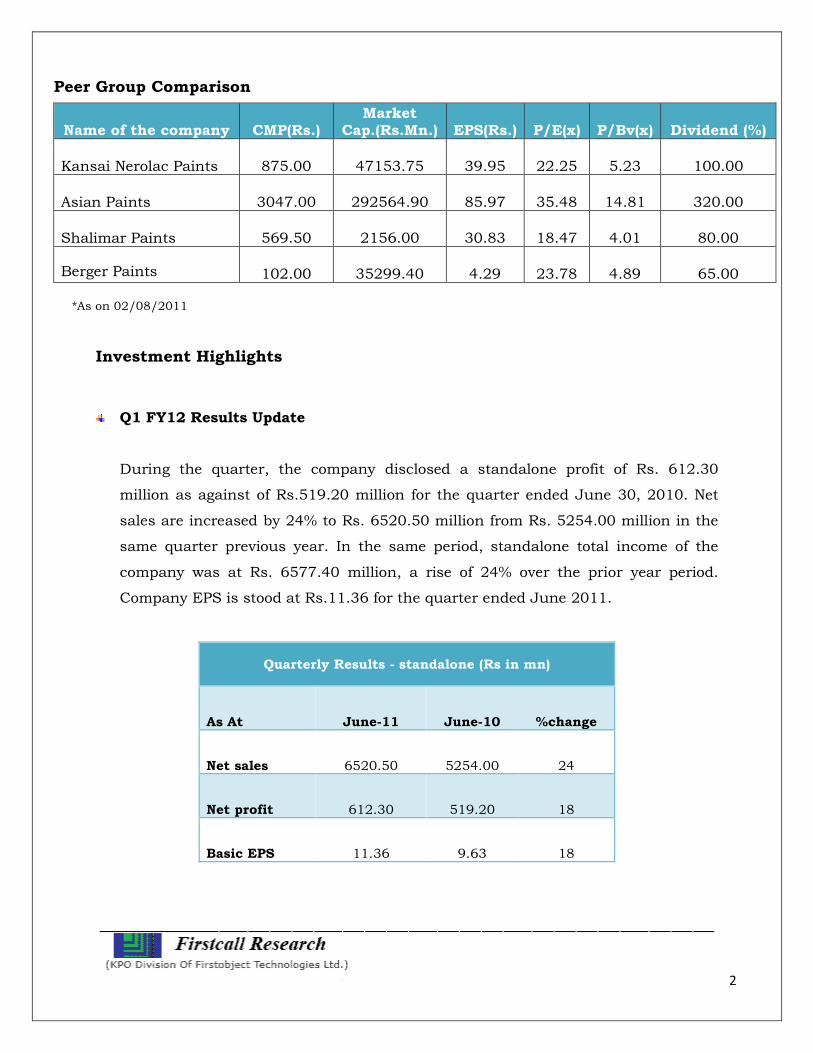
Share Holding Pattern
1 Year Comparative Graph
Kansai Nerolac Paints Ltd
BSE SENSEX
C.M.P: Rs. 875.00 Target Price: Rs. 980.00 Date: Aug 2nd 2011 BUY
KANSAI NEROLAC PAINTS LTD Result Update: Q1 FY 12
2
Peer Group Comparison
Name of the company CMP(Rs.) Market
Cap.(Rs.Mn.) EPS(Rs.) P/E(x) P/Bv(x) Dividend (%)
Kansai Nerolac Paints 875.00 47153.75 39.95 22.25 5.23 100.00
Asian Paints 3047.00 292564.90 85.97 35.48 14.81 320.00
Shalimar Paints 569.50 2156.00 30.83 18.47 4.01 80.00
Berger Paints 102.00 35299.40 4.29 23.78 4.89 65.00
*As on 02/08/2011
Investment Highlights
Q1 FY12 Results Update
During the quarter, the company disclosed a standalone profit of Rs. 612.30
million as against of Rs.519.20 million for the quarter ended June 30, 2010. Net
sales are increased by 24% to Rs. 6520.50 million from Rs. 5254.00 million in the
same quarter previous year. In the same period, standalone total income of the
company was at Rs. 6577.40 million, a rise of 24% over the prior year period.
Company EPS is stood at Rs.11.36 for the quarter ended June 2011.
Quarterly Results - standalone (Rs in mn)
As At June-11 June-10 %change
Net sales 6520.50 5254.00 24
Net profit 612.30 519.20 18
Basic EPS 11.36 9.63 18
3
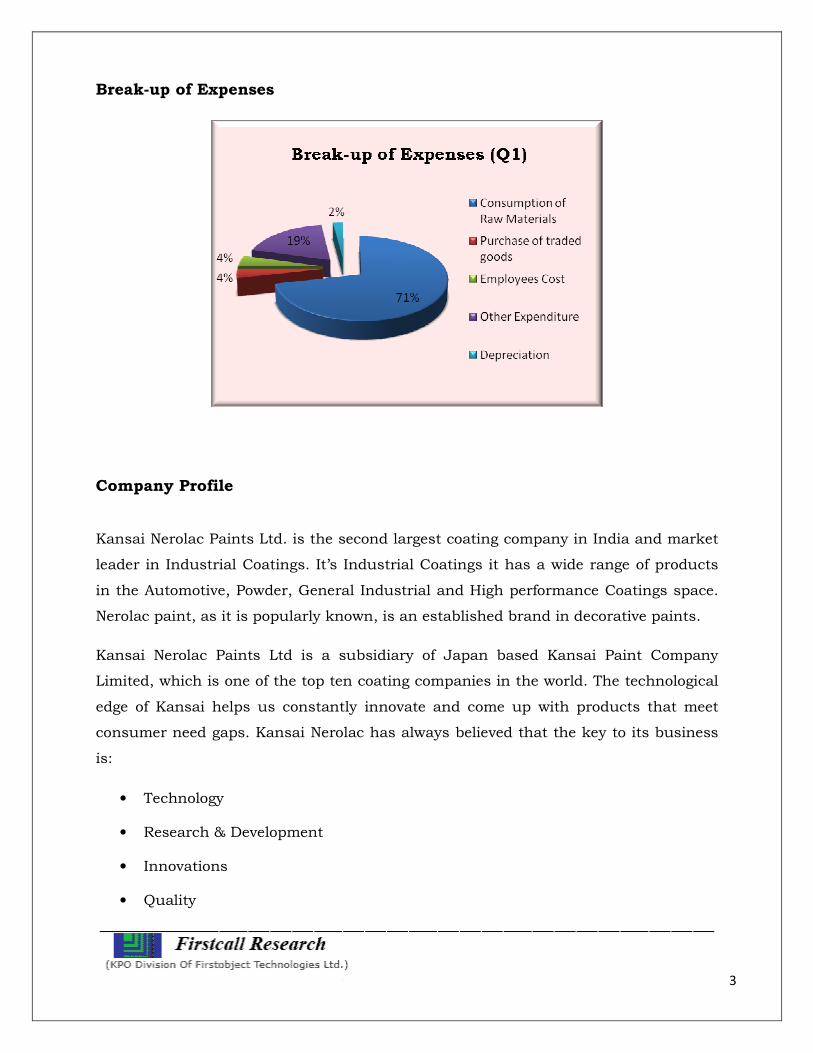
Break-up of Expenses
Company Profile
Kansai Nerolac Paints Ltd. is the second largest coating company in India and market
leader in Industrial Coatings. It’s Industrial Coatings it has a wide range of products
in the Automotive, Powder, General Industrial and High performance Coatings space.
Nerolac paint, as it is popularly known, is an established brand in decorative paints.
Kansai Nerolac Paints Ltd is a subsidiary of Japan based Kansai Paint Company
Limited, which is one of the top ten coating companies in the world. The technological
edge of Kansai helps us constantly innovate and come up with products that meet
consumer need gaps. Kansai Nerolac has always believed that the key to its business
is:
• Technology
• Research & Development
• Innovations
• Quality
4
Company Products
• Decorative Paints
• Automotive Coatings
• General Industries Coatings
• High Performance Coatings
• Powder Coatings
• Specialty Coatings
In India the company has presence in Assam, Goa, Gujarat, Haryana, Himachal
Pradesh, Madhya Pradesh, Orissa, West Bengal, Rajasthan, Maharashtra, Punjab,
Uttaranchal, Bihar, New Delhi, Tamil Nadu, Uttar Pradesh and many more.
Company’s manufacturing units have received ISO 9001-2000, ISO-14001 and
OHSAS-18001 for its quality management. Company has also implemented Japanese
5-S and TPM (total productive maintenance) concepts in organization.
Nerolac has a wide distribution network of over 11,000 dealers which one of the key
strength of company.
Company’s R&D facility focuses on improving its manufacturing processes and
innovate its products. This facility has officially recognized by the Department of
Science and Technology (DTI), Government of India.
Company has technically collaborated with two companies Kansai Paint Co. and
Oshima Kogyo Co. of Japan. The company markets its products under the brand
name such as 'Impressions', 'Beauty', 'Excel' and 'Suraksha'.

5
Financials Results 12 Months Ended Profit & Loss Account (Standalone)
Value(Rs.in.mn) FY10 FY11 FY12E FY13E
Description 12m 12m 12m 12m
Net Sales 17074.10 21398.80 25250.58 28533.16
Other Income 193.50 223.10 240.95 265.04
Total Income 17267.60 21621.90 25491.53 28798.20
Expenditure -14426.90 -18228.60 -21589.25 -24424.38
Operating Profit 2840.70 3393.30 3902.28 4373.82
Interest -12.00 -8.40 -8.31 -9.00
Gross profit 2828.70 3384.90 3893.97 4364.82
Depreciation -442.60 -493.60 -542.96 -591.83
Profit Before Tax 2386.10 2891.30 3351.01 3772.99
Tax -731.10 -831.50 -955.04 -1086.62
Net Profit 1655.00 2059.80 2395.97 2686.37
Equity capital 269.50 538.90 538.90 538.90
Reserves 7458.70 8828.70 11224.67 13911.04
Face Value 10.00 10.00 10.00 10.00
Total No. of Shares 26.95 53.89 53.89 53.89
EPS 61.41 38.22 44.46 49.85

6
Quarterly Ended Profit & Loss Account (Standalone)
Value(Rs.in.mn) 31-Dec-10 31-Mar-11 30-Jun-11 30-Sep-11E
Description 3m 3m 3m 3m
Net sales 5603.80 5195.90 6520.50 6781.32
Other income 43.30 81.30 56.90 59.75
Total Income 5647.10 5277.20 6577.40 6841.07
Expenditure -4916.30 -4361.80 -5592.50 -5784.47
Operating profit 730.80 915.40 984.90 1056.60
Interest -2.40 -0.90 -2.50 -2.43
Gross profit 728.40 914.50 982.40 1054.17
Depreciation -127.90 -132.10 -120.10 -123.70
Profit Before Tax 600.50 782.40 862.30 930.47
Tax -184.60 -193.80 -250.00 -269.84
Net Profit 415.90 588.60 612.30 660.63
Equity capital 538.90 538.90 538.90 538.90
Face Value 10.00 10.00 10.00 10.00
Total No. of Shares 53.89 53.89 53.89 53.89
EPS 7.72 10.92 11.36 12.26
7
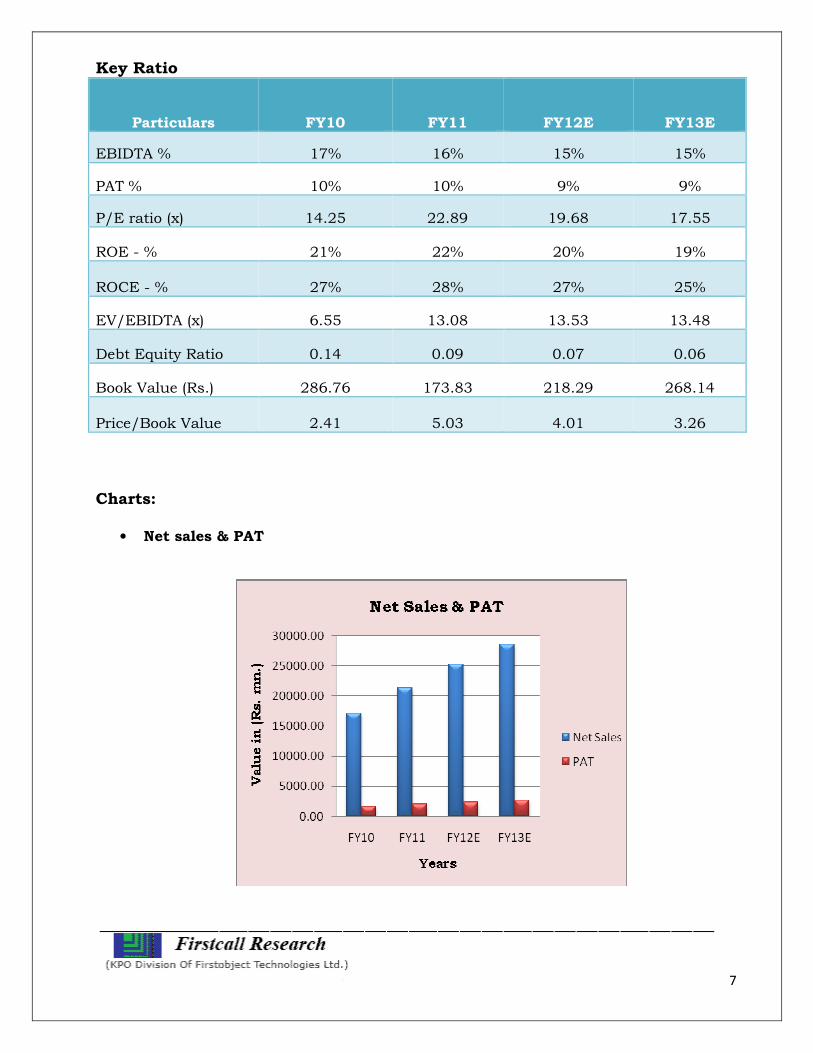
Key Ratio
Particulars FY10 FY11 FY12E FY13E
EBIDTA % 17% 16% 15% 15%
PAT % 10% 10% 9% 9%
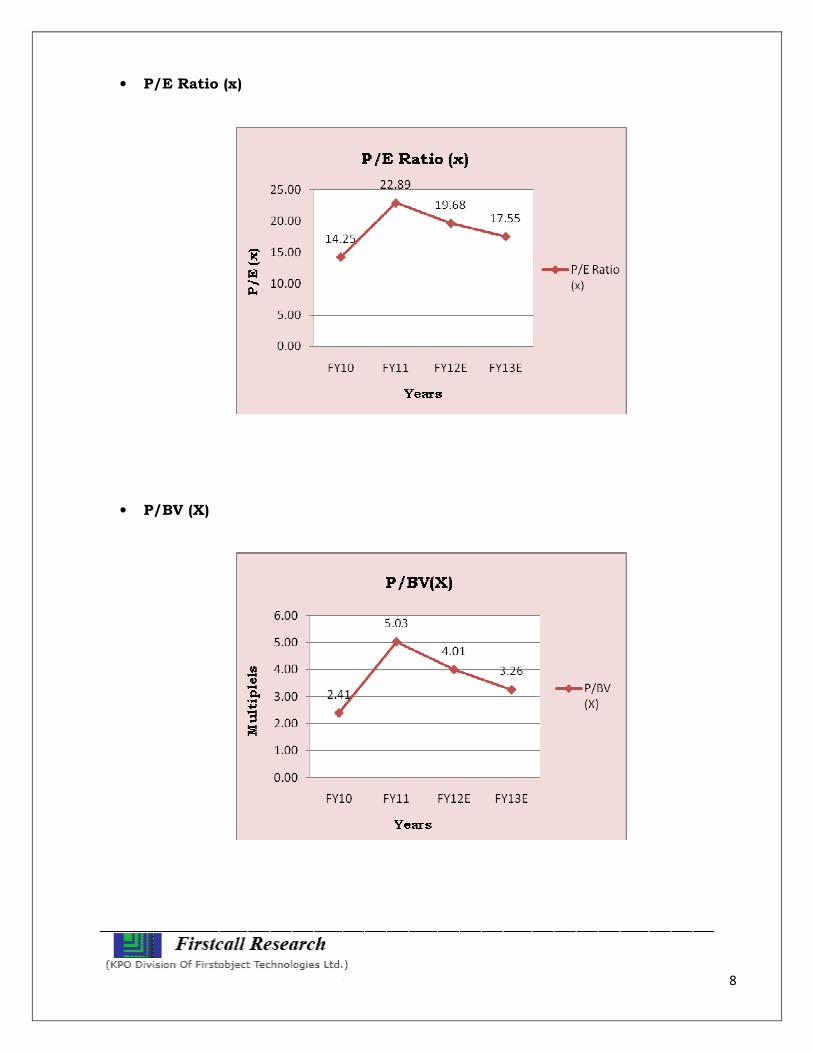
P/E ratio (x) 14.25 22.89 19.68 17.55
ROE - % 21% 22% 20% 19%
ROCE - % 27% 28% 27% 25%
EV/EBIDTA (x) 6.55 13.08 13.53 13.48
Debt Equity Ratio 0.14 0.09 0.07 0.06
Book Value (Rs.) 286.76 173.83 218.29 268.14
Price/Book Value 2.41 5.03 4.01 3.26
Charts:
• Net sales & PAT
8
• P/E Ratio (x)
• P/BV (X)

9
• EV/EBITDA(X)
Outlook and Conclusion
At the current market price of Rs.875.00, the stock is trading at 19.68 x FY12E
and 17.55 x FY13E respectively.
Earning per share (EPS) of the company for the earnings for FY12E and FY13E
is seen at Rs.44.46 and Rs.49.85 respectively.
Net Sales and PAT of the company are expected to grow at a CAGR of 19% and
18% over 2010 to 2013E respectively.
On the basis of EV/EBITDA, the stock trades at 13.53 x for FY12E and 13.48 x
for FY13E.
Price to Book Value of the stock is expected to be at 4.01 x and 3.26 x
respectively for FY12E and FY13E.
We expect that the company will keep its growth story in the coming quarters
also. We recommend ‘BUY’ in this particular scrip with a target price of
Rs.980.00 for Medium to Long term investment.
10
Industry Overview
Paint industry in India has been long considered as the barometer of Industrial
activity in the country. The industry has witnessed buoyant growth during the last
decade riding on increasing per-capita disposable incomes in the country and the
boom in real estate and automobile industry.
Despite the sharp growth in recent times, the per capita consumption of paints in
India remains very low at 0.8 kg per year compared with 4 kg in the South East Asian
nations and 22 kg in developed countries. The global average per capita consumption
is around 15 kg. This leaves much room for growth for the industry going forward as
the Indian economy braces for a high growth trajectory in the current decade.
Profile of the Industry
The paint market can be divided into decorative paints which cater to household and
industrial paints which cater to needs of automotive, white goods and other
industries. The demand for decorative paints is highly price-sensitive and also
cyclical in nature. Monsoon represents the slack season while the peak business
period is the Sept-Oct festival season when most people repaint their houses close to
Diwali. Decorative paints can further be classified into premium, medium and
distemper segments. Premium decorative paints are acrylic emulsions used mostly in
the metros and other large cities and high-end offices. The medium range consists of
enamels, popular in smaller cities and towns. Distempers are economy products and
are used in plenty in the suburban and rural markets. This segment is dominated by
the unorganized sector players.
The industrial paints segment, on the other hand, is a high volume-low margin
business. Industrial paints include powder coatings, high performance coating and
automotive and marine paints. Nearly two-thirds of the industrial paint demand in
the country comes from the automotive sector while the rest is constituted by
producers of white goods, electronics etc.
11
The share of industrial paints in the total paint consumption of the nation is very low
compared to global standards. It accounts for nearly 30% of the paint market with
70% of paints sold in India belonging to the decorative purposes. In most developed
countries, the ratio of decorative paints and industrial paints is around 50:50. But,
with the economy growing rapidly over the last decade and industries like automotive
and consumer durables picking up speed, the ratio is likely to improve going forward.
Market Structure
Paint industry is characterized by both organized and unorganized segments.
Organized segment controls nearly 80% of total industry output. Asian Paints is the
market leader in the organized sector with 37% of the market share. Other two big
companies Berger and Nerolac accounts for 18% and 15% share respectively.
Unorganized segment consists of around 2000 small companies which usually cater
to the local demand, particularly in household paints.
Current Scenario
Paint industry in India has seen tremendous growth in the last decade. However, like
the rest of the world, the industry faced surge in cost of production in early 2008 and
some slack in demand towards end of the year as economy slowed down. However,
with a rapid recovery in the Indian economy, the paint industry is back on track and
saw strong growth in 2009.
Decorative Paints
As stated earlier, decorative paints account for around 70% of the overall paint
market in India and most of the companies saw good revenue in this segment. The
decline in raw material prices helped boost revenue of all the companies. All though
cost of production has started to increase in 2010-11, with strong overall economic
growth and revival in construction activity, the segment is set to perform well in the
current fiscal as well.
Industrial Paints
With sharp surge in the industrial activity, industrial paints segment too has
performed very well over the last one year. Both consumer durables and automotive

12
sales in the country have seen an unprecedented rally over last several months,
generating massive demand for the paint industry.
New Capex Cycle Begins
Riding on the strong sales seen over last few quarters and improvement in margins,
the paint industry is set to enter a new capex cycle. India's largest paint maker Asian
Paints is investing Rs 735 crore for a 400,000 tonne a year plant in Maharashtra and
the first phase of the project is expected to be commissioned by end-2012. Second
biggest paint company Kansai Nerolac Paints is also investing Rs 600 crore to raise
capacity by 50% over next three years. Berger Paints, the third-largest player, plans
to increase its capacity from 250,000 tonnes to 450,000 tonne over the next two
years. We expect that with rapid growth in economy, rising disposable incomes and
living standards and sharp surge in industrial production, the capacity expansion
will help the industry to cater to rising demand and boost top line of the industry.
Outlook
The Rs 13,000-crore paint industry has been growing at over 15% due to high
demand from decorative paints led by housing and real estate construction, and
industrial paints led by strong performance of automotive and white goods
industries. With strong outlook of the Indian economy, we expect per-capita paint
consumption will grow rapidly going forward, providing the key to sustained high
growth to the industry. Historically, the industry has grown at nearly 1.5x-2x the
growth of national income. We expect the Indian economy to post 8-10% average
growth over the next decade, which provides for a lot of scope for the paint industry
to sustain its high growth trajectory seen in recent years.
On the fillip side, the industry faces a volatile cost structure. After a surge in early
2008, cost of production for the paint industry came down as the commodity rally
waned. However, over the last couple of quarters, costs have started to increase
again. Prices of titanium dioxide, the key raw material, have risen 8% since January
and are expected to increase another 5% in the next few months. Prices of other raw
materials are also on an uptrend.
Overall, however, we believe that the oligopolistic nature of the organized sector and
strong demand growth scenario will provide enough market power to the paint

13
makers to pass on most of the increase in costs to consumers, particularly in the
decorative segment. In the industrial segment, while the prices often rise after
substantial lag to the rise in costs, increasing volumes in wake of high growth in
auto, consumer goods and infrastructure spaces projects can help mitigate the
impact of rise in costs.
14
________________ ____ _________________________ Disclaimer:
This document prepared by our research analysts does not constitute an offer or solicitation
for the purchase or sale of any financial instrument or as an official confirmation of any
transaction. The information contained herein is from publicly available data or other
sources believed to be reliable but do not represent that it is accurate or complete and it
should not be relied on as such. Firstcall India Equity Advisors Pvt. Ltd. or any of it’s
affiliates shall not be in any way responsible for any loss or damage that may arise to any
person from any inadvertent error in the information contained in this report. This document
is provide for assistance only and is not intended to be and must not alone be taken as the
basis for an investment decision.

15
Firstcall India Equity Research: Email – [email protected]
C.V.S.L.Kameswari Pharma
U. Janaki Rao Capital Goods
D. Ashakirankumar Automobile
A. Rajesh Babu FMCG
H.Lavanya Oil & Gas
T. Joshna Devi Diversified
P. Nageswara Rao Diversified
Dheeraj Bhatia Diversified
Manoj kotian Diversified
Nimesh Gada Diversified
Firstcall India also provides
Firstcall India Equity Advisors Pvt.Ltd focuses on, IPO’s, QIP’s, F.P.O’s,Takeover
Offers, Offer for Sale and Buy Back Offerings.
Corporate Finance Offerings include Foreign Currency Loan Syndications,
Placement of Equity / Debt with multilateral organizations, Short Term Funds
Management Debt & Equity, Working Capital Limits, Equity & Debt
Syndications and Structured Deals.
Corporate Advisory Offerings include Mergers & Acquisitions(domestic and
cross-border), divestitures, spin-offs, valuation of business, corporate
restructuring-Capital and Debt, Turnkey Corporate Revival – Planning &
Execution, Project Financing, Venture capital, Private Equity and Financial
Joint Ventures
Firstcall India also provides Financial Advisory services with respect to raising
of capital through FCCBs, GDRs, ADRs and listing of the same on International
Stock Exchanges namely AIMs, Luxembourg, Singapore Stock Exchanges and
other international stock exchanges.
For Further Details Contact:
3rd Floor,Sankalp,The Bureau,Dr.R.C.Marg,Chembur,Mumbai 400 071
Tel. : 022-2527 2510/2527 6077/25276089 Telefax : 022-25276089
E-mail: [email protected]
www.firstcallindiaequity.com


![gstcouncil.gov.ingstcouncil.gov.in/.../kansai-nerolac-appellate-authority-order.pdf · referred to as "the CGST Act and MGST Act"] by M/S Kansai Nerolac Paints Limited (herein after](https://img.dokumen.tips/doc/110x75/5ea379f73af1fb740234b7b1/referred-to-as-the-cgst-act-and-mgst-act-by-ms-kansai-nerolac-paints.jpg)