Embed Size (px)
Citation preview
Kannu PriyaMin-Min ChenVarinthorn(Build) SaengpanyarakPattharaporn(Pauline) Lertphaiboonsiri
May 1st 2012
Agenda
IntroductionStock Market ProspectIndustryHormel BusinessFinancial AnalysisMultiplesDCFRecommendation
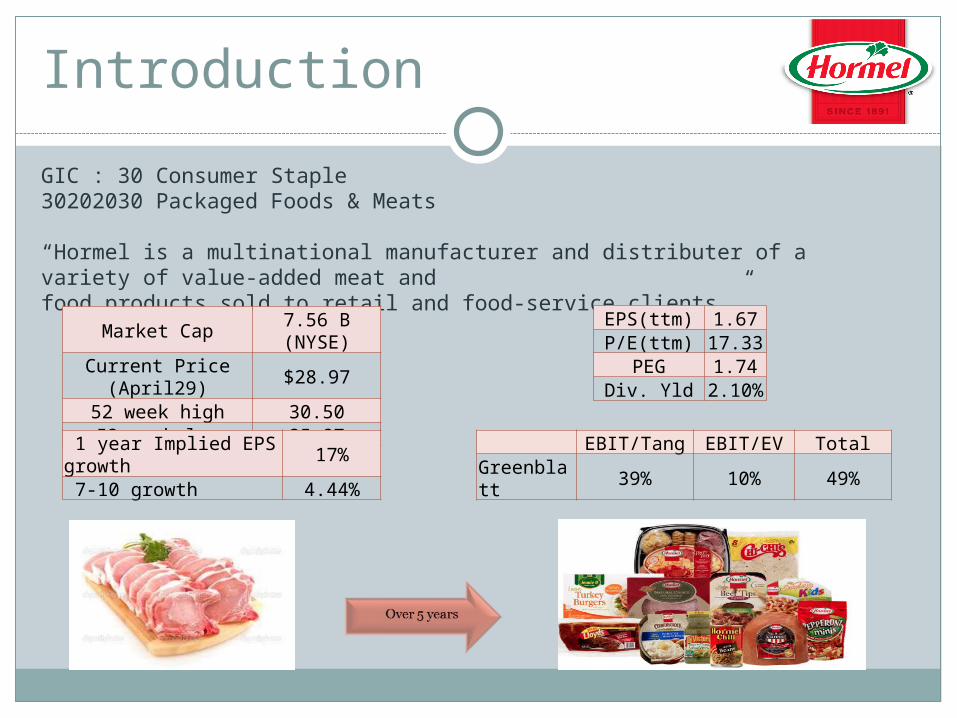
Introduction
GIC : 30 Consumer Staple30202030 Packaged Foods & Meats
“Hormel is a multinational manufacturer and distributer of a variety of value-added meat and food products sold to retail and food-service clients.”
Market Cap7.56 B (NYSE)
Current Price (April29)
$28.97
52 week high 30.5052 week low 25.87
EPS(ttm) 1.67P/E(ttm) 17.33
PEG 1.74Div. Yld 2.10%
1 year Implied EPS growth
17%
7-10 growth 4.44%
EBIT/Tang EBIT/EV TotalGreenblatt
39% 10% 49%
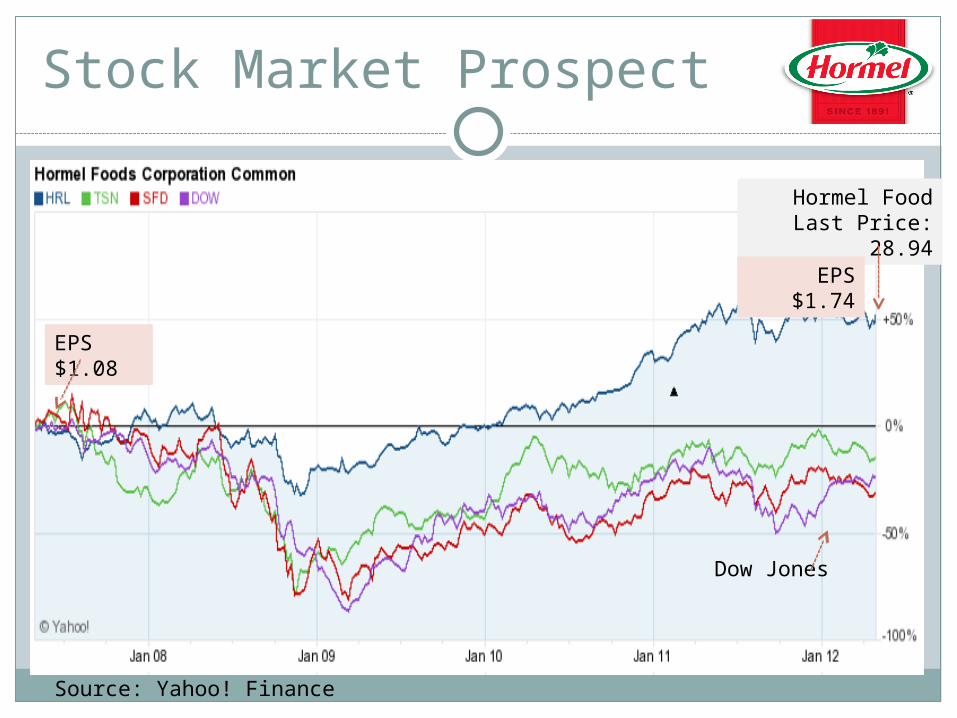
Stock Market Prospect
Hormel FoodLast Price: 28.94
Dow Jones
EPS $1.08
EPS $1.74
Source: Yahoo! Finance
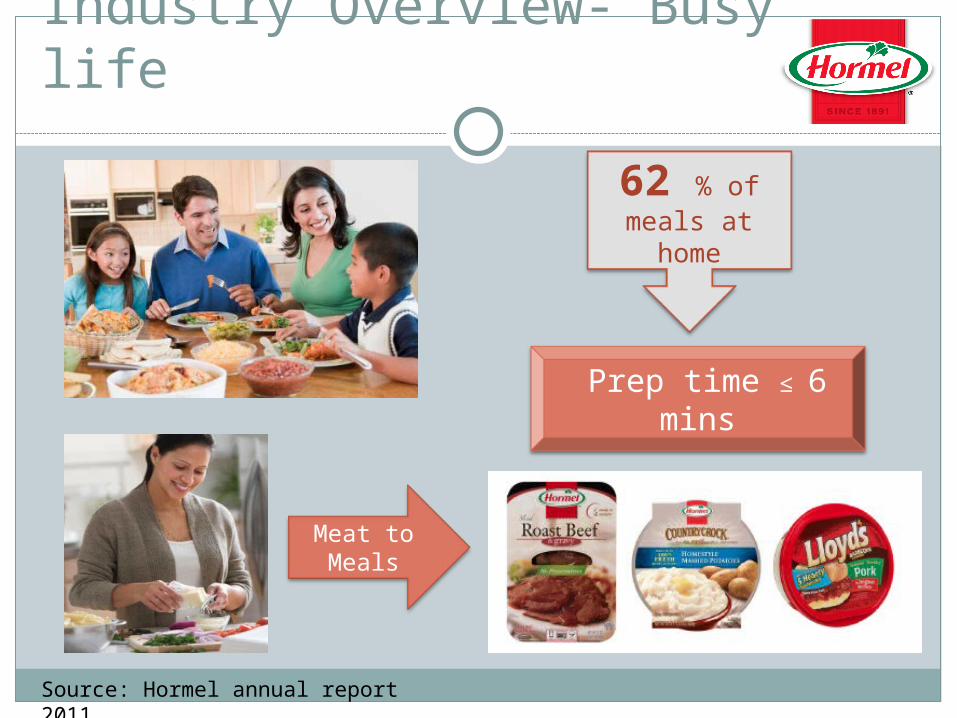
Industry Overview- Busy life
62 % of meals at
home
Prep time ≤ 6 mins
Meat to Meals
Source: Hormel annual report 2011
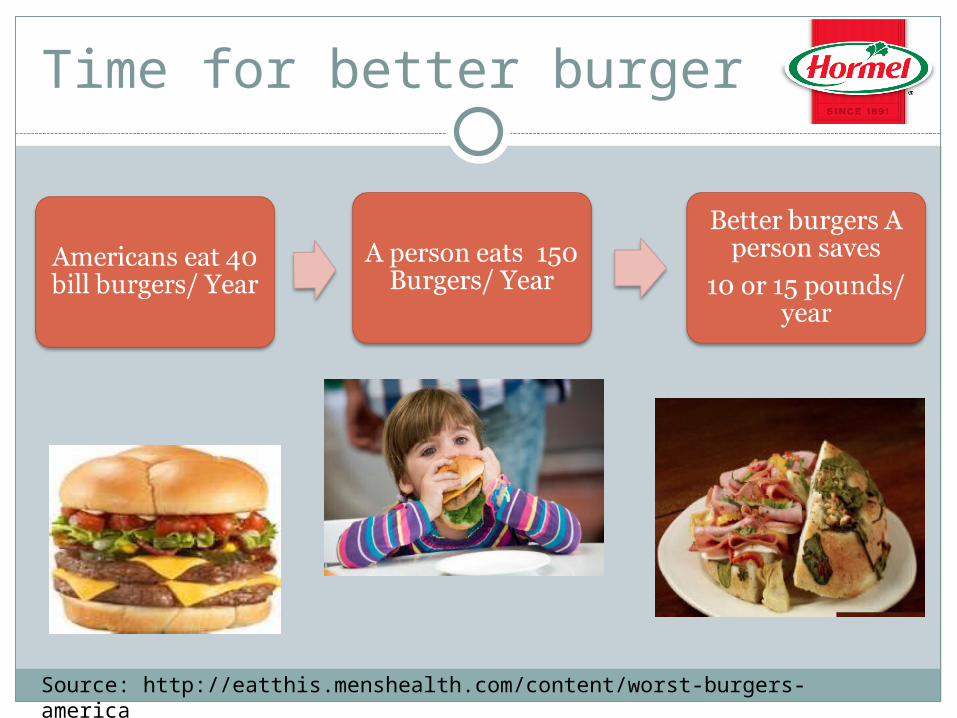
Time for better burger
Source: http://eatthis.menshealth.com/content/worst-burgers-america
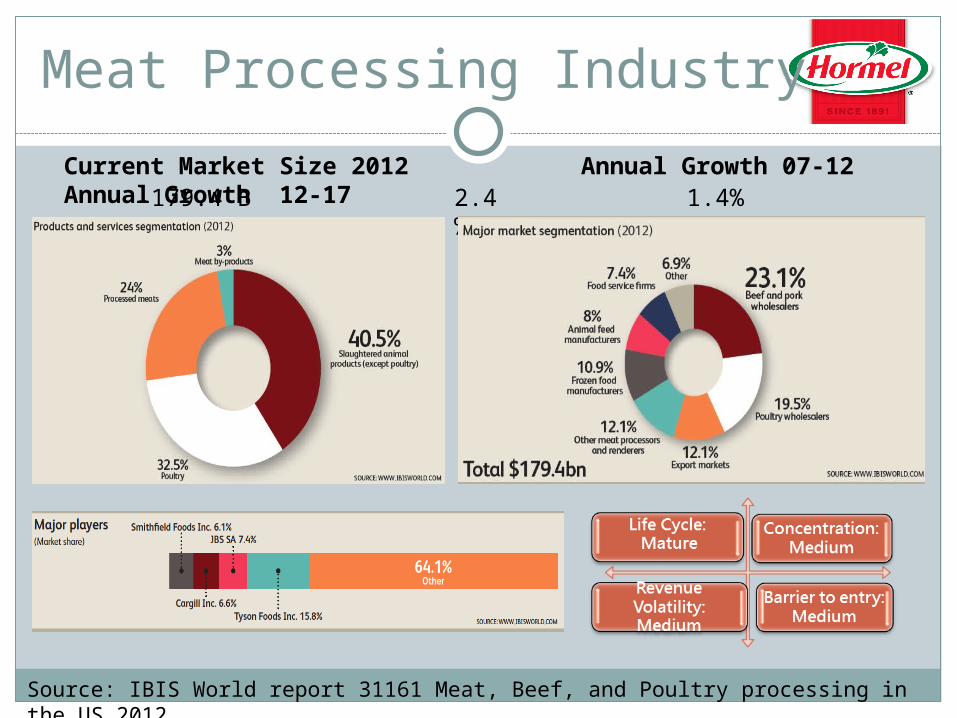
Meat Processing Industry
Current Market Size 2012 Annual Growth 07-12 Annual Growth 12-17 179.4 B 2.4
%1.4%
Source: IBIS World report 31161 Meat, Beef, and Poultry processing in the US 2012
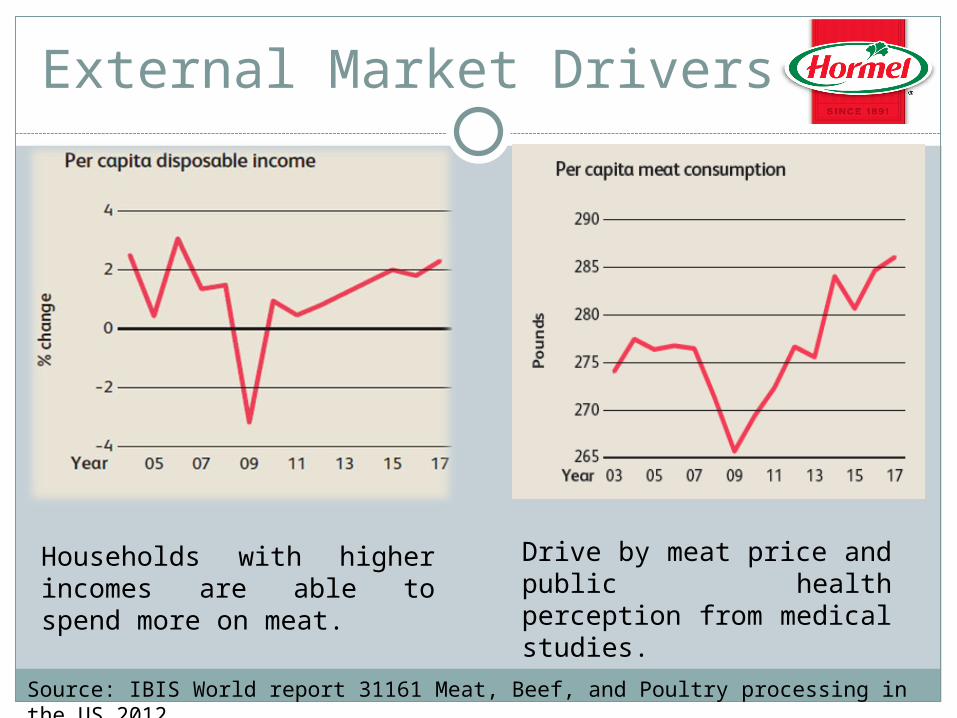
External Market Drivers
Households with higher incomes are able to spend more on meat.
Drive by meat price and public health perception from medical studies.
Source: IBIS World report 31161 Meat, Beef, and Poultry processing in the US 2012

External Market Driver
Meat priceDemand &
Supply
Source: IBIS World, Hormel annual report 2011
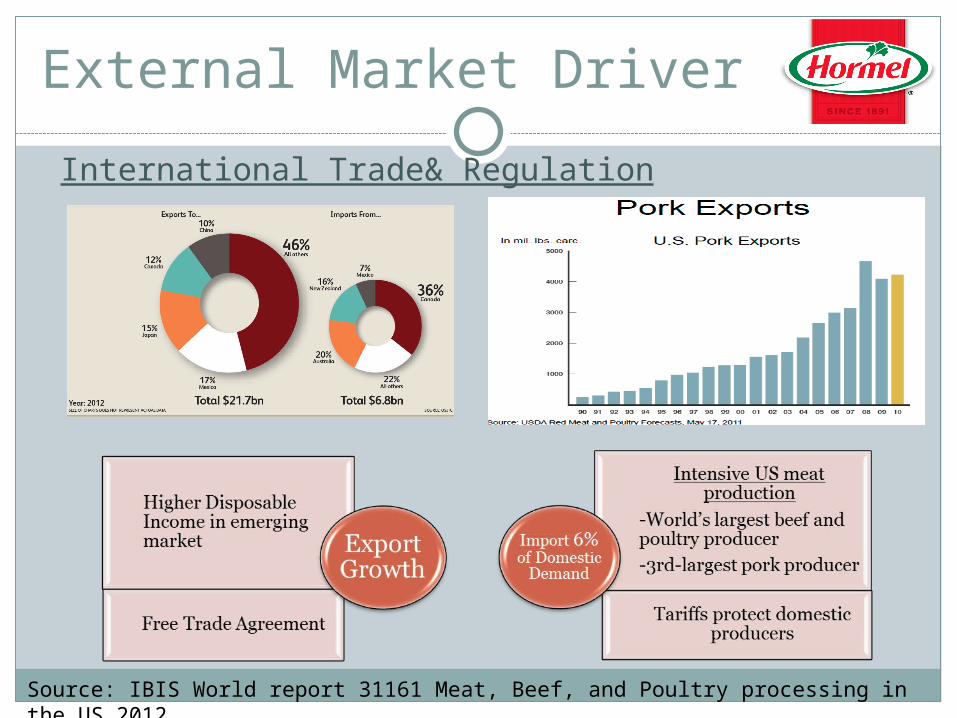
External Market Driver
International Trade& Regulation
Source: IBIS World report 31161 Meat, Beef, and Poultry processing in the US 2012
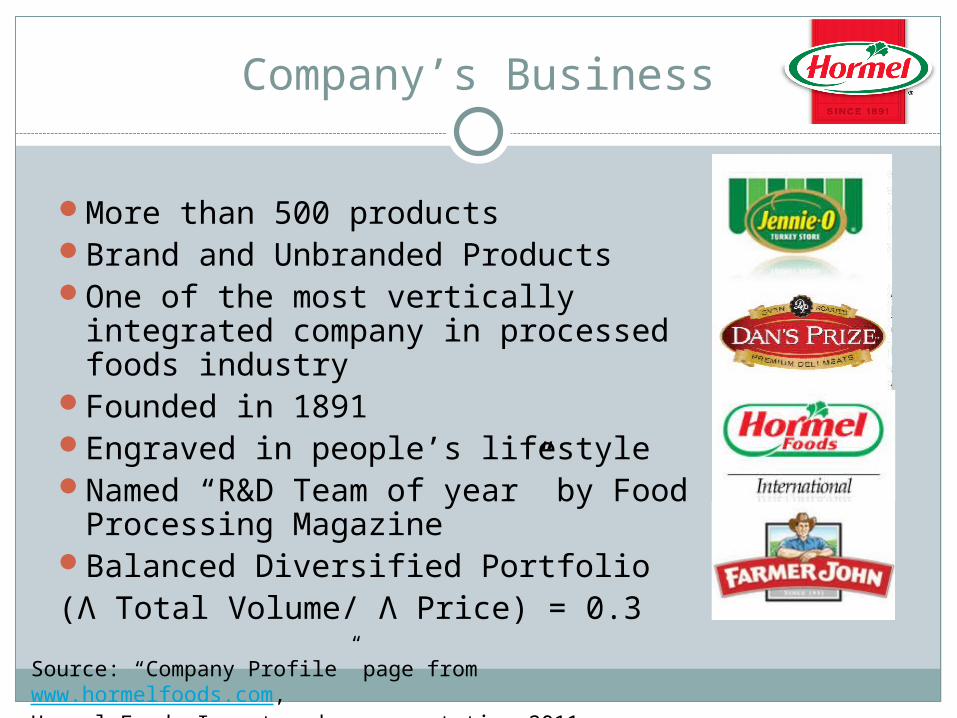
Company’s Business
More than 500 productsBrand and Unbranded ProductsOne of the most vertically integrated
company in processed foods industryFounded in 1891Engraved in people’s lifestyleNamed “R&D Team of year” by Food
Processing MagazineBalanced Diversified Portfolio(Λ Total Volume/ Λ Price) = 0.3
Source: “Company Profile” page from www.hormelfoods.com, Hormel Foods Investor day presentation 2011
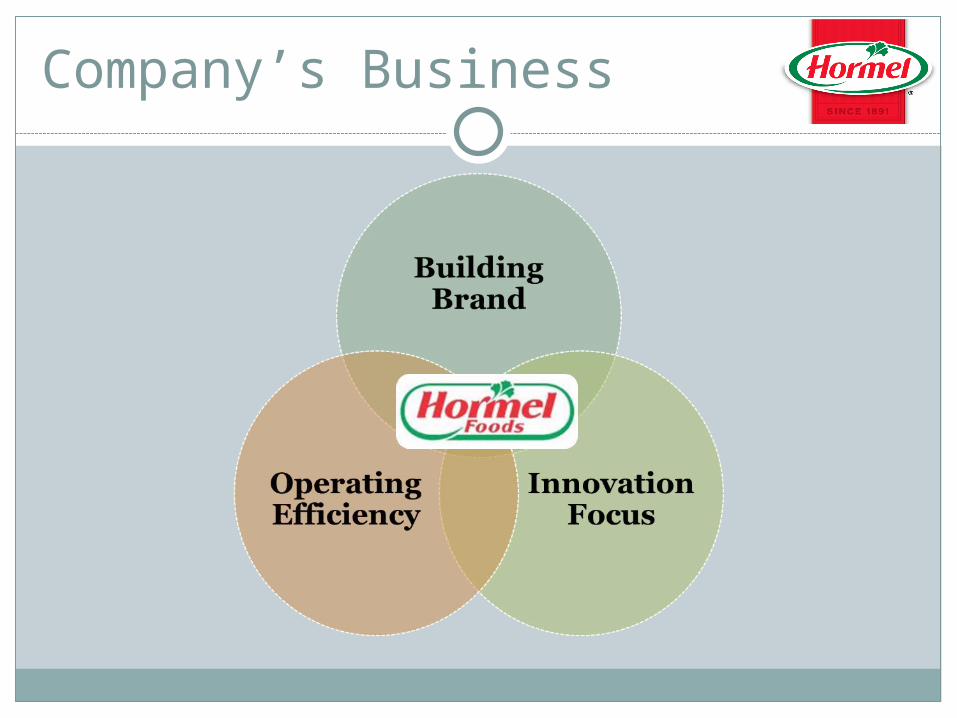
Company’s Business
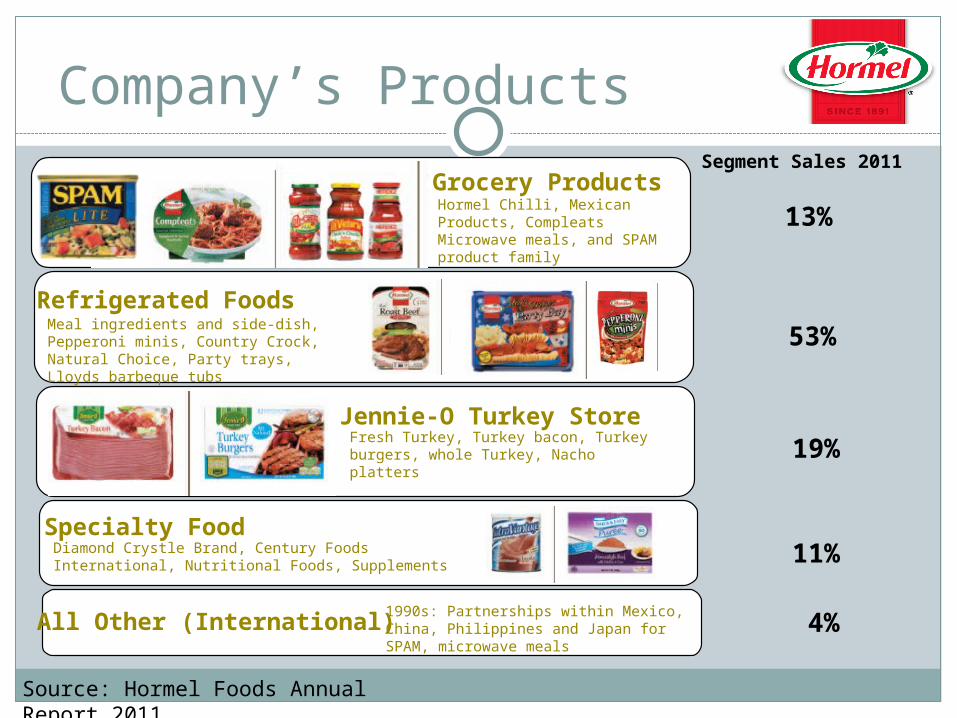
Company’s Products
Grocery Products
Refrigerated Foods
Jennie-O Turkey Store
Specialty Food
All Other (International)
Segment Sales 2011
13%
53%
19%
11%
4%
Hormel Chilli, Mexican Products, Compleats Microwave meals, and SPAM product family
Meal ingredients and side-dish, Pepperoni minis, Country Crock, Natural Choice, Party trays, Lloyds barbeque tubs
Fresh Turkey, Turkey bacon, Turkey burgers, whole Turkey, Nacho platters
Diamond Crystle Brand, Century Foods International, Nutritional Foods, Supplements
1990s: Partnerships within Mexico, China, Philippines and Japan for SPAM, microwave meals
Source: Hormel Foods Annual Report 2011
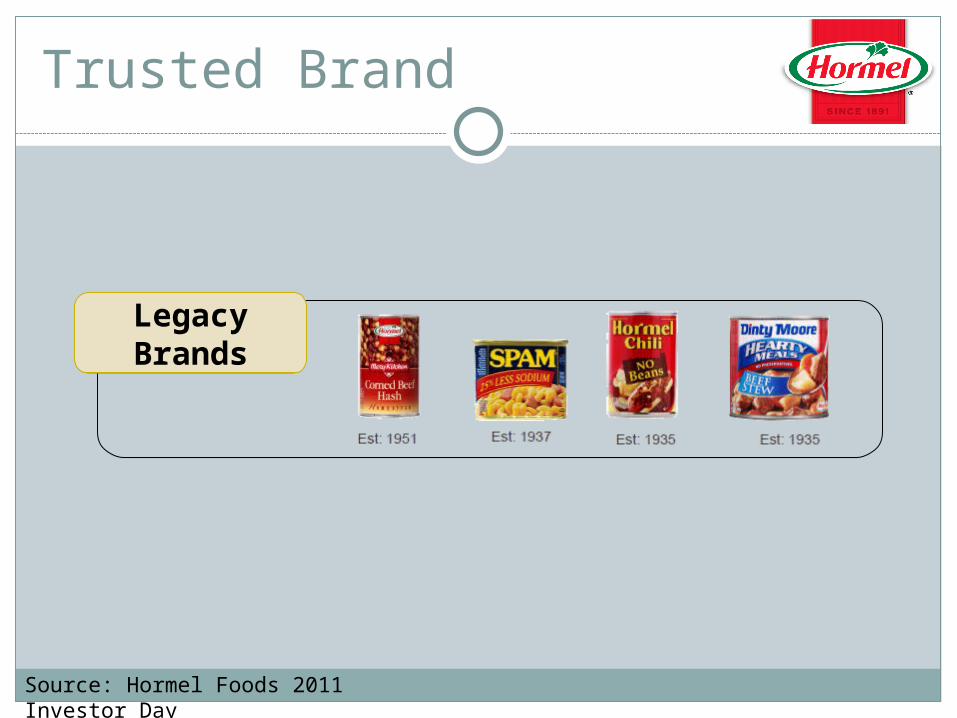
Trusted Brand
Legacy BrandsLegacy Brands
Source: Hormel Foods 2011 Investor Day
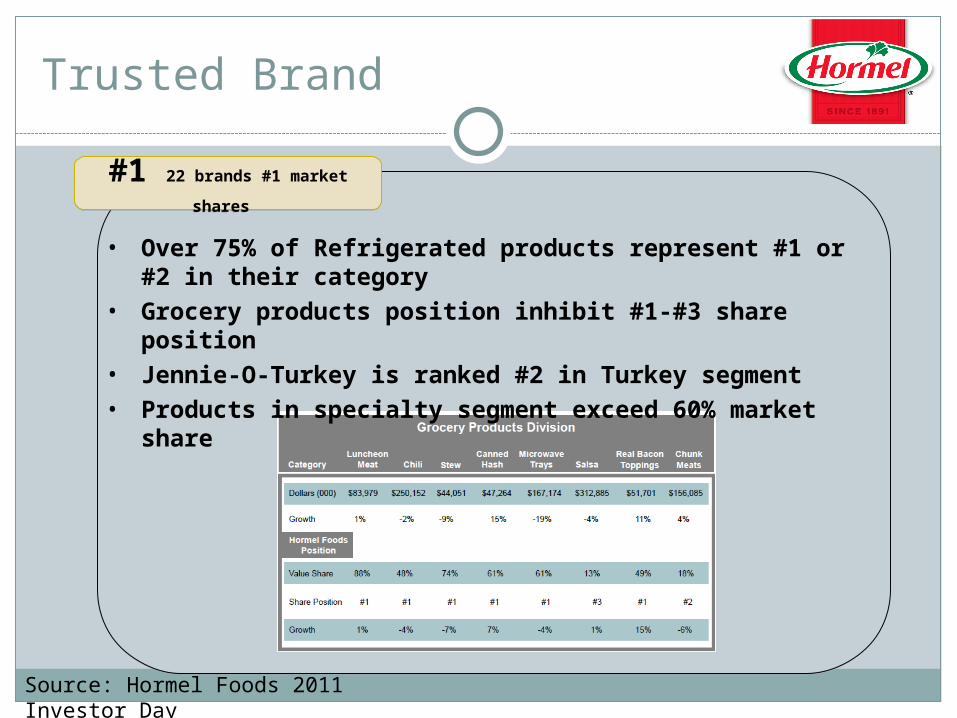
Trusted Brand
#1 22 brands #1 market
shares #1 22 brands #1 market
shares
• Over 75% of Refrigerated products represent #1 or #2 in their category
• Grocery products position inhibit #1-#3 share position
• Jennie-O-Turkey is ranked #2 in Turkey segment• Products in specialty segment exceed 60% market
share
Source: Hormel Foods 2011 Investor Day
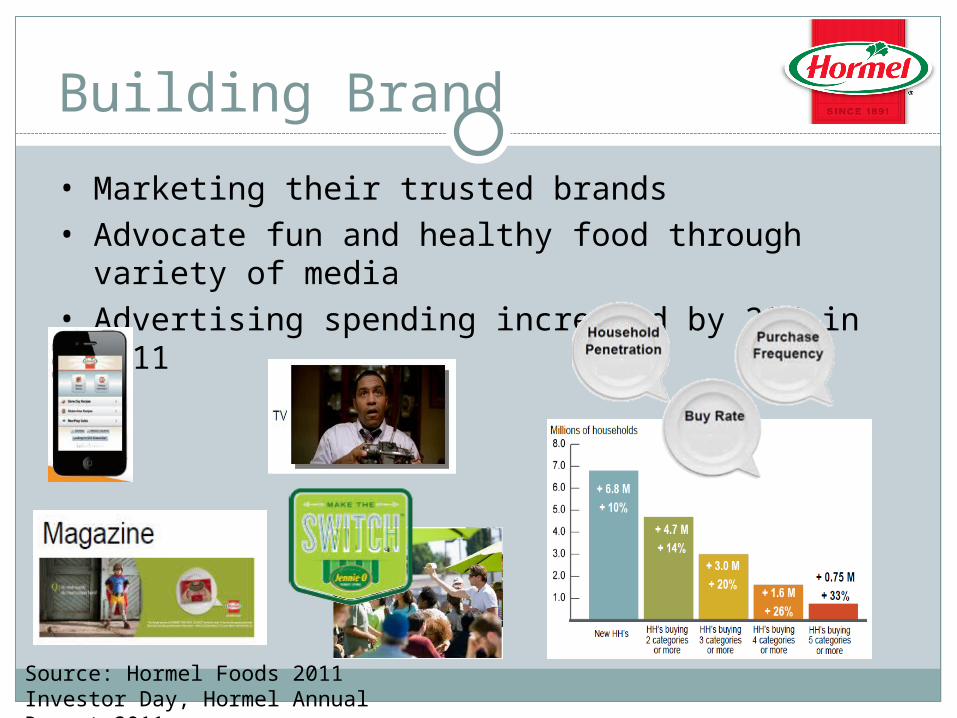
Building Brand
• Marketing their trusted brands• Advocate fun and healthy food through variety of
media • Advertising spending increased by 20% in 2011
Source: Hormel Foods 2011 Investor Day, Hormel Annual Report 2011
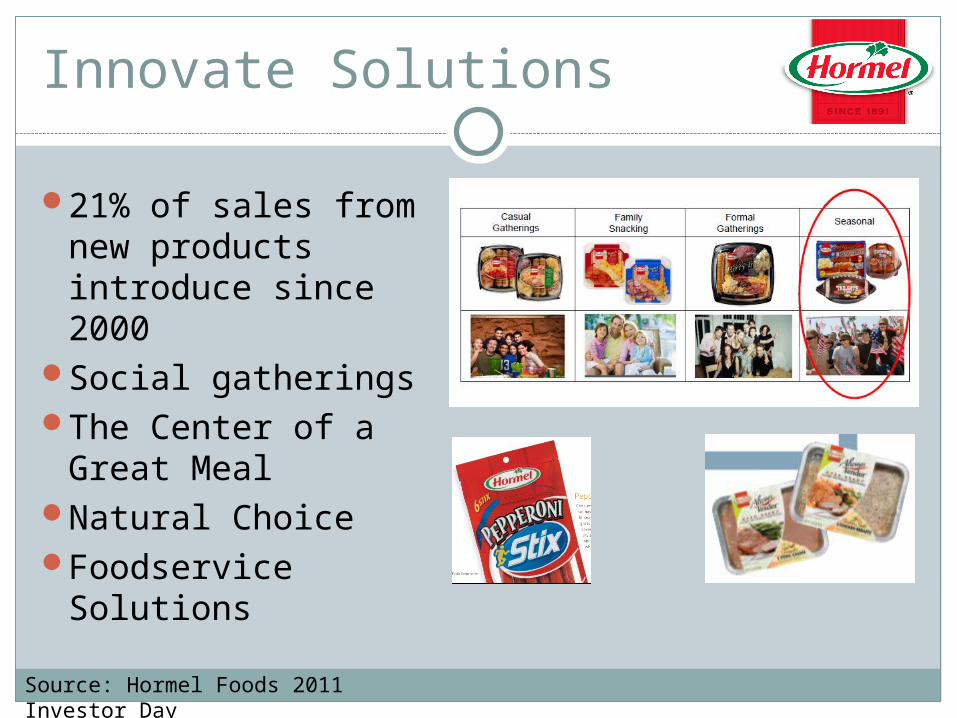
Innovate Solutions
21% of sales from new products introduce since 2000
Social gatheringsThe Center of a
Great MealNatural ChoiceFoodservice
SolutionsSource: Hormel Foods 2011 Investor Day
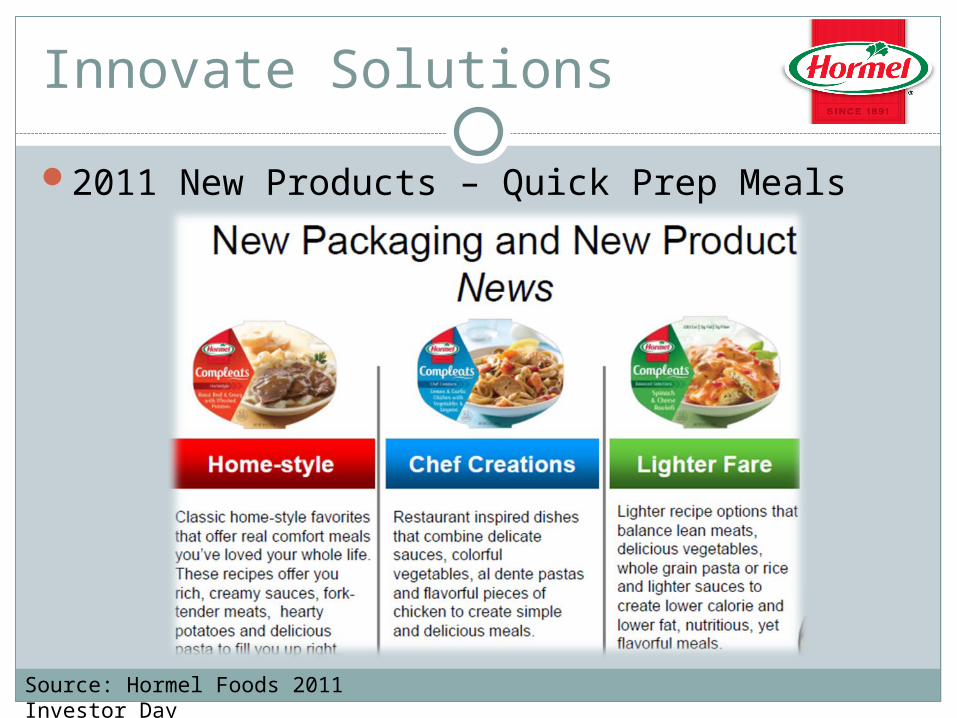
Innovate Solutions
2011 New Products – Quick Prep Meals
Source: Hormel Foods 2011 Investor Day
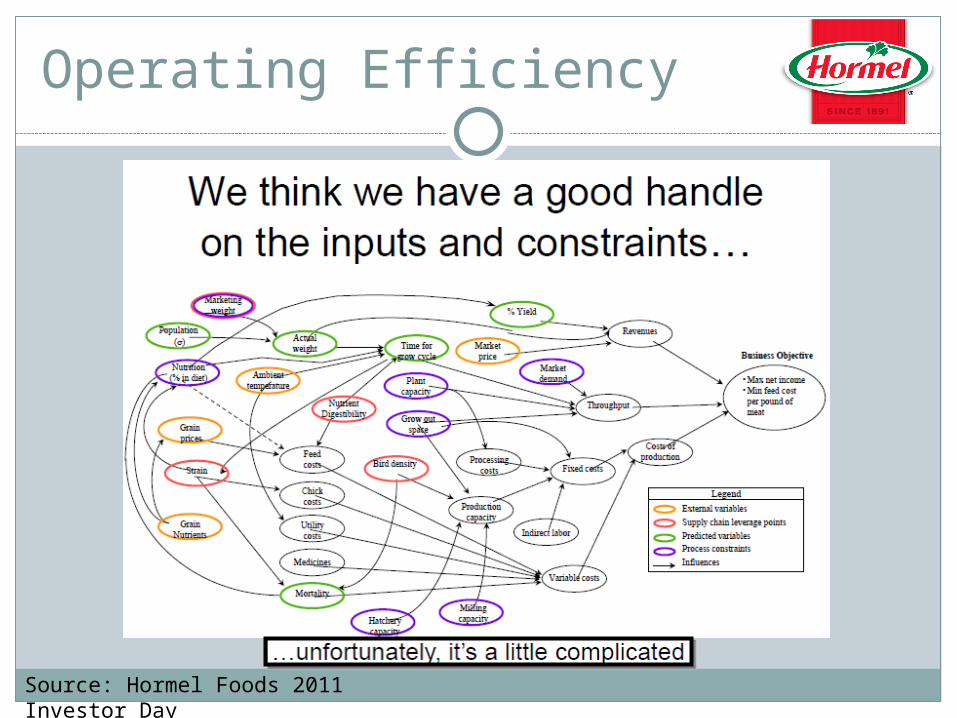
Operating Efficiency
Source: Hormel Foods 2011 Investor Day
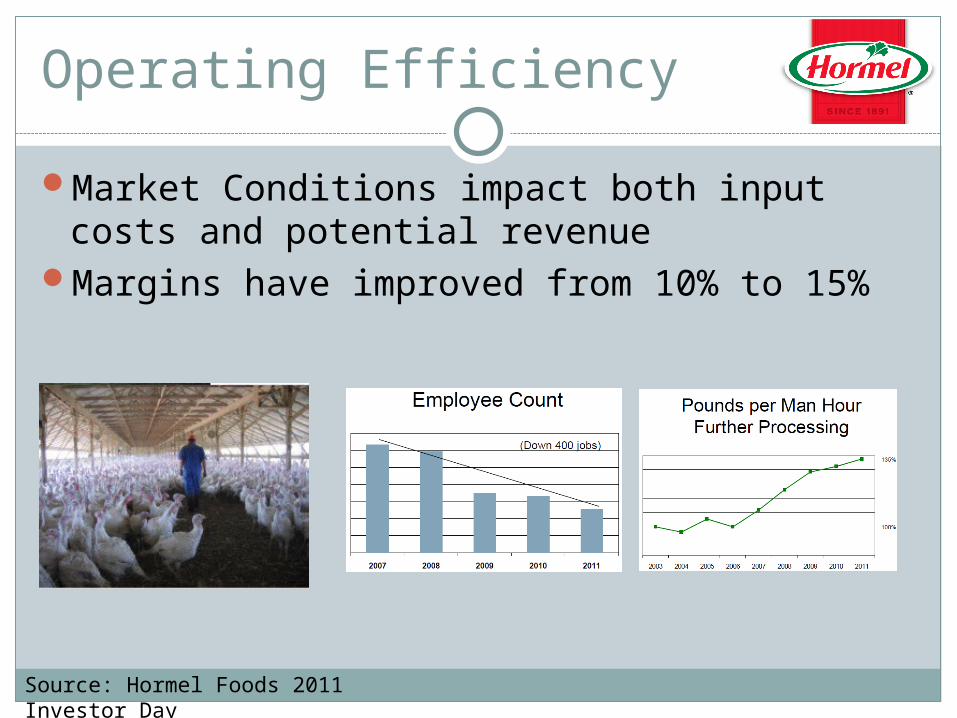
Operating Efficiency
Market Conditions impact both input costs and potential revenue
Margins have improved from 10% to 15%
Source: Hormel Foods 2011 Investor Day
Growth Potential
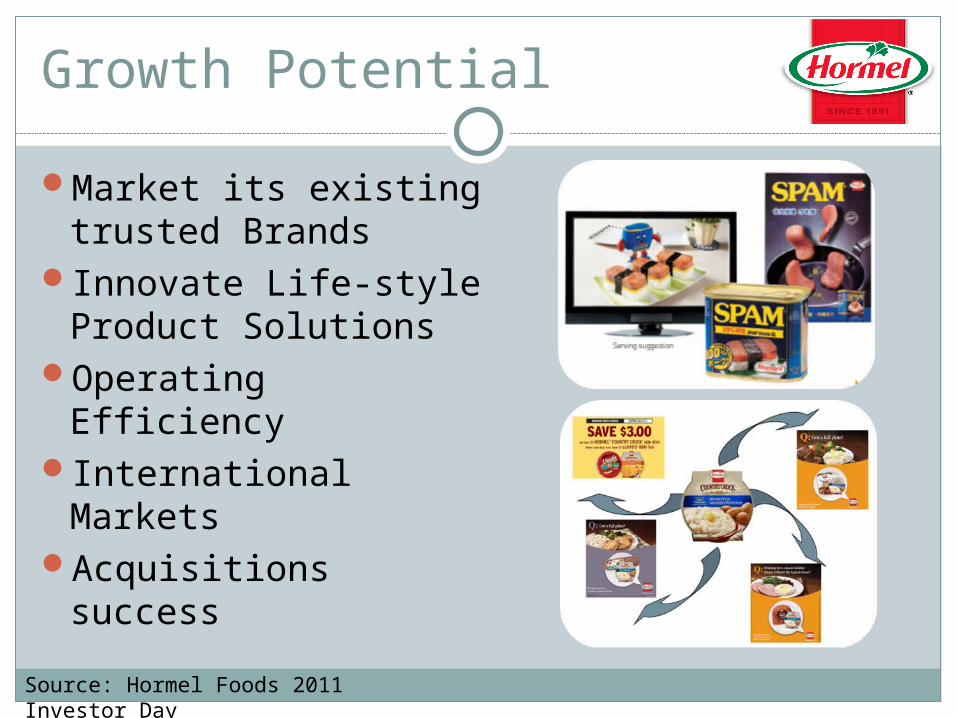
Market its existing trusted Brands
Innovate Life-style Product Solutions
Operating EfficiencyInternational MarketsAcquisitions success
Source: Hormel Foods 2011 Investor Day
Acquisitions
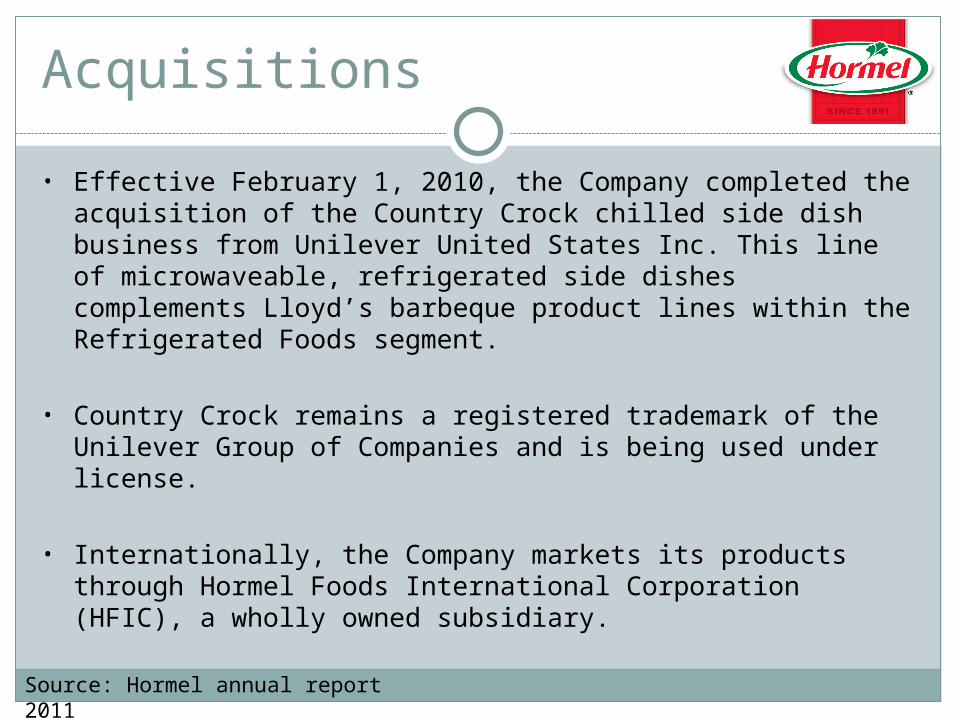
• Effective February 1, 2010, the Company completed the acquisition of the Country Crock chilled side dish business from Unilever United States Inc. This line of microwaveable, refrigerated side dishes complements Lloyd’s barbeque product lines within the Refrigerated Foods segment.
• Country Crock remains a registered trademark of the Unilever Group of Companies and is being used under license.
• Internationally, the Company markets its products through Hormel Foods International Corporation (HFIC), a wholly owned subsidiary.
Source: Hormel annual report 2011
Acquisitions
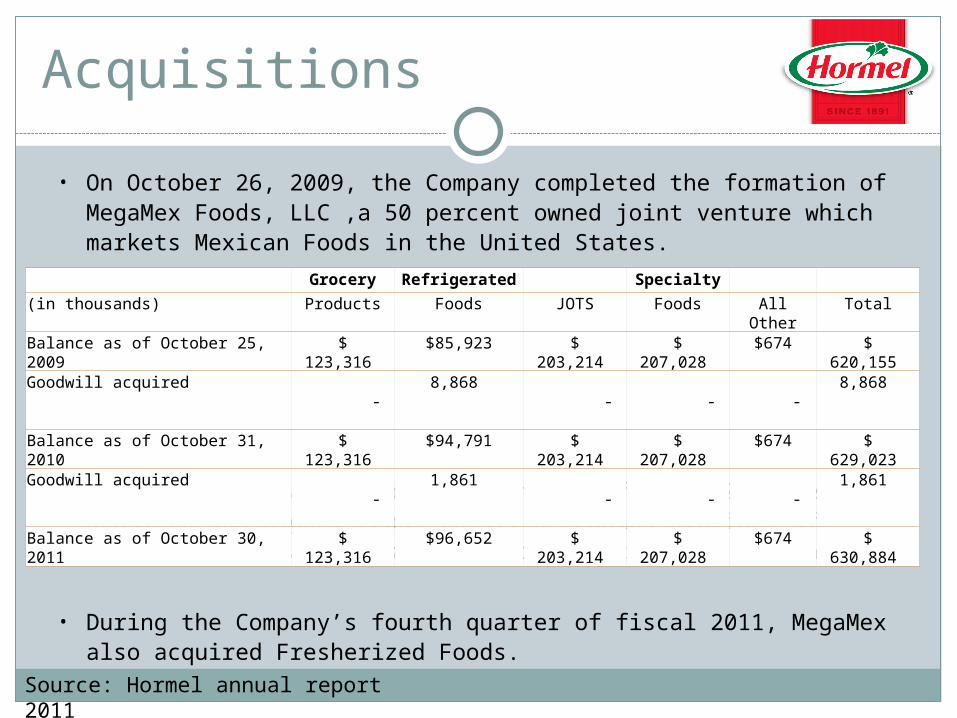
• On October 26, 2009, the Company completed the formation of MegaMex Foods, LLC ,a 50 percent owned joint venture which markets Mexican Foods in the United States.
• During the Company’s fourth quarter of fiscal 2010, MegaMex acquired Don Miguel Foods Corp., a leading provider of branded frozen and fresh authentic Mexican line of Snacks
• During the Company’s fourth quarter of fiscal 2011, MegaMex also acquired Fresherized Foods.
Grocery Refrigerated Specialty
(in thousands) Products Foods JOTS Foods All Other Total
Balance as of October 25, 2009 $ 123,316 $85,923 $ 203,214 $ 207,028 $674 $ 620,155
Goodwill acquired - 8,868 - - - 8,868
Balance as of October 31, 2010 $ 123,316 $94,791 $ 203,214 $ 207,028 $674 $ 629,023
Goodwill acquired - 1,861 - - - 1,861
Balance as of October 30, 2011 $ 123,316 $96,652 $ 203,214 $ 207,028 $674 $ 630,884
Source: Hormel annual report 2011
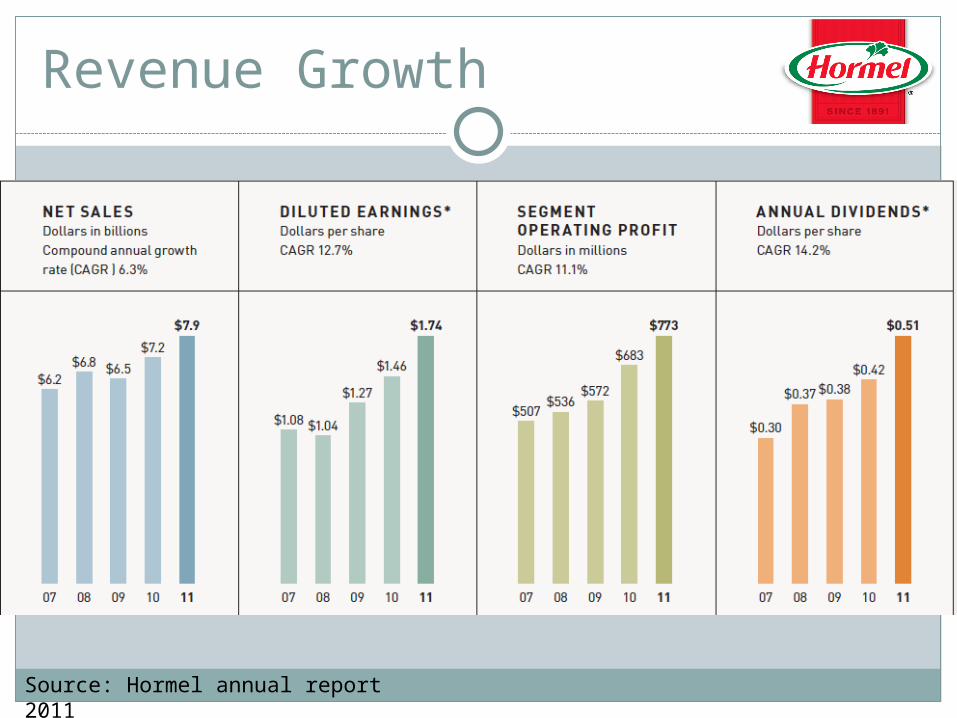
Revenue Growth
Source: Hormel annual report 2011
Financial Position & Performance
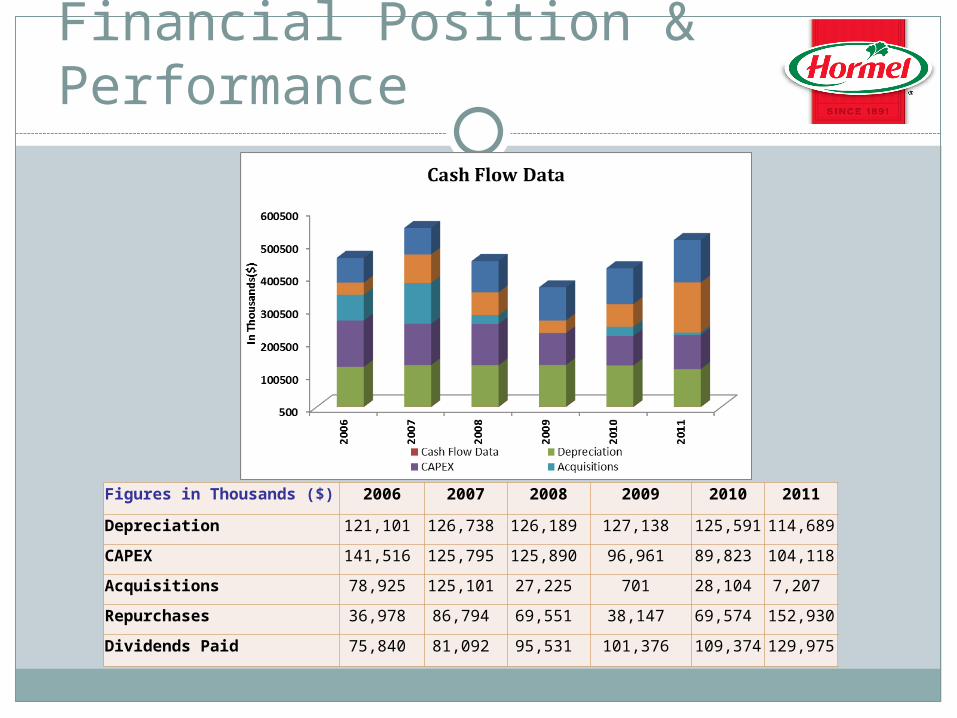
Figures in Thousands ($) 2006 2007 2008 2009 2010 2011
Depreciation 121,101 126,738 126,189 127,138 125,591 114,689
CAPEX 141,516 125,795 125,890 96,961 89,823 104,118
Acquisitions 78,925 125,101 27,225 701 28,104 7,207
Repurchases 36,978 86,794 69,551 38,147 69,574 152,930
Dividends Paid 75,840 81,092 95,531 101,376 109,374 129,975
Financial Position & Performance
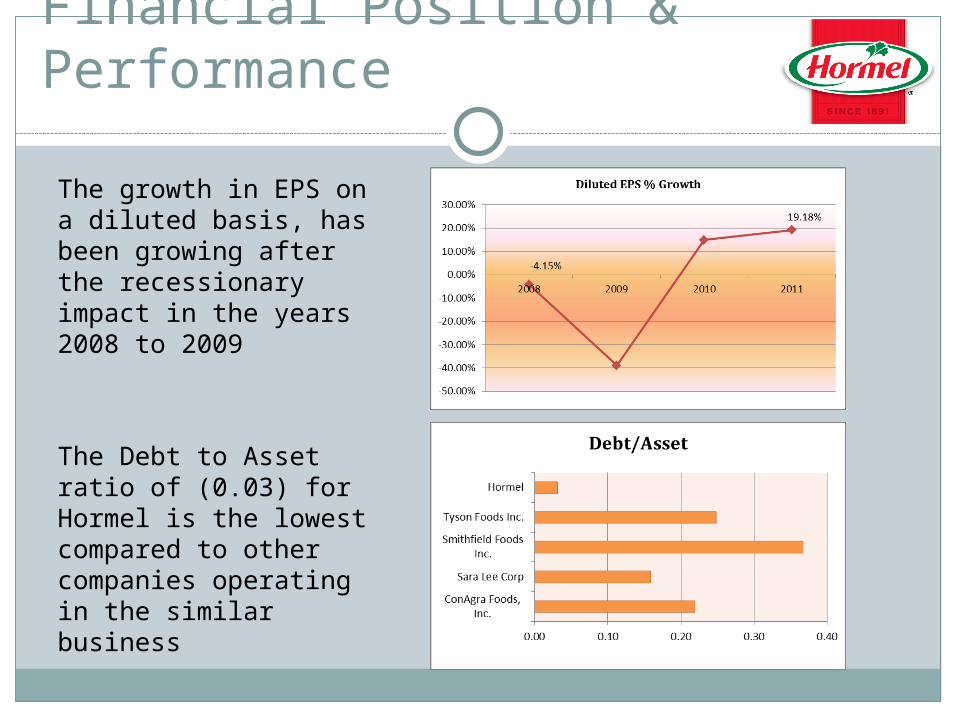
The growth in EPS on a diluted basis, has been growing after the recessionary impact in the years 2008 to 2009
The Debt to Asset ratio of (0.03) for Hormel is the lowest compared to other companies operating in the similar business
Financial Position & Performance
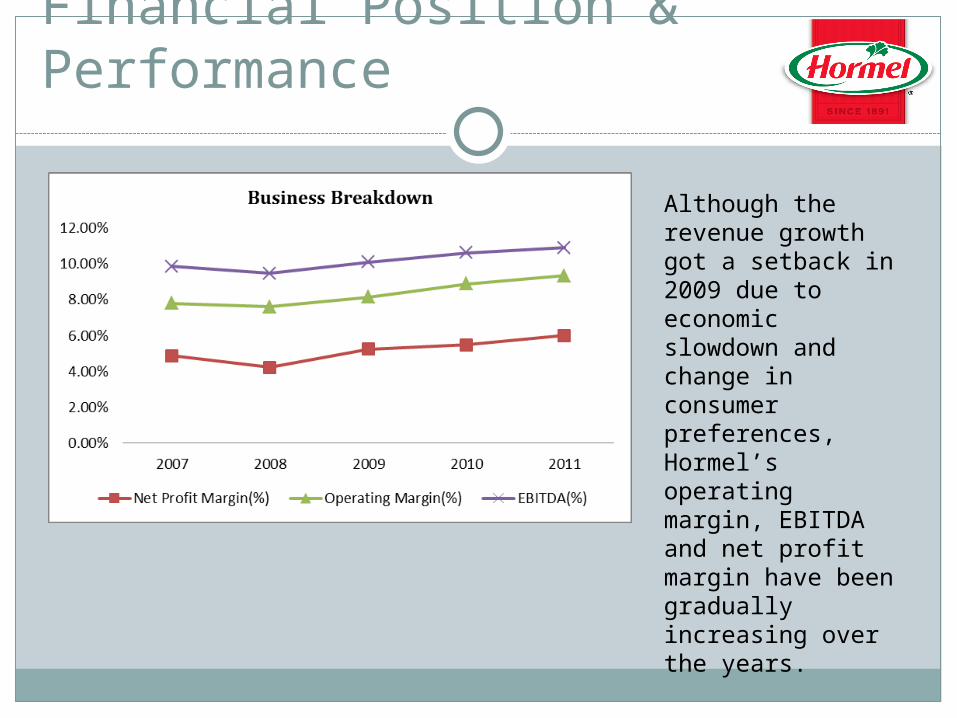
Although the revenue growth got a setback in 2009 due to economic slowdown and change in consumer preferences, Hormel’s operating margin, EBITDA and net profit margin have been gradually increasing over the years.

Return on Equity
2009 2010 2011Profit margin 5.30% 5.54% 6.07%Assets turnover 1.77 1.78 1.86Financial Leverage (A/E) 1.74 1.68 1.60ROE 16.29% 16.61% 18.02%
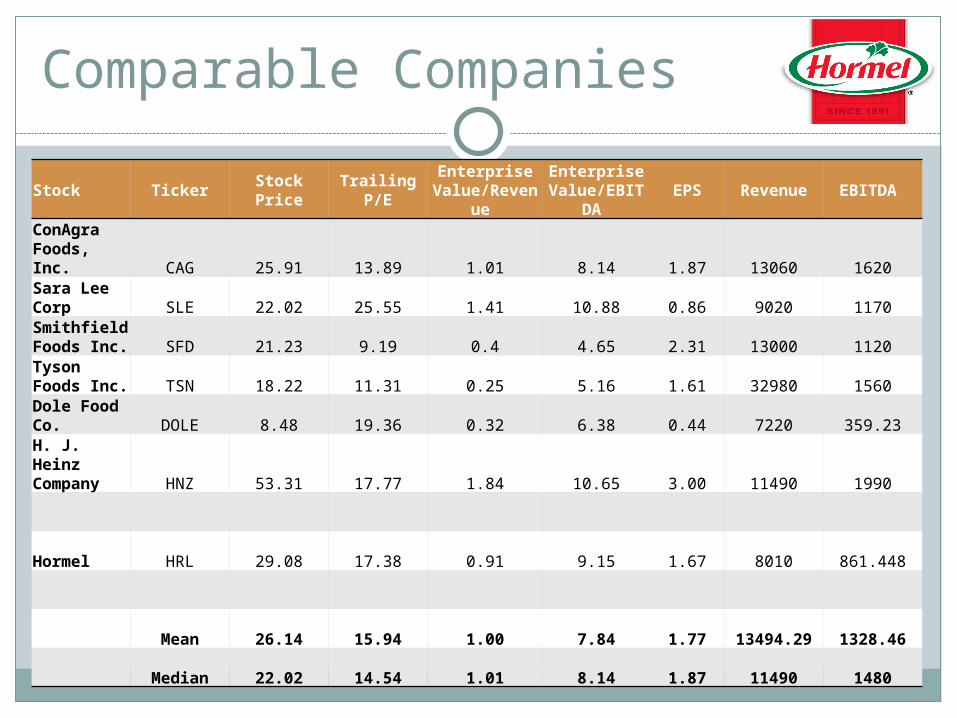
Comparable Companies
Stock TickerStock Price
Trailing P/E
Enterprise Value/Reven
ue
Enterprise Value/EBIT
DA EPS Revenue EBITDA
ConAgra Foods, Inc. CAG 25.91 13.89 1.01 8.14 1.87 13060 1620Sara Lee Corp SLE 22.02 25.55 1.41 10.88 0.86 9020 1170Smithfield Foods Inc. SFD 21.23 9.19 0.4 4.65 2.31 13000 1120Tyson Foods Inc. TSN 18.22 11.31 0.25 5.16 1.61 32980 1560Dole Food Co. DOLE 8.48 19.36 0.32 6.38 0.44 7220 359.23H. J. Heinz Company HNZ 53.31 17.77 1.84 10.65 3.00 11490 1990
Hormel HRL 29.08 17.38 0.91 9.15 1.67 8010 861.448
Mean 26.14 15.94 1.00 7.84 1.77 13494.29 1328.46
Median 22.02 14.54 1.01 8.14 1.87 11490 1480
Comparable Companies
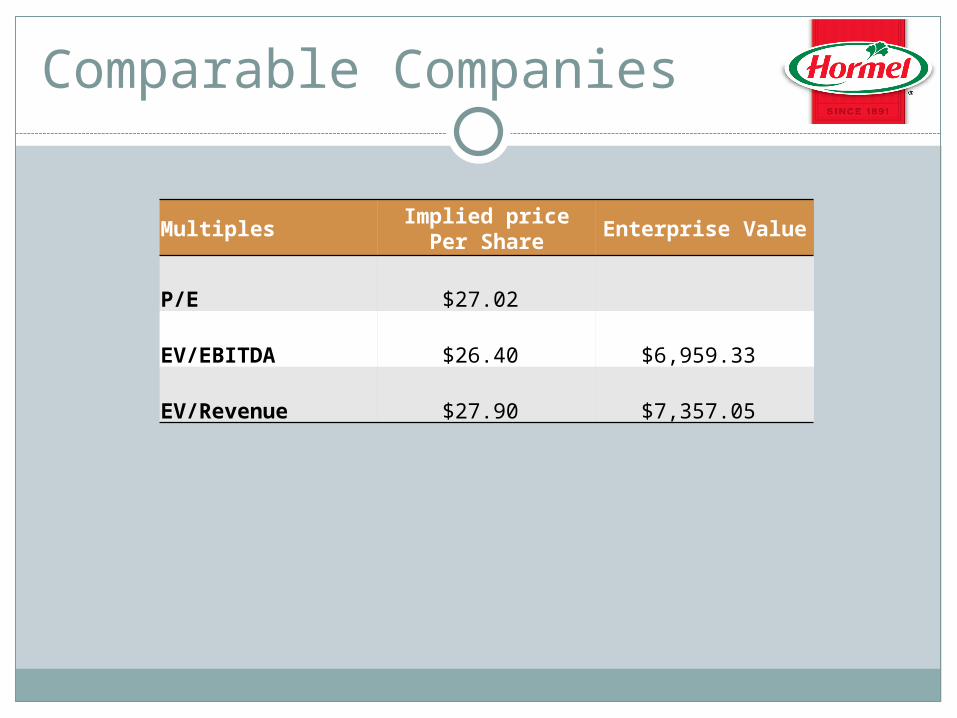
MultiplesImplied price Per
ShareEnterprise Value
P/E $27.02
EV/EBITDA $26.40 $6,959.33
EV/Revenue $27.90 $7,357.05
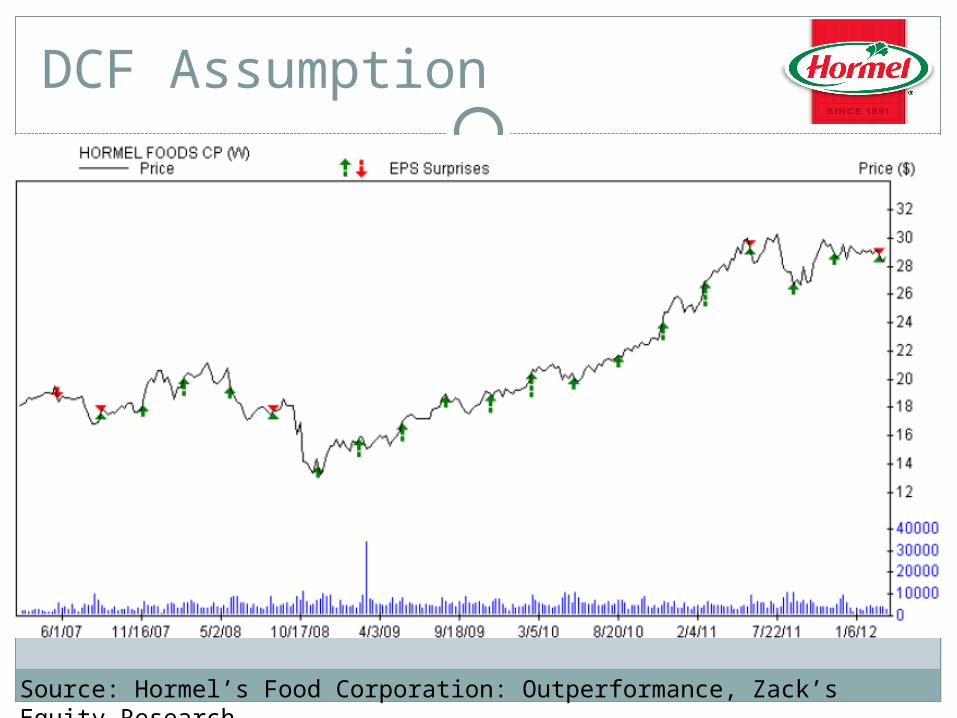
DCF Assumption
Source: Hormel’s Food Corporation: Outperformance, Zack’s Equity Research
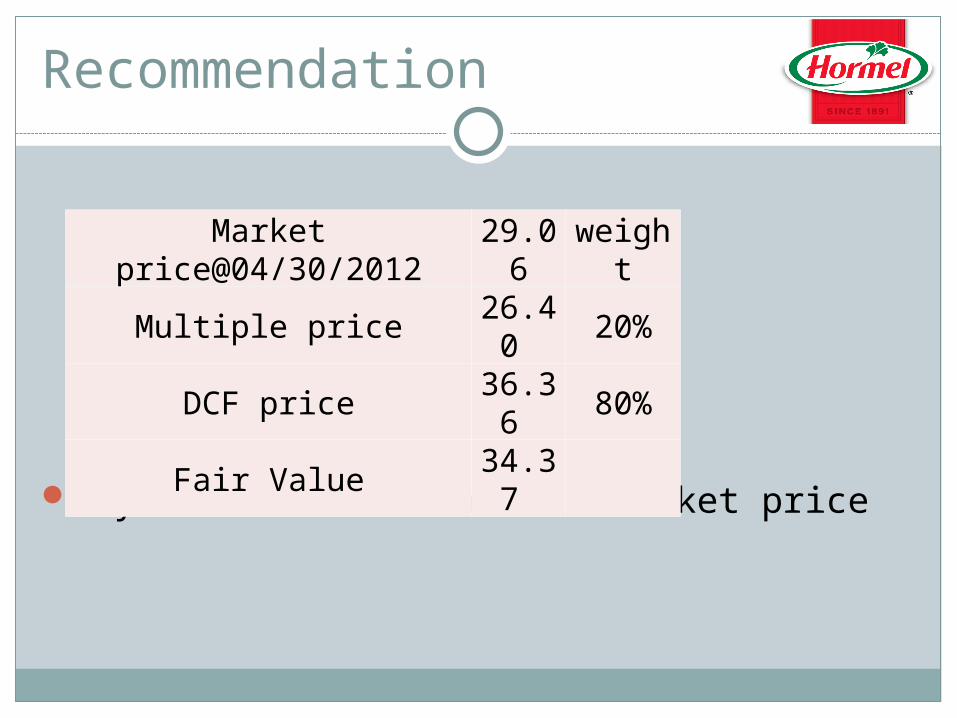
Recommendation
Buy 100 shares Hormel at market price
Market price@04/30/2012
29.06weight
Multiple price 26.40 20%DCF price 36.36 80%Fair Value 34.37