Embed Size (px)
Citation preview

This article was downloaded by: [University of California, San Diego]On: 28 September 2013, At: 05:06Publisher: RoutledgeInforma Ltd Registered in England and Wales Registered Number: 1072954Registered office: Mortimer House, 37-41 Mortimer Street, London W1T 3JH,UK
Total Quality ManagementPublication details, including instructions for authorsand subscription information:http://www.tandfonline.com/loi/ctqm19
Kanji's Business ScorecardGopal K. Kanji & Patrícia Moura e SáPublished online: 25 Aug 2010.
To cite this article: Gopal K. Kanji & Patrícia Moura e Sá (2002) Kanji's BusinessScorecard, Total Quality Management, 13:1, 13-27, DOI: 10.1080/09544120120098537
To link to this article: http://dx.doi.org/10.1080/09544120120098537
PLEASE SCROLL DOWN FOR ARTICLE
Taylor & Francis makes every effort to ensure the accuracy of all theinformation (the “Content”) contained in the publications on our platform.However, Taylor & Francis, our agents, and our licensors make norepresentations or warranties whatsoever as to the accuracy, completeness, orsuitability for any purpose of the Content. Any opinions and views expressedin this publication are the opinions and views of the authors, and are not theviews of or endorsed by Taylor & Francis. The accuracy of the Content shouldnot be relied upon and should be independently verified with primary sourcesof information. Taylor and Francis shall not be liable for any losses, actions,claims, proceedings, demands, costs, expenses, damages, and other liabilitieswhatsoever or howsoever caused arising directly or indirectly in connectionwith, in relation to or arising out of the use of the Content.
This article may be used for research, teaching, and private study purposes.Any substantial or systematic reproduction, redistribution, reselling, loan, sub-licensing, systematic supply, or distribution in any form to anyone is expresslyforbidden. Terms & Conditions of access and use can be found at http://www.tandfonline.com/page/terms-and-conditions

TOTAL QUALITY MANAGEMENT, VOL. 13, NO. 1, 2002, 13- 27
Kanji’s Business Scorecard
Gopal K. Kanji & Patri cia Moura e SaÂSheý eld Business School, Sheý eld Hallam University, City Campus, Sheý eld S1 1WB, UK
abstract The Balanced Scorecard was ® rst devised by Kaplan and Norton (1992, HarvardBusiness Review, January- February, pp. 71- 79) as a measurement framework that was expected
to overcome some of the de® ciencies of traditional performance systems. It gives a holistic view of the
organization by simultaneously looking at four important perspectives (® nancial, customer, internal
processes, innovation and learning). Apart from being a measurement framework, the Balanced
Scorecard achieved recognition as a strategic management system. The new approach to performance
measurement suggested in the Balanced Scorecard is consistent with the initiatives under way in many
companies: cross-functional integration, continuous improvement, customer- supplier partnerships and
team rather than individual accountability. In this sense, it ® ts well into the quality management
philosophy, embracing some of the business excellence principles of Kanji’s Business Excellence Model.
Nevertheless, the Balanced Scorecard, as presented by Kaplan and Norton, is not without limitations.
The causality links suggested among the four perspectives are particularly problematic and ambiguous.
Additionally, it fails to recognize explicitly the contributions of important stakeholders, such as
employees and suppliers. Taking into account the potentialities and limitations of the traditional
Balanced Scorecard, we propose the development of a new framework integrating the elements of
Kanji’s Business Excellence Model and taking advantage of the strengths of its sound methodological
support. The Business Scorecard may be improved by integrating the total quality management
principles and critical success factors that constitute Kanji’s Business Excellence Model. The Kanji’s
Business Scorecard we present in this paper is not only a conceptual model, but also a measurement
model. Furthermore, Kanji’s approach has the potential to give a deeper understanding of how
achievements in the diþ erent areas feed each other to form a cycle of continuous improvement.
Finally, the implementation of Kanji’s Business Scorecard can help organizations to develop, cascade
and implement a strategy for business excellence.
Review of the literature on the Balanced Scorecard
Origins and principles
Today managers compete in such a competitive and complex environment that establishingaccurate goals and understanding how they can be achieved is vital. In this context, it is atruism to say that eþ ective management depends on the eþ ective measurement of performanceand results. Executives understand that their organization’s measurement system stronglyaþ ects the behaviour of managers and employees (Kaplan & Norton, 1992). It is thereforedesirable that the system is linked to the espoused strategy of the organization in order tohave the maximum impact.
Correspondence: G. K. Kanji, Kanji Quality Culture Ltd, Sheý eld Science & Technology Park, Cooper Building,Unit 13, Arundel Street, Sheý eld S1 2NS, UK. Tel: +44 (0)114 221 2003; Fax: +44 (0)114 221 2006;E-mail: [email protected]
ISSN 0954-4127 print/ISSN 1360-0613 online/02/010013-15 © 2002 Taylor & Francis LtdDOI: 10.1080/09544120120098537
Dow
nloa
ded
by [
Uni
vers
ity o
f C
alif
orni
a, S
an D
iego
] at
05:
06 2
8 Se
ptem
ber
2013

14 G. K. KANJI & P. MOURA E SAÂ
Traditional ® nancial measures do not match entirely with the competencies and skillscompanies need to face today’s business environment. Recognition is given to the view thatpurely ® nancial evaluation of performance is not enough in an environment where non-® nancial assets, business relationships and organization’s capabilities increasingly determinethe prospects for success (Kaplan & Norton, 1996).
Accounting ® gures do not emphasize the elements that will lead to good or poor future® nancial results. The problem may even be aggravated if the company is in a situation inwhich it feels forced to pursue short-term ® nancial results rather than the organization’slong-term goals ( Johnson & Kaplan, 1987; Kaplan, 1984). Broader performance measure-ment systems are increasingly seen as a device for delivering long-term strategic objectives(Butler et al., 1997). On realizing the shortcomings of ® nancial measures (and managementaccounting in particular), operational measures began to take a more important role in themeasurement of business performance.
As Kaplan and Norton (1992) argue, no single measure can provide a clear performancetarget or focus attention on the critical areas of the business. The complexity of managing anorganization today requires managers to view performance in several areas simultaneously.Managers need a real time balanced presentation of both ® nancial and operational measures.In reality, many organizations have for a long time already been using measurement systemsincorporating ® nancial and non-® nancial measures, but the Balanced Scorecard goes beyondthat by driving measures from the organization’s mission and strategy (Kaplan & Norton,1996).
Kaplan and Norton devised a `Balanced Scorecard’ Ð a set of measures that givesmanagers a fast but comprehensive view of the business. The Balanced Scorecard includes® nancial measures that tell the results of actions already taken; and it complements the® nancial measures with operational measures on customer satisfaction, internal processesand the organization’s innovation and improvement activitiesÐ operational measures that arethe drivers of future ® nancial performance. Therefore, it enables companies to track ® nancialresults while simultaneously monitoring progress in building the capabilities and acquiringthe intangible assets they would need for future growth.
Many have criticized ® nancial measures because of their inadequacies, their backward-looking focus and their inability to re¯ ect contemporary value-creating activities. Financialindicators are typically considered to be l̀agging indicators of performance’ because theyrecord the eþ ect of decisions not when decisions are made, but rather as the ® nancial impactof these decisions materializes, which can be long after the decision was made (Epstein &Manzoni, 1998).
According to Kaplan and Norton (1996), the Balanced Scorecard must retain a strongemphasis on ® nancial outcomes, which ultimately are the result of the causal paths establishedin the scorecard. Thus, ® nancial results are obtained by successful implementation of strategicinitiatives in key business process perspectives (Mooraj et al., 1998). As stated by Kaplanand Norton (1992), `̀ the hard truth is that if improved performance fails to be re¯ ected inthe bottom line, executives should re-examine the assumptions of their strategy and mission’’ .
The Balanced Scorecard allows managers to look at the business from four importantperspectives, thus constituting a holistic view of the organization (see Fig. 1). It providesanswers to four basic questions (Kaplan & Norton, 1992):
· How do customers see us? (Customer perspective.)· What must we excel at? (Internal perspective.)· Can we continue to improve and create value? (Innovation and learning perspective.)· How do we look to shareholders? (Financial perspective.)
Dow
nloa
ded
by [
Uni
vers
ity o
f C
alif
orni
a, S
an D
iego
] at
05:
06 2
8 Se
ptem
ber
2013

KANJI’S BUSINESS SCORECARD 15
Figure 1. The Balanced Scorecard links performance measures (Kaplan & Norton, 1992).
The Balanced Scorecard: Contributions, strengths and weaknesses
The Balanced Scorecard (BSC) is distinct from other strategic measurement systems in thatit contains outcome measures and the performance drivers of outcomes (Kaplan & Norton,1996, pp. 31, 53). One of the reasons the BSC is such a powerful tool is precisely that itstresses the linkages for achieving outstanding performance in related measures, rather thanconcentrating on isolated measures. As Hepworth (1998) puts it, `̀ the added value of thebalanced scorecard is in the drawing together of all the key business areas and identifying thelinkages that deliver success’ ’ . Thus, the scorecard helps to ® ght suboptimization by forcingmanagers to consider all key measures that collectively are critical for the success of theorganization and highlighting the need to analyse trade-oþ s (Letza, 1996; Tsang, 1998). Themeasurement system should then make the relationships among objectives (and measures) inthe various perspectives explicit so that they can be managed and validated.
The BSC claims to identify cause-and-eþ ect relationships between the diþ erent elementsof an organization. Nù rreklit (2000), however, considers that these relationships are problem-atic. The causality between quality and ® nancial results, for instance, has not been provedon an empirical basis. In addition, according to Nù rreklit (2000) if a cause-and-eþ ectrelationship requires a time lag between cause and eþ ect, then it is problematic that the timedimension is not part of the scorecard. Nù rreklit (2000) concludes that there is no causalrelationship between measures from the four perspectives. Instead, the arguments indicatethat the perspectives are interdependent. The in¯ uence between measures is not unidirectionalin the sense that learning and growth are the drivers of internal business processes, whichare the drivers of customer satisfaction, which in turn is the driver of ® nancial results. The
Dow
nloa
ded
by [
Uni
vers
ity o
f C
alif
orni
a, S
an D
iego
] at
05:
06 2
8 Se
ptem
ber
2013

16 G. K. KANJI & P. MOURA E SAÂ
reasoning is circular. So instead of a cause-and-eþ ect relationship, the relationship betweenthe areas is more likely to be one of interdependence.
Probably, the main bene® t of the BSC is its ability to translate an organization’s visionand strategy into tangible objectives and measures. The BSC uses indicators to communicatea strategy and to measure the success of its implementation. To translate the corporate goalsinto operational terms, the company’s BSC should be deployed to each business unit. Asstated by Mooraj et al. (1998), `̀ by evaluating the relevant factors of each segment of theBalanced Scorecard which may have an impact on a ® nancial aim, the appropriate measurescan be identi® ed and the alignment of actions to the strategic goal is facilitated’’ . Usedcorrectly it can empower an organization by operationalizing the strategy discussion, andthen by assigning the accountability for well-de® ned results (Gering & Rosmarin, 2000).
As recognized by Mintzberg (1994) among many others, strategy implementation is thecause of many problems. The process of building a scorecard clari® es the strategic objectivesand identi® es the critical few drivers for strategic success. Therefore, the BSC is more thana performance measurement system. It is commonly adopted as a strategic managementsystem to (Kaplan & Norton, 1992, 1996; McClintock, 2000):
· describe the organization’s vision of the future and create shared understanding;· clarify and update corporate strategy;· communicate strategic objectives throughout the organization (it establishes a com-
munication system that bridges the gap between goals set by high-level executives andthe front-line workers whose performance is ultimately responsible for reaching thesegoals);
· align customer needs and business objectives;· work as a holistic model of the strategy allowing all employees to see how they
contribute to organizational success, and contributing to aligning departmental andpersonal goals to corporate strategy;
· focus change eþ orts, by identifying opportunities for initiatives in the areas that arelagging behind;
· link strategic objectives to targets and budgets (® nancial and physical resources mustbe aligned to the strategy; long-run capital budgets, strategic initiatives and annualexpenses must all be directed to achieving targets for the objectives and measures ofthe scorecard);
· build a reward system that is geared to achieving targets (alignment and accountabilitywill be enhanced when individual contributions to achieving scorecard objectives arelinked to recognition, promotion and compensation programmes);
· align strategic and operational reviews;· obtain feedback on the eþ ectiveness of the strategy policy deployment and implementa-
tion to track progress over time and facilitate strategic review.
Kaplan and Norton (1996) also claim that the BSC is a useful tool to translate the visionand strategy into actions at local level. In Kaplan and Norton’s (1996, p. 47) words, `̀ thescorecard should tell the story of the strategy, starting with the long-run ® nancial objectives,and then linking them to the sequence of actions that must be taken with ® nancial processes,customer internal processes, and ® nally employees and systems to deliver the desired long-run economic performance’’ . The main message is that in the short and medium term theultimate ® nancial objectives can be reached by adequate customer service and an eþ ectivebusiness process only. However, in order to sustain success in the long term, the organizationmust also realize its objectives concerning the learning and growth perspective (Lengyel,2000). A good BSC should have a mix of outcome measures (lag indicators) and performancedrivers (lead indicators) (Nù rreklit, 2000).
Dow
nloa
ded
by [
Uni
vers
ity o
f C
alif
orni
a, S
an D
iego
] at
05:
06 2
8 Se
ptem
ber
2013

KANJI’S BUSINESS SCORECARD 17
Thus, the aim of the BSC is to present management with a concise summary of the keysuccess factors of a business, and to facilitate the alignment of business operations with theoverall strategy (Mooraj et al., 1998). This brings a signi® cant bene® t of developing a BSC:it is a learning exercise in which ® rms improve knowledge of their activities and processes.The BSC constitutes an eþ ective learning process, since it integrates: (1) a shared strategicframework that communicates the strategy and allows each participant to see how tocontribute to achievement of the overall strategy; (2) a feedback process that collectsperformance data about the strategy and allows the hypothesis about interrelationships amongstrategic objectives and initiatives to be tested; and (3) a team problem-solving process thatanalyses and learns from the performance data and then adapts the strategy to emergingconditions and issues (Kaplan & Norton, 1996).
Like every other major change, the development and adoption of the BSC requires thefull engagement and commitment of the leadership at the top. Introducing a BSC inevitablybrings some change and resistance. Changes aþ ecting the availabilit y of performance-relatedinformation can be particularly threatening, as they have the potential of modifying thebalance of power within the organization (Epstein & Mazoni, 1998).
To be eþ ective, the model has to be rooted in the management and the organization. Suchrooting requires the scorecard to ® t the concepts and relationships which the management usewhen the company formulates its strategy and vision (Nù rreklit, 2000). Additionally, theunique culture and existing company philosophy have to be incorporated in the scorecardfor it to be acceptable to managers (Letza, 1996).
In sum, the BSC has strengths and weaknesses.
Strengths of the BSC approach
· It puts together, in a single report, many of the seemingly disparate elements of acompany’s competitive agenda.
· Ability to translate an organization’s vision and strategy into tangible objectives andmeasures.
· Holistic approach to performance measures.· Focus on a limited number of critical measures (avoiding information overload).· Flexibility and adaptability to ® t each organization in particular.· By forcing managers to consider all the important operational measures together, gives
a sense of interdependency among diþ erent organizational areas.· Strong focus on customer and market.· Forces managers to develop a clear and shared view of what they are trying to achieve
and what are the critical levers and means to reach those objectives (Epstein &Manzoni, 1998), helping to focus everyone’s attention toward the future.
· Easy to use.
Weaknesses of the BSC approach
· A conceptual model only (not easy to convert into a measurement model).· Interactions between criteria are not clearly shown.· Causal relationships are problematic (more like interdependence).· Not a comprehensive system approach, focus is only on customers, forgetting other
important stakeholders.· Only focus on results.
Dow
nloa
ded
by [
Uni
vers
ity o
f C
alif
orni
a, S
an D
iego
] at
05:
06 2
8 Se
ptem
ber
2013

18 G. K. KANJI & P. MOURA E SAÂ
Atkinson et al. (1997) point out other weaknesses:
· It fails to highlight employee and supplier contributions (also Nù rreklit, 2000).· It does not identify the role of the community in de® ning the environment within
which the company works.· It focuses primarily (and almost exclusively) on top-down performance measurement.
Nù rreklit (2000) adds that:
· It does not monitor the competition (the emphasis on the customer perspectiveimplicitly ignores the broader market perspective) or technological developments,which means that the focus of the model is static rather than dynamic.
· The control model is highly top-down, making the required interactive control anddouble-loop learning diý cult.
· Due to its top-down strategy, the BSC will primarily create external commitment(based on manager’s orders and rewards). If the external commitment is too high,then it motivates employees to focus their attention on what is measured (Hollowayet al., 1995).
The process of building and implementing a BSC must be customized. As Kaplan andNorton (1996) state `̀ the balanced scorecard is not a template that can be applied to abusiness in general or even industry wide. The speci® c content of the four `boxes’ of theBalanced Scorecard must be adapted to the circumstances of each organisation. Businessunits devise customised scorecards to ® r their mission, strategy and culture’ ’ .
Epstein and Manzoni (1998) state that Kaplan and Norton’s four perspectives arepresented as an organizing framework rather than a constraining straight-jacket. They suggesta few potential additional perspectives for the BSC, including the impact of the ® rm onsociety and the ® rm’s economic, political and social environment, while calling attention tothe need for keeping the number of boxes rather small in order to preserve the concisenessand clarity of the BSC presentation.
The BSCs need to be more than collection of critical successful indicators on key successfactors. The multiple measures on a properly constructed BSC should consist of a linkedseries of objectives and measures that are both consistent and mutually reinforcing (Kaplan& Norton, 1996). The set of indicators needs to re¯ ect and operationalize the organization’smission and strategy to be eþ ective.
Once the BSC is developed and implemented, it must also evolve over time, as thecompany’s environment, capabilities and/or strategy change (Epstein & Mazoni, 1998).
Total quality management, business excellence and the Balanced Scorecard
The new approach to performance measurement suggested in the BSC is consistent withbusiness excellence and total quality management (TQM) initiatives under way in manycompanies: cross-functional integration, continuous improvement, customer- supplierpartnerships and team rather than individual accountability. In addition, corporate eþ orts todecentralize decision-making through empowerment, improved eý ciency and competi-tiveness, increased co-operation and execution of strategy are consistent with the BSCapproach (Walker, 1996).
As stated by Butler et al. (1997), traditional measurement systems have a control bias,i.e. they specify the particular actions they want employees to take and then measure to seewhether or not the employees have taken these actionsÐ they try to control behaviour. TheBSC, on the other hand, assumes that people will adopt whatever action is necessary to
Dow
nloa
ded
by [
Uni
vers
ity o
f C
alif
orni
a, S
an D
iego
] at
05:
06 2
8 Se
ptem
ber
2013
KANJI’S BUSINESS SCORECARD 19
arrive at the agreed goals. It assumes that the employee, if directly involved in the goal-setting process, can be relied upon for self-control (Lee et al., 2000).
Furthermore, as Martinsons et al. (1999) emphasize, the evolution of the BSC conceptduring the 1990s re¯ ects assumptions and theories that underlie business process re-engineering, as advocated by quality management. Process-based metrics are seen as a keyelement in a strategic management system that drives performance improvement and enablesthe top management team to make well-informed decisions.
In addition, the BSC encourages multiple measurements for cross-functional andintegrated business processes, which constitutes a signi® cant improvement over traditionalperformance measurement systems (Kaplan & Norton, 1996). As quality managementadvocates, measurement is the foundation of an eþ ective management strategy (Brown,1994). That is also the idea behind the management by fact principle in Kanji’s BusinessExcellence Model (KBEM).
Customer satisfaction is at the core of any quality de® nition. The BSC, in its turn,provides organizations with a customer-based planning method that is consistent with thequality concept adopted.
The novelties introduced in the 2000 revision of the ISO standards, in particular theidea that the documented process management system has to cover all business processes ofthe value chain including the analysis of customer requirements, the monitoring of customersatisfaction and the cycle of revision and learning (Lengyel, 2000) represent a clear evolutiontendency in the direction of the adoption of a BSC by companies that follow the ISO 2000standards. Lengyel (2000) highlights that this integration is widely justi® ed:
· A signi® cant part of the measurement analysis subsystem of the quality managementsystem can be made up of BSC process measurement indicators.
· The source of the customer-related indicators could also be the BSC measurementsystem.
· The strategic goals of the BSC are an important input for the continuous improvementof the quality system.
Business excellence (BE) requires continuous improvement. A somehow similar message isprovided by the learning and growing perspective, which constitutes the infrastructure toenable ambitious objectives in the other three perspectives to be achieved. Moreover, theenablers for learning and growth identi® ed by Kaplan and Norton come mainly from sourcessuch as employees, systems and organizational alignment, which are in accordance withcrucial TQM principles such as people training and development, unity of purpose and thesystemic view of organizations.
A few attempts have been made to compare the BSC with BE models. One of them ispresented by Lengyel (2000). He found that the BSC covers most criteria of the EFQM’sBusiness Excellence Model (BEM). In many cases, the content of each BSC perspectivetends to be widespread by several BEM criteria. The author argues that the integrationbetween the two approaches can be bene® cial and that some companies (such as the BritishPost Oý ce and the Hungarian Telecommunications Company) apply both of them withpositive results.
By combining the ® nancial, customer, internal process and innovation, and organizationallearning perspectives, the BSC helps managers understand, at least implicitly, manyinterrelationships.
The application of the Balanced Scorecard should be unique to each organization andlevel in the organization. In this sense, the Balanced Scorecard, like most business excellencemodels, is not a prescriptive approach.
Dow
nloa
ded
by [
Uni
vers
ity o
f C
alif
orni
a, S
an D
iego
] at
05:
06 2
8 Se
ptem
ber
2013
20 G. K. KANJI & P. MOURA E SAÂ
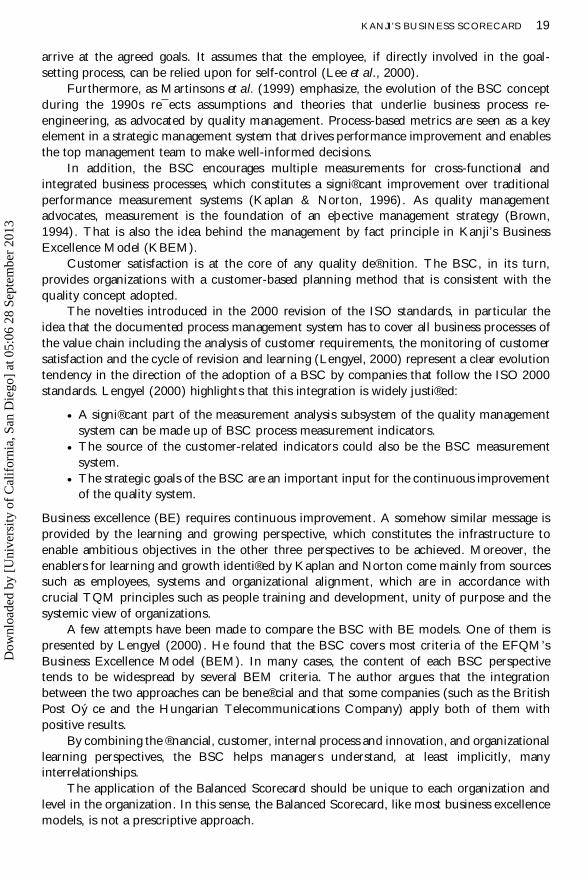
Figure 2. Comparative Business Scorecard (Kanji, 2000).
Kanji’s Business Excellence Model and the Business Scorecard
The BSC may be improved by integrating TQM principles and critical success factors thatconstitute KBEM. Kanji’s model, on the other hand, may be described using the BSCcon® guration. As a matter of fact, it is possible to compare the four areas identi® ed byKaplan and Norton (1992) with the ones proposed by Kanji (1998) (see Fig. 2). Kanji arguesthat to achieve business excellence companies need to: (1) maximize stakeholders value;(2) achieve process excellence; (3) improve organizational learning; and (4) delight thestakeholder.
Business Excellence critical success factors, along with the organization’s values, will beused as the basis for the de® nition of the scorecard measures (see Fig. 3).
The dimensions of Kanji’s Business Scorecard (KBS) extend the understanding of thefour BSC perspectives, as discussed below.
Customer perspective versus delight the stakeholders. The BSC demands that managers translatetheir general mission statement on customer service into speci® c measures that re¯ ect thefactors that really matter to customers (Kaplan & Norton, 1992). The quality philosophy, aswell, has the customer as its main focus. To delight the customer, an organization needs toassess its customers’ expectations and be able to meet (and even to exceed) them. A closerelationship with customers will facilitate information sharing and increase loyalty.
Kanji’s view, however, goes a step further by thinking that not only customers should beconsidered. It is essential to an organization to take into account the needs and expectationsof all its stakeholders, i.e. all those groups or individuals who are directly or indirectly aþ ectedby an organization’s pursuit of its goals (investors, community, employees, suppliers, etc.).
Dow
nloa
ded
by [
Uni
vers
ity o
f C
alif
orni
a, S
an D
iego
] at
05:
06 2
8 Se
ptem
ber
2013

KANJI’S BUSINESS SCORECARD 21
Fig
ure
3.
Per
form
ance
mea
sure
men
tin
Kanji’s
Busi
nes
sS
core
card
.
Dow
nloa
ded
by [
Uni
vers
ity o
f C
alif
orni
a, S
an D
iego
] at
05:
06 2
8 Se
ptem
ber
2013

22 G. K. KANJI & P. MOURA E SAÂ
Internal business perspective versus process excellence. Customer-based measures are important,but they must be translated into measures of what the company must do internally to meetits customers’ expectations. Managers need to focus on those critical internal operations thatenable them to satisfy customer needs (Kaplan & Norton, 1992).
It is therefore important to think of an organization as an interrelated net of processes,or put in Kanji’s terms, organizations need to recognize that all work is process. Companiesshould decide what processes and competencies they must excel at and specify measuresfor each.
Process excellence implies that an organization has developed a good information systemthat allows the identi® cation of the root causes of problems when they arise. In that sense,measurement is essential. Moreover, employees need to feel responsible for the managementof the processes in which they are involved and have the expertise to solve problems thatmay arise.
Innovation and learning perspective versus organizational learning. The targets for success keepchanging. Intense global competition requires that companies make continual improvementsto their existing products and have the ability to introduce entirely new products withexpanded capabilities (Kaplan & Norton, 1992).
Customers’ needs are changing continuously. Organizations need to be proactive andinvest in improvements and innovations, both related to products and processes. In thissense, training and education at all levels of the organization are essential.
Principles such as teamwork, continuous improvement and prevention ® t well in thisphilosophy. Moreover, leadership has a crucial role in implementing a culture of continuousimprovement and innovation.
Financial perspective versus stakeholder value. Financial performance measures indicatewhether the company’s strategy, implementation and execution are contributing to bottomline improvement. The traditional perspective of the BSC is, however, somehow restrictedby focusing exclusively on shareholders. All stakeholders (not just the shareholders) are to beconsidered if business excellence is to be achieved. The shareholder value must be understoodin a long-term perspective, balancing cash generation, future growth, risk and return.
Kanji (2000) explains further, `̀An organization that achieves business excellence createsa large net-worth and therefore increases shareholder’s equity. The measurement of BusinessExcellence, then, provides a yardstick by which an investor judges an organization’s equityperformance’’ .
Developing Kanji’s Business Scorecard
In the previous section, we have highlighted how the adoption of TQM principles contributesto the enrichment of the traditional scorecard. However, it is possible to go a step furtherand build a framework with enhanced measurement abilities and increased managerialpotentialities.
As Kanji (1998) emphasizes, in order to achieve business excellence it is necessary togive simultaneous attention to areas that comprise the scorecard. Furthermore, the authorreinforces that achievements in each of the four areas need to feed each other to form a cycleof continuous improvement, so that:
· delighting the stakeholders helps generate revenues and satisfactory returns to theinvestor;
Dow
nloa
ded
by [
Uni
vers
ity o
f C
alif
orni
a, S
an D
iego
] at
05:
06 2
8 Se
ptem
ber
2013

KANJI’S BUSINESS SCORECARD 23
Figure 4. Kanji’s Business Scorecard.
· increased revenues help ® nd investments in processes and learning;· better process and learning help people to delight the stakeholders and create business
excellence.
Thus, critical for the development of any scorecard is the cause-and-eþ ect relationship. Asmentioned earlier, traditional approaches do not specify how each area interacts with others.Structural equation modelling provides a clear mathematical calculation framework for thedetermination of interrelationships. KBS therefore is better seen as suggested in Fig. 4.
Similarly to Kaplan and Norton’s (1992) strategic foundation of the BSC, we alsobelieve that the KBS measurement model should be based upon the organizational values,which in turn are translated into its vision, mission and strategy (see Kanji & Sa , 2001).Organizational values are the prime for process excellence, organizational learning andstakeholders’ delight. Eþ ective management of these critical success factors will lead not onlyto good ® nancial results, as suggested by Kaplan and Norton (1992), but also to a higherKanji’s Business Scorecard Index (KBSI), meaning that the organization is providing goodvalue for all stakeholders and has a strong quality reputation, which is a more embracing andlong-term-oriented concept.
Each block in Fig. 4 corresponds to a latent variable in the structural equation model.Since latent variables (constructs) cannot be directly observed and measured, a set of manifestvariables (indicators) was developed. It is important to cover adequately the construct domainwhile keeping the number of indicators as small as possible. The ® nal measurementinstrument re¯ ects the balance between these two con¯ icting demands.
KBS aims to complement KBEM by focusing on measuring how the organization isperforming from the outside perspective. As a matter of fact, while KBEM is mainly aninternal assessment framework, where data are collected from the organization’s leaders andemployees, KBS is mainly directed towards an external assessment of the organization fromthe point of view of its other important stakeholders. Organizations intending to apply theKBS should then consider who their fundamental stakeholders are and establish a way ofcollecting feedback from them. One possible way is periodically to administer the question-naire to a panel of stakeholders.
Next, we show the KBS structural equation model works and how it can be used tomeasure KBSI.
Illustrative example
A typical service sector company (X) was utilized to illustrate the way KBS works. Data wereused to determine the indices of the critical success factors of the model and the ® nal BSI.Figure 5 shows the Business Excellence Model with values of the structural parameters.
Dow
nloa
ded
by [
Uni
vers
ity o
f C
alif
orni
a, S
an D
iego
] at
05:
06 2
8 Se
ptem
ber
2013

24 G. K. KANJI & P. MOURA E SAÂ
Figure 5. Structural parameters for company `̀ X’’.
Based on partial least square (PLS) estimations, path coeý cients, correlations and reliab-ility measures for the overall system were computed. The structural parameters (or pathcoeý cients) are indications of the strength of the relationship between independent anddependent variables of the model. Figure 5 shows that all coeý cients are positive and signi® -cant, strongly supporting the holistic and synergic nature of the model. The results show thatorganizational values (prime) are strongly associated with the three other critical dimensions.
With the purpose of assessing the reliability of the scales used to measure the latentvariables in the KBS model, the Cronbach coeý cient (a ) was calculated. Table 1 displaysthe results.
Figure 6 shows the indices for each of the model variables, as well as the resultingBusiness Scorecard Index achieved by company X.
It is possible to see that the organization is not doing very well in several dimensions.Organizational values and process excellence scores (around 50%) are particularly worrying.Several factors may be behind this relatively poor performance. Behind the organizationalvalues index, it may well be the case that the company either does not have strong values anda strategy aligned to them or it is not communicating them properly to its stakeholders.Additionally, the organization is hardly delivering what people expect, possibly due to a lackof measurement in key processes. Yet, the organization’s willingness to learn and improve,along with its ability to respond to change in its environment, are contributing to a reasonable
Table 1. Reliability of empirical measurements for company X
Critical success factors and BusinessScorecard Index Reliability a
Organizational values 0.764Process excellence 0.848Organizational learning 0.914Delight the stakeholders 0.833Business Scorecard Index 0.958
Dow
nloa
ded
by [
Uni
vers
ity o
f C
alif
orni
a, S
an D
iego
] at
05:
06 2
8 Se
ptem
ber
2013

KANJI’S BUSINESS SCORECARD 25
Figure 6. Indices of critical success factors and KBSI for company `̀ X’’.
stakeholders’ delight score and pushing up the KBSI. However, the ® nal index of 58.7 clearlyindicates that there is great room for improvement.
Critical success factors with low index scores are obviously natural candidates forimprovement, however it is important to notice that some of them may have a strongercorrelation with the ® nal KBSI, as suggested by the diþ erent path coeý cients. One possibleway of more precisely assessing where to concentrate eþ orts to make real improvementhappen in the most economical and eý cient way is using the excellence seeker’s approach(see Kanji, 2000). The excellence seeker’s approach involves the use of an optimizationalgorithm for determining which indices to increase and by how much to achieve a giventarget level of excellence. Since organizations usually face some constraints, the algorithmallows the introduction of upper limits of improvement for one (or more) critical successfactors.
The required performance levels for the critical success factors associated with BSI of,respectively, 65, 75 and 85%, are shown in Table 2. This information can help company Xto establish improvement plans and eþ ectively allocate resources in order to increase its BSIto diþ erent levels, while at the same time considering that it is not feasible to go beyond 85%in any dimension.
As Table 2 illustrates, considerable improvement can be obtained only by increasing thescore of the delight the stakeholders dimension, through measures such as providing themwith better and more reliable information and carefully listening to their needs. In order toachieve an index of 75, the organization also has to improve the way it communicates whatit stands for and develop consistent strategies. By getting all factors to their upper limit, theorganization can potentially achieve a BEI of 92 points.
Table 2. Revised indices of critical success factors and Business Scorecard Index
Originalindex Target business scorecard index
Critical success factor and Upperleadership excellence limit BSI 5 59 65 75 85 92
Organizational values 85 51 51 67 85* 85*Process excellence 85 50 50 50 50 85*Organizational learning 85 62 62 62 83 85*Delight the stakeholders 85 60 73 85* 85* 85*
Dow
nloa
ded
by [
Uni
vers
ity o
f C
alif
orni
a, S
an D
iego
] at
05:
06 2
8 Se
ptem
ber
2013

26 G. K. KANJI & P. MOURA E SAÂ
Conclusion
The need to develop simple, comprehensive and relevant measures was behind the develop-ment of new performance instruments. Among them, the BSC achieved considerablepopularity, particularly due to its potential to be simultaneously used as a tool for strategydevelopment and implementation.
Despite this considerable success, the BSC does not fully explain the factors that leadto superior performance and the way they relate with each other. This can only be done bybuilding a framework that incorporates the critical success factors and uses a mathematicalmodel to describe the embedded relationships.
It is our belief that these performance drivers are to be found in the TQM philosophyand can be successfully integrated in an innovative measurement model. Using the fourperspectives proposed by Kaplan and Norton (1992) as a starting point and by enlarging theirunderstanding, KBS suggests that organizational values, process excellence, organizationallearning and delight the stakeholders are the fundamental dimensions to be managed andmonitored. In order to analyse the relationships existing among them, the structural equationmodelling approach seems to be the most powerful and reliable methodology.
Overall, the empirical results obtained in the example presented (in particular thepositive path coeý cients and the high reliability scores) tend to con® rm the validity of thestructural model and its value in assisting organizations in their road to excellence.
For company X some initial comments and recommendations can be made:
· The ® nal business excellence index is reasonable (around 60%), but some performanceareas such as organizational values (51%) and performance excellence (50%) arebarely positive.
· The fact that the score of the prime of the modelÐ organizational valuesÐ is low isparticularly worrying, suggesting that further eþ orts need to be done in communicatingwhat the organization stands for, creating a sense of community and showing that thestrategy actually is putting these values into motion.
· The relatively poor process excellence indicates that the organization has a large rateof non-conformities, delays and wastage. Better measurement and analysis of keyprocesses and benchmarking may help to raise the score.
· These negative eþ ects are compensated at some extent by the organization’s capacityto learn. The organization has a culture of continuous improvement and an ability tointerpret changes in the environment that contribute to a good index in delighting thestakeholders.
· By using this continuous improvement and learning attitude as a competitive advantageand by concentrating eþ orts in the weakest areas of the BSC the company can improveits performance considerably.
Despite the possibility of using KBS as a completely separate approach, it may be bene® cialto apply it in conjunction with the generic KBEM. As mentioned earlier, they are complemen-tary in the sense that KBS focuses mainly on external stakeholders while KBEM takes themeasurements from a more internal perspective. Additionally, their simultaneously useencourages organizations to question whether their internal measurements are right andallows cross-validation of both models.
Acknowledgement
Patrõ cia Moura e Sa ’s studentship is sponsored by FundacË aÄ o para a Cieà ncia & Tecnologia.
Dow
nloa
ded
by [
Uni
vers
ity o
f C
alif
orni
a, S
an D
iego
] at
05:
06 2
8 Se
ptem
ber
2013

KANJI’S BUSINESS SCORECARD 27
References
Brown, M. (1994) Is your measurement system well balanced?, The Journal for Quality and Participation, 17,pp. 6-11.
Butler, A., Letza, S. & Neale, B. (1997) Linking the Balanced Scorecard to strategy, Long Range Planning,30, pp. 242-253.
Epstein, M. & Manzoni, J. (1998) Implementing corporate strategy: from Tableaux de Bord to BalancedScorecards, European Management Journal, 16, pp. 190-203.
Gering, M. & Rosmarin, K. (2000) Central Beating, Management Accounting, 78, No. 6, pp. 32- 33.Hepworth, P. (1998) Weighting upÐ a literature review for the balanced Scorecard, Journal of Management
Development, 17, No. 8, pp. 559- 563.Johnson, S. (1998) Identi® cation and selection of environmental performance indicators: application of the
Balanced Scorecard approach, Corporate Environmental Strategy, 5, pp. 35- 41.Kanji, G.K. (1998) Measurement of business excellence, Total Quality Management, 9, pp. 633-643.Kanji, G.K. (2000) Take a test drive for business excellence, Proceedings of the ASQ Congress, Indianapolis, IN.Kanji, G.K. & Sa , P.M. (2001) Measuring Leadership Excellence, 12, No. 6, pp. 701- 718.Kaplan, R. (1984) The evolution of management accounting, The Accounting Review, 59, pp. 390- 418.Kaplan, R. (1987) Relevance LostРthe Rise and Fall of Management Accounting (Boston, MA, Harvard Business
School Press).Kaplan, R. & Norton, D. (1992) The Balanced ScorecardÐ measures that drive performance, Harvard
Business Review, January- February, pp. 71- 79.Kaplan, R. & Norton, D. (1996) The Balanced Scorecard Ð Translating Strategy into Action (Harvard, Harvard
Business School Press).Lee, S., Lo, K., Leung, R. & Ko, A. (2000) Strategy formulation framework for vocational education:
integrating SWOT analysis, balanced scorecard, QFD methodology and MBNQA education criteria,Managerial Auditing Journal, 15, pp. 407-423.
Lengyel, C. (2000) Integration of the Balanced Scorecard system, Proceedings of the 44th EOQ Congress,Budapest, Vol. 1, pp. 40- 48.
Letza, S. (1996) The design and implementation of the balanced scorecard: an analysis of three companies inpractice, Business Process Reengineering & Management Journal, 2, pp. 59- 76.
Martinsons, M., Davison, R. & Tse, D. (1999) The Balanced Scorecard: a foundation for the strategicmanagement of information systems, Decision Support Systems, 25, pp. 71- 88.
McClintock, C.J. (2000) Performance indicators in Lisburn Borough Council, MSc. Thesis, Faculty ofBusiness and Management, University of Ulster.
Mintzberg, H. (1994) The Rise and Fall of Strategic Planning (New York, Prentice Hall).Mooraj, S., Oyon, D. & Hosteller, D. (1998) The Balanced Scorecard: A necessary good or an unnecessary
evil?, European Journal of Management, 17, pp. 481- 491.Nørreklit, H. (2000) The balance on the Balanced ScorecardÐ a critical analysis of some of its assumptions,
Management Accounting Research, 11, pp. 65- 88.Tsang, A. (1998) A strategic approach to managing maintenance performance, Journal of Quality in Main-
tenance Engineering, 4, pp. 87- 94.Walker, K. (1996) Corporate performance reporting revisitedÐ the Balanced Scorecard and dynamic manage-
ment reporting, Industrial Management and Data Systems, 26, pp. 24-30.Williams, M. & Meier, R. (2001) Measure quality and performance with the Balanced Scorecard, The Quality
Management Forum.
Dow
nloa
ded
by [
Uni
vers
ity o
f C
alif
orni
a, S
an D
iego
] at
05:
06 2
8 Se
ptem
ber
2013


