Embed Size (px)
Citation preview

Kadoka, South Dakota COMPREHENSIVE PLAN
(2012 – 2037)
Prepared with the assistance of the Central South Dakota Enhancement District for the City of Kadoka

2
ACKNOWLEDGEMENTS This Comprehensive Plan is a collaborative document that has been forged by several people, businesses, organizations and government entities. This document expresses the perseverance, determination, and civic pride that exist in the City of Kadoka. Through the preparation and adoption of this Comprehensive Plan, the governing officials of Kadoka have expressed their intent for orderly and efficient growth and development in the community and surrounding area. Mayor: Harry Weller Planning & Zoning Commission Members: Ken Wilmarth (Chair), Jim Brown (Vice Chairk), Cindy Vandermay (Secretary), Mike Groven, Kelly O’Connell Council Members: Brad Jorgenson, Keith Prang, Colby Shuck, Richard Stolley, Ryan Willert, Micki Word Finance Officer: Patty Ulmen Water/Sewer Superintendent: Nathan Riggins Streets Superintendent: Patrick Solon Jackson-Kadoka Economic Development Corporation Director: Jo Beth Uhlir

3
ACKNOWLEDGEMENTS ……………..………………......................... 2 TABLE OF CONTENTS……...…………………………………………. 3 CHAPTER 1: INTRODUCTION............................................................... 6 1.1 PURPOSE, AUTHORIZATION AND ADOPTION………………….. 6 CHAPTER 2: HISTORY OF KADOKA …….………………………… 8 2.1 KADOKA’S BEGININGS……………………………………………. 8 CHAPTER 3: DEMOGRAPHICS……………..………........................... 9 3.1 HISTORIC POPULATION TRENDS…………………………………9 3.2 ECONOMIC PROFILE OF KADOKA/JACKSON COUNTY............. 12 CHAPTER 4: ENVIRONMENTAL…………………………………...... 17 4.1 TOPOGRAPY…………………………………………………………. 17 4.2 SOILS………………………………………………………………….. 18 4.3 SLOPE STABILITY AND LANDSLIDES…………………………… 19 4.4 HYDROLOGY………………………………………………………… 20 4.5 CLIMATE……………………………………………………………… 20 CHAPTER 5: INFRASTRUCTURE & DRAINAGE MANAGEMENT…………………………………………………………. 22 5.1 DRAINAGE MANAGEMENT……………………………………….. 22 5.2 KADOKA INFRASTRUCTURE & DRAINAGE PROJECTS………. 23 5.3 WATER……………………………………………………………….. 24 5.4 WASTE WATER SERVICES & LAGOON SYSTEM………………. 25 5.5 SOLID WASTE MANAGEMENT…………………………………… 27 5.6 ENCOURAGE WATER QUALITY TESTING……………………… 27 CHAPTER 6: LAND USE……………………………………………….. 28 6.1 EXISTING LAND USE………………………………………………. 28 6.2 FUTURE LAND USE RECOMMENDATIONS…………………….. 30 CHAPTER 7: TRANSPORTATION…………………………………… 33 7.1 ROAD NETWORK…………………………………………………… 33 7.2 TRANSPORTAION/DRAINAGE PROJECTS………………………. 34 7.3 AIRPORT SERVICE………………………………………………….. 34 7.4 MASS TRANSIT………………………………………………………. 34 CHAPTER 8: ECONOMIC DEVELOPMENT……………………….. 35 8.1 INCREASE RETAIL TRADE OPPORTUNTIES…………………… 35 8.2 ENCOURAGING CITIZENS TO SHOP LOCALLY AND MARKETING KADOKA…………………………………………….…………………… 35 8.3 REVITALIZING AND MARKETING DOWNTOWN……………… 35

4
8.4 RETAINING AND SUPPORTING CURRENT BUSINESSES……… 36 8.5 ATTRACTING NEW BUSINESSES BY PROVIDING AN ENTREPRENEUR-FRIENDLY COMMUNITY………………………… 36 8.6 ENSURE SUFFICEINT AMOUNT OF COMMERCIAL AND INDUSTRIAL SITES……………………………………………………… 36 8.7 SUPPORT FARMING AND RANCHING COMMUNITY………….. 37 8.8 IMPROVING KADOKA’S AESTHETICS……………….………….. 37 8.9 PROMOTING TOURISM…………………………………………….. 37 8.10 UTILIZE KADOKA SCHOOL SYSTEM……………………………38 CHAPTER 9: HISTORIC PRESERVATION…………………………. 39 9.1 KADOKA’S HISORIC PRESERVATION PHILOSPHY……………. 39 9.2 FIND INCETIVES AND PRIVATE SUPPORT FOR THE RESTORING OF EXISTING STRUCTURES…………………………… 39 9.3 INVENTORY KADOKA’S FULL RANGE OF HISTORIC RESOURCES……………………………………………………………... 39 9.4 DETERMINE FEASIBILITY TO DECLARE A SECTION OF KADOKA AS AN HISTORIC DISTRICT……………………………….. 40 9.5 KADOKA’S HISTORIC SITES………………………………………. 40 CHAPTER 10: HOUSING………………………………………..……… 41 10.1 ENSURE ADEQUATE SUPPLY OF AFFORDABLE HOUSING… 41 10.2 PROVISION OF SUFFICENT HOUSING OPTIONS AND CHOICES……………………………………………………………. 41 10.3 ENCOURAGE REHABILITATION AND IN-FILL DEVELOPMENT………………………………………………………….. 42 10.4 CREATE HOUSING OPPORTUNTIES FOR THE ELDERLY……. 42 10.5 CREATE PEDESTRIAN FRIENDLY RESIDENTIAL ENVIRONMENT………………………………………………………….. 42 10.6 DEVELOP/ENFORCE NUISANCE ABATEMENT ORDINANCES FOR VACANT AND HAZARDOUS PROPERTIES……...………...………….42 10.7 PROVIDE FOR ADEQUATE SUPPLY OF RESIDENTIAL LAND, AND TIMELY INFRASTRUCTURE IMPROVEMENT……………………….43 CHAPTER 11: PARKS & RECREATION…………………………….. 44 11.1 CONTINUED SUPPORT OF FAMILY FRIENDLY RECRATION OPPORTUNITIES…………………………………………. 44 11.2 SELECT POTENTIAL SITES FOR ADDITIONAL PARKS, GREEN SPACE, TRAILS…………………………………………………. 45 11.3 IMPROVE OR UPDATE EXISTING RECREATIONAL FACILTIES IN KADOKA……………………………………..…………. 45 11.4 SUSTAIN AND MANAGE PUBLIC TREE INFRASTRUCTURE… 45 CHAPTER 12: EXTRATERRITORIAL JURISDICTION……………46 12.1 EXTRATERRITORIAL JURISCITION…………………………….. 46

5
CHAPTER 13: PLANNING POLICY FRAMEWORK………………..47 CHAPTER 13.1 GROWTH MANAGEMENT STRATEGIES…………... 47 CHAPTER 14: PLAN IMPLEMENTATION/MAINTAINCE……….. 48 14.1 COMPREHENSIVE PLAN UTILIZATION………………………… 48 Appendix………………………………………………………….……….. 49 FIGURES: FIGURE 4-1: KADOKA TOPOGRAPY MAP………………………………..18 FIGURE 4-2: KADOKA SOILS MAP………………………………………...19 FIGURE 4-3: KADOKA’S NORMAL TEMPERATURE…….……………… 20 FIGURE 4-4: KADOKA’S NORMAL PERCIPITATION……………………21 FIGURE 5-1: CITY OF KADOKA’S NATIONAL FLOOD INSURANCE PROGRAM RATE MAP………………………………………….…………... 22 FIGURE 5-2: CITY OF KADOKA’S EXISTING COLLECTION SYSTEM…………….………………………………………………………….23 FIGURE 5-3: CITY OF KADOKA’S EXISTING WATER SYSTEM…….….24 FIGURE 5-4: CITY OF KADOKA’S WASTERWATER TREATMENT FACILITY…………….………………………………………………………..26 FIGURE 6-1: CITY OF KADOKA CURRENT LAND USE MAP…………...29 FIGURE 6-2: CITY OF KADOKA FUTURE LAND USE MAP…………….. 31 FIGURE 6-2: POTENTIAL SITES FOR RESIDENTIAL GROWTH………...32 FIGURE 6-2: POTENTIAL SITES FOR COMMERCIAL GROWTH………..32 TABLES: TABLE 3-1: TOTAL POPULATION – KADOKA………………………….... 9 TABLE 3-2: LAND AREA AND POPULATION DENSITY………………...10 TABLE 3-3: RACE DISTRIBUTION……………………………………... …. 10 TABLE 3-4: AGE DISTRIBUTION………………………………………….. 11 TABLE 3-5: SEX DISTRIBUTION…………………………………………… 11 TABLE 3-6: POPULATION DISTRIBUTION DATA KADOKA……........... 12 TABLE 3-7: POPULATION DISTRIBUTION DATA JACKSON COUNTY…………………………………………………………………........ 12 TABLE 3-8: HISTORICAL POPULATION DISTRIBUTION DATA – STATEWIDE…………………………………………………………12 TABLE 3-9: INCOME-JACKSON COUNTY………………………………...13 TABLE 3.10 ECONMOMIC PROFILE KADOKA…………………………...13 TABLE 3.11: EMPLOYEE COMPENSATION: JACKSON COUNTY.......... .14

6
CHAPTER 1: INTRODUCTION
A. PURPOSE, AUTHORIZATION AND ADOPTION 1. PURPOSE OF THE COMPREHENSIVE PLAN There are three primary imperatives of this document: (1) To address community goals and objectives that provide for the long term health, safety, and general welfare of the municipality; (2) To provide guidance regarding potential land uses and the timing of future development so that both public and private interests can make informed fiscal decisions in the areas of real estate and capital investments; and (3) To provide the Kadoka City Council with policies for future planning decisions and the methods and justification to control land use through zoning, city ordinances, and other enforcement controls. 2. AUTHORIZATION UNDER STATE LAW Under 11-6-14 of South Dakota Codified Laws, the municipality is directed to “propose a plan for the said physical development… [to] include the general location, character, layout and extent of community centers and neighborhood units…” 3. DEVELOPMENT AND ADOPTION The Kadoka City Council has adopted this document in accordance with state codified law. While creating this Comprehensive Plan, the Planning & Zoning Commission has used historical research, detailed inventories and assessments, and discussion sessions at Planning & Zoning Commission meetings. This Comprehensive Plan is intended to direct the City in its implementation of zoning regulations, building regulations, capital improvements, plans, and other related policies. 4. AREA OF PLANNING JURISDICTION The City of Kadoka shall, under South Dakota statutes, have the authority to control development within the corporate limits of Kadoka. 5. INTERGOVERNMENTAL CONSIDERATIONS A comprehensive plan impacts not only persons living within the study area, but also those residing and working throughout the Kadoka area. As a result, input was gained from the City of Kadoka Planning and Zoning Commission, Jackson-Kadoka Economic Development Corporation, and the public at large.
7
6. APPROPRIATE USE OF THE COMPREHENSIVE PLAN South Dakota laws require that zoning districts must be in accordance with the Comprehensive Plan. The intent of this document is to demonstrate the most suitable use of land within the study area, based on the potential expansion and development of the community. 7. COMPREHENSIVE PLAN INFORMATION MEETING PUBLIC FORUM On ____________, the Kadoka City Council held a public information meeting regarding the content of this Comprehensive Plan. The purpose of the meeting was to discuss Kadoka’s plans for future growth and development through the year 2037.

8
CHAPTER 2: HISTORY OF KADOKA 2.1 KADOKA’S BEGINNINGS1 The City of Kadoka was originally named Willard but was eventually renamed Kadoka, which originated from "Hodoka", meaning "Hole in the Wall". The Indians thought Kadoka was a fitting name because it sits at the mouth of a gap leading into the Badlands. The Train Depot was built in the spring of 1907 and town lots were sold April 7, 1907. Kadoka was incorporated on May 4, 1908 and the Independent School District was organized in July of 1908. The first City Volunteer Fire Department came into being in 1909 as well as the organization of a Commercial Club. Gas street lights were also installed in town at this time. In 1910 a phone office was set up, as well as the High School building being dedicated with grades 1 thru 10 being taught. In 1913 the 11th grade was added, followed by the 12th grade. The present school building was built in 1939. The first town well was completed in August of 1908 in the center of Main Street. In 1911 the town bonded for the first water lines ($6,700). A large well was dug later west of the fairgrounds but the town soon outgrew that supply and found it necessary to haul water from Wells Spring and the artesian well on the White River. In 1950 a deep artesian well was dug on the east edge of Kadoka and when that proved insufficient a second artesian well was dug in 1964. In 1915, Kadoka was no longer a part of Stanley County and became Jackson County. An election was held to determine the county seat and Kadoka came out on top with 410 of the 610 votes cast. On July 28th, 1916 the County Court House was dedicated in Kadoka. In 1926 the streets in town were treated with a gravel coat and Main Street was re-graveled in 1931 and later hard surfaced. In 1937 the City took over the liquor business and today continues to operate the Kadoka City Bar. In 1962 the first public library was established and the City Auditorium was built and dedicated. 1Kadoka SD City Website (2011) Kadoka History, http://www.kadokasd.com/index.asp?Type=B_BASIC&SEC={CDA435EC-4F67-412F-86C7-93001AE39D6A}

9
CHAPTER 3: DEMOGRAPHICS Demographics Goal: To properly utilize population and economic demographics when making future land use and zoning decisions. Demographics Objectives Assess Kadoka’s current population demographics (Using both ACS 2005-2009
& 2010 Census) Assess Kadoka’s current economic demographics (Using both ACS 2005-2009 &
2010 Census) Update the demographics section of the comprehensive plan as current
information is disperse to help ensure accuracy when assessing demographics for future planning decisions.
3.1 HISTORIC POPULATION TRENDS Historical, present, and projected data from both the United States Census Bureau and South Dakota State University (SDSU) - Rural Data Center (RDC) for Kadoka has been assembled to chart past trends, assess current data, and to derive estimates relating to the future population of Kadoka. These numbers will be used to guide the decision making process as it relates to addressing future housing, school, and land use development needs. It is important to remember that these population figures not only represent the total population, but also chart the diversity of age and race. TABLE 3-1: Total Population – Kadoka US. Census Year Number Percentage 1910 222 - 1920 341 +53.6% 1930 385 +12.9% 1940 464 +20.5% 1950 584 +25.8% 1960 840 +43.8% 1970 815 -3.0% 1980 832 +2.0% 1990 736 -13.0% 2000 706 -4.0% 2010 657 -6.9% Projected for 2020 629 -3.8%
The nearly 44% population increase from 1950 to 1960 may be attributed to the construction of the Oahe Dam, which caused the populations of Pierre, Fort Pierre, and surrounding communities to boom. Some of the construction worker’s families may have lived in Kadoka during the construction period of the dam lasting from 1948 to 1962. Outside of this population spike, Kadoka’s population has steadily declined throughout

10
the years, with the exception of 1970 -1980 which experienced a small 2.0% increase in population. The most recent Census results show a dramatic 6.9% loss from 2000-2010; which caps approximately a 24% decrease over the past 30 years. The number of persons per household in Kadoka also decreased from 2.33 in 2000 to 2.17 in 2010. However, between 2000 and 2010 Jackson County has gained about 4% of its population, rising from 2,930 to 3,031. The following tables reflect Kadoka’s current demographics in regards to age, sex, and population. TABLE 3-2: Land Area and Population Density – 2010 census data – Kadoka Kadoka Land Area in Square Miles 2.31
Total Population 657
Average Population per Square Mile 284
TABLE 3-3: Race Distribution Census 2010 Data –Kadoka
Race Total Number Percent
Total population 657 100.0 One race 624 95.0 White 534 81.2 Black or African American
3 0.5
American Indian and Alaska Native
87 13.3
Asian 0 0.0 Native Hawaiian and Other Pacific Islander
0 0.0
Some Other Race 0 0.0 Two or More Races 33 5.0

11
TABLE 3-4: Age Distribution – 2010 Census Data City of Kadoka2
Age Number Percent Both sexes Both sexes
Total population 657 100.0 Under 5 years 36 5.5 5 to 9 years 42 6.4 10 to 14 years 53 8.1 15 to 19 years 44 6.7 20 to 24 years 28 4.3 25 to 29 years 26 4.0 30 to 34 years 32 4.9 35 to 39 years 31 4.7 40 to 44 years 38 5.8 45 to 49 years 32 4.9 50 to 54 years 47 7.2 55 to 59 years 42 6.4 60 to 64 years 43 6.6 65 to 69 years 30 4.6 70 to 74 years 34 5.2 75 to 79 years 26 4.0 80 to 84 years 37 5.7 85 to 89 years 16 2.4 90 years and over 17 2.6 Median age (years) 44.5 ( X )
TABLE 3-5: Sex Distribution – 2010 Census Data – Kadoka3
Age Number Percent Male Female Male Female
Total population 307 347 100.0 100.0 18 to 64 years 163 168 53.1 48.4 65 years and over
74 86 24.1 24.8
2 Census information left a block off that is within City limits; information will be updated as made available by US Census. 3 Census information left a block off that is within City limits; information will be updated as made available by US Census.
12
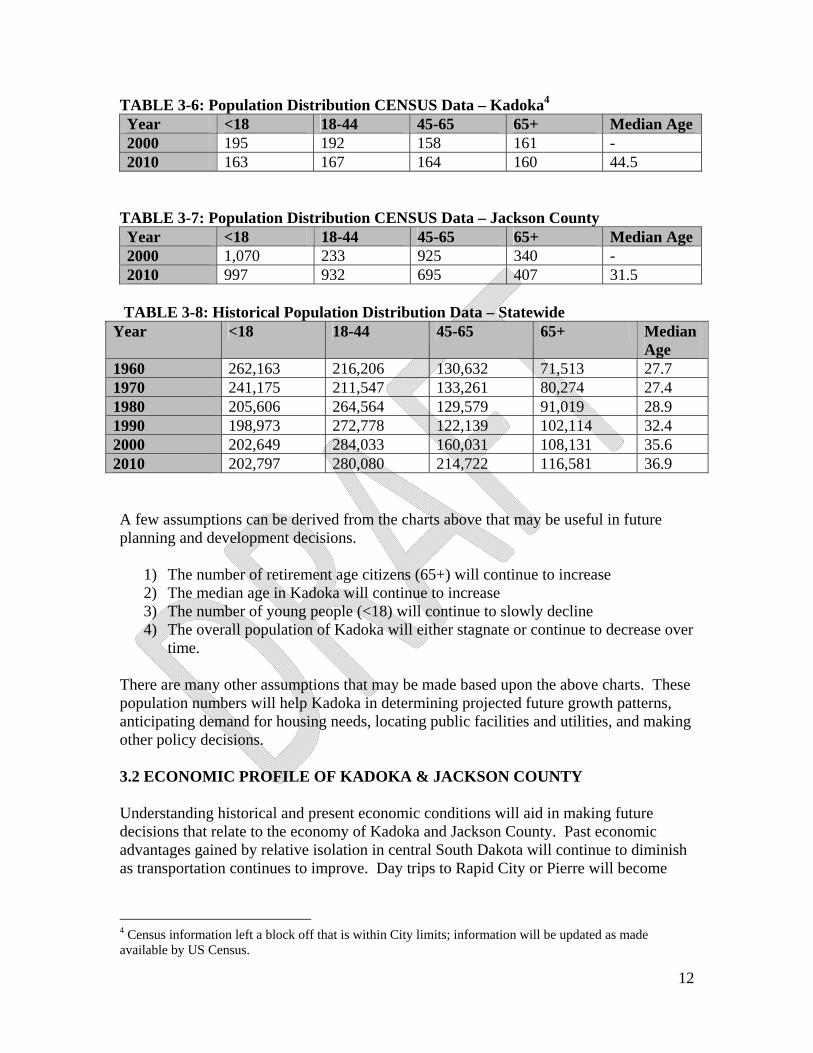
TABLE 3-6: Population Distribution CENSUS Data – Kadoka4 Year <18 18-44 45-65 65+ Median Age 2000 195 192 158 161 - 2010 163 167 164 160 44.5
TABLE 3-7: Population Distribution CENSUS Data – Jackson County Year <18 18-44 45-65 65+ Median Age 2000 1,070 233 925 340 - 2010 997 932 695 407 31.5
TABLE 3-8: Historical Population Distribution Data – Statewide
Year <18 18-44 45-65 65+ Median Age
1960 262,163 216,206 130,632 71,513 27.7 1970 241,175 211,547 133,261 80,274 27.4 1980 205,606 264,564 129,579 91,019 28.9 1990 198,973 272,778 122,139 102,114 32.4 2000 202,649 284,033 160,031 108,131 35.6 2010 202,797 280,080 214,722 116,581 36.9 A few assumptions can be derived from the charts above that may be useful in future planning and development decisions.
1) The number of retirement age citizens (65+) will continue to increase 2) The median age in Kadoka will continue to increase 3) The number of young people (<18) will continue to slowly decline 4) The overall population of Kadoka will either stagnate or continue to decrease over
time. There are many other assumptions that may be made based upon the above charts. These population numbers will help Kadoka in determining projected future growth patterns, anticipating demand for housing needs, locating public facilities and utilities, and making other policy decisions. 3.2 ECONOMIC PROFILE OF KADOKA & JACKSON COUNTY Understanding historical and present economic conditions will aid in making future decisions that relate to the economy of Kadoka and Jackson County. Past economic advantages gained by relative isolation in central South Dakota will continue to diminish as transportation continues to improve. Day trips to Rapid City or Pierre will become
4 Census information left a block off that is within City limits; information will be updated as made available by US Census.

13
more and more common and local business will have to compete not just across town but across the state. According to the Bureau of Economic Analysis, Kadoka’s per capita income increased from $16,104.00 in 1999 to $27,918 in 2009. When the entirety of the 2010 census information becomes released, the economic information should also be considered in order to make an accurate and informed decision. The data in the tables below was obtained from Regional Economic Information System/ Bureau of Economic Analysis, US Economic Census, and American Community Survey; all provide an overview of past and present economic trends in Jackson County. TABLE 3.9: Income – Jackson County Year 1969 1979 1989 1999 2009 Per Capita Income 3,257 5,075 9,274 16,104 27,918 Population 2950 3389 2901 2902 2658
TABLE 3.10: Economic Profile Kadoka (American Community Survey)
Selected Economic Characteristics Estimate Margin of Error (+/-)
Percent
Margin of Error (+/-)
EMPLOYMENT STATUS Population 16 years and over 548 104 548 (X) In labor force 403 92 73.5% 7.9 Civilian labor force 403 92 73.5% 7.9 Employed 394 89 71.9% 7.8 Unemployed 9 10 1.6% 1.8 Armed Forces 0 99 0.0% 4 Not in labor force 145 49 26.5% 7.9
OCCUPATION Estimate Margin of Error (+/-)
Percent
Margin of Error (+/-)
Civilian employed population 16 years and over 394 89 394 (X) Management, professional, and related occupations 132 57 33.5% 11.6 Service occupations 78 44 19.8% 9.8 Sales and office occupations 90 42 22.8% 9.1 Farming, fishing, and forestry occupations 17 18 4.3% 4.3 Construction, extraction, maintenance, and repair occupations 41 29 10.4% 7.2 Production, transportation, and material moving occupations 36 25 9.1% 5.9

14
INDUSTRY Estimate Margin of Error (+/-)
Percent
Margin of Error (+/-)
Civilian employed population 16 years and over 394 89 394 (X) Agriculture, forestry, fishing and hunting, and mining 41 26 10.4% 5.8 Construction 13 18 3.3% 4.6 Manufacturing 13 18 3.3% 4.5 Wholesale trade 16 15 4.1% 3.9 Retail trade 65 33 16.5% 7.5 Transportation and warehousing, and utilities 33 24 8.4% 5.8 Information 13 18 3.3% 4.5 Finance and insurance, and real estate and rental and leasing 9 11 2.3% 2.6 Professional, scientific, and management, and administrative and waste management services 17 14 4.3% 3.5 Educational services, and health care and social assistance 89 51 22.6% 10.7 Arts, entertainment, and recreation, and accommodation and food services 37 29 9.4% 7 Other services, except public administration 8 12 2.0% 3 Public administration 40 26 10.2% 6.6
INCOME AND BENEFITS (IN 2009 INFLATION-ADJUSTED DOLLARS)
Estimate Margin of Error (+/-)
Percent
Margin of Error (+/-)
Total households 304 67 304 (X) Less than $10,000 43 28 14.1% 8.6 $10,000 to $14,999 34 38 11.2% 11.5 $15,000 to $24,999 15 14 4.9% 4.5 $25,000 to $34,999 49 31 16.1% 9.1 $35,000 to $49,999 53 30 17.4% 10.3 $50,000 to $74,999 70 36 23.0% 10.1 $75,000 to $99,999 32 20 10.5% 6.7 $100,000 to $149,999 8 13 2.6% 4.1 $150,000 to $199,999 0 99 0.0% 7.1 $200,000 or more 0 99 0.0% 7.1

15
Estimate Margin of Error (+/-)
Percent
Margin of Error (+/-)
All people 17.6% 9 (X) (X) Under 18 years 12.5% 13.9 (X) (X) Related children under 18 years 12.5% 13.9 (X) (X) Related children under 5 years 22.7% 28.5 (X) (X) Related children 5 to 17 years 9.8% 11.7 (X) (X) 18 years and over 19.7% 9.5 (X) (X) 18 to 64 years 21.9% 11.4 (X) (X) 65 years and over 10.3% 9.5 (X) (X) People in families 10.9% 9.3 (X) (X) Unrelated individuals 15 years and over 52.6% 21.4 (X) (X) TABLE 3.11: Employee Compensation: Jackson County Description 2001 2005 2009 Total compensation of employees Compensation of employees, received 1/ 19741 23698 27536Total wage and salary disbursements 15035 17505 20007Total supplements to wages and salaries 4706 6193 7529 Employer contributions for employee pension and insurance funds 3523 4798 5873 Employer contributions for government social insurance 1183 1395 1656 Total average compensation per job (dollars) 2/ 25341 29366 34206Compensation of employees by industry Farm compensation 1195 1044 1244 Nonfarm compensation 18546 22654 26292 Private compensation 6046 6978 8299 Mining 0 0 0 Utilities (D) (D) (D) Construction (D) 527 903 Manufacturing (D) (D) (D) Wholesale trade 820 407 457 Retail trade 1836 1940 1916 Transportation and warehousing (D) (D) (D) Information (D) (D) (D) Finance and insurance (D) (D) (D) Real estate and rental and leasing 0 0 0 Professional, scientific, and technical services (D) (D) (D) Management of companies and enterprises 0 0 0 Administrative and waste services (D) (D) (D)

16
Educational services 0 0 0 Health care and social assistance (D) (D) (D) Arts, entertainment, and recreation (D) (D) (D) Accommodation and food services (D) (D) (D) Accommodation (D) 928 1052 Food services and drinking places 431 (D) (D) Other services, except public administration (D) (D) 837 Government and government enterprises 12500 15676 17993 Federal, civilian 5036 6359 8095 Military 302 681 811 State and local 7162 8636 9087 State government 462 581 740 Local government 6700 8055 8347
1/ The estimates of compensation for 2001-2006 are based on the 2002 North American Industry Classification System (NAICS). The estimates for 2007 forward are based on the 2007 NAICS. 2/ Total average compensation per job is compensation of employees received divided by total full-time and part-time wage and salary employment. 3/ Under the 2007 NAICS, internet publishing and broadcasting was reclassified to other information services. • All dollar estimates are in current dollars (not adjusted for inflation). (D) Not shown to avoid disclosure of confidential information, but the estimates for this item are included in the total. (N) Data not available for this year.
17
CHAPTER 4: ENVIRNOMENTAL
Environmental Goal: To sustain an environmental strategy that supports an interworking relationship between the physical and built environment and also protect the air and water quality to ensure public health and safety for the residents of Kadoka. Environmental Objectives Assess Kadoka’s Topographic and Soil Classifications Assess Kadoka’s Slope Stability, Hydrology, and Climate Promote/support any grass roots recycling campaigns/organizations Develop/Promote/Support/Enforce strategies/ordinances to protect air and water
quality throughout the City. This chapter gives general information, key findings, and examines critical issues associated with the topographic characteristics of the Kadoka area. Information provided in this chapter will assist in guiding planning policy decisions in the formulation of this comprehensive plan. Being familiar with an area’s physical surroundings is a necessary component of sustainable long-range land use planning. The physical environment’s topography, geology, soils, hydrology, and overall climate all shape an area’s growth and land use development patterns. This chapter summarizes the main attributes of the city’s natural environment, giving city policy makers, land owners, and citizens the opportunity to consider positive and negative natural characteristics that could potentially shape future development within the City of Kadoka. The chapter also addresses environmental concerns/responsibilities the City should address in the near future to help protect the environmental quality of the City of Kadoka. 4.1 TOPOGRAPHY Jackson County is located in southwestern South Dakota and is part of the Pierre Hills and Tertiary Table Lands division of the Great Plains. The Badlands area consists of Brule and Chadron Formations of the White River Group. This is characterized by very steep Badlands and gently sloping drainage ways. The White River is the county’s major drainage way and flows eastward through the center of the county. Elevation ranges from 2,660 feet near Cedar Pass to 1,940 feet where the White River flows out of the county. An example of Kadoka’s topography is shown on figure 4-1.
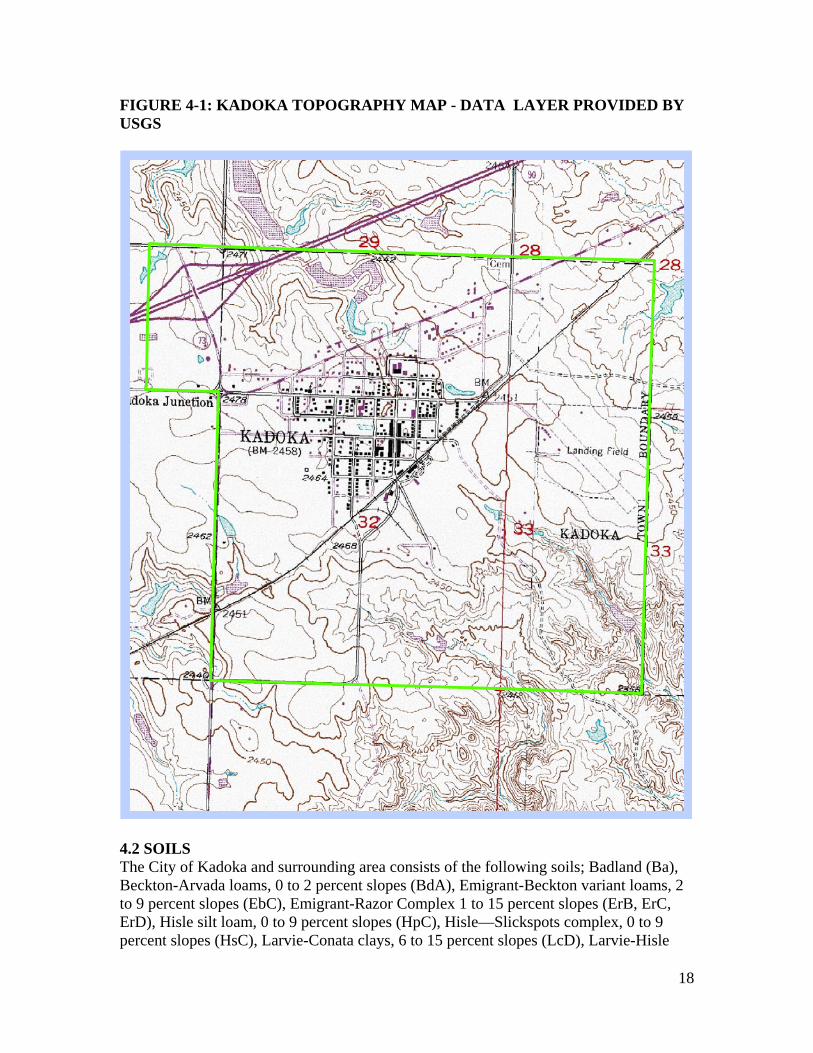
18
FIGURE 4-1: KADOKA TOPOGRAPHY MAP - DATA LAYER PROVIDED BY USGS
4.2 SOILS The City of Kadoka and surrounding area consists of the following soils; Badland (Ba), Beckton-Arvada loams, 0 to 2 percent slopes (BdA), Emigrant-Beckton variant loams, 2 to 9 percent slopes (EbC), Emigrant-Razor Complex 1 to 15 percent slopes (ErB, ErC, ErD), Hisle silt loam, 0 to 9 percent slopes (HpC), Hisle—Slickspots complex, 0 to 9 percent slopes (HsC), Larvie-Conata clays, 6 to 15 percent slopes (LcD), Larvie-Hisle

19
complex 2 to 9 percent slopes (LhC), Metre-Larvie clays, 2 to 6 percent slopes (MoB), Orella-Rock outcrop complex, 3 to 45 percent slopes (OrE), Pierre-Hisle complex, 1 to 6 percent slopes (PhB), Pierre-Samsil clays, 6 to 15 percent slopes (PkD), Promise Clay, 0 to 3 percent slopes (PrA), Promise-Hurley complex, 0 to 6 percent slopes (PsA, PsB), Razor-Midway silty clay loams, 6 to 15 percent slopes (RmD), Samsil Clay, 15-40 percent slopes (SaF), Samsil-Hisle-Rock outcrop complex, 6 to 25 percent slopes (ShE), and Water (W). FIGURE 4-2: KADOKA SOILS MAP USDA-NRCS
I 90 E
I 90 W
SD HWY 248
SD
HW
Y 7
3
6T
H A
VE
MA
IN S
T
LOCUST
POPLAR ST
PINE ST
9T
H A
VE
5T
H A
VE
229
AV
E
13
TH
AV
E
I 90 E1
CHESTNUT ST
I 90
E2
I 90 W1
SPRUCE ST
7T
H A
VE
MAPLE ST1
2T
H A
VE
FRANK CREEK RD
WO
RD
RD
OAK ST
BULK RD
AIRPORT RD
UNKNOWN
2N
D A
VE
4T
H A
VEBAYBERRY ST
3RD
AV
E 10T
H A
VE
6T
H A
VE
10
TH
AV
E
Legend
Roads
Kadoka City Limits
Soils
Ba
BdA
EbC
ErB
ErC
ErD
HpC
HsC
LcD
LhC
MoB
OrE
PhB
PkD
PrA
PsA
PsB
RmD
SaF
ShE
W 4.3 SLOPE STABILITY AND LANDSLIDES With all new development or construction landslides and slumps (landmass surface failures) can result from one or more of the following factors: over-loading the top of a slope, construction of non-compacted fills, digging out the base of a slope, constructing on unstable sites, constructing fill over exposed groundwater or improper channeling of surface water. For all new construction in Kadoka, planning and engineering must be used as tools to mitigate against hazards posed by hilly topography, high degrees of slope, and soil instability.
KADOKA SOILS

20
4.4 HYDROLOGY5 The majority of the water derived from Kadoka comes in the form of precipitation which is 17.1 inches annually. The City of Kadoka also has Kadoka Lake which is a reservoir located just over a mile west of town. The City of Kadoka provides water service to approximately 335 users. The City purchases its water from West River / Lyman-Jones Rural Water System, Inc. (WR/LJ RWS). The rural water point of connection is on the east side of the city. The city of Kadoka maintains two wells that can be used, if necessary. Water from the wells is pumped through various sized piping to the old water treatment plant on the east side of the city. The City no longer uses the water treatment plant other than a point of entry for the well water. The City has not used its wells for its water supply since rural water was supplied in 2007. 4.5 CLIMATE Kadoka’s climate is generally described as a continental climate. Winters are relatively long and cold while summers are fair and hot. Most of the precipitation occurs during the warm period of late spring and early summer. Approximately 75 percent of the total annual precipitation falls in April through September. Normal precipitation for the area is 17.1 inches annually. The average summer temperature is 72 degrees and the average winter temperature is 22. CHART 4-1: KADOKA’S NORMAL TEMPERATURE (FAHRENHEIT), REPORTED: KADOKA 1 S WEATHER STATION6
5 Facility Plan for the Water System in Kadoka, SD, SPN & Associates, 1/2011 6 http://www.city-data.com/city/Kadoka-South-Dakota.html

21
CHART 4-2: KADOKA’S NORMAL PRECIPITATION (INCHES), REPORTED: KADOKA 1 S WEATHER STATION7
7 http://www.city-data.com/city/Kadoka-South-Dakota.html

22
CHAPTER 5: INFRASTRUCTURE & DRAINAGE MANAGEMENT
Infrastructure & Drainage Management Goal: To support a cost effective infrastructure & drainage management strategy that meets Kadoka’s long term water, waste water, storm drainage, solid waste management, and other infrastructure needs. Infrastructure & Drainage Management Objectives Address/Access Kadoka’s Drainage Management System Needs Address/Access Kadoka’s Water & Waste Water System Needs Address/Access Kadoka’s Solid Waste Management System Needs Actively pursue infrastructure rehabilitation/improvements to all system needs as
financial constraints allow Encourage/Promote water quality testing/reporting information to public 5.1 DRAINAGE MANAGEMENT As indicated in Figure 2: City of Kadoka’s National Flood Insurance Program Rate Map, portions of Kadoka’s southern sections designated as Zone A are located along the floodplain of the White River and are relatively flat. The City of Kadoka is a participating community and in good standing with the National Flood Insurance Program. FIGURE 5-1: CITY OF KADOKA’S NATIONAL FLOOD INSURANCE PROGRAM RATE MAP

23
5.2 KADOKA INFRASTRUCTURE & DRAINAGE PROJECTS 5.2.1 Kadoka – Problem Drainage Areas & Projects 5.2.1.1 2nd and 3rd Avenue Pavement/Curb and Gutter Project The community plans to pave/install curb and gutter; 2nd Avenue from Popular Street to Airport Road, Chestnut Street from 2nd Avenue to 3rd Avenue, and 3rd Avenue from Popular Street to Chestnut Street. 5.2.1.1 5th and 6th Avenue Storm Drainage Collector Project The community plans to install a storm drainage system; 5th Avenue from Cedar Street to Popular Street, Birch Street from 5th Avenue to 7th Avenue, and 6th Avenue from Cedar Street to Hickory Street, and Popular Street from 4th Avenue to 6th Avenue. 5.2.2 Kadoka – Infrastructure Needs for Development & Projects 5.2.2.1 (20) - Acre Business Development The community of Kadoka plans to develop 20 new acres for business development. This new business development will require new infrastructure for electricity, roads, transportation, water, sewer, and storm-water drainage. The estimated cost of the project is $975,000. FIGURE 5-2: CITY OF KADOKA’S EXISTING COLLECTION SYSTEM

24
5.3 WATER The city currently provides water service to approximately 250 residential and 63 commercial connections. In addition to these connections there are 22 rural water connections for a total of 335 connections. The city purchases its water from West River/ Lyman-Jones Rural Water System, Inc. The rural water point of connection is on the east side of the city. Kadoka maintains two wells that can also be used when necessary. Water from the wells is pumped through various sized piping to the old water treatment plant on the east side of the city. The City no longer uses the water treatment plant other than as a point of entry for the well water. The city has not used its wells for its water supply since rural water was supplied in 2007. Recently, an engineering firm created a facilities plan for Kadoka’s wastewater system. The firm made multiple recommendations for improvements, which are included below. The total estimated cost for all of the recommended projects is $6,314,792.50. Also, future needs should be addressed as need requires, and as financial feasibility is available. FIGURE 5-3: CITY OF KADOKA’S EXISTING WATER SYSTEM

25
5.3.1 Water Storage: Improve Water Towers The project would allow the City to meet the required OSHA upgrades needed for the south water tower. The project includes upgrades to its entry, ventilation, and safety system. It also includes sandblasting and recoating the inside of the south tower, and cleaning, touching up and over coating the exterior of both water towers. The estimated total project cost is $222,500. 5.3.2 Water Distribution: Looping. The project allows the City to eliminate dead-end pipelines where practical. The loop piping eliminates nine dead ends while establishing a new six-inch PVC water main. The remaining six dead ends are not realistically able to be looped due to their location. One fire hydrant is also proposed for the dead end that does not currently have a fire hydrant in the southwest part of the City. The estimated total project cost is $775,100. 5.3.3 Water Distribution: Replace the CIP and ACP. When CIP and ACP ages it becomes brittle and has a tendency to corrode on the inside. This corrosion and scale build-up is common with this type of piping, and greatly decreases the capacity of the pipe. The proposed PVC pipe will increase the pressures and fire flow, while also helping to reduce the amount of water loss in the system. The estimated total project cost is $5,124,880. 5.3.4 Water Distribution: Meters and Reading System Upgrades The project incorporates the completion of the City’s program of replacing the existing water meters. Half of the water meters remain and are approximately 10 to 20 years old. The old meters may also be a part of the water loss problem. The city may also benefit a great deal from an automatic water meter reading system. The estimated total project cost is $186,312.50. 5.3.5 Water Distribution: Leak Detection Survey The City of Kadoka may benefit from hiring a professional to provide leak detection services. This could greatly lessen the amount of water loss in the system, and in turn save the City a great deal of previously lost revenues. The expected cost of this work is approximately $6,000. 5.4 WASTE WATER SERVICES The city’s waste water lagoon system is located approximately one-half mile north of Kadoka’s city limits. The treatment system consists of three storage/treatment cells and one terraced artificial wetland. Recently, an engineering firm created a facilities plan for Kadoka’s wastewater system. The firm made multiple recommendations for improvements, which are included below. The total estimated cost for all of the recommendations is $2,043,450. Also, future needs should be addressed as need requires, and as financial feasibility is available.

26
5.4.1 Clean and Televise Existing System This project will allow the city to evaluate the condition of the entire collection system. With this information, the city can further evaluate and prioritize areas that need to be repaired or replaced. The estimated cost of this would be $83,950 5.4.2 Replace ACP Sanitary Sewer This project will allow the city to begin replacing or repairing the potentially structurally deficient AC pipe before significant failures are experienced. The estimated total project cost is $495,000. 5.4.3 Brick Manhole Replacement This project would allow the city to begin replacing the failing brick manholes before further “cave-ins” and damage to the street surface is experienced. The estimated total project cost is $671,500. 5.4.4 Repair Riprap in Cells One and Two This project would repair the erosion being experienced and protect the structural integrity of the pond dikes. The estimated total project is $793,000. FIGURE 5-4: CITY OF KADOKA’S WASTEWATER TREATMENT FACILITY

27
5.5 SOLID WASTE MANAGEMENT The City’s current landfill or rubble site is located east of town at on CS 14. The City of Kadoka shall encourage/promote/research/implement strategies to improve the recycling capabilities for the City of Kadoka. Recycling can benefit the population of Kadoka in a number of different ways. Reducing the amount of material brought to the current rubble site will extend the life of the site in its current condition, pushing improvement costs further away. The citizens of Kadoka are being asked to pay to throw away large recyclable materials, discovering an effective strategy to recycle these materials will not only lower costs on the citizen, but may also lead to a possible revenue stream for the City. 5.6 ENCOURAGE/PROMOTE WATER QUALITY TESTING/REPORTING TO PUBLIC As stated in the environmental section, the City of Kadoka places great emphasis on protecting its water and air quality. These two components have a very significant correlation to public health and safety for both citizens and visitors of Kadoka. The City of Kadoka will explore the financial viability of conducting regular water quality testing, and seek an efficient way of making that information available to the public.

28
CHAPTER 6: LAND USE Land use defines the physical landscape and provides justification for zoning in a community. It also provides a basis for how each land parcel functions as a living component of the city and provides a visual strategy for planning future growth. The city of Kadoka’s land use is separated out by Six districts; Residential, Business/Commercial, Parks & Recreation, Industrial, Institutional, and Agricultural. Land Use Goal: The City of Kadoka will promote a land use policy that addresses the community’s current and future economic development and housing needs. Land Use Objectives Access Kadoka’s Existing Land Use Conduct a Land Use Analysis Address Development Constraints Address Kadoka’s Future Land Recommendations 6.1 EXISTING LAND USE Kadoka’s two business districts exist along the SD HWY 248 and 73 corridors and the city’s Central Business District which encompasses approximately eight city blocks that are closely bordered by Chestnut Street to the north, Railway Street to the south, 9th Avenue to the east, and 7th Avenue to the west. The vast majority of Kadoka’s land is designated residential and it runs east and west along the city’s center. The land areas surrounding the business, industrial, and residential districts are either considered a no-use/vacant district or comprised of land with an agricultural designation. Current Land Use in Kadoka Land uses for Kadoka have been divided into six district types; Business/Commercial District – automobile service stations, banks/financial services, carpenter or cabinet making, clubs, funeral services, laundry services, car washes, bars, beauty & fitness, tourist attractions, offices, newspaper/book binding, restaurants, and retail Industrial District – building Material Grain elevators, warehouses, wholesale houses, manufacturing, gravel operations, and monument works Institutional District- Government buildings, Schools, Churches, libraries, clinics, assisted living buildings, and other public works facilities Parks & Recreation District- Designated green spaces, Rodeo Grounds, recreational facilities, Parks, etc. Residential District – single detached houses, multi-family dwellings, and apartment buildings

29
Agricultural District/Vacant/No-Use District – includes land that is not developed, not designated as one of the other five districts, acreages, or areas that provide farming and other agriculturally related uses. Also, newly annexed land or land in which the construction of permanent structures is prohibited pending study and survey of lands by the city’s board of adjustment. FIGURE 6-1: CITY OF KADOKA CURRENT LAND USE MAP
Land Use Analysis Need to identify future areas for business and industrial development to promote
economic development Need to continue revitalizing the downtown Central Business District Need to plan for future residential and housing needs

30
Development Constraints A city is obligated to assess its development constraints when planning for future growth in adjoining areas. The city must coordinate with the county on all matters concerning annexation. The city must also take issues such as minimum infrastructure costs and public safety concerns into account. For example, building in areas that are flatter or with limited variances in slope may prove to be more cost effective than building on the edge of a hill with a 15% slope. The City of Kadoka has 1 major development constraint. Land near wetlands north of town are low lying and not ideal for development 6.2 FUTURE LAND USE RECOMMENDATIONS Business/Commercial District Downtown will continue to be the main location for specialty retail, offices, and
other commercial uses Land for additional commercial development should be reserved along both the
SD HWY 248 and Interstate 90 corridors located on the northern edge of town. This corridor will continue to be the epicenter future commercial development
Industrial District / Ag-Industrial District With the current comprehensive plan only focusing on land within the City’s incorporated limits the commission felt that combining the Industrial district with an Ag-Industrial designation would simplify the future land use map. The placement of future industrial land should be adjacent to the current industrial district located south of the central business district where the current industrial district is. Containing industrial development to one district can increase the quality of life for residents throughout the community. Future consideration will be given to acknowledge the “right to farm” or “agriculture operation and its appurtenances” according to South Dakota State Statutes §21-10-25.1 – §21-10-25.6 and preserve areas for agricultural production. The purpose behind “right to farm” is to limit potential conflicts between acreages and farms. Residential District Development should primarily focus on infill development with land that is
currently designated residential to lessen future infrastructure costs (sewer, water, drainage) that are often associated with building in newly annexed areas.
Ensure there is an adequate amount of land available to meet the future housing needs of Kadoka
Flexibility in residential zoning that accommodates multiple housing options; single family dwellings, multi-family dwellings, and housing for the low-moderate income and the elderly

31
Parks & Recreation District Currently, the designated green spaces are filling Kadoka’s recreation needs. However, improvements and other possibilities are discussed in Chapter 11: Parks & Recreation. Vacant/No Use/Out of Jurisdiction Designation All lands being annexed by the city shall be placed in a No Use designation till the City’s Board of Adjustment is able to conduct an investigation and study of the proposed land use of the existing area. For this reason, The Commission felt the future land use map should contain lands outside of the City’s Limits to be classified under this designation. The aforementioned future land use recommendations were based on information provided by/discussions with the Planning and Zoning Commission, the Kadoka City Council and the Jackson-Kadoka Economic Development Corporation. It is the recommendation of the Planning and Zoning Commission that current land uses be grandfathered into the adoption of future zoning ordinances. Figure 6-2: City of Kadoka Future Land Use Map is not the community’s official zoning map. It is a guide for future land use patterns. The future land component and other features of the Comprehensive Plan are implemented mainly use through development regulations (i.e., zoning and building regulations). Text of the zoning regulations and its corresponding map establish which specific development requirements apply to a particular property. Figure 6-2: Future Land Use Map

32
FIGURE 6-3: POTENTIAL AREA FOR RESIDENTIAL GROWTH
FIGURE 6-4: POTENTIAL SITES FOR COMMERCIAL GROWTH

33
CHAPTER 7: TRANSPORTATION Transportation Goal: To support a transportation strategy that ensures the City of Kadoka’s critical road improvements occur, community safety concerns are addressed, and long-term transportation needs are met. Transportation Objectives Maintain/Rehabilitate/Improve Existing Road Network in a Timely Manner Meet Airport Service Needs & Address Airfield Quality Issues Address Community Mass Transit Needs 7.1 ROAD NETWORK The City’s road network is a critical planning component due to the interactive relationship between transportation and land use. A well planned and maintained road network leads to convenient access to jobs, schools, medical services, businesses, parks, and other recreational opportunities. The upkeep of the road network is essential to accommodate existing infrastructure and future growth. In terms of functional classifications according to the South Dakota Department of Roads, the City of Kadoka has two principal arterial highways, US HWY 16 that runs east and west along the city’s northern segment and acts as a hub to bring people to the central business district. SD HWY 73 runs north and south, and provides a direct route to I-90. These arterial roads carry a large volume of traffic and facilitate the movement of goods and services. The remaining roads within city limits are classified as either collectors or local streets. Collector streets are designed to provide connectivity between arterials and are normally spaced every one-half mile. Local streets provide access from low-density residential developments to collector or arterial streets. The road network continues to be the city’s main source of transportation to and from work. According to the US Census’ American Community Survey 2005-09, 76.6% of Kadoka residents commuted to work by automobile alone, 13.2% carpooled, 7.1% walked, and 3% worked from home. The interconnectivity between the city’s road network, trails, sidewalks, and its residents is essential to ensure people and goods are able to move around the community in a safe, efficient, and convenient manner. Transportation is often considered to be a community’s single largest capital investment that requires every dollar to be spent in an efficient streamlined manner. Transportation expenditures also account for a greater percentage of city budgets than education, public safety, or public welfare for cities with populations fewer than 50,000, according to a study conducted by the National League of Cities. It is therefore imperative that Kadoka’s transportation projects are thoughtfully planned and address long term community needs.
34
Transportation/Drainage Projects8 Project 1 - 2nd and 3rd Avenue Pavement/Curb and Gutter Project Project 2 - 5th and 6th Avenue Storm Drainage Collector Project 7.2 AIRPORT SERVICE The Kadoka Airport is located 1 mile east of Kadoka’s current city limits. The airport is owned and operated by the city of Kadoka. The facility provides services for businesses and the general public. The airport is managed by the City of Kadoka’s Finance Office, in addition to oversight from the State Department of Transportation (Aeronautics) and the Federal Aviation Administration (FAA). Currently, there are approximately 1.15 operational flights per week at the Kadoka Airport. This translates to roughly 60 operational flights per year. The airport consists of two runways; runway 12/30 has a turf/gravel surface and measures 2,600 feet in length, runway 4/22 has a turf surface and is 1,600 feet in length. The City of Kadoka shall maintain a serviceable air field in order to help prevent any potential mishaps jeopardizing the health and safety of the residents of Kadoka and prospective users of the airfield. 7.3 MASS TRANSIT Currently, the City of Kadoka’s mass transit needs are served by a private sector partner. These needs are primarily individuals who can no longer transport themselves, and need assistance in receiving services not available in the Kadoka community. The current service is doing a more than adequate job serving the need in the community, but as the City continues to develop, the service may need to be re-addressed.
8 Projects are thoroughly described in Chapter 5 Infrastructure & Drainage Management

35
CHAPTER 8: ECONOMIC DEVELOPMENT Economic Development Goal: Kadoka will strive to provide an entrepreneur-friendly community that nurtures existing businesses and attracts new business by promoting Kadoka’s quality of life attributes. Economic Development Objectives: Increase Retail Trade Opportunities Encouraging Citizens to Shop Locally and Marketing Kadoka Revitalize and Market Downtown Retaining and Supporting Current Businesses Attracting New Businesses by Providing an Entrepreneur-friendly Community Ensure Sufficient amount of Commercial and Industrial Sites Support Farming and Ranching Community Improving Kadoka’s Aesthetics Promote Tourism Utilize Kadoka’s School System 8.1 INCREASE RETAIL TRADE OPPORTUNITIES Kadoka is a self-contained community that is nestled between the Pierre and Rapid City Regional Trade Areas. According to the South Dakota Department of Revenue the total taxable retail sales Kadoka was $10,142,018.79, the taxable retail sales for the calendar year for Jackson county was $10,990,150.76 meaning Kadoka accounts for about 92% of the total taxable retail sales in the county. As a means of comparison, neighboring Pennington County’s taxable retail sales was $1,441,645,159.47 with 94% coming from Rapid City at $1,356,018,509.58. While Hughes County generated $205,762,092.49 in taxable retail, with $204,097,035.26 or 99% coming from Pierre. Due to its competition from the east and west Kadoka must continue to remain creative and progressive in order to retain the retail trade area it currently has by building upon past successes. 8.2 ENCOURAGING CITIZENS TO SHOP LOCALLY AND MARKETING KADOKA It has become more and more difficult for local businesses to compete with near-by Rapid City and its numerous box stores. The Kadoka Community Betterment Association (KCBA) has been instrumental in promoting and advertising Kadoka through its publications, bill boards programs, pancake feeds, new signage, Christmas and Homecoming Day Promotions and other activities. The community website may also be an excellent resource for promoting Kadoka. Further coordination with the City, local businesses, and other organizations could lead to marketing campaigns/strategies to further promote shopping in Kadoka. 8.3 REVITALIZING AND MARKETING DOWNTOWN Kadoka has a charming downtown with a lot of potential. The City must promote an economic strategy that concentrates on filling empty buildings and focusing efforts on restoration as opposed to new construction in the downtown area. This can be
36
accomplished by encouraging/coordinating with business owners to take advantage of state and federal tax incentives for historic preservation. The City also has the option of coordinating its own local Main Street Program. Once these façade and frontage improvements are made, the downtown area will become more marketable to those both local to Kadoka, as well as those passing by on nearby highways. 8.4 RETAINING AND SUPPORTING CURRENT BUSINESSES The City must continue to support local firms and businesses. These companies are more likely to remain and create new jobs locally due to their roots and commitment to the community. The majority of new jobs being created in the United States come from the expansion of existing local firms and businesses. Attracting new business however should still be encouraged. 8.5 ATTRACTING NEW BUSINESSES BY PROVIDING AN ENTREPRENEUR-FRIENDLY COMMUNITY The Kadoka Needs Assessment prepared by the CSDED recommended for Kadoka to utilize a business-friendly entrepreneurial development approach with four key cornerstones; financial resources, community design, creative capital, and health care strategies.
1. Financial Resources – Access to financial capital is essential to the development of businesses and entrepreneurs. This strategy can be accomplished by educating potential entrepreneurs about funding avenues and other resources that could be used to start their own businesses. (A list of potential financial resources for business development is attached in the appendix of this plan)
2. Community Design – Having a community design infrastructure in place that continues to make Kadoka both inviting and beautiful place for potential businesses and entrepreneurs.
3. Creative Capital – This process involves developing potential entrepreneurs in Kadoka by creating or promoting educational opportunities for both youth and other members of the community. Assist with local/state/federal grant/incentive resources/programs and also assist with local/regional bank relationships.
4. Health Care Strategies – Continue to provide quality health care and services through Hans P Peterson Memorial Hospital and other health care providers.
8.6 ENSURE SUFFICIENT AMOUNT OF COMMERCIAL AND INDUSTRIAL SITES The City will continue to work with the Jackson-Kadoka Economic Development Corporation (JKEDC) and prospective businesses to ensure there is an adequate amount of commercial and industrial land available for development. Potential future sites for economic development or industrial/commercial expansion will be placed in the City’s future land use map. Considerations such as water, sewer, utilities, rail, and road access will be taken into account for making determinations regarding the placement of future commercial or industrial sites. The JKEDC has been coordinating with the South

37
Dakota’s Governor’s Office of Economic Development (SDGOED) to participate in a pilot run of the ‘Certified Ready’ program along with putting together a listing of potential business, commercial, and industrial sites on a the SDGOED’s database to recruit potential businesses to locate to Kadoka. 8.7 SUPPORT FARMING AND RANCHING COMMUNITY Continue to support area farmers and ranchers by providing the goods, services, and capital they need to maintain or expand operations. Kadoka’s success as a business community hinges on the success of its agricultural sector. This can be established through the creation of partnerships with area businesses and the agricultural community. This will help encourage area farmers and ranchers to shop locally and will help promote local economic development. 8.8 IMPROVING KADOKA’S AESTHEITICS Improving Kadoka’s aesthetics could also be a strategy to attracting prospective businesses and residents. Community beautification is an issue that the community of Kadoka is beginning to address. Kadoka has been successful at initiating community clean-up projects and has hosted block parties to clean up various sections within the community. The community still has issues with abandoned properties and junk cars. The issue could be solved by having the City of Kadoka implement and enforce its nuisance ordinances. The City of Kadoka should also investigate possible strategies to give incentive to inspire property owners to be proactive with their properties. 8.9 PROMOTING TOURISM Kadoka is known as the “Gateway to the Badlands” and it prides itself with this distinction. It also possesses attractions such as the Badlands Petrified Garden, Pearl Hotel, and the Kadoka Depot Museum. Signage is abundant off of the interstate to lure persons in for the Badlands Petrified Garden. The Pearl Hotel is still in the process of being renovated and this process may take several years. The restoration of the Pearl Hotel is the main key in preserving Kadoka’s past. The Pearl Hotel, Kadoka Depot Museum and Mt. Moriah Masonic Lodge #155 are all properties listed on the National Register of Historic Places. There has also been some discussions regarding using the Rails for Trails program to create a trail link from Cedar Pass to Kadoka. The Black Hills Badlands and Lakes Association have been in discussions with several local groups to make this dream a reality. The creation of this trail will bring in tourists who are visiting the Badlands. A trail stop that fixes and rents bicycles/dinner with Gatorade and energy bars could be one possible business opportunity.

38
8.10 UTILIZE KADOKA SCHOOL SYSTEM Kadoka’s school system can be a dynamic resource in both marketing Kadoka and also workforce development. Kadoka’s small class sizes, athletic opportunities, and safe environment are all excellent marketing qualities for Kadoka. These assets should not be ignored while marketing Kadoka to perspective residents and businesses. Establishing a working relationship with the school to focus on workforce development could also provide great benefits to the City. Continued efforts in providing part-time work for youth and increased coordination with school’s “Kadoka Cares” program are encouraged to help assist Kadoka’s youth. Retaining youth in the work force is a true need of the community, and a more involved relationship may assist in filling this need.

39
CHAPTER 9: HISTORIC PRESERVATION Historic Preservation Goal: To protect and preserve Kadoka’s historic structures, resources, and character. Kadoka’s Historic Preservation Objectives: Find Incentives and Private Support for the Restoring of Existing Structures Inventory Kadoka’s Full Range of Historic Resources Determine Feasibility to Declare a Section of Kadoka as a Historic District Incorporate historic preservation principles in future economic
development/downtown revitalization strategies 9.1 KADOKA’S HISTORIC PRESERVATION PHILOSOPHY Historic preservation is built on a philosophy of taking logical steps to preserve buildings or objects from a community’s past so that they may be enjoyed by future generations. The community of Kadoka does not have a designated historic district, but does have 3 structures, or buildings that are placed on the National Register of Historic Places within city limits: Chicago, Milwaukee, and St. Paul Railroad Depot, Mt. Moriah Masonic Lodge #155, and the Pearl Hotel. Each of these structures is a living testimonial to Kadoka’s past. Structures like these must be protected, because when they’re destroyed it diminishes the overall character of a community. The comprehensive plan however, encourages Kadoka to work with private interests and property owners to maintain and preserve its landmarks even if they are not designated as such by the state or federal government. 9.2 FIND INCENTIVES AND PRIVATE SUPPORT FOR THE RESTORING OF EXISTING STRUCTURES At the grass roots level partnerships must be built between private property owners, members of the community, and local officials to build support for the restoration or maintenance of existing structures with historic significance. State and federal partnerships may also be required. For example, in order to receive 10 percent or 20 percent federal tax rebate incentives through the Internal Revenue Services (IRS) there needs to be a three-way partnership in place with the IRS, South Dakota’s State Historic Preservation Office, and the United States National Park Service. Properties must also be listed on the National Register of Historic Places in order for property owners to be eligible for federal tax incentives. 9.3 INVENTORY KADOKA’S FULL RANGE OF HISTORIC RESOURCES The process must begin with Kadoka creating an inventory or listing of potential historic properties. This listing could be accomplished through the creation of a local historic preservation committee. The historic preservation committee could then conduct research to determine if either of Kadoka’s structures would qualify to be placed on the national or state register of historic places. Once the list is compiled the local historic preservation committee could work with the South Dakota Historic Preservation Office to have selected properties placed on the state or federal registers of historic places.

40
9.4 DETERMINE FEASIBILITY TO DECLARE A SECTION OF KADOKA AS AN HISTORIC DISTRICT In order for a section to be declared an historic district at the local level there must be support among business owners, home owners, and local officials. A lack of support among the community at large could prevent the local designation of an historic district from becoming feasible. The Kadoka City Council does have the option of declaring an area a historic district. Zoning ordinances or building regulations could then be used as tools to restrict development or maintain the character of existing structures within an area that has a historic district designation. Kadoka’s downtown business district could potentially be listed as an historic district. 9.5 KADOKA’S HISTORIC SITES Chicago, Milwaukee, and St. Paul Railroad Depot: The first Railroad Depot was built in the spring of 1907. The first cattle were shipped by John Hart of Interior in August of 1907. The final train passed through Kadoka in 1980. The Depot now serves as a Museum and is open daily throughout the summer months, located at the south end of Kadoka's Main Street. The depot was listed on the National Register of Historic Places in 1986. Mt. Moriah Masonic Lodge #155: The Mt. Moriah Masonic Lodge once was the meeting place to Kadoka’s freemason organization. It now stands vacant on the south end of Main Street, but is still an excellent example of architecture from the early 1900’s. The lodge was listed on the National Register of Historic Places in 2004. Pearl Hotel: The hotel was established within a year of Kadoka’s founding, making it a first generation building. The Pearl Hotel is one of the few remaining links that connects the town with the railroad. Since the time of its construction, the building has served as a hotel, housing for school children, and private residences. The hotel was listed on the National Register of Historic Places in 2007. 9.6 INCLUDE HISTORIC PRESERVATION PRINCIPLES IN FUTURE ECONOMIC DEVELOPMENT/DOWNTOWN REVITALIZATION STRATEGIES The historic integrity of the City of Kadoka should be considered a major asset of the community. Future economic development and/or downtown revitalization strategies implemented by the City, should take into consideration the effect said strategies will have on Kadoka’s overall character. Historical assets, like those located in Kadoka, cannot be rebuilt, and are finite assets. If consideration isn’t given to the historical impact of potential development, Kadoka may lose some of its invaluable historic significance/assets.

41
CHAPTER 10: HOUSING Housing Goal: To promote a long-term housing strategy that ensures a healthy and viable housing stock for all of Kadoka’s residents, along with protecting property values and promoting the health and safety throughout the community. Housing Objectives: Ensure Adequate Supply of Affordable Housing Provision of Sufficient Housing Options and Choices Create More Housing Opportunities for the Elderly Create Pedestrian Friendly Residential Environment with Convenient Access to
Neighborhood Services Encourage Rehabilitation and In-fill Development Develop/Enforce Nuisance Abatement Ordinances for vacant and hazardous
properties Provide for Adequate Supply of Affordable Land, and Timely Infrastructure
Improvements 10.1 ENSURE ADEQUATE SUPPLY OF AFFORDABLE HOUSING The City of Kadoka must continue to make certain an adequate supply of affordable housing is present in their community to meet the needs of working families, the elderly, and low income individuals. Housing affordability is not simply important, but it is vital for a community’s future. A lack of affordable housing acts as a deterrent for new families that are considering locating to Kadoka, and limits prospects for first time home buyers. An adequate supply of affordable housing will help enhance the livability of existing neighborhoods and ensures their survivability for future generations. The South Dakota Rural Development Council’s “Rural Resource Team Report Kadoka, SD stated that financing has become the main hurdle for real estate and commercial development. Financing is further complicated by the fact that appraisals/values of new homes often do not equal the costs of construction. Therefore housing programs such as the First-time Homebuyer Program through the South Dakota Housing Development Authority and the Section 502 Loan Guarantee Program of the United State Department of Agriculture must be utilized to help fill the appraisal/values gap for new home development. 10.2 PROVISION OF SUFFICIENT HOUSING OPTIONS AND CHOICES A safe and affordable residential unit must be available to each of Kadoka’s citizens. Sufficient housing options should provide a community with a wide range of housing opportunities such as rentals, elderly housing, apartments, starter homes, mid-level priced homes, and upper-end homes. Housing choices give a young family the option of moving into a larger home when their family size increases. Elderly couples are given the option to sell their existing home for a smaller home that is more accommodating. A broad range of housing options increases a community’s quality of life for its residents during all phases of life.

42
10.3 ENCOURAGE REHABILITATION AND IN-FILL DEVELOPMENT Rehabilitation of existing homes and in-fill development will be encouraged. Residential structures should be rehabilitated when feasible or when it’s deemed cost effective. The rehabilitation of existing housing will not only add to the beautification of the community as a whole, but it will help ensure the longevity of the housing stock for the long-term. Homes that are vacant and damaged beyond repair should be leveled to free up lots for new housing. In-fill development will be encouraged when possible due to the fact that infrastructure costs to the city are minimized because the infrastructure is already in place. 10.4 CREATE HOUSING OPPORTUNITIES FOR THE ELDERLY Housing options should be made available for the elderly to include low maintaince housing, assisted living centers, and long-term care facilities. Kadoka’s current demographics show that the number of persons over the age of 65 has increased from 22.8% of the city’s total population in 2000 to 24.5% of the city’s total population in 2010. The total number of persons over the age of 65 is expected to increase despite the projection that Kadoka’s overall population which was 706 during the 2000 US Census, dropped to 654 according 2010 US Census, and is expected to decrease even further in coming years. It can be assumed that with this percentage increase combined with an overall population increase, that many of the older population will be staying there, while the younger demographic leaves. While we want to encourage them to stay, it is reasonable to estimate that the demand for elderly housing will be rising in the coming years. Housing Programs through the South Dakota Housing Development Authority and the United States Department of Agriculture - Rural Development could be utilized to provide financing for a non-profit sponsored elderly housing developments. 10.5 CREATE PEDESTRIAN FRIENDLY RESIDENTIAL ENVIRONMENT WITH CONVENIENT ACCESS TO NEIGHBORHOOD SERVICES New or existing residential neighborhoods need to be resident friendly as possible with convenient access to sidewalks, bike paths, and transit services. These sidewalks or bike paths should be interconnected when feasible to encourage walking and bicycling between neighborhoods. Creating a pedestrian friendly environment will increase the quality of life for the community as a whole and promote a healthier lifestyle. 10.6 DEVELOP/ENFORCE NUISANCE ABATEMENT ORDINANCES FOR VACANT AND HAZARDOUS PROPERTIES The development/enforcement of nuisance abatement ordinances is tied to rehabilitation and in-fill development. While the priority should be placed on rehabilitation, the City may encounter some properties for which rehabilitation is financially unfeasible. For these instances, it would be to the advantage of the City to have nuisance abatement ordinances in place. Nuisance abatement ordinances can provide the City with the ability to remove structures deemed to be hazardous, in order to both eliminate the health risk to the community, along with increasing property values.

43
10.7 PROVIDE FOR ADEQUATE SUPPLY OF RESIDENTIAL LAND, AND TIMELY INFRASTRUCTURE IMPROVEMENTS New residential development is encouraged to be placed in areas where infrastructure costs associated with new development are optimized. This can be accomplished through creating residential subdivisions with a higher density that mix available housing types such as single family, town homes, and apartment complexes. The increased density will decrease infrastructure costs associated new development. A strategy for timely infrastructure improvements or additions will see to it that there is an adequate supply of residential land for future development. The infrastructure additions could occur simultaneously with updating existing infrastructure to cut down on overall costs. Long-term infrastructure planning and meetings with prospective developers/home buyers will be necessary in order to determine the best use of infrastructure resources for newly created residential additions.
44
CHAPTER 11: PARKS & RECREATION Parks & Recreation Goal: To ensure the City of Kadoka has an adequate amount of park land, trails, and recreational opportunities. Parks & Recreation Objectives Continued Support of Family Friendly Recreational Opportunities Select Potential Sites for Additional Parks, Green space, or Trails Improve or Update Existing Recreational Facilities in Kadoka Sustain and Manage Public Tree Infrastructure
11.1 CONTINUED SUPPORT OF FAMILY FRIENDLY RECREATION OPPORTUNITIES The City of Kadoka and surrounding area has several family friendly recreational opportunities available such as baseball, softball, rodeo, swimming, golf, hunting, or fishing. The community must continue to support and promote these recreational activities. Parks and Recreation Opportunities Kadoka City Park: The City’s park has playground equipment, an open grass lawn, a picnic area, horseshoe pit, volleyball and basketball courts. The park is located near the center of town on between 1st and 3rd Ave, and Chestnut and Poplar Streets. Kadoka Swimming Pool: The pool is open during the summer months and is located in the City Park. Rodeo Grounds: The City’s rodeo grounds are located on east end of town, just north of the baseball field and football stadium. Sports Complex: The City of Kadoka has a sports complex that contains a baseball field and a football stadium on the east end of town, just south of the rodeo grounds. The complex gets used by the City’s High School, and summer baseball leagues. Kadoka Campgrounds: The campgrounds are located just at the northern end of the city. Located just off of highway 16 and offers both tenting, and RV camp sites. Kadoka Golf Course: is one of the nation’s last sand green golf courses. The Golf Course is located near the Kadoka Airport on Airport Road at the southeast corner of Kadoka.
45
11.2 SELECT POTENTIAL SITES FOR ADDITIONAL PARKS, GREEN SPACE, OR TRAILS It is a general rule of thumb for most cities to have a public park within a quarter mile of any residential neighborhood. A quarter mile is a guide for a walking distance easily achievable by most pedestrians. Parks not only provide recreation but also uplift property values and give an overall higher standard of living for citizens. The community of Kadoka has one very large neighborhood park. Currently, the neighborhood park serves the entire community quite well, but potential future expansion may lead to development of additional parks, green spaces, or other recreational opportunities. Additional Parks, Green Space, or Trails Projects Trail Head between Kadoka and Cedar Pass The Black Hills Badlands and Lakes Association have discussed establishing a trail head from Cedar Pass to Kadoka. This new pedestrian/biking trail head will help promote Kadoka’s link to the Badlands and make Kadoka a tourism destination for those that bike or hike on South Dakota’s existing trails system. 11.3 IMPROVE OR UPDATE EXISTING RECREATIONAL FACILITIES IN KADOKA The community must continue to update and maintain their existing recreational facilities. This will help ensure the longevity of Kadoka’s existing facilities for future generations. The CSDED conducted a local needs assessment in the fall of 2010 in an attempt to identify needs and possible solutions for meeting said need. The assessment identified the following as possible improvements to Kadoka’s recreational facilities. Kadoka Swimming Pool: Increase size and depth Rodeo Grounds: Upgrades include better bathrooms, gravel on road, upgraded panels
and upgraded pens Kadoka Golf Course: Upgrades to Public Restroom and other facilities 11.4 SUSTAIN AND MANAGE PUBLIC TREE INFRASTRUCTURE The city must work hard to maintain their existing tree infrastructure. Trees not only add to a community’s aesthetic value, but they increase property values, improve air quality, mitigate against the effects of floods/storm water, and create synergy between open space. This tree management strategy process involves planting new trees, maintaining existing trees, and removing dead or dying trees.

46
Chapter 12: Extraterritorial Jurisdiction 12.1 EXTRATERRITORIAL JURISDICTION At this time the Planning & Zoning Commission has decided that currently extraterritorial jurisdiction is a function that the City of Kadoka need not utilize. Future growth however may lead to the necessity of employing extraterritorial jurisdiction; for the purposes of promoting the health, safety, morals and general welfare of the community. It is the Planning & Zoning Commission’s recommendation that the City of Kadoka coordinate with Jackson County if/as a need for extraterritorial jurisdiction presents itself.

47
CHAPTER 13: PLANNING POLICY FRAMEWORK The City of Kadoka has adopted this comprehensive plan to provide a planning policy framework for future land-use and growth management. It was created to be both flexible and open to accommodate the needs of the population. Future planning for the City of Kadoka should involve the public, other city agencies, and elected officials to ensure all viewpoints are taken into consideration. 13.1 GROWTH MANAGEMENT STRATEGY The following goals illustrate the growth management strategy for the city of Kadoka. The goals provide a compass for future planning decisions that will have a lasting impact on the City of Kadoka and the adjoining planning area. Goal 1: To properly utilize population and economic demographics when making future land use and zoning decisions. Goal 2: To sustain an environmental strategy that supports an interworking relationship between the physical and built environment and also protect the air and water quality to ensure public health and safety for the residents of Kadoka. Goal 3: To support a cost effective infrastructure & drainage management strategy that meets Kadoka’s long term water, waste water, storm drainage, solid waste management, and other infrastructure needs. Goal 4: The City of Kadoka will promote a land use policy that addresses the community’s current and future economic development and housing needs. Goal 5: To support a transportation strategy that ensures the City of Kadoka’s critical road improvements occur, community safety concerns are addressed, and long-term transportation needs are met. Goal 6: Kadoka will strive to provide an entrepreneur-friendly community that nurtures existing businesses and attracts new business by promoting Kadoka’s quality of life attributes Goal 7: Protect and preserve Kadoka’s historic structures, resources, and character Goal 8: To promote a long-term housing strategy that ensures a healthy and viable housing stock for all of Kadoka’s residents, along with protecting property values and promoting the health and safety throughout the community. Goal 9: Ensure the City of Kadoka has an adequate amount of park land, trails, and recreational opportunities

48
CHAPTER 14: PLAN IMPLEMENTATION/MAINTAINCE A comprehensive plan is best utilized when it is implemented with all administrative tools available in order to shape development in a clear and concise manner. The tools that can be utilized include zoning regulations, ordinances, policy plans, community studies/assessments, and public involvement. The comprehensive plan is a living document that should be reviewed annually and updated once every ten years to ensure proper maintenance of the plan. Local Governing and Advisory Committees: The key players in the implementation of a comprehensive plan are the advisory committees and the City Council. It is the responsibility of the governing body to utilize all planning tools at their disposal, so that smart growth and development can take place. With the input of the public and the City Council a balance of development can take place between industry, commerce, and housing. Local Regulatory Tools: The most widely used administrative tools are the zoning and building regulations. It is necessary to modify either of these documents when they are in conflict with the comprehensive plan. It is also important that there is an interworking relationship between Kadoka and Jackson County to ensure growth and development occurs as the comprehensive plan recommends. Annexation: If growth of Kadoka occurs, it is important that the city takes recommendations laid out in the comprehensive plan when annexing property. The boundaries for making available municipal services should concur with city limits. Areas designated by the land use plan as future growth areas of the city should be annexed prior to development. This policy will assure an adequate amount of developable land is available to accommodate the future growth needs of the city. Environmental, infrastructure requirements, economic, property owner concerns, and social impacts must be taken into consideration prior to any annexation actions. Studies: The City of Kadoka must assess the need to conduct special studies prior to the initiation of major capital improvements. These studies will give the City of Kadoka additional guidance on how to best implement future infrastructure, housing, transportation, and other related projects.

49
Appendix A: Financial Resources Access to financial capital is critical for starting new businesses. There are numerous programs at the state and regional level that can be used for this purpose. Some of these programs are being listed below. For more information on these programs, please see the South Dakota Resource Directory located at www.sdcommunitynetwork.com or the Governor’s Office of Economic Development’s website at http://www.sdreadytowork.com/ . Statewide financial resources for Business Development
CAP Lines (SBA) – for meeting working capital needs
EDFA Pooled Bond Program (GOED) – Bond financing pools
REDI Fund (GOED) – Low interest loans to startups or relocating firms
Micro Loans (SBA) – for women, low income, and minority entrepreneurs
Section 504 Loan Guarantee (SBA) – SBA loan guarantees provided through and SBA partner
Rule 7(a) Business Loan Guarantee (SBA) – Guarantee for business loans through a local lender
SBIR Grants – For Federal Small business innovative research opportunities
SD MicroLOAN Program (GOED) low interest gap financing for small businesses
Agriculture Processing and Export Loan Program APEX (GOED) – Loans to add value to raw agricultural products
Value-Added Ag Subfund (GOED)
Tourism Enhancement Program (GOED)
Rural Business Opportunity Grant (USDA-RD)
Rural Business Enterprise Grant (USDA-RD)
Resources: USDA – Rural Development State Office Attn: Rural Business Cooperative Service 200 4th Street SW Federal Building Room 210 Huron, SD 57530-2477 (605) 352-1142

50
Governor's Office of Economic Development Department of Tourism and State Development 711 E Wells AVE Pierre, SD, 57501-3369 Phone: 605-773-3301 Fax: 605-773-3256 Website: http://www.sdreadytowork.com/ Jackson-Kadoka Economic Development Corporation PO Box 71 Kadoka, SD 57543 (605) 488-0206 [email protected]

51
Appendix B: Bibliography/Comprehensive Plan Resources Publications: City of Lincoln/Lancaster County, Nebraska Comprehensive Plan 2030 (November 2006) City of Pierre, South Dakota Comprehensive Plan, Ulteig (December 2008) City of Tea, South Dakota, A Comprehensive Plan for Community Development 2025, South Eastern Council of Governments Contemporary Urban Planning, Sixth Edition, John M Levy, 2003 Facility Plan for Water and Wastewater System Improvements: Project #13430 & #13429, SPN Associates, January - 2011 South Dakota Codified Law: Chapter 11-6 Kadoka Needs Assessment, Prepared by CSDED, Fall of 2010 Kadoka Housing Needs Assessment, Prepared by CSDED, May, 2010 Electronic Resources & Websites: Climate, City of Kadoka: 1 http://www.city-data.com/city/Kadoka-South-Dakota.html Main Street Program official Website: http://www.mainstreet.org/content.aspx?page=3564 Minnesota Rural Partners Website: http://mnruralpartners.wordpress.com/about/ National League of Cities: http://www.nlc.org/about_cities/cities_101/179.aspx National Record of Historic Places Website: http://www.nps.gov/history/nr/ Open Space & Environmental Resource Protection Plan, Analysis of Green Infrastructure: http://www.lowermerion.org/archive/osp/osp_infra.html Kadoka’s Home Website: http://www.kadokasd.com/ Jackson-Kadoka Economic Development Corporation Website: http://www.growkadoka.com South Dakota Housing Development Authority Website: http://www.sdhda.org/

52
South Dakota State Registers or Historic Places: http://www.sdhistory.org/HP/hp_streg.htm U.S. Census Bureau: www.census.gov United States Department of Agriculture, National Resource Conservation Service - Soils Website: http://soils.usda.gov/ Cover Page: Trip Advisor, “Kadoka Depot Picture” http://media-cdn.tripadvisor.com/media/photo-s/01/58/ca/3c/kadoka-s-milwaukee-road.jpg Wikipedia, “Kadoka & Jackson County Map” http://en.wikipedia.org/wiki/File:Jackson_County_South_Dakota_Incorporated_and_Unincorporated_areas_Kadoka_Highlighted.svg