Embed Size (px)
Citation preview

Lesson0-1 Ka-fu Wong © 2007 ECON1003: Analysis of Economic Data
Lesson 0:
Understanding China

Lesson0-2 Ka-fu Wong © 2007 ECON1003: Analysis of Economic Data
Gross Regional Product of China (100 million yuan)(from http://www.stats.gov.cn/tjsj/ndsj/2005/indexee.htm)
RegionGross Regional Product (100 million yuan)
2000 2001 2002 2003 2004
Beijing 2478.76 2845.65 3212.71 3663.10 4283.31 Tianjin 1639.36 1840.10 2051.16 2447.66 2931.88 Hebei 5088.96 5577.78 6122.53 7098.56 8768.79 Shanxi 1643.81 1779.97 2017.54 2456.59 3042.41 Inner Mongolia 1401.01 1545.79 1756.29 2150.41 2712.08 Liaoning 4669.06 5033.08 5265.66 6002.54 6872.65 Jilin 1821.19 2032.48 2246.12 2522.62 2958.21 Heilongjiang 3253.00 3561.00 3882.16 4430.00 5303.00 Shanghai 4551.15 4950.84 5408.76 6250.81 7450.27 Jiangsu 8582.73 9511.91 10631.75 12460.83 15403.16 Zhejiang 6036.34 6748.15 7796.00 9395.00 11243.00 Anhui 3038.24 3290.13 3553.56 3972.38 4812.68 Fujian 3920.07 4253.68 4682.01 5232.17 6053.14 Jiangxi 2003.07 2175.68 2450.48 2830.46 3495.94 Shandong 8542.44 9438.31 10552.06 12435.93 15490.73 Henan 5137.66 5640.11 6168.73 7048.59 8815.09 Hubei 4276.32 4662.28 4830.98 5401.71 6309.92 Hunan 3691.88 3983.00 4140.94 4638.73 5612.26 Guangdong 9662.23 10647.71 11735.64 13625.87 16039.46 Guangxi 2050.14 2231.19 2455.36 2735.13 3320.10 Hainan 518.48 545.96 597.50 670.93 769.36 Chongqing 1589.34 1749.77 1971.30 2250.56 2665.39 Sichuan 4010.25 4421.76 4875.12 5456.32 6556.01 Guizhou 993.53 1084.90 1185.04 1356.11 1591.90 Yunnan 1955.09 2074.71 2232.32 2465.29 2959.48 Tibet 117.46 138.73 161.42 184.50 211.54 Shaanxi 1660.92 1844.27 2101.60 2398.58 2883.51 Gansu 983.36 1072.51 1161.43 1304.60 1558.93 Qinghai 263.59 300.95 341.11 390.21 465.73 Ningxia 265.57 298.38 329.28 385.34 460.35 Xinjiang 1364.36 1485.48 1598.28 1877.61 2200.15
Lesson0-3 Ka-fu Wong © 2007 ECON1003: Analysis of Economic Data
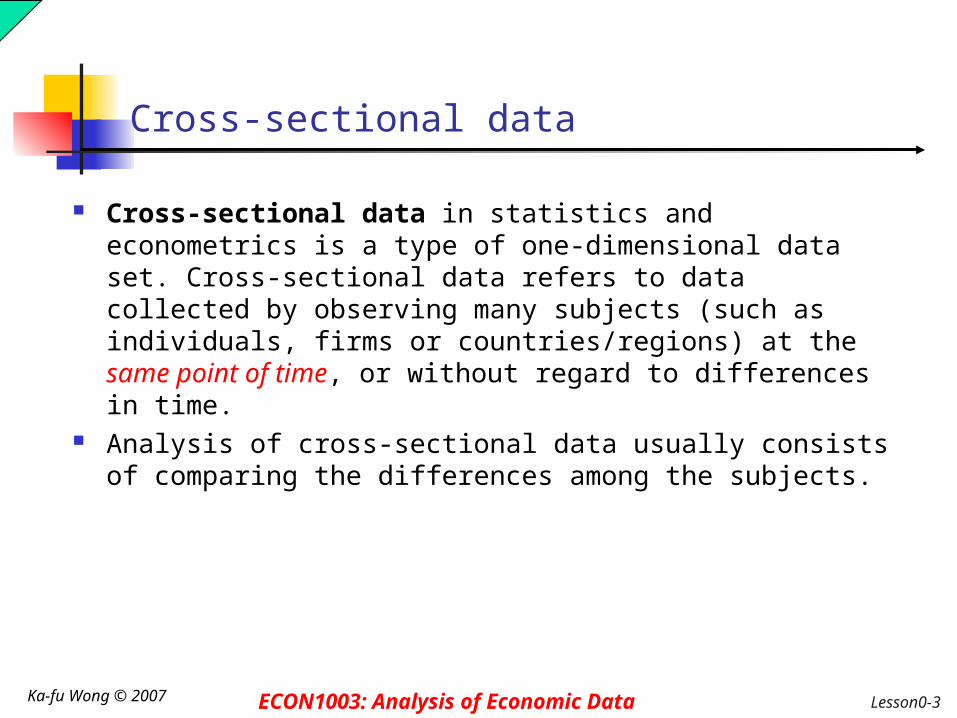
Cross-sectional data
Cross-sectional data in statistics and econometrics is a type of one-dimensional data set. Cross-sectional data refers to data collected by observing many subjects (such as individuals, firms or countries/regions) at the same point of time, or without regard to differences in time.
Analysis of cross-sectional data usually consists of comparing the differences among the subjects.

Lesson0-4 Ka-fu Wong © 2007 ECON1003: Analysis of Economic Data
Cross-sectional dataRegion
Gross Regional Product (100 million yuan)
2000 2001 2002 2003 2004
Beijing 2478.76 2845.65 3212.71 3663.10 4283.31 Tianjin 1639.36 1840.10 2051.16 2447.66 2931.88 Hebei 5088.96 5577.78 6122.53 7098.56 8768.79 Shanxi 1643.81 1779.97 2017.54 2456.59 3042.41 Inner Mongolia 1401.01 1545.79 1756.29 2150.41 2712.08 Liaoning 4669.06 5033.08 5265.66 6002.54 6872.65 Jilin 1821.19 2032.48 2246.12 2522.62 2958.21 Heilongjiang 3253.00 3561.00 3882.16 4430.00 5303.00 Shanghai 4551.15 4950.84 5408.76 6250.81 7450.27 Jiangsu 8582.73 9511.91 10631.75 12460.83 15403.16 Zhejiang 6036.34 6748.15 7796.00 9395.00 11243.00 Anhui 3038.24 3290.13 3553.56 3972.38 4812.68 Fujian 3920.07 4253.68 4682.01 5232.17 6053.14 Jiangxi 2003.07 2175.68 2450.48 2830.46 3495.94 Shandong 8542.44 9438.31 10552.06 12435.93 15490.73 Henan 5137.66 5640.11 6168.73 7048.59 8815.09 Hubei 4276.32 4662.28 4830.98 5401.71 6309.92 Hunan 3691.88 3983.00 4140.94 4638.73 5612.26 Guangdong 9662.23 10647.71 11735.64 13625.87 16039.46 Guangxi 2050.14 2231.19 2455.36 2735.13 3320.10 Hainan 518.48 545.96 597.50 670.93 769.36 Chongqing 1589.34 1749.77 1971.30 2250.56 2665.39 Sichuan 4010.25 4421.76 4875.12 5456.32 6556.01 Guizhou 993.53 1084.90 1185.04 1356.11 1591.90 Yunnan 1955.09 2074.71 2232.32 2465.29 2959.48 Tibet 117.46 138.73 161.42 184.50 211.54 Shaanxi 1660.92 1844.27 2101.60 2398.58 2883.51 Gansu 983.36 1072.51 1161.43 1304.60 1558.93 Qinghai 263.59 300.95 341.11 390.21 465.73 Ningxia 265.57 298.38 329.28 385.34 460.35 Xinjiang 1364.36 1485.48 1598.28 1877.61 2200.15

Lesson0-5 Ka-fu Wong © 2007 ECON1003: Analysis of Economic Data
Regional Nominal GDP in Year 2004 Region GDP (100 million yuan) GDP per capita (yuan) Beijing 4283.31 37058 Tianjin 2931.88 31550 Hebei 8768.79 12918 Shanxi 3042.41 9150 Inner Mongolia 2712.08 11305 Liaoning 6872.65 16297 Jilin 2958.21 10932 Heilongjiang 5303.00 13897 Shanghai 7450.27 55307 Jiangsu 15403.16 20705 Zhejiang 11243.00 23942 Anhui 4812.68 7768 Fujian 6053.14 17218 Jiangxi 3495.94 8189 Shandong 15490.73 16925 Henan 8815.09 9470 Hubei 6309.92 10500 Hunan 5612.26 9117 Guangdong 16039.46 19707 Guangxi 3320.10 7196 Hainan 769.36 9450 Chongqing 2665.39 9608 Sichuan 6556.01 8113 Guizhou 1591.90 4215 Yunnan 2959.48 6733 Tibet 211.54 7779 Shaanxi 2883.51 7757 Gansu 1558.93 5970 Qinghai 465.73 8606 Ningxia 460.35 7880 Xinjiang 2200.15 11199

Lesson0-6 Ka-fu Wong © 2007 ECON1003: Analysis of Economic Data
2004 Regional Nominal GDPSummary Statistics (100 million yuan)
Mean 5265.82Standard Error 783.88Median 3495.94Mode #N/AStandard Deviation
4364.43
Sample Variance 19048264.72Kurtosis 1.10Skewness 1.29Range 15827.92Minimum 211.54Maximum 16039.46Sum 163240.43Count 31
Tibet
Guangdong
Lesson0-7 Ka-fu Wong © 2007 ECON1003: Analysis of Economic Data
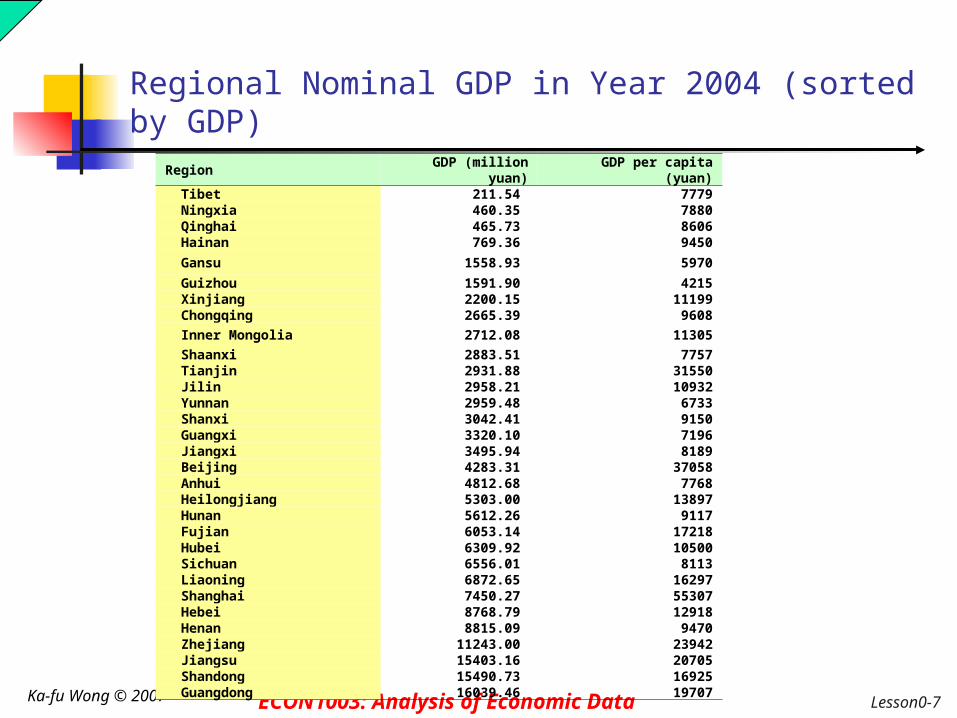
Regional Nominal GDP in Year 2004 (sorted by GDP)
RegionGDP (million
yuan)GDP per capita (yuan)
Tibet 211.54 7779 Ningxia 460.35 7880 Qinghai 465.73 8606 Hainan 769.36 9450 Gansu 1558.93 5970 Guizhou 1591.90 4215 Xinjiang 2200.15 11199 Chongqing 2665.39 9608 Inner Mongolia 2712.08 11305 Shaanxi 2883.51 7757 Tianjin 2931.88 31550 Jilin 2958.21 10932 Yunnan 2959.48 6733 Shanxi 3042.41 9150 Guangxi 3320.10 7196 Jiangxi 3495.94 8189 Beijing 4283.31 37058 Anhui 4812.68 7768 Heilongjiang 5303.00 13897 Hunan 5612.26 9117 Fujian 6053.14 17218 Hubei 6309.92 10500 Sichuan 6556.01 8113 Liaoning 6872.65 16297 Shanghai 7450.27 55307 Hebei 8768.79 12918 Henan 8815.09 9470 Zhejiang 11243.00 23942 Jiangsu 15403.16 20705 Shandong 15490.73 16925 Guangdong 16039.46 19707

Lesson0-8 Ka-fu Wong © 2007 ECON1003: Analysis of Economic Data
2004 Regional Nominal GDP per CapitaSummary Statistics (yuan per person)
Mean 14079.39Standard Error 1912.88Median 9608.00Mode #N/AStandard Deviation
10650.44
Sample Variance113431828.1
1Kurtosis 7.14Skewness 2.50Range 51092.00Minimum 4215.00Maximum 55307.00Sum 436461.00Count 31
Guizhou
Shanghai

Lesson0-9 Ka-fu Wong © 2007 ECON1003: Analysis of Economic Data
Regional Nominal GDP in Year 2004 (sorted by GDP per capita)
RegionGDP (100 million
yuan)GDP per capita (yuan)
Guizhou 1591.90 4215 Gansu 1558.93 5970 Yunnan 2959.48 6733 Guangxi 3320.10 7196 Shaanxi 2883.51 7757 Anhui 4812.68 7768 Tibet 211.54 7779 Ningxia 460.35 7880 Sichuan 6556.01 8113 Jiangxi 3495.94 8189 Qinghai 465.73 8606 Hunan 5612.26 9117 Shanxi 3042.41 9150 Hainan 769.36 9450 Henan 8815.09 9470 Chongqing 2665.39 9608 Hubei 6309.92 10500 Jilin 2958.21 10932 Xinjiang 2200.15 11199 Inner Mongolia 2712.08 11305 Hebei 8768.79 12918 Heilongjiang 5303.00 13897 Liaoning 6872.65 16297 Shandong 15490.73 16925 Fujian 6053.14 17218 Guangdong 16039.46 19707 Jiangsu 15403.16 20705 Zhejiang 11243.00 23942 Tianjin 2931.88 31550 Beijing 4283.31 37058 Shanghai 7450.27 55307

Lesson0-10 Ka-fu Wong © 2007 ECON1003: Analysis of Economic Data
Time Series
RegionGross Regional Product (100 million yuan)
2000 2001 2002 2003 2004
Beijing 2478.76 2845.65 3212.71 3663.10 4283.31
Tianjin 1639.36 1840.10 2051.16 2447.66 2931.88
Hebei 5088.96 5577.78 6122.53 7098.56 8768.79
Shanxi 1643.81 1779.97 2017.54 2456.59 3042.41
Inner Mongolia 1401.01 1545.79 1756.29 2150.41 2712.08
A time series is a sequence of data points, measured typically at successive times, spaced at (often uniform) time intervals.

Lesson0-11 Ka-fu Wong © 2007 ECON1003: Analysis of Economic Data
Nominal Gross Domestic Product (100 million yuan)
0
20000
40000
60000
80000
100000
120000
140000
160000
1978
1979
1980
1981
1982
1983
1984
1985
1986
1987
1988
1989
1990
1991
1992
1993
1994
1995
1996
1997
1998
1999
2000
2001
2002
2003
2004
2005
Year

Lesson0-12 Ka-fu Wong © 2007 ECON1003: Analysis of Economic Data
Per Capita Nominal GDP (yuan per person)
0
2000
4000
6000
8000
10000
12000
1978
1979
1980
1981
1982
1983
1984
1985
1986
1987
1988
1989
1990
1991
1992
1993
1994
1995
1996
1997
1998
1999
2000
2001
2002
2003
2004
2005
Year

Lesson0-13 Ka-fu Wong © 2007 ECON1003: Analysis of Economic Data
Nominal GDP and Per Capita nominal GDP
0
20000
40000
60000
80000
100000
120000
140000
160000
1978
1979
1980
1981
1982
1983
1984
1985
1986
1987
1988
1989
1990
1991
1992
1993
1994
1995
1996
1997
1998
1999
2000
2001
2002
2003
2004
2005
Year

Lesson0-14 Ka-fu Wong © 2007 ECON1003: Analysis of Economic Data
Nominal GDP and Per Capita nominal GDP
0
500
1000
1500
2000
2500
3000
3500
4000
1978
1979
1980
1981
1982
1983
1984
1985
1986
1987
1988
1989
1990
1991
1992
1993
1994
1995
1996
1997
1998
1999
2000
2001
2002
2003
2004
2005
Year
nominal GDP index (year 1978=100)
Per capita nominal GDP index (year 1978=100)
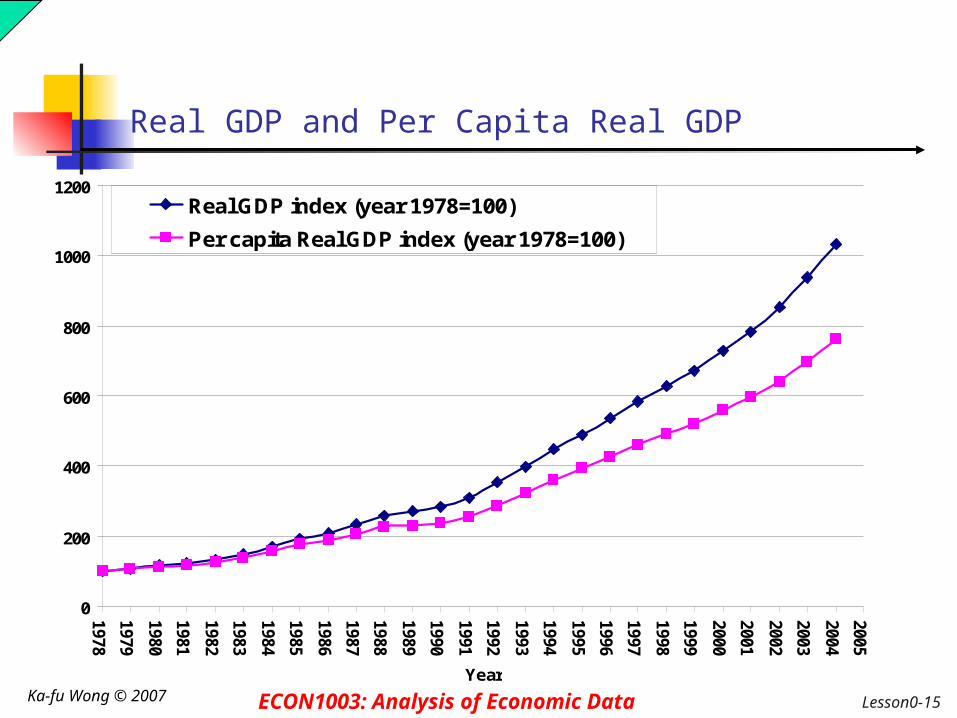
Lesson0-15 Ka-fu Wong © 2007 ECON1003: Analysis of Economic Data
Real GDP and Per Capita Real GDP
0
200
400
600
800
1000
1200
1978
1979
1980
1981
1982
1983
1984
1985
1986
1987
1988
1989
1990
1991
1992
1993
1994
1995
1996
1997
1998
1999
2000
2001
2002
2003
2004
2005
Year
Real GDP index (year 1978=100)
Per capita Real GDP index (year 1978=100)

Lesson0-16 Ka-fu Wong © 2007 ECON1003: Analysis of Economic Data
Panel data
RegionGross Regional Product (100 million yuan)
2000 2001 2002 2003 2004
Beijing 2478.76 2845.65 3212.71 3663.10 4283.31
Tianjin 1639.36 1840.10 2051.16 2447.66 2931.88
Hebei 5088.96 5577.78 6122.53 7098.56 8768.79
Shanxi 1643.81 1779.97 2017.54 2456.59 3042.41
Inner Mongolia 1401.01 1545.79 1756.29 2150.41 2712.08
A data set containing observations on multiple phenomena observed over multiple time periods is called panel data.

Lesson0-17 Ka-fu Wong © 2007 ECON1003: Analysis of Economic Data
ExampleFinancial Intermediation in China
All bank financial intermediation rate and GDP per capita in Chinese provinces 1997.Note: Excludes Beijing, Tianjin, Shanghai, and Tibet.
Source: Park, Albert, and Kaja Sehrt (2001): “Tests of Financial Intermediation and Banking Reform in China ,” Journal of Comparative Economics 29: 608–644.
Provincial data of 1997 reveals a striking inverse relationship between financial intermediation and GDP per capita. This pattern suggests that the allocation of financial resources across provinces may be highly inefficient, with richer provinces being taxed relative to poorer provinces.
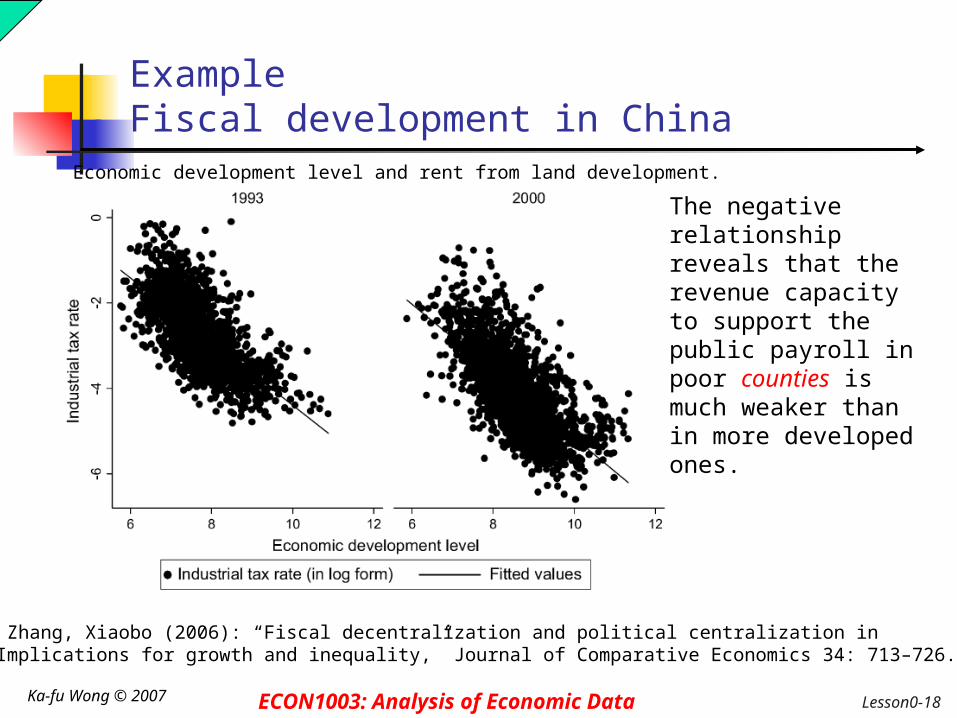
Lesson0-18 Ka-fu Wong © 2007 ECON1003: Analysis of Economic Data
ExampleFiscal development in China
The negative relationship reveals that the revenue capacity to support the public payroll in poor counties is much weaker than in more developed ones.
Economic development level and rent from land development.
Source: Zhang, Xiaobo (2006): “Fiscal decentralization and political centralization inChina: Implications for growth and inequality,” Journal of Comparative Economics 34: 713–726.

Lesson0-19 Ka-fu Wong © 2007 ECON1003: Analysis of Economic Data
ExampleDevelopment of Motorcycle industry in China
Production grew rapidly in the early 1990s and, by 1995, it exceeded the production peak in 1981 in Japan, which had been the largest producer in the world. The export of motorcycles, mainly to Asia and Africa, began when the growth of domestic consumption stagnated in the late 1990s. Exports have increased rapidly since 2000 reaching three million in 2003, which accounts for 20.6% of the total number of motorcycles produced. (However, these data do not cover small producers operating without government permission.)
Source: Sonobe, Tetsushi, Dinghuan Hu, and Keijiro Otsuka (2006): “Industrial development in the inland region of China: A case study of the motorcycle industry,” Journal of Comparative Economics 34: 818–838.
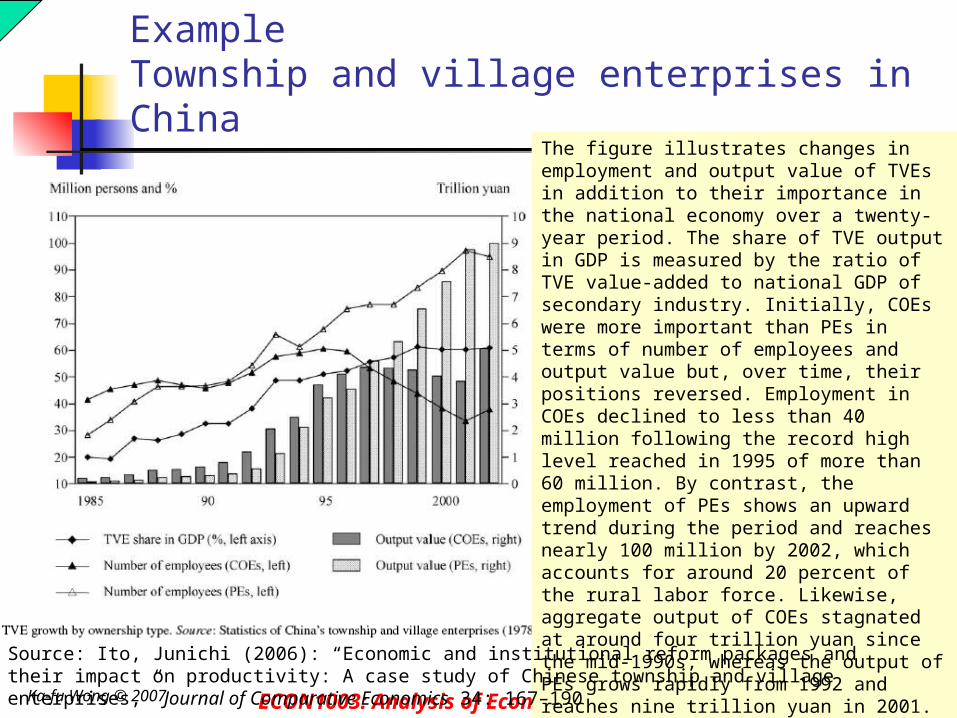
Lesson0-20 Ka-fu Wong © 2007 ECON1003: Analysis of Economic Data
ExampleTownship and village enterprises in China
The figure illustrates changes in employment and output value of TVEs in addition to their importance in the national economy over a twenty-year period. The share of TVE output in GDP is measured by the ratio of TVE value-added to national GDP of secondary industry. Initially, COEs were more important than PEs in terms of number of employees and output value but, over time, their positions reversed. Employment in COEs declined to less than 40 million following the record high level reached in 1995 of more than 60 million. By contrast, the employment of PEs shows an upward trend during the period and reaches nearly 100 million by 2002, which accounts for around 20 percent of the rural labor force. Likewise, aggregate output of COEs stagnated at around four trillion yuan since the mid-1990s, whereas the output of PEs grows rapidly from 1992 and reaches nine trillion yuan in 2001. This growth of TVEs is attributable to both enterprise privatization and the establishment of private enterprises.
Source: Ito, Junichi (2006): “Economic and institutional reform packages and their impact on productivity: A case study of Chinese township and village enterprises,” Journal of Comparative Economics 34: 167–190

Lesson0-21 Ka-fu Wong © 2007 ECON1003: Analysis of Economic Data
ExampleReturn to Schooling in China
The plotted log-income differences may be interpreted crudely as returns to schooling. Assuming a schooling gap between elementary-school and college graduates of 10 to 12 years, the implied marginal rate of return per year of schooling for college graduates was approximately 5.5% shortly after the beginning of the Communist era and it decreased to about half that in the very early years of reform. After reform, the earnings premium for college education accelerated sharply beginning around 1990.
Source: Fleisher, Belton M., and Xiaojun Wang (2005): “Returns to schooling in China under planning and reform,” Journal of Comparative Economics 33: 265–277.

Lesson0-22 Ka-fu Wong © 2007 ECON1003: Analysis of Economic Data
ExampleRegional disparities in China
On average, the coastal regions registered relatively higher growth than the inland provinces following the reforms and into the 1990s.Although the inland regions experienced growth similar to that of the coastal regions during the 1980s, these regions fell considerably behind their coastal counterparts during the 1990s when real GDP per capita increased by only 95 percent in the inland regions but by 144 percent in the coastal regions. In fact, GDP per capita in purchasing power terms in the coastal regions began to catch up with that of the Southeast Asian emerging economies, e.g., Malaysia, Philippines, Indonesia and Thailand, in the early 1990s and even surpassed that of these countries in 1996 Fu, Xiaolan (2004): “Limited linkages from growth engines and regional disparities in China,” Journal of Comparative Economics 32: 148–164.

Lesson0-23 Ka-fu Wong © 2007 ECON1003: Analysis of Economic Data
Part 1 of Problem set #1
Download xmarriage.xls from our class website and perform the following tasks: Compute the ratio, the registered cross-border
marriages per marriage registrations approved in each region, for the year 2000.
Summarized and briefly describe this ratio of year 2000 across regions. For example, which province has the highest cross-border marriages? Why?
Plot the ratio against GDP per capita of year 2000. Do you see any relationship between the two variables?

Lesson0-24 Ka-fu Wong © 2007 ECON1003: Analysis of Economic Data
- END -
Lesson 0: Lesson 0: Understanding China