Embed Size (px)
Citation preview
Ka-BOOM! The Power of Appliance Standards
Opportunities for New Federal Appliance and Equipment Standards
Updated from and Supercedes Report A062
Max Neubauer, Andrew deLaski, Marianne DiMascio & Steven Nadel
July 2009
Report Number ASAP-7/ACEEE-A091
© American Council for an Energy-Efficient Economy 529 14th Street, NW, Suite 600, Washington, DC 20045 (202) 527-4003 phone, (202) 429-2248 fax, aceee.org
and
© Appliance Standards Awareness Project
20 Belgrade Avenue, Suite 7, Boston, MA 02131 (617) 363-9470 phone, (617) 363-9973 fax, standardsASAP.org


Ka-BOOM! The Power of Appliance Standards
Contents About the Appliance Standard Awareness Project................................................................................. ii ASAP's Steering Committee................................................................................................................... ii Acknowledgments .................................................................................................................................. ii Executive Summary................................................................................................................................iii 1. Introduction .........................................................................................................................................1 2. Savings on Tap: Record Activity Planned for 2009–2013..................................................................3 3. Savings Achieved: Standards’ Track Record in the U.S. ...................................................................4
3.1 History of Standards in the United States ....................................................................................4 3.2 Policy Rationale for Standards.....................................................................................................6 3.3 Savings from Existing Federal Standards....................................................................................9 3.4. Impacts on Manufacturers.........................................................................................................13
4. Savings Ahead: Potential Benefits from New and Updated National Standards .............................16 4.1 Potential Savings........................................................................................................................17 4.2 Consumer Economics ................................................................................................................23
5. Product Discussions .........................................................................................................................25 6. Conclusion ........................................................................................................................................44 References ...........................................................................................................................................47 Appendix A. Methodology, Assumptions, and Sources........................................................................53
Detailed Methodology.......................................................................................................................58 Appendix B. Market Barriers.................................................................................................................63
i

Ka-BOOM! The Power of Appliance Standards
About the Appliance Standard Awareness Project
The Appliance Standards Awareness Project (ASAP) is dedicated to increasing awareness of and support for appliance and equipment efficiency standards. Founded in 1999 by the American Council for an Energy-Efficient Economy (ACEEE), the Alliance to Save Energy, the Energy Foundation, and the Natural Resources Defense Council, ASAP is led by a steering committee that includes representatives from the environmental community, consumer groups, utilities and state government. ASAP provides advice and technical support to parties interested in advancing state standards.
ASAP's Steering Committee
Charlie Harak National Consumer Law Center
Tim Ballo Earthjustice
Jeffrey Harris Alliance to Save Energy
Dennis Beck California Energy Commission
Duane Larson Pacific Gas & Electric Susan E. Coakley
Northeast Energy Efficiency Partnerships Steven Nadel American Council for an Energy-Efficient Economy
Tom Eckman Northwest Power and Conservation Council David B. Goldstein Natural Resources Defense Council John Wilson
Energy Foundation Mel Hall-Crawford Consumer Federation of America
Acknowledgments
The authors would like to thank ACEEE staff members Jennifer Amann, Amanda Korane, Daniel Trombley, and Harvey Sachs for their assistance with the analysis. We thank Sue AnderBois (The Energy Foundation), Richard Fassler (Power Integrations), David Goldstein (National Resources Defense Council), Noah Horowitz (National Resources Defense Council), Molly McAnn-Trombley (Energy Solutions), Jon McHugh (McHugh Energy), William McNary (U.S. Department of Energy), Jim O'Reilly (Northeast Energy Efficiency Partnerships), Ed Osann (Potomac Resources), and Amanda Stevens (Energy Solutions) for their review and helpful comments on a draft of this report. In addition, we would like to thank Chris Calwell (Ecos Consulting), Patrick Eilert (Pacific Gas & Electric Company), Christopher Kent (U.S. Environmental Protection Agency), Pat McAuliffe (California Energy Commission), James McMahon (Lawrence Berkeley National Laboratory), Catherine Mercier (Ecos Consulting), Ted Pope (Energy Solutions), Leo Rainer (Davis Energy), and Kathleen Vokes (U.S. Environmental Protection Agency) for their valuable input and assistance with data collection. A special thanks to the Pacific Gas & Electric Company, the California Energy Commission (CEC), and the Consortium for Energy Efficiency (CEE) as many of the potential standards levels analyzed are based on standards that have been passed or are being considered by the CEC, or efficiency levels promoted by CEE. This study was made possible by grants from the Energy Foundation.
ii
Ka-BOOM! The Power of Appliance Standards
Executive Summary
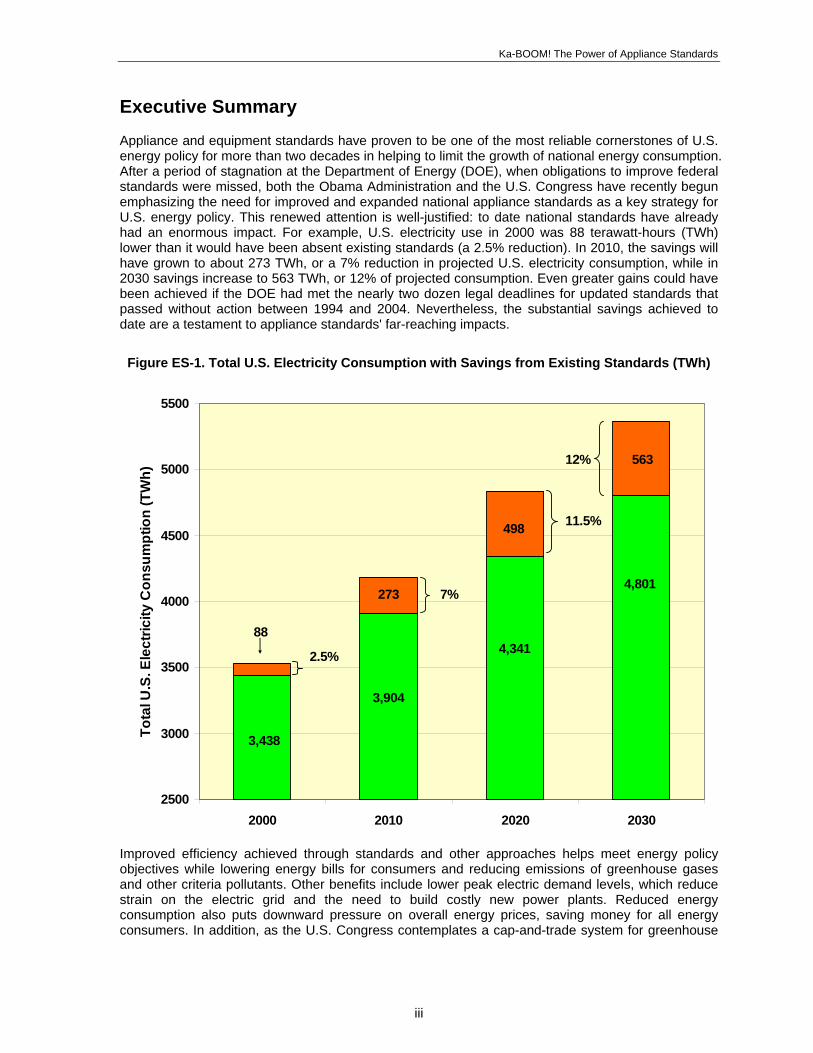
Appliance and equipment standards have proven to be one of the most reliable cornerstones of U.S. energy policy for more than two decades in helping to limit the growth of national energy consumption. After a period of stagnation at the Department of Energy (DOE), when obligations to improve federal standards were missed, both the Obama Administration and the U.S. Congress have recently begun emphasizing the need for improved and expanded national appliance standards as a key strategy for U.S. energy policy. This renewed attention is well-justified: to date national standards have already had an enormous impact. For example, U.S. electricity use in 2000 was 88 terawatt-hours (TWh) lower than it would have been absent existing standards (a 2.5% reduction). In 2010, the savings will have grown to about 273 TWh, or a 7% reduction in projected U.S. electricity consumption, while in 2030 savings increase to 563 TWh, or 12% of projected consumption. Even greater gains could have been achieved if the DOE had met the nearly two dozen legal deadlines for updated standards that passed without action between 1994 and 2004. Nevertheless, the substantial savings achieved to date are a testament to appliance standards' far-reaching impacts.
Figure ES-1. Total U.S. Electricity Consumption with Savings from Existing Standards (TWh)
2500
3000
3500
4000
4500
5000
5500
2000 2010 2020 2030
Tota
l U.S
. Ele
ctric
ity C
onsu
mpt
ion
(TW
h)
88
273
498
3,438
3,904
4,341 2.5%
7%
11.5%
4,801
12% 563
Improved efficiency achieved through standards and other approaches helps meet energy policy objectives while lowering energy bills for consumers and reducing emissions of greenhouse gases and other criteria pollutants. Other benefits include lower peak electric demand levels, which reduce strain on the electric grid and the need to build costly new power plants. Reduced energy consumption also puts downward pressure on overall energy prices, saving money for all energy consumers. In addition, as the U.S. Congress contemplates a cap-and-trade system for greenhouse
iii
Ka-BOOM! The Power of Appliance Standards
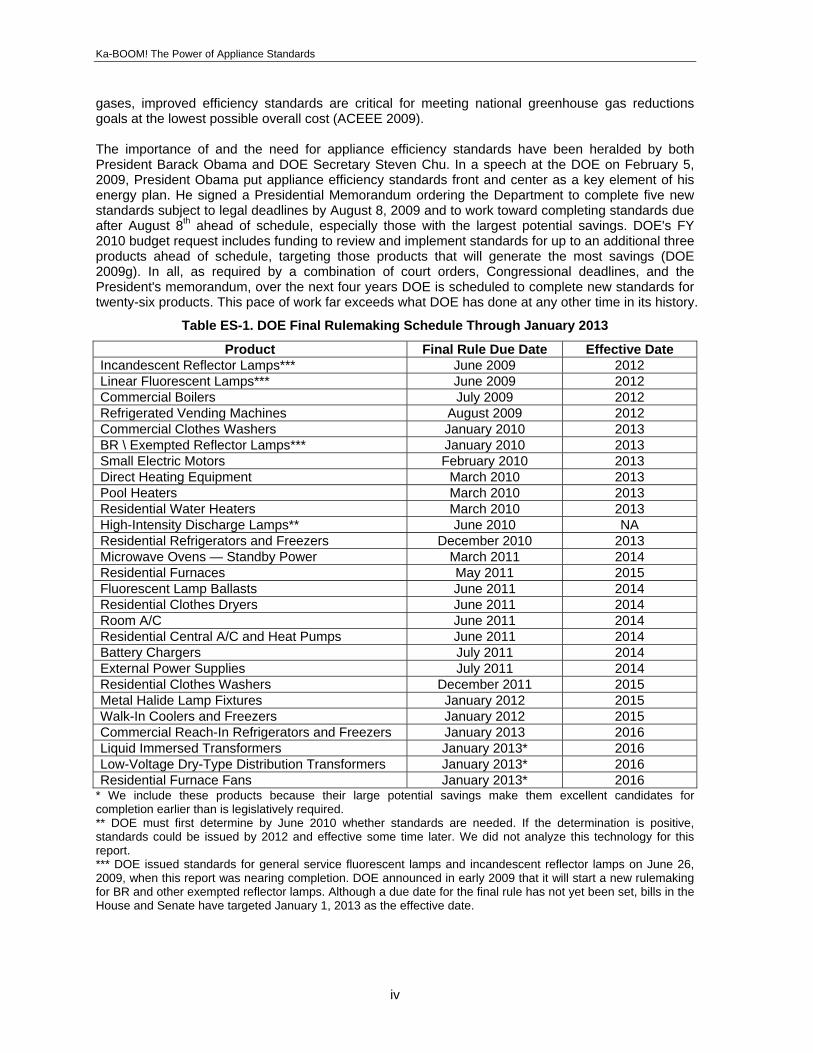
gases, improved efficiency standards are critical for meeting national greenhouse gas reductions goals at the lowest possible overall cost (ACEEE 2009). The importance of and the need for appliance efficiency standards have been heralded by both President Barack Obama and DOE Secretary Steven Chu. In a speech at the DOE on February 5, 2009, President Obama put appliance efficiency standards front and center as a key element of his energy plan. He signed a Presidential Memorandum ordering the Department to complete five new standards subject to legal deadlines by August 8, 2009 and to work toward completing standards due after August 8th ahead of schedule, especially those with the largest potential savings. DOE's FY 2010 budget request includes funding to review and implement standards for up to an additional three products ahead of schedule, targeting those products that will generate the most savings (DOE 2009g). In all, as required by a combination of court orders, Congressional deadlines, and the President's memorandum, over the next four years DOE is scheduled to complete new standards for twenty-six products. This pace of work far exceeds what DOE has done at any other time in its history.
Table ES-1. DOE Final Rulemaking Schedule Through January 2013
Product Final Rule Due Date Effective Date Incandescent Reflector Lamps*** June 2009 2012 Linear Fluorescent Lamps*** June 2009 2012 Commercial Boilers July 2009 2012 Refrigerated Vending Machines August 2009 2012 Commercial Clothes Washers January 2010 2013 BR \ Exempted Reflector Lamps*** January 2010 2013 Small Electric Motors February 2010 2013 Direct Heating Equipment March 2010 2013 Pool Heaters March 2010 2013 Residential Water Heaters March 2010 2013 High-Intensity Discharge Lamps** June 2010 NA Residential Refrigerators and Freezers December 2010 2013 Microwave Ovens — Standby Power March 2011 2014 Residential Furnaces May 2011 2015 Fluorescent Lamp Ballasts June 2011 2014 Residential Clothes Dryers June 2011 2014 Room A/C June 2011 2014 Residential Central A/C and Heat Pumps June 2011 2014 Battery Chargers July 2011 2014 External Power Supplies July 2011 2014 Residential Clothes Washers December 2011 2015 Metal Halide Lamp Fixtures January 2012 2015 Walk-In Coolers and Freezers January 2012 2015 Commercial Reach-In Refrigerators and Freezers January 2013 2016 Liquid Immersed Transformers January 2013* 2016 Low-Voltage Dry-Type Distribution Transformers January 2013* 2016 Residential Furnace Fans January 2013* 2016
* We include these products because their large potential savings make them excellent candidates for completion earlier than is legislatively required. ** DOE must first determine by June 2010 whether standards are needed. If the determination is positive, standards could be issued by 2012 and effective some time later. We did not analyze this technology for this report. *** DOE issued standards for general service fluorescent lamps and incandescent reflector lamps on June 26, 2009, when this report was nearing completion. DOE announced in early 2009 that it will start a new rulemaking for BR and other exempted reflector lamps. Although a due date for the final rule has not yet been set, bills in the House and Senate have targeted January 1, 2013 as the effective date.
iv

Ka-BOOM! The Power of Appliance Standards
We estimate that this unprecedented rate of rulemaking for new and updated standards could generate colossal energy and economic savings. Our key findings regarding the estimated energy and economic savings are as follows:
New and updated federal standards could yield 24 quads of primary energy savings and over 1,900 TWh of electricity savings between now and 2030, or roughly enough power to meet the total electricity needs of every American household for 18 months.
Annual electricity savings in 2030 alone could equal about 180 TWh, or about 4% of total projected U.S. electricity consumption in that year (EIA 2009c).
Annual savings from standards for natural gas appliances could reach about 290 trillion Btus by 2030, or enough to heat one out of every ten natural-gas heated U.S. homes for one year.
Peak demand savings could reach about 65,000 MW in 2030, or about 6% of total U.S. generating capacity projected for that year (EIA 2009c).
The net present value benefits of standards amount to over $123 billion.
For individual consumers:
The average simple payback of the twenty-six evaluated standards is 3.1 years. Simple paybacks range from less than one year to around ten years for some very long-lived products.
The average benefit-cost ratio for the twenty-six evaluated standards is 4:1. That is, the product lifetime savings are, on average, four times larger than the upfront incremental costs for efficiency improvements.
Figure ES-2. Projected U.S. Electricity Consumption in 2020 and 2030 less Savings from New Standards (TWh)
3,800
4,000
4,200
4,400
4,600
4,800
5,000
2020 2030
TWh
Projected Consumption Net New Standards Consumption Savings from New Standards
100
177
4,241
4,6242.3%
3.7%
v

Ka-BOOM! The Power of Appliance Standards
Table ES-2. Savings Summary from 2009-2013 DOE Rulemakings
Energy Savings in 2020Energy Savings in 2030
Net Present
Value for Purchases
through 2030
($ Million)
Product TWh TBtua TWh TBtua Cumulative
(quads)b
Residential: Battery chargers 9.1 94.9 9.1 91.5 1.3 $5,811 Central AC & HP 5.3 55.6 17.2 172.7 1.4 $7,331 Clothes dryers 3.6 41.1 9.2 101.1 0.9 $4,133 Clothes washers 3.8 59.4 7.6 116.0 1.2 $15,627 Direct heaters 7.5 15.2 0.2 $652 NA NA External power supplies 2.1 21.6 2.1 20.8 0.3 $544 Furnaces (gas) NA 80.1 NA 186.9 1.7 $7,058 Furnaces (oil) NA 2.3 NA 5.4 0.05 $843 Furnace fans 6.5 68.1 21.0 211.6 1.7 $11,735 Microwave ovens 1.8 18.4 1.9 18.8 0.3 $1,453 Pool heaters NA 2.9 NA 2.9 0.0 $226 Refrigerators 6.6 69.0 16.8 169.1 1.5 $8,640 Room AC 1.7 17.7 3.3 32.8 0.4 $1,467 Water heaters 7.7 127.8 14.4 220.7 2.6 $14,396
Commercial: Beverage vending machines 0.3 3.1 0.5 4.8 0.1 $286 Boilers 4.8 11.1 0.1 $771 NA NA Clothes washers 0.4 8.2 0.4 10.1 0.1 $239 Fluorescent ballasts 2.1 21.5 5.1 51.1 0.5 $2,815
c Fluorescent lamps 25.3 264.2 25.3 254.9 4.3 $12,853 c Incandescent reflector lamps 7.5 78.1 7.5 75.3 1.4 $5,061
d BR \ exempted reflector lamps 3.4 35.4 3.4 34.2 0.7 $2,777 Liquid-immersed transformers 0.9 9.5 2.9 29.6 0.2 $928 Low volt. dry-type transformers 2.5 26.5 8.2 82.3 0.7 $5,643 Metal halide fixtures 4.6 47.5 12.8 129.0 1.1 $7,836 Reach-in refrigerators & freezers 0.8 8.2 2.1 21.1 0.2 $1,019 Small electric motors 3.7 38.7 4.7 47.5 0.6 $2,429 Walk-in coolers & freezers 0.6 6.1 1.3 12.8 0.1 $676 TOTAL 100 1,218 177 2,129 24 $123,249
a Notes: These savings represent primary energy savings for standards on products that consume electricity or natural gas/oil savings for standards on products that consume natural gas/oil. b The quad estimates in this report are calculated differently than estimates developed by DOE in their rulemakings. For this report, we account for savings from products sold through 2030, i.e., we account for between 15 and 18 years of sales for most products. DOE, on the other hand, typically accounts for 30 years worth of sales in its analyses. c Savings estimated for fluorescent lamps and incandescent reflector lamps are based on the standards set by DOE's final rule issued June 26, 2009. d These savings are attributable to BR and other reflector lamps that were exempted from EPAct 1992 and EISA 2007 and remain exempt in the fluorescent and incandescent reflector lamp final rule issued June 26, 2009. The energy savings from standards also result in fewer criteria pollutant emissions from power plants and direct combustion of fossil fuel by appliances. Reductions in nitrogen oxides (NOx), sulfur
vi

Ka-BOOM! The Power of Appliance Standards
dioxides (SO2) and mercury help meet air quality goals designed to protect public health and the environment. Reductions in carbon dioxide (CO2) emissions help address climate change: the savings from standards can make a significant contribution in cutting the amount of CO2 emissions in the years ahead. For example, due to existing standards, CO2 emissions will be about 4% lower in 2010 than they would have been otherwise, about 6.5% lower in 2020, and about 7.5% lower in 2030. New and updated standards can add to this total. Figure ES-3 shows that the emissions savings from already existing standards are equal to the output of 96 conventional coal-fired power plants in 2010, increasing to 154 power plants in 2020 and 186 power plants in 2030. On a national basis, we estimate that the standards proposed in this report could:
Reduce carbon dioxide emissions by 78 million metric tons (MMT) in 2020 and 158 MMT in 2030, or another 1.3% and 2.6% of projected U.S. emissions in those years. These emissions reductions are equivalent to the output of an additional 31 new conventional coal power plants in 2020 and 63 new conventional coal power plants in 2030 (see Figure ES-3).
Reduce nitrous oxides emissions by 66 and 118 thousand metric tons and reduce sulfur dioxide emissions by 269 and 475 thousand metric tons in 2020 and 2030, respectively.
Figure ES-3. Emissions Reductions from Existing and Potential Standards in Equivalent Number of Coal Plants
0
50
100
150
200
250
300
2010 2020 2030
Num
ber o
f Equ
ival
ent C
oal P
lant
s' E
mis
sion
s A
void
ed
= 50 Power Plants
96
31
154
63
186
Clearly new national appliance standards have the power to cost-effectively save the nation a considerable amount of energy while saving money for the consumers and businesses that buy and use more efficient products. New standards can also make significant contributions toward environmental objectives by reducing energy-related emissions. Ultimately, standards can contribute towards bringing U.S. energy supply and demand into better balance, thereby improving the long-term reliability of our electric grid and helping to moderate long-term energy prices. These large potential benefits make a strong case for aggressive action to ensure that standards are completed on time and are set at efficiency levels that will yield the largest possible benefits.
vii

Ka-BOOM! The Power of Appliance Standards
viii
Ka-BOOM! The Power of Appliance Standards
1. Introduction “Energy efficiency can be improved very quickly….Appliance standards, ka-BOOM, can be had right away." — DOE Secretary Chu, March 2, 2009, National Geographic
1Appliance, equipment, and lighting efficiency standards, one of the most reliable cornerstones of U.S. energy policy for more than two decades, have recently garnered renewed national attention. Both the Obama Administration and the U.S. Congress have emphasized improved and expanded national appliance standards as a key policy strategy for U.S. energy policy. Improved efficiency achieved through standards and other approaches helps meet energy policy objectives while lowering energy bills for consumers and reducing emissions of greenhouse gases and other criteria pollutants. Other benefits include lower peak demand levels that reduce strain on the electric grid and the need to build costly new power plants. Reduced energy consumption also puts downward pressure on overall energy prices, saving money for all energy consumers. In addition, as the U.S. Congress contemplates a cap-and-trade system for greenhouse gases, improved efficiency standards are critical for meeting national greenhouse gas reductions goals at the lowest possible overall cost (ACEEE 2009). Recognition of standards’ contribution is long overdue: national standards have already had an enormous impact. For example, U.S. electricity use in 2000 was 88 terawatt hours (TWh) lower than it would have been absent existing standards (a 2.5% reduction). In 2010, the savings will have grown to about 273 TWh, or a 7% reduction in projected U.S. electricity consumption (see section 3.3 below). Even greater gains could have been achieved if the Department of Energy (DOE) had met the nearly two dozen legal deadlines for updated standards that passed without action between 1994 and 2004. Nevertheless, the substantial savings achieved to date are a testament to appliance standards' far-reaching impacts. Support for improved standards extends well beyond the new administration. Congress has generally been supportive, having enacted bipartisan laws establishing standards in 1987, 1992, 2005, and 2007, while providing consistent and, when needed, increased budgetary support. President George W. Bush's administration also extolled the benefits of appliance standards and acknowledged them as an integral element of U.S. energy policy in the National Energy Policy Development Group report (2001). The National Association of Regulatory Utility Commissioners (NARUC) has supported strong standards in a series of resolutions over the past decade, most recently calling for upgraded national standards on February 18, 2009 (NARUC 2009). Other voices that have highlighted the need for improved national appliance standards have included the National Petroleum Council (2003), the National Commission on Energy Policy (2004), McKinsey and Company (2007), and the American Physical Society2 (2008). At the state level, support for improved standards is evidenced by greater state-level standards activity and regular state support for stronger standards in the DOE rulemaking processes. Thirteen states established their own state level appliance standards between 2001 and 2008, including several that enacted two or more rounds of new standards. In general, these new state standards cover products outside the scope of existing federal regulation, providing the basis and impetus for new Congressional standards (see section 3.1 below). This report is the latest in a series of federal- and state-level analyses by ACEEE and ASAP assessing the impacts of new and updated appliance standards. We cover more products than any previous report in the series simply because more DOE reviews and updates are due within the next few years than have been completed by the agency in the previous two decades. We review twenty-three products for which federal standards are due between now and January 1, 2013 (i.e., during the
1 Throughout the rest of this report, we use the shorthand “appliance” standards to refer to minimum energy efficiency requirements that apply to a variety of residential and commercial energy-using products, including household appliances, commercial equipment, and lighting products. 2 The American Physical Society is the largest organization of professional physicists in the U.S.
1

Ka-BOOM! The Power of Appliance Standards
current presidential term) as well as an additional three products that have potential savings warranting consideration for earlier-than-scheduled rulemakings. 3 , 4 As in our earlier reports, we estimate the potential energy savings, economic benefits, and emissions reductions from new standards for these products. We also provide a state-by-state breakdown of these impacts in an online appendix published on the ASAP website at standardsASAP.org. Our estimates are based on the assessment of standards levels that are achievable using available technology and, importantly, are cost-effective for consumers. As demonstrated below, by meeting the ambitious but achievable schedule for improved standards, DOE can deliver immense benefits for the entire nation:
Over 1,900 terawatt hours saved between now and 2030, or roughly enough power to meet the total electricity needs of every American household for 18 months;
Annual electricity savings in 2030 alone of about 180 terawatt hours, or about 4% of total projected U.S. electricity consumption in that year (EIA 2009c);5
Annual savings from standards for natural gas appliances could reach about 290 trillion Btus by 2030, or enough to heat one out of every ten natural-gas heated U.S. homes for one year;
Peak electric demand savings of about 65,000 MW in 2030, or about 6% of total U.S. generating capacity projected for 2030 (EIA 2009c);
Over $123 billion in net present value savings from products purchased through 2030; and 158 million metric tons of CO2 avoided in 2030, or nearly 3% of total U.S. projected emissions
in 2030. For information on the state-by-state breakdown of the impacts of the new federal
standards we analyze in this report, please visit www.standardsasap.org
.
Additional savings can be achieved with standards updates due after January 2013, but we have not included these standards in this report. Standards completed after 2013 will add considerably to total savings generated by 2030. The report is organized into the following sections:
Savings on Tap: Record Activity Planned for 2009–2013. After years of relative neglect at
DOE, appliance standards are moving into the limelight, with executive level recognition of their role and at least twenty-six new and updated national standards planned.
Savings Achieved: Standards’ Track Record in the U.S. Here we provide a brief history of U.S. appliance standards, including the interplay of state and national standards, and summarize impacts to date.
Savings Ahead: Potential Benefits from New and Updated National Standards. In this section, we discuss the potential energy savings, economic benefits, and emissions reductions achievable from implementation of twenty-six new or updated appliance standards.
Product Discussions. This section provides detailed information on the twenty-six products we analyzed, including a description of the product, the current standard — if any — and our current recommendation for the new standard level(s). We also summarize the energy and economic savings generated by the proposed new standard as well as key facts about the product, such as the various technical improvements that can help achieve the new standard level(s).
3 Some new standards could potentially generate large savings, which would justify expediting these rulemaking processes. The 2010 U.S. Department of Energy budget request allows for the acceleration of up to three products not currently on DOE's multiyear schedule (DOE 2009g). 4 DOE announced in early 2009 that it will start a new rulemaking for BR and other exempted reflector lamps. Although a due date for the final rule has not yet been set, bills in the House and Senate have targeted January 1, 2013 as the effective date. 5 This assumes forecasted sales of 4,801 TWh in 2030 (EIA 2009c).
2

Ka-BOOM! The Power of Appliance Standards
2. Savings on Tap: Record Activity Planned for 2009–2013 The importance of and the need for appliance efficiency standards has been heralded by both President Barack Obama and DOE Secretary Steven Chu. In a speech at the DOE on February 5, 2009, President Obama put appliance efficiency standards front and center as a key element of his energy plan. He signed a Presidential Memorandum ordering the Department to complete five new standards subject to legal deadlines by August 8, 2009 and to work toward completing standards due after August 8th ahead of schedule, especially those with the largest potential savings. As President Obama declared his commitment to accelerating the pace of DOE’s work, he touted the massive benefits of national standards:
We'll save through these simple steps over the next 30 years the amount of energy produced over a two-year period by all the coal-fired power plants in America. This will save consumers money, this will spur innovation and this will conserve tremendous amounts of energy.
Administration background fact sheets. provided along with the President's speech, state that the implementation of the standards would represent an estimated savings to Americans of more than $500 billion in electric bills over 30 years. The administration explains, “[They] spur more investment in energy efficiency and pay for themselves many times over. It’s a win for consumers, a win for the economy and a win for the environment.” President Obama’s commitment to meet and beat the legal deadlines for new standards is an important break with the past. His predecessors fell behind on legislatively-required updates for twenty-two standards. Congressional oversight and lawsuits have pushed DOE to set an ambitious agenda to compensate for these missed deadlines. In addition, the 2005 and 2007 energy laws required new DOE rulemakings for several additional product categories. Altogether, twenty-three standards are required to be set by January 2013 and, as described in the DOE's budget request for 2010, the administration plans to accelerate at least three more — an unprecedented pace for DOE. In his first few months in office, Secretary Chu has followed up on the President's call for action. At an Alliance to Save Energy conference on March 3, 2009, Secretary Chu declared: “I am going to be looking at those [federal appliance standards] because I have become more convinced that they are not as aggressive as they could be. So we will look at making them more aggressive.” Later in March, Secretary Chu followed through on his assertion as DOE reversed a legal opinion from the prior administration that would have exempted a large segment of the reflector lamp market from standards due out later in 2009.6 And in April, DOE agreed to a voluntary remand in a lawsuit concerning the 2007 residential furnace standard. In that suit, efficiency advocates and states alleged that in choosing a standard that was virtually unchanged from the original 1987 standard, DOE ignored key considerations about the economic benefits of reduced natural gas demand and avoided global warming emissions. In effect, DOE has now voluntarily chosen to undertake a new rulemaking to correct the flawed 2007 standard. The early statements and actions of the new administration have also proven to be consistent with promises made by President Obama during the electoral campaign. In the Obama campaign's "New Energy for America" plan,7 the campaign noted that the DOE had, to date, missed many deadlines for updating federal appliance efficiency standards. Citing the costs to American consumers from these missed opportunities, the Obama campaign committed to an overhaul of the standards process as
6 In the notification of proposed rulemaking (NOPR) issued by the DOE in April, the DOE expressed its intention to proceed with setting standards for BR and other exempted reflector lamps in a separate rulemaking from the final rule issued on June 26, 2009 for general service fluorescent lamps and incandescent reflector lamps. See the product description for incandescent reflector lamps in Section 5 for more information. 7 http://www.barackobama.com/pdf/factsheet_energy_speech_080308.pdf
3

Ka-BOOM! The Power of Appliance Standards
well as increased budgets to enable DOE to keep up with the ambitious schedule needed to seize upon the savings opportunities created by new standards (BarackObama.com 2008). These statements and early actions by President Obama and Secretary Chu underscore what many energy efficiency advocates have long known: appliance efficiency standards are one of the quickest, easiest, and cheapest ways to save energy and reduce costs. Even more importantly, the President and Secretary have brought the importance of energy saving appliance standards into focus as part of a broader strategy to promote energy security and to make America more energy efficient in order to improve energy security, stimulate economic growth, and protect the environment and public health. Presidential memorandum: The White House - Press Office - Appliance Efficiency Standards Secretary Chu’s remarks: http://www.standardsasap.org/documents/DOE_might_make_pending_appliance_standards.pdf
3. Savings Achieved: Standards’ Track Record in the U.S. In the 35 years since the first appliance standards were introduced at the state level, their contribution to the energy and economic policy goals of the United States are unmistakable and, most likely, underappreciated. To better understand the potential impact that new and updated standards could have, it is important to understand how national standards have developed over the years and to quantify their benefits. 3.1 History of Standards in the United States Appliance standards have served as one of the nation’s most effective policies for improving energy efficiency. The first standards were enacted at the state level in California in 1974, the first of many policy actions initiated that year when then-Governor Reagan signed the State Energy Resources Conservation and Development Act as part of the state's policy to "reduce wasteful, uneconomical, and unnecessary uses of energy" (CEC 1983). The two main rationales for standards were to save consumers money by lowering appliance operating costs and to help overcome the market barriers that inhibit the sale of efficient products.8 California's standards proved to be so successful that in 1986, with the development of additional state standards in California and other states underway, appliance manufacturers became increasingly concerned about the impact of differing state standards on their ability to do business on a national basis. To address these concerns, manufacturers negotiated with energy efficiency advocates and states, reaching a consensus on national efficiency standards covering many major household appliances that would preempt the individual state standards. The resulting agreement formed the basis for a new federal law, the National Appliance Energy Conservation Act of 1987 (NAECA), enacted by Congress and signed by President Reagan (U.S. Congress 1987). States continued developing new standards on products not covered by NAECA, and in 1992 Congress enacted another round of standards. The Energy Policy Act (EPAct 1992) added standards for many of the most common types of light bulbs, electric motors, commercial heating and cooling equipment, and plumbing fittings (U.S. Congress 1992). Each of these laws was based on consensus agreements between product manufacturers and efficiency advocates (Nadel and Pye 1996). Since 2001, thirteen states and the District of Columbia have adopted new state-level standards. As in the past, states' initiative has continued to elicit a federal response. In 2005, the Energy Policy Act (EPAct 2005) set new standards for sixteen products and directed DOE to set standards via rulemaking for another five (U.S. Congress 2005). In 2007, Congress passed the Energy Independence and Security Act (EISA 2007), enacting new or updated standards for thirteen products, several of which had been first regulated at the state level. EISA created the first-ever U.S. standards
8 For more on market barriers, see Appendix B.
4

Ka-BOOM! The Power of Appliance Standards
for general service light bulbs, which will begin to phase out conventional incandescent light bulbs in 2012. EISA also included the first significant program reforms since NAECA in 1987, including specific authority for DOE to create regional standards for major residential heating and cooling products and a requirement that DOE review and improve all standards and their underlying test methods on a regular schedule.9
In general, these laws set initial standards in statute and direct DOE to conduct scheduled reviews to update standards to determine if improved standards make sense. DOE must set new standards “to achieve the maximum improvement in energy efficiency […] which the Secretary determines is technologically feasible and economically justified" (42 U.S. Code 6295(o)). An economically justified standard is one for which the benefits exceed the costs, taking into consideration seven factors including impacts on consumers, impacts on manufacturers, and the nation’s need to save energy. Several standards were updated during President George H.W. Bush’s term in office (e.g., refrigerators, clothes washers, and dishwashers), and another eight were updated under President Clinton (e.g., central air conditioners, room air conditioners, refrigerators [second update], clothes washers [second update], water heaters, and fluorescent lamp ballasts). President George W. Bush updated two major standards (home furnaces and distribution transformers), but both are subject to litigation that could lead to stronger standards than were initially set. His administration also issued the first standards for supermarket refrigeration, which will become effective in 2012, and updated standards for packaged terminal air conditioners (PTAC) and packaged terminal heat pumps (PTHP). Despite these various updates, by 2004 DOE had missed legal deadlines for the review of 22 different standards. These delays have been very costly: the U.S. Government Accountability Office estimates that delays for only four missed standards cost U.S. consumers $28 billion in foregone energy savings (GAO 2007). Part of this lapse could be traced to a Congressional moratorium on standards and resulting focus on process redevelopment at DOE in the mid-1990s. In response to concerns about whether they had sufficient resources to meet all the statutory deadlines, DOE instituted a prioritization approach whereby the agency would first tackle those overdue rulemakings with the biggest savings. However, DOE’s pace of work on new rulemakings slowed to a crawl during President George W. Bush’s first term. Much of the DOE’s early efforts during this period were focused on rolling back the air conditioning standards set at the end of the Clinton presidency — a rollback that was ultimately declared illegal by the federal courts (National Resources Defense Council, et. al., v. Abraham, 355 F.3d 179, 185 (2d Circuit 2004)). For the three major high-priority rulemakings begun in 2001 (home furnaces, commercial air conditioners and heat pumps, and distribution transformers), DOE did not release its preliminary analyses until July 2004. A process that should have been finalized by 2004 was still stuck in its early stages. Instead of catching up on missed deadlines, DOE was falling further and further behind, which led a coalition of states and efficiency advocates to file suit (New York, et. al. and Natural Resources Defense Council, et. al., v. Bodman. Nos 05 Civ. 7807 & 7808 (July 1, 2005 Southern District of New York)). Concurrently, Congress increased its scrutiny in budget hearings and enacted new reporting requirements. Legislation enacted in August 2005 required DOE to report on its missed deadlines, provide explanation, and develop a plan for catching up (EPAct 2005, Section 141). The law also requires DOE to provide status reports to Congress every six months. DOE submitted its first report to Congress in January 2006, which included its plan for catching up on all missed deadlines (DOE 2006).10 In November 2006, DOE signed a consent decree in the suit over the missed deadlines (United States District Court for the Southern District of New York 2006).11 Under the new schedule, DOE committed to catch up on all missed legal deadlines by July 2011 as
9 In 2009, Congress is again working on new energy legislation. The pending legislation includes six new standards and program reforms that would streamline and improve DOE decision-making, allow for standards using multiple efficiency metrics, and remove some of the most problematic barriers to improved state-level building codes. 10 See http://www1.eere.energy.gov/buildings/appliance_standards/pdfs/congressional_report_013106.pdf. 11 See http://www.ag.ca.gov/globalwarming/pdf/2-27-08consent_decree_NYvBodman.pdf.
5

Ka-BOOM! The Power of Appliance Standards
well as to meet new deadlines created by the 2005 law. DOE’s schedule with respect to the missed deadlines is subject to ongoing court oversight. In the wake of the Congressional report and consent decree, the pace of work at DOE increased noticeably. Congress also increased the program budget from $10.1 million in FY2005 to $20 million by FY 2009 (DOE 2009g). As of May 2009, DOE had met all eight final rule deadlines required under the consent decree12 and EPACT 2005. In addition, DOE met initial deadlines required under the 2005 energy law, including the first standards for supermarket refrigeration standards completed in January 2009. 3.2 Policy Rationale for Standards By setting a minimum efficiency level, standards ensure that efficiency improvements are incorporated into all new products and thus provide all buyers a minimum level of efficiency performance. In many cases, without standards only premium products include efficiency improvements. Standards can help bring down costs for energy-efficient technologies due to economies of scale and also because standards encourage manufacturers to focus on how to achieve efficiency improvements at minimum cost as they compete for the most price-sensitive portion of the market. This result is obtained because the standards are usually based on energy performance (as measured by a test protocol promulgated by DOE) rather than on the use of specific technologies or design approaches. As a result, higher-efficiency products become more affordable and widely available so that more consumers can benefit from advances in product performance and design. For example, due to standards, all new refrigerators use high-efficiency motors and compressors, better insulation, and improved heat exchangers and, as a result, use 70% less energy than refrigerators manufactured in the 1970s, an improvement in efficiency of 225%. And while refrigerators became much more efficient during this period, they also featured other consumer amenities (e.g., they got bigger and auto defrost became universal). During this period, the average per unit value (wholesale price) of refrigerators actually declined (see Figure 1).
12 The eight deadlines met included new standards for transformers (issued Oct. 12, 2007), home furnaces, home boilers, and mobile home furnaces (issued Nov. 19, 2007); packaged terminal air conditioners (issued Oct. 7, 2008); ranges and ovens (issued on April 8, 2009). DOE also issued determinations required for instantaneous water heaters and commercial boilers. A subsequent rulemaking is underway for commercial boilers, which will determine standards. Congress eliminated a ninth deadline by enacting new standards for dishwashers in EISA 2007. Thus, as of May 2009, 13 consent decree deadlines remain.
6

Ka-BOOM! The Power of Appliance Standards
Figure 1. U.S. Refrigerator Use vs. Time
0
500
1,000
1,500
2,000
1947
1950
1953
1956
1959
1962
1965
1968
1971
1974
1977
1980
1983
1986
1989
1992
1995
1998
2001
2004
2007
Ave
rage
Eer
ngy
Use
per
Uni
t Sol
d (k
Wh/
yr)
0
5
10
15
20
25
Ref
riger
ator
vol
ume
(cub
ic fe
et)
1978 CA Standard
1980 CA Standard
1987 CA Standard
1990 NAECA Standard1993 DOE Standard
2003 DOE Standard
Energy Use per Unit
$1270Refrigerator Size (cubic feet)
Refrigerator Price Dollars (2001$) $ 481
Source: Pat McAuliffe and David Goldstein (personal work)
Figure 2 shows significant reduction in energy use for 3 products: gas furnaces, refrigerators, and central air conditioners over 35 years. The arrows indicate the effective date of state and federal standards. Minimum efficiency standards generally make sense when high-efficiency products are readily available or can be readily produced and are cost-effective, but due to a number of market barriers, many consumers and businesses are purchasing less efficient products. These barriers are deep and pervasive, and include demand and supply-side barriers, such as a lack of consumer awareness of efficiency options or benefits, limited stocking in retail stores, and split incentives between building owners and occupants. A greater discussion of this topic can be found in Appendix B.
7

Ka-BOOM! The Power of Appliance Standards
Figure 2. Index of U.S.-Average Energy Use per New Appliance Relative to 1972
20
30
40
50
60
70
80
90
100
110
1972 1977 1982 1987 1992 1997 2002 2007
Inde
x (1
972=
100)
Effective Dates of National Standards Effective Dates of State Standards
=
=
-25%
Central Air Conditioner – 50%
Refrigerator -70%
Gas Furnace
Source: LBNL 2009
Besides minimum efficiency standards, several other program and policy options help overcome these barriers, including education programs, rebate programs, and building code requirements. However, none of these options has the energy-saving impact of minimum efficiency standards because they do not affect all purchase decisions. The Environmental Protection Agency and DOE's ENERGY STAR labeling program offers manufacturers a way to increase the marketability of their most efficient products, but for products in this report, there is either no ENERGY STAR specification or the market share is generally much less than 50%. Education programs generally only reach a small fraction of consumers. Likewise, utility incentive programs generally reach less than 50% of the eligible market (Nadel, Pye, and Jordan 1994). For education programs or incentive programs to reach larger portions of the market would be prohibitively expensive in nearly all cases; in fact, those few incentive programs that reach near-100% market share required 100% subsidization of all measures (Nadel, Pye, and Jordan 1994; Goldstein 2009). Building codes generally apply only to new or substantially renovated buildings, leaving the large number of existing buildings unaffected for decades. Also, building codes generally only cover products that are installed in buildings prior to occupancy (e.g., heating, cooling, and water-heating systems). Many products covered by standards are not affected by building codes.13 These other programs and policy options deliver critical energy savings benefits and help pave the way for future standards, but they are by no means a replacement for efficiency standards as no single one of them would capture all of the potential benefits.
ENERGY STAR specifications should not be confused with federal standards. Federal appliance and equipment standards establish a minimum efficiency level that all products within a product class are legally obligated to meet. ENERGY STAR specifications are set higher than federal standards, so by qualifying for an ENERGY STAR label, manufacturers can increase the marketability of their efficient products due to the recognition that comes with the ENERGY STAR label.
13 California's Title 24 standards cover lighting and HVAC equipment and ducts.
8

Ka-BOOM! The Power of Appliance Standards
3.3 Savings from Existing Federal Standards ACEEE has compiled savings estimates attributable to all standards adopted since 1987. For a list of products subject to federal standards, see Table 4 below. These estimates include electricity savings, primary energy savings, peak load reductions, and carbon reductions for 2000, 2010, 2020, and 2030. The total achieved savings from existing standards are enormous. As of 2000, appliance standards had already cut total U.S. electricity use by 2.5% and U.S. carbon emissions from fossil fuel use by nearly 2%. The projected savings are even larger, as shown in Tables 1 and 2.
Table 1. Savings from Existing Federal Appliance Standards (Billion kWh)
Year Kilowatt-hour Savings (Billions) Percent of U.S. Electricity Use* 2000 88 2.5% 2010 273 7.0% 2020 498 11.5% 2030 563 12%
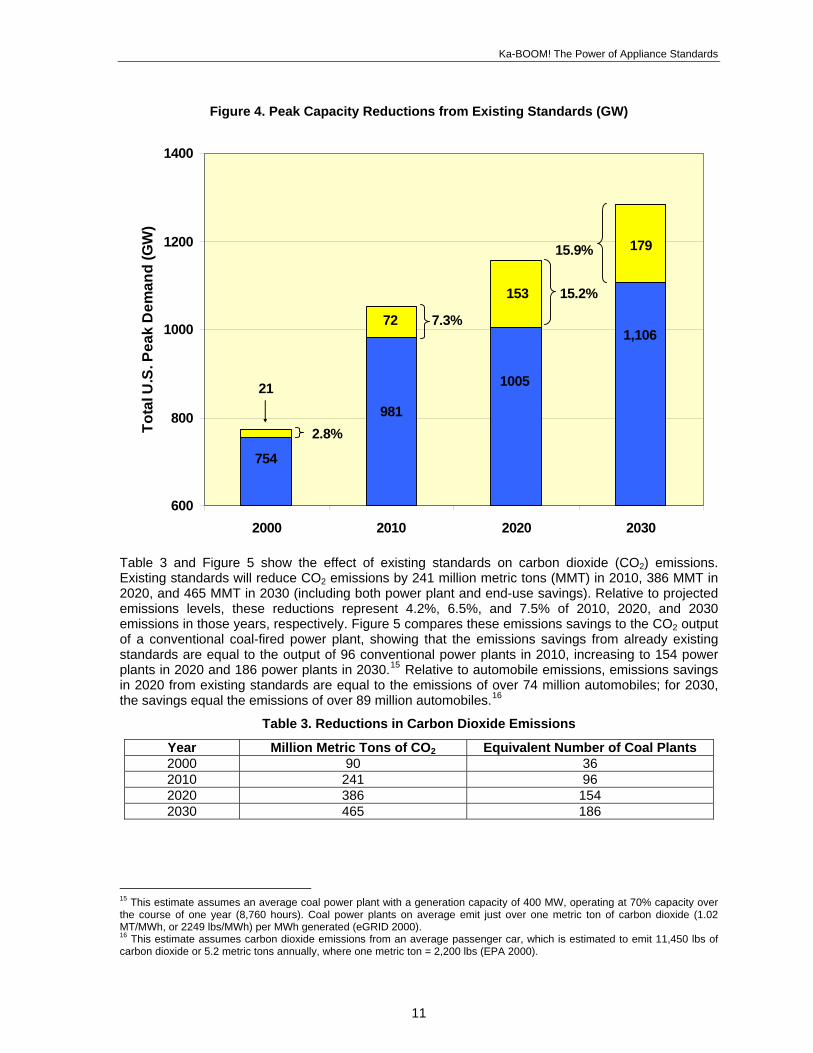
* Percent of actual use in 2000, and projected use for 2010 and 2020 (EIA 2009b). EIA projects 3,904 TWh for 2010 and 4,341 for 2020. Figure 3 shows how standards have helped curb the growth of U.S. electricity consumption. This progression shows how the effect of standards accumulates over time as the stock of equipment in use improves. Nevertheless, overall U.S. energy consumption has increased: savings from standards and other efficiency policies have not been large enough to compensate for a growing population, an expanding economy, and greater consumer demand for more and bigger energy-using appliances and homes. More will need to be done with standards and other policies in order to achieve absolute reductions in energy use (Calwell 2009). Table 2 and Figure 4 show how standards have slowed the rate of growth of U.S. peak electricity demand. Peak capacity14 reduction from existing standards is expected to reach 72,000 MW in 2010 and 179,000 MW in 2030, which is equivalent to about 7% and 16% of projected U.S. generating capacity, respectively. The overall growth in U.S. electric demand is much lower than it would have been absent new standards, which will save billions of dollars in investments in new power plants and transmission and distribution infrastructure.
14 Peak capacity, also referred to as net summer capacity, is the steady hourly output that generation equipment is expected to supply to system load (EIA 2009c). Our peak savings estimates reflect avoided peak generation requirements; i.e., peak savings from these standards will negate the need for additional capacity in the future.
9

Ka-BOOM! The Power of Appliance Standards
Figure 3. Total U.S. Electricity Consumption with Savings from Existing Standards (TWh)
2500
3000
3500
4000
4500
5000
5500
2000 2010 2020 2030
Tota
l U.S
. Ele
ctric
ity C
onsu
mpt
ion
(TW
h)
88
273
498
3,438
3,904
4,341 2.5%
7%
11.5%
4,801
12% 563
Table 2. Peak Capacity Reductions (GW)
Year Peak Capacity Reductions (GW) Percent of Total U.S. Peak Capacity*2000 21 2.8% 2010 72 7.3% 2020 153 15.2% 2030 179 15.9%
* Percent of actual peak capacity for 2000 and projected peak for 2010 (981 GW) and 2020 (1005 GW) (EIA 2009b).
10
Ka-BOOM! The Power of Appliance Standards
Figure 4. Peak Capacity Reductions from Existing Standards (GW)
600
800
1000
1200
1400
2000 2010 2020 2030
Tota
l U.S
. Pea
k D
eman
d (G
W)
21
72
153
754
981
1005
2.8%
7.3%
15.2%
1,106
17915.9%
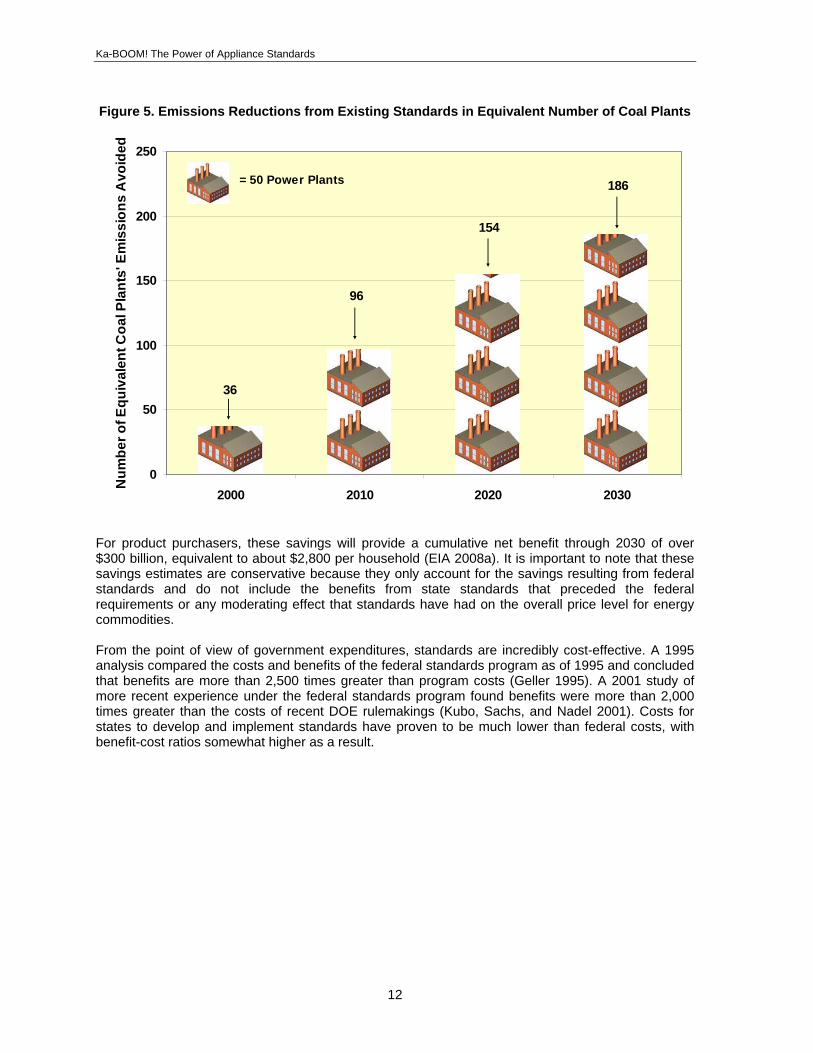
Table 3 and Figure 5 show the effect of existing standards on carbon dioxide (CO2) emissions. Existing standards will reduce CO2 emissions by 241 million metric tons (MMT) in 2010, 386 MMT in 2020, and 465 MMT in 2030 (including both power plant and end-use savings). Relative to projected emissions levels, these reductions represent 4.2%, 6.5%, and 7.5% of 2010, 2020, and 2030 emissions in those years, respectively. Figure 5 compares these emissions savings to the CO2 output of a conventional coal-fired power plant, showing that the emissions savings from already existing standards are equal to the output of 96 conventional power plants in 2010, increasing to 154 power plants in 2020 and 186 power plants in 2030.15 Relative to automobile emissions, emissions savings in 2020 from existing standards are equal to the emissions of over 74 million automobiles; for 2030, the savings equal the emissions of over 89 million automobiles.16
Table 3. Reductions in Carbon Dioxide Emissions
Year Million Metric Tons of CO Equivalent Number of Coal Plants 22000 90 36 2010 241 96 2020 386 154 2030 465 186
15 This estimate assumes an average coal power plant with a generation capacity of 400 MW, operating at 70% capacity over the course of one year (8,760 hours). Coal power plants on average emit just over one metric ton of carbon dioxide (1.02 MT/MWh, or 2249 lbs/MWh) per MWh generated (eGRID 2000). 16 This estimate assumes carbon dioxide emissions from an average passenger car, which is estimated to emit 11,450 lbs of carbon dioxide or 5.2 metric tons annually, where one metric ton = 2,200 lbs (EPA 2000).
11
Ka-BOOM! The Power of Appliance Standards
Figure 5. Emissions Reductions from Existing Standards in Equivalent Number of Coal Plants
0
50
100
150
200
250
2000 2010 2020 2030
Num
ber o
f Equ
ival
ent C
oal P
lant
s' E
mis
sion
s A
void
ed
36
96
154
= 50 Power Plants 186
For product purchasers, these savings will provide a cumulative net benefit through 2030 of over $300 billion, equivalent to about $2,800 per household (EIA 2008a). It is important to note that these savings estimates are conservative because they only account for the savings resulting from federal standards and do not include the benefits from state standards that preceded the federal requirements or any moderating effect that standards have had on the overall price level for energy commodities. From the point of view of government expenditures, standards are incredibly cost-effective. A 1995 analysis compared the costs and benefits of the federal standards program as of 1995 and concluded that benefits are more than 2,500 times greater than program costs (Geller 1995). A 2001 study of more recent experience under the federal standards program found benefits were more than 2,000 times greater than the costs of recent DOE rulemakings (Kubo, Sachs, and Nadel 2001). Costs for states to develop and implement standards have proven to be much lower than federal costs, with benefit-cost ratios somewhat higher as a result.
12

Ka-BOOM! The Power of Appliance Standards
Table 4. Products Subject to Existing National Efficiency Standards
Residential Products Boilers Furnaces Battery chargers* Furnace fans* Central air conditioners & heat pumps Microwave ovens* Clothes dryers Pool heaters Clothes washers Refrigerators Dehumidifiers Room air conditioners Direct-fired space heaters Ranges & ovens Dishwashers Showerheads External power supplies Toilets
Water heaters Faucets & aerators Freezers
Commercial Products Air conditioners and heat pumps (unitary equipment 240–760k Btu/hr) Ice-makers (cube type, 50 to 2,500 lbs/day)
Packaged terminal air conditioners and heat pumps Beverage vending machines*
Commercial clothes washers Pre-rinse spray valves Refrigerators and freezers (packaged) Commercial furnaces & boilers
Commercial packaged air conditioners & heat pumps Small electric motors*
Commercial three-phase central air conditioners (under 65 kBtu/h) Supermarket refrigerators
Commercial water heaters Unit heaters Distribution transformers Walk-in coolers and freezers Electric motors (1–500 hp)
Lighting Products Ceiling fans and lights Mercury vapor lamp ballasts General service incandescent lamps Metal halide lamp fixtures Fluorescent lamp ballasts Pedestrian traffic signals Fluorescent lamps Torchiere lighting fixtures High-intensity discharge lamps* Vehicular traffic signals Illuminated exit signs Incandescent reflector lamps
* Products marked with an asterisk do not have federal standards currently, but DOE rulemakings to determine standards are underway or scheduled. 3.4. Impacts on Manufacturers New standards can have a big impact on manufacturers, requiring them to make substantial investments in new products and manufacturing capacity. For example, only 13% of the more than 6 million units sold per year met the most recent central air conditioner standard when it was
13
Ka-BOOM! The Power of Appliance Standards
announced in 2001 (it became effective in 2006). No mass-produced products met the 1993 refrigerator standard when it was issued by DOE in 1989.17 However, the size and even the direction of the financial impact of standards on manufacturers is a matter of some debate. Financial impacts are determined largely by whether a new standard causes the cost of manufacturing a new product to increase and, if so, whether any cost increases lead to lower sales volumes or profit margins. Manufacturer margins can increase as product prices increase, provided manufacturers can maintain current price markups. Profit margins can decline if manufacturers find they must lower prices to maintain volume or if they are unable to offer premium products that carry a higher markup. DOE attempts to account for this high degree of uncertainty: for example, for the recently announced new general service fluorescent lamp standard, DOE ran scenarios showing manufacturer impacts ranging from a loss of 0.6% of industry value to a loss of 30.7% of industry value (DOE 2009i). In the 2007 home furnaces final rule, DOE estimated that the standard recommended by efficiency advocates (90% AFUE) would have impacts on manufacturers ranging from an increase in industry value of 2% to a decrease of 24% (DOE 2007d). Similar ranges, generally including an estimate of impacts close to zero, have been found in other recent rulemakings. Ample evidence exists in manufacturer reports and retrospective analyses that the lowest DOE estimates are probably the most accurate. A survey of 15 manufacturer annual and financial reports from affected companies for 1987 to 1993, a period during which many new standards took effect, found no negative assessments of standards impacts and several positive ones. For example, one water heater manufacturer’s annual report noted that the original water heater standards benefited the company in three ways: (a) “we no longer have to produce models to address the varying state energy efficiency standards;” (b) “price increases on …minimum standard models have more than offset the corresponding cost increases resulting in an improved gross profit margin;” and (c) since the standard took effect, “the Company has been selling a larger number of ‘step-up’ models" (Chan 1995). Examination of more recent financial reports would help build understanding of more recent standards. Retrospective analyses have found that DOE and others have historically tended to overestimate standards’ impact on product prices and sales volume, and, therefore, impacts on manufacturer finances. DOE overestimated the first furnace standard’s cost impact by a factor of six and ACEEE overestimated by a factor of two. For the 1992 central air conditioner standard, both DOE and the industry trade association predicted very large price increases, but consumer prices actually declined from pre-standard prices within two years. The historical trend in refrigerator prices, including the period after the 2001 standard, has also defied the assumption that standards lead to higher product prices (see Figure 1) (Nadel 2002, 2004; Greening 1997). A 2004 study by Lawrence Berkeley National Labs (LBNL), which conducts analyses for DOE, found that, “Looking at the trends, it is difficult to see an impact on price from DOE standards effective in the 1990s” (p. 23). Similarly, the study found that predicted declines in sales after standards are implemented did not materialize (Meyers 2005). Additional analyses of standards implemented during the 2004 to 2007 timeframe (e.g., clothes washers, water heaters, and air conditioners) would be valuable to evaluate if DOE has continued to overestimate price and sales volumes impacts. Another LBNL study, published in 2002, attempted to understand why price predictions were often too high. This analysis evaluated six rulemakings and found that DOE had overestimated price impacts in all six. Overestimates ranged from 20% to 310%. Four factors were found to explain why DOE’s models over-predicted price impacts: general increases in productivity, technological change leading to lower costs for improved efficiency, lower profit margins, and economies of scale (Dale 2002). Among these factors, technological innovation is perhaps the most important and the most difficult to predict. But the record proves that new standards unleash intense market pressures to bring existing efficiency improvements to market at the lowest possible cost and to innovate further. For example,
17 In general, DOE provides at least three years between a new standard’s publication and implementation to allow manufacturers time to make necessary product changes and investments.
14

Ka-BOOM! The Power of Appliance Standards
engineers for two refrigerator manufacturers observed, “[Manufacturers] typically combine improvements in energy efficiency with cost reductions, quality improvement, and new features. Each manufacturer’s facility and tooling are typically revised at certain intervals to attain these other objectives due to improvements in technology and/or new marketplace demands." (McInerney 1997). In other words, the disruption created by standards creates an opportunity for innovation. Shortly after the 2001 refrigerator standard took effect, manufacturers offered units using 20% less energy and today offer units using 30% less energy; neither of these levels were available when the standard was issued in 1997. Shortly after the SEER 13 air conditioner standard was announced, manufacturers reached for new efficiency levels, introducing new “trophy” units with SEER levels as high as 19 to 21. In the mass market, product offerings at SEER 15 and 16 have increased in recent years. For clothes washers, the best units today reach efficiency performance levels unheard of when the 2007 clothes washer standard was announced in 2001. For example, the best large Kenmore, GE, and Whirlpool clothes washers use just one-third the energy of each manufacturers’ comparably-sized products that just meet the current minimum standard (FTC 2008). Even century-old technology like the incandescent light bulb is not immune: standards enacted by Congress in 2007 that will take effect starting in 2012 have spurred dramatic innovation and plans to incorporate such innovations in products that very few observers would have predicted (Vestel 2009).
Recent experience with the 2001
refrigerator, the 2006 central air conditioner and
2007 clothes washer standards all
indicate that new standards provoke
innovation.
Innovations that enable efficiency improvements at lower-than-expected costs help manufacturers meet standards without raising prices or losing sales; innovations that take efficiency to new levels enable manufacturers to earn the larger margins sometimes associated with premium efficiency products. With innovation, manufacturer impacts are likely to vary from minimal to positive. But, to date, DOE has resisted any attempt to model the effects of technological change, even when it is well documented. For example, as recently as 2008, efficiency advocates argued that DOE should base standards for commercial refrigeration lighting on reasonable assumptions about future LED prices, which are widely expected to decline. But DOE’s 2009 standard, which will be effective in 2012, is based on an assumption of no further technical development in LEDs and that this rapidly evolving technology will remain at 2009 price levels indefinitely. Finally, while the size and direction of impacts on manufacturers are a matter of debate, all estimates are generally dwarfed by the public benefits gained from standards. Net national economic benefits are estimated at $10 billion to $53.5 billion; DOE estimates manufacturer costs at $4 million to $162 million (DOE 2009i). The 2007 final rule for distribution transformers estimated that transformer owner savings outweighed worst case manufacturer losses by 150 to 1 (DOE 2007e). In the 2009 final rule for supermarket refrigeration systems, the ratio was not as large: DOE estimated that national economic benefits outweighed worst case costs for manufacturers by just 26 to 1. Net savings for equipment purchasers are estimated at up to $3.9 billion; manufacturers’ impacts are estimated at $39 million to $148 million (DOE 2009j). But, since manufacturers supported this particular standard, it seems unlikely that they expect the worst case estimates to play out.
For the June 2009 standard for general service fluorescent
lighting, DOE’s estimates of the net
savings for the products’ consumers outweigh the worst case estimate of
manufacturer impacts by as much as 330 to 1.
These ratios do not even account for the large environmental and energy system benefits resulting from strengthened standards. Accounting for the monetary value of pollution reductions, any impacts of energy savings on the overall energy price level and the value of deferring or avoiding new power system investments would only increase the disparity between public benefits and manufacturer impacts.
15

Ka-BOOM! The Power of Appliance Standards
4. Savings Ahead: Potential Benefits from New and Updated National Standards Despite the enormous benefits for existing standards, much more can be accomplished. Fortunately, the pace at which new standards are being set by DOE is at an all-time high as the agency works to catch up on overdue standards as well as to meet new deadlines. DOE is conducting more rulemakings now than at any time in its history and this work rate will continue through at least the end of 2012. Some of this work may be accelerated pursuant to President Obama’s February 5, 2009 memorandum, discussed above. The agency must meet 13 remaining overdue updates under the terms of settlement in the deadline lawsuit and also meet new review deadlines created by the 2005 and 2007 energy laws. In addition, DOE's 2010 budget request indicates plans to initiate at least three more rulemakings. Accounting for these additional rulemakings, DOE plans to complete at least twenty-six new standards by early 2013. The table below shows the date by which new standards are due for products during this period. We include the three additional standards mentioned above, which we recommend as good candidates for completion ahead of their legal deadlines.
Table 5. DOE Final Rulemaking Schedule Through January 2013
Product Final Rule Due Date Effective Date Incandescent Reflector Lamps*** June 2009 2012 Linear Fluorescent Lamps*** June 2009 2012 Commercial Boilers July 2009 2012 Refrigerated Vending Machines August 2009 2012 BR \ Exempted Reflector Lamps*** January 2010 2013 Commercial Clothes Washers January 2010 2013 Small Electric Motors February 2010 2013 Direct Heating Equipment March 2010 2013 Pool Heaters March 2010 2013 Residential Water Heaters March 2010 2013 High-Intensity Discharge Lamps** June 2010 NA Residential Refrigerators and Freezers December 2010 2013 Microwave Ovens — Standby Power March 2011 2014 Residential Furnaces May 2011 2015 Fluorescent Lamp Ballasts June 2011 2014 Residential Clothes Dryers June 2011 2014 Room A/C June 2011 2014 Residential Central A/C and Heat Pumps June 2011 2014 Battery Chargers July 2011 2014 External Power Supplies July 2011 2014 Residential Clothes Washers December 2011 2015 Metal Halide Lamp Fixtures January 2012 2015 Walk-In Coolers and Freezers January 2012 2015 Commercial Reach-In Refrigerators and Freezers January 2013 2016 Liquid Immersed Transformers* January 2013 2016 Low-Voltage Dry-Type Distribution Transformers* January 2013 2016 Residential Furnace Fans* January 2013 2016
* We include these products because their large potential savings make them excellent candidates for completion earlier than is legislatively required. ** DOE must first determine by June 2010 whether standards are needed. If the determination is positive, standards could be issued by 2012 and effective some time later. We did not analyze this technology for this report. *** DOE issued standards for general service fluorescent lamps and incandescent reflector lamps on June 26, 2009, when this report was nearing completion. DOE announced in early 2009 that it will start a new rulemaking for BR and other exempted reflector lamps. Although a due date for the final rule has not yet been set, bills in the House and Senate have targeted January 1, 2013 as the effective date.
16

Ka-BOOM! The Power of Appliance Standards
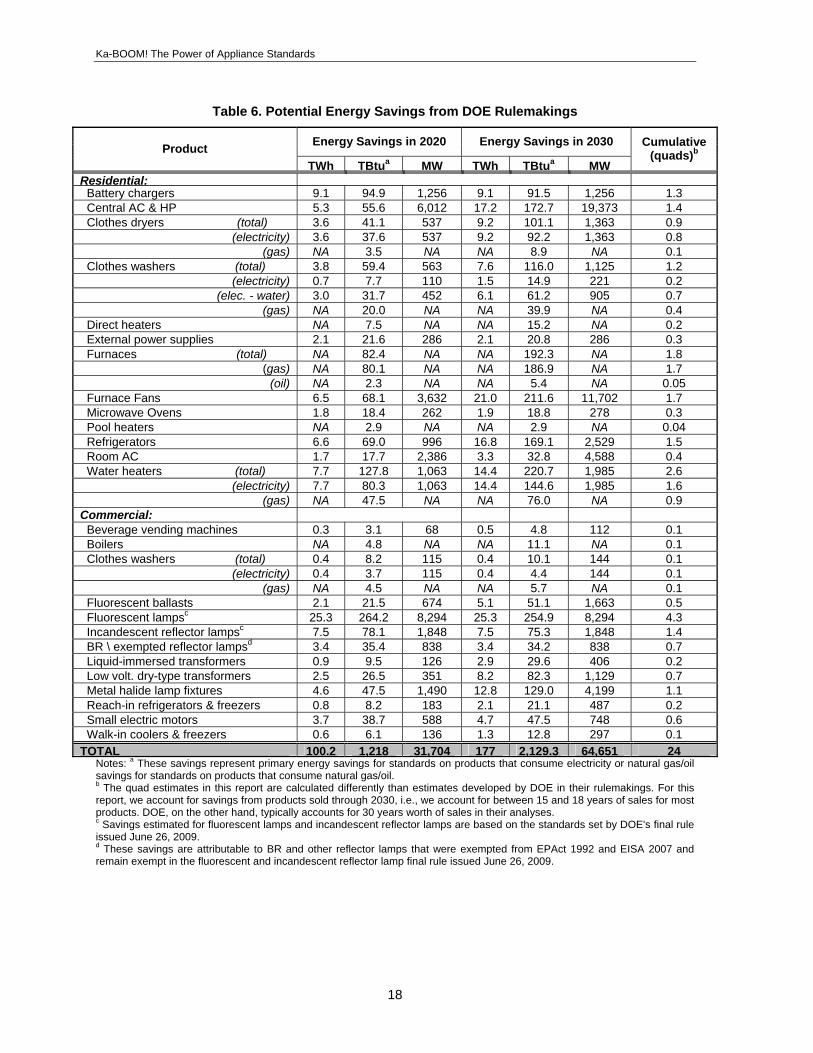
4.1 Potential Savings In this section, we present the key findings regarding the potential savings from twenty-three new product standards that are due by January 1, 2013 as well as the three products (furnace fans, liquid-immersed transformers,18 and low-voltage dry type distribution transformers) for which rulemakings should be accelerated by the Obama Administration in order to achieve larger overall energy savings sooner.19 Descriptions of the products and potential new standards can be found in Section 5. See Appendix A for our detailed methodology. We estimate that the energy and economic savings from new and updated standards could be colossal. Table 6 lists the products and our potential energy savings estimates in 2020 and 2030. We also estimate cumulative savings in quadrillion Btu's (quads).20 The cumulative savings estimate accounts for products sold between the implementation date and 2030. Our key findings are as follows:
New and updated federal standards could yield 24 quads of primary energy savings and over 1,900 TWh saved cumulatively by 2030, or roughly enough power to meet the total electricity needs of every American household for 18 months.
Annual electricity savings in 2030 alone could equal about 180 TWh, or about 4% of projected electricity consumption in that year (EIA 2009c).21
Annual savings from standards for natural gas appliances could reach about 290 trillion Btus (TBtu) annually by 2030, or enough to heat one out of every ten natural-gas heated U.S. homes for one year.
Peak electricity demand savings could reach about 65,000 MW in 2030, or about 6% of total U.S. generating capacity projected for 2030 (EIA 2009c).
Table A-5 in Appendix A lists the potential standard levels we analyzed for products subject to pending DOE rulemakings, which includes our assumptions of average unit lifetime, annual energy savings per unit, and incremental cost.
18 The standard established in 2007 is subject to litigation, which, if successful, would require DOE to reconsider higher levels. 19 Our analysis does not include high-intensity discharge lamps, which would make twenty-seven products. 20 As a point of reference, currently annual energy consumption in the U.S. is around 100 quads. 21 This assumes forecasted sales of 4,801 TWh in 2030 (EIA 2009b).
17
Ka-BOOM! The Power of Appliance Standards
18
Table 6. Potential Energy Savings from DOE Rulemakings
Energy Savings in 2020 Energy Savings in 2030 Product TWh TBtua MW TWh TBtua MW
Cumulative (quads)b
Residential: Battery chargers 9.1 94.9 1,256 9.1 91.5 1,256 1.3 Central AC & HP 5.3 55.6 6,012 17.2 172.7 19,373 1.4 Clothes dryers (total) 3.6 41.1 537 9.2 101.1 1,363 0.9
(electricity) 3.6 37.6 537 9.2 92.2 1,363 0.8 (gas) NA 3.5 NA NA 8.9 NA 0.1
Clothes washers (total) 3.8 59.4 563 7.6 116.0 1,125 1.2 (electricity) 0.7 7.7 110 1.5 14.9 221 0.2
(elec. - water) 3.0 31.7 452 6.1 61.2 905 0.7 (gas) NA 20.0 NA NA 39.9 NA 0.4
Direct heaters NA 7.5 NA NA 15.2 NA 0.2 External power supplies 2.1 21.6 286 2.1 20.8 286 0.3 Furnaces (total) NA 82.4 NA NA 192.3 NA 1.8
(gas) NA 80.1 NA NA 186.9 NA 1.7 (oil) NA 2.3 NA NA 5.4 NA 0.05
Furnace Fans 6.5 68.1 3,632 21.0 211.6 11,702 1.7 Microwave Ovens 1.8 18.4 262 1.9 18.8 278 0.3 Pool heaters NA 2.9 NA NA 2.9 NA 0.04 Refrigerators 6.6 69.0 996 16.8 169.1 2,529 1.5 Room AC 1.7 17.7 2,386 3.3 32.8 4,588 0.4 Water heaters (total) 7.7 127.8 1,063 14.4 220.7 1,985 2.6
(electricity) 7.7 80.3 1,063 14.4 144.6 1,985 1.6 (gas) NA 47.5 NA NA 76.0 NA 0.9
Commercial: Beverage vending machines 0.3 3.1 68 0.5 4.8 112 0.1 Boilers NA 4.8 NA NA 11.1 NA 0.1 Clothes washers (total) 0.4 8.2 115 0.4 10.1 144 0.1
(electricity) 0.4 3.7 115 0.4 4.4 144 0.1 (gas) NA 4.5 NA NA 5.7 NA 0.1
Fluorescent ballasts 2.1 21.5 674 5.1 51.1 1,663 0.5 Fluorescent lampsc 25.3 264.2 8,294 25.3 254.9 8,294 4.3 Incandescent reflector lampsc 7.5 78.1 1,848 7.5 75.3 1,848 1.4 BR \ exempted reflector lampsd 3.4 35.4 838 3.4 34.2 838 0.7 Liquid-immersed transformers 0.9 9.5 126 2.9 29.6 406 0.2 Low volt. dry-type transformers 2.5 26.5 351 8.2 82.3 1,129 0.7 Metal halide lamp fixtures 4.6 47.5 1,490 12.8 129.0 4,199 1.1 Reach-in refrigerators & freezers 0.8 8.2 183 2.1 21.1 487 0.2 Small electric motors 3.7 38.7 588 4.7 47.5 748 0.6 Walk-in coolers & freezers 0.6 6.1 136 1.3 12.8 297 0.1 TOTAL 100.2 1,218 31,704 177 2,129.3 64,651 24
Notes: a These savings represent primary energy savings for standards on products that consume electricity or natural gas/oil savings for standards on products that consume natural gas/oil. b The quad estimates in this report are calculated differently than estimates developed by DOE in their rulemakings. For this report, we account for savings from products sold through 2030, i.e., we account for between 15 and 18 years of sales for most products. DOE, on the other hand, typically accounts for 30 years worth of sales in their analyses. c Savings estimated for fluorescent lamps and incandescent reflector lamps are based on the standards set by DOE's final rule issued June 26, 2009. d These savings are attributable to BR and other reflector lamps that were exempted from EPAct 1992 and EISA 2007 and remain exempt in the fluorescent and incandescent reflector lamp final rule issued June 26, 2009.
Ka-BOOM! The Power of Appliance Standards
Figure 6. Projected U.S. Electricity Consumption in 2020 and 2030 less Savings from New Standards (TWh)
3,800
4,000
4,200
4,400
4,600
4,800
5,000
2020 2030
TWh
Projected Consumption Net New Standards Consumption Savings from New Standards
100
177
4,241
4,6242.3%
3.7%
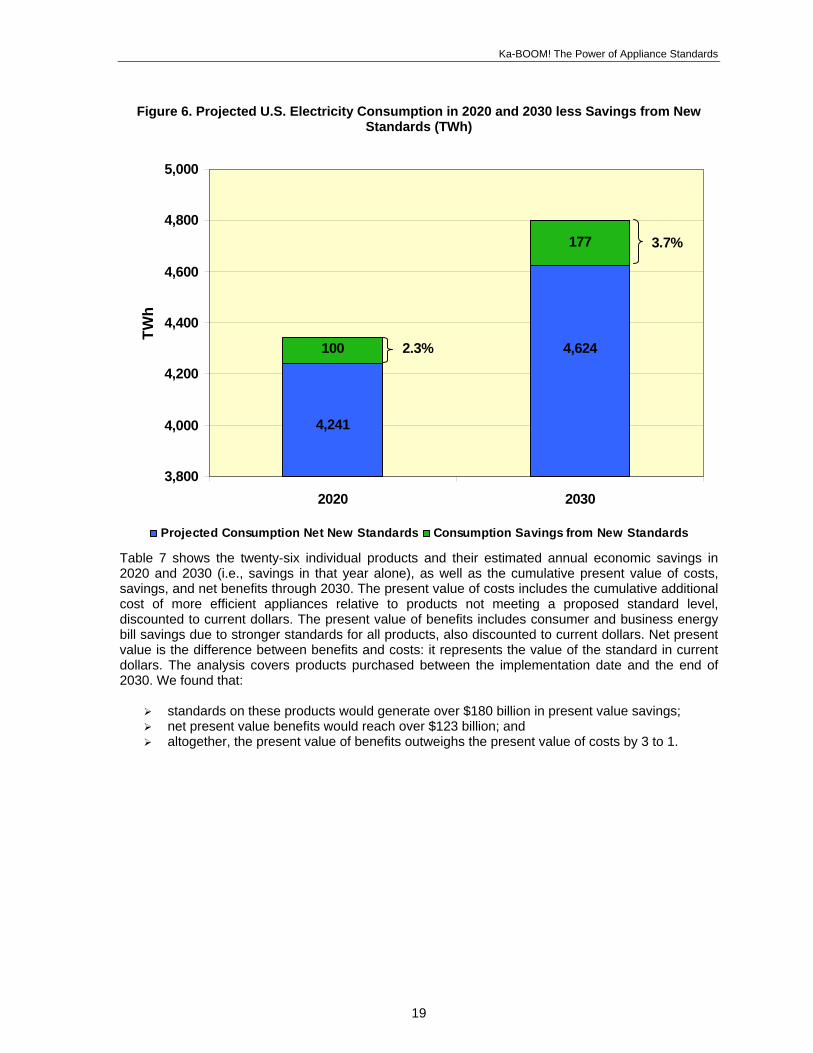
Table 7 shows the twenty-six individual products and their estimated annual economic savings in 2020 and 2030 (i.e., savings in that year alone), as well as the cumulative present value of costs, savings, and net benefits through 2030. The present value of costs includes the cumulative additional cost of more efficient appliances relative to products not meeting a proposed standard level, discounted to current dollars. The present value of benefits includes consumer and business energy bill savings due to stronger standards for all products, also discounted to current dollars. Net present value is the difference between benefits and costs: it represents the value of the standard in current dollars. The analysis covers products purchased between the implementation date and the end of 2030. We found that:
standards on these products would generate over $180 billion in present value savings; net present value benefits would reach over $123 billion; and altogether, the present value of benefits outweighs the present value of costs by 3 to 1.
19

Ka-BOOM! The Power of Appliance Standards
Table 7. Potential Economic Savings from DOE Rulemakings
Present Value of Savings
through 2030 (Million $)
Net Present Value for
Purchases through 2030
($ Million)
Annual Savings in
2020 (Million $)
Annual Savings in 2030
(Million $)
Present Value of Costs
through 2030 ($ Million)
Product
Residential: Battery chargers $1,033 $1,033 $1,953 $7,764 $5,811 Central AC & HP $605 $1,950 $4,088 $11,419 $7,331 Clothes dryers $458 $1,162 $3,310 $7,443 $4,133 Clothes washers $702 $1,405 $4,720 $20,348 $15,627 Direct heaters $107 $214 $783 $1,436 $652 External power supplies $235 $235 $1,336 $1,880 $544 Furnaces (gas) $1,096 $2,557 $9,205 $16,263 $7,058 Furnaces (oil) $58 $134 $11 $854 $843 Furnace fans $741 $2,388 $2,252 $13,987 $11,735 Microwave ovens $200 $212 $311 $1,764 $1,453 Pool heaters $40 $40 $104 $329 $226 Refrigerators $752 $1,908 $3,583 $12,223 $8,640 Room AC $192 $370 $936 $2,403 $1,467 Water heaters $1,525 $2,672 $4,225 $18,621 $14,396
Commercial: Beverage vending machines $30 $49 $83 $368 $286 Boilers $57 $133 $352 $1,123 $771 Clothes washers $127 $160 $1,041 $1,279 $239 Fluorescent ballasts $212 $522 $324 $3,139 $2,815 Fluorescent lamps $2,603 $2,603 $10,743 $23,596 $12,853 Incandescent reflector lamps $769 $769 $2,639 $7,700 $5,061 BR \ exempted reflector lamps $349 $349 $1,064 $3,841 $2,777 Liquid-immersed transformers $94 $302 $1,421 $2,349 $928 Low volt. dry-type transformers $261 $841 $896 $6,539 $5,643 Metal halide fixtures $468 $1,318 $641 $8,477 $7,836 Reach-in refrigerators & freezers $81 $215 $155 $1,174 $1,019 Small electric motors $381 $485 $827 $3,255 $2,429 Walk-in coolers & freezers $60 $131 $110 $786 $676 TOTAL $13,235 $24,158 $57,113 $180,362 $123,249
Table 8 shows the annual avoided emissions from updated standards in 2020 and 2030. The energy savings from standards results in fewer emissions from power plants and direct combustion of fossil fuel by appliances. Reductions in nitrogen oxides (NOx), sulfur dioxides (SO2), and mercury help meet air quality goals designed to protect public health and the environment. Reductions in CO2 help address climate change: the savings from standards can make a substantial contribution in cutting the amount of CO2 emissions in the years ahead. Our key findings regarding emissions reductions follow on p. 22:
20

Ka-BOOM! The Power of Appliance Standards
21
Table 8. Potential Environmental Savings from DOE Rulemakings
Emissions Reductions 2020 Emissions Reductions 20306
Product CO2 MMT
NOx 1000MT
SO2 1000MT
CO2 MMT
NOx 1000MT
SO2 1000MT
Residential: Battery chargers 6.2 5.3 24.5 7.2 5.3 24.5Central AC & HP 3.6 3.1 14.3 13.6 10.0 46.2Clothes dryers 2.7 2.3 9.7 7.7 5.7 24.7
(electricity) 2.5 2.1 9.7 7.3 5.4 24.7(gas) 0.2 0.1 0.001 0.5 0.4 0.002
Clothes washers 3.7 3.0 10.2 8.2 6.1 20.4(electricity - machine) 0.5 0.4 2.0 1.2 0.9 4.0
(electricity - water heating) 2.1 1.8 8.2 4.8 3.6 16.4(gas) 1.1 0.8 0.01 2.2 1.7 0.01
(water) NA NA NA NA NA NADirect heatersa 0.4 0.3 -0.4 0.8 0.6 -0.8
(gas) 0.5 0.4 0.002 1.0 0.8 0.005External power supplies 1.4 1.2 5.6 1.6 1.2 5.6Furnaces 4.5 3.4 0.02 10.4 8.0 0.1
(gas) 4.3 3.3 0.02 10.1 7.8 0.05(oil) 0.1 0.1 0.001 0.3 0.2 0.001
Furnace fans 4.4 3.8 17.6 16.6 12.3 56.6Microwave ovens 1.2 1.0 4.7 1.5 1.1 5.0Pool heaters 0.2 0.1 0.001 0.2 0.1 0.001Refrigerators 4.5 3.9 17.8 13.3 9.8 45.2Room AC 1.2 1.0 4.6 2.6 1.9 8.8Water heaters 7.8 6.5 20.7 15.5 11.6 38.7
(electricity) 5.3 4.5 20.7 11.4 8.4 38.7(gas) 2.6 2.0 0.01 4.1 3.2 0.02
Commercial: Beverage vending machines 0.2 0.2 0.8 0.4 0.3 1.3Boilers 0.3 0.2 0.001 0.6 0.5 0.003Clothes washers 0.5 0.4 0.9 0.7 0.5 1.2
(electricity) 0.2 0.2 0.9 0.3 0.3 1.2(gas) 0.2 0.2 0.001 0.3 0.2 0.002
(water) NA NA NA NA NA NAFluorescent ballasts 1.4 1.2 5.5 4.0 3.0 13.7Fluorescent lamps 17.3 14.8 68.2 20.1 14.8 68.2Incandescent reflector lamps 5.1 4.4 20.2 5.9 4.4 20.2BR \ exempted reflector lamps 2.3 2.0 9.1 2.3 2.0 9.1Liquid-immersed transformers 0.6 0.5 2.5 2.3 1.7 7.9Low volt. dry-type transformers 1.7 1.5 6.8 6.5 4.8 22.0Metal halide lamp fixtures 3.1 2.7 12.3 10.2 7.5 34.5Reach-in refrigerators & freezers 0.5 0.5 2.1 1.7 1.2 5.6Small electric motors 2.5 2.2 10.0 3.7 2.8 12.7Walk-in coolers and freezers 0.4 0.3 1.6 1.0 0.7 3.4
TOTAL 78 66 269 158 118 475 Notes: a The negative values reflect the electricity requirement from incorporating electronic ignition.

Ka-BOOM! The Power of Appliance Standards
For carbon dioxide, we estimate the annual avoided emission at 78 MMT in 2020 and 158 MMT in 2030, or 1.3% and 2.6% of projected U.S. emissions in those years, as show in Figure 7. These emissions reductions are equivalent to that of 31 new coal power plants by 2020 and 63 new coal power plants in 2030 (see Figure 7).22
For nitrogen oxides, we estimate total potential emissions reductions of 66 and 118 thousand metric tons (1000 MT), while for sulfur dioxide we estimate total emissions reductions of 269 and 475 1000 MT.
Figure 7. Emissions Reductions from Existing and Potential Standards in Equivalent Number of Coal Plants
0
50
100
150
200
250
300
2010 2020 2030
Num
ber o
f Equ
ival
ent C
oal P
lant
s' E
mis
sion
s A
void
ed
= 50 Power Plants
96
31
154
63
186
In addition to the overall energy, economic, and emission savings, this analysis shows the relative importance of various pending standards:
The three standards that have the largest potential energy savings through 2030 (in quads) are fluorescent lamps (4.3), water heaters (2.6), and residential furnaces (1.8). These three standards alone offer 36% of the total energy savings potential.
The top ten energy savers through 2030 (in quads) represent 77% (18.4) of the total savings potential.
Five standards — residential central air conditioners and heat pumps (19.4 GW), furnace fans (12 GW),23 fluorescent lamps (8.3 GW), room air conditioners (4.6 GW), and metal halide lamp fixtures (4.2 GW) — offer nearly 75% of the peak demand savings potential.
New standards for home furnaces (186.9 TBtu) and water heaters (76 TBtu) offer the potential for the greatest natural gas savings.
The three standards that offer the largest potential net economic savings ($ billion) are residential clothes washers ($15.6), water heaters ($14.4 billion), and fluorescent lamps ($12.9 billion).
22 See footnote 15 for assumptions. 23 Furnace fans typically also serve as the air handler for central air conditioners, hence the impact on summer peak demand.
22

Ka-BOOM! The Power of Appliance Standards
Although a handful of the pending standards offer the greatest savings, it is important to consider the standards as a package. For example, if DOE were to take the approach used in the 1990s and focus only on the three most important standards, more than 60% of the savings opportunity would be missed. All the standards deserve careful consideration, even those that are relatively small, because they all contribute to the overall goals of improved efficiency, reduced emissions, and economic savings. 4.2 Consumer Economics Above we have reported the national economic impacts for each of the products analyzed. This section illustrates the impacts for typical consumers. Table 9 provides key assumptions concerning the impact of new standards on a product's price (incremental cost) and the annual energy savings. These variables are the basis for determining the cost-effectiveness of new standards for typical purchasers. The last columns in Table 9 report the benefit-cost ratio and average simple payback period for each of the twenty-six products. Below we summarize our key findings:
24 Simple payback periods range from less than a year to 10.4 years, with sixteen new product standards having a payback of less than three years. In other words, for most new standards, energy savings recoup any increase in product cost within three years. But in some cases a longer payback period yields greater energy savings.
In all cases, the projected new standards will save consumers money over the life of the product.
The average, non-discounted payback of improved efficiency for the twenty-six products is 3.1 years.
The average benefit cost-ratio, which is a measure of the incremental cost of an efficient product versus its annual energy bill savings, is 4:1.
The benefit-cost ratios are calculated using a 5% real discount rate. These calculations are based on national average electricity and natural gas prices for 2008 (EIA 2009a, 2009b). For areas with higher than average prices, paybacks will be shorter; where costs are lower, paybacks will be longer. For products whose energy consumption varies with climate (e.g., residential furnaces and boilers, and pool heaters), savings and payback period will vary with climate as well.
24 This would be nineteen if we counted residential electric and natural gas water-heated clothes washers, oil and gas furnaces, and electric and gas water heaters as separate products.
23
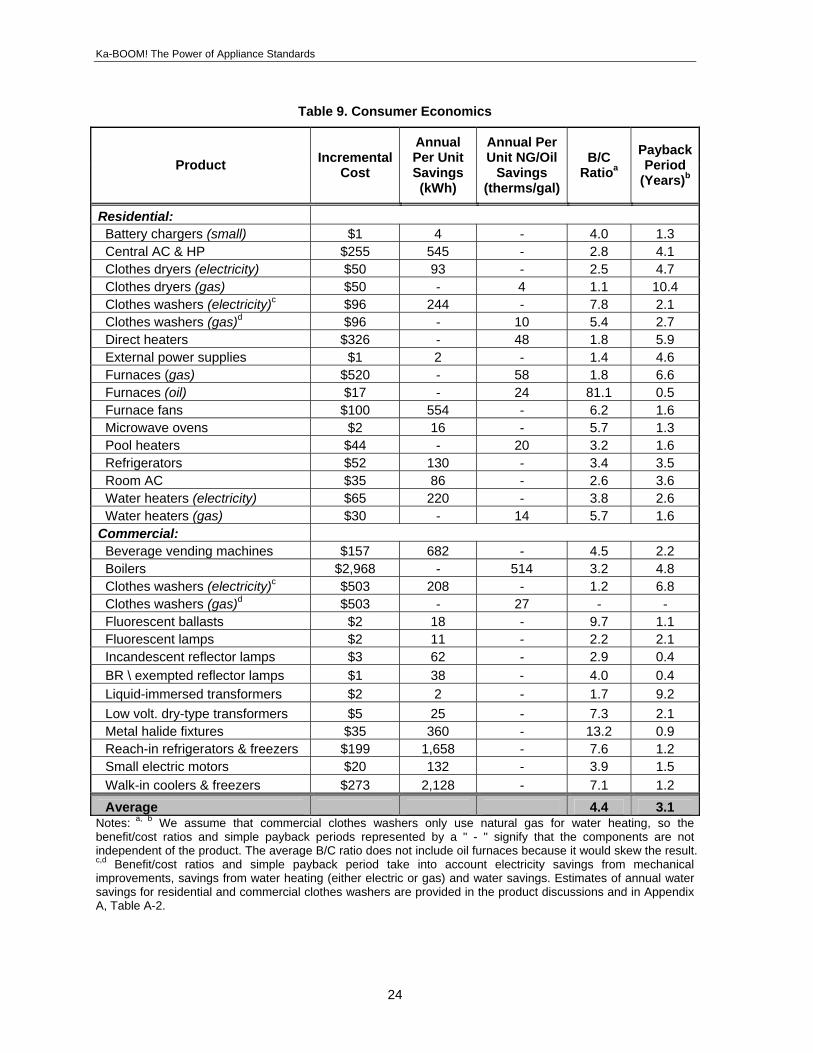
Ka-BOOM! The Power of Appliance Standards
Table 9. Consumer Economics
Annual Per Unit Savings (kWh)
Annual Per Unit NG/Oil
Savings (therms/gal)
Payback Period
(Years)Incremental
Cost B/C
RatioProduct ab
Residential: Battery chargers (small) $1 4 4.0 1.3 - Central AC & HP $255 545 2.8 4.1 - Clothes dryers (electricity) $50 93 2.5 4.7 - Clothes dryers (gas) $50 4 1.1 10.4 - Clothes washers (electricity)c $96 244 7.8 2.1 - Clothes washers (gas)d $96 10 5.4 2.7 - Direct heaters $326 48 1.8 5.9 - External power supplies $1 2 1.4 4.6 - Furnaces (gas) $520 58 1.8 6.6 - Furnaces (oil) $17 24 81.1 0.5 - Furnace fans $100 554 6.2 1.6 - Microwave ovens $2 16 5.7 1.3 - Pool heaters $44 20 3.2 1.6 - Refrigerators $52 130 3.4 3.5 - Room AC $35 86 2.6 3.6 - Water heaters (electricity) $65 220 3.8 2.6 - Water heaters (gas) $30 14 5.7 1.6 -
Commercial: Beverage vending machines $157 682 4.5 2.2 - Boilers $2,968 514 3.2 4.8 - Clothes washers (electricity)c $503 208 1.2 6.8 - Clothes washers (gas)d $503 27 - - - Fluorescent ballasts $2 18 9.7 1.1 - Fluorescent lamps $2 11 2.2 2.1 - Incandescent reflector lamps $3 62 2.9 0.4 - BR \ exempted reflector lamps $1 38 - 4.0 0.4 Liquid-immersed transformers $2 2 1.7 9.2 - Low volt. dry-type transformers $5 25 7.3 2.1 - Metal halide fixtures $35 360 13.2 0.9 - Reach-in refrigerators & freezers $199 1,658 7.6 1.2 - Small electric motors $20 132 3.9 1.5 - Walk-in coolers & freezers $273 2,128 7.1 1.2 -
Average 4.4 3.1 a, bNotes: We assume that commercial clothes washers only use natural gas for water heating, so the
benefit/cost ratios and simple payback periods represented by a " - " signify that the components are not independent of the product. The average B/C ratio does not include oil furnaces because it would skew the result. c,d Benefit/cost ratios and simple payback period take into account electricity savings from mechanical improvements, savings from water heating (either electric or gas) and water savings. Estimates of annual water savings for residential and commercial clothes washers are provided in the product discussions and in Appendix A, Table A-2.
24
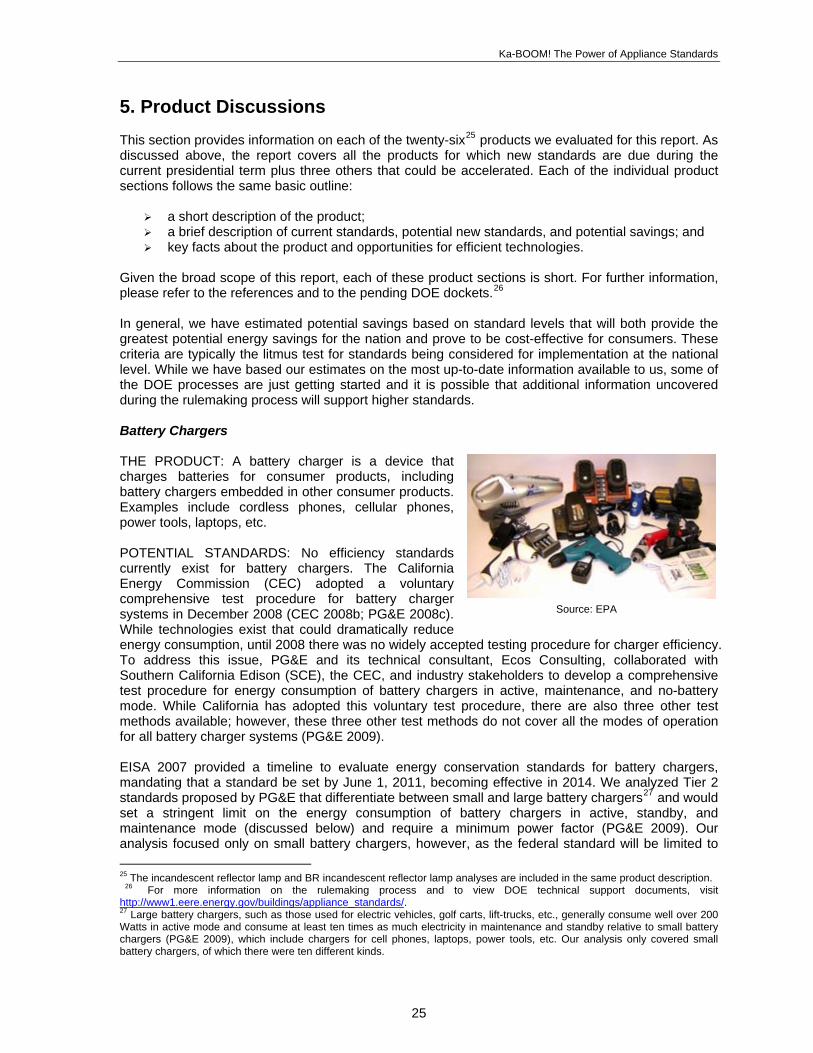
Ka-BOOM! The Power of Appliance Standards
5. Product Discussions
25This section provides information on each of the twenty-six products we evaluated for this report. As discussed above, the report covers all the products for which new standards are due during the current presidential term plus three others that could be accelerated. Each of the individual product sections follows the same basic outline:
a short description of the product; a brief description of current standards, potential new standards, and potential savings; and key facts about the product and opportunities for efficient technologies.
Given the broad scope of this report, each of these product sections is short. For further information, please refer to the references and to the pending DOE dockets.26 In general, we have estimated potential savings based on standard levels that will both provide the greatest potential energy savings for the nation and prove to be cost-effective for consumers. These criteria are typically the litmus test for standards being considered for implementation at the national level. While we have based our estimates on the most up-to-date information available to us, some of the DOE processes are just getting started and it is possible that additional information uncovered during the rulemaking process will support higher standards. Battery Chargers THE PRODUCT: A battery charger is a device that charges batteries for consumer products, including battery chargers embedded in other consumer products. Examples include cordless phones, cellular phones, power tools, laptops, etc.
Source: EPA
POTENTIAL STANDARDS: No efficiency standards currently exist for battery chargers. The California Energy Commission (CEC) adopted a voluntary comprehensive test procedure for battery charger systems in December 2008 (CEC 2008b; PG&E 2008c). While technologies exist that could dramatically reduce energy consumption, until 2008 there was no widely accepted testing procedure for charger efficiency. To address this issue, PG&E and its technical consultant, Ecos Consulting, collaborated with Southern California Edison (SCE), the CEC, and industry stakeholders to develop a comprehensive test procedure for energy consumption of battery chargers in active, maintenance, and no-battery mode. While California has adopted this voluntary test procedure, there are also three other test methods available; however, these three other test methods do not cover all the modes of operation for all battery charger systems (PG&E 2009). EISA 2007 provided a timeline to evaluate energy conservation standards for battery chargers, mandating that a standard be set by June 1, 2011, becoming effective in 2014. We analyzed Tier 2 standards proposed by PG&E that differentiate between small and large battery chargers27 and would set a stringent limit on the energy consumption of battery chargers in active, standby, and maintenance mode (discussed below) and require a minimum power factor (PG&E 2009). Our analysis focused only on small battery chargers, however, as the federal standard will be limited to 25 The incandescent reflector lamp and BR incandescent reflector lamp analyses are included in the same product description.
26 For more information on the rulemaking process and to view DOE technical support documents, visit http://www1.eere.energy.gov/buildings/appliance_standards/. 27 Large battery chargers, such as those used for electric vehicles, golf carts, lift-trucks, etc., generally consume well over 200 Watts in active mode and consume at least ten times as much electricity in maintenance and standby relative to small battery chargers (PG&E 2009), which include chargers for cell phones, laptops, power tools, etc. Our analysis only covered small battery chargers, of which there were ten different kinds.
25

Ka-BOOM! The Power of Appliance Standards
chargers connected to or embedded within "consumer products," which does not include industrial equipment that utilize battery chargers, such as fork lifts.28 We estimate that the proposed Tier 2 standard level would save 127 TWh (about 1.3 quads of primary energy) cumulatively by 2030 and generate $5.8 billion in net present value savings. KEY FACTS: Battery chargers consume almost 42 TWh per year nationally, or around 14% of the total electricity consumption of electronic devices (CEC 2008a). Battery chargers operate in three modes: no-battery, maintenance, and active mode. In no-battery mode, the charger is plugged into the wall but is not connected to a battery. In maintenance mode, the battery is fully charged yet still connected to the charger. In active mode, the battery is in the process of being charged. We estimate that setting standards for no-battery and maintenance mode would reduce per unit electricity consumption by 30%. Again, this ignores the potential savings of chargers in active mode. Active mode efficiency and maintenance mode efficiency are interrelated in battery chargers. There are some essential functions of battery chargers that are carried out in maintenance mode, such as leveling the charge for batteries that have multiple cells, which are similar to active mode functions. Improving the efficiency of battery chargers in maintenance mode will therefore have an impact on the energy consumed in active mode. Before standards are set for active mode energy consumption, it is important that the interaction effects of chargers in maintenance and active mode are better understood and clearly represented by some sort of efficiency metric. As mentioned above, California has developed metrics for estimating energy use in active mode and is considering standards based on those metrics for products outside the scope of the federal rulemaking. DOE will be analyzing active mode efficiency in the pending rulemaking, which will allow new federal standards to cover active mode if warranted. Commercial Boilers
Source: AERCO
THE PRODUCT: Commercial boilers are used to heat commercial and multifamily residential buildings. Boilers heat water using fuel inputs (principally natural gas or oil) and generate either hot water or steam. The heated water or steam is circulated through radiators, baseboard units, or fan coils. Commercial boilers are also used in some industrial process applications. Boilers used in commercial or multifamily applications have an input of 300,000 Btu/h (British thermal units per hour) or more.29 THE STANDARD: In 2005, efficiency advocacy organizations (including ASAP, ACEEE, NRDC, and the Alliance to Save Energy) negotiated an agreement with the commercial boiler manufacturers calling for new ASHRAE boiler standards. ASHRAE finalized adoption of those recommended new levels in 2007, triggering a DOE rulemaking. The present federal standard, finalized in 1992 and effective in 1994, calls for a combustion efficiency of 80% for gas-fired boilers and 83% for oil-fired boilers. However, combustion efficiency is not a good efficiency descriptor as it only accounts for combustion inefficiencies and does not account for thermal inefficiencies such as heat radiated from the warm boiler. A better efficiency metric is thermal efficiency, which measures the heat contained in the water or steam as it leaves the boiler relative to the heat content of the fuel
28 Whether or not to include golf carts is a consumer product is currently the subject of debate. 29 It is fairly common in relatively small installations to "gang" multiple residential condensing boilers as an alternative to a commercial boiler. See footnote 30 for more on condensing furnaces.
26

Ka-BOOM! The Power of Appliance Standards
that is burned. Typically, the thermal efficiency of a boiler will be 2-3% less than its combustion efficiency. ASHRAE 90.1-2007 included a revised standard for commercial boilers, based upon the joint recommendation negotiated by the commercial boiler makers and efficiency advocates. The new ASHRAE standard changes the efficiency metric from combustion efficiency to thermal efficiency, requiring 80% thermal efficiency for gas-fired boilers and 82% thermal efficiency for oil-fired boilers. Whenever ASHRAE standard 90.1 is amended, DOE must consider amending the existing federal energy conservation standard for each type of equipment listed. DOE has tentatively concluded that the new ASHRAE standard meets the requirements necessary for federal adoption. If DOE adopts the ASHRAE levels, the new standard must be issued by July 2009; if DOE elects to investigate higher standards, a final new standard is due in July 2010. ASAP has recommended that DOE adopt the ASHRAE levels. New national standards based on the revised ASHRAE levels would save 103 billion cubic feet (Bcf) (103 TBtu) of natural gas cumulatively by 2030 and generate about $770 million in net present value savings. Greater savings could be realized by using gas-fired condensing boiler(s) 30 with low-temperature distribution and optimizing controls. This technological advance saves 40% (hot water) – 70% (steam) relative to non-condensing systems with minimum 140oF return water temperature. KEY FACTS: Almost 38% of commercial end-use energy consumption is dedicated to space heating, while about 60% of all commercial space heating uses natural gas as the primary fuel source (EIA 2008b). Fuel oil, on the other hand, is consumed for only 9% of space heating in commercial buildings, though this figure is much higher in certain sections of the country where the building stock is older, such as the Northeast. And because oil is an unregulated fuel in these areas and not addressed through ratepayer-funded energy efficiency programs, the need for standards is even more acute. According to the April 2005 edition of the Institute of Boiler and Radiation Manufacturers Ratings for Commercial Boilers, 23 out of 25 manufacturers listed have products that meet the proposed standard levels already. Of the boilers with thermal efficiency data, about half the products meet our proposed standards. A recent analysis prepared by ACEEE indicates that the energy cost savings with such a standard are more than three times greater than the costs, with a simple payback period of fewer than five years (Nadel 2005). Many utilities provide incentives for high efficiency boilers, but for higher thermal efficiencies than we analyze here. For example, California utilities estimate a base case thermal efficiency for gas-fired boilers of 80% and are providing incentives for units with a thermal efficiency of 83% (Nadel 2005; SCG 2006). Commercial Clothes Washers
Source: Maytag
THE PRODUCT: Commercial clothes washers (CCWs) are defined in EPAct 2005 as soft-mount, front-loading or soft-mount, top-loading washers, and have a clothes container compartment that is not more than 3.5 cubic feet for horizontal-axis clothes washers and not more than 4.0 cubic feet for vertical-axis clothes washers. EPAct 2005 also defines CCWs as products designed for applications in which the occupants of more than one household will be using the clothes washer, such as multi-family housing common areas, coin laundries, or other commercial applications (DOE 2008c). THE STANDARD: Standards for commercial soft-mount clothes washers (similar to residential machines) were set in the EPAct 2005 and took effect January 2007. There is no federal or state standard for hard-mount clothes washers. The energy standard (1.26 modified
30 A condensing heat exchanger is an addition that recaptures latent heat from excess water vapor, vastly improving the overall efficiency of the boiler.
27

Ka-BOOM! The Power of Appliance Standards
energy factor, or MEF) is the same as the current residential clothes washer standard, but the commercial standard also requires a maximum 9.5 water factor (WF).31 DOE is required to complete a revised standard by January 1, 2010.32 ASAP and ACEEE have recommended that the new federal standard apply to all commercial clothes washers, regardless of whether clothes are loaded from the machine’s top or front. A standard set at the 2007 Energy Star efficiency levels (1.72 MEF and 8.0 WF) would save 6 TWh and 77 Bcf of natural gas (for a total of about .14 quads of primary energy) cumulatively by 2030 and generate about $240 million in net present value savings. In addition, we estimate that such a standard would save about 13 billion gallons of water annually by 2030. Substantially more stringent standards are likely to be cost-effective and produce even larger savings. KEY FACTS: We estimate that a standard set at 2007 Energy Star efficiency levels would save between 20 and 30 percent of energy consumption relative to the current federal standard, while water savings would reach 15%. There are 2 to 3 million commercial washers in the United States, which are replaced at a rate of about 10% per year. The vast majority of new commercial washer sales are top-loading (~80%). Improving the efficiency of CCWs can be achieved by incorporating several different technologies, such as advanced agitation concepts, direct-drive motor, improved water extraction, low-standby-power electronic controls, and spray rinse technologies. Direct Heaters THE PRODUCT: Direct heating equipment are small heaters that are located in the space to be heated and can be either permanently installed or portable. Common names for this equipment include space heaters, wall heaters, floor heaters, and room heaters. They are predominantly fired with natural gas or propane — some require electricity for certain operations like fan motors or electrical vent dampers — and only these units are covered by federal standards.
Source: Empire
THE STANDARD: Several states historically regulated direct heating equipment, leading to federal standards established in 1987. The standard varies as a function of unit type (wall, floor, and room heaters), the presence or absence of a fan, and heating capacity. Depending on the category, the required minimum efficiency varies from 57% Annual Fuel Utilization Efficiency (AFUE) for a small floor unit to 74% AFUE for a large, fan-assisted wall unit. These standards took effect in 1990. For the purpose of our analysis, we focus on room heaters as they are the most commonly sold type of direct heating unit. In November 2006, DOE began a rulemaking to revise this standard, and in January 2009 it released a preliminary technical support document (TSD). The preliminary TSD identified several different potential efficiency levels for direct heaters. We estimated standards set at the minimum lifecycle cost level identified in the DOE analysis, which would require an AFUE of 78%. This standard incorporates electronic ignition into the engineering analysis, an element not included in the lower efficiency levels.33 The rulemaking is scheduled to be completed in April 2010 and will take effect three years later. We estimate this new standard would save 189 Bcf of natural gas (about .16 quads of primary
31 Under EISA, a 9.5 water factor takes effect for residential clothes washers in 2011, and DOE will evaluate stronger water factor standards in the pending residential clothes washer rulemaking. 32 The DOE regulatory process as been marked by several major shifts, and the outcome is uncertain as of this writing. In the 2007 ANOPR, DOE evaluated CCWs as a single product class. However, in the 2008 NOPR, DOE established two product classes (top- and front-loading washers, respectively) and proposed separate standards for each, with substantially weaker standards proposed for top-loaders. ASAP, ACEEE, and others protested this approach, and, citing other serious flaws in the supporting analysis, urged DOE to withdraw the CCW NOPR and reissue a revised NOPR in time to issue a final rule by the statutory deadline of January 1, 2010. On March 31, 2009, DOE agreed to defer final action on the CCW standard, while committing to meet the statutory 2010 deadline for the final rule. 33 DOE also analyzed savings for units capable of recovering waste heat through a condensing process, which could improve the AFUE to 93%, but this technology is unlikely to be adopted as a minimum standard.
28

Ka-BOOM! The Power of Appliance Standards
energy, taking into account the increase in electricity consumption from electronic ignition) cumulatively by 2030 and generate about $650 million in net present value savings. KEY FACTS: Baseline direct heating units generally consume 200–300 therms annually, depending on the type of unit, and efficiency gains can reach as high as 30% between the baseline and the maximum available technology. Manufacturers improve the AFUE of direct heating equipment primarily through improvements in the heat exchanger design, though the DOE has identified a dozen other technology options that can also improve efficiency. These improvements include, but are not limited to: electronic ignition (part of the proposed standard), improved fan or blower motor efficiency, thermal or electric vent damper, and induced draft (DOE 2009b). External Power Supplies THE PRODUCT: External power supplies are the small black boxes attached to the cord of many small or portable electronic appliances such as cordless phones, cell phones, computer speakers, telephone answering machines, and laptop computers. Power supplies convert AC supply voltage (around 120 volts in the United States) to lower AC or DC voltages on which many electronic products operate.
Source: Ecos Consulting
POTENTIAL STANDARD: Congress enacted the current standard for external power supplies in 2007, which became effective in 2008, reducing the maximum standby (no-load) consumption for all output wattages to 0.5 W. The minimum efficiency required during active mode varies depending on nameplate output, with devices supplying greater than 51 Watts required to achieve 85% efficiency (DOE 2009e). A revised federal standard is due by July 1, 2011. A standard based on the current ENERGY STAR Version 2.0 specification would increase the required efficiency for power supplies in both active and standby mode. We estimate that this standard would save 30 TWh (about .3 quads of primary energy) cumulatively by 2030 and generate about $540 million in net present value savings. DOE must also consider extending standards to types of power supplies not covered by current standards, which could further increase savings. KEY FACTS: More efficient power supplies typically use electronic rather than magnetic components and can be 90% efficient in active mode and have standby (no-load) power levels of less than 1 Watt. In general, power supplies now use electronic technology. The ENERGY STAR Version 2.0 specification increases the minimum efficiency during active mode, which varies depending on the mode's output power as well as the voltage (AC-AC versus AC-DC). For devices supplying > 49 Watts, the minimum efficiency requirement is 87% for standard models and 86% for low voltage models. For devices that supply ≤ 49 watts, the minimum efficiency is determined by an equation that factors in the output power.34 The ENERGY STAR Version 2.0 specification also decreased the maximum standby (no-load) consumption of AC-DC devices to ≤ 0.3 Watts for those supplying up to 50 Watts of output power. Otherwise, all external power supplies are required to have a maximum standby mode consumption of ≤ 0.5 Watts. These efficiency requirements can decrease annual per unit consumption by 30% relative to the current standard. Fluorescent Ballasts THE PRODUCT: Ballasts are components in every fluorescent lamp system that adjust the incoming electricity to allow the lamp to work properly. The ballast provides the high voltage required to start the lamps and then limits the current to a safe value (DOE 2000). About two-thirds of all ballasts currently sold use standard modern electronic technology while one-third still rely on out-dated, energy-wasting magnetic technology. 34 For more information, visit: http://www.energystar.gov/ia/partners/product_specs/program_reqs/EPS_Eligibility_Criteria.pdf.
29

Ka-BOOM! The Power of Appliance Standards
POTENTIAL STANDARD: Efficiency requirements for T12 fluorescent ballasts were enacted by Congress in 1990 and revised by DOE in 2000. The F40T12 and F96T12 are the only ballasts that are currently regulated by federal standards. Under the 2000 rule, magnetic ballasts are prohibited on new fluorescent fixtures manufactured after July 1, 2005 and banned completely after July 1, 2010. DOE is required to issue a new standard in 2011, which will become effective in 2014. EISA 2007 also directed the DOE to amend its test procedure to incorporate a measure of standby mode and off mode energy consumption by March 31, 2009. A new federal standard requiring an increase in ballast efficiency that could only be met by extra-efficient, instant-start (IS) electronic ballasts and which can only use more efficient T8 lamps (see discussion on fluorescent lamps) would effectively eliminate the less efficient T8 and T12 lamps and ballasts from the market. We estimate this standard would save 46 TWh (about .5 quads of primary energy) cumulatively by 2030 and generate about $3 billion in net present value savings. These savings are from efficiency improvements to ballasts only and do not include lamp savings.
Source: Wikipedia
KEY FACTS: The efficiency of fluorescent ballasts is measured by the Ballast Efficacy Factor (BEF), which measures the efficacy — another way to describe efficiency when the input and output have different units of measure — of the entire system, i.e., the combination of the ballast and its lamp. However, there is interest in moving towards another metric for evaluating ballast efficiency as the BEF varies depending on the number of lamps that are controlled, which can range between one and four, making efficiency comparisons across configurations difficult. In commercial and industrial buildings, the most common fixture in the market is four feet long, although eight-foot fixtures still retain a significant market share. The market share of four-foot fixtures is increasing and most of these fixtures already use T8 lamps with electronic ballasts (PG&E 2008a), which are more efficient than energy-efficient magnetic ballasts in transforming input power to lamp requirements. As estimated above, extra-efficient IS electronic ballasts can reduce ballast energy consumption by 11%. Fluorescent Lamps
Source: Germes Online
THE PRODUCT: Fluorescent lamps have a low pressure mercury electric-discharge source in which a fluorescing coating transforms some of the ultraviolet energy generated by the mercury discharge into light. Fluorescent lamps are manufactured in a variety of shapes (straight- or U-shaped) and types (rapid start and instant start). General service fluorescent lamps are those lamps that satisfy the majority of fluorescent applications, except for some specific lighting applications, such as lamps used in horticulture, cold temperature installations, and others (DOE 2009b).35 For the purposes of our analysis, we assumed four baseline lamps, three for the commercial sector and one for the residential sector. The three most common fluorescent lamps in the commercial sector are the 40W and 34W T12 lamps, and the T8 32 W lamp. The most common fluorescent lamp in the residential sector is the T12 40W lamp. POTENTIAL STANDARD: Initial standards for fluorescent lamps were enacted by Congress in the Energy Policy Act of 1992, building on standards developed by states. The standards cover most four- and eight-foot long fluorescent tubes. The standards essentially ban halophosphor (e.g., cool
35 For more information, see the Advanced Notice of Proposed Rulemaking Technical Support Document, chapter 3, p 3-3
30
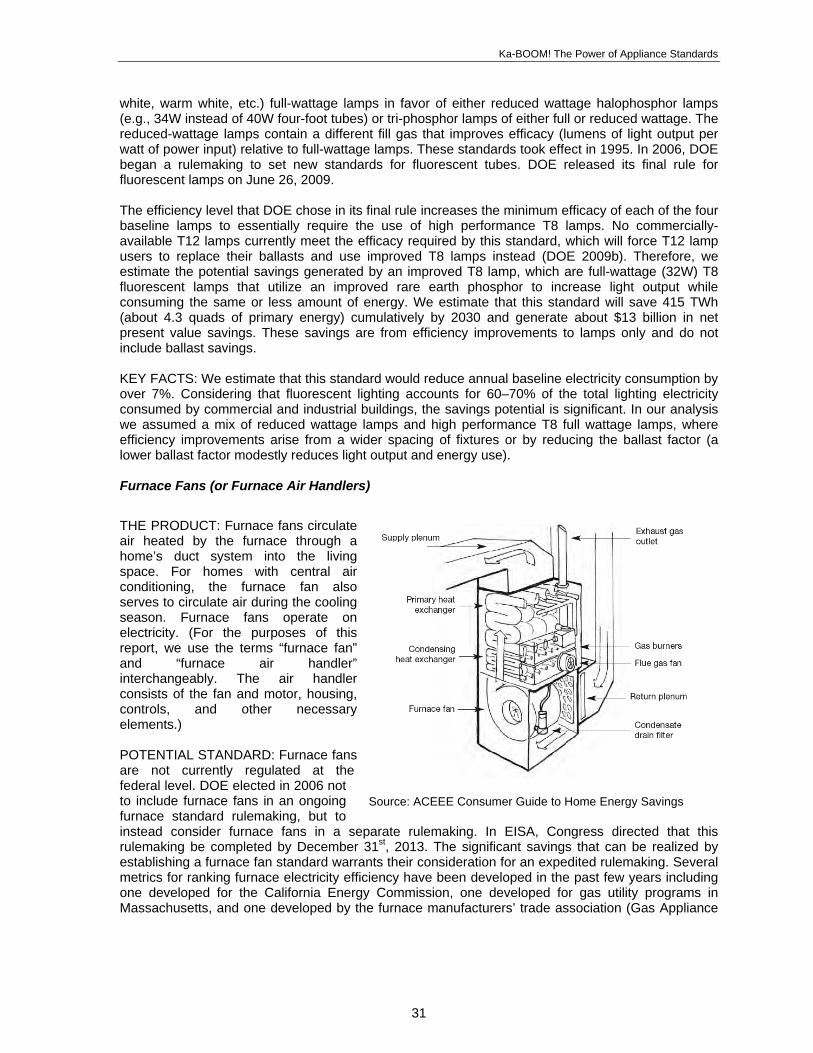
Ka-BOOM! The Power of Appliance Standards
white, warm white, etc.) full-wattage lamps in favor of either reduced wattage halophosphor lamps (e.g., 34W instead of 40W four-foot tubes) or tri-phosphor lamps of either full or reduced wattage. The reduced-wattage lamps contain a different fill gas that improves efficacy (lumens of light output per watt of power input) relative to full-wattage lamps. These standards took effect in 1995. In 2006, DOE began a rulemaking to set new standards for fluorescent tubes. DOE released its final rule for fluorescent lamps on June 26, 2009. The efficiency level that DOE chose in its final rule increases the minimum efficacy of each of the four baseline lamps to essentially require the use of high performance T8 lamps. No commercially-available T12 lamps currently meet the efficacy required by this standard, which will force T12 lamp users to replace their ballasts and use improved T8 lamps instead (DOE 2009b). Therefore, we estimate the potential savings generated by an improved T8 lamp, which are full-wattage (32W) T8 fluorescent lamps that utilize an improved rare earth phosphor to increase light output while consuming the same or less amount of energy. We estimate that this standard will save 415 TWh (about 4.3 quads of primary energy) cumulatively by 2030 and generate about $13 billion in net present value savings. These savings are from efficiency improvements to lamps only and do not include ballast savings. KEY FACTS: We estimate that this standard would reduce annual baseline electricity consumption by over 7%. Considering that fluorescent lighting accounts for 60–70% of the total lighting electricity consumed by commercial and industrial buildings, the savings potential is significant. In our analysis we assumed a mix of reduced wattage lamps and high performance T8 full wattage lamps, where efficiency improvements arise from a wider spacing of fixtures or by reducing the ballast factor (a lower ballast factor modestly reduces light output and energy use). Furnace Fans (or Furnace Air Handlers)
Source: ACEEE Consumer Guide to Home Energy Savings
THE PRODUCT: Furnace fans circulate air heated by the furnace through a home’s duct system into the living space. For homes with central air conditioning, the furnace fan also serves to circulate air during the cooling season. Furnace fans operate on electricity. (For the purposes of this report, we use the terms “furnace fan” and “furnace air handler” interchangeably. The air handler consists of the fan and motor, housing, controls, and other necessary elements.) POTENTIAL STANDARD: Furnace fans are not currently regulated at the federal level. DOE elected in 2006 not to include furnace fans in an ongoing furnace standard rulemaking, but to instead consider furnace fans in a separate rulemaking. In EISA, Congress directed that this rulemaking be completed by December 31st, 2013. The significant savings that can be realized by establishing a furnace fan standard warrants their consideration for an expedited rulemaking. Several metrics for ranking furnace electricity efficiency have been developed in the past few years including one developed for the California Energy Commission, one developed for gas utility programs in Massachusetts, and one developed by the furnace manufacturers’ trade association (Gas Appliance
31
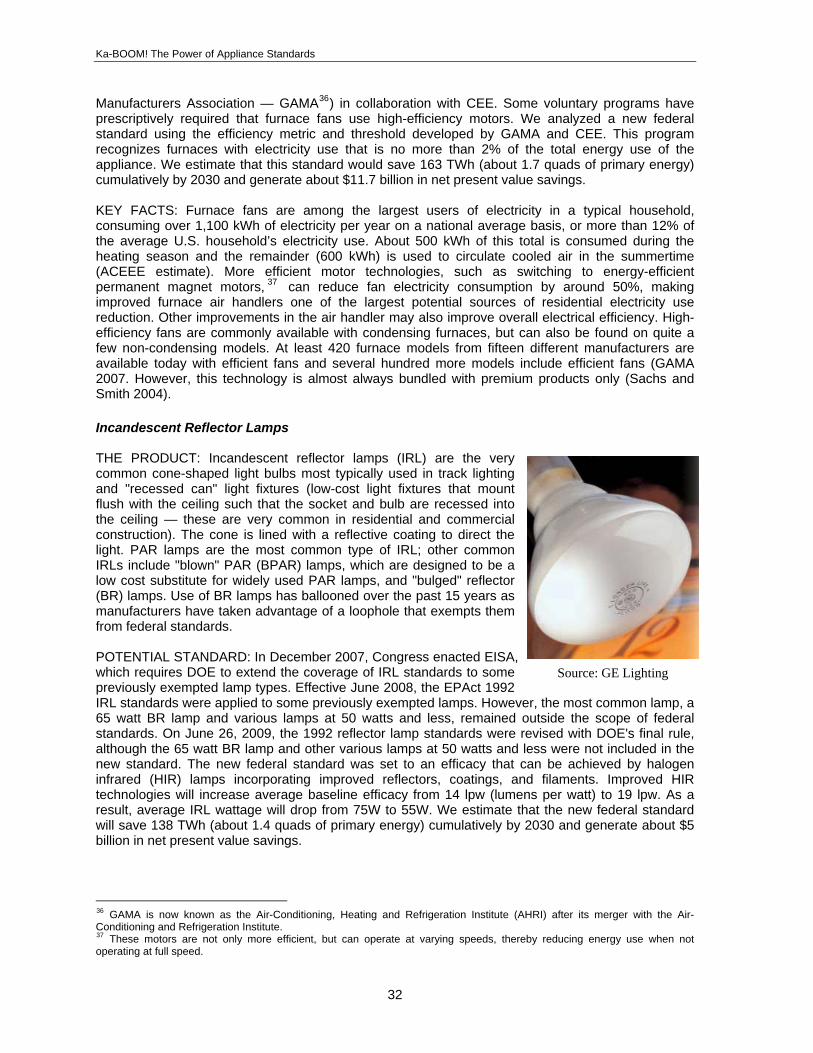
Ka-BOOM! The Power of Appliance Standards
36Manufacturers Association — GAMA ) in collaboration with CEE. Some voluntary programs have prescriptively required that furnace fans use high-efficiency motors. We analyzed a new federal standard using the efficiency metric and threshold developed by GAMA and CEE. This program recognizes furnaces with electricity use that is no more than 2% of the total energy use of the appliance. We estimate that this standard would save 163 TWh (about 1.7 quads of primary energy) cumulatively by 2030 and generate about $11.7 billion in net present value savings. KEY FACTS: Furnace fans are among the largest users of electricity in a typical household, consuming over 1,100 kWh of electricity per year on a national average basis, or more than 12% of the average U.S. household’s electricity use. About 500 kWh of this total is consumed during the heating season and the remainder (600 kWh) is used to circulate cooled air in the summertime (ACEEE estimate). More efficient motor technologies, such as switching to energy-efficient permanent magnet motors, 37 can reduce fan electricity consumption by around 50%, making improved furnace air handlers one of the largest potential sources of residential electricity use reduction. Other improvements in the air handler may also improve overall electrical efficiency. High-efficiency fans are commonly available with condensing furnaces, but can also be found on quite a few non-condensing models. At least 420 furnace models from fifteen different manufacturers are available today with efficient fans and several hundred more models include efficient fans (GAMA 2007. However, this technology is almost always bundled with premium products only (Sachs and Smith 2004). Incandescent Reflector Lamps THE PRODUCT: Incandescent reflector lamps (IRL) are the very common cone-shaped light bulbs most typically used in track lighting and "recessed can" light fixtures (low-cost light fixtures that mount flush with the ceiling such that the socket and bulb are recessed into the ceiling — these are very common in residential and commercial construction). The cone is lined with a reflective coating to direct the light. PAR lamps are the most common type of IRL; other common IRLs include "blown" PAR (BPAR) lamps, which are designed to be a low cost substitute for widely used PAR lamps, and "bulged" reflector (BR) lamps. Use of BR lamps has ballooned over the past 15 years as manufacturers have taken advantage of a loophole that exempts them from federal standards.
Source: GE Lighting
POTENTIAL STANDARD: In December 2007, Congress enacted EISA, which requires DOE to extend the coverage of IRL standards to some previously exempted lamp types. Effective June 2008, the EPAct 1992 IRL standards were applied to some previously exempted lamps. However, the most common lamp, a 65 watt BR lamp and various lamps at 50 watts and less, remained outside the scope of federal standards. On June 26, 2009, the 1992 reflector lamp standards were revised with DOE's final rule, although the 65 watt BR lamp and other various lamps at 50 watts and less were not included in the new standard. The new federal standard was set to an efficacy that can be achieved by halogen infrared (HIR) lamps incorporating improved reflectors, coatings, and filaments. Improved HIR technologies will increase average baseline efficacy from 14 lpw (lumens per watt) to 19 lpw. As a result, average IRL wattage will drop from 75W to 55W. We estimate that the new federal standard will save 138 TWh (about 1.4 quads of primary energy) cumulatively by 2030 and generate about $5 billion in net present value savings.
36 GAMA is now known as the Air-Conditioning, Heating and Refrigeration Institute (AHRI) after its merger with the Air-Conditioning and Refrigeration Institute. 37 These motors are not only more efficient, but can operate at varying speeds, thereby reducing energy use when not operating at full speed.
32

Ka-BOOM! The Power of Appliance Standards
Additional savings will come from extending the scope of the standard to cover the still-exempted lamps (e.g., the 65 watt BR lamps and lamps below 50 watts). Initially, DOE determined that it could not set standards for these lamps because they were exempted when EISA extended coverage of the EPAct 1992 standards. DOE recently reversed its view on these exemptions and plans to conduct a rulemaking to examine the additional savings that could be realized from implementing standards on the exempted IRLs. Although a final rule date has not yet been set, bills in the House and Senate have targeted January 1, 2013 as the effective date, a date that the National Electrical Manufacturers Association (NEMA) has agreed to. We estimate that improved halogen technologies applied to the exempted lamps could save 59 TWh (about .7 quads of primary energy) cumulatively by 2030 and generate $3.2 billion in net present value savings. KEY FACTS: Like other incandescent lamps, HIR lamps utilize a tungsten filament, but instead the filament is surrounded by a capsule filled with a halogen gas while the glass is coated with a material that reflects infrared light. Introducing a halogen gas and an infrared coating to an IRL increases the efficacy of the bulb in several ways. By reflecting radiant energy, or heat, back onto the filament, the operating temperature increases, resulting in higher light output from a given wattage. Meanwhile, the halogen gas increases the longevity of the filament by introducing a regenerative cycle, where the evaporated tungsten from the heated filament combines with the halogen gas to make a gaseous compound, which allows the tungsten to be re-deposited when the compound comes back into contact with the filament. Improved coatings, reflectors, and filaments can further increase HIR lamp efficacy and decrease annual electricity consumption of IRLs by more than 30%. Liquid Immersed Transformers THE PRODUCT: Distribution transformers include the metal boxes found in subdivisions and cylinders found on utility poles across the nation that serve the important function of reducing the voltage of electricity so that it can be used by customers in their homes and businesses. They are also commonly used in industrial facilities. Utilities own and operate the transformers on their systems including those seen on utility poles and cement pads. Utility-owned transformers are typically "liquid-immersed"-type equipment, where liquid-immersed refers to the type of insulation medium. Liquid-immersed distribution transformers use oil as a coolant and are generally used outdoors, unlike the dry-type transformers discussed below that are generally used indoors.
Source: Wikipedia
THE STANDARD: On October 12, 2007, DOE finalized standards for liquid-immersed transformers that will become effective on January 1, 2010. While the standard improved upon an initial proposal issued the year before, it fell short of the levels endorsed both by the utility industry, represented by the Edison Electric Institute (EEI) and the American Public Power Association (APPA), and energy efficiency and environmental groups. The initial standards proposed in August 2006 would have saved 238 TWh over 29 years, while the higher standards recommended by utilities would have saved an additional 130 TWh. Although the final standard improved upon the initial proposal, the difference between the standards endorsed by these groups and those introduced by DOE would have saved another 48 TWh over 29 years. An updated standard is due by 2015, but could be considered sooner as a result of litigation by state and environmental groups over the 2007 final rule or if the Obama administration decides to accelerate the rule. As of the date of this report, no settlement has been reached in the litigation over the 2007 final rule. Regardless, we assume that a new standard — due to the large potential savings — will be completed by January 2013, effective 2016. Taking into account improvements required by the 2007 standard and using the EEI and APPA recommendation as the new standard (equivalent to trial standard level 4 from the DOE TSD), we estimate potential savings of 23 TWh (about .2 quads of
33
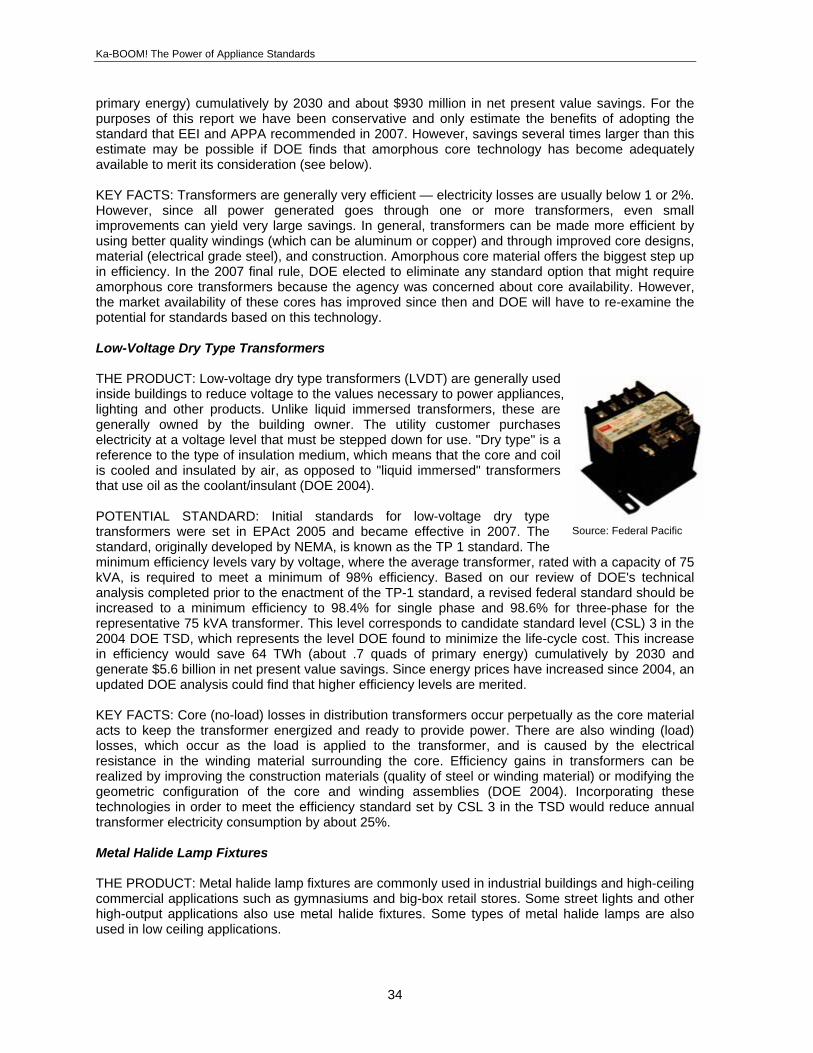
Ka-BOOM! The Power of Appliance Standards
primary energy) cumulatively by 2030 and about $930 million in net present value savings. For the purposes of this report we have been conservative and only estimate the benefits of adopting the standard that EEI and APPA recommended in 2007. However, savings several times larger than this estimate may be possible if DOE finds that amorphous core technology has become adequately available to merit its consideration (see below). KEY FACTS: Transformers are generally very efficient — electricity losses are usually below 1 or 2%. However, since all power generated goes through one or more transformers, even small improvements can yield very large savings. In general, transformers can be made more efficient by using better quality windings (which can be aluminum or copper) and through improved core designs, material (electrical grade steel), and construction. Amorphous core material offers the biggest step up in efficiency. In the 2007 final rule, DOE elected to eliminate any standard option that might require amorphous core transformers because the agency was concerned about core availability. However, the market availability of these cores has improved since then and DOE will have to re-examine the potential for standards based on this technology. Low-Voltage Dry Type Transformers
Source: Federal Pacific
THE PRODUCT: Low-voltage dry type transformers (LVDT) are generally used inside buildings to reduce voltage to the values necessary to power appliances, lighting and other products. Unlike liquid immersed transformers, these are generally owned by the building owner. The utility customer purchases electricity at a voltage level that must be stepped down for use. "Dry type" is a reference to the type of insulation medium, which means that the core and coil is cooled and insulated by air, as opposed to "liquid immersed" transformers that use oil as the coolant/insulant (DOE 2004). POTENTIAL STANDARD: Initial standards for low-voltage dry type transformers were set in EPAct 2005 and became effective in 2007. The standard, originally developed by NEMA, is known as the TP 1 standard. The minimum efficiency levels vary by voltage, where the average transformer, rated with a capacity of 75 kVA, is required to meet a minimum of 98% efficiency. Based on our review of DOE's technical analysis completed prior to the enactment of the TP-1 standard, a revised federal standard should be increased to a minimum efficiency to 98.4% for single phase and 98.6% for three-phase for the representative 75 kVA transformer. This level corresponds to candidate standard level (CSL) 3 in the 2004 DOE TSD, which represents the level DOE found to minimize the life-cycle cost. This increase in efficiency would save 64 TWh (about .7 quads of primary energy) cumulatively by 2030 and generate $5.6 billion in net present value savings. Since energy prices have increased since 2004, an updated DOE analysis could find that higher efficiency levels are merited. KEY FACTS: Core (no-load) losses in distribution transformers occur perpetually as the core material acts to keep the transformer energized and ready to provide power. There are also winding (load) losses, which occur as the load is applied to the transformer, and is caused by the electrical resistance in the winding material surrounding the core. Efficiency gains in transformers can be realized by improving the construction materials (quality of steel or winding material) or modifying the geometric configuration of the core and winding assemblies (DOE 2004). Incorporating these technologies in order to meet the efficiency standard set by CSL 3 in the TSD would reduce annual transformer electricity consumption by about 25%. Metal Halide Lamp Fixtures THE PRODUCT: Metal halide lamp fixtures are commonly used in industrial buildings and high-ceiling commercial applications such as gymnasiums and big-box retail stores. Some street lights and other high-output applications also use metal halide fixtures. Some types of metal halide lamps are also used in low ceiling applications.
34
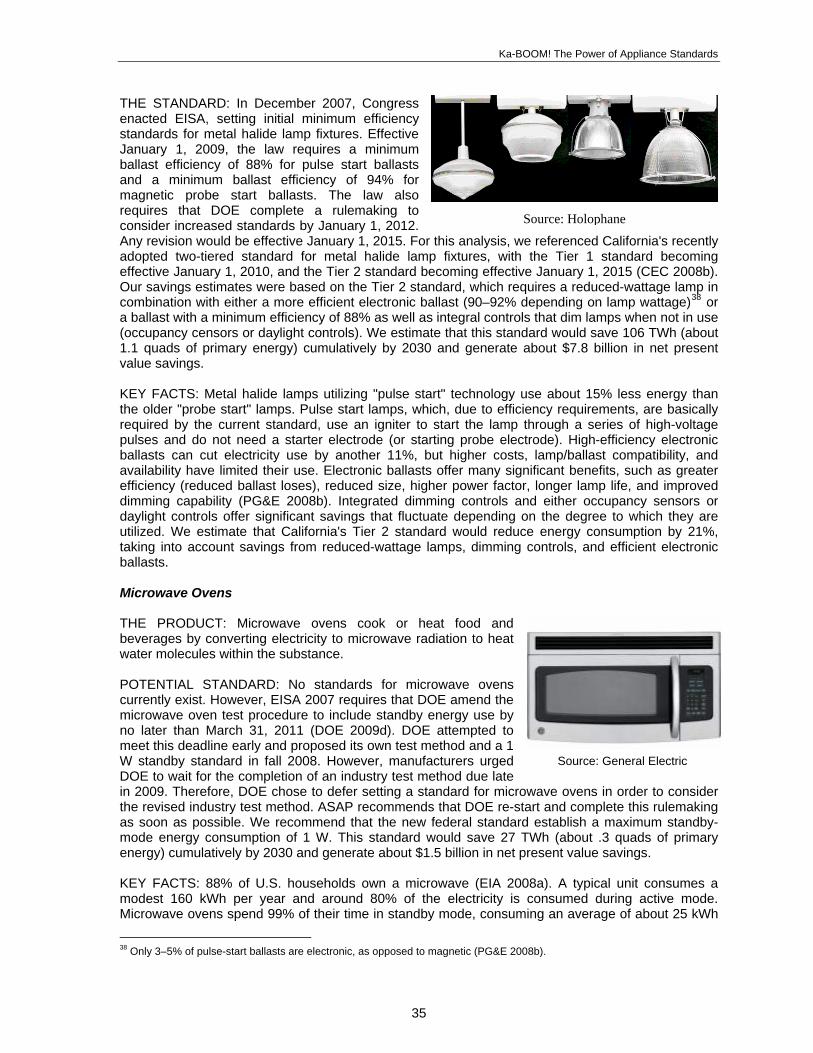
Ka-BOOM! The Power of Appliance Standards
THE STANDARD: In December 2007, Congress enacted EISA, setting initial minimum efficiency standards for metal halide lamp fixtures. Effective January 1, 2009, the law requires a minimum ballast efficiency of 88% for pulse start ballasts and a minimum ballast efficiency of 94% for magnetic probe start ballasts. The law also requires that DOE complete a rulemaking to consider increased standards by January 1, 2012. Any revision would be effective January 1, 2015. For this analysis, we referenced California's recently adopted two-tiered standard for metal halide lamp fixtures, with the Tier 1 standard becoming effective January 1, 2010, and the Tier 2 standard becoming effective January 1, 2015 (CEC 2008b). Our savings estimates were based on the Tier 2 standard, which requires a reduced-wattage lamp in combination with either a more efficient electronic ballast (90–92% depending on lamp wattage)
Source: Holophane
38 or a ballast with a minimum efficiency of 88% as well as integral controls that dim lamps when not in use (occupancy censors or daylight controls). We estimate that this standard would save 106 TWh (about 1.1 quads of primary energy) cumulatively by 2030 and generate about $7.8 billion in net present value savings. KEY FACTS: Metal halide lamps utilizing "pulse start" technology use about 15% less energy than the older "probe start" lamps. Pulse start lamps, which, due to efficiency requirements, are basically required by the current standard, use an igniter to start the lamp through a series of high-voltage pulses and do not need a starter electrode (or starting probe electrode). High-efficiency electronic ballasts can cut electricity use by another 11%, but higher costs, lamp/ballast compatibility, and availability have limited their use. Electronic ballasts offer many significant benefits, such as greater efficiency (reduced ballast loses), reduced size, higher power factor, longer lamp life, and improved dimming capability (PG&E 2008b). Integrated dimming controls and either occupancy sensors or daylight controls offer significant savings that fluctuate depending on the degree to which they are utilized. We estimate that California's Tier 2 standard would reduce energy consumption by 21%, taking into account savings from reduced-wattage lamps, dimming controls, and efficient electronic ballasts. Microwave Ovens THE PRODUCT: Microwave ovens cook or heat food and beverages by converting electricity to microwave radiation to heat water molecules within the substance.
Source: General Electric
POTENTIAL STANDARD: No standards for microwave ovens currently exist. However, EISA 2007 requires that DOE amend the microwave oven test procedure to include standby energy use by no later than March 31, 2011 (DOE 2009d). DOE attempted to meet this deadline early and proposed its own test method and a 1 W standby standard in fall 2008. However, manufacturers urged DOE to wait for the completion of an industry test method due late in 2009. Therefore, DOE chose to defer setting a standard for microwave ovens in order to consider the revised industry test method. ASAP recommends that DOE re-start and complete this rulemaking as soon as possible. We recommend that the new federal standard establish a maximum standby-mode energy consumption of 1 W. This standard would save 27 TWh (about .3 quads of primary energy) cumulatively by 2030 and generate about $1.5 billion in net present value savings. KEY FACTS: 88% of U.S. households own a microwave (EIA 2008a). A typical unit consumes a modest 160 kWh per year and around 80% of the electricity is consumed during active mode. Microwave ovens spend 99% of their time in standby mode, consuming an average of about 25 kWh
38 Only 3–5% of pulse-start ballasts are electronic, as opposed to magnetic (PG&E 2008b).
35

Ka-BOOM! The Power of Appliance Standards
39annually. A maximum standby power level of 1 W would decrease standby mode consumption by 35%.40 DOE identified four technology options that could reduce electricity consumption in standby mode: 1) lower-power display technologies; 2) cooking sensors with no standby power requirement; 3) improved power supply and control board options; and; 4) automatic power-down. Low-power display technologies like liquid crystal display (LCD) or light-emitting diode (LED) displays alone can achieve close to 1 W standby. Adding an automatic power-down element, which turns off most power-consuming components after a certain period of inactivity, could achieve standby power levels of less than 1 W (DOE 2009c). Pool Heaters
Source: Doheny's Water Warehouse
THE PRODUCT: Pool heaters are used to heat the water contained in swimming pools, spas, and hot tubs. The water is heated as it passes through the pool heater, which is installed on the water line that circulates pool water through the filter. A thermostat turns on the heater when the water temperature is too low and shuts it off when the water reaches the desired temperature. Although there are several types of pool heaters, including those powered by gas, oil, electric resistance, heat pump, and solar energy, gas-fired heaters are the most widely used and offer good efficiency opportunities. POTENTIAL STANDARD: A national efficiency standard for gas-fired pool heaters was first established in 1987, requiring a minimal thermal efficiency of 78%. Although DOE proposed a revision in 1994, the agency never completed an update. California and Connecticut have since enacted regulations that prohibit constant burning pilot lights in gas pool heaters. DOE began a new pool heater rulemaking in 2007 and a final rule is due in March 2010. An 81% AFUE standard based on DOE’s efficiency level 2 (EL 2) may make sense since it is the only efficiency level at which the greatest number of households would benefit (DOE 2009b). We estimate that such a standard would save 44 Bcf (44 TBtu) cumulatively by 2030 and generate about $230 million in net present value savings. KEY FACTS: Basic, inefficient pool heaters have a standing pilot, which can be replaced with electronic ignition to reduce gas consumption. The thermal efficiency can also be increased by adding additional heat exchange area relative to the current standard. Other possible efficiency improvements include: electronic ignition; power venting, where draft fans are installed around the combustion zone helping to regulate the amount of air at the burner to obtain higher combustion efficiency; sealed combustion, where combustion chambers are sealed to prevent excess air from impacting thermal efficiency, and; condensing, where water vapor from the combustion gases is condensed to capture the heat released during vaporization (DOE 2009b). Increasing the thermal efficiency to 81% would decrease energy consumption by 4%. Reach-In Refrigerators and Freezers THE PRODUCT: Reach-in refrigerators typically have a metallic or painted exterior finish and are used in commercial kitchens, delicatessens, and food stores. They are equipped with opaque or glass-doors, the later used largely for displaying inventory. Reach-ins are also equipped with their own built-in compressor, making them "self-contained." POTENTIAL STANDARD: Congress adopted a standard for commercial reach-in refrigerators and freezers in EPAct 2005 (effective 2010), building on previous state standards, Consortium for Energy
39 Out of 8760 hours in a year, DOE assumes microwaves spend 8689 hours in standby mode. This assumes standby power equal to 2.83 W (DOE 2009c). 40 This assumes baseline standby-power consumption of 2.83 W (DOE 2009c).
36
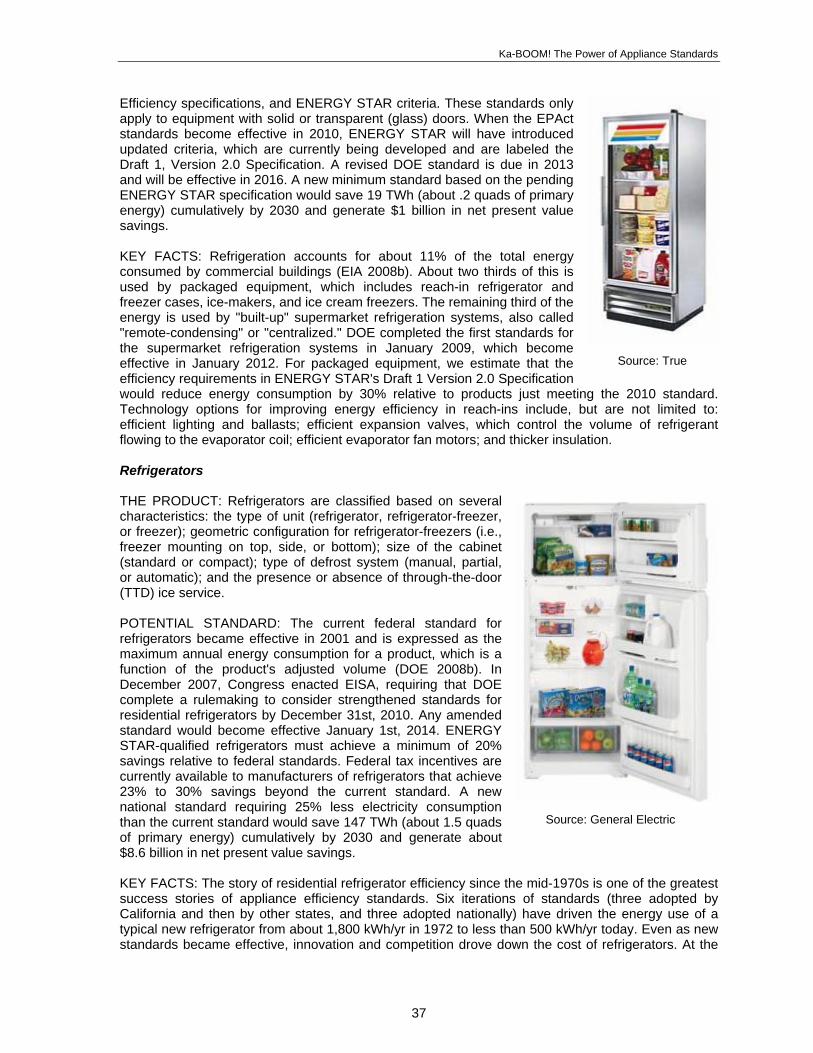
Ka-BOOM! The Power of Appliance Standards
Efficiency specifications, and ENERGY STAR criteria. These standards only apply to equipment with solid or transparent (glass) doors. When the EPAct standards become effective in 2010, ENERGY STAR will have introduced updated criteria, which are currently being developed and are labeled the Draft 1, Version 2.0 Specification. A revised DOE standard is due in 2013 and will be effective in 2016. A new minimum standard based on the pending ENERGY STAR specification would save 19 TWh (about .2 quads of primary energy) cumulatively by 2030 and generate $1 billion in net present value savings.
Source: True
KEY FACTS: Refrigeration accounts for about 11% of the total energy consumed by commercial buildings (EIA 2008b). About two thirds of this is used by packaged equipment, which includes reach-in refrigerator and freezer cases, ice-makers, and ice cream freezers. The remaining third of the energy is used by "built-up" supermarket refrigeration systems, also called "remote-condensing" or "centralized." DOE completed the first standards for the supermarket refrigeration systems in January 2009, which become effective in January 2012. For packaged equipment, we estimate that the efficiency requirements in ENERGY STAR's Draft 1 Version 2.0 Specification would reduce energy consumption by 30% relative to products just meeting the 2010 standard. Technology options for improving energy efficiency in reach-ins include, but are not limited to: efficient lighting and ballasts; efficient expansion valves, which control the volume of refrigerant flowing to the evaporator coil; efficient evaporator fan motors; and thicker insulation. Refrigerators THE PRODUCT: Refrigerators are classified based on several characteristics: the type of unit (refrigerator, refrigerator-freezer, or freezer); geometric configuration for refrigerator-freezers (i.e., freezer mounting on top, side, or bottom); size of the cabinet (standard or compact); type of defrost system (manual, partial, or automatic); and the presence or absence of through-the-door (TTD) ice service.
Source: General Electric
POTENTIAL STANDARD: The current federal standard for refrigerators became effective in 2001 and is expressed as the maximum annual energy consumption for a product, which is a function of the product's adjusted volume (DOE 2008b). In December 2007, Congress enacted EISA, requiring that DOE complete a rulemaking to consider strengthened standards for residential refrigerators by December 31st, 2010. Any amended standard would become effective January 1st, 2014. ENERGY STAR-qualified refrigerators must achieve a minimum of 20% savings relative to federal standards. Federal tax incentives are currently available to manufacturers of refrigerators that achieve 23% to 30% savings beyond the current standard. A new national standard requiring 25% less electricity consumption than the current standard would save 147 TWh (about 1.5 quads of primary energy) cumulatively by 2030 and generate about $8.6 billion in net present value savings. KEY FACTS: The story of residential refrigerator efficiency since the mid-1970s is one of the greatest success stories of appliance efficiency standards. Six iterations of standards (three adopted by California and then by other states, and three adopted nationally) have driven the energy use of a typical new refrigerator from about 1,800 kWh/yr in 1972 to less than 500 kWh/yr today. Even as new standards became effective, innovation and competition drove down the cost of refrigerators. At the
37

Ka-BOOM! The Power of Appliance Standards
same time, the typical refrigerator has gotten bigger and better, often including features like ice-makers and auto-defrost. Refrigerators exceeding current minimum standards may employ improved insulation, improved compressor efficiency, improved heat exchange in the evaporator and condenser, efficient fan and fan motors, and improved temperature control (DOE 2008b). Residential Central Air Conditioners and Heat Pumps THE PRODUCT: Central air conditioners and heat pumps utilize a large compressor unit located outdoors to distribute cooled or heated air through a forced-air system. In a central air conditioning unit, the compressor cycles air from indoors over a coil filled with refrigerant to cool the inside. Heat pumps, on the other hand, are two-way air conditioners. While heat pumps can provide cool air, a reversing valve allows a heat pump system to reverse the air conditioning cycle, where the compressor cycles heat from the outside over a coil for distribution indoors. Current standards for central air conditioning products include several classes including: 1) split central air conditioning systems (cooling-only); 2) split central air conditioning heat pump systems (two piece); 3) single packaged central air conditioning systems (cooling-only), and; 4) single packaged air conditioning heat pump systems (DOE 2002). Source: Goodman POTENTIAL STANDARD: Since the first federal standard for central air conditioners and heat pumps was established in 1987, revisions have fallen behind schedule. The most recent standard raising the minimum Seasonal Energy Efficiency Ratio (SEER) requirement from 10 to 13 became effective in 2006. The revised standard, scheduled to be updated by DOE in 2011, will become effective in 2016. To qualify for an ENERGY STAR rating requires a minimum 14.5 SEER for split systems and 14 SEER for single package equipment. A new federal standard requiring an average SEER of 14 for central AC units and a Heating Seasonal Performance Factor (HSPF) of 8.2 for heat pumps, which is also the minimum efficiency for qualification with ENERGY STAR specifications, would save 133 TWh (about 1.4 quads or primary energy) cumulatively by 2030 and generate about $7.3 billion in net present value savings. We evaluate this standard as a proxy for regional standards, as authorized under EISA 2007. Regional standards could include SEER 14 or higher for the South and SEER 13 for much of the northernmost states. In addition, the hot, dry Southwest would benefit enormously from standards requiring efficiency at high temperature operation. Our savings estimates used an average SEER to reflect that the units in the Southwest will tend to range more towards SEER 15 in order to meet the EER requirement. KEY FACTS: 59% of U.S. households have a central cooling system, and 19% of those systems have a heat pump (EIA 2008a). Moreover, virtually all new homes are built with central air conditioning. The efficiency of central air conditioning systems can be augmented by several technologies. A variable speed motor allows more control over air distribution, which can lower energy consumption and increase comfort. In fact, the majority of systems rated over SEER 13 incorporate variable speed motors in order to achieve this efficiency. Advanced compressors and microchannel heat exchangers, which transfer more heat per unit of face area than the typical round tube plate fin heat exchangers, are other options for improving efficiency (DOE 2002). Increasing the efficiency of central AC units to a SEER of 14 and heat pumps to an HSPF of 8.2 would reduce electricity consumption by about 7% for cooling and about 6% for heating purposes. Residential Clothes Dryers THE PRODUCT: Clothes dryers are designed to remove moisture from clothes and other textiles by heating air, using either electricity or gas, and passing the heated air into a tumbler. Clothes dryers are also differentiated by their capacity: standard (4.4 ft3 and greater) or compact (less than 4.4 ft3). Clothes dryers are typically manufactured with a vent to which an exhaust is fitted, but vent-less
38

Ka-BOOM! The Power of Appliance Standards
dryers are common in areas where space for venting is restricted, such as apartments or mobile homes.
Source: Maytag
POTENTIAL STANDARD: Congress set the initial clothes dryer standard in 1987, outlawing constantly burning pilot lights in gas dryers. DOE revised the standard in 1991, which became effective three years later. This standard requires a temperature or moisture sensor in order to end the drying cycle when clothes are dry. DOE began its rulemaking to set a new dryer standard in fall 2007, to be completed by June 2011 and taking effect three years later. The new standard will differ between vented and vent-less clothes dryers. DOE is currently seeking comment for proposed energy factors (EF) for vent-less dryers, as EFs for these dryers cannot be estimated using the current test procedure, requiring the current procedure to be amended (DOE 2007a). The test procedure for clothes dryers has not been updated since it was introduced in 1981, and as a result there has been concern that it does not give an accurate assessment of performance. The proposed baseline unit efficiency standards for vented clothes dryers vary depending on the capacity and heating input. Energy factors for clothes dryers are measured in lb/kWh, and the current DOE standard for electric, vented clothes dryers is an EF of 3.01 lb/kWh. There is no ENERGY STAR standard for clothes dryers. DOE has not yet issued an analysis for residential clothes dryers, and if the test procedure is inaccurate, the savings attainable through efficiency improvements are unclear. We analyzed a standard that saves 10% relative to the current federal standard, which would save 80 TWh and 78 Bcf of natural gas (for a total of about .9 quads of primary energy) cumulatively by 2030 and generate $4.1 billion in net present value savings. KEY FACTS: Almost 79% of U.S. households have a clothes dryer. 77% of those households utilize an electric clothes dryer, while 22% use natural gas (EIA 2008a). DOE is considering analyzing advanced clothes dryer technologies that were included in the advanced notice of public rulemaking (ANOPR) document issued in 1994, as well as technologies described in recent trade publications, research reports, and manufacturer product offerings. The technologies that DOE has identified as improving the efficiency of clothes dryers include, but are not limited to: increased insulation; improved drum design, and; recycling of exhaust heat (DOE 2007a). A 2005 study of electric heat pump clothes dryers and modulating gas dryers commissioned by DOE estimated savings from these new technologies of 30–50% and 10–25%, respectively (TIAX 2005), but limited commercial availability limits their consideration in the standards process at this time. Clothes dryer efficiency can also be improved by reducing the remaining moisture content (RMC) of loads after they have gone through the wash process, which reduces the amount of water that a dryer would have to remove. Residential Clothes Washers THE PRODUCT: Clothes washers are defined by type: horizontal- or vertical-axis; and by capacity: standard and compact. POTENTIAL STANDARD: In December 2007, Congress enacted EISA, setting the first minimum water efficiency requirements for clothes washers. Minimum energy efficiency requirements, however, were left unchanged from the existing levels set by DOE in 2001, which became effective in January 2007. Effective January 1st, 2011, residential clothes washers must be manufactured with a modified energy factor (MEF) of at least 1.26 and a maximum water factor (WF) of 9.5 or less. Currently, ENERGY STAR-qualified products must meet a minimum MEF of
Source: Maytag
39

Ka-BOOM! The Power of Appliance Standards
1.8 and a maximum WF of 7.5. Energy Star criteria will rise to a minimum 2.0 MEF / 6.0 WF in 2011. Federal tax incentives are available to manufacturers of clothes washers with a minimum 2.0 MEF / 6.0 WF as well as 2.2 MEF / 4.5 WF. DOE is scheduled to complete a rulemaking on stronger standards by December 31st, 2011. The revised standards would become effective January 1st, 2015. A standard requiring an MEF of 2.0 would save 79 TWh and 419 Bcf (for a total of about 1.2 quads of primary energy) cumulatively by 2030 and generate $15.6 billion in net present value savings. In addition, a 6.0 WF standard would save about 550 billion gallons of water annually by 2030. Even higher standards may be merited. KEY FACTS: About 83% of U.S. households have a clothes washer. The vast majority of clothes washers in the U.S., almost 92%, are vertical axis (top-loading) clothes washers, though the stock of horizontal axis (front-loading) is slowly increasing (EIA 2008a). Although all clothes washers are electrically powered, around 90% of the energy consumed is used to heat water (EPA 2008). Efficiency improvements can therefore arise from advances in mechanical technology (efficient motors) and reductions in the amount of water consumed to clean a given volume of laundry. We estimate that increasing the MEF to 2.0 would reduce the mechanical electricity consumption as well as electricity and natural gas used for water heating by 30%. Residential Furnaces THE PRODUCT: Furnaces are the most common type of heating equipment in the United States. Furnaces burn natural gas, propane, or oil for heat and distribute the heat through a duct system. There are two main types of residential furnaces: weatherized (for outdoor installation, such as on rooftops) and non-weatherized. Non-weatherized furnaces come in two forms: condensing
Source: Carrier
41 and non-condensing (DOE 2007b). POTENTIAL STANDARD: The current federal standard for residential oil and gas furnaces is a minimum of 78% annual fuel utilization efficiency (AFUE). DOE raised the standard in 2007 to 80% AFUE, effective 2015. However, virtually all furnaces on the market have an AFUE of 80% or better, which prompted states and environmental and consumer groups to sue DOE over its 2007 decision. In April 2009, DOE accepted a “voluntary remand” in that litigation. Under the terms of settlement, DOE will complete a revised standard by May 2011. Many efficiency groups are asking that 90% AFUE at least be required for all northern states. Higher levels may be justified. Gas furnaces that utilize a condensing cycle achieve an AFUE rating of 90% and better. For oil furnaces, a significant number are being sold with an AFUE of 83%. A standard at 90% for gas and 83% for oil would save 1,780 Bcf (about 1.8 quads) of natural gas cumulatively by 2030 and generate $7.9 billion in net present value savings. KEY FACTS: Space heating is the largest energy end-use in the U.S. residential sector, accounting for around 41% of total residential energy consumption. 40% of U.S. households use natural gas furnaces (the most common equipment and fuel used for space heating), while a little more than 14% use electric furnaces and almost 3% use fuel oil furnaces (EIA 2008a). 42 Non-weatherized, condensing furnaces are typically the most efficient (90% and above) as waste heat is not entirely dissipated outside (as with a weatherized furnace) and more heat is recovered from the combustion process from the latent heat created from the condensing of water vapor. No gas furnaces exist with AFUE ratings between 83–89% because problems arising from condensation occur within this range (DOE 2007b). At this time, condensing is not considered feasible for "weatherized" furnaces, such as the furnace sections of packaged roof-top equipment.
41 See footnote 30 for an explanation of the condensing cycle 42 Other sources of space heating include steam or hydronic systems, electric heat pumps, wood, oil, etc. (RECS 2008).
40

Ka-BOOM! The Power of Appliance Standards
Residential Water Heaters THE PRODUCT: Residential water heaters are used primarily to provide hot water to residences for consumer use, appliances, and other functions. Water can be heated by electricity, gas, or oil. There are two main types of water heaters: typical heater/storage units and instantaneous water heaters.
Source: General Electric
POTENTIAL STANDARD: In January 2001, DOE published revised water heater standards, effective January 2004. For an average-sized unit, the required energy factor (EF) is .59 for gas, .53 for oil, and .90 for electricity. In November 2006, DOE began a rulemaking to revise the 2004 standard. The rulemaking is scheduled to be completed in April 2010 and will take effect three years later. A new standard increasing the EF to .63 for natural gas water heaters, .62 for oil, and .95 for electric would save 158 TWh and 920 Bcf (for a total of 2.6 quads of primary energy) cumulatively by 2030 and generate $14.4 billion in net present value savings. Based on DOE preliminary analysis, such standards also are the most cost-effective. However, even higher standards may make sense for the largest equipment. KEY FACTS: Water heating represents 20% percent of total annual household energy consumption in the U.S. About 53% of U.S. households use natural gas water heaters, while 38% use electric and less than 4% use oil (EIA 2008a). A baseline .90 EF electric water heater consumes around 2,700 kWh annually (DOE 2009b). Though electric water heaters are rated with higher energy factors than gas or oil, these ratings do not account for the fact that about 3 Btus of fuel need to be burned to generate 1 Btu of electricity. All water heaters generally waste a portion of fuel they use to keep storage water heated: for example, in a conventional gas water heater, only 43% of the fuel energy actually reaches the point of use. The remaining 57% dissipates through standby losses, distribution losses, or combustion losses (Thorne Amman, Wilson and Ackerly 2007). Thicker tank insulation can increase the efficiency of all types of water heaters, but this has decreasing gains at higher efficiency levels, which already have relatively thick insulation. The current rulemaking will essentially exhaust the efficiency potential of conventional tank gas and electric water heaters. Bringing electricity to the gas tank water heater allows multiple improvements, particularly the use of a vent damper (which dramatically reduces standby losses) or a condensing 43 operation (where latent heat is captured by condensing the water vapor that is a byproduct of combustion vapor). For electricity, the only central technology option is the heat pump water heater, with an energy factor greater than 1 and possibly greater than 2.5 in the long run. Room AC THE PRODUCT: Room air conditioners are encased AC units designed primarily for mounting in a window or through a wall. They are constructed to deliver conditioned air into a room without the use of ducts or with very short ducts. Room AC units have their own source of refrigerant and dehumidification as well as a mechanism for circulating or filtering the air, and may also include mechanisms for ventilation and heating (ASHRAE 2004).
Source: LG
POTENTIAL STANDARD: Room air conditioners were regulated by several states in the 1970s and 1980s and became federally regulated in 1987. The standard varies as a function of cooling capacity and other features, but for the most common type of unit (an 8,000–13,999 Btu/hour unit with side-vents) the 1987 law required an efficiency of 9.0 EER, effective 1990. In 1997, DOE published the most recent standard for room air conditioners, which became effective
43 See footnote 30 for an explanation of the condensing cycle.
41
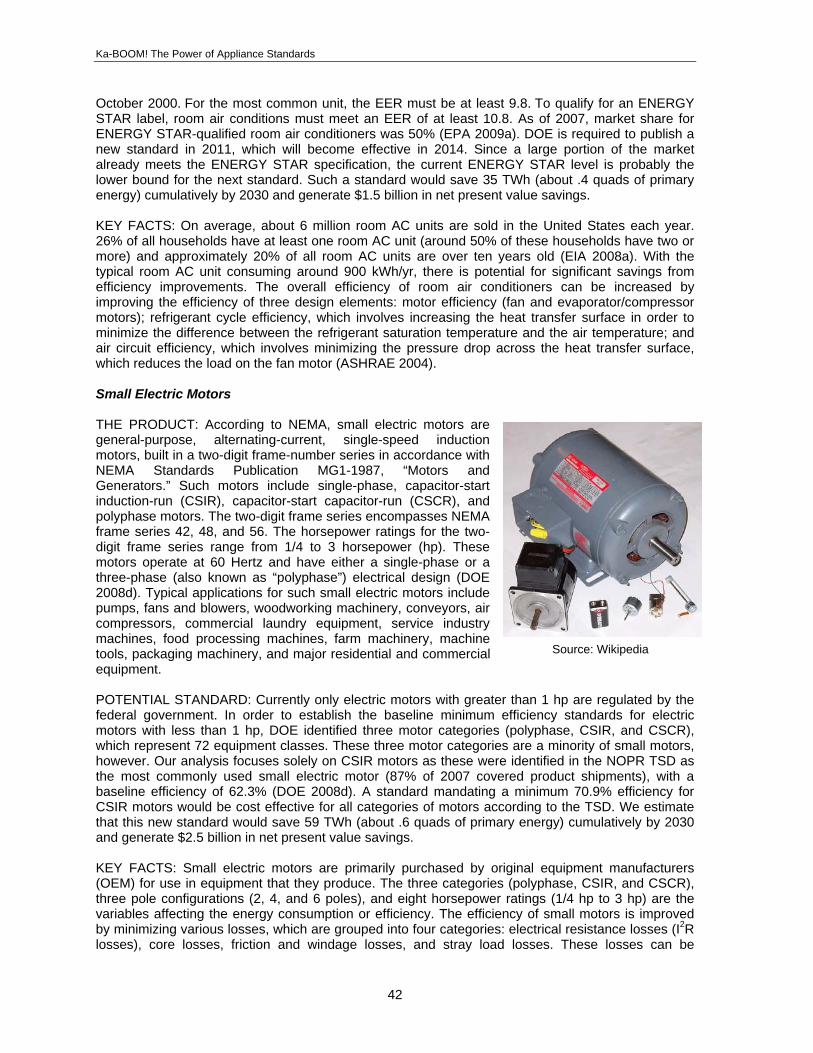
Ka-BOOM! The Power of Appliance Standards
October 2000. For the most common unit, the EER must be at least 9.8. To qualify for an ENERGY STAR label, room air conditions must meet an EER of at least 10.8. As of 2007, market share for ENERGY STAR-qualified room air conditioners was 50% (EPA 2009a). DOE is required to publish a new standard in 2011, which will become effective in 2014. Since a large portion of the market already meets the ENERGY STAR specification, the current ENERGY STAR level is probably the lower bound for the next standard. Such a standard would save 35 TWh (about .4 quads of primary energy) cumulatively by 2030 and generate $1.5 billion in net present value savings. KEY FACTS: On average, about 6 million room AC units are sold in the United States each year. 26% of all households have at least one room AC unit (around 50% of these households have two or more) and approximately 20% of all room AC units are over ten years old (EIA 2008a). With the typical room AC unit consuming around 900 kWh/yr, there is potential for significant savings from efficiency improvements. The overall efficiency of room air conditioners can be increased by improving the efficiency of three design elements: motor efficiency (fan and evaporator/compressor motors); refrigerant cycle efficiency, which involves increasing the heat transfer surface in order to minimize the difference between the refrigerant saturation temperature and the air temperature; and air circuit efficiency, which involves minimizing the pressure drop across the heat transfer surface, which reduces the load on the fan motor (ASHRAE 2004). Small Electric Motors
Source: Wikipedia
THE PRODUCT: According to NEMA, small electric motors are general-purpose, alternating-current, single-speed induction motors, built in a two-digit frame-number series in accordance with NEMA Standards Publication MG1-1987, “Motors and Generators.” Such motors include single-phase, capacitor-start induction-run (CSIR), capacitor-start capacitor-run (CSCR), and polyphase motors. The two-digit frame series encompasses NEMA frame series 42, 48, and 56. The horsepower ratings for the two-digit frame series range from 1/4 to 3 horsepower (hp). These motors operate at 60 Hertz and have either a single-phase or a three-phase (also known as “polyphase”) electrical design (DOE 2008d). Typical applications for such small electric motors include pumps, fans and blowers, woodworking machinery, conveyors, air compressors, commercial laundry equipment, service industry machines, food processing machines, farm machinery, machine tools, packaging machinery, and major residential and commercial equipment. POTENTIAL STANDARD: Currently only electric motors with greater than 1 hp are regulated by the federal government. In order to establish the baseline minimum efficiency standards for electric motors with less than 1 hp, DOE identified three motor categories (polyphase, CSIR, and CSCR), which represent 72 equipment classes. These three motor categories are a minority of small motors, however. Our analysis focuses solely on CSIR motors as these were identified in the NOPR TSD as the most commonly used small electric motor (87% of 2007 covered product shipments), with a baseline efficiency of 62.3% (DOE 2008d). A standard mandating a minimum 70.9% efficiency for CSIR motors would be cost effective for all categories of motors according to the TSD. We estimate that this new standard would save 59 TWh (about .6 quads of primary energy) cumulatively by 2030 and generate $2.5 billion in net present value savings. KEY FACTS: Small electric motors are primarily purchased by original equipment manufacturers (OEM) for use in equipment that they produce. The three categories (polyphase, CSIR, and CSCR), three pole configurations (2, 4, and 6 poles), and eight horsepower ratings (1/4 hp to 3 hp) are the variables affecting the energy consumption or efficiency. The efficiency of small motors is improved by minimizing various losses, which are grouped into four categories: electrical resistance losses (I2R losses), core losses, friction and windage losses, and stray load losses. These losses can be
42

Ka-BOOM! The Power of Appliance Standards
43
minimized in a variety of ways, such as changing the conductor material (copper versus aluminum wire), adjusting the quantity or quality of the steel in the steel components, improving the bearings, or improving the cooling system. The biggest savings opportunity is to change from inefficient types of motors such as shaped pole to more efficient types such as permanent split capacitor (DOE 2008d). Increasing the minimum efficiency of CSIR motors to 70.9% would reduce electricity consumption of these motors by 12%. Refrigerated Vending Machines
Source: Universal Vending
THE PRODUCT: Refrigerated vending machines are upright, refrigerated cases whose purpose is to hold cold beverages and vend them in exchange for currency. The entire refrigeration system is built into the machine and heat is rejected from the refrigeration cycle to the surrounding air. POTENTIAL STANDARD: The federal Energy Policy Act of 2005 directed DOE to set standards for refrigerated vending machines as no standards currently exist. The rulemaking is now underway and is scheduled for completion in August 2009. Tier 1 criteria for qualification for an ENERGY STAR rating became effective in 2004, while Tier 2 criteria became effective 2007, both of which are a function of the vendible capacity. In the ANOPR TSD, DOE has created varying efficiency levels using a design-options approach, where the efficiency level increases as additional design-options are added to the product. ASAP has recommended that DOE set the new standard at the level identified as EL 5 in the DOE analysis and could be met by implementing a variety of efficiency improvements similar to those found in packaged refrigeration equipment. Design options include, but are not limited to, better insulation and more efficient lighting, compressors, and motors. We estimate that this level of standard would save 6 TWh (60 TBtu) cumulatively by 2030 and generate about $290 million in net present value savings. KEY FACTS: DOE divides refrigerated vending machines into two classes (Class A and Class B), and within those two classes are six product types that vary depending on size (large, medium, and small) and location of installation (indoor or outdoor). In 2005, there were an estimated 3.67 million machines in the U.S, 95% of which were designated Class B where the front is opaque so inventory is not visible to the consumer (Class A has a transparent front). Energy consumption is a function of the cooling load that the machine must meet, which typically comprises 65–76% of the total energy consumption of the machine. Lighting accounts for another 5–20% of total energy consumption. Annual energy consumption for the various sizes of refrigerated vending machines averages around 2000 kWh (DOE 2008a). Walk-In Coolers and Freezers THE PRODUCT: Walk-in coolers and walk-in freezers (walk-ins or WICF) are large, insulated refrigerated spaces with access door(s) large enough for people to enter. The purpose of walk-ins is to temporarily store refrigerated or frozen food or other perishable materials. The two major classes of walk-ins are low-temperature refrigerated space (-10°F to -20°F) and medium-temperature refrigerated space (-10°F to 30°F). Although walk-ins can be used in a wide variety of applications, they are used primarily in food service and sales (DOE 2009f).
Source: U.S. Cooler POTENTIAL STANDARD: In 2004, California became the first of five states (plus Connecticut, Maryland, Oregon, and Rhode Island) to adopt a standard, reducing average walk-in energy use by over 40% through requirements for insulation levels, motor types, and use of automatic door-closers. In 2007, ACEEE reached an agreement with walk-in cooler and

Ka-BOOM! The Power of Appliance Standards
freezer manufacturers on a national standard for walk-ins that builds upon the California standard but adds some provisions and modifies others. This agreement was incorporated into EISA 2007. It includes prescriptive requirements affecting the thermal enclosure, motors, and lights, effective January 1, 2009. DOE must conclude a rulemaking to set performance-based standards no later than January 1, 2012, with any amended standard effective January 1, 2015. Beyond the prescriptive requirements included in EISA 2007, standards based on an additional five efficiency improvements (discussed below) could generate savings of about 20% relative to the current standard. We estimate this increase in efficiency would result in savings of 13 TWh (about .1 quads of primary energy) cumulatively by 2030 and $680 million in net present value savings. KEY FACTS: Walk-in coolers and freezers are generally assembled onsite from pre-fabricated wall panels and adding refrigeration units of various sizes. The standards incorporated into EISA 2007 included efficiency requirements for high-efficacy lighting and floor insulation, but the standard that ASAP is recommending would require an additional five measures, all of which have been estimated to be cost-effective on an individual basis (SCE 2008). Southern California Edison, with support from the other California electric utilities, has recommended these measures be incorporated into a revised California state standard for walk-ins, which would be enforced by California until the amended federal standard becomes effective in 2015. It is anticipated that the CEC will consider this proposal in the next phase of its rulemaking process. These five measures include air-infiltration reduction, floating head pressure control, evaporator fan control, temperature termination defrost controls, and anti-sweat heater humidity responsive controls. Floating head pressure control (which allows the condensing system to float the temperature setpoint relative to the outside temperature) and temperature termination defrost controls (which reduce the frequency and duration of defrost periods) have the potential to generate the greatest degree of energy savings (SCE 2008). 6. Conclusion Appliance standards have been a cornerstone of U.S. energy policy for the past several decades. Though underappreciated, their contribution to curbing energy demand growth is undeniable. By 2010, existing federal appliance standards will have generated 273 billion kWh of savings, equivalent to the amount of power generated by 111 average coal-fired power plants. By 2030, savings from current federal standards will generate 563 billion kWh of savings, which is equivalent to the power generated by 230 average coal-fired power plants. We estimate that these cumulative energy savings will equal 7% and 12% of projected U.S. energy consumption in 2010 and 2030, respectively. The power of appliance standards reaches far beyond limiting energy consumption growth. Existing appliance standards will also reduce the need for future additional generation capacity while simultaneously reducing emissions such as carbon dioxide, sulfur dioxide, and nitrous oxides. By 2030, we estimate that existing standards will lower peak summer demand by 179 GW, which is 16% of projected generation capacity in that year. Additionally, we estimate that U.S. carbon dioxide emissions in 2030 will fall by 465 MMT, which is equivalent to almost 8% of projected emissions in 2030; the same impact as removing 89 million average cars from the road. The fact that existing standards have already made a considerable contribution to meeting our nation's energy policy goals emphasizes the need for aggressive action in implementing new and updated standards over the next four years. By January 1, 2013, DOE is legally obligated to finalize standards for twenty-three products and may accelerate rulemakings for at least an additional three products that may prove to generate significant savings. Several of the products, such as fluorescent lamps, residential water heaters, furnaces, and central air conditioners and heat pumps, offer the biggest opportunities for savings. But it is the combination of many standards, with both large and small impacts, that will have the greatest effect. Completing standards that improve the overall efficiency of these products to the highest levels justified will be a boon to this nation for many different reasons. We estimate that, if implemented, the standards analyzed in this report will:
44
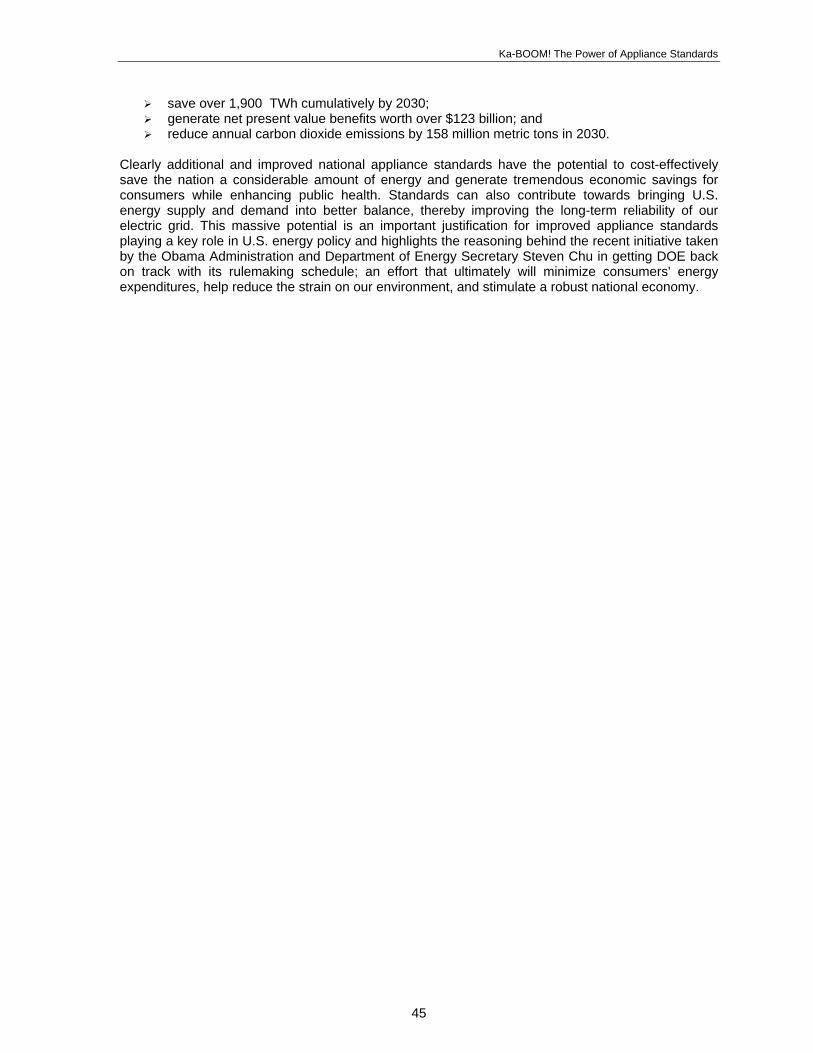
Ka-BOOM! The Power of Appliance Standards
save over 1,900 TWh cumulatively by 2030; generate net present value benefits worth over $123 billion; and reduce annual carbon dioxide emissions by 158 million metric tons in 2030.
Clearly additional and improved national appliance standards have the potential to cost-effectively save the nation a considerable amount of energy and generate tremendous economic savings for consumers while enhancing public health. Standards can also contribute towards bringing U.S. energy supply and demand into better balance, thereby improving the long-term reliability of our electric grid. This massive potential is an important justification for improved appliance standards playing a key role in U.S. energy policy and highlights the reasoning behind the recent initiative taken by the Obama Administration and Department of Energy Secretary Steven Chu in getting DOE back on track with its rulemaking schedule; an effort that ultimately will minimize consumers' energy expenditures, help reduce the strain on our environment, and stimulate a robust national economy.
45

Ka-BOOM! The Power of Appliance Standards
46

Ka-BOOM! The Power of Appliance Standards
References [ACEEE] American Council for an Energy-Efficient Economy. 2009. Reducing the Cost of Addressing Climate Change Through Energy Efficiency — Consensus Recommendations for Future Federal Climate Legislation in 2009. http://www.aceee.org/energy/climate/Reducing%20the%20Cost%20of%20Addressing%20Climate%20 Change%20-%20synopsis.pdf. Washington, D.C.: American Council for an Energy-Efficient Economy. [AHAM] Association of Home Appliance Manufacturers. 2005. Refrigerators, Energy Efficiency and Consumption Trends. Washington, D.C.: Association of Home Appliance Manufacturers. [AHRI] Air-Conditioning, Heating, and Refrigeration Institute. 2007. January Central Air Conditioner and Air-Source Heat Pump Shipments Fall Nearly 50 Percent, Compared with January 2006. Arlington, VA: Air-Conditioning, Heating, and Refrigeration Institute. American Physical Society. 2008. "Energy Future: Think Efficiency." www.aps.org. American Physical Society. Appliance Magazine. 2007. "North America Forecast." January. Los Angeles, Calif.: Canon Communications LLC. [ASAP] Appliance Standards Awareness Project. 2000. Staying Cool: How Energy-Efficient Air Conditioners Can Prevent Blackouts, Cut Pollution, and Save Money. Boston, Mass.: Appliance Standards Awareness Project. [ASHRAE] American Society of Heating, Refrigeration, and Air-Conditioning Engineers. 2004. 2004 ASHRAE Handbook: HVAC Systems and Equipment. Atlanta, GA: American Society of Heating, Refrigeration, and Air-Conditioning Engineers.
http://www.barackobama.BarackObama.com. 2008. Barack Obama and Joe Biden: New Energy for America. com/pdf/factsheet_energy_speech_080308.pdf. Washington, D.C.: www.barackobama.com. Calwell, Chris. 2009. Is Efficiency Sufficient? The Case for Shifting our Emphasis in Energy Specification to Progressive Efficiency and Sufficiency. FINAL DRAFT. Prepared for European Council for an Energy-Efficient Economy, Stockholm and U.S. Environmental Protection Agency. [CEC] California Energy Commission. 1983. California's Appliance Standards: A Historical Review, Analysis, and Recommendations, Staff Report. Sacramento, Calif.: California Energy Commission. ____. 2008a. Electronic Products: Making Battery Chargers More Efficient. Sacramento, Calif.: California Energy Commission. ____. 2008b. Proposed Amendments to Appliance Efficiency Regulations (Express Terms). 2008 Appliance Efficiency Rulemaking, Phase 1, Part B. Docket Number 08-AAER-1B. November. Sacramento, Calif.: California Energy Commission. [Census] U.S. Census Bureau. 2005. Current Industrial Reports: MQ335C – Fluorescent Lamp Ballasts. http://www.census.gov/ftp/pub/industry/mq335c055.xls. Washington, D.C.: U.S. Census Bureau. Chan, T. and C. Webber. 1995. "Memorandum, Oct 11." Berkeley, Calif.: Lawrence Berkeley National Laboratory. Dale, L., C. Antinori, M. McNeil, and J. McMahon. 2002. “Retrospective Evaluation of Declining Price for Energy Efficient Appliances.” In Proceedings of the ACEEE Summer Study of Energy Efficiency in Buildings, 9.55–9.70 Washington, D.C.: American Council for an Energy-Efficient Economy. [DOE] U.S. Department of Energy. 1982. Consumer Products Efficiency Standards, Engineering Analysis Document. Washington, D.C.: U.S. Department of Energy, Test and Evaluation Branch. ____. 2000. Technical Support Document: Energy Efficiency Standards for Consumer Products: Fluorescent Lamp Ballast Proposed Rule. Washington, D.C.: U.S. Department of Energy, Office of Energy Efficiency and Renewable Energy. ____. 2001a. Energy Conservation Program for Consumer Products: Central Air Conditioners and Heat Pumps Energy Conservation Standards; Final Rule. Washington, D.C.: U.S. Department of Energy, Office of Energy Efficiency and Renewable Energy.
47
Ka-BOOM! The Power of Appliance Standards
____. 2001b. Energy Efficiency Program for Commercial and Industrial Equipment: Efficiency Standards for Commercial Heating, Air Conditioning and Water Heater Equipment; Final Rule. Washington, D.C.: U.S. Department of Energy, Office of Energy Efficiency and Renewable Energy. ____. 2002. Technical Support Document: Energy Efficiency Standards for Consumer Products: Residential Central Air Conditioners and Heat Pumps. Washington, D.C.: U.S. Department of Energy, Office of Energy Efficiency and Renewable Energy. ____. 2004. Technical Support Document: Energy Efficiency Program for Commercial and Industrial Equipment: Electrical Distribution Transformers. Washington, D.C.: U.S. Department of Energy, Office of Energy Efficiency and Renewable Energy. ____. 2005a. FY 2005 Technical Support Document, Appendix A. Washington, D.C.: U.S. Department of Energy, Office of Energy Efficiency and Renewable Energy. ____. 2005b. Technical Report: Analysis of Amended Energy Conservation Standards for Residential Refrigerator-Freezers. Washington, D.C.: U.S. Department of Energy, Office of Energy Efficiency and Renewable Energy. ____. 2006. Energy Conservation Standards Activities — Submitted Pursuant to Section 141 of the Energy Policy Act of 2005 and to the Conference Report (109-275) to the FY 2006 Energy and Water Development Appropriations Act. Washington, D.C.: U.S. Department of Energy, Office of Energy Efficiency and Renewable Energy. ____. 2007a. Energy Conservation Standards Rulemaking Framework Document for Residential Clothes Dryers and Room Air Conditioners. Washington, D.C.: U.S. Department of Energy, Office of Energy Efficiency and Renewable Energy. ____. 2007b. Technical Support Document: Energy Efficiency Program for Consumer Products: Energy Conservation Standards for Residential Furnaces and Boilers. Washington, D.C.: U.S. Department of Energy, Office of Energy Efficiency and Renewable Energy. ____. 2007c. Distribution Transformers Final Rule Analytical Spreadsheets, National Impact Analysis with Regulatory Impact Analysis. http://www1.eere.energy.gov/buildings/appliance_standards/commercial/ distribution_transformers_fr_spreadsheets.html. Washington, D.C.: U.S. Department of Energy, Office of Energy Efficiency and Renewable Energy. ____. 2007d. Energy Conservation Program: Energy Conservation Standards for Residential Furnaces and Boilers; Final Rule. Washington, D.C., U.S. Department of Energy, Office of Energy Efficiency and Renewable Energy. (72 Fed. Reg. 65136). ____. 2007e. Energy Conservation Program for Commercial Equipment: Distribution Transformers Energy Conservation Standards; Final Rule. Washington, D.C., U.S. Department of Energy, Office of Energy Efficiency and Renewable Energy. (72 Fed. Reg. 58190). ____. 2008a. Advance Notice of Proposed Rulemaking (ANOPR) Technical Support Document (TSD): Energy Efficiency Standards for Commercial and Industrial Equipment: Refrigerated Bottled or Canned Beverage Vending Machines. Washington, D.C.: U.S. Department of Energy, Office of Energy Efficiency and Renewable Energy. ____. 2008b. Energy Conservation Standards Rulemaking Framework Document for Residential Refrigerators, Refrigerator-Freezers, and Freezers. Washington, D.C.: U.S. Department of Energy, Office of Energy Efficiency and Renewable Energy. ____. 2008c. Technical Support Document: Energy Efficiency Program for Consumer Products and Commercial and Industrial Equipment: Residential Dishwashers, Dehumidifiers, and Cooking Products, and Commercial Clothes Washers. Washington, D.C.: U.S. Department of Energy, Office of Energy Efficiency and Renewable Energy.
48

Ka-BOOM! The Power of Appliance Standards
____. 2008d. Preliminary Technical Support Document: Energy Efficiency Program for Commercial and Industrial Equipment: Small Electric Motors. Washington, D.C.: U.S. Department of Energy, Office of Energy Efficiency and Renewable Energy. ____. 2009a. Notice of Proposed Rulemaking (NOPR) Technical Support Document (TSD): Energy Conservation Standards for General Service Fluorescent Lamps and Incandescent Reflector Lamps. Washington, D.C.: U.S. Department of Energy, Office of Energy Efficiency and Renewable Energy. ____. 2009b. Preliminary Technical Support Document: Energy Efficiency Program for Consumer Products: Energy Conservation Standards for Heating Products. Washington, D.C.: U.S. Department of Energy, Office of Energy Efficiency and Renewable Energy. ____. 2009c. Technical Support Document: Energy Efficiency Program for Consumer Products and Commercial and Industrial Equipment: Residential Dishwashers, Dehumidifiers, and Cooking Products, and Commercial Clothes Washers. Washington, D.C.: U.S. Department of Energy, Office of Energy Efficiency and Renewable Energy. ____. 2009d. Energy Conservation Program: Energy Conservation Standards for Certain Consumer Products (Dishwashers, Dehumidifiers, Microwave Ovens, and Electric and Gas Kitchen Ranges and Ovens) and for Certain Commercial and Industrial Equipment (Commercial Clothes Washers); Final Rule. Washington, D.C.: U.S. Department of Energy, Office of Energy Efficiency and Renewable Energy. ____. 2009e. "Battery Chargers and External Power Supplies." http://www1.eere.energy.gov/buildings/appliance_standards/residential/battery_external.html. Washington, D.C.: U.S. Department of Energy, Office of Energy Efficiency and Renewable Energy. ____. 2009f. "Walk-In Coolers and Walk-In Freezers." http://www1.eere.energy.gov/buildings/appliance_standards/commercial/wicf.html. Washington, D.C.: U.S. Department of Energy, Office of Energy Efficiency and Renewable Energy. ____. 2009g. FY 2010 Congressional Budget Request: Energy Efficiency and Renewable Energy, Electricity Delivery and Energy Reliability, Energy Transformation Acceleration Fund, Nuclear Energy (Volume 3). http://www.cfo.doe.gov/budget/10budget/Content/Volumes/Volume3.pdf. Washington, D.C.: U.S. Department of Energy. ____. 2009h. Final Rule Technical Support Document (TSD): Energy Efficiency Standards for Commercial and Industrial Equipment: Commercial Ice-Cream Freezers; Self-Contained Commercial Refrigerators, Freezers, and Refrigerator-Freezers without Doors; and Remote Condensing Commercial Refrigerators, Freezers, and Refrigerator-Freezers. Washington, D.C.: U.S. Department of Energy, Office of Energy Efficiency and Renewable Energy. ____. 2009i Energy Conservation Program: Energy Conservation Standards and Test Procedures for General Service Fluorescent Lamps and Incandescent Reflector Lamps; Final Rule. Washington, D.C., U.S. Department of Energy, Office of Energy Efficiency and Renewable Energy. (74 Federal Register 34080). ____. 2009j. Energy Conservation Program for Commercial and Industrial Equipment: Energy Conservation Standards for Commercial Ice-Cream Freezers; Self-Contained Commercial Refrigerators, Commercial Freezers, and Commercial Refrigerator-Freezers Without Doors; and Remote Condensing Commercial Refrigerators, Commercial Freezers, and Commercial Refrigerator-Freezers: Final Rule. Washington, D.C., U.S. Department of Energy, Office of Energy Efficiency and Renewable Energy. (74 Federal Register 1092). Ecos Consulting. 2009. Memorandum on External Power Supplies Calculations. Portland, OR: Ecos Consulting. [EIA] Energy Information Administration. Annual Energy Outlook 2000. Washington, D.C.: U.S. Department of Energy, Energy Information Administration. ____. 2008a. Residential Energy Consumption Survey 2005. http://www.eia.doe.gov/emeu/recs/contents.html. Washington, D.C.: U.S. Department of Energy, Energy Information Administration. ____. 2008b. Commercial Buildings Energy Consumption Survey 2003. http://www.eia.doe.gov/emeu/cbecs/contents.html. Washington, D.C.: U.S. Department of Energy, Energy Information Administration.
49

Ka-BOOM! The Power of Appliance Standards
____. 2008c. 2007 Annual Energy Review. Washington, D.C.: U.S. Department of Energy, Energy Information Administration. ____. 2009a. Natural Gas Monthly for February. http://www.eia.doe.gov/oil_gas/ natural_gas/data_publications/natural_gas_monthly/ngm.html. Washington, D.C.: U.S. Department of Energy, Energy Information Administration. ____. 2009b. Electric Power Monthly for March. http://www.eia.doe.gov/cneaf/electricity/epm/matrix96_2000.html. Washington, D.C.: U.S. Department of Energy, Energy Information Administration. ____. 2009c. Annual Energy Outlook for 2009 — ARRA update. Washington, D.C.: U.S. Department of Energy, Energy Information Administration. [eGRID] Emissions and Generated Resource Integrated Database. 2000. Washington, D.C.: U.S. Environmental Protection Agency. [EPA] Environmental Protection Agency. 1998. Compilation of Air Pollutant Emission Factors AP-42. Fifth Edition I, 1.4-1.10. Washington D.C.: U.S. Environmental Protection Agency, Office of Air Quality Planning and Standards. ____. 2000. Average Annual Emissions and Fuel Consumption for Passenger Cars and Light Trucks. Washington, D.C.: U.S. Environmental Protection Agency. ____. 2007. ENERGY STAR Unit Shipment and Market Penetration Report, Calendar Year 2007 Summary. http://www.energystar.gov/ia/partners/downloads/2007_Summary_Report.pdf. Washington, D.C.: U.S. Environmental Protection Agency. ____. 2008. "Savings Calculator — Clothes Washers." http://www.energystar.gov/index.cfm? c=clotheswash.pr_clothes_washers. Washington, D.C.: U.S. Environmental Protection Agency. ____. 2009a. "2007 ENERGY STAR Qualified Appliance Retail Sales Data." http://www.energystar.gov/ index.cfm?c=manuf_res.pt_appliances. Washington, D.C.: U.S. Environmental Protection Agency. ____. 2009b. "Energy Star Incremental Savings for Commercial Refrigeration." Washington, D.C.: U.S. Environmental Protection Agency. [ET] Emerging Technologies Conference. 2004. ""Emerging Technologies in Energy Efficiency Summit, 2004." San Francisco, CA: American Council for an Energy-Efficiency Economy. Fassler, Richard [Power Integrations]. 2009. Personal communication to Max Neubauer. San Jose, Calif.: Power Intergrations. [FTC] Federal Trade Commission. 2008. 2008 Standard Clothes Washer Energy Data. http://www.ftc.gov/bcp/conline/edcams/eande/appliances/data/2008/clwasher/standard_effic.pdf. Washington, D.C.: Federal Trade Commission. [GAMA] Gas Appliance Manufacturers Association. 2007. Statistical Highlights for Direct Heating Equipment. Arlington, VA: Gas Appliance Manufacturers Association. [GAO] Government Accountability Office. 2007. Energy Efficiency: Longstanding Problems with DOE’s Program for Setting Efficiency Standards Continue to Result in Forgone Energy Savings. Washington, D.C.: U.S. Government Accountability Office. Geller, H. 1995. National Appliance Efficiency Standards: Cost-Effective Federal Regulations. Washington, D.C.: American Council for an Energy-Efficient Economy. Goldstein, David. 2009. Personal communication to Max Neubauer. Washington, D.C.: Natural Resources Defense Council.
50

Ka-BOOM! The Power of Appliance Standards
Greening, L., A. Sanstad, J. McMahon, T. Wenzel, and S. Pickle. 1996. “Retrospective Analysis of National Energy Efficiency Standards for Refrigerators.” In Proceedings of the ACEEE Summer Study of Energy Efficiency in Buildings, 9.101–9.109. Washington, D.C.: American Council for an Energy-Efficient Economy. Kubo, T., H. Sachs, and S. Nadel. 2001. Opportunities for New Appliance and Equipment Efficiency Standards: Energy and Economic Savings Beyond Current Standards Programs. Washington, D.C.: American Council for an Energy-Efficient Economy. [LBNL] Lawrence Berkeley National Lab. 2007. "Savings Estimate for Home Appliance March 20, 2007 Negotiated Agreement. Berkeley, Calif.: Lawrence Berkeley National Lab. ____. 2009. Personal Communication from James McMahon to Marianne DiMascio. June. Washington, D.C.: American Council for an Energy-Efficient Economy. Lutz, James D. 2004. "Lest We Forget, a Short History of Housing the in the United States." In Proceedings of the 2004 Summer Study in Buildings. Washington, D.C.: American Council for an Energy-Efficient Economy. McInerney E., Anderson V. 1997. "Appliance Manufacturers’ Perspective on Energy Standards." Energy and Buildings. 26:17-22. McKinsey and Company. 2007. Reducing U.S. Greenhouse Gas Emissions: How Much at What Cost? Atlanta, Ga.: McKinsey Global Institute. Meyers S., McMahon J., McNeil, M. 2005. Realized and Prospective Impacts of U.S. Energy Efficiency Standards for Residential Appliances: 2004 Update. Berkeley, Calif.: Lawrence Berkeley National Laboratory. Nadel, S. 2002. "Appliance and Equipment Efficiency Standards." In Annual Review of Energy and the Environment, 159–192. R. Socolow, D. Anderson, and J. Harte, eds. Palo Alto, Calif.: Annual Reviews. ____. 2005. "Form for Submittal of Proposed Change to ASHRAE Standard Under Continuous Maintenance." Washington, D.C.: American Council for an Energy-Efficient Economy. Nadel, S., A. deLaski, J. Kliesch, A. Shipley, E. Osann, and C. Harak. 2004. “Powerful Priorities: Updating Energy Efficiency Standards for Residential Furnaces, Commercial Air Conditioners, and Distribution Transformers. Washington, D.C.: American Council for an Energy-Efficient Economy. Nadel, S. and M. Pye. 1996. Appliance and Equipment Efficiency Standards: Impacts by State. Washington, D.C.: American Council for an Energy-Efficient Economy. Nadel, S., M. Pye, and J. Jordan. 1994. Achieving High Participation Rates: Lessons Taught by States. Washington, D.C.: American Council for an Energy-Efficient Economy. Nadel, S. and M. Suozzo. 1996. The Need and Opportunities for State Action on Equipment Efficiency Standards. Washington, D.C.: American Council for an Energy-Efficient Economy. [NARUC] National Association of Regulatory Utility Commissioners. 2009. "Resolution Supporting U.S. Department of Energy's Energy Efficiency Standards.” Washington, D.C.: National Association of Regulatory Utility Commissioners. National Commission on Energy Policy. 2004. Ending the Energy Stalemate: A Bipartisan Strategy to Meet America's Energy Challenges. Washington, D.C.: National Commission on Energy Policy. National Energy Policy Group. 2001. National Energy Policy. U.S. Government Printing Office, May. National Petroleum Council. 2003. Balancing Natural Gas Policy — Fueling the Demands of a Growing Economy; Volume 1: Summary Findings and Recommendations. Washington D.C.: National Petroleum Council. [ORNL] Barnes, P.R., S. Das, B.W. McConnell, and J.W. van Dyke. 1997. Supplement to the "Determination Analysis (ORNL-6847) and Analysis of the NEMA Efficiency Standard for Distribution Transformers. ORNL-6925. Oak Ridge, Tenn.: Oak Ridge National Laboratory.
51

Ka-BOOM! The Power of Appliance Standards
[PG&E] Pacific Gas and Electric Company. 2004. Codes and Standards Enhancement Initiative for PY2002: Title 20 Standards Development: [Preliminary Draft] Analysis of Standards Options for Consumer Battery Chargers. Prepared by Ecos Consulting, Energy Solutions, and Davis Energy Group. San Francisco, Calif.: Pacific Gas & Electric Company.
____. 2005. Codes and Standards Enhancement Initiative for PY2004: Title 20 Standards Development: Analysis of Standards Options for BR, ER, and R20 Incandescent Lamps. Prepared by the American Council for an Energy-Efficient Economy and Energy Solutions. San Francisco, Calif.: Pacific Gas & Electric Company.
____. 2007. Analysis of Standards Options for Residential Refrigerators. Prepared by the American Council for an Energy-Efficient Economy. San Francisco, Calif.: Pacific Gas and Electric Company.
____. 2008a. Codes and Standards Enhancement Initiative for PY2008: Title 20 Standards Development: Analysis of Standards Options for Linear Fluorescent Fixtures. Prepared by Katie Ackerly and Steven Nadel, American Council for an Energy-Efficient Economy and Lighting Wizards. San Francisco, Calif.: Pacific Gas & Electric Company.
____. 2008b. Codes and Standards Enhancement (CASE) Initiative for PY2008: Title 20 Standards Development: Analysis of Standards Options for High-Intensity Discharge Lighting Fixtures. Prepared by American Council for an Energy-Efficient Economy. San Francisco, Calif.: Pacific Gas & Electric Company.
____. 2008c. Codes and Standards Enhancement Initiative for PY2008: Title 20 Standards Development: Proposal Information Template for Battery Charger Systems. Prepared by Paul Bendt, Peter May-Ostrendorpm, Brooke Frazer, and Riley Neugebauer, Ecos Consulting. San Francisco, Calif.: Pacific Gas & Electric Company.
____. 2009. Internal Analysis. San Francisco, Calif.: Pacific Gas & Electric.
Pigg, Scott. 2003. Electricity Use by New Furnaces, A Wisconsin Field Study. Madison, Wisc.: Wisconsin Focus on Energy.
Sachs, Harvey and Sandy Smith. 2004. How Much Energy Could Residential Furnace Air Handlers Save? Atlanta, Ga.: American Society of Heating, Refrigeration, and Air-Conditioning Engineers .
Sachs, Harvey and Katie Ackerly. 2008. "Measuring Furnace Fan Energy Savings." ACEEE Internal Brief. Washington, D.C.: American Council for an Energy-Efficient Economy.
[SCE] Southern California Edison. 2008. Preliminary CASE Report: Analysis of Standards Options for Walk-in Refrigerated Storage. Prepared by Heschong Mahone Group. Fair Oaks, Calif.: Southern California Edison.
[SCG] Southern California Gas. 2006. Express Rebates 2006. Los Angeles, Calif.: Southern California Gas.
[SWEEP] Southwest Energy Efficiency Project. 2002. The New Mother Lode: The Potential for More Efficient Electricity Use in the Southwest. Boulder, CO: Southwest Energy Efficiency Project.
Thorne Amman, J., A. Wilson, and K. Ackerly. 2007. Consumers Guide to Home Energy Savings. Washington, D.C.: American Council for an Energy-Efficient Economy.
TIAX LLC. 2005. High Efficiency, High Performance Clothes Dryer. Prepared for the U.S. Department of Energy. Cambridge, Mass.: TIAX LLC.
United States District Court for the Southern District of New York. 2006. State of New York, et al. v. Bodman and Natural Resources Defense Council, et. al. V. Bodman. No. 05 Civ. 7807 and No. 05 Civ. 7808 Consent Decree. November 11.
U.S. Congress. 1987. National Appliance Energy Conservation Act of 1987, Public Law 100-12. March 17. Washington, D.C.: U.S. Government Printing Office.
____. 1992. Energy Policy Act of 1992, Conference Report to Accompany H.R. 776. October 5. Washington, D.C.: U.S. Government Printing Office.
____. 2005. Energy Policy Act of 2005, Conference Report to Accompany H.R. 6. Washington, D.C.: U.S. Government Printing Office.
Vestel L.B. 2009 Incandescent Bulbs Return to the Cutting Edge. New York, N.Y.: New York Times. July 6, 2009.
52

Ka-BOOM! The Power of Appliance Standards
Appendix A. Methodology, Assumptions, and Sources
To calculate the potential energy savings of new standards for the products discussed in this report, we started with national estimates of equipment sales, per unit energy use, energy savings, and peak demand. The energy and peak demand savings then drove the calculation of the economic savings and emissions reductions achieved nationally. Economic savings were calculated on a consumer basis by multiplying energy savings by national average retail rates (residential or commercial rates, as appropriate). We used retail rates from 2008 data compiled by the U.S. Energy Information Administration (EIA 2009a, 2009b). These rates are presented in Table A.2. We assumed retail rates remain constant through 2030. However, it is unlikely that retail electricity rates will remain static in the future; in fact, it is more likely that they will increase over time. Higher future retail rates will mean greater economic savings per unit of energy savings, and vice versa for lower retail rates. We calculated economic costs by multiplying the per-unit incremental cost for each product by the number of units sold. Cumulative costs and cumulative savings cover the period from the effective date of the standard to 2030, and we discounted them to 2009 using a 5% real discount rate. Similarly, we derived emissions reductions by multiplying the primary energy savings by an average marginal emission factor for the United States, which we took from a DOE projection for 2020. We assumed that the marginal emission factor in 2020 and 2030 was constant.
Table A-5. Basis for and Assumed Standard, Assumed Equipment Life, Annual Per-Unit Energy Savings and Incremental Costs
Assumed Standard
(max. energy use
of min. efficiency)
Average Per Unit Annual Energy Svgs
(kWh, therms)
Average Life of
Equipment
Incremental Equipment
Cost Product Basis for Standard
Residential: PG&E Internal Analysis
Varies by type Battery chargers 6 4 $1
$255 Central AC & HP Energy Star SEER 14 18 230 $108 cooling (includes A/C and HP) Energy Star HSPF 8.2 18 315 $147 heating (HP in heating mode only)
Clothes dryers 10% reduction in energy consumption
19 93 $50 ACEEE Estimate electricity
10% reduction in energy consumption
ACEEE Estimate 19 4 $50 (gas)
$96 Clothes washers Minimum 2.0 MEF CEE Tier 2 11 22 $9 (electricity)
Minimum 2.0 MEF CEE Tier 2 11 222 $87 (electricity - water heating)
Minimum 2.0 MEF CEE Tier 2 11 10 $87 (gas)
53
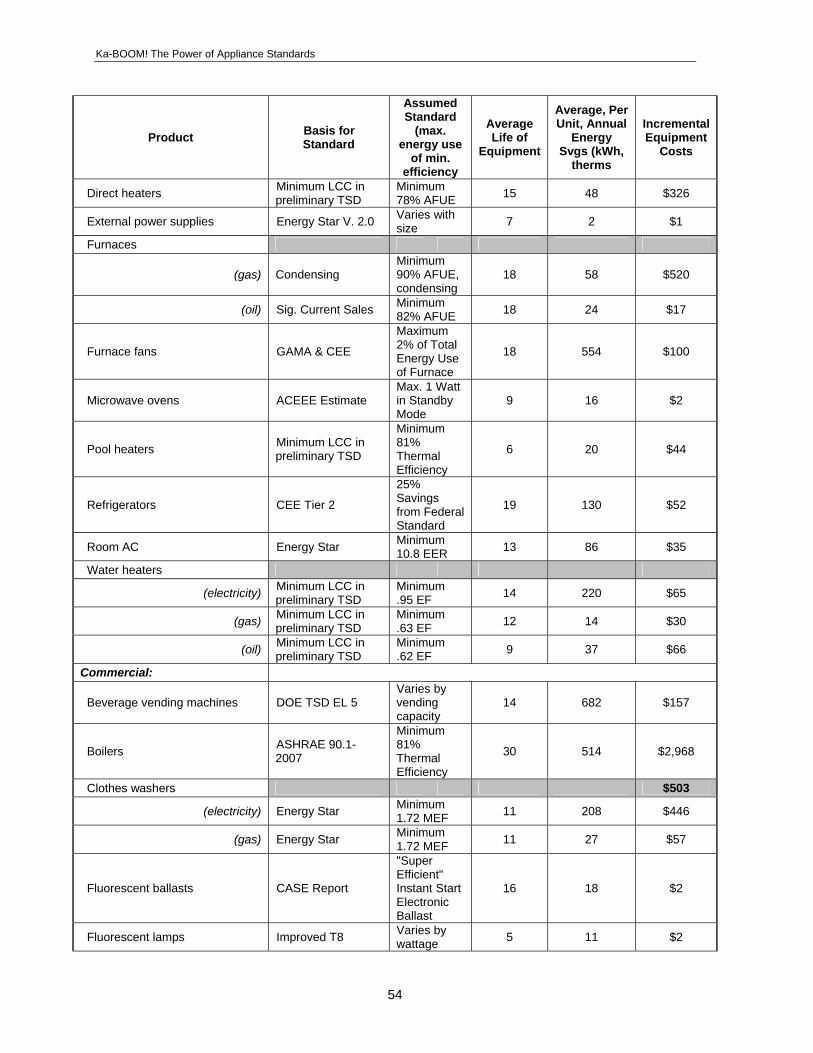
Ka-BOOM! The Power of Appliance Standards
Assumed Standard
(max. energy use
of min. efficiency
Average, Per Unit, Annual Average IncrementalBasis for
Standard Product Life of Energy Equipment Svgs (kWh, Equipment Costs
therms
Minimum LCC in preliminary TSD
Minimum 78% AFUE Direct heaters 15 48 $326
Varies with size External power supplies Energy Star V. 2.0 7 2 $1
Furnaces Minimum 90% AFUE, condensing
Condensing 18 58 $520 (gas)
Minimum 82% AFUE Sig. Current Sales 18 24 $17 (oil)
Maximum 2% of Total Energy Use of Furnace
Furnace fans GAMA & CEE 18 554 $100
Max. 1 Watt in Standby Mode
Microwave ovens ACEEE Estimate 9 16 $2
Minimum 81% Thermal Efficiency
Minimum LCC in preliminary TSD Pool heaters 6 20 $44
25% Savings from Federal Standard
19 130 $52 Refrigerators CEE Tier 2
Minimum 10.8 EER Room AC Energy Star 13 86 $35
Water heaters Minimum LCC in preliminary TSD
Minimum .95 EF 14 220 $65 (electricity)
Minimum LCC in preliminary TSD
Minimum .63 EF 12 14 $30 (gas)
Minimum LCC in preliminary TSD
Minimum .62 EF 9 37 $66 (oil)
Commercial: Varies by vending capacity
Beverage vending machines DOE TSD EL 5 14 682 $157
Minimum 81% Thermal Efficiency
ASHRAE 90.1-2007 Boilers 30 514 $2,968
$503 Clothes washers Minimum 1.72 MEF Energy Star 11 208 $446 (electricity)
Minimum 1.72 MEF Energy Star 11 27 $57 (gas)
"Super Efficient" Instant Start Electronic Ballast
Fluorescent ballasts CASE Report 16 18 $2
Varies by wattage Fluorescent lamps Improved T8 5 11 $2
54
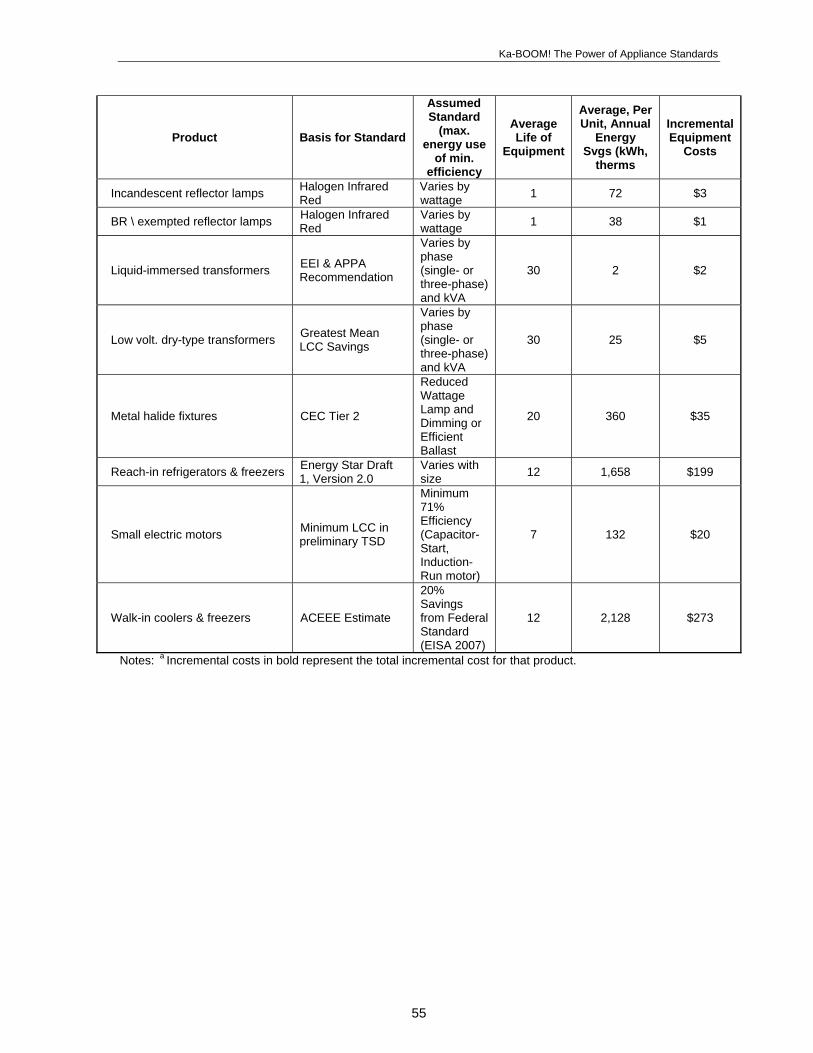
Ka-BOOM! The Power of Appliance Standards
Assumed Standard
(max. energy use
of min. efficiency
Average, Per Unit, Annual Average Incremental
Product Basis for Standard Life of Energy Equipment Svgs (kWh, Equipment Costs
therms
Halogen Infrared Red
Varies by wattage Incandescent reflector lamps 1 72 $3
Halogen Infrared Red
Varies by wattage BR \ exempted reflector lamps 1 38 $1
Varies by phase (single- or three-phase) and kVA
EEI & APPA Recommendation Liquid-immersed transformers 30 2 $2
Varies by phase (single- or three-phase) and kVA
Greatest Mean LCC Savings Low volt. dry-type transformers 30 25 $5
Reduced Wattage Lamp and Dimming or Efficient Ballast
Metal halide fixtures CEC Tier 2 20 360 $35
Energy Star Draft 1, Version 2.0
Varies with size Reach-in refrigerators & freezers 12 1,658 $199
Minimum 71% Efficiency (Capacitor-Start, Induction-Run motor)
Minimum LCC in preliminary TSD Small electric motors 7 132 $20
20% Savings from Federal Standard (EISA 2007)
Walk-in coolers & freezers ACEEE Estimate 12 2,128 $273
a Notes: Incremental costs in bold represent the total incremental cost for that product.
55

Ka-BOOM! The Power of Appliance Standards
56
Table A-6. Summary Table of the National Benefits of New Federal Efficiency Standards
Summary of Benefits by Product 2020 2030
Products Effective
Date
Annual Svgs
per Unit Units
Incre-mental
Cost per Unit Savings
Summer Peak
Capacity Reduction Energy Savings
Summer Peak
Capacity Reduction
B/C Ratio
Net Present Value1
Year $ TWh
TBtu [Billion gallons water] GW TWh
TBtu [Billion gallons water] GW
$Million (2009$)
Residential Battery chargers 2014 4 kWh $ 1 9.1 94.9 1.3 9.1 91.5 1.3 4.0 $ 5,811 Central AC & HP 2016 545 kWh $ 255 5.3 55.6 6.0 17.2 172.7 19.4 2.8 $ 7,331 Clothes dryers (total) 2014 - - $ 50 3.6 41.1 0.5 9.2 101.1 1.4 2.2 $ 4,133
(electricity) 2014 93 kWh $ 50 3.6 37.6 0.5 9.2 92.2 1.4 2.5 $ 4,034 (gas) 2014 4 therms $ 50 NA 3.5 NA NA 8.9 NA 1.1 $ 99
Clothes washers 2015 244 kWh $ 96 3.8 59.4 0.6 7.6 116.0 1.1 4.3 $ 15,627
(electricity - machine) 2015 22 kWh $ 9 0.7 7.7 0.1 1.5 14.9 0.2 7.8 $ 603
(electricity - water heating) 2015 222 kWh $ 87 3.0 31.7 0.5 6.1 61.2 0.9 NA $ 2,474
(gas) 2015 10 therm $ 87 NA 20.0 NA NA 39.9 NA 5.4 $ 815
(water) 2015 5234 gallons $ - Bil. Gal.--> [273.45] NA Bil. Gal.--> [546.9] NA NA $ 11,735 Direct heaters2 2013 48 therm $ 326 NA 7.5 NA NA 15.2 NA 1.8 $ 652
(gas) 2013 48 therm $ 326 NA 9.0 NA NA 18.0 NA 2.1 $ 866 External power supplies 2013 2 kWh $ 1 2.1 21.6 0.3 2.1 20.8 0.3 1.4 $ 544 Furnaces (gas) 2013 58 therms $ 520 NA 80.1 NA NA 186.9 NA 1.8 $ 7,058 Furnaces (oil) 2013 24 gallons $ 17 NA 2.3 NA NA 5.4 NA 81.1 $ 843 Furnace fans 2016 554 kWh $ 100 6.5 68.1 3.6 21.0 211.6 11.7 6.2 $ 11,735
Microwave ovens 2012 16 kWh $ 2 1.8 18.4 0.3 1.9 18.8 0.3 5.7 $ 1,453
Pool heaters 2013 20 therms $ 44 NA 2.9 NA NA 2.9 NA 3.2 $ 226 Refrigerators 2014 130 kWh $ 52 6.6 69.0 1.0 16.8 169.1 2.5 3.4 $ 8,640 Room AC 2014 86 kWh $ 35 1.7 17.7 2.4 3.3 32.8 4.6 2.6 $ 1,467 Water heaters 2013 - - $ - 7.7 127.8 1.1 14.4 220.7 2.0 4.4 $ 14,396
(electricity) 2013 220 kWh $ 65 7.7 80.3 1.1 14.4 144.6 2.0 3.8 $ 8,262

Ka-BOOM! The Power of Appliance Standards
57
Summary of Benefits by Product 2020 2030
Products Effective
Date
Annual Svgs
per Unit Units
Incre-mental
Cost per Unit Savings
Summer Peak
Capacity Reduction Energy Savings
Summer Peak
Capacity Reduction
B/C Ratio
Net Present Value1
Year $ TWh
TBtu [Billion gallons water] GW TWh
TBtu [Billion gallons water] GW
$Million (2009$)
(gas) 2013 14 therms $ 30 NA 47.5 NA NA 76.0 NA 5.7 $ 6,134 Commercial
Beverage vending machines 2012 682 kWh $ 157 0.3 3.1 0.1 0.5 4.8 0.1 4.5 $ 286
Commercial boilers 2013 514 therms $ 2,968 NA 4.8 NA NA 11.1 NA 3.2 $ 771
Clothes washers (total) 2012 - - $ 503 0.4 8.2 0.1 0.4 10.1 0.1 1.2 $ 239
(electricity) 2012 208 kWh $ 446 0.4 3.7 0.1 0.4 4.4 0.1 NA $ (560)
(gas) 2012 27 therm $ 57 NA 4.5 NA NA 5.7 NA NA $ 425
(water) 2012 5827 gallons $ - Bil. Gal.--> [10.6] NA Bil. Gal.--> [13.31] NA NA $ 373 Fluorescent ballasts 2014 18 kWh $ 2 2.1 21.5 0.7 5.1 51.1 1.7 9.7 $ 2,815 Fluorescent lamps 2012 11 kWh $ 2 25.3 264.2 8.3 25.3 254.9 8.3 2.2 $ 12,853 Incandescent reflector lamps 2012 62 kWh $ 3 7.5 78.1 1.8 7.5 75.3 1.8 2.9 $ 5,061 BR \ exempted reflector lamps 2013 38 kWh $ 1 3.4 35.4 0.8 3.4 34.2 0.8 3.6 $ 2,777 Liquid-immersed transformers 2016 2 kWh $ 2 0.9 9.5 0.1 2.9 29.6 0.4 1.7 $ 928 Low-voltage dry type
transformers 2016 25 kWh $ 5 2.5 26.5 0.4 8.2 82.3 1.1 7.3 $ 5,643 Metal halide lamp fixtures 2015 360 kWh $ 35 4.6 47.5 1.5 12.8 129.0 4.2 13.2 $ 7,836 Reach-in refrigerators and
freezers 2016 1658 kWh $ 199 0.8 8.2 0.2 2.1 21.1 0.5 7.6 $ 1,019 Small electric motors 2015 132 kWh $ 20 3.7 38.7 0.6 4.7 47.5 0.7 3.9 $ 2,429 Walk-in refrigerators and
freezers 2015 2128 kWh $ 273 0.6 6.1 0.1 1.3 12.8 0.3 7.1 $ 676 Total 100 1,218 31.70 177 2,129 64.65 $ 123,249
Notes: 1 Net present value is the total monetary value of bill savings achieved by products sold under the standards between now and 2030 minus the total incremental product cost incurred by purchasers as a result of the standards over the same period expressed in current dollars. Both costs and savings are discounted using a 5% real discount rate. 2 Values for direct heaters include loss of savings attributable to the incorporation of electronic ignition in the new standard, whereas the baseline technology including a standing pilot light. The incremental cost includes the cost associated with electronic ignition, while energy savings (TBtu), B/C ratio, and Net Present Value are net of the additional cost associated with electricity consumption.

Ka-BOOM! The Power of Appliance Standards
Detailed Methodology 1) Calculation of national energy and peak demand savings We obtained national energy savings from proposed new standards by multiplying annual national sales figures for each appliance by per-unit energy savings. Per unit savings are the difference between a product just meeting the proposed standard and a typical basic efficiency new product. (We assume the distribution of efficiency levels above the current baseline and above a future standard are the same, except we assume zero savings for sales that currently meet the proposed standards.) The analysis is static and assumes that equipment sales remain at current levels for all products. We also assumed that, in the absence of standards, efficiency levels remain at present levels. In actuality, product sales and efficiency are gradually increasing, even in the absence of standards. Thus, we implicitly assumed that these factors counterbalance each other. We used the following equation to calculate end-use electricity savings in 2015, 2020, and 2030:
End-use electricity savings = annual sales volume x per-unit electricity savings x (1 – current market share of new standard) x (years from effective date - 0.5)
Similarly, we used the following equation to calculate end-use natural gas (NG) savings in 2015, 2020, and 2030:
NG savings = annual sales volume x per-unit NG savings x (1 – current market share of new standard) x (years from effective date - 0.5)
In each case, we used equation (a) when the average product lifetime is longer than the number of years from the effective date. We subtracted 0.5 from the number of effective years to account for sales throughout the purchase year, so the savings from units installed during the year will be equivalent to only half-year sales multiplied by the annual savings per unit. For heat rates to calculate primary energy savings (primary energy input required to generate a unit of electricity, in Btu/kWh), we use 10,764 Btu/kWh for 2010, 10,424 Btu/kWh for 2020, and 10,056 for 2030 (EIA 2005). We use a 0.91 T&D loss factor — a 9% T&D loss (EIA 2008c). To calculate peak generation savings, we multiplied electric generation savings by a peak factor (kilowatt per kilowatt-hour) that quantifies the fraction of a product’s annual hours of usage that occur during times of peak system demand. Table A.5 provides the sources of the peak factors used in the analysis. We calculated peak capacity savings as:
Peak capacity savings = end-use electricity savings ÷ T&D loss factor x peak factor x reserve factor
The analysis assumed a conservative 10% reserve margin. Thus the reserve factor in the formula is 1.1. Historically, a reserve margin of 20% was typical, but utilities have cut down their margins during restructuring of the electric utility industry. For overall water savings, we considered both direct and indirect water savings. Direct water savings are reduced water use for efficient products such as commercial clothes washers and pre-rinse spray valves. These savings were calculated using the same methodology as for energy savings. Indirect water savings are water used at the power plant as part of the generation of electricity. For these calculations, we assumed 0.5 gallons of water saved per kWh of electricity, which in turn is based on an assumption that about half of the displaced generation is coal-fired and about half is gas-fired. Data on water use for coal and gas generation comes from data collected by the Southwest Energy Efficiency Project (SWEEP 2002).
58

Ka-BOOM! The Power of Appliance Standards
2) Calculating Economic Costs and Savings We calculated consumer bill savings using the following formula:
Consumer bill savings = end-use electricity savings x national average electricity price+ natural gas savings x national average natural gas price
For electricity and natural gas prices used for this analysis, see Table A-7.
Table A-7. Average 2008 Retail Energy Costs for the U.S.
Natural Gas Prices, 2008 ($/1000 cubic feet or $/10 therms)
Electric Prices, 2008 (cents per kWh)
Res. Comm. Ind. Res. Comm. Ind.11.35 10.27 7.02 13.68 11.98
We calculated expected investment using the following formula:
Expected investment = annual sales volume x per-unit incremental cost We discounted present value (PV) calculations to 2009 assuming a 5% real discount rate. The PV of expected investment aggregates the present value of annual investments from the effective date of each standard through 2030. The PV of savings aggregates the present value of societal savings/consumer bill savings from the effective date of the standard through the year in which products installed through 2030 die out. Essentially, these two measures give the cumulative costs and benefits of standard-complying products installed through 2030. Subtracting the PV of investments from the PV of savings yields the net present value (NPV) of the standards policy. Market barriers to improved energy efficiency include the following demand- and supply-side barriers. 3) Calculating Emission Reductions We calculated carbon dioxide, nitrogen oxide, sulfur dioxide, and particulate emissions reductions for products using the following equation:
Emission Reductions = end-use electricity savings ÷ T&D loss factor x national marginal emission factor
We used a marginal emission factor calculated at the national level rather than straight emissions factors from the projected fuel mix. This gives a more accurate estimate of emissions reductions from new standards. For example, coal-fired power plants are often base load plants — they are the dirtiest, but also the cheapest to operate under current regulatory conditions, so they are likely to remain in operation. Power plants that operate on the margin, however, are generally more expensive to operate, which is why they only operate during peak periods, i.e., on the margin. Carbon dioxide emissions factors for electricity are based on projections from DOE's national impact analysis on distribution transformers (DOE 2007c). Carbon dioxide emissions savings for natural gas are based on DOE projections (EIA 2000). Nitrogen oxides, sulfur dioxide, and particulate emissions reductions are based on data from the EPA Office of Air Quality Planning and Standards (EPA 1998). Specific national average emissions factors are summarized in Table A-8.
Table A-8. National Average Emissions Factors
CO NO SO PM2 x 2 10Electricity (tons/GWh 620 0.53 2.45 0.03 NG & Oil (MMT/Quad) 54.18 41.8 0.27 3.38
59
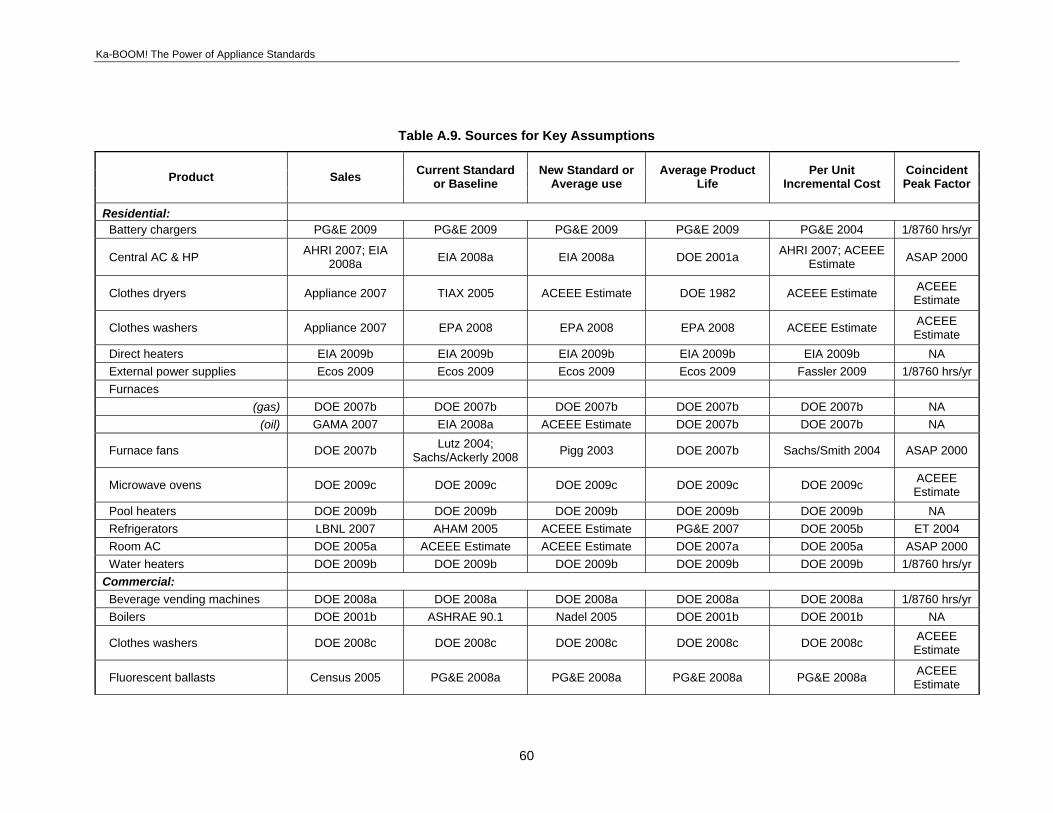
Ka-BOOM! The Power of Appliance Standards
Table A.9. Sources for Key Assumptions
Product Sales Current Standard or Baseline
New Standard or Average use
Average Product Life
Per Unit Incremental Cost
Coincident Peak Factor
Residential: Battery chargers PG&E 2009 PG&E 2009 PG&E 2009 PG&E 2009 PG&E 2004 1/8760 hrs/yr
AHRI 2007; EIA 2008a
AHRI 2007; ACEEE Estimate Central AC & HP EIA 2008a EIA 2008a DOE 2001a ASAP 2000
ACEEE Estimate Clothes dryers Appliance 2007 TIAX 2005 ACEEE Estimate DOE 1982 ACEEE Estimate
ACEEE Estimate Clothes washers Appliance 2007 EPA 2008 EPA 2008 EPA 2008 ACEEE Estimate
Direct heaters EIA 2009b EIA 2009b EIA 2009b EIA 2009b EIA 2009b NA External power supplies Ecos 2009 Ecos 2009 Ecos 2009 Ecos 2009 Fassler 2009 1/8760 hrs/yr Furnaces
DOE 2007b DOE 2007b DOE 2007b DOE 2007b DOE 2007b NA (gas) GAMA 2007 EIA 2008a ACEEE Estimate DOE 2007b DOE 2007b NA (oil)
Lutz 2004; Sachs/Ackerly 2008 Furnace fans DOE 2007b Pigg 2003 DOE 2007b Sachs/Smith 2004 ASAP 2000
ACEEE Estimate Microwave ovens DOE 2009c DOE 2009c DOE 2009c DOE 2009c DOE 2009c
Pool heaters DOE 2009b DOE 2009b DOE 2009b DOE 2009b DOE 2009b NA Refrigerators LBNL 2007 AHAM 2005 ACEEE Estimate PG&E 2007 DOE 2005b ET 2004 Room AC DOE 2005a ACEEE Estimate ACEEE Estimate DOE 2007a DOE 2005a ASAP 2000 Water heaters DOE 2009b DOE 2009b DOE 2009b DOE 2009b DOE 2009b 1/8760 hrs/yr
Commercial: Beverage vending machines DOE 2008a DOE 2008a DOE 2008a DOE 2008a DOE 2008a 1/8760 hrs/yr Boilers DOE 2001b ASHRAE 90.1 Nadel 2005 DOE 2001b DOE 2001b NA
ACEEE Estimate Clothes washers DOE 2008c DOE 2008c DOE 2008c DOE 2008c DOE 2008c
ACEEE Estimate Fluorescent ballasts Census 2005 PG&E 2008a PG&E 2008a PG&E 2008a PG&E 2008a
60

Ka-BOOM! The Power of Appliance Standards
Product Sales Current Standard or Baseline
New Standard or Average use
Average Product Life
Per Unit Incremental Cost
Coincident Peak Factor
ACEEE Estimate Fluorescent lamps DOE 2009a DOE 2009a DOE 2009a DOE 2009a DOE 2009a
ACEEE Estimate Incandescent reflector lamps DOE 2009a DOE 2009a DOE 2009a DOE 2009a DOE 2009a
DOE 2009a; PG&E 2005
DOE 2009a; PG&E 2005
ACEEE Estimate; PG&E 2005
ACEEE Estimate BR \ exempted reflector lamps DOE 2009a DOE 2009a
ORNL 1997; DOE 2007c
ORNL 1997; DOE 2007c
ORNL 1997; DOE 2007c Liquid-immersed transformers DOE 2007c DOE 2007c 1/8760 hrs/yr
ORNL 1997; DOE 2004
ORNL 1997; DOE 2004
ORNL 1997; DOE 2004 Low volt. dry-type transformers DOE 2004 DOE 2004 1/8760 hrs/yr
ACEEE Estimate Metal halide fixtures PG&E 2008b PG&E 2008b PG&E 2008b PG&E 2008b PG&E 2008b
Reach-in refrigerators & freezers
ACEEE Estimate EPA 2007 DOE 2009h DOE 2009h DOE 2009h EPA 2009b
ACEEE Estimate Small electric motors DOE 2008d DOE 2008d DOE 2008d DOE 2008d DOE 2008d
ACEEE Estimate Walk-in coolers & freezers SCE 2008 SCE 2008 SCE 2008 SCE 2008 SCE 2008
61

Ka-BOOM! The Power of Appliance Standards
62
Ka-BOOM! The Power of Appliance Standards
Appendix B. Market Barriers Minimum-efficiency standards make sense when high-efficiency products are readily available or can be readily produced and are cost-effective. However, due to a number of market barriers, many consumers and businesses are purchasing less-efficient products. These market barriers include the following demand- and supply-side barriers. Demand-Side Barriers • Lack of awareness: Many purchasers underestimate the amount of energy consumption and the
associated environmental impacts of operating the equipment. Very often, they are not even aware that different models can consume significantly different amounts of energy and that buying more efficient products can lead to energy and utility bill savings.
• Uninformed decision-makers/”panic purchases”: Even when the purchaser is aware of variations in energy efficiency, often they are too busy or rushed to research the cost-effectiveness of a decision, or information on high-efficiency products is not readily available. Many of these products are purchased once in a decade, so maintaining awareness to facilitate an occasional decision is not something most consumers can do. When purchases are made, often the buyer is in a rush (e.g., a broken-down furnace or refrigerator must be replaced quickly). In such “panic purchase” situations, efficiency performance gets little attention and choices are, at best, limited to what is in stock. In the commercial/industrial sector, many purchasing decisions are made by purchasing or maintenance staff that are unfamiliar with the relative efficiencies and operating costs of the equipment they purchase.
• Third-party decision-makers (“split incentive”): Many times the decision-maker (e.g., developer or
landlord, purchasing department, etc.) is responsible for purchasing equipment but someone else (e.g., tenant, operating department, etc.) is responsible for paying the energy bills. In these instances, the purchaser tends to buy the least expensive equipment because he or she receives none of the benefits from improved equipment efficiency.
• Financial procedures that overemphasize initial costs and de-emphasize operating costs: In the commercial/industrial sector, accounting procedures often closely scrutinize capital costs, favoring purchase of inexpensive equipment, while operating costs are generally less scrutinized. Furthermore, when operating costs are reduced, the savings typically show up in a corporate-level account and are rarely passed on to the department that made the decision and the investment. This diversion of benefits discourages energy-saving investments (Nadel and Suozzo 1996).
• Small per unit savings: While per unit savings may seem significant to the individual consumer for
some appliances and equipment types (e.g., heating and cooling equipment), for others the per-unit savings may be so small as to be inconsequential to the individual consumer. For example, an efficient external power supply for electronic equipment may save less than a dollar’s worth of electricity a year, an amount unlikely to influence many consumers’ purchase decisions. However, because 250 million or so of these devices are sold nationally each year, large energy savings are at stake for states or the nation as a whole.
Supply-Side Barriers
• Limited stocking of efficient products: Equipment distributors generally have limited storage space
and therefore only stock equipment that is in high demand. This creates a "Catch-22" situation: users purchase inefficient equipment so distributors only stock inefficient equipment. Purchasing efficient equipment thus may require a special order, which takes more time. Most equipment that fails needs to be replaced immediately. Thus, if efficient equipment is not in stock, even
63
Ka-BOOM! The Power of Appliance Standards
customers who want efficient equipment are often stuck purchasing standard equipment (Nadel and Suozzo 1996).
• Efficiency bundled into premium products only: Often manufacturers will produce commodity-
grade and value-added product lines. The commodity-grade line just meets efficiency standards and includes only basic features. The value-added line includes improved efficiency and other extra non-energy features at a significantly higher cost than commodity-grade products. A portion of the extra cost is for the improved efficiency but much of the extra cost is for the added “bells and whistles.” Consumers desiring improved efficiency without the extra features are out of luck.
• Manufacturer price competition: Since manufacturers are competing for market share, if a
manufacturer voluntarily increases efficiency in a commodity product line, they may find it impossible to pass on even small product cost increases to consumers without risking loss of market share. In contrast, mandatory standards ensure a level playing field for all manufacturers.
64