Embed Size (px)
Citation preview

ChemicalScience
EDGE ARTICLE
Ope
n A
cces
s A
rtic
le. P
ublis
hed
on 2
7 O
ctob
er 2
015.
Dow
nloa
ded
on 1
0/8/
2021
1:2
6:08
AM
. T
his
artic
le is
lice
nsed
und
er a
Cre
ativ
e C
omm
ons
Attr
ibut
ion
3.0
Unp
orte
d L
icen
ce.
View Article OnlineView Journal | View Issue
K2xSn4�xS8�x (x ¼
aDepartment of Chemistry, Northwestern Uni
60208, USA. E-mail: m-kanatzidis@northwebMaterials Science Division, Argonne Nation
† Electronic supplementary informatiothermogravimetric analysis, scannicrystallographic le (CIF) containing cryscoordinates with equivalent isotropic ddisplacement parameters, and selected10.1039/c5sc03040d
Cite this: Chem. Sci., 2016, 7, 1121
Received 16th August 2015Accepted 24th October 2015
DOI: 10.1039/c5sc03040d
www.rsc.org/chemicalscience
This journal is © The Royal Society of C
0.65–1): a new metal sulfide forrapid and selective removal of Cs+, Sr2+ and UO2
2+
ions†
Debajit Sarma,a Christos D. Malliakas,a K. S. Subrahmanyam,a Saiful M. Islama
and Mercouri G. Kanatzidis*ab
The fission of uranium produces radionuclides, 137Cs and 90Sr, which are major constituents of spent
nuclear fuel. The half-life of 137Cs and 90Sr is nearly 30 years and thus that makes them harmful to
human life and the environment. The selective removal of these radionuclides in the presence of high
salt concentrations from industrial nuclear waste is necessary for safe storage. Here we report the
synthesis and crystal structure of K2xSn4�xS8�x (x ¼ 0.65–1, KTS-3) a material which exhibits excellent
Cs+, Sr2+ and UO22+ ion exchange properties in varying conditions. The compound adopts a layered
structure which consists of exchangeable potassium ions sandwiched between infinite layers of
octahedral and tetrahedral tin centers. K2xSn4�xS8�x (x ¼ 0.65–1, KTS-3) crystallizes in the monoclinic
space group P21/c with cell parameters a ¼ 13.092(3) A, b ¼ 16.882(2) A, c ¼ 7.375(1) A and b ¼98.10(1)�. Refinement of the single crystal diffraction data revealed the presence of Sn vacancies in the
tetrahedra that are long range ordered. The interlayer potassium ions of KTS-3 can be exchanged for
Cs+, Sr2+ and UO22+. KTS-3 exhibits rapid and efficient ion exchange behavior in a broad pH range. The
distribution coefficients (Kd) for KTS-3 are high for Cs+ (5.5 � 104), Sr2+ (3.9 � 105) and UO22+ (2.7 � 104)
at neutral pH (7.4, 6.9, 5.7 ppm Cs+, Sr2+ and UO22+, respectively; V/m � 1000 mL g�1). KTS-3 exhibits
impressive Cs+, Sr2+ and UO22+ ion exchange properties in high salt concentration and over a broad pH
range, which coupled with the low cost, environmentally friendly nature and facile synthesis underscores
its potential in treating nuclear waste.
Introduction
The pursuit of efficient, cheap, sustainable and growing sourcesof energy, involves nuclear energy which has emerged as one ofthe prominent alternatives inmany countries and accounted for12.3% of the world's electricity production in 2012.1 Over thelast four decades the accumulation of radioactive spent nuclearfuel (nuclear waste) has reached a staggering volume of 71 780metric tons and it is increasing by 2300 metric tons every year.2
The rapidly increasing number of nuclear power plants willgenerate even larger amounts of nuclear waste. The primesource of nuclear fuel is various uranium salts, which are beingused in different stages from mining, nuclear fabrication andprocessing. The uranium salts form a major component of the
versity, 2145 Sheridan Road, Evanston, IL
stern.edu
al Laboratory, Argonne, IL 60439, USA
n (ESI) available: Raman spectra,ng electron microgram, X-raytallographic renement details, atomicisplacement parameters, anisotropicbond distances for KTS-3. See DOI:
hemistry 2016
nuclear waste along with the ssion generated non-actinideisotopes. The estimated amount of uranium present in seawateris 4 � 1012 kg (at �3 ppb), so potentially it could supply nuclearfuel for thousands of years.3 The primary issue with isolation ofuranium from seawater in a cost effective manner is the pres-ence of other ions (Na+, Cl�, Mg2+, SO4
2�, Ca2+, and CO32�) in
predominant amounts. 90Sr and 137Cs are the main hazardousssion generated non-actinide isotopes present in nuclearwaste, as they produce gamma and high energy beta particles.490Sr (with a half-time of t1/2� 29 years) and 137Cs (t1/2� 30 years)pose a major long-term risk due to their long half-life. Recently,the tsunami-induced disaster at the Fukushima nuclear powerplant in 2011 resulted in contamination of a wide region of thenorthern Kanto and Tohoku areas in Japan with radionuclides,131I, 134Cs, 137Cs, and 90Sr.5–7 Therefore, nuclear waste needs tobe dealt with effectively, for safe storage and disposal due to itsadverse health effects in humans and the environment.
The most commonly used technique for the separation ofradioactive elements from industrially produced nuclear wasteis solvent extraction using liquid phase organic compounds.8–10
The use of ion exchange media is another alternative for theremoval of radionuclides from the nuclear waste,11–22 however,they are relatively less explored due to certain drawbacks: the
Chem. Sci., 2016, 7, 1121–1132 | 1121

Chemical Science Edge Article
Ope
n A
cces
s A
rtic
le. P
ublis
hed
on 2
7 O
ctob
er 2
015.
Dow
nloa
ded
on 1
0/8/
2021
1:2
6:08
AM
. T
his
artic
le is
lice
nsed
und
er a
Cre
ativ
e C
omm
ons
Attr
ibut
ion
3.0
Unp
orte
d L
icen
ce.
View Article Online
organic ion exchange materials are efficient but costly, whereasthe inorganic ion exchange materials are cheaper but they areless efficient because of low selectivity for the ions of interest.So, there is a growing need to develop efficient inorganic ionexchange materials for radioactive species.
Over the past decade or so metal suldes have emerged asa selective class of ion exchangers for capturing so metal ionssuch as Hg, Cd, Ag etc.20,23,24 Chalcogenide open-frameworkcompounds, such as K6Sn[Zn4Sn4S17]17 and (NH4)4In12Se20 (ref.19) present unique advantages over their oxide analogues. Thelayered thiostannates are particularly interesting because theyexhibit open accessible structures where ion-exchange chem-istry can occur readily.25–30 In previous work, we proposed thatlayered metal suldes K2xMxSn3�xS6 (M ¼Mn, KMS-1; M ¼Mg,KMS-2) can be used for facile ion exchange of Sr2+, Cs+ andUO2
2+.18,19,31,32 A variety of synthetic parameters were explored inthe search for new compounds based on a tin sulde layerstructure to modulate the ion exchange properties. The advan-tage of the chalcogenide materials stems from the fact that theyare based on soer chalcogen ligands (in the Lewis base sense)which can induce high selectivity for heavy metal ions, Cs+, Sr2+,UO2
2+ against co-present hard ions such as Na+, Al3+ andCa2+.17,19,31–33
Herein, we report a new ternary layered compound, K2x-Sn4�xS8�x (x ¼ 0.65–1, KTS-3) and its promising selectivity forremoving Cs+, Sr2+ and UO2
2+ species via ion exchangeprocesses. Specically, we nd that KTS-3 exhibits high distri-bution coefficients (Kd) for the capture of Cs+ (5.5 � 104), Sr2+
(3.9 � 105) and UO22+ (2.7 � 104) over a broad pH range (V/m �
1000 mL g�1). We nd that KTS-3 remains highly effective forthese ions even in presence of a large amount of Na+ ions.
Experimental sectionStarting materials
KTS-3 was synthesized using high purity K2CO3 (99%, Sigma-Aldrich), tin powder (<150 mm, 99.5%, Sigma-Aldrich) andelemental sulfur (5N Plus Inc.).
Hydrothermal synthesis of K2xSn4�xS8�x (x ¼ 0.65–1, KTS-3)
K2CO3 (6 mmol, 0.830 g), elemental Sn (9 mmol, 1.068 g), S (30mmol, 0.962 g) were taken in a 23 mL polytetrauoroethylene(PTFE) lined stainless steel autoclave and deionized water (0.5mL) was added drop wise until the mixture acquired dough-likeconsistency. The autoclave was sealed properly and maintainedin a preheated oven at 220 �C for 15 h under autogenous pres-sure. Then, the autoclave was allowed to cool to room temper-ature. The product was found to contain yellow rod shapedcrystals along with yellow polycrystalline powder (Fig. 1a). Theproduct was isolated by ltration, washed several times withwater, acetone and dried under vacuum. The yield was �2.0 g(�85%, based on Sn) and the product was air and moisturestable. Electron Dispersive Spectroscopy (EDS) analysis showsthe presence of K, Sn and S and gave an average formula“K1.34Sn3.26S7.32”.
1122 | Chem. Sci., 2016, 7, 1121–1132
Ion-exchange experiments
A typical ion exchange experiment of KTS-3 with Cs+, Sr2+, orUO2
2+ was carried out in a 20 mL scintillation vial, wheremeasured amounts of CsCl, SrCl2$6H2O or UO2(NO3)$6H2O (0.1mmol of An+) were dissolved in deionized water (10 mL) andKTS-3 (40 mg) was added. Then the mixture was kept undermagnetic stirring for anywhere from 5 min to 15 h at roomtemperature. The ion exchanged material was centrifuged andisolated by ltration (through lter paper, Whatman no. 1),washed several times with water and acetone, and dried undervacuum. In all cases, the ion exchange reaction was completedaer only one cycle (EDS showed all potassium ions wereexchanged).
The distribution coefficient Kd, used for the determination ofthe affinity and selectivity of KTS-3 for Cs+, Sr2+, or UO2
2+ isgiven by the equation: Kd ¼ (V/m)[(C0 � Cf)/Cf] where, V is thevolume (mL) of the testing solution, m is the amount of the ionexchanger (g), C0 and Cf are the initial and equilibriumconcentration of a given ion An+ (ppm).
The individual Cs+, Sr2+, or UO22+ uptake from solutions of
various concentrations were studied with V/m z 1000 mL g�1,at room temperature and 15 h contact time. The data obtainedwere used for the determination of the sorption isotherms. Allion exchange experiments reported in this work were performedby the batch method in 20 mL scintillation vials.
The individual ion exchange experiments for the Cs+, Sr2+, orUO2
2+ ions at different pH and salt concentration were alsocarried out. The required pH values (2, 4, 6, 8, 10 and 12) wereachieved by diluting the commercial standards (1000 ppm) withHCl or NaOH solution to�6 ppm. The ion exchange experimentat different Na+ concentration was done by dissolving therequired amount of NaCl in 10 mL solution of An+ ion (�6 ppm).The exchange experiments were performed with V/mz 1000mLg�1, at room temperature and 15 h contact.
Competitive ion exchange (Cs+ and Sr2+) experiments of KTS-3 were also carried out with a V/m ratio of 1000 mL g�1, at roomtemperature with 15 h of contact time. The initial concentrationwas approximately �6 ppm for both the ions. The competitiveion exchange experiments were similar to those of the indi-vidual ion exchange experiments except they contained both Cs+
and Sr2+ ions in solution.The kinetic studies of the adsorption of ions by KTS-3 were
carried out as follows: ion-exchange experiments of variousreaction times (5, 15, 30, 60, 120, 300 and 1200 min) were per-formed. For each experiment, 10 mg of KTS-3 was weighed intoa 20 mL vial. A 10 mL sample of water solution containing �1ppm of Cs+/Sr2+/UO2
2+ was added to each vial, and the mixtureswere kept under magnetic stirring (pH � 7). The suspensionswere ltered aer the designated reaction time and the ltrateswere analyzed by inductively coupled plasma-mass spectros-copy (ICP-MS).
Powder X-ray diffraction
The powder X-ray diffraction (PXRD) patterns were collected atroom temperature with a CPS 120 INEL X-ray powder diffrac-tometer with graphite monochromated Cu Ka radiation
This journal is © The Royal Society of Chemistry 2016
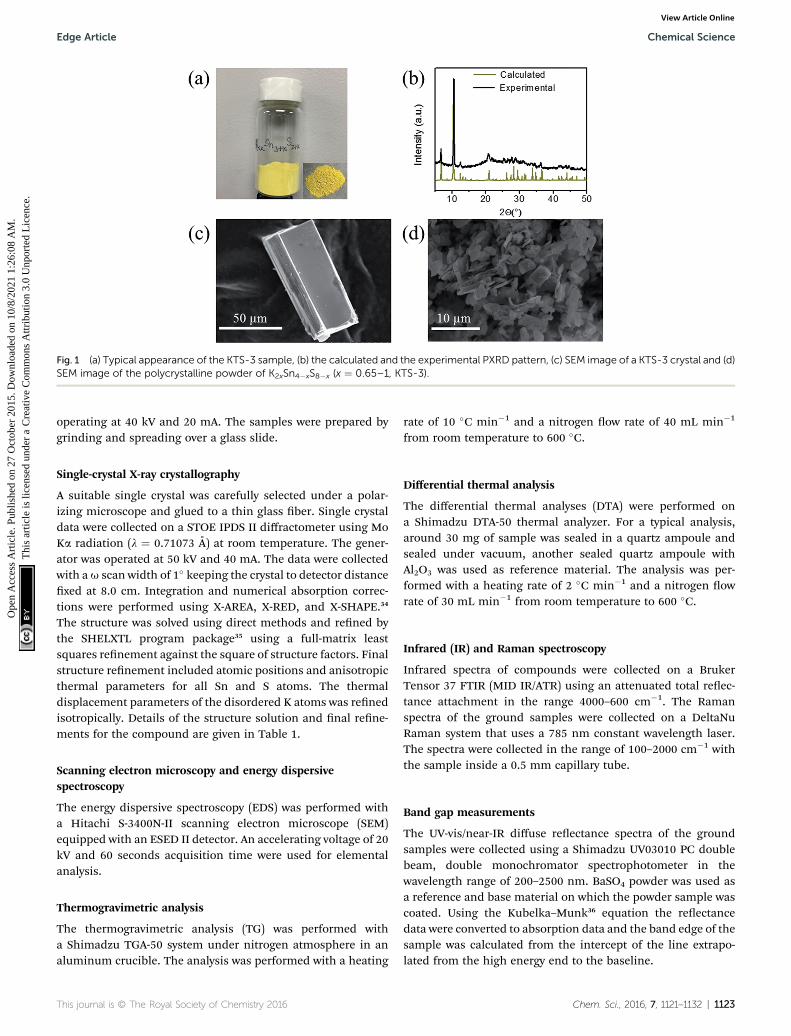
Fig. 1 (a) Typical appearance of the KTS-3 sample, (b) the calculated and the experimental PXRD pattern, (c) SEM image of a KTS-3 crystal and (d)SEM image of the polycrystalline powder of K2xSn4�xS8�x (x ¼ 0.65–1, KTS-3).
Edge Article Chemical Science
Ope
n A
cces
s A
rtic
le. P
ublis
hed
on 2
7 O
ctob
er 2
015.
Dow
nloa
ded
on 1
0/8/
2021
1:2
6:08
AM
. T
his
artic
le is
lice
nsed
und
er a
Cre
ativ
e C
omm
ons
Attr
ibut
ion
3.0
Unp
orte
d L
icen
ce.
View Article Online
operating at 40 kV and 20 mA. The samples were prepared bygrinding and spreading over a glass slide.
Single-crystal X-ray crystallography
A suitable single crystal was carefully selected under a polar-izing microscope and glued to a thin glass ber. Single crystaldata were collected on a STOE IPDS II diffractometer using MoKa radiation (l ¼ 0.71073 A) at room temperature. The gener-ator was operated at 50 kV and 40 mA. The data were collectedwith au scan width of 1� keeping the crystal to detector distancexed at 8.0 cm. Integration and numerical absorption correc-tions were performed using X-AREA, X-RED, and X-SHAPE.34
The structure was solved using direct methods and rened bythe SHELXTL program package35 using a full-matrix leastsquares renement against the square of structure factors. Finalstructure renement included atomic positions and anisotropicthermal parameters for all Sn and S atoms. The thermaldisplacement parameters of the disordered K atoms was renedisotropically. Details of the structure solution and nal rene-ments for the compound are given in Table 1.
Scanning electron microscopy and energy dispersivespectroscopy
The energy dispersive spectroscopy (EDS) was performed witha Hitachi S-3400N-II scanning electron microscope (SEM)equipped with an ESED II detector. An accelerating voltage of 20kV and 60 seconds acquisition time were used for elementalanalysis.
Thermogravimetric analysis
The thermogravimetric analysis (TG) was performed witha Shimadzu TGA-50 system under nitrogen atmosphere in analuminum crucible. The analysis was performed with a heating
This journal is © The Royal Society of Chemistry 2016
rate of 10 �C min�1 and a nitrogen ow rate of 40 mL min�1
from room temperature to 600 �C.
Differential thermal analysis
The differential thermal analyses (DTA) were performed ona Shimadzu DTA-50 thermal analyzer. For a typical analysis,around 30 mg of sample was sealed in a quartz ampoule andsealed under vacuum, another sealed quartz ampoule withAl2O3 was used as reference material. The analysis was per-formed with a heating rate of 2 �C min�1 and a nitrogen owrate of 30 mL min�1 from room temperature to 600 �C.
Infrared (IR) and Raman spectroscopy
Infrared spectra of compounds were collected on a BrukerTensor 37 FTIR (MID IR/ATR) using an attenuated total reec-tance attachment in the range 4000–600 cm�1. The Ramanspectra of the ground samples were collected on a DeltaNuRaman system that uses a 785 nm constant wavelength laser.The spectra were collected in the range of 100–2000 cm�1 withthe sample inside a 0.5 mm capillary tube.
Band gap measurements
The UV-vis/near-IR diffuse reectance spectra of the groundsamples were collected using a Shimadzu UV03010 PC doublebeam, double monochromator spectrophotometer in thewavelength range of 200–2500 nm. BaSO4 powder was used asa reference and base material on which the powder sample wascoated. Using the Kubelka–Munk36 equation the reectancedata were converted to absorption data and the band edge of thesample was calculated from the intercept of the line extrapo-lated from the high energy end to the baseline.
Chem. Sci., 2016, 7, 1121–1132 | 1123
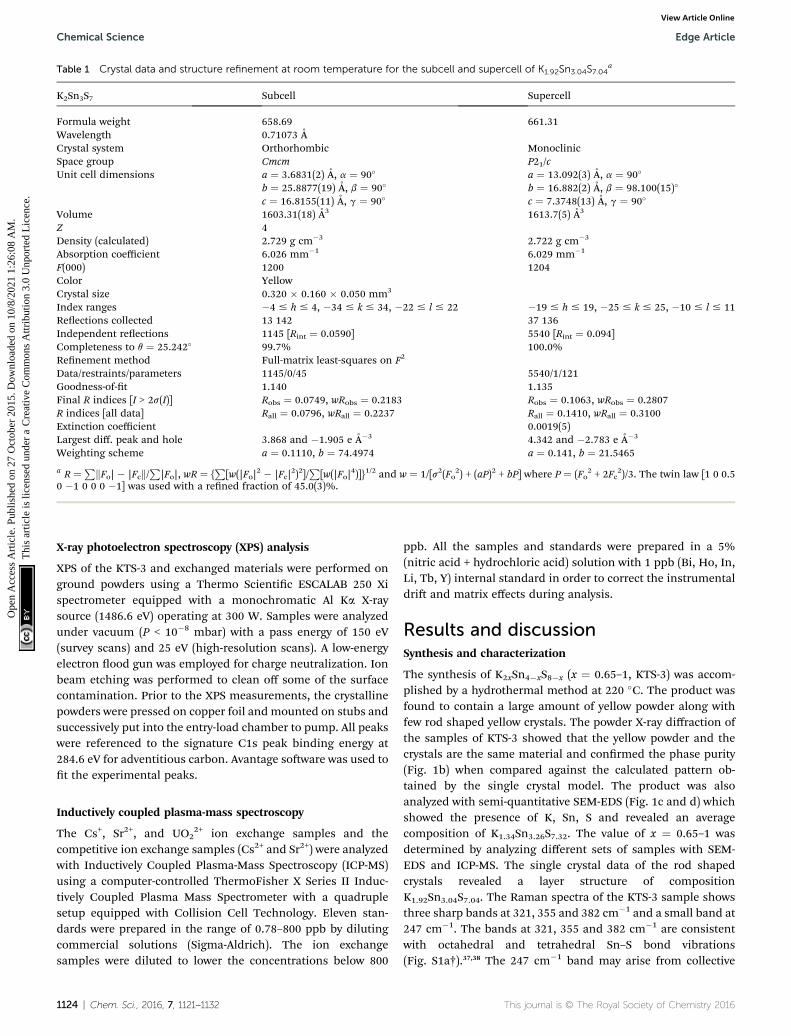
Table 1 Crystal data and structure refinement at room temperature for the subcell and supercell of K1.92Sn3.04S7.04a
K2Sn3S7 Subcell Supercell
Formula weight 658.69 661.31Wavelength 0.71073 ACrystal system Orthorhombic MonoclinicSpace group Cmcm P21/cUnit cell dimensions a ¼ 3.6831(2) A, a ¼ 90� a ¼ 13.092(3) A, a ¼ 90�
b ¼ 25.8877(19) A, b ¼ 90� b ¼ 16.882(2) A, b ¼ 98.100(15)�
c ¼ 16.8155(11) A, g ¼ 90� c ¼ 7.3748(13) A, g ¼ 90�
Volume 1603.31(18) A3 1613.7(5) A3
Z 4Density (calculated) 2.729 g cm�3 2.722 g cm�3
Absorption coefficient 6.026 mm�1 6.029 mm�1
F(000) 1200 1204Color YellowCrystal size 0.320 � 0.160 � 0.050 mm3
Index ranges �4 # h # 4, �34 # k # 34, �22 # l # 22 �19 # h # 19, �25 # k # 25, �10 # l # 11Reections collected 13 142 37 136Independent reections 1145 [Rint ¼ 0.0590] 5540 [Rint ¼ 0.094]Completeness to q ¼ 25.242� 99.7% 100.0%Renement method Full-matrix least-squares on F2
Data/restraints/parameters 1145/0/45 5540/1/121Goodness-of-t 1.140 1.135Final R indices [I > 2s(I)] Robs ¼ 0.0749, wRobs ¼ 0.2183 Robs ¼ 0.1063, wRobs ¼ 0.2807R indices [all data] Rall ¼ 0.0796, wRall ¼ 0.2237 Rall ¼ 0.1410, wRall ¼ 0.3100Extinction coefficient 0.0019(5)Largest diff. peak and hole 3.868 and �1.905 e A�3 4.342 and �2.783 e A�3
Weighting scheme a ¼ 0.1110, b ¼ 74.4974 a ¼ 0.141, b ¼ 21.5465
a R ¼ PkFo| � |Fck/P
|Fo|, wR ¼ {P
[w(|Fo|2 � |Fc|
2)2]/P
[w(|Fo|4)]}1/2 and w ¼ 1/[s2(Fo
2) + (aP)2 + bP] where P ¼ (Fo2 + 2Fc
2)/3. The twin law [1 0 0.50 �1 0 0 0 �1] was used with a rened fraction of 45.0(3)%.
Chemical Science Edge Article
Ope
n A
cces
s A
rtic
le. P
ublis
hed
on 2
7 O
ctob
er 2
015.
Dow
nloa
ded
on 1
0/8/
2021
1:2
6:08
AM
. T
his
artic
le is
lice
nsed
und
er a
Cre
ativ
e C
omm
ons
Attr
ibut
ion
3.0
Unp
orte
d L
icen
ce.
View Article Online
X-ray photoelectron spectroscopy (XPS) analysis
XPS of the KTS-3 and exchanged materials were performed onground powders using a Thermo Scientic ESCALAB 250 Xispectrometer equipped with a monochromatic Al Ka X-raysource (1486.6 eV) operating at 300 W. Samples were analyzedunder vacuum (P < 10�8 mbar) with a pass energy of 150 eV(survey scans) and 25 eV (high-resolution scans). A low-energyelectron ood gun was employed for charge neutralization. Ionbeam etching was performed to clean off some of the surfacecontamination. Prior to the XPS measurements, the crystallinepowders were pressed on copper foil andmounted on stubs andsuccessively put into the entry-load chamber to pump. All peakswere referenced to the signature C1s peak binding energy at284.6 eV for adventitious carbon. Avantage soware was used tot the experimental peaks.
Inductively coupled plasma-mass spectroscopy
The Cs+, Sr2+, and UO22+ ion exchange samples and the
competitive ion exchange samples (Cs2+ and Sr2+) were analyzedwith Inductively Coupled Plasma-Mass Spectroscopy (ICP-MS)using a computer-controlled ThermoFisher X Series II Induc-tively Coupled Plasma Mass Spectrometer with a quadruplesetup equipped with Collision Cell Technology. Eleven stan-dards were prepared in the range of 0.78–800 ppb by dilutingcommercial solutions (Sigma-Aldrich). The ion exchangesamples were diluted to lower the concentrations below 800
1124 | Chem. Sci., 2016, 7, 1121–1132
ppb. All the samples and standards were prepared in a 5%(nitric acid + hydrochloric acid) solution with 1 ppb (Bi, Ho, In,Li, Tb, Y) internal standard in order to correct the instrumentaldri and matrix effects during analysis.
Results and discussionSynthesis and characterization
The synthesis of K2xSn4�xS8�x (x ¼ 0.65–1, KTS-3) was accom-plished by a hydrothermal method at 220 �C. The product wasfound to contain a large amount of yellow powder along withfew rod shaped yellow crystals. The powder X-ray diffraction ofthe samples of KTS-3 showed that the yellow powder and thecrystals are the same material and conrmed the phase purity(Fig. 1b) when compared against the calculated pattern ob-tained by the single crystal model. The product was alsoanalyzed with semi-quantitative SEM-EDS (Fig. 1c and d) whichshowed the presence of K, Sn, S and revealed an averagecomposition of K1.34Sn3.26S7.32. The value of x ¼ 0.65–1 wasdetermined by analyzing different sets of samples with SEM-EDS and ICP-MS. The single crystal data of the rod shapedcrystals revealed a layer structure of compositionK1.92Sn3.04S7.04. The Raman spectra of the KTS-3 sample showsthree sharp bands at 321, 355 and 382 cm�1 and a small band at247 cm�1. The bands at 321, 355 and 382 cm�1 are consistentwith octahedral and tetrahedral Sn–S bond vibrations(Fig. S1a†).37,38 The 247 cm�1 band may arise from collective
This journal is © The Royal Society of Chemistry 2016

Edge Article Chemical Science
Ope
n A
cces
s A
rtic
le. P
ublis
hed
on 2
7 O
ctob
er 2
015.
Dow
nloa
ded
on 1
0/8/
2021
1:2
6:08
AM
. T
his
artic
le is
lice
nsed
und
er a
Cre
ativ
e C
omm
ons
Attr
ibut
ion
3.0
Unp
orte
d L
icen
ce.
View Article Online
lattice modes or from the vibrations associated with thepotassium ions.
Thermogravimetric (TG) analysis of the KTS-3 compoundwas carried out in owing nitrogen gas (ow rate ¼ 20 mLmin�1) in the temperature range 20–600 �C (heating rate of 10�C min�1). The TG studies indicate that KTS-3 exhibits a single-step weight loss of �10% up to 235 �C which corresponds to theloss of adsorbed water molecules. The compound remainsstable up to 525 �C, aer which it starts to decompose(Fig. S1b†) into K2Sn2S5 and SnS2 as determined by powderXRD. Differential thermal analysis (DTA) of the samples showsno sign of melting up to 600 �C (Fig. S2†).
X-ray photoelectron spectroscopy performed on KTS-3(Fig. 2) shows peaks at 292.5 and 295.6 eV which are charac-teristic for 2p3/2 and 2p1/2 of K
+ cations.39 The peaks at 486.0 and494.5 eV are consistent with the 3d5/2 and 3d3/2 levels observedfor Sn4+ cations.39 The sulfur 2p orbital excitations appear asa broad peak in the range 158–165 eV. The deconvolution of thebroad band gives two bands centered at 161.5 and 162.7 eVwhich are characteristic of 2p3/2 and 2p1/2 sulde anions,respectively.39,40
Crystal structure
The structure of K1.92Sn3.04S7.04 is composed of innite layers of[Sn3S7] stacked along the b-axis with K ions residing between thelayers, Fig. 3a. The [Sn3S7] layer consists of [SnS6] octahedra and[SnS4] tetrahedra. Edge-shared [SnS6] octahedral units formribbons that run innitely along the c-axis and have a width oftwo octahedral units. The [SnS6] ribbons are interconnected byedge-shared [SnS4] tetrahedra in the form of [Sn2S6] bridges.
Fig. 2 X-ray photoelectron spectra of (a) potassium, (b) tin, (c) sulfur,experimental and deconvoluted spectra, respectively.
This journal is © The Royal Society of Chemistry 2016
Potassium atoms are disordered and sandwiched between the[Sn3S7] layers. An apparent C-centered orthorhombic cell witha ¼ 3.6831(2) A, b ¼ 25.8877(19) A, and c ¼ 16.8155(11) A canindex most of the reections but aer careful examination ofthe reciprocal lattice (Fig. 3b) we found the presence of addi-tional broad and diffuse reections that could be indexed bydoubling of the short a-axis with a transformed primitivemonoclinic unit cell of a ¼ 13.092(3) A, b ¼ 16.882(2) A, c ¼7.375(1) A and b¼ 98.10(1)�. The origin of the supercell is due topartial long range ordering of vacancies in the [SnS4] slabswhere every other [Sn2S6] unit is missing along the c-axis,Fig. 3c.
The orthorhombic cell can be rened in Cmcm with a stoi-chiometry of ‘K2Sn4S8’ but this is problematic because thiscomposition does not charge balance assuming K+, Sn4+, andS2� ions. Furthermore, the agreement factor for the ‘K2Sn4S8’renement was very high at�14.5% with large negative residualelectron density around the Sn(2) and S(4) sites. Upon rene-ment of the occupancy of Sn(2) and S(4) (50% disorderly occu-pied) but omitting the supercell reections, the agreementfactor improved signicantly (7.5%, see Table 1) and the renedcomposition becomes K1.92Sn3.04S7.04 which is charge balanced.By subsequently introducing the intensity of the supercellreections into the renement, an additional long rangeordering of the vacancies in the Sn(2) and S(4) sites was found.The supercell of KTS-3 was solved using the monoclinic space-group P21/c and twining was required for a successful rene-ment. A rened twin fraction of 45.0(3)% was determined usinga twin law of 180 degrees rotation along the c-axis, Table 1. Thenal agreement factor is satisfactory given the very broad anddiffuse nature of the supercell reections, Fig. 3b.
and (d) survey spectrum for KTS-3. Dotted and solid lines represent
Chem. Sci., 2016, 7, 1121–1132 | 1125

Fig. 3 (a) The layer structure of K1.92Sn3.04S7.04, (b) synthetic preces-sion image of the (h5l) layer with the diffuse super cell reflectionsshown with arrows, and (c) [Sn3S7]
2� layer with ideally ordered Sn andvacancy sites. Refinement suggests the presence of some Sn atoms inthe vacant sites with fractional occupancy of 31.1(5)% due to thediffuse character of the supercell reflections.
Fig. 4 Powder X-ray diffraction patterns of pristine KTS-3 and theexchanged materials. The (020) and (040) reflection peaks for the
Chemical Science Edge Article
Ope
n A
cces
s A
rtic
le. P
ublis
hed
on 2
7 O
ctob
er 2
015.
Dow
nloa
ded
on 1
0/8/
2021
1:2
6:08
AM
. T
his
artic
le is
lice
nsed
und
er a
Cre
ativ
e C
omm
ons
Attr
ibut
ion
3.0
Unp
orte
d L
icen
ce.
View Article Online
The asymmetric unit of the KTS-3 supercell has 15 atoms.Four crystallographically independent Sn4+ atoms (two sites arepartially occupied), eight sulde atoms (two sites are partiallyoccupied) and three K+ ions (two sites are partially disordered).The Sn(1) and Sn(2) ions are octahedrally coordinated by sixsulfur atoms, and Sn(3) and Sn(4) atoms are tetrahedrallycoordinated by four sulfur atoms. The [SnS6] and [SnS4] unitsare shared through S(5)/S(6) edges, the [SnS6] units are edge-shared through S(1)–S(2), and the [SnS4] units are edge-sharedthrough S(7)/S(7) and S(8)/S(8) edges. The Sn(1), Sn(2) distortedoctahedra have Sn–S distances in the range of 2.504(2)–2.621(2)A and the Sn(3) distorted tetrahedral have Sn–S distances in therange of 2.288(2)–2.486(2) A. Because of the partial ordering ofvacancies, Sn(3) and Sn(4) are disordered with a rened frac-tional occupancy of 73.0(4) and 31.1(5)%, respectively. The
1126 | Chem. Sci., 2016, 7, 1121–1132
same occupancy values were used for the S atoms that edge-share the [SnS4] tetrahedra, i.e., the occupancy factor of S(7) andS(8) was constrained at 73.0(4) and 31.1(5)%, respectively. All Katoms have relatively large thermal factors which is character-istic for loosely bound intercalated atoms found in ion-exchanged materials.17,18,32 K(1A) and K(1B) are delocalized withan average disordered distance of 2.32(1) A and fractionaloccupancy of 60.7(5) and 39.3(5)%, respectively where K(3) fullyoccupies its own site.
The basic difference between the structure of KTS-3 and thatof so-called KMS structures which are also layered (K2xMx-Sn3�xS6; M¼Mn, KMS-1; M¼Mg, KMS-2)18,32 is in the structureof the layers themselves. The layers of KMS-1 and KMS-2 areessentially derived from the SnS2 structure by replacingrandomly some of the octahedral Sn4+ ions by either Mn2+
(KMS-1) or Mg2+ (KMS-2) ions, where all the Sn/M (M ¼ Mn orMg) ions occupy octahedral sites and the sulfur ions are threecoordinated.18,32 However, in case of KTS-3 there are bothoctahedral and tetrahedral centers that are connected by threeand two coordinated sulfur atoms to form the layer structure.Disordered potassium ions are located between the SnS2 orSn3S7 layers, Fig. 3c.
Ion-exchange of KTS-3 with Cs+, Sr2+ and UO22+ ions
The interlayer potassium ions in the KTS-3 structure are disor-dered and move rapidly in an ion-exchange process. To checkthe feasibility of ion exchange of K+ in KTS-3 we immersed it ina solution of An+ (An+ ¼ Cs+, Sr2+ and UO2
2+) ions for 15 h. Theseion exchange processes are in fact very rapid and almost all theions were exchanged within 5 min, but to ensure a complete ionexchange we used 15 h. The EDS analysis of the materials aerion exchange showed the complete removal of the K+ ions. TheEDS of the exchanged materials showed a ratio of 1.5 : 3 forCs : Sn, 0.7 : 3 for Sr : Sn and 0.51 : 3 U : Sn, which are compa-rable with the expected Cs to Sn ratio (1.3–2.0) and Sr, UO2 to Snratio (0.65–1) (Fig. S3†). The PXRD of the exchanged materialsshowed isotactic ion exchange with retention of the parentstructure (Fig. 4). The ion exchange processes can be describedby the following equations:
K1.92Sn3.04S7.04 + 1.92CsCl / Cs1.92Sn3.04S7.04 + 1.92KCl (1)
exchanged materials shift towards lower 2q (higher d spacing).
This journal is © The Royal Society of Chemistry 2016

Edge Article Chemical Science
Ope
n A
cces
s A
rtic
le. P
ublis
hed
on 2
7 O
ctob
er 2
015.
Dow
nloa
ded
on 1
0/8/
2021
1:2
6:08
AM
. T
his
artic
le is
lice
nsed
und
er a
Cre
ativ
e C
omm
ons
Attr
ibut
ion
3.0
Unp
orte
d L
icen
ce.
View Article Online
K1.92Sn3.04S7.04 + 0.96SrCl2$6H2O /
[Sr(H2O)y]0.96Sn3.04S7.04 + 1.92KCl (2)
K1.92Sn3.04S7.04 + 0.96UO2(NO3)2$6H2O /
[UO2(H2O)y]0.96Sn3.04S7.04 + 1.92KNO3 (3)
For the Cs+ and Sr2+ exchanged samples the PXRD analysisshowed a shi of the (020) and (040) basal Bragg peaks to lower2q values (higher d-spacing). The interlayer spacing of thematerial increases from 8.441 A to 8.632 A (Sr2+) and 8.813 A(Cs+). The PXRD analysis of the UO2
2+ exchanged sample showsthe presence of a mixture of layered phases, which are mainlydue to the different degrees of hydration of the UO2
2+ ions. Theinterlayer spacing of the UO2
2+ exchanged material increasesfrom 8.441 A to 9.966 A and 10.250 A. The change in theinterlayer spacing follows the order UO2
2+ > Cs+ > Sr2+ > K+,which is consistent with the ionic size of the ions. The TGanalysis (Fig. S4†) showed that the degree of hydration for theexchanged materials follows the order Sr2+ > UO2
2+ > Cs+ > K+.The band gap of the pristine KTS-3 material is 2.38 eV and
the yellow color of the material changes marginally uponexchange with Cs+ and Sr2+ ions. The exchanged materials showa small increase in absorption and the measured band gapswere 2.54 eV (Cs+) and 2.56 eV (Sr2+). With UO2
2+ exchange, theyellow color slowly changes to a darker orange color and theband gaps red shied to 2.30 eV and 2.40 eV (Fig. 5a). This canbe attributed to partial dehydration of the UO2
2+ ions and thepresence of U/S interactions. The presence of two band gapsfor the UO2
2+ exchanged material was attributed to the differ-ently hydrated UO2
2+ ions.The infra-red spectrum of the uranyl exchanged KTS-3
material shows a strong peak at �910 cm�1, which is not foundin pristine KTS-3 (Fig. 5b). This peak at �910 cm�1 is assignedto the antisymmetric vibration of [O]U]O]2+ group and issignicantly red shied compared to the peaks found foraqueous [O]U]O]2+ ions (�963 cm�1).41
The XPS spectra of the Cs+ exchanged samples show thecharacteristic 3d5/2 and 3d3/2 for Cs+ at 724.7 and 738.7 eV(Fig. 6a).39 The Sr2+ exchanged samples show peaks at 133.9 and
Fig. 5 (a) Electronic absorption edges of KTS-3 (black), KTS-3exchanged with Cs+ (red), Sr2+ (blue), and UO2
2+ (magenta). Therespective band gaps are 2.38, 2.54, 2.56, and 2.40, 2.30 eV, and (b) theIR spectra of KTS-3, Cs+, Sr2+ and UO2
2+ exchangedmaterial. The peakat �910 cm�1 corresponds to the antisymmetric vibration of the [O]
U]O]2+ group.
This journal is © The Royal Society of Chemistry 2016
135.7 eV characteristic for 3d5/2 and 3d3/2 of Sr2+ cations(Fig. 6b).39 The UO2
2+ exchanged samples show two peaks at379.6 and 390.6 eV characteristic for 3f7/2 and 3f5/2 of U
6+ centers(Fig. 6c).31,39 All exchanged samples showed the characteristicpeaks for tin and sulfur ions as observed for the pristinecompound. The peaks for the potassium 2p3/2 and 2p1/2 couldnot be found in the exchanged samples (Fig. 6d), whichconrms their complete exchange from the KTS-3 compound.
Ion exchange adsorption isotherm studies (Cs+, Sr2+ andUO2
2+)
In order to understand the ion exchange capacity of KTS-3a detailed adsorption study was carried out. The ion exchangeequilibrium, kinetics, effect of salt concentration and pH on theCs+, Sr2+ and UO2
2+ ion exchange were studied. The equilibriumdata for the ions were modeled using the Langmuir and Lang-muir–Freundlich adsorption isotherms.42 Table 2 shows theequilibrium constants and different parameters obtained by themodeling of the equilibrium data.
Langmuir isotherm
q ¼ qmbCe
1þ bCe
(4)
Langmuir–Freundlich isotherm
q ¼ qmðbCeÞ1=n
1þ ðbCeÞ1=n(5)
where q (mg g�1) is the amount of cation adsorbed at equilib-rium concentration, qm is the maximum cation adsorptioncapacity, b (L mg�1) is the Langmuir constant, Ce (ppm) is theequilibrium concentration and n is a constant.
The Langmuir isotherm describes adsorption on a homoge-nous surface and the maximum adsorption corresponds toa saturated monolayer. This model is based on the assumptionsthat (a) the adsorption sites are equivalent and each site canonly accommodate one molecule, (b) the energy of adsorption isconstant and independent of surface coverage, and (c) there isno transmigration of adsorbate from one site to another.42–44
The Langmuir–Freundlich isotherm is an extension of theLangmuir model, which reduces to Freundlich isotherms at lowsurface coverage and to Langmuir isotherms at high surfacecoverage.42
The equilibrium data for Cs+ ion exchange (Fig. 7a) could betted with both Langmuir, and Langmuir–Freundlich isothermmodels with a good agreement (R2 $ 0.97). The value of theLangmuir–Freundlich constant n ¼ 1.37(23) was found to becloser to 1 which suggests that the adsorption behavior of Cs+
ion exchange follows the Langmuir adsorption model. Theagreement of the Langmuir adsorption isotherm with the Cs+
ion exchange can be rationalized by taking into considerationthe structural features of KTS-3. The [Sn3S7]
2� layers of KTS-3are separated by layers of disordered potassium ions, so theexchangeable Cs+ ions form a layer between the [Sn3S7]
2� layersthat corresponds to the monolayer of Langmuir isotherms. Theadsorption sites for the exchangeable ions are xed (S2� ions)
Chem. Sci., 2016, 7, 1121–1132 | 1127

Fig. 6 X-ray photoelectron spectra of (a) cesium, (b) strontium, (c) uranium and (d) potassium spectrum for the ion exchanged materials. Notethat there was no peak observed for potassium for the exchanged materials, indication of complete exchange of potassium ions. Dotted andsolid lines represent experimental and deconvoluted spectra, respectively.
Chemical Science Edge Article
Ope
n A
cces
s A
rtic
le. P
ublis
hed
on 2
7 O
ctob
er 2
015.
Dow
nloa
ded
on 1
0/8/
2021
1:2
6:08
AM
. T
his
artic
le is
lice
nsed
und
er a
Cre
ativ
e C
omm
ons
Attr
ibut
ion
3.0
Unp
orte
d L
icen
ce.
View Article Online
and chemically equivalent. Moreover, once the ions areexchanged it is not possible to migrate to other sites. Theequilibrium data for Sr2+ (Fig. 7b) and UO2
2+ (Fig. 7c) were alsotted with Langmuir (R2 ¼ 0.92 and 0.95, for Sr2+, UO2
2+
respectively) and Langmuir–Freundlich adsorption (R2 ¼ 0.92and 0.96, for Sr2+, UO2
2+ respectively) isotherms in goodagreement. The value of Langmuir–Freundlich constant [n ¼1.81(54) for Sr2+ and 1.52(24) for UO2
2+] shows that it deviatesfrom the Langmuir isothermmodel (n¼ 1). The behavior of Cs+,Sr2+ and UO2
2+ vis-a-vis their isotherms can be rationalized bythe fact that the number of ions exchanged in the case of Cs+ istwice that of bivalent Sr2+ and UO2
2+ and hence it has highersurface coverage and tends to follow better the Langmuirmodel. The ion exchange of bivalent metal ions oen follow theLangmuir–Freundlich model rather than the Langmuirmodel.45
The maximum ion exchange capacities, qm were found to be280(11) mg g�1 (2.10 mmol g�1) for Cs+, 102(5) mg g�1 (1.16mmol g�1) for Sr2+ and 287(15) mg g�1 (1.20 mmol g�1) for
Table 2 The ion exchange sorption constants obtained by fitting the iso
Cs+ ion exchange Sr2+ ion exc
Langmuir Langmuir–Freundlich Langmuir
qe (mg g�1) 280(11) 304(22) 102 (5)b (L mg�1) 0.09(2) 0.07(2) 0.20(8)n — 1.37(23) —R2 0.965 0.972 0.923
1128 | Chem. Sci., 2016, 7, 1121–1132
UO22+ from the Langmuir isotherm model. The theoretical
capacities for K2xSn4�xS8�x (x ¼ 0.96) considering all the K+ ionare exchanged are 2.90 mmol g�1 (385 mg g�1) for Cs+ and 1.45mmol g�1 for Sr2+ (127 mg g�1), UO2
2+ (347 mg g�1). Theobserved Cs+ exchange is about 72%, Sr2+ exchange � 80% andUO2
2+ exchange � 83% of the theoretical capacity. All K+ ionsare exchanged aer the reaction and the observed exchangecapacity is due to the fact that the polycrystalline sample (K2x-Sn4�xS8�x, KTS-3) has a range of x values from 0.65–1. Theobserved ion exchange capacity of KTS-3 compares well withwell-known Cs+ and Sr2+ sorbents (e.g., zeolites, sodium silico-titanates and zirconium titanium silicates; 1.86–4.1 mmol g�1
for Cs+ and 1.0–2.0 mmol g�1 of Sr2+).46–49
The Langmuir constants b (L mg�1) for the Cs+, Sr2+ andUO2
2+ were found to be 0.09(2), 0.20(8) and 0.23(6) L mg�1,respectively. The value of b is an indicator for the affinitytowards a particular ion. Higher b values for Sr2+ and UO2
2+ ionsindicate that KTS-3 has larger affinity towards them compared
therm data with different models
hange UO22+ ion exchange
Langmuir–Freundlich Langmuir Langmuir–Freundlich
113(14) 287(15) 358(61)0.19(15) 0.23(6) 0.09(6)1.81(54) — 1.52(24)0.928 0.952 0.960
This journal is © The Royal Society of Chemistry 2016
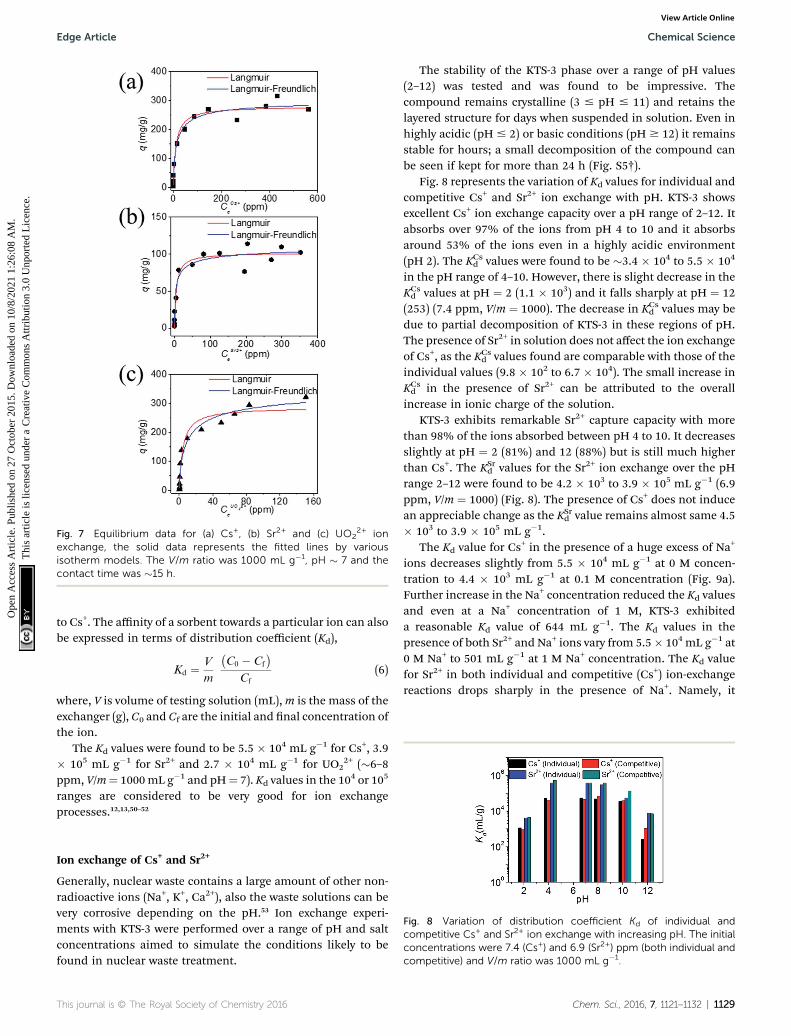
Fig. 7 Equilibrium data for (a) Cs+, (b) Sr2+ and (c) UO22+ ion
exchange, the solid data represents the fitted lines by variousisotherm models. The V/m ratio was 1000 mL g�1, pH � 7 and thecontact time was �15 h.
Edge Article Chemical Science
Ope
n A
cces
s A
rtic
le. P
ublis
hed
on 2
7 O
ctob
er 2
015.
Dow
nloa
ded
on 1
0/8/
2021
1:2
6:08
AM
. T
his
artic
le is
lice
nsed
und
er a
Cre
ativ
e C
omm
ons
Attr
ibut
ion
3.0
Unp
orte
d L
icen
ce.
View Article Online
to Cs+. The affinity of a sorbent towards a particular ion can alsobe expressed in terms of distribution coefficient (Kd),
Kd ¼ V
m
�C0 � Cf
�
Cf
(6)
where, V is volume of testing solution (mL),m is the mass of theexchanger (g), C0 and Cf are the initial and nal concentration ofthe ion.
The Kd values were found to be 5.5 � 104 mL g�1 for Cs+, 3.9� 105 mL g�1 for Sr2+ and 2.7 � 104 mL g�1 for UO2
2+ (�6–8ppm, V/m¼ 1000mL g�1 and pH¼ 7). Kd values in the 104 or 105
ranges are considered to be very good for ion exchangeprocesses.12,13,50–52
Fig. 8 Variation of distribution coefficient Kd of individual andcompetitive Cs+ and Sr2+ ion exchange with increasing pH. The initialconcentrations were 7.4 (Cs+) and 6.9 (Sr2+) ppm (both individual andcompetitive) and V/m ratio was 1000 mL g�1.
Ion exchange of Cs+ and Sr2+
Generally, nuclear waste contains a large amount of other non-radioactive ions (Na+, K+, Ca2+), also the waste solutions can bevery corrosive depending on the pH.53 Ion exchange experi-ments with KTS-3 were performed over a range of pH and saltconcentrations aimed to simulate the conditions likely to befound in nuclear waste treatment.
This journal is © The Royal Society of Chemistry 2016
The stability of the KTS-3 phase over a range of pH values(2–12) was tested and was found to be impressive. Thecompound remains crystalline (3 # pH # 11) and retains thelayered structure for days when suspended in solution. Even inhighly acidic (pH # 2) or basic conditions (pH $ 12) it remainsstable for hours; a small decomposition of the compound canbe seen if kept for more than 24 h (Fig. S5†).
Fig. 8 represents the variation of Kd values for individual andcompetitive Cs+ and Sr2+ ion exchange with pH. KTS-3 showsexcellent Cs+ ion exchange capacity over a pH range of 2–12. Itabsorbs over 97% of the ions from pH 4 to 10 and it absorbsaround 53% of the ions even in a highly acidic environment(pH 2). The KCs
d values were found to be �3.4 � 104 to 5.5 � 104
in the pH range of 4–10. However, there is slight decrease in theKCsd values at pH ¼ 2 (1.1 � 103) and it falls sharply at pH ¼ 12
(253) (7.4 ppm, V/m ¼ 1000). The decrease in KCsd values may be
due to partial decomposition of KTS-3 in these regions of pH.The presence of Sr2+ in solution does not affect the ion exchangeof Cs+, as the KCs
d values found are comparable with those of theindividual values (9.8 � 102 to 6.7 � 104). The small increase inKCsd in the presence of Sr2+ can be attributed to the overall
increase in ionic charge of the solution.KTS-3 exhibits remarkable Sr2+ capture capacity with more
than 98% of the ions absorbed between pH 4 to 10. It decreasesslightly at pH ¼ 2 (81%) and 12 (88%) but is still much higherthan Cs+. The KSr
d values for the Sr2+ ion exchange over the pHrange 2–12 were found to be 4.2 � 103 to 3.9 � 105 mL g�1 (6.9ppm, V/m ¼ 1000) (Fig. 8). The presence of Cs+ does not inducean appreciable change as the KSr
d value remains almost same 4.5� 103 to 3.9 � 105 mL g�1.
The Kd value for Cs+ in the presence of a huge excess of Na+
ions decreases slightly from 5.5 � 104 mL g�1 at 0 M concen-tration to 4.4 � 103 mL g�1 at 0.1 M concentration (Fig. 9a).Further increase in the Na+ concentration reduced the Kd valuesand even at a Na+ concentration of 1 M, KTS-3 exhibiteda reasonable Kd value of 644 mL g�1. The Kd values in thepresence of both Sr2+ and Na+ ions vary from 5.5� 104 mL g�1 at0 M Na+ to 501 mL g�1 at 1 M Na+ concentration. The Kd valuefor Sr2+ in both individual and competitive (Cs+) ion-exchangereactions drops sharply in the presence of Na+. Namely, it
Chem. Sci., 2016, 7, 1121–1132 | 1129
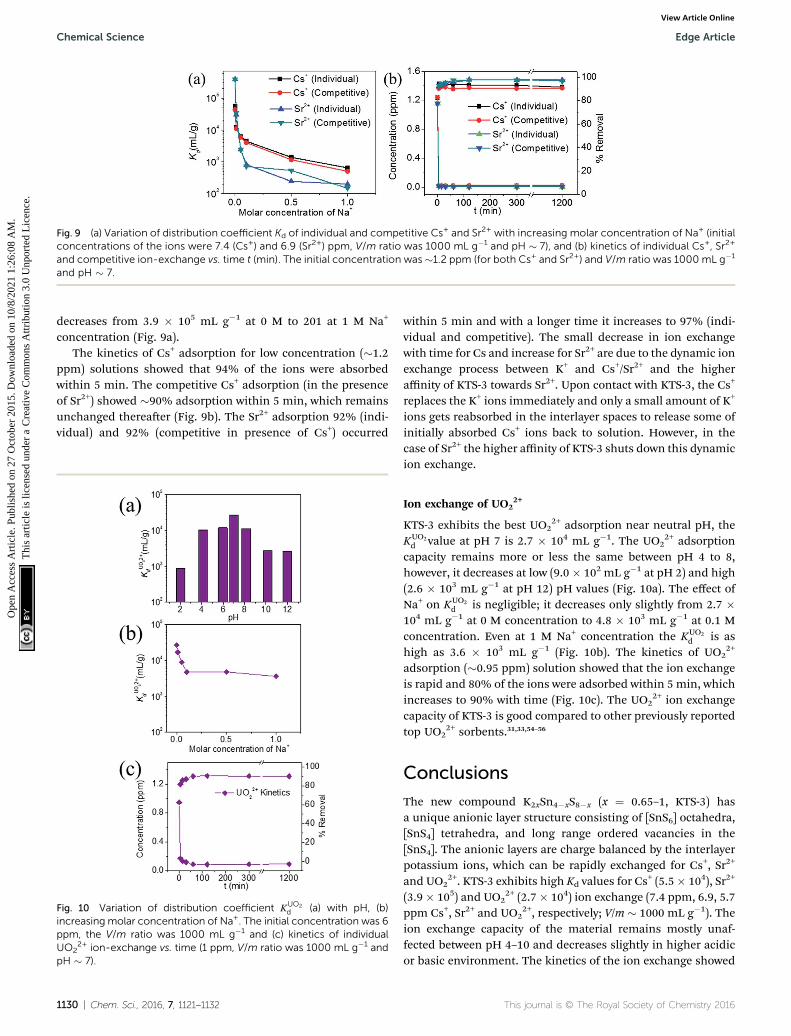
Fig. 9 (a) Variation of distribution coefficient Kd of individual and competitive Cs+ and Sr2+ with increasing molar concentration of Na+ (initialconcentrations of the ions were 7.4 (Cs+) and 6.9 (Sr2+) ppm, V/m ratio was 1000 mL g�1 and pH � 7), and (b) kinetics of individual Cs+, Sr2+
and competitive ion-exchange vs. time t (min). The initial concentration was �1.2 ppm (for both Cs+ and Sr2+) and V/m ratio was 1000 mL g�1
and pH � 7.
Chemical Science Edge Article
Ope
n A
cces
s A
rtic
le. P
ublis
hed
on 2
7 O
ctob
er 2
015.
Dow
nloa
ded
on 1
0/8/
2021
1:2
6:08
AM
. T
his
artic
le is
lice
nsed
und
er a
Cre
ativ
e C
omm
ons
Attr
ibut
ion
3.0
Unp
orte
d L
icen
ce.
View Article Online
decreases from 3.9 � 105 mL g�1 at 0 M to 201 at 1 M Na+
concentration (Fig. 9a).The kinetics of Cs+ adsorption for low concentration (�1.2
ppm) solutions showed that 94% of the ions were absorbedwithin 5 min. The competitive Cs+ adsorption (in the presenceof Sr2+) showed �90% adsorption within 5 min, which remainsunchanged thereaer (Fig. 9b). The Sr2+ adsorption 92% (indi-vidual) and 92% (competitive in presence of Cs+) occurred
Fig. 10 Variation of distribution coefficient KUO2d (a) with pH, (b)
increasing molar concentration of Na+. The initial concentration was 6ppm, the V/m ratio was 1000 mL g�1 and (c) kinetics of individualUO2
2+ ion-exchange vs. time (1 ppm, V/m ratio was 1000 mL g�1 andpH � 7).
1130 | Chem. Sci., 2016, 7, 1121–1132
within 5 min and with a longer time it increases to 97% (indi-vidual and competitive). The small decrease in ion exchangewith time for Cs and increase for Sr2+ are due to the dynamic ionexchange process between K+ and Cs+/Sr2+ and the higheraffinity of KTS-3 towards Sr2+. Upon contact with KTS-3, the Cs+
replaces the K+ ions immediately and only a small amount of K+
ions gets reabsorbed in the interlayer spaces to release some ofinitially absorbed Cs+ ions back to solution. However, in thecase of Sr2+ the higher affinity of KTS-3 shuts down this dynamicion exchange.
Ion exchange of UO22+
KTS-3 exhibits the best UO22+ adsorption near neutral pH, the
KUO2d value at pH 7 is 2.7 � 104 mL g�1. The UO2
2+ adsorptioncapacity remains more or less the same between pH 4 to 8,however, it decreases at low (9.0 � 102 mL g�1 at pH 2) and high(2.6 � 103 mL g�1 at pH 12) pH values (Fig. 10a). The effect ofNa+ on KUO2
d is negligible; it decreases only slightly from 2.7 �104 mL g�1 at 0 M concentration to 4.8 � 103 mL g�1 at 0.1 Mconcentration. Even at 1 M Na+ concentration the KUO2
d is ashigh as 3.6 � 103 mL g�1 (Fig. 10b). The kinetics of UO2
2+
adsorption (�0.95 ppm) solution showed that the ion exchangeis rapid and 80% of the ions were adsorbed within 5 min, whichincreases to 90% with time (Fig. 10c). The UO2
2+ ion exchangecapacity of KTS-3 is good compared to other previously reportedtop UO2
2+ sorbents.31,33,54–56
Conclusions
The new compound K2xSn4�xS8�x (x ¼ 0.65–1, KTS-3) hasa unique anionic layer structure consisting of [SnS6] octahedra,[SnS4] tetrahedra, and long range ordered vacancies in the[SnS4]. The anionic layers are charge balanced by the interlayerpotassium ions, which can be rapidly exchanged for Cs+, Sr2+
and UO22+. KTS-3 exhibits high Kd values for Cs
+ (5.5� 104), Sr2+
(3.9� 105) and UO22+ (2.7� 104) ion exchange (7.4 ppm, 6.9, 5.7
ppm Cs+, Sr2+ and UO22+, respectively; V/m � 1000 mL g�1). The
ion exchange capacity of the material remains mostly unaf-fected between pH 4–10 and decreases slightly in higher acidicor basic environment. The kinetics of the ion exchange showed
This journal is © The Royal Society of Chemistry 2016

Edge Article Chemical Science
Ope
n A
cces
s A
rtic
le. P
ublis
hed
on 2
7 O
ctob
er 2
015.
Dow
nloa
ded
on 1
0/8/
2021
1:2
6:08
AM
. T
his
artic
le is
lice
nsed
und
er a
Cre
ativ
e C
omm
ons
Attr
ibut
ion
3.0
Unp
orte
d L
icen
ce.
View Article Online
that the process is very facile and it absorbs most of the ionswithin minutes.
The ion exchange capacity of K2xSn4�xS8�x (x ¼ 0.65–1, KTS-3) is excellent and compares well with K2xMxSn3�xS6 (M ¼ Mn,KMS-1; M ¼ Mg, KMS-2). The Cs and UO2
2+ ion exchangecapacity of KTS-3 (qm ¼ 226 mg g�1 for Cs+ and 382 mg g�1 forUO2
2+) is comparable with KMS-1 (qm ¼ 280 mg g�1 for Cs+ and287 mg g�1 for UO2
2+) and the Cs+ ion exchange capacity ismuch lower than KMS-2 (qm ¼ 532 mg g�1 for Cs+). However,KTS-3 (qm ¼ 102 mg g�1 for Sr2+) outperforms both KMS-1 (qm ¼77 mg g�1 for Sr2+) and KMS-2 (qm¼ 87 mg g�1 for Sr2+) in termsof Sr2+ ion exchange capacity. Moreover, the relative ease andinexpensive synthesis of K2xSn4�xS8�x make it a promisingmaterial for future studies.
Our work shows that the metal chalcogenide family canprovide promising ion exchange materials for the selectiveremoval of radionuclide from nuclear waste. Further work is toassess the utility of KTS-3 in remediation applications ofnuclear wastes is justied.
Author contributions
DS and MGK designed and conducted the research. The struc-ture was solved by CDM. KSS and MSI helped characterizing theexchanged compounds by TGA, IR, Raman, UV-Vis and XPS. Themanuscript was written by DS, CDM and MGK. All authors haveapproved the nal version of the manuscript.
Conflict of interest
The authors declare no competing nancial interest.
Acknowledgements
Thematerials synthesis and crystallographic characterization inthis work was supported by National Science Foundation grantDMR-1410169. The ion exchange aspects of this research weresupported by a NEUP grant from the Department of Energy,Office of Nuclear Energy. The work made use of the facilitiesavailable at the Northwestern University Integrated MolecularStructure Education and Research Center. A description of thefacility and full funding disclosure can be found at http://www.imserc.facilities.northwestern.edu/. Electron microscopyimaging (SEM) and XPS were performed at the EPIC facility ofthe NUANCE Center at Northwestern University. The NUANCECenter is supported by NSF-NSEC, NSF-MRSEC, the KeckFoundation, the State of Illinois, and Northwestern University.C. D. M. was supported by the U.S. Department of Energy, Officeof Basic Energy Sciences under contract no. DE-AC02-06CH11357.
References
1 World Statistics: Nuclear Energy Around the World, http://www.nei.org/Knowledge-Center/Nuclear-Statistics/World-Statistics.
This journal is © The Royal Society of Chemistry 2016
2 Nuclear Waste: Amounts and On-Site Storage., http://www.nei.org/Knowledge-Center/Nuclear-Statistics/On-Site-Storage-of-Nuclear-Waste.
3 W. Ferguson, Record haul of uranium harvested from seawater,2012, http://www.newscientist.com/article/dn22201-record-haul-of-uranium-harvested-from-seawater.html.
4 V. N. Romanovskiy, I. V. Smirnov, V. A. Babain, T. A. Todd,R. S. Herbst, J. D. Law and K. N. Brewer, Solvent Extr. IonExch., 2001, 19, 1–21.
5 N. Kinoshita, K. Sueki, K. Sasa, J.-I. Kitagawa, S. Ikarashi,T. Nishimura, Y.-S. Wong, Y. Satou, K. Handa,T. Takahashi, M. Sato and T. Yamagata, Proc. Natl. Acad.Sci. U. S. A., 2011, 108, 19526–19529.
6 Y. Morino, T. Ohara and M. Nishizawa, Geophys. Res. Lett.,2011, 38, L00G11.
7 T. J. Yasunari, A. Stohl, R. S. Hayano, J. F. Burkhart,S. Eckhardt and T. Yasunari, Proc. Natl. Acad. Sci. U. S. A.,2011, 108, 19530–19534.
8 A. Braun, et al., Application of Ion Exchange Processes for theTreatment of Radioactive Waste and Management of Spent IonExchangers, International Atomic Energy Agency, Vienna,Austria, 2002.
9 J. D. Law, R. S. Herbst, T. A. Todd, V. N. Romanovskiy,V. A. Babain, V. M. Esimantovskiy, I. V. Smirnov andB. N. Zaitsev, Solvent Extr. Ion Exch., 2001, 19, 23–36.
10 D. A. Orth and T. W. Olcott, Nucl. Sci. Eng., 1963, 17, 593.11 G. Arena, A. Contino, A. Magri, D. Sciotto, G. Spoto and
A. Torrisi, Ind. Eng. Chem. Res., 2000, 39, 3605–3610.12 E. A. Behrens and A. Cleareld,Microporous Mater., 1997, 11,
65–75.13 E. A. Behrens, P. Sylvester and A. Cleareld, Environ. Sci.
Technol., 1998, 32, 101–107.14 A. I. Bortun, S. A. Khainakov, L. N. Bortun, E. Jaimez,
J. R. Garci and A. Cleareld, Mater. Res. Bull., 1999, 34,921–932.
15 P. A. Haas, Sep. Sci. Technol., 1993, 28, 2479–2506.16 I. Kallonen, Kem.–Kemi, 1996, 23, 550.17 M. J. Manos, K. Chrissas and M. G. Kanatzidis, J. Am. Chem.
Soc., 2006, 128, 8875–8883.18 M. J. Manos, N. Ding and M. G. Kanatzidis, Proc. Natl. Acad.
Sci. U. S. A., 2008, 105, 3696–3699.19 M. J. Manos and M. G. Kanatzidis, J. Am. Chem. Soc., 2009,
131, 6599–6607.20 M. J. Manos, C. D. Malliakas and M. G. Kanatzidis, Chem.–
Eur. J., 2006, 13, 51–58.21 B. A. Moyer, J. F. Birdwell Jr, P. V. Bonnesen and
L. H. Delmau, Macrocyclic Chem., 2005, 383–405.22 P. Sylvester and A. Cleareld, ACS Symp. Ser., 2001, 778, 133–
145.23 Z. Hassanzadeh Fard, C. D. Malliakas, J. L. Mertz and
M. G. Kanatzidis, Chem. Mater., 2015, 27, 1925–1928.24 M. J. Manos and M. G. Kanatzidis, Chem.–Eur. J., 2009, 15,
4779–4784.25 T. Jiang, A. Lough, G. A. Ozin, R. L. Bedard and R. Broach, J.
Mater. Chem., 1998, 8, 721–732.26 T. Jiang, A. Lough and G. A. Ozin, Adv. Mater., 1998, 10, 42–
46.
Chem. Sci., 2016, 7, 1121–1132 | 1131

Chemical Science Edge Article
Ope
n A
cces
s A
rtic
le. P
ublis
hed
on 2
7 O
ctob
er 2
015.
Dow
nloa
ded
on 1
0/8/
2021
1:2
6:08
AM
. T
his
artic
le is
lice
nsed
und
er a
Cre
ativ
e C
omm
ons
Attr
ibut
ion
3.0
Unp
orte
d L
icen
ce.
View Article Online
27 T. Jiang, G. A. Ozin and R. L. Bedard, Adv. Mater., 1994, 6,860–865.
28 G. A. Marking and M. G. Kanatzidis, Chem. Mater., 1995, 7,1915–1921.
29 X.-H. Qi, K.-Z. Du, M.-L. Feng, J.-R. Li, C.-F. Du, B. Zhang andX.-Y. Huang, J. Mater. Chem. A, 2015, 3, 5665–5673.
30 W. S. Sheldrick, Z. Anorg. Allg. Chem., 1988, 562, 23–30.31 M. J. Manos and M. G. Kanatzidis, J. Am. Chem. Soc., 2012,
134, 16441–16446.32 J. L. Mertz, Z. H. Fard, C. D. Malliakas, M. J. Manos and
M. G. Kanatzidis, Chem. Mater., 2013, 25, 2116–2127.33 S. Ma, L. Huang, L. Ma, Y. Shim, S. M. Islam, P. Wang,
L.-D. Zhao, S. Wang, G. Sun, X. Yang and M. G. Kanatzidis,J. Am. Chem. Soc., 2015, 137, 3670–3677.
34 X-AREA, STOE & Cie GmbH, IPDS Soware, Darmstadt, 2006.35 K. Sheldrick, Acta Crystallogr., Sect. A: Found. Crystallogr.,
2008, 64, 112–122.36 (a) K. Chondroudis, T. J. McCarthy and M. G. Kanatzidis,
Inorg. Chem., 1996, 35, 840–844; (b) M. G. Kanatzidis,T. J. McCarthy, T. A. Tanzer, L.-H. Chen, L. Iordanidis,T. Hogan, C. R. Kannewurf, C. Uher and B. Chen, Chem.Mater., 1996, 8, 1465–1474.
37 R. G. Iyer and M. G. Kanatzidis, Inorg. Chem., 2002, 41, 3605–3607.
38 G. A. Marking, M. Evain, V. Petricek and M. G. Kanatzidis, J.Solid State Chem., 1998, 141, 17–28.
39 J. Chastain and J. F. Moulder, Handbook of X-rayPhotoelectron Spectroscopy: A Reference Book of StandardSpectra for Identication and Interpretation of XPS Data,Physical Electronics, 1995.
40 S. M. Islam, J. Im, A. J. Freeman and M. G. Kanatzidis, Inorg.Chem., 2014, 53, 4698–4704.
1132 | Chem. Sci., 2016, 7, 1121–1132
41 S. Amayri, T. Arnold, T. Reich, H. Foerstendorf, G. Geipel,G. Bernhard and A. Massanek, Environ. Sci. Technol., 2004,38, 6032–6036.
42 D. D. Do, Adsorption Analysis: Equilibria and Kinetics,Imperial College Press, 1998.
43 M. Arias, C. Perez-Novo, E. Lopez and B. Soto, Geoderma,2006, 133, 151–159.
44 R. Han, W. Zou, Y. Wang and L. Zhu, J. Environ. Radioact.,2007, 93, 127–143.
45 M. Arshadi, M. J. Amiri and S. Mousavi,Water Res. Ind., 2014,6, 1–17.
46 A. I. Bortun, L. N. Bortun, D. M. Poojary, O. Xiang andA. Cleareld, Chem. Mater., 2000, 12, 294–305.
47 H.-L. Chang and W.-H. Shih, Ind. Eng. Chem. Res., 1998, 37,71–78.
48 A. Cleareld, A. I. Bortun, L. N. Bortun, D. M. Poojary andS. A. Khainakov, J. Mol. Struct., 1998, 470, 207–213.
49 P. Sylvester, E. A. Behrens, G. M. Graziano and A. Cleareld,Sep. Sci. Technol., 1999, 34, 1981–1992.
50 A. Cleareld, Spec. Publ. - R. Soc. Chem., 1999, 239, 147–154.51 A. Cleareld, D. M. Poojary, E. A. Behrens, R. A. Cahill,
A. I. Bortun and L. N. Bortun, ACS Symp. Ser., 1999, 716,168–182.
52 A. Cleareld, D. M. Poojary, F. Gingl, E. A. Behrens,A. I. Bortun and L. N. Bortun, ACA Trans., 1999, 33, 67–73.
53 Journal, 2007.54 R. Chiariza, E. P. Horwitz, S. D. Alexandrators andM. J. Gula,
Sep. Sci. Technol., 1997, 32, 1–35.55 G. E. Fryxell, Y. Lin, S. Fiskum, J. C. Birnbaum, H. Wu,
K. Kemner and S. Kelly, Environ. Sci. Technol., 2005, 39,1324–1331.
56 P. Sharma and R. Tomar, Microporous Mesoporous Mater.,2008, 116, 641–652.
This journal is © The Royal Society of Chemistry 2016