Embed Size (px)
Citation preview
UNCLASSIF IED " i .r, .SECURITY CL ASSIFICATION OF THIS PAGE (When Date Fntered) , -,
READ INSI RUCTIONSREPORT DOCUMENTATION PAGE BEFORE COMPLETING FORM
I. RFPORT NUMRER 2, GOVT ACCESSION NO. 3. RECIPIENT'S CATALOG NUMBER
ic, AFIT/CI/NR 88- I _4. TITLE (and S.bttle) 5. TYPE OF REPORT & PERIOD COVERED %
0 Tkfi. IEF:FCTS OF PLY D OpcFF5 o r MS THESISTCJILL 3-4ApVof OF GLA PHI1T/
6. PERFORMING 03G. REPORT NUMBER
7. AUTHOR(s) 6. CONTRACT OR GRANT NUMBER(s)
9. PERFORMING ORGANIZATION NAME AND ADDRESS 10. PROGRAM ELEMENT. PROJECT. TASKAREA & WORK UNIT NUMBERS
AFIT STUDENT AT: K I'J51tiTLS TT,
6A Tt(L iOLOC.Y______ ______
Ii. CONTROLLING OFFICE NAME AND ADDRESS 12. REPORT DATE
198813. NUMBER OF PAGES
14 MONITORING AGENCY NAME & ADDRESS(I llliferent Irom Controlling Office) IS. SECURITY CLASS. (of this report)
AFIT/NR UNCLASSIFIEDWright-Patterson AFB OH 45433-6583 UNCLASSIFIED
IS.. DECLASSIFICATION, DOWNGRADING
SCHEDULE
16, DISTRIBUTION STATEMENT (of this Report)
DISTRIBUTED UNLIMITED: APPROVED FOR PUBLIC RELEASE
DTIC17. DISTRI UT1ION STATEMENT (of the abstract entered in Block 20, If different from, Repor)~ S
SAME AS REPORT A 3H
I. SUPPLEMENTARY NOTES Approved for Publ I Release JAW AFR 190-1 V
LYNN E. WOLAVERd - -tL Y'Dean for Research nd Professional DevelopmentAir Force Instit e of TechnologyWright-Patterson AFB OH 45433-6 83
19. KEY WORDS (Continue on reverse side if necessary and identify by block number)
-
.p
20. ASTRACTY (_Cnntinue on reverse side If necessary and Identify by block number) a
ATTACHED P"F
DD I JAN73 1473 EDITION OF I NOV 65 IS OBSOLETE
SECURITY CLASSIFICATION OF THIS PAGE (When Data Entered)
% %",-

-2-
THE EFFECTS OF PLY DROPOFFS ON THE TENSILE BEHAVIOR
OF GRAPHITE/EPOXY LAMINATES
by
RAYMOND KEVIN CANNON
Submitted to the Department of Aeronautics and Astronauticson May 26, 1987 in patial fulfillment of the
requirements for the Degree of Master of Science
ABSTRACT
The effects of ply dropoffs on the stress-strain behavior,
fracture modes and fracture strength of graphitP,'epcxylaminates in tension were investigated. Seven different layupswith ply dropoffs were manufactured and tested to failure inuniaxial tension. Test variables included the number, order,
angular orientation, and effective ply thickness of dropped
plies. With six of the ply dropoff laminates, one side of thelaminate was flat, with the outer plies of the other side of
the laminate curving over the ply dropoff from the undropped,
or thicker, section to the dropped section. This type of
laminate is geometrically unsymmetric, and therefore bending
stresses are induced in the laminate during testing. The
analysis method developed was a one-dimensional model which
allows the calculation of first ply failure of a ply dropofflaminate taking into account this induced bending effect. Theseventh ply dropoff laminate was made such that the outer pliessurrounding the dropped plies tapered in on both sides suchthat the laminate was geometrically symmetric. Thestress-strain behavior of the ply dropoff laminates was closelyapproximated by those of the flat laminates having the samelayups as the dropped and undropped sections. The failurestresses and modes of the ply dropoff laminates were equal andsimilar to, respectively,that of the flat laminate having thesame layup as the dropped section of the ply dropoff laminate,within data scatter. Of the number, order, angularorientation, and effective ply thickness variables studied,only the order seemed to affect the ply dropoff laminates incomparison with the flat laminates. Laminates with all droppedplies adjacent to each other in the center of the laminatetended to delaminate away from the rest of the laminate in theundropped section. Failure stresses were still unaffected,however.
Thesis Supervisor: Paul A. Lagace
Title: Associate Professor of Aeronautics and Astronautics
!Z

+ q I
THE EFFECTS OF PLY DROPOFFS ON THE TENSILE BEHAVIOROF GRAPHITE/EPOXY LAMINATES
by
RAYMOND KEVIN CANNONB.S., United States Air Force Academy
(1981)
SUBMITTED IN PARTIAL FULFILLMENTOF THE REQUIREMENTS FOR THE
DEGREE OF
MASTER OF SCIENCE INAERONAUTICS AND ASTRONAUTICS
at the
MASSACHUSETTS INSTITUTE OF TECHNOLOGYMay 1987
@ Massachusetts Institute of Technology 1987
Signature of Author___ _Department of Aeronautics and Astronautics
May 26, 1987
Ceritifed byProfessor Paul A. Lagace
Thesis Supervisor
Accepted byProfessor Harold Y. Wachman
Chairman, Departmental Graduate Committee
3J
3
'.-~*~#.P ~ ~ ~ Sy~.\.\~.v %r. ~ Wi. %%SI S . .'%******* *-I

-2-
THE EFFECTS OF PLY DROPOFFS ON THE TENSILE BEHAVIOR
OF GRAPHITE/EPOXY LAMINATES
by
RAYMOND KEVIN CANNON
Submitted to the Department of Aeronautics and Astronauticson May 26, 1987 in patial fulfillment of the
requirements for the Degree of Master of Science
ABSTRACT
The effects of ply dropoffs on the stress-strain behavior,fracture modes and fracture strength of graphite/epoxylaminates in tension were investigated. Seven different layupswith ply dropoffs were manufactured and tested to failure inuniaxial tension. Test variables included the number, order,angular orientation, and effective ply thickness of droppedplies. With six of the ply dropoff laminates, one side of thelaminate was flat, with the outer plies of the other side ofthe laminate curving over the ply dropoff from the undropped,or thicker, section to the dropped section. This type oflaminate is geometrically unsymmetric, and therefore bendingstresses are induced in the laminate during testing. Theanalysis method developed was a one-dimensional model whichallows the calculation of first ply failure of a ply dropofflaminate taking into account this induced bending effect. Theseventh ply dropoff laminate was made such that the outer pliessurrounding the dropped plies tapered in on both sides suchthat the laminate was geometrically symmetric. Thestress-strain behavior of the ply dropoff laminates was closelyapproximated by those of the flat laminates having the samelayups as the dropped and undropped sections. The failurestresses and modes of the ply dropoff laminates were equal andsimilar to, respectively,that of the flat laminate having thesame layup as the dropped section of the ply dropoff laminate,within data scatter. Of the number, order, angular
orientation, and effective ply thickness variables studied,only the order seemed to affect the ply dropoff laminates incomparison with the flat laminates. Laminates with all dropped
plies adjacent to each other in the center of the laminatetended to delaminate away from the rest of the laminate in theundropped section. Failure stresses were still unaffected,
however.
Thesis Supervisor: Paul A. Lagace
Title: Associate Professor of Aeronautics and Astronautics.
%1
V~d..~.~4' ; ~ ~95 ~ ~ .<C..'. -.- %-
'L.' . "---X* 5., ' :."X .,,. & i. S.., ,S.' ..." " ' : < "; : ¢ 4:' 'N'''" '. '"" '".;":'':"'''i'? "__,_ "'" ' '"'
-3-
ACKNOWLEDGMENTS
I would like to take this opportunity to thank the manypeople who have contributed so much to this thesis and to mystay at MIT. First of all, I would like to thank the Air Forcefor sponsoring me and MIT for accepting me into this program.The challenge was great and the rewards were many.
I am very thankful to my advisor, Professor Paul Lagace.Besides putting in a great deal of effort, expertise, andinsight into the thesis itself, Paul was a great motivator.Whenever things were going badly, a talk with Paul would helpme get things turned around.
while the Air Force and MIT got me into this program, myoffice mates saw me through it. Whether it was technicaladvice for research or the classroom, or just keeping thingsfun and interesting, my friends in the office never let medown. Thanks very much to Lenny who took me under his wingwhen I first arrived, Doug, Mike K., Pierre, Mike B., Peter,John B., John S., and especially to Kevin, without whom thisthesis would still not be done.
I had a great deal of assistance from two undergraduatesfrom beginning to end of the thesis, Stephanie and Kara. My
sincere thanks goes to you for not only doing a lot of the"grunt" work required in the lab, but for also being realcontributors in every aspect of the project. I would also liketo thank Adam and Charles for coming to my rescue during thelast month of the project when so much still needed to bedone.
There would be no TELAC without the people who really runthe lab. Many thanks to Al Supple and Carl Varnerin forgetting me through the manufacturing, testing, and so manyother details which go into an experimental program. Thanks goto Ping Lee and Debra Smith for taking care of theadministrative matters.
p. V
*?L
c ;p Avrai 3 For
6 7T.
DIst SpeaizU.
e1 1
UN

-5-
DEDICATION
To my wife, Leona, and son, Jonathan
S..
S.' 'S
4'.
U.
'p.5'
.4
4.
U
A.U.U
'S
'S -,
U
4
h
p.

-6-
TABLE OF CONTENTS
PAGE
Introduction 15
2 Previous Work 19
2.1 Interlaminar Stresses and Delamination 19
2.2 Interlaminar Stresses with Ply Dropoffs 24
3 The Experiment 33
3.1 Material and Specimen Choice 33
3.2 Experimental Test Program 36
3.3 Specimen Manufacture 43
3.4 Ply Dropoff Charactristics 61
3.5 Instrumentation of Specimens 61
3.6 Testing Procedures 64
3.7 Data Reduction 66
4 Analysis 68 -
4.1 Problem Overview 68
4.2 Assumptions 68
4.3 Governing Equations 70
4.4 Stress Calculation 78
4.5 Failure Criteria 79
4.6 Analytical Results 81
5 Experimental Results 84
5.1 Stress-Strain Behavior 84
5.2 Photoelastic Tests 116
5.3 Fracture Stresses 127 e
5.4 Fracture Modes 130-V
y'

-7-
TABLE OF CONTENTS (continued)
6 Discussion 153
6.1 Effects of Ply Dropoffs on Stress-Strain 153Behavior
6.2 Effects of Ply Dropoffs on Failure Stresses 154
6.3 Effects of Ply Dropoffs on Failure Modes 158
7 Conclusions and Recommendations 164
References 167
Data Tables 171
2% %
|,e
h
w'S

-8-
LIST OF FIGURES
PAGE
Figure 2.1 Laminate with Free Edge Uniaxially Load 20
Figure 2.2 Interlaminar Shear Stress From Free Edge 22
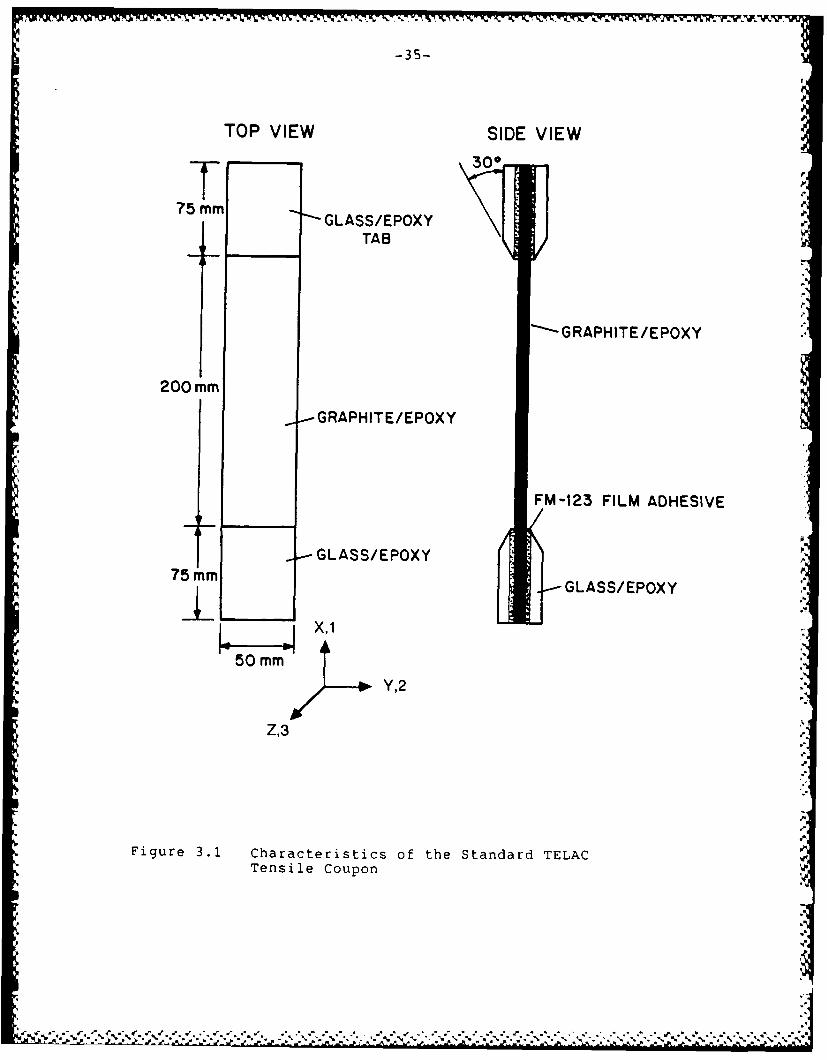
Figure 3.1 Characteristics of the Standard TELAC 35Tensile Coupon
Figure 3.2 Side View of Coupon Configurations for 38(a-Top) Coupon With Ply Dropoffs With OneFlat Side; and (b-Bottom) Coupon With PlyDropoffs With Contiguous Neutral Axis
Figure 3.3 Schematic of a Layup With Ply Dropoffs 47
Figure 3.4 Photomicrograph of a Typical Ply Dropoff 48Region
Figure 3.5 Illustration of Cross Section of Cure Setup 50for Flat Laminates
Figure 3.6 Illustration of Cross Section of Cure Setup 51for Laminates With Ply Dropoffs
Figure 3.7 Illustration of Cross Section of Cure Setup 53for Geometrically Symmetric Ply DropoffLaminates
Figure 3.8 Standard Cure Cycle for AS4/3501-6 55Graphite/Epoxy
Figure 3.9 Location of the Coupon Measurement Points 57
Figure 3.10 Photomicrograph and Schematic 62Representation of Ply Dropoff
Figure 3.11 Photomicrograph and Schematic 63Representation of Ply Dropoff With Void
Figure 3.12 Strain Gage Locations for (a) Flat and (b) 65Ply Dropoff Specimens
Figure 4.1 Schematic of Analysis Model 69
Figure 5.1 Stress-Strain Plot Showing Linear-to-Failure 85Behavior
Figure 5.2 Stress-Strain Plot Showing a Reduction in 86Tangent Modulus ("Softening")
-9-
Figure 5.3 Stress-Strain Plot Showing "Stiffening" 88
Figure 5.4 Stress-Strain Plot Showing Strain 89
Discontinuity Points
Figure 5.5 Stress-Strain Plot Showing a Reversal Point 90
Figure 5.6 Stress-Strain Plot Showing Load Drops 91
Figure 5.7 Typical Stress-Strain Plot for a [±4 5/0S 97Specimen
Figure 5.8 Typical Stress-Strain Plot for a 99[±4 5/0D/O/-+ 4 5 ]T Specimen
Figure 5.9 Typical Stress-Strain Plot for a 100[±4 5/0/-+4 5]T Specimen
Figure 5.10 Typical Stress-Strain Plot for a 101[±(452)/02]S Specimen
Figure 5.11 Typical Stress-Strain Plot for a 103
(±(4 52)/0/0D]S Specimen
Figure 5.12 Typical Stress-Strain Plot for a 104[+45/+45D/-45/-45D/0/0D]S Specimen
Figure 5.13 Typical Stress-Strain Plot for a [±(452)/0] 106Specimen 2- S
Figure 5.14 Typical Stress-Strain Plot for a 107[(±45)2/92JS Specimen
2 2 SFigure 5.15 Typical Stress-Strain Plot for a 108 V
[±4 5/(±45)D/02]S Specimen
Figure 5.16 Typical Stress-Strain Plot for a 110[±4 5/(± 4 5)D/0/0D]S Specimen
Figure 5.17 Typical Stress-Strain Plot for a (±45/01 2 S i1 SSpecimen 2S
Figure 5.18 Stress-Strain Plot for a (±4 5/012S With a 112Load Drop
Figure 5.19 Typical Stress-Strain Plot for a 114 S[±4 5/0/(± 4 5/0)DJS Specimen[±(15 2/02] S cm n'"-.
Figure 5.20 Typical Stress-Strain Plot for a 115[±(15) /0 1~ Specimen
Figure 5.21 Typical Stress-Strain Plot fou a 117[+15/+15D/-15/-15D/0/0D]S Specimen

-10-
Figure 5.22 Typical Stress-Strain Plot for a [±15/0] s 118
Figure 5.23 Photoelastic Photograph of the [±45/012 S 119Specimen Loaded with 17.9 KN
Figure 5.24 Photoelastic Photograph of the 121[±45/0 /0/-+ 451T Specimen Loaded with5.70 KR
Figure 5.25 Photoelastic Photograph of the 122[±45/0 /0/-+ 4 5 ]T Specimen Loaded with9.36 KR
Figure 5.26 Photoelastic Photograph of the 123[±4 5/(± 4 5 )D/02]S Specimen Loaded with5.89 KN
Figure 5.27 Photoelastic Photograph of the 124[±4 5/(±4 5 )D/021S Specimen Loaded with27.6 KN D
Figure 5.28 Photoelastic Photograph of the 125[±4 5/0/(± 4 5/0)DIS Specimen Loaded with464 KN
Figure 5.29 Photoelastic Photograph of the 126[±4 5/0/(± 4 5/0)DIS Specimen Loaded with11.2 KN
Figure 5.30 Typical Fracture Mode for a [±45/0] S 131Specimen
Figure 5.31 Typical Fracture Mode for a [±4 5/0/-+ 4 51T 133Specimen
Figure 5.32 Typical Fracture Mode for a [±4 5/0D/0/-+4 51T 134Specimen
Figure 5.33 Typical Fracture Mode for a [±(452)/02]S 135Specimen
Figure 5.34 Typical Fracture Mode for a [±( 4 52)/0]S 137Specimen 2 S
Figure 5.35 Typicalpein Fracture Mode for a [±(452)/0/0D] 138
Figure 5.36 Typical Fracture Mode for a 139 ,[+45/+45 D /-45/-45D/0/0DS Specimen
Figure 5.37 Typical Fracture Mode for a [±(45)2/021 S 141Specimen
5'4

Figure 5.38 Typical Fracture Mode for a [±45/021 S 142Specimen
Figure 5.39 Typical Fracture Mode for a [±4 5/(±4 5)D/ 0 21 S 143Specimen
Figure 5.40 Typical Fracture Mode for a 144(±4 5/(± 4 5 )D/O/ODIS Specimen
Figure 5.41 Typical Fracture Mode for a [±4 5/0 12S 146Specimen
Figure 5.42 Typical Fracture Mode for a 148[±45/0/(±45/0) D]S Specimen
Figure 5.43 Typical Fracture Mode for a [±(152)/02]S 149
Specimen
Figure 5.44 Typical Fracture Mode for a [±15/0j s 150Specimen
Figure 5.45 Typical Fracture Mode for a 152[+15/+15D/-15/-15D/0/0D1 Specimen
- - i - ' a I . 5 ~ B, U B
-12-
LIST OF TABLES
PAGE
Table 3.1 Elastic Properties of AS4/3501-6 34
Graphite/Epoxy
Table 3.2 Test Program Summary 40
Table 3.3 Number of Plies Per Tab for Flat Specimens 59
Table 3.4 Number of Plies Per Tab for Ply Dropoff 60Specimens
Table 4.1 Summary of Analytical Results for Laminates 82With Ply Dropoffs
Table 5.1 Longitudinal Moduli for Flat Specimens 93
Table 5.2 Longitudinal Moduli for Dropped and Undropped 94Section, Flat and Tapered Sides of PlyDropoff Laminates
Table 5.3 Comparison of Experimental and Predicted 95Longitudinal Moduli for Ply Dropoff Laminates
Table 5.4 Summary of Average Fracture Stresses of Flat 128Laminates
Table 5.5 Summary of Average Fracture Loads and 129Fracture Stresses Based on Undropped Sectionand Dropped Section Area of Laminates withPly Dropoffs
Table 6.1 Comparison of Experimental Fracture Stresses 155and Predicted First Ply Failure Stresses forPly Dropoff Laminates
Table 6.2 Comparison of Fracture Stresses for Ply 157Dropoff Laminates, Flat Laminates ModelingDropped Section of Ply Dropoff Laminates, andCLPT Predicted Values
Table 6.3 CLPT Predicted First Ply Failure Loads for 161Ply Dropoff Laminates
.1o
p .. * . ' " .
li 4
.. 4

-13-
LIST OF DATA TABLESPAGE
Data Table 1 Summary of Data for Flat Specimes 171
Data Table 2 Summary of Longitudinal Modulus Data for 173Ply Dropoff Laminates
Data Table 3 Summary of Thickness and Failure Stress 175Data for Ply Dropoff Laminates
|5
'S5'
-".- - -.
*5* 5%5%VSi~% 5*
' %v- sv- .,~ .
-14-
J.
NOMENCLATURE
CLPT Classical Laminated Plate Theory
EL longitudinal modulusLa
GPa Gigapascals (=109 pascals)
KN Kilonewtons (=10 3 newtons)
M moment resultant
MPa Megapascals (=106 pascals)
mm millimeters p
N stress resultant
w z-direction displacement
K curvature
np total potential energyp
[ei]ali longitudinal stress in ith ply
[ei] ,0221 transverse stress in ith ply
0121 shear stress in ith ply
Of failure stress
V Poisson's ratio
'4
%• %
%5%
U-

-15-
CHAPTER 1
INTRODUCTION
The use of composites has grown tremendously in the past
decade. Industries as diverse as recreational, sporting,
automotive, and aerospace have fouiid good use of the improved
strength to weight and stiffness to weight ratios which
composites can offer over more conventional materials. Golf
club shafts, hockey sticks, and tennis racquets reinforced by
or made of advanced composites are now commonplace to the
sports enthusiast. It is becoming more and more common to see
composite racing bicycle frames in the local bicycle shop.
Composite driveshafts and leaf springs have been in production
in American automobiles for several years. Formula type and
Grand Touring Prototype (GTP) racecars use composite monocoque
chassis. Lotus expects to have the first production car with a
full composite monocoque chassis sold in the United States in
late 1990 [1]. What is particularly encouraging about some of
these later developments in the use of composites is that they
are being used in primary structural applications, laid up from
preimpregnated tape or cloth rather than molded chopped
fibers. This gives a composite structure in its strongest and
stiffest form.
Nevertheless, the aerospace industry has been the prime
mover in composite materials, mainly because of the great
importance of weight savings. Initial aircraft applications
were secondary structural applications, such as access doors,

-16-
fairings, and flaps. Tail sections and wing skins are common
in such aircraft as the General Dynamics F-16 and the
McDonnell-Douglas F-18. The Beech Starship is a new, all
composite, business class civilian aircraft currently awaiting
certification by the FAA. This aircraft represents a huge jump
forward in the use of composites. Another very desirable
property of composites which make them particularly well suited
to the aerospace industry is that the stiffness, strength, and
coefficient of thermal expansion can be "tailored" to optimize
the structure for the type of loads it will carry. A space
structure can be made with a zero coefficient of thermal
expansion to eliminate the problems caused by large swings of
temperature in space. Bending-twisting coupling can be
tailored into forward-swept wings allowing the increased
aerodynamic performance of this configuration to be taken
advantage of without the divergence problem which occurs with
isotropic material. This is currently being demonstrated with
the X-29.
With many real world structures, the load which must be
carried is not uniform throughout the structure. An example of
this is an aircraft wing, where the root of the wing carries
much higher loads than the tip. For this reason it would be
too conservative to design the entire structure to the highest
load. Ideally, each area of the structure is designed to be
able to carry only the load which it will see. This is often
done by varying the thickness of the structure. With metals,
it might be done by machining, casting, or various formingi%

-17-
methods. With composites it is often done by terminating plies
at various points to achieve the desired thicknesses. These
terminated plies are called ply dropoffs. These ply dropoffs
are essentially a discontinuity which act as a stress riser
both in the plane and out of the plane, even with strictly in
plane loading. Out-of-plane, or interlaminar, stresses can
lead to delamination in a composite material due to the
relative weakness of the material in the out of plane direction
when compared with the strength along the fibers. Delamination
can in turn lead to early failure in the structure when
compared with that predicted from in-plane considerations.
The purpose of this investigation was to determine the
effects of ply dropoffs on the strength of graphite/epoxy
laminates loaded in tension. This was done by conducting a
series of experiments on statically loaded tensile coupons with
and without ply dropoffs. In Chapter 2 of this document,
previous work done in this area and the related topic of free
edge induced interlaminar stresses is described. The
experimental work performed, including ply dropoff
characteristics, specimen manufacturing, and testing methods
are described in Chapter 3. A derivation of the analysis used ,
to predict the strength effects of ply dropoffs on laminates is
presented in Chapter 4. In Chapter 5, the results of the
experimental study, including stress-strain behavior, fracture
stresses, fracture modes, and the analysis are presented.
Chapter 6 contains a discussion on the effects of the ply
dropoffs on fracture stresses and failure modes. Finally,
N Nt.

-18-
conclusions from this work and further recommendations are made
in Chapter 7.
N|'
i o °N
.: ° S
S - - . . .. . . . . . . .. -

-19-
CHAPTER 2
SUMMARY OF PREVIOUS WORK
2.1 Interlaminar Stresses and Delamination
Delamination is a damage mode peculiar to laminated
composites where the plies of the composite separate at a ply
interface. Delaminations are caused by out-of-plane, or
interlaminar, stresses. These interlaminar stresses occur in a
multidirectional composite wherever there is a gradient field,
such as at a ply dropoff, free edge, hole, or bonded or bolted
joint (2]. The most studied case in this area has been that of
the free edge.
Classical Laminated Plate Theory (CLPT) is based on the
assumption that a state of plane stress exists for a thin,
symmetric laminate when subjected to in-plane loads. In any
multidirectional layup, elastic properties such as Poisson's
ratio, Young's modulus, and coefficients of mutual influence
differ among the various angular orientations [3]. Since CLPT
imposes strain continuity through the thickness of the
laminate, in-plane stresses must differ in the plies. The CLPT
solution cannot hold near the gradient field. This is most
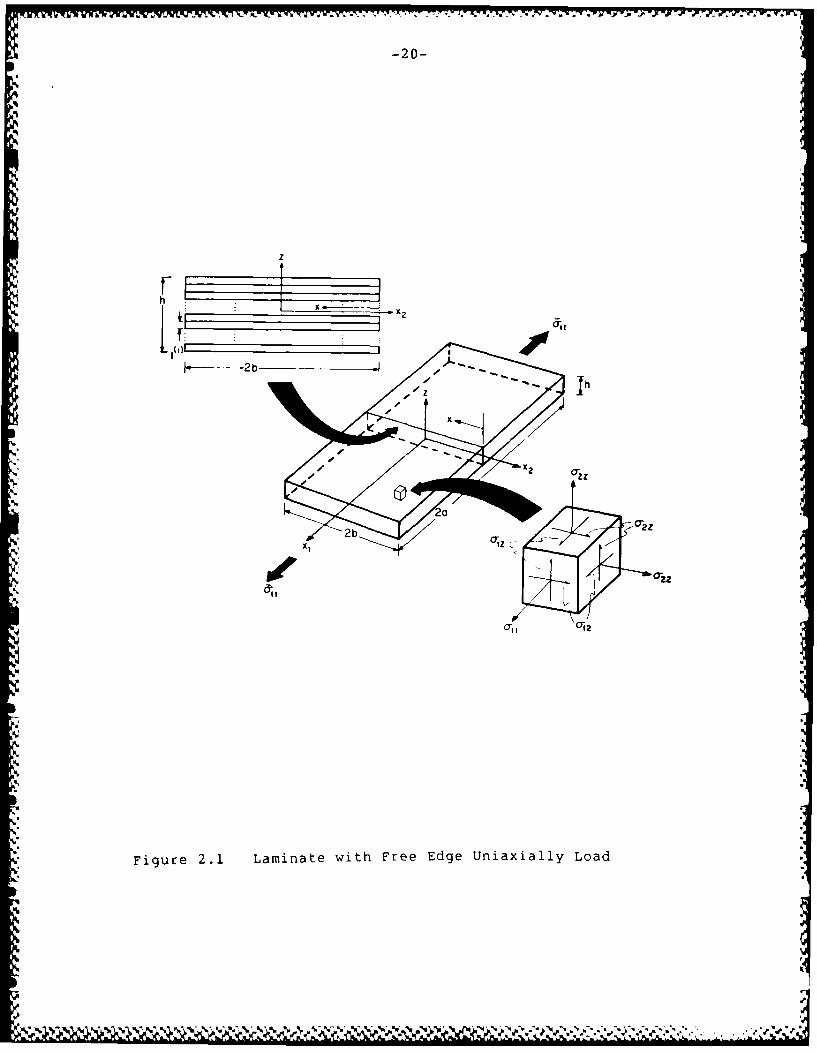
easily seen with the case of the free edge. Figure 2.1 is a
drawing of a laminate with a free edge uniaxially loaded in the
x-direction. The free edge is in the y-z plane of the
laminate, and therefore in-plane stresses a22 and all must be
zero on this face. With CLPT, however, it is predicted that
. , " . . '. -. , ' . . o2 . v' ".';¢'.-'€; '.''; - €'-' .'.- ' : " ::€ C :-:..S.
-20-
2b
.54p
x OI
2bI
Figure 2.1 Laminate with Free Edge Uniaxially Load
5%%

-21-
these stresses are not zero in the plies themselves, but only
in an average sense through the thickness of the laminate. As
can be seen in Figure 2.2, a1 2 equal to zero on the free edgeNi
means that the couple caused by a1 2 on the other edges must be
reacted by some other force to remain in equilibrium. The only
force that can counteract this couple is a lz acting on the
edge, or boundary layer, at the lower ply interface [4]. This
same boundary layer effect will occur at any gradient field.
Calculating these interlaminar stresses has been the topic
of many research papers. Pipes and Pagano used a finite
difference scheme in a 1970 paper which initiated much of the
interest in this area [5]. Many authors have used finite
element methods (FEM) to model the interlaminar stress problem
[6,7,8,9]. Whitney assumed stress functions which satisfied
differential equilibrium and found fair agreement with some
elasticity solutions although compatability was not satisfied
[10]. Pipes and Pagano experienced a divergence problem using
a Fourier series method [11]. Lagace and Kassapoglou [12,13]
determined the interlaminar stresses in the free edge problem
by assuming stress functions which satisfy differential and
integral equilibrium, and minimizing the complementary energy.
Excellent agreement with numerical solutions were obtained with
the benefi of thick laminate capability and greatly reduced
computati-,,.i time over that of FEM.
After the interlaminar stress distributions are
calculated, a failure, or delamination initiation, criterion is
needed to determine the effects of these stresses. The

ft -. a * t a ft a-22- ---
T j y dydz
f I, z~ dxdyf
IF
JJ-ryx dydz ~
Xf
Y,2
z
Figure 2.2 Interlaminar Shear Stress From Free Edge

F-; V. ' -ulr C A. -' _M - - M
p -23-
interlminar shear and normal stresses calculated at the point
of the free edge far exceed the strength of the matrix, which
is similar to the case of the point at the edge of a hole where
the in-plane stress, aill exceeds the ultimate stress of the
material. Since failure does not occur the moment this point
*- stress value exceeds the strength of the material, it was
reasoned that failure is due to an average stress over a
specified region. Whitney and Nuismer [14] introduced this
concept of an average stress criterion in a study of the
failure of notched composites. Kim and Soni [15,161 applied an
average stress criterion to delamination initiation, first by
averaging the interlaminar normal stress, azzi over an
arbitrarily chosen dimension of one nominal ply thickness.
Delamination initiation was predicted when the averaged azz
value reached the interlaminar normal strength parameter, which
was estimated as the transverse strength of a unidirectional
ply. In another study, Kim and Soni averaged the interlaminar
shear stress, a1z' over the nominal ply thickness and used the
in-plane shear stregth to approximate the interlaminar shear
strength of the laminate. Reasonable agrreement with
experimental data was achieved with both of these studies.
The Quadratic Delamination Criterion (QDC) proposed by
Lagace and Brewer [17] is an average stress criterion which
takes account of a1 z and tensile azz" Compressive a zz values
are not believed to cause delamination. The effect of ply
thickness on delamination initiation due to interlaminar
stresses at the free edge was also studied in this

-24-
investigation. It has been experimentally shown that
initiation will occur at lower values of applied far-field
stress for laminates with larger ply thicknesses. This was
explained mathematically by noting that the interlaminar stress
distributions spread out with respect to distance from the free
edge as ply thickness increases, while the value of stress at
the free edge and the shape of the stress distribution remains
constant. Since the stresses are averaged in the QDC failure
criterion over an averaging dimension which remains constant,
the average interlaminar stress components contributing to
delamination increase for a given far field stress.
Several others [18,19,20] have used a fracture mechanics
approach for predicting delamination initiation. With this
approach, the delamination is modeled as an interlaminar
crack. The basic idea behind this approach is that
delamination occurs if and only if the strain energy released
as the delamination grows is sufficient to provide the energy
needed to create the new surface. Strain energy available for
release is typically determined by finite element analysis.
2.2 Interlaminar Stresses With Ply Dropoffs
While the effects of interlaminar stresses and
delamination have been studied quite extensively in the area of
the general free edge problem, very little work has been done
in the area of ply dropoffs. Similar to the free edge problem,
gradient stress fields also occur due to ply dropoffs and
therefore need to be studied fuither. Ply dropoffs are used
4]
p"

-25-
quite frequently in the aerospace industry to tailor thickness,
stiffness, and strength. Therefore, it is important to gain a
more thorough understanding of the strength effects of ply
dropoffs in composite laminates.
The Navy has funded several projects in the area of ply
dropoffs, dealing more specifically with composite panels
designed for the vertical stabilizers of the F-18. These
investigations were performed by the Northrop Corporation and
the University of Wyoming and included experimental and
analytical work. Grimes and Dusablon [21] and Adams [22]
performed an experimental investigation based on a 30 ply
[(±4 5)5/016/ 9 0 4]C layup, where the I IC notation denotes a
condensed notation scheme used for ease of wriiting. Three
variations were tested, the flat (undropped) laminates, a ply
dropoff laminate with two 00 plies dropped off (referred to as
PDO #1) and a ply dropoff laminate with two sets of ±450 plies
dropped off(PDO #2). All plies were dropped off
symmetrically. The panels were tested in compression testing
both statically and in fatigue, as well as under various
temperature and humidity conditions. For the static tests,
there was very little variation in strength between the flat
specimens and PDO #1 and #2. Note, however that these ply
dropoffs are relatively benign cases, with only two 00 or four
450 plies dropped off in a 30 ply laminate.
Ramkumar and Adams [231 continued this study by combining
the effects of porosity and holes drilled at the ply dropoffs.
The same laminates, in addition to [0124, [90]24, and [±4 5 16S24 4 S

-26-
were used in this study. Reduced pressure during the cure
cycle was used to create additional porosity in the laminates.p
Poros-ty had no effect on the failure strains of the laminates
with ply dropoffs but did reduce failure strains in the flat
specimens. Holes drilled at ply dropoffs greatly reduced
failure strains, regardless of porosity. ..
Adams, Ramkumar, and Walrath [241 performed an analytical
study on the same problem using a three-dimensional nonlinear I
finite element analysis of PDO #1. Manufacturing stresses and
moisture absorption were taken into account. The grid used was
rather coarse, two layers of elements were used for the 0°
dropped ply, and only the top half was modeled, even though the
laminate was not geometrically symmetric. It was felt that a
good representation of the macroscopic, structural effect of
the ply dropoffs was achieved. The results showed
concentrations of in-plane stress in the area of the ply
dropoff and correlated well with the experimental room.I
temperature results. The model showed small interlaminar
stresses around the ply dropoff region relative to that of the
in-plane stresses.
DiNardo and Lagace [25] conducted an investigation into
the effects of ply dropoffs on the buckling and postbuckling
behavior on composite plates. Both experimental and analytical
work was done with flat (no dropoff) plates, plates with ply
dropoffs, and plates with angle changes in the same location as
the ply dropoffs, that being along a centerline perpendicular
to the loading direction. Several layups with ply dropoffs
a:
3 6,% J ° o". - -"-' " '." ' " ' . - " "€" -' " ' .. . . " • I
|5
-27-
were considered, including a single 00 ply dropped off, double
00 plies dropped off both symmetrically and unsymmetrically,
angle plies dropped off symmetrically, 00 and angle plies p
dropped off symmetrically, and entire sublaminates ([±45/0] S )
dropped off. Two methods of analysis were used, both looking
at the linear buckling behavior of the plates. One method used
a "superelement" formulated with a Rayleigh-Ritz assumed
deflection method. Each plate used one such element to model.4
each half of the plate. The second method used a hybrid stress
finite element method.
DiNardo and Lagace found that ply dropoffs have
significant effects on both the buckling load and deflection
shapes of buckled plates. It was found both with the analysis
and by experiment that the buckling loads for the ply dropoff
cases were bounded by the buckling loads for the basic plates
having the same layups as the individual halves of the plate
with the ply dropoff. The ply dropoffs complicated the
deflection shapes, as well as moving the maximum lateral
deflection of the plate from the center towards the center of
the dropped section. The buckling behavior of the plates with
the dropoffs depended largely on the ratio of the D terms of
the dropped and undropped sections. Plates with ply dropoffs
which had dropped and undropped sections with identical or
similar D terms had exhibited similar deflection, strain, and
failure behavior. In general, failure loads were dependent on
the thickness of the thinnest section of the plate.
More closely related to the topic at hand, Wu and Webber
• - - .= _ " -. .. ° " . ' ,€ ' " " "U.' .' ¢$€,.C 2 , .' 2 ',22 . a-
-28-
(26] performed an analytical investigation upon the effects of
ply dropoffs via FEM by developing a quasi-three dimensional
isoparametric element. They modeled a configuration with the
ply dropoffs on the outside of the laminate with a plane of
symmetry about the center of the laminate such that the
displacements and strains do not vary across the width of the
specimen in the transverse direction away from any free edges.
The assumed displacement fields limit the applicability of this
element to balanced, symmetric laminates. Three laminates were
analyzed, ( 0 4 1S? [0/ 9 0/0 2]S , and (-+4 5/0 21 S' The first two
plies in each half laminate were dropped off on the outside of
the laminate, where only half of the laminate is modeled due to
symmetry. The model predicted high in-plane (aii) and
interlaminar (alz and azz ) peak stresses in the corner region
of the step. These peak stresses were reduced when a more
realistic case was modeled with a glue fillet added at the tip
of the ply dropoff. The three laminates above are listed in
descending order of peak stresses, with the [ 0 4 1s laminate
having the highest peak stresses.
Kemp and Johnson (27] also conducted an analytical study
in the area of ply dropoffs in compression and tension. They
used a two-dimensional isoparametric element for the finite
element analysis used to predict stresses. Two modes of
failure initiation were analyzed. The maximum stress criterion
was used for the pure resin regions modeled around the
inidividual plies and the three-dimensional Tsai-Wu criteria
was used for in-plane failure. Two layups were analyzed,
- . ---' .Sp~ i , *- i& - . " . 01
-29-
[±45/0/ 9 0/0nD/ 9 0/0/-+ 4 5] (case 1) and [0/90/±45/0 nD/-+ 4 5/9 0 /0 1
(case 2) in both symmetric and total configurations, where the
laminates in the total configuration were half the thickness of
the symmetric configuration and flat on one side. The
symmetric configuration laminates were geometrically
symmetric. The subscript nD denotes the number of plies
dropped off where n is equal to one, two, or three. One other
variable was added to thp analysis. which the authors called
the aspect ratio and was defined as the ratio of height to
length of the triangular region of resin ahead of the dropped
ply. Values of 1/3, 1/4, 1/5, and 1/6 were used. Tensile
results of the first laminate listed above in both the
symmetric and total configuration were presented and discussed
with n equals 3 and an aspect ratio of 1/3.
The results presented showed that the ply dropoff does
significantly affect the stress distribution and contributes to
the formation of interlaminar shear and normal stresses. The
peak values of the interlaminar stresses occur at the ply
dropoff and decay when moving away from the dropoff to a value
of zero, as predicted by CLPT, away from this boundary layer.
The shear-in distance, defined as the axial length required to
transfer load to dropped plies, for interlaminar shear stress
was found to be equal to 20h for 1 ply dropoff, where h equals
the ply thickness, and an additional 5h for each additional
dropped ply. Shear-in distance for interlaminar normal stress
was about half that of interlaminar shear stress. The failure
criterion for out-of-plane failure indicated a failure at the
3 ) " . 3 5".;v~~~*. " v '.. . .. " - ". - ,"'2 "*" .,,-.., *'VW V-€-.-'. ." -".. . ........ %.. ... *
-30-
upper interface at the ply dropoff for all unsymmetric
laminates and about half of the symmetric laminates, with the
remaining failures occurring at the lower interface at the ply
dropoff. Decreasing aspect ratio increased strain to failure. %
This was the first failure event predicted in most cases,
although the analysis predicted tension intralaminar failures
at the upper corner of the ply of the case 2 layup with an
aspect ratio of 1/3. The authors noted that material
nonlinearity might need to be taken into account to
realistically predict failure strains due to the known
softening of the neat resin before failure.
Curry, Johnson, and Starnes (28] performed an experimental
and analytical study on the effects of ply dropoffs on
graphite/epoxy laminates loaded in tension and compression.
Laminates considered were [(±45/0/90) s(ND)(±45/0/90)S] T layups
where ND represents eight different sublaminates. Six of these
sublaminates were unidirectional layups of 900 and 00, each
with two, four, or eight plies. The last two sublaminates were
[±4 5/0 2]s and [±45/0/90 S Therefore, undropped laminate
thickness ranged from 18 to 24 plies, while all dropped end
thicknesses were 16 plies. All laminates with ply dropoffs
were fabricated with one side of the laminate flat and one side
tapering in from the undropped end of the specimen to the
dropped end. Bending-extension coupling was thus created due
to the geometric eccentricity of the midplanes of the dropped
and undropped sections. A finite element analysis was
performed to determine the three-dimensional state of stress in
%"- -" -' % . %1 %W -

-31-
the laminates in the region of the ply dropoff. Three failure
criteria were used to predict the failure load and mode. The
three-dimensional tensor polynomial failure criterion and
individual fiber/matrix criteria developed by Hashin were used
for intralaminar failure, the interlaminar criteria were based
on the matrix failure modes developed by Hashin, and strength
criteria for neat resin were taken from data by Chamis.
The results of this study were that the strength of
laminates with ply dropoffs was less than that of its dropped
section, the compression specimens exhibited a lower strength
than a tension specimen of the same configuration and width,
and that the reduction in strength is directly related to the
axial stiffness change between the thick and thin sections of
the laminate. The failure criteria were accurate in predicting
* the regions of critical stress, but were quite conservative in
predicting the failure load.
It is clear from a review of work completed to date in the
area of ply dropoffs that more work needs to be done in this
area to understand what is really happening, particularly in
the case of tension loaded laminates, where very little work
has been done. Methods must be developed to predict the
strength, and possible strength and stiffness reduction
effects, of laminates with ply dropoffs for more efficient
design of aerospace structures. The goal of this investiqation
is therefore to experimentally determine the effects of ply
dropoffs on the strength of a composite structure loaded in

V -------------- 77 .-. .-.
-32-
tension. Analysis methods are developed to determine any
strength reduction effect caused by the ply dropoffs due to
induced bending.
. . . . . .
p.%
-33-
CHAPTER 3
THE EXPERIMENT
3.1 Material and Specimen Choice
The graphite/epoxy used in this investigation was Hercules
AS4/3501-6. The material was furnished as a continuous roll of
unidirectional tape with a nominal width of 305 mm. The epoxy
system of the preimpregnated tape or prepreg was in a
semi-cured state and hence stored in freezers at -18 C or below
until used. The elastic properties of unidirectional
AS4/3501-6 are listed in Table 3.1.
The specimen used in this study was the standard coupon
used at TELAC [291. This coupon, shown in Figure 3.1, measures
350 mm long by 50 mm wide. Glass/epoxy loading tabs 75 mm long
were bonded to the ends of the specimen with FM-123-2, a film
adhesive from American Cyanimid. The loading tabs were
precured 3M type 1002 with a layup of alternating 00 and 900
plies. The thickness of the loading tabs was a function of the
thickness of both ends of the coupon. This is described in
more detail in Section 3.3, Specimen Manufacture. The tab
thickness to specimen thickness ratio is that recommended by
the American Society for Testing and Materials, which is
between 1.5 to I and 4 to 1 [301. The length of the test
section is 200 mm.
S• ,
S

-34-
TABLE 3.1
ELASTIC PROPERTIES OF AS4/3501-6 GRAPHITE/EPOXY
E 11 142 GPa
E2 9.81 GPa
E33 9.81 GPa
G1 6.0 GPa
G1 3 6.0 GPa
S G2 3 4.8 GPa
V 1 2 0.30
V 1 3 0.30
V 23 0.34
.
-35-
TOP VIEW SIDE VIEW
I.T 300
TA'75 mm GLASS/EPOXY
TAB
.- GRAPHITE/EPOXY
200 mm
0..GRAPHITE/EPOXY
FM-123 FILM ADHESIVE
GLASS/EPOXY-, 75 mm GLASS/EPOXY.
x,150mm
Y,2
Z,3
''p
Figure 3.1 Characteristics of the Standard TELAC
Tensile Coupon
a -V-aJ:..L . ",_.'.I.,'% .''- C ." -" " ..- ';-" -" " " , .,"; ,'." ',' ".-"," -,-"."." " ,., ' " .-. ,
-36-
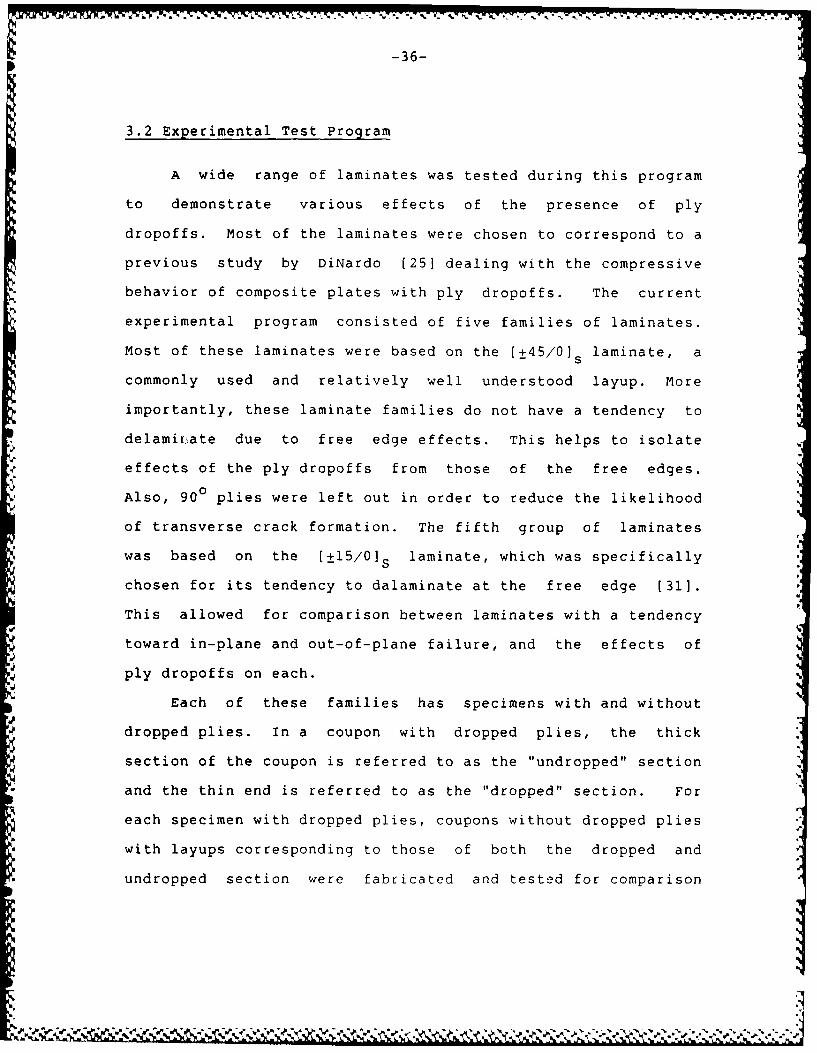
3.2 Experimental Test Program
A wide range of laminates was tested during this program
to demonstrate various effects of the presence of ply
dropoffs. Most of the laminates were chosen to correspond to a
previous study by DiNardo [251 dealing with the compressive
behavior of composite plates with ply dropoffs. The current
experimental program consisted of five families of laminates.
Most of these laminates were based on the [±45/0] s laminate, a
commonly used and relatively well understood layup. More
importantly, these laminate families do not have a tendency to
delamirnate due to free edge effects. This helps to isolate
effects of the ply dropoffs from those of the free edges.
Also, 900 plies were left out in order to reduce the likelihood
of transverse crack formation. The fifth group of laminates
was based on the [±15/01 S laminate, which was specifically
chosen for its tendency to dalaminate at the free edge [31].
This allowed for comparison between laminates with a tendency
toward in-plane and out-of-plane failure, and the effects of
ply dropoffs on each.
Each of these families has specimens with and without
dropped plies. In a coupon with dropped plies, the thick
section of the coupon is referred to as the "undropped" section
and the thin end is referred to as the "dropped" section. For
each specimen with dropped plies, coupons without dropped plies
with layups corresponding to those of both the dropped and
undropped section were fabricated and tested for comparison
"p%a%

-37-
purposes.
Several factors were considered important in choosing
these layups, including the number of plies dropped off, theb
orientation of the plies dropped off, the arrangement of the
dropped plies within the laminate, and the effective ply
thickness. Laminates were selected such that these effects
could be isolated. All of the laminates tested contained
internal ply dropoffs only, that is the plies which are dropped
off have covering contoured plies over them such that the
dropped ply is not exposed. This was done for realism as most
structural designs using ply dropoffs use internal ply
dropoffs.
Four different classes of ply dropoffs were considered for
this investigation to isolate the effects of the factors listed
above. These were a single 00 ply dropped off, two 00 plies
dropped off symmetrically, angle plies (±45 ,±15 ) dropped off
symmetrically, 00 and angle plies dropped off symmetrically,
and an entire sublaminate ([±45/01 s ) dropped off.
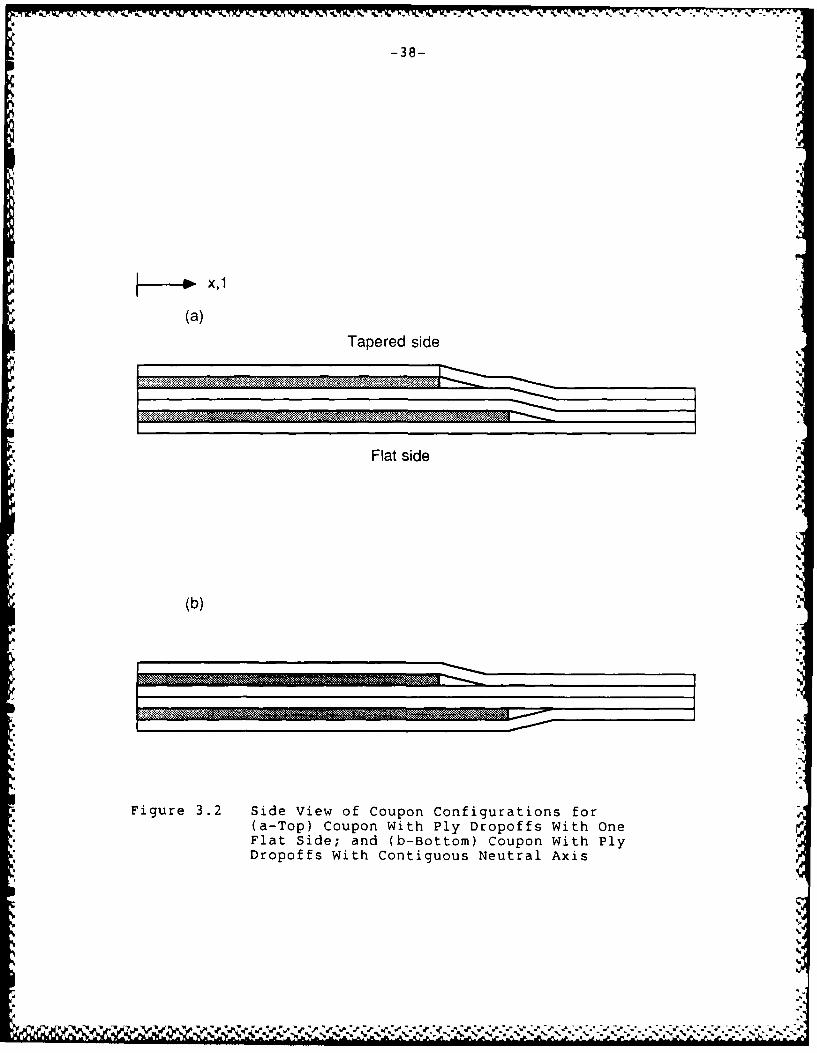
Side views of the coupon configurations with ply dropoffs
used in this investigation are shown in Figure 3.2. Most of
the specimens made were of the type shown in Figure 3.2a.
These specimens have one flat side. The other side is not flat
due to the ply dropoffs. The plies laid up on top of the
terminating plies curve over the ply dropoff and then become
flat again over the dropped section of the coupon. Note that
even though the specimens are laid up symmetrically, with both
the dropped and the undropped sections having a symmetric
...... . ....
-38-~I.
X, 1
(a)Tapered side
Flat side
.,
(b)
Figure 3.2 Side View of Coupon Configurations for(a-Top) Coupon With Ply Dropoffs With OneFlat Side; and (b-Bottom) Coupon With PlyDropoffs With Contiguous Neutral Axis
IS
,4.
'. ' . . '" '__ __ L" " '"._,. ,.. " ,,,,.",,." ,,"".,." ,,""." . "" '"'" " ' ' " '"+" " " " - " " " "' -"" '""""" " """

-39-
layup, the entire coupon is not geometrically symmetric. The
midplanes of the dropped and undropped section do not V
coincide. While thicker loading tabs were used on the dropped
end of the specimen to minimize loading eccentricity, some
bending is still likely to be induced.
The motivation behind the specimen shown in Figure 3.2b
was to make a geometrically symmetric laminate. With this
laminate, the midplanes of the dropped and undropped sections
are the same. Therefore when the laminate is loaded
extensionally in the test machine, a loading eccentricity, and
therefore bending, does not occur. It should be noted,
however, that the specimen in Figure 3.2a is more realistic of
actual structures. The specimen in Figure 3.2b was used
experimentally to help isolate the effects of the ply dropoff
from one more variable, that being induced bendin. This
proved to be a more difficult laminate to manufacture. More
details of the fabrication of this laminate are given in
section 3.3 on Specimen Manufacture.
Table 3.2 is a complete list of the specimens used in this
investigation. The subscript "S" denotes that the laminate is
symmetric about the midplane for the flat coupons. Although
the specimens with ply dropoffs do not have a common midplane,
the "S" subscript still means that the laminate is laid up
symmetrically. The "S" applies to the dropped plies as well as
the undropped plies, and also applies to each section
separately. The subscript "T" stands for total and means that
the total laminate has been specified. The subscript "D"
'I

-40-
TABLE 3.2
TEST PROGRAM SUMMARY
Laminate Letter Typea CommentsName
[±45/0] S J F Basic Laminate
[±4 5/0D/0/-+ 4 5 ]T K PD Single 00 ply dropped
[±45/0/-+45) T M F Models dropped section
[±(452)/02]S A F Basic laminate
[±( 4 5 2)/0/0D]S E PD 00 plies dropped
(+45/+45D/-45/-45D/0/0D]S F PD 00, angle plies dropped
[±(452)/0]S C F Models dropped section
[(±45)2/021 S G F Basic laminate
[±4 5/(t 4 5 )D/02Is H PD Angle plies dropped
0[±4 5/(± 4 5 )D/0/0DIS I PD 0 , angle plies dropped
[±45/02]s L F Models dropped section
[±45/012 S B F Basic laminate
(±4 5/0/(± 4 5/0)D]S D PD Sublaminate dropped
[±(152)/02]S Q F Basic Laminate
P SPDb 00, angle plies dropped
[±15/01S R F Models dropped section
alaminate types: flat (F), ply dropoff (PD)
bSPD indicates geometrically symmetric ply dropoff specimen
JIN

-41-
denotes that the associated ply or sublaminate are terminated
at the midline of the section, perpendicular to the direction
of the applied load. For example, a [±4 5/(±4 5 )D/0/0D]S
laminate would have an undropped section layup of [(±4 5 )2/02]s
and a dropped section layup of [±4 5/0]S.
The laminates used in this experiment are placed into five
groups in Table 3.2. The first group is based around the
[±45/0] S laminate. The second laminate in the first group,
[±4 5/OD/O/-+4 5]T has one 00 ply dropped off from the basic
laminate. The third laminate in this group, (±4 5/0/-+ 4 5]T
matches the dropped section of the second laminate. Note that
the undropped section of the second laminate is the same as the
[±45/0] S laminate, the first layup in this group.
The second group of specimens in Table 3.2 is based around
the [±(452)/02] laminate. This is actually the same layup as
the basic laminate of the first with double the effective ply
thickness. The second laminate in this group, [±( 4 52)/0/0D]sP
has two 0 plies dropped symmetrically, whereas the
[+45/+45 D/-45/-45D/0/0D]S laminate has both angle plies and 00
plies dropped symmetrically in an alternating fashion. The
first laminate in this group models the undropped section of
both of the laminates with ply dropoffs. The fourth laminate
in this group, [±(452)/0] models the dropped section of the
[±( 45 2)/O/ODJS laminate. Note that the dropped section of the
[+45/+45 D/-45/-45D/0/0D s is modeled by the basic laminate of
the first group, the [±4 5/0)S laminate.
The third group of laminates is similar to the second, the
V V

-42-
difference being that the 450 plies are alternated instead of
being doubled. The basic layup in this group is the
[(±4 5 )2/02]s laminate. The second laminate in this group,
[±45/(±45)D/02] S has angle plies dropped, while the third
laminate in this group, [±4 5/(± 4 5 )D/0/0D]s has both angle plies
and two 00 plies dropped off symmetrically. The undropped
sections of both the laminates with ply dropoffs in this
section are modeled by the basic lanminate in this group,
[(±45)2 /02 ]s. The dropped section of the [±45/(±45
laminate is modeled by the fourth laminate listed in this
group, [±4 5/02]s' The dropped section of the
[±45/(±45)D/0/0D1s laminate is modeled by the basic laminate of
the first group, (45/0] S *
The fourth group of laminates in Table 3.2 is based around
the first laminate of this group, the [±4 5/0)2S layup. This is
also related to the basic [±4 5/0]S of the first group, but with
twice the plies. Instead of making the plies double thickness,
as in the second group, the thickness has been doubled by
doubling each half of the laminate as a unit, rather than by
doubling the individual plies. This allows comparison of
single ply effective thickness, double ply effective thickness,
and stacking sequence effects. The ply dropoff laminate in
this group is a [±4 5/0/(± 4 5/0)D]S layup with half of its plies
dropped off symmetrically as a sublaminate group. The
undropped section of this laminate is modeled by the basic
laminate of this group, while the undropped section of this
laminate is modeled by the basic laminate of the first group,

-43-
[±45/0 Is
The fifth family of laminates in this group in Table 3.2
is similar to that of the second group but with two
differences. The first is that the +450 angle plies of the
second group are replaced by ±150 plies. This was done to
create a laminate with a greater tendency to delaminate.
Previous experiments with flat laminates have shown this
greater tendency to delaminate over that of the [±45/01 s family
[31,321 The second difference is that the laminates with
dropped plies in this group were laid up symmetrically, that is
both sides were made to curve around the ply dropoff region
rather than having one side flat and one side curve around the
dropped region. This was done to minimize any load
eccentricity and thus induced bending effect which might be
caused by the loading of a geometrically unsymmetric (one side
flat) laminate. Details on fabrication of these specinmens are
contained in section 3.5. The basic laminate of this group
then is the [±(15 2)/02Js layup, which corresponds to the
undropped section of the laminate with the ply dropoffs in this
group, the [+15/+15D/-15/-15D/0/0D]S layup. This latter
laminate has angle plies and two 00 plies dropped off
symmetrically in an alternating fashion. The undropped section
of this laminate is modeled by the third laminate in this55
group, [±15/01.
3.3 Specimen Manufacture
All procedures except those directly pertaining to ply
SorF
% O.55o

-44-
dropoffs were done according to standard procedures developed
at TELAC [29]. The methodology of manufacturing the laminates
with ply dropoffs had already been developed within TELAC by
DiNardo [25]. The important point dealing with the
manufacturing of ply dropoffs which came out of this study was
that constructing these laminates requires a great deal of care
to prevent voids from forming. The general manufacturing
methodology is as follows. The plate is laid up in the
conventional manner up until the layer of the terminated ply.
The terminated ply is half the length of a normal ply in the x
direction. The undropped plies are then laid up on top of the
terminated ply or plies. Each of these plies is carefully
smoothed down by hand over the ply dropoff region. The entire
laminate is carefully smoothed down by hand, again paying
particular attention to the region over the ply dropoff.
The laminate is cured according to standard procedure,
except that no top caul plate is used since the upper surface
is not flat. Care must be taken to ensure that cure materials
on top of the laminate are flat so as not to cause any
wrinkling on the laminate surface. After cure and postcure, a
milling machine equipped with a diamond grit cutting wheel and
water cooling system is used to cut the plate into coupons.
This allows the ply dropoff region to be examined at two
widthwise points per coupon under a microscope.
A detailed summary of these procedures and modifications
made for ply dropoff manufacturing follows.
The graphite/epoxy is supplied in rolls of semi-cured
-45-
unidirectional preimpregnated tape or "prepreg" with a nominal
width of 305 mm. To prevent curing of the matrix before layup,
the prepreg is stored in freezers at a temperature below
-18°0C. One hour prior to manufacture, the roll is removed from
the freezer and left in a sealed bag. This warm-up procedure
prevents condensation from forming on the composite and helps
to make the prepreg more pliable. The prepreg is cut and
stacked ino uncured laminates in an air conditioned "clean
room". The air conditioning keeps the temperature below 25°C
and the relative humidity low. When handling the prepreg,
surgical gloves are worn to avoid contamination by skin oil.
The prepreg is cut into shapes which can be placed together to
form plies with dimensions of 305 mm by 350 mm. This is
accomplished using Stanley razor knives and teflon covered
templates to ensure the required precision. When forming the
angle plies, the cuts are made to avoid fiber breaks in the
ply. The edges of the two pieces which form this angled ply
are placed together so the cuts are parallel to the fiber
direction. In other words, only matrix joints are present
within a laminae. Alignment of the plies during layup is
assured by laying one corner of the plies up against a square
corner of a layup jig, which defines the good corner of the
laminate. This good corner is used subsequently as a reference
to ensure alignment during cure and machining of the laminate.
Following layup, peel-ply is applied to both sides of the
laminate. The peel-ply protects the laminate during the cure
and also produces a textured finish to aid in bonding the
-I

-46-
loading tabs and strain gages.
Layup of the ply dropoff plates requires the use of
special techniques not standardized within TELAC. However,
plates with ply dropoffs have previously been manufactured at
TELAC by DiNardo [251. These same procedures were used in the
current study.
The plate is laid up in the conventional manner up until
the layer of the terminated ply. The terminated ply is half
the length of a normal ply in the x direction, as illustrated
in Figure 3.3. Aluminum templates were made with a tolerance
of ±0.03 mm to cut the terminated plies to the desired
accuracy. When more than two plies are dropped off, the
dropoffs were spaced apart from each other (in the x-direction)
by 1.5 mm. This spacing allows the top plies to more readily
conform to the underlying plies, reducing the likelihood of
void or bubble formation. During the actual layup of the
plies, considerable care was taken to smooth down the plies as
they were laid down, particularly in the region of the ply
dropoff. A plastic smoothing tool was used to press down the
plies as they were laid down and to smooth out any bubbles or
wrinkles in the laminate. At the ply dropoff, each ply was
carefully pressed down to conform as much as possible to the
underlying plies. These steps permitted the manufacture of
quality ply dropoff specimens containing a minimum of voids and
other defects. The ply dropoff characteristics are described ."
in Section 3.4. In Figure 3.4, a photomicrograph of a typical
specimen in the region of the ply dropoff is shown. The
C..

-47-
175 mm
175 mm
Dropped
LayupJig
Figure 3.3 Schematic of a Layup with Ply Dropoffs

-48
*Figure 3.4 Photomicrograph of a Typical Ply DropoffRegion
FZ - . z. e,:

-49-
individual plies and the triangular resin of neat matrix in
front of the terminated plies are clearly visible. Microscopic
examination of a number of coupons provided assurance that
large numbers of voids were not present in the test specimens.
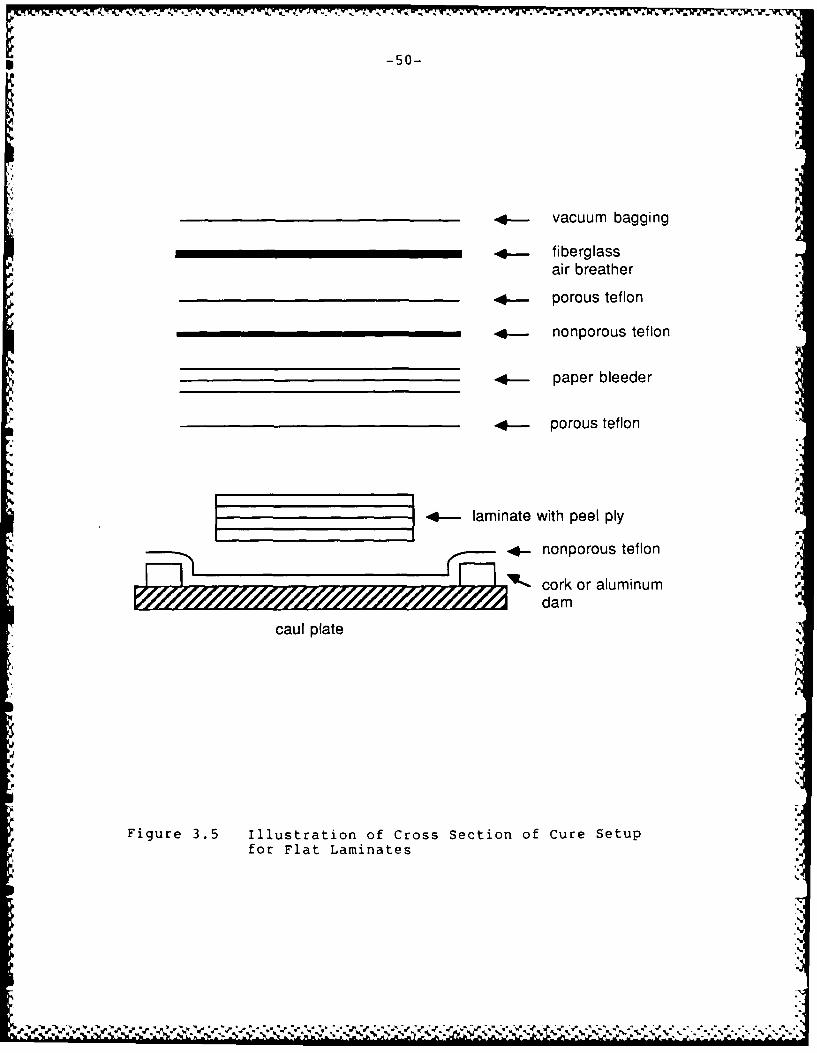
The cure setup for the flat laminates is illustrated in
Figure 3.5. The peel-ply covered laminate is placed into a
prepared space set up on an aluminum caul plate which is large
enough to cure six 305 mm by 350 mm plates at a time. Each
laminate is held in place by aluminum dams on two sides, which
maintain the good corner and by cork dams on the other two
sides. Nonporous teflon is placed on the caul plate, which was
previously coated with mold release, to help keep it clean
during the cure. The laminate is covered with porous teflon,
followed by one layer of paper bleeder for every two plies to
absorb excess resin during the cure. This is followed by a
sheet of nonporous teflon and an aluminum top plate coated with
Frekote 905 mold release. The top plate helps assure that the
finished laminate will be flat. The assembly is covered with
* another piece of nonporous teflon, followed by porous teflon,
fiberglass air breather and finally the entire setup is vacuum
bagged.
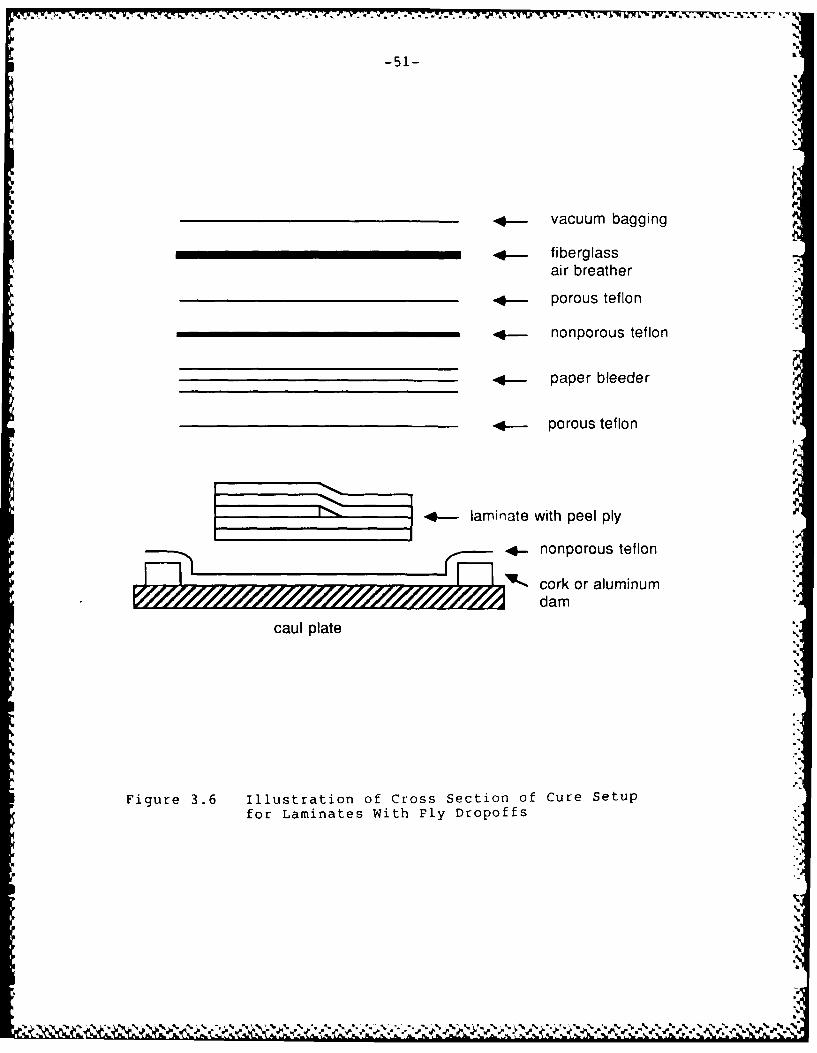
The cure setup used for the ply dropoff specimens was
slightly different, as shown in Figure 3.6. Since the top
surface of a ply dropoff specimen is, and must not be, flat,
the aluminum top plates could not be used. Instead, the top
plate was eliminated from the cure setup and pressure was
applied directly through the cure materials to the laminate
-50-
_ _ __ vacuum bagging
. fiberglass
air breather
4.-- porous teflon
4 nonporous teflon
. paper bleeder
4- porous teflon
I ~ laminate with peel ply
nonporous teflon
_ _ _ _ __ cork or aluminum,XIMOMMMO I'lOZOMMMA dam
caul plate
Figure 3.5 Illustration of Cross Section of Cure setupfor Flat Laminates
-51- IL
4-vacuum bagging
... fiberglassair breather
4- porous teflon
.. nonporous teflon
.4-- paper bleeder
4- porous teflon
4-laminate with peel ply
4-. nonporous teflon
_ _ _ _ _ _ _ _ _ _ _~ cork or aluminumdam
caul plate
N
Figure 3.6 Illustration of cross section of cure Setupfor Laminates With Ply Dropoffs

MMIL*IM 707. 7 Y - ..-..... . PF - -
-52-
during the cure. Particular care was taken with the cure9
materials to ensure a smooth surface, both with the cure
materials, and thereby the laminate itself. Any creases or
irregularities in the cure materials would affect the surface
finish of the cured plates.
The [+I5/+I5 /-15/-15D/0/0 specimen required a special
cure setup to provide a geometrically symmetric specimen. In
other words, these specimens did not have a flat side, but 9
instead had a common midplane in the dropped and undropped
region of the specimens with both sides of the undropped plies
curving in from the undropped end of the laminate around the
ply dropoff and joining up with the dropped end, as illustrated
in Figure 3.2b. It can also be seen in Figure 3.2b that these
specimens are not exactly symmetric in that the ply dropoffs
are laid up in a slightly antisymmetric manner about the
midplane such that no two ply dropoffs occur at the same point
in the x-direction. This should have minimal affect on the9
behavior of the laminate with respect to induced bending loads
or extension-bending coupling. The cure assembly used for
these specimen types is shown in Figure 3.7. Again, 305 mm by
350 mm plates are cured. Spacers manufactured from the same
material as the laminates were used both underneath and above
the dropped end of the specimen in a thickness equal to half of
the total plies dropped off. These spacers were cured before
being used. The spacers were wrapped in peel-ply to prevent
them from sticking to the laminate. Peel-ply was added to the
undropped end of the specimen to compensate for the added

| k . .4 .t -- - a- ~ -~ - - _
-53-
-q- vacuum bagging
.4..fiberglass
air breather
Sporous teflon
.4 nonporous teflon
.4-.- paper bleeder
4- porous teflon
A - spacerIz z-
4- laminate with peel ply
spacer4- nonporous teflon
_cork or aluminumdam
caul plate
Figure 3.7 Illustration of Cross Section of Cure Setup
for Geometrically Symmetric Ply Dropoff
Laminates p
-I:
I,.I 2"2 .,;• -" '€ %'-""", ' ." '''",-'%-.- -,- '.'/'%2'%,,"..). ' % ' ' -. , . ' ) .. %..-. / .' '/ / ,".
-54-
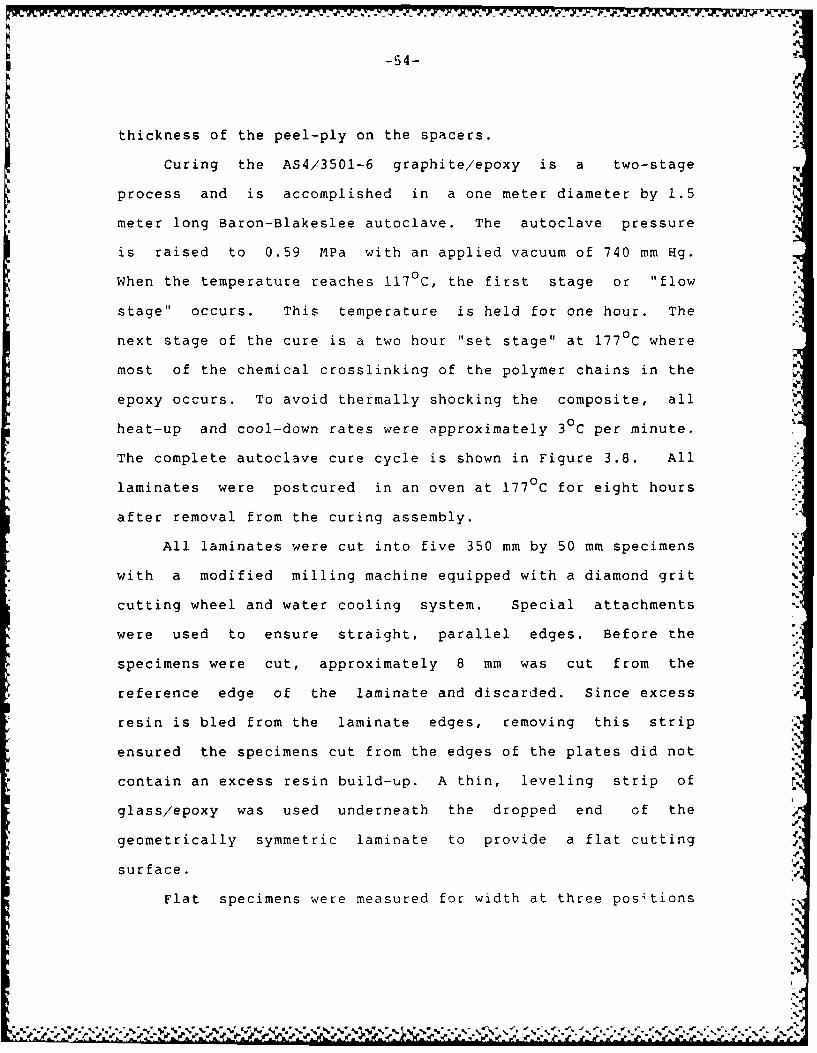
thickness of the peel-ply on the spacers.
Curing the AS4/3501-6 graphite/epoxy is a two-stage
process and is accomplished in a one meter diameter by 1.5
meter long Baron-Blakeslee autoclave. The autoclave pressure
is raised to 0.59 MPa with an applied vacuum of 740 mm Hg.
When the temperature reaches 117 0C, the first stage or "flow
stage" occurs. This temperature is held for one hour. The
next stage of the cure is a two hour "set stage" at 177 0 C where
most of the chemical crosslinking of the polymer chains in the
epoxy occurs. To avoid thermally shocking the composite, all
heat-up and cool-down rates were approximately 3 C per minute.
The complete autoclave cure cycle is shown in Figure 3.8. All
laminates were postcured in an oven at 177 °C for eight hours
after removal from the curing assembly.
All laminates were cut into five 350 mm by 50 mm specimens
with a modified milling machine equipped with a diamond grit
cutting wheel and water cooling system. Special attachments A-
were used to ensure straight, parallel edges. Before the
specimens were cut, approximately 8 mm was cut from the
reference edge of the laminate and discarded. Since excess
resin is bled from the laminate edges, removing this strip
ensured the specimens cut from the edges of the plates did not
contain an excess resin build-up. A thin, leveling strip of
glass/epoxy was used underneath the dropped end of the
geometrically symmetric laminate to provide a flat cutting
surface. "p
Flat specimens were measured for width at three positions
.VS?#I.$- - " - 1 .4$4# .#'. V ' ' • ' > -., % • - . "." . N%" .% " . 44'.

-55-
AUTOCLAVETEMMEATURE (OC)
177 A
PLUS 8 HOUR116 POSTCURE A~AT 350F
21 ,.
- ,I I I ,1 1
10 35 95 115 235 275280
AUTOCLAVE TIME (MINUTES)PRESSURE(MPG)
0.59
tO 35 95 115 25258TIME
5l VACUUM(MM HG) 5
760
I I,
10 35 95 H5 235 275280TIME
Figure 3.8 Standard Cure Cycle for AS4/3501-6Graphi te/Epoxy
V2p -

-56-
and specimens with ply dropoffs at four locations using
calipers. Flat specimens were measured for thickness at nine
locations and specimens with ply dropoffs were measured for
thickness at twelve locations, six in each of the dropped and
undropped sections of the specimens. The exact location of the
measurement points is shown in Figure 3.9. The thickness
measurements were taken primarily as a quality control check.
Application of the peel-ply causes dimpling of the laminate
surface which slightly distorts the thickness measurements.
Therefore, nominal thicknesses were used in all stress
calculations, with a nominal per ply thickness of 0.134 mm.
The overall average ply thickness was 0.135 mm with a
coefficient of variation of 4.8%. The average ply thickness of
the flat specimens was 0.134 mm with a coefficient of variation
of 4.3%, while the average thickness for specimens with ply
dropoffs was 0.136 mm with a coefficient of variation of 5.0%.
The average ply thickness of the dropped section of the
specimens with ply dropoffs was 0.140 mm with a coefficient of
variation of 4.3%, while the average for the undropped section
was 0.132 mm with a coefficient of variation of 3.5%.
Precured glass/epoxy loading tabs 75 mm long by 50 mm wide
were bonded to the coupons with American Cyanimid FM-123-2 film
adhesive. The tabs were 3M type 1002 with a [0/ 9 0 1nS layup,
where for flat specimens n is determined so as to be sufficient
for the loading tab to be 1.5 to 4 times as thick as the
laminate, as is recommended by the American Society for Testing
and Materials [31]. For specimens with ply dropoffs, the tabs
i !4.

-57-
Enlarged Section of Coupon
50mm " 50 mm
25
25 mm 25 m- Ply + +< ~Drop- +
25 off 25 m
25 rm
3 3
'%0 0 'U
3 33 3
Coupon with Flat CouponPly Dropoff
.
Figure 3.9 Location of the Coupon Measurement Points
ZZ-
,%,
U' :.~ * ... U ~U* .I

-58-
at the undropped end of the specimen were scaled the same way
as the flat specimens. This same tab thickness was used on the
flat side of the dropped end of the specimen, but tab thickness
was added to the other side of the dropped end of the specimen
to compensate for the additional thickness of the undropped end
of the specimen. For the ply dropoff laminate cured to be
geometrically symmetric, that is with no flat side, the
thickness difference between the dropped and undropped sections
was split equally between both sides of the dropped end of the
specimen. The purpose of this was to facilitate the bond cure,
as described below. The number of tab plies used for all the
coupons are listed for the flat specimens in Table 3.3 and for
the ply dropoff specimens in Table 3.4. Tab ply thickness
equals 0.250 mm.
The adhesive, cut about 4 mm longer and wider than the tab
itself, was applied directly to the tab which was then
carefully aligned and applied to the coupon. The film, which
is stored at -180 C, becomes very tacky at room temperature and
holds the tab in place on the coupon until curing. The
specimens were placed on an aluminum caul plate and covered
with porous teflon before placing steel plates on each
specimen. Nonporous teflon and then fiberglass air breather
were placed on top of the plates and the entire assembly vacuum
bagged. The film adhesive was cured for two hours at 107 0 C
with an applied vacuum and an autoclave pressure of 0.07 MPa.
This provided an absolute pressure of 0.35 MPa on the bonding
surface.
J ,6
If.Ir
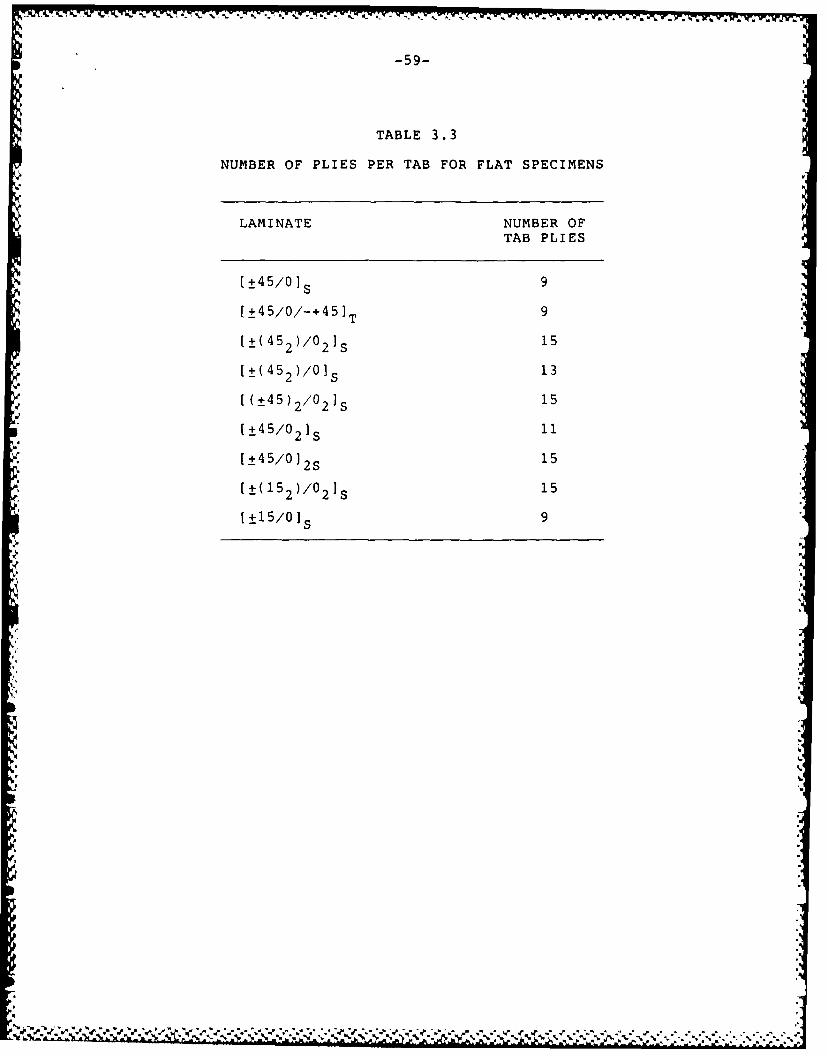
-59-
TABLE 3.3
NUMBER OF PLIES PER TAB FOR FLAT SPECIMENS
LAMINATE NUMBER OFTAB PLIES
[±45/0] S 9
[±4 5/0/-+ 45 ]T 9[±(45 2)/02] S 15 "
[±(45 2 )/0 S 13
[(±45)2/021 S 15
[±45/0 2]S 11
[±45/0 12S 15
[t(15 2 )/021s 15
[t15/0] S 9

-60-
TABLE 3.4
NUMBER OF PLIES PER TAB FOR PLY DROPOFF SPECIMENS
LAMINATE NUMBER OF rAB PLIES
Undropped End Dropped End
Flat side Tapered side
[±45/0D/0/-+45]T 9 9 99 T
(±( 4 52)/0/0DIs 15 15 17
[+45/+45D/-45/-45D/0/0D] S 15 15 19
[±4 5/(± 4 5 )D/02]S 15 15 17 "
[± 4 5/(± 4 5 )D/0/0DIs 15 15 19
[± 4 5/0/(± 4 5/0)D]S 15 15 19
S15 1 7a 17a[+15/+15D /-15/-15 D/0/0 D]S 1 7a1
a .geometrically symmetric laminate, both sides taper
N N5
:5*
, '. - ---- - --- -- --- --- -- --. , ='c ::, ' z : ' ''. ': ' ',,' .' -:,, -, ,- - -",,, ,-,,- " ' .,,-, -- ,...-'.',.', •._._ '

-61-
3.4 Ply Dropoff Characteristics
Typical photos of the ply dropoff region and schematic
representations of the photos are shown in Figures 3.10 and
3.11. For every ply that is dropped off, a triangular region
of epoxy is created at the end of the dropped ply due to the
fact that the ply placed on top of the terminated ply cannot
bend very sharply over the discontinuity. The length of this
triangular region is typically about three times the thickness
of the dropped ply (a ply has a nominal thickness of 0.134
mm). This triangular region of resin is the area where voids
often form, as can be seen in Figure 3.11. As mentioned in the
previous section, steps were taken when laying up the dropped
plies to minimize void formation. Although some voids did
still occur, they were normally found on only one side of the
cuts made when machining the plates into coupons, suggesting
that the voids were small and roughly spherical.
1.5 Instrumpntati'n of Tpecimens
Three coupons were tested with photoelastic coating bonded
to them, one each of the [±4 5/OD/O/-+ 4 5 ]s,[± 4 5/(± 4 5 )D/O/OD]S ,
and [±4 5/0/(± 4 5/0)D]S laminates. The purpose of these tests
was to obtain a qualitative feel for the stress distribution
around different ply dropoff regions. The photoelastic
coatings were bonded to the coupons using PC-l adhesive, a two
part adhesive mixed with ten parts of PCH-l hardener to one
part adhesive. The surfaces of the coupon were wiped clean
9 "*

- F- r - - -W
-62-
*7w7
Figure 3.10 Photomicrograph and SchematicRepresentation of Ply Dropoff

-63-
-- plow-
-eA

-64-
with cheesecloth before bonding. The 1.0 mm thick photoelastic
coating was cut with scissors to the size of the test section,
200 mm by 50 mm. The adhesive was allowed to cure for twelve
hours at room temperature.
Strain gages were attached to the rest of the coupons.
The gages used were type EA-06-125AD-120 with a gage factor of
2.055 and an accuracy of +0.5% and were manufactured by,%
Micro-Measurements Division of Measurements Group, Inc. For
the flat (no ply dropoff) specimens, one gage was centered on
the test section, as shown in Figure 3.12. For the coupon with
ply dropoffs, four strain gages were used. Back to back gages
were centered on both the dropped and undropped halves of the
coupon, again shown in Figure 3.12. The purpose of the strain -
gages was to determine the stiffness of the specimens and to
detect any bending which might occur in the coupons with ply
dropoffs.
3.7 Testing Procedures
All testing was done under monotonic tensile loading using a'
a Material Test System (MTS) 810 equipped with hydraulic
grips. A stroke rate of 1.09 mm/minute was used. For a
specimen with a 200 mm test section, this equates to a strain
rate of approximately 5500 microstrain per minute.
After the specimen was aligned properly in the upper grip -,
using a machinist's square, the grip was closed and the strain
gages attached to Vishay conditioners. This free hanging
position is defined as the zero load position. The gages wereI
N!

... ,,,. ., - , - -,-,, .A,,.j. -- - ' J. -. i .- - -,., ,_ .!., k , .. . .. ... .. . . . . . .*.
-65-
(a) 25 mm
25 mm
75 mm 1004 m100mm mm 75 mm
Flat Laminate
FRONT
(b) _MEM 25m
4.f
Ply Dropoffs
BACK
1*-75 mm o-1.4 -J-- -. Is .r-4 75 mm -4401 01 01 00 o C >
3 3 3 33 3 3 3
Strain Gage
-4
Figure 3.12 Strain Gage Locations for (a) Flat and (b),a"Ply Dropoff Specimens
oe 0'
4%

-66-
calibrated before the lower tab was gripped. Each gage was
first balanced so zero strain registered in this zero load
position. The proper resistance was then connected in parallel
with each strain gage to calibrate the system. A PDP11/34
computer stored the data from the conditioners through
analog-to-digital converters.
The data acquisition program was started just prior to the
application of the load by the testing machine. All tests were
conducted to failure. During the tests, the specimens were
inspected visually for signs of cracking, matrix splitting, and
delamination and monitored for sounds indicating damage. When
sounds were detected, marks were placed at the corresponding
point in the data file using a feature offered by the data
acquisition software. At failure, the fracture load and stroke
were recorded and a photograph was taken of the specimen while
it was still mounted in the grips.
3.8 Data Reduction
Following each testing period, the data was stored on
floppy disks to form a permanent record. The data was analyzed
on computer software written at TELAC [33]. This analysis
consisted of editing out points in the data file which were
recorded before the test started and after it ended. Thickness
and width measurements were added to the data file so that load
could be converted to stress. The slope of all the stress and
strain data was computed using a program called LIN6. This
program uses an algorithm to determine best fit linear regions
*""1 ' .. + ,. . +, ,+ 7 -' ++ + - + +- +] " + . " ' > '

-67-
of a data set. The longitudinal modulus at the far-field
position was determined using this program. Finally, a graph
was drawn on a pen plotter showing the stress-strain behavior
at all gage positions, as well as the marks which were placed
in the data file when noises were heard.
- " •.o.°.-
-68-
p.
CHAPTER 4I
ANALYSIS
4.1 PROBLEM OVERVIEW
All the specimens with ply dropoffs, but one, in the
current investigation were laid up with one side flat and the
other side tapered over the ply dropoff region from the
undropped to the dropped section. This means that the
midplanes of the two sections did not coincide. This is the
way most structures with ply dropoffs are actually manufactured
for reasons such as ease of manufacture and for improved
aerodynamics. The problem with this midplane offset is that
bending stresses are induced from in-plane loads. This induced
bending load is what is analyzed herein. It is very important
to note that this analysis does not consider the effect of the
interlaminar stresses induced by the ply dropoffs, as was
discussed in Chapter 2, but does consider the in-plane stress
concentration caused by the loading eccentricity. The
objective of this analysis is to determine the failure stress
of the specimen taking into account the in-plane stresses
caused directly by the tension loading in the x-direction and
the induced bending stress due to curvature in the
x-direction.
4.2 Assumptions
A drawing of the model used in this analysis is shown in
Figure 4.1. Several assumptions were made in deriving the
Ci2
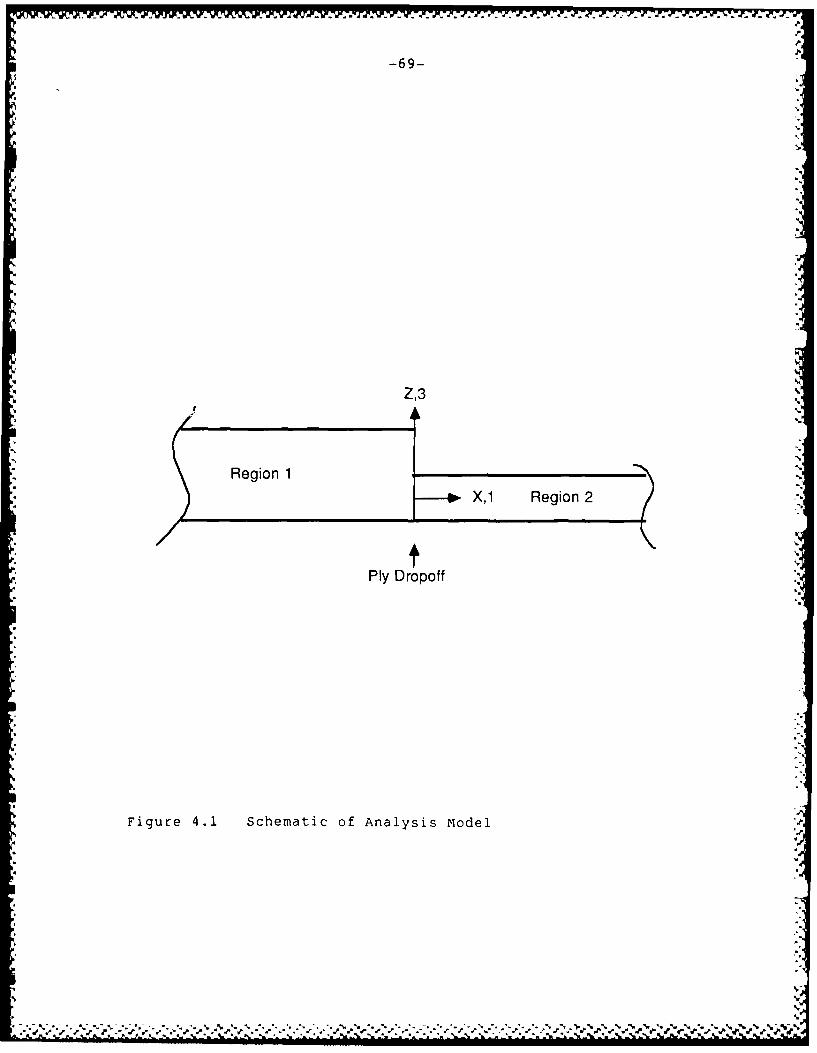
. - - 4 -- - - b 4 -J..
.Jr
-69-
'4-Z,3
Region 1
X,1 Region 2
Ply Dropoff
Figure 4.1 Schematic of Analysis Model
4.

-70-
bending correction equation. The individual properties of the
fiber and matrix are "smeared", that is each ply was considered 1
macroscopically homogeneous. Also, classical laminated plate
theory (CLPT) can be applied. Thus, each region is
characterized by the elastic matrices calculated from CLPT.
The most important assumption is that the model is a
one-dimensional model, that is in the energy expression used in
deriving the desired equations, bending and extension terms in
the x-direction only are included. Bending in the transverse
direction is assumed to be negligible.
4.3 Governing Equations
It can be seen from Figure 4.1 that the laminate is
divided up into two sections where terms with a "1" subscript
refer to the undropped end of the specimen and terms with a "2"
subscript refer to the dropped end. Since the ends of the
specimens are far away from the ply dropoff area under
consideration, the coupon can be assumed to be infinitely
long. The total potential energy of the laminate, considering
only bending and extension terms in the x-direction, can be
expressed as the sum of the potential energy of the undropped
and dropped sections:
.5
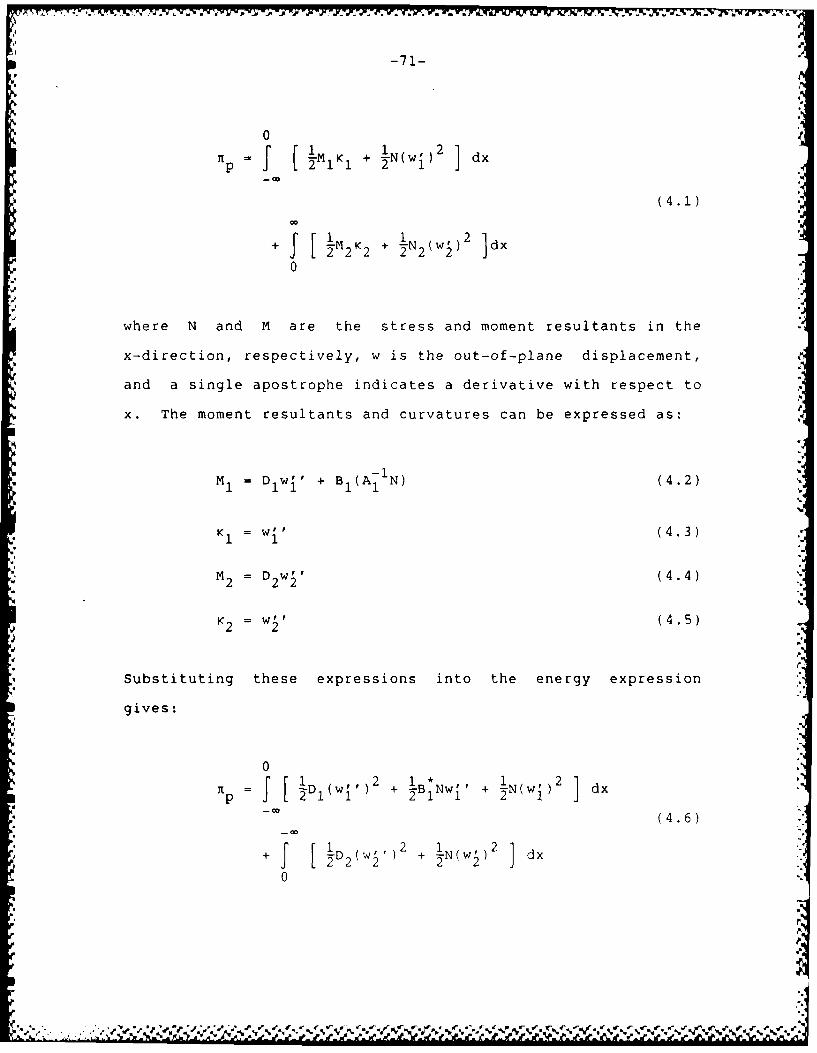
-71-
0
f-P [ MK + !N(W') 2 dx
(4.1)
+ { [ I-M2 K2 + I N 2(W2')2 ]dx
0
where N and M are the stress and moment resultants in the
x-direction, respectively, w is the out-of-plane displacement,
and a single apostrophe indicates a derivative with respect to
x. The moment resultants and curvatures can be expressed as:
SM= D wr' + B 1(A-N) (4.2)
Kl = Wi, (4.3)
M = D w' (4.4)2 2 2
K 2 = wr, (4.5)
Substituting these expressions into the energy expression
gives:
0
pI = !Dl(W')2 + 21 BNW + N(w) dx
(4.6)
+ {D 2(w') ) 2 j-"
%p.
- a , .
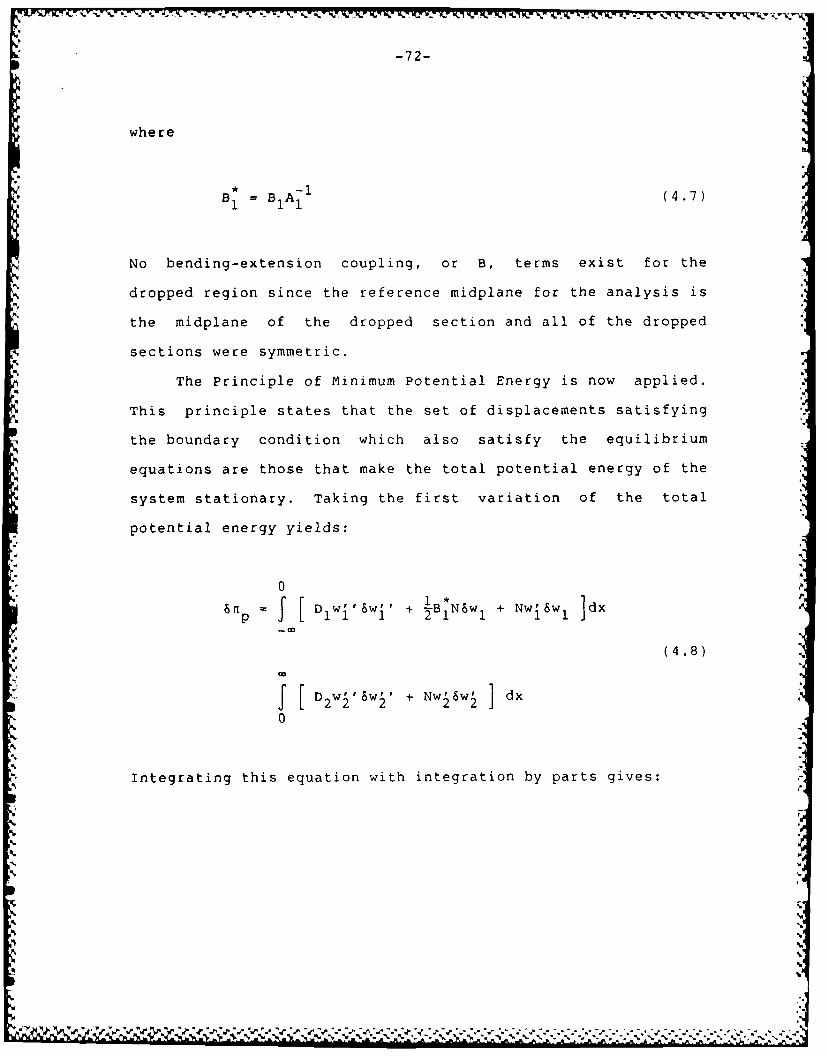
-72-
where
B A- (4.7)
No bending-extension coupling, or B, terms exist for the
dropped region since the reference midplane for the analysis is
the midplane of the dropped section and all of the dropped
sections were symmetric.
The Principle of Minimum Potential Energy is now applied.
This principle states that the set of displacements satisfying
the boundary condition which also satisfy the equilibrium
equations are those that make the total potential energy of the
system stationary. Taking the first variation of the total
potential energy yields:
0
6n $ DW1 w iw'' + !B*NW I + Nw18w I ]dx
(4.8)
D Dwl'Sw'' + Nw'Sw dx0
Integrating this equation with integration by parts gives:
'V
'S'
'S'
.5
,.
S.

-3- .PN -J Ii -. li 'j. .- - - -
-73-
0
0
2 1 A, 0 .,
-B1 N Swl + Nw~I- Nwi' 8WldX '
(4.9)COo
+ D2wi,8w - Dw',,w 1 - D wt,,q w dPPw ~ ~ o I f wW x o,L 'Sw 22 2 6 J D 2 w dx
o 1-0
" Nw'S N w'wdx =0'210
%0N
Since the variation of w I and w 2 , and therefore their
integrals, are arbitrary, this equation may be split into four
parts, the first of which deals with terms associated with the
variation of w -
0 0
DIW ['''8w I dx + Nw''Sw I dx = 0 (4.10)
Since the variation of w 1 is arbitrary and therefore not equal
to zero, the following must be true;
w1,,, - 1 = (4.11)
Similarly, the second part of the energy equation dealing with
I
,.. _.- .._ _.. .. ._.. ,.. ., .. . .. . ,.. ..--. ,..:.-' -'.-'. ..-,.- .-? -> ... :..:.-'.-:..:.-:.-:.--..-. ... -.-,...-..- .- . .-. - ., .-. . .. i'p
.~"-,
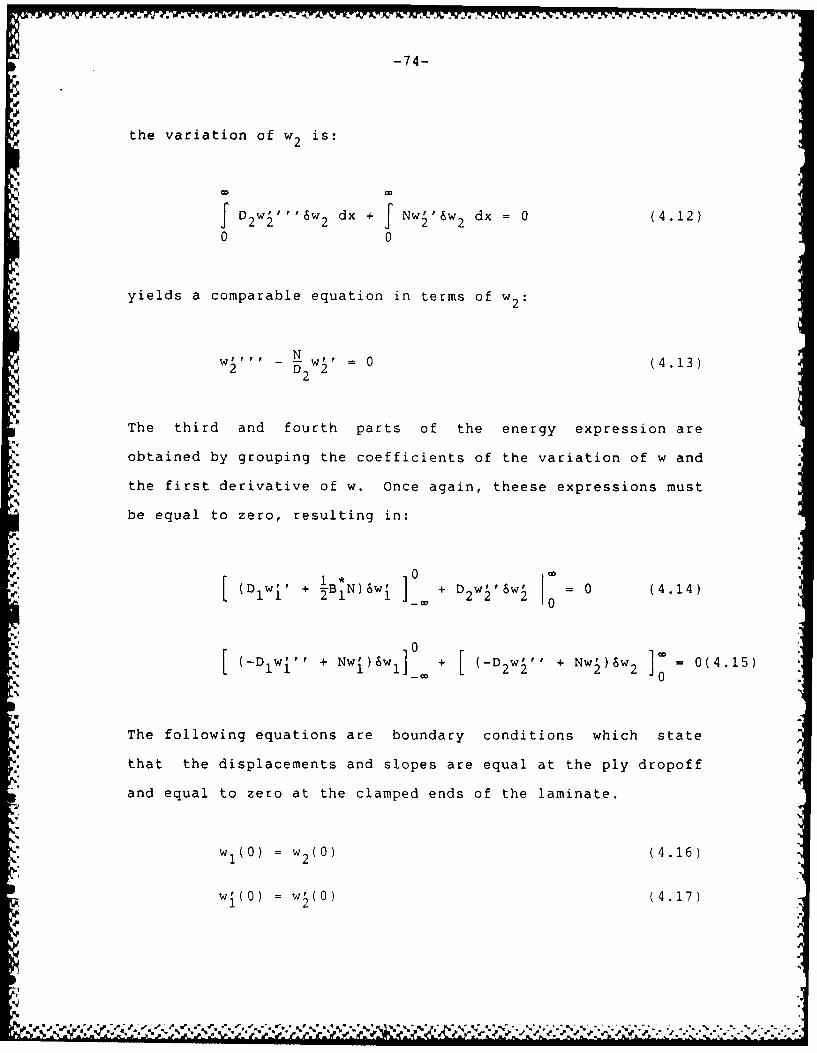
; : .. ,,-,.-..,=. * A k. 4. - *. - -. . . . ... , ,,,.. -. A . =
-74-
the variation of w2 is:
{DW''''6w2 dx +f NwI'Sw2 dx = 0 (4.12)
0 0
yields a comparable equation in terms of w2
w F,,F, - 2w! W 0 14. 131
The third and fourth parts of the energy expression are
obtained by grouping the coefficients of the variation of w and
the first derivative of w. Once again, theese expressions must
be equal to zero, resulting in:
(D w'' + iB*N)Swj + D w?'Sw = 0 (4.14)
0
The following equations are boundary conditions which state
that the displacements and slopes are equal at the ply dropoff
and equal to zero at the clamped ends of the laminate.
1(0) = w2(0) (4.16)
wi(o) = w(O) (4.17): 2 .' €, . ¢' ' ¢'. .t~~t. t~ L ." " .- %... L. . L. .. ..
.') .€.. .'. ... ,'. .. '

-75-
W w2 ) =wi(-D) =WI(-) (4.18)
These boundary conditions are used to evaluate the integrals in
equations 4.14 and 4.15 from the energy expression, which
results in:
D w' + IB*N - D w''I 0 (4.19)1 1 2 21 2 210
D ? - D=fI 0 (4.20)1 10 22K
Equations 4.11 and 4.13 are ordinary differential equations
with the solutions:
W 1 (x W1X (4.21)
11
N 2 (4.23
-C N Cx Ce (4.22) '
2 D
where
Th camedbondrycodiio o Euaio 418imlis 1a
__ .5.

-76-
C2 C3 0 (4.25)
C6 = C8 = 0 (4.26)
giving the following equations:
(ix (4.27 )w1 = C1 +
C4e
w 2 = C5 + C7e2 (4.28)
Applying the boundary conditions of displacement and slope
continuity, equations 4.16 and 4.17, at the ply dropoff to the
above equations gives:
C1 = C5 + C7 - C4 (4.29)
C4 = - C7 (4.30)
where
2 (4.31)D 2
Equations 4.29 and 4.30 simplify Equations 4.27 and 4.28 to
w I C5 + C7 1 + A - e1 (4.32)
J6 J

-77-
-W2x
w = C5 + C7 e 2 (4.33)
The fourth equation from the energy expression, Equation 4.20
provides no new information with the simplified form of the
displacement equation. However it does provide a check. Using
Equations 4.32 and 4.33 with Equation 4.19, the third equation
from the energy expression, allows C7 to be solved for.
BB1 (4.34)
4 2(1 + A)
Looking at Equations 4.32 and 4.33, it can be seen that C5 is
arbritrary since it exists alone in both the equations and will
therefore drop out of the solution. Substituting Equation 4.34
into 4.32 and 4.33 gives:
-+ 1W = - A (4.3e
,
BI -w2x (4.36)w2 = 2(A +1) e
Substituting this into Equation 4.2, the moment resultant
equation, yields:
M -B N B (4.37)M - 2(A + 1) 2
0w
a., V."
a.
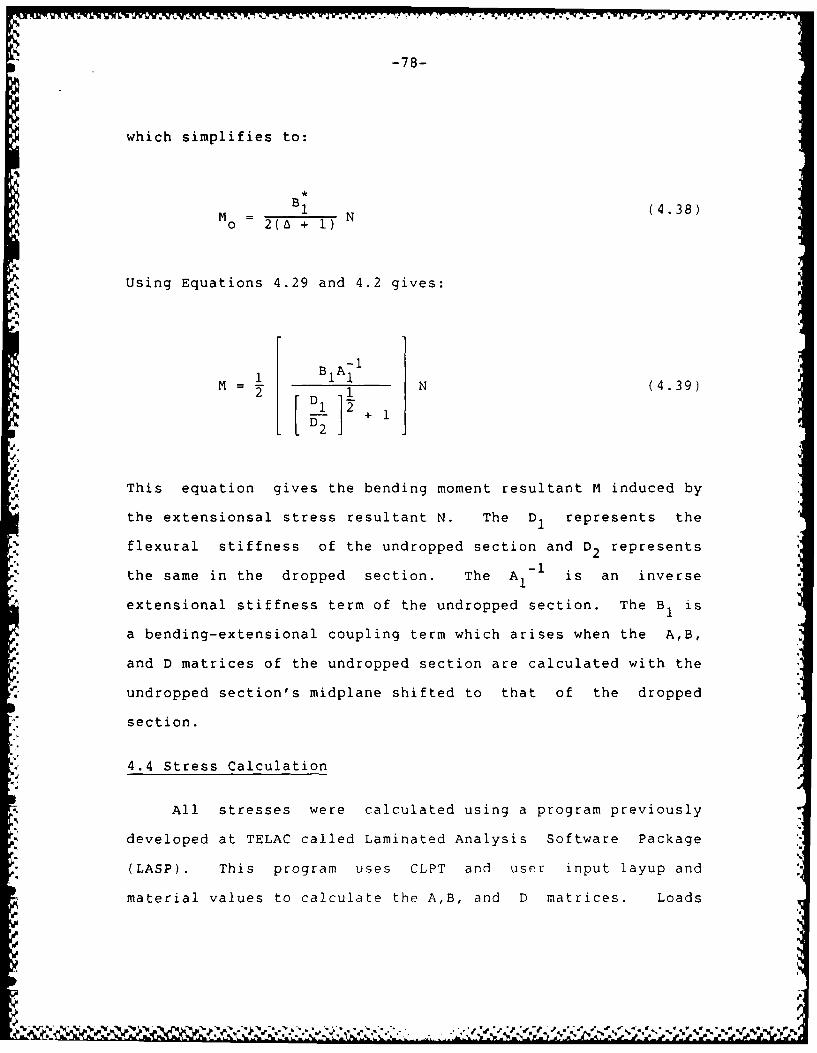
-78-
which simplifies to:iB1 N
Mo = 2(6 +) (4.38)
Using Equations 4.29 and 4.2 gives:
1 A- N (4.39)
This equation gives the bending moment resultant M induced by
the extensionsal stress resultant N. The D1 represents the
flexural stiffness of the undropped section and D2 represents-l
the same in the dropped section. The A1 is an inverse
extensional stiffness term of the undropped section. The B1 is
a bending-extensional coupling term which arises when the A,B,
and D matrices of the undropped section are calculated with the
undropped section's midplane shifted to that of the dropped
section.
4.4 Stress Calculation
All stresses were calculated using a program previously
developed at TELAC called Laminated Analysis Software Package
(LASP). This program uses CLPT and user input layup and
material values to calculate the A,B, and D matrices. Loads

-79-
are then applied by the user. In this case, two loading cases
were done for each specimen with a ply dropoff which was not
geometrically symmetric. In the first loading case, a solution
for the dropped end of the specimen is desired, neglecting any
of the effect of the ply dropoff and undropped end of the
specimen. This is the solution for the flat, control specimen
which models the dropped end of the specimen. In this case, a
unit stress in the x-direction is applied and CLPT and the
Maximum Stress Criterion (described in Section 4.5) are used to
determine the failure stress of the laminate. In the second
case, the applied loading is adjusted to include the induced
bending effect caused by the eccentric loading of the coupon.
In this case, a unit value of stress resultant N is applied to
the dropped section with the corresponding value of M. This
number is the coefficient of M in Equation 4.47. The MaximumJi
Stress Criterion is again used with LASP to determine the
failure stress of the dropped section of the specimen. In all
cases, in-plane failure would occur in this section rather than
in the undropped section since the latter is thicker than the
former and thus has more load-carrying capability.
4.5 Failure Criteria
The Maximum Stress Criterion is used to determine the
magnitude and type (shear, longitudinal or transverse tension
or compression) of ply failure. The allowable ply stresses are
[34]: 4.
]2v
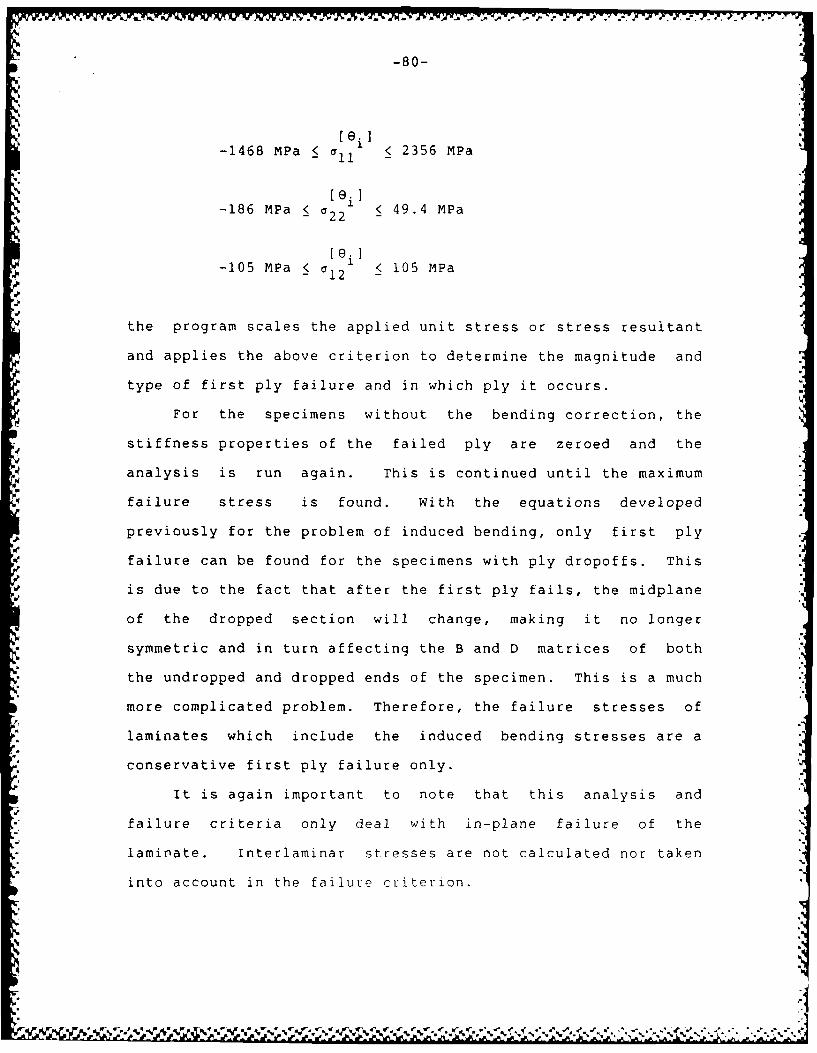
-80-
-1468 MPa < a < 2356 MPa
-186 MPa < 22 < 49.4 MPa
-105 MPa < a < 105 MPa_ 12 -
the program scales the applied unit stress or stress resultant
and applies the above criterion to determine the magnitude and
type of first ply failure and in which ply it occurs.
For the specimens without the bending correction, the
stiffness properties of the failed ply are zeroed and the
analysis is run again. This is continued until the maximum
failure stress is found. With the equations developed
previously for the problem of induced bending, only first ply
failure can be found for the specimens with ply dropoffs. This
is due to the fact that after the first ply fails, the midplane
of the dropped section will change, making it no longer
symmetric and in turn affecting the B and D matrices of both
the undropped and dropped ends of the specimen. This is a much
more complicated problem. Therefore, the failure stresses of
laminates which include the induced bending stresses are a
conservative first ply failure only.
It is again important to note that this analysis and
failure criteria only deal with in-plane failure of the
laminate. Interlaminar stresses are not calculated nor taken
into account in the failure criterion.
Ma • i4 J~ V%~ .. ( ~ **~y*~*~- ~.
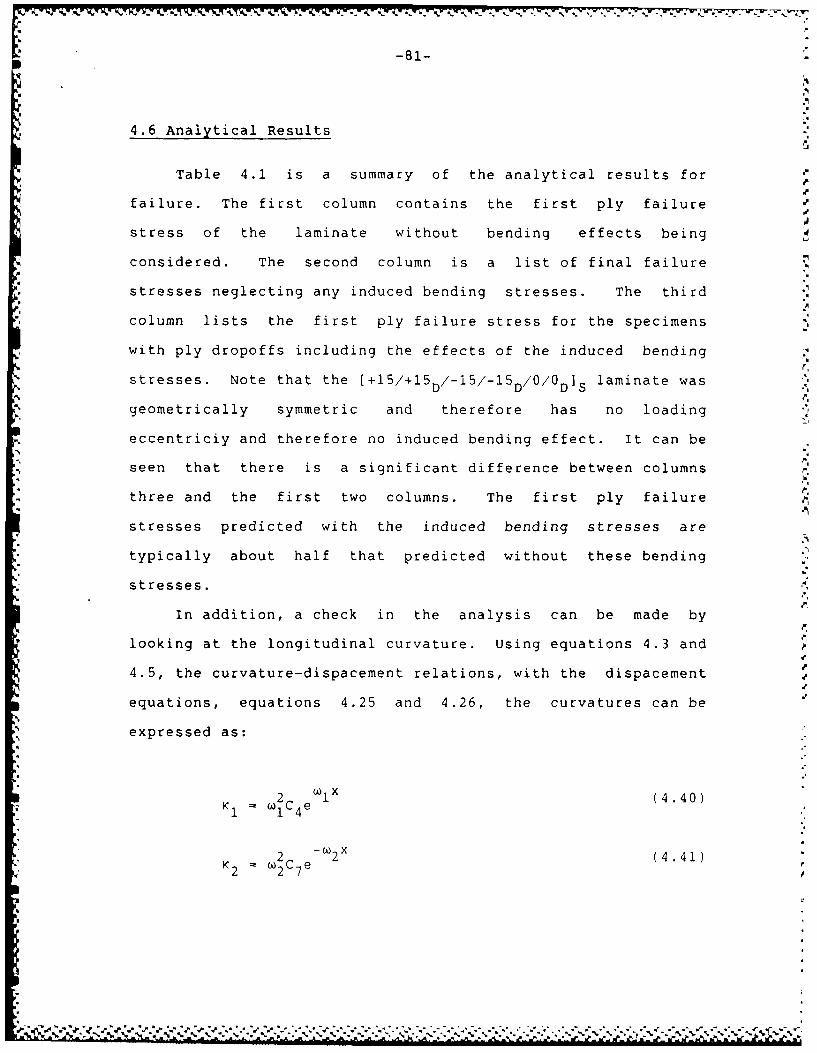
-81-
4.6 Analytical Results
Table 4.1 is a summary of the analytical results for
failure. The first column contains the first ply failure
stress of the laminate without bending effects being
considered. The second column is a list of final failure
stresses neglecting any induced bending stresses. The third
column lists the first ply failure stress for the specimens
with ply dropoffs including the effects of the induced bending
stresses. Note that the [+15/+15D/-15/-15D/0/0D]S laminate was
geometrically symmetric and therefore has no loading
eccentriciy and therefore no induced bending effect. It can be
seen that there is a significant difference between columns
three and the first two columns. The first ply failure
stresses predicted with the induced bending stresses are
typically about half that predicted without these bending
stresses.
In addition, a check in the analysis can be made by
looking at the longitudinal curvature. Using equations 4.3 and
4.5, the curvature-dispacement relations, with the dispacement
equations, equations 4.25 and 4.26, the curvatures can be
expressed as:
2 Ce Ix (4.40)
1 1 4
-LA X2 C 2 (4.41)
2 2 7

-82-
TABLE 4.1
SUMMARY OF ANALYTICAL RESULTS FOR LAMINATES WITH PLY DROPOFFS
Laminate af (MPa) BASED ON DROPPED SECTION
First Ply Final First PlyFailure Failure Failure w/
Bending
[±4 5/0D/0/-+ 4 51T 464 471 252
[±( 4 5 2)/0/0D]S 464 471 239
[+45/+45D/-45/-45D/0/0D]S 638 785 364
[±45/(±45)D/02] S 866 1178 439
(±4 5/(± 4 5 )D/0/0DIS 638 785 364
C±4 5/0/(± 4 5/0)DIS 638 785 371
Sa 2105 215a[+15/+I5D/-15/-15D/0/0D]aS 15 10
a Geometrically symmetric specimen, no bending correction
4 4l4 5
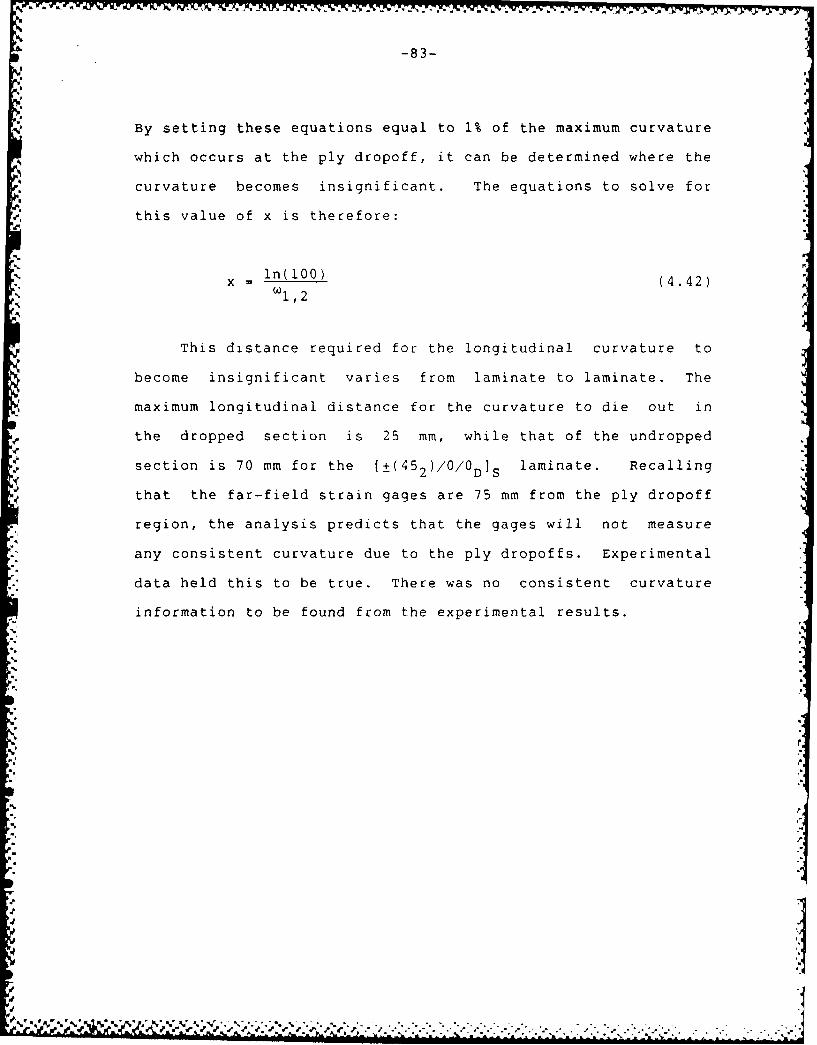
-83-
By setting these equations equal to 1% of the maximum curvature
which occurs at the ply dropoff, it can be determined where the
curvature becomes insignificant. The equations to solve for
this value of x is therefore:
x = (4.42)W1,2
This distance required for the longitudinal curvature to
become insignificant varies from laminate to laminate. The
maximum longitudinal distance for the curvature to die out in
the dropped section is 25 mm, while that of the undropped
section is 70 mm for the [±( 4 52)/0/0DIs laminate. Recalling
that the far-field strain gages are 75 mm from the ply dropoff
region, the analysis predicts that the gages will not measure
any consistent curvature due to the ply dropoffs. Experimental
data held this to be true. There was no consistent curvature
information to be found from the experimental results.
'N.
a.P
-84-
CHAPTER 5
EXPERIMENTAL RESULTSq
5.1 Stress-Strain Behavior
The far-field stress-strain behavior of the specimens
tested is discussed in this section. This data was collected
from strain gages centered on the front and back of both the
dropped and undropped sections of the coupons with ply
dropoffs, and centered on one side of the flat specimens, as
explained in Chapter 3 and illustrated in Figure 3.12. All
stress calculations were computed using load data from the
testing machine, the measured width of the specimen, and the
nominal thickness of the specimen, equal to the number of plies
times 0.134 mm as explained in Chapter 3. Trends of audible
sounds detected by ear during testing are also discussed.
These audible sounds often correspond to damage and hence
changes in the stress-strain behavior of the laminate. The
order of discussion is based on the grouping of laminates shown
in Table 3.2.
Most of the stress-strain curves can be categorized
according to a few basic types of curves. The first type is
linear, where the strain increases at a constant rate
proportional to the load. A schematic of this type of curve is
shown in Figure 5.1. A curve which has a gradual decrease in
tangent modulus is said to soften. This type of curve can be
suseen in Figure 5.2. This figure also illustrates the term
F
gW % S-..--%-L% % %- '. -y\ ' . _., .-% - - '..-. -. *5. -. 4- -.* - ,; . . .\*-., -. 5-.

-85- -.5.5
I
) A-'
5,
"I
I
Figure 5.1 Stress-Strain Plot Showing Linear-to-Failure ,,Behavior "
5'

-~~-Xy F-- - -- - -. 7 -. .7. P -... . . . . . . . . . .
-86-
- - -BREAK STRESS
C5
Figue 5. Strss-trai Plo Sho inga Reuctin'i
Tangnt mdulu ("Sftenng"

-87-
the term break stress, which is the point where a linear curve
becomes nonlinear, such as in the softening type of curve
[311. A curve which has a gradual increase in tangent modulus
is said to stiffen. This curve is illustrated in Figure 5.3.
A discontinuity is a term to describe any irregularity from a
smooth curve. There are several common types of
discontinuities. A strain discontinuity occurs where strain
increases at a constant load, as shown in Figure 5.4. A
reversal point, illustrated in Figure 5.5, is a point where
both load and strain decrease. A load drop, illustrated in
Figure 5.6, occurs where the load decreases at either a
constant or increasing level of strain (given that the tests
were perfoLaed in stroke control).
Values for the longitudinal modulus of a specimen are
determined using a program called LIN6 [33]. This is a program
developed within TELAC which takes the load and strain data and
outputs the linear regions of the curve, their slopes, and
correlation coefficients. The longitudianl modulus was taken
as the slope of the initial linear portion of the stress-strain
curve.
Gage numbering was standardized for the coupons with ply
dropoffs. Gage numbers three and five were on the flat side of
the specimen, with three being centered on the undropped end of
the specimen and five on the dropped end. Gages two and four
were on the other side, or tapered side of the laminate, with
two being centered on the undropped end of the specimen and
four on the dropped end. Note that there was no gage numbered
ft1
9* 2 2 .. .,f '. t " " "
,: "2 - .: ' ./ " - .- '" ' , -"."." ' ' " "."." ' " .' .
' -"-". ." "
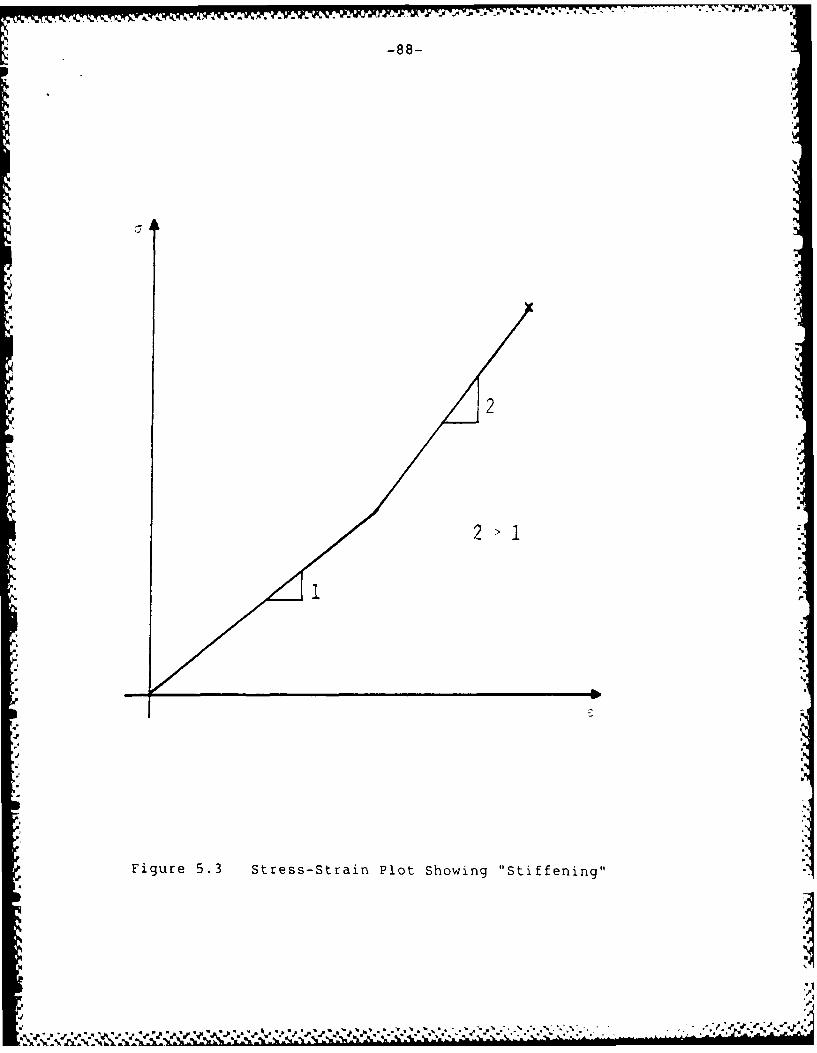
N777ftw:iw
-88-
2>1I
Figure 5.3 Stress-Strain Plot Showing "Stiffening"

-89-
'aq
S ;'a
',.
4.
"
4.q
. . . . I i i ' - " i - i '
I : : ..... . . . . . . . . . -'
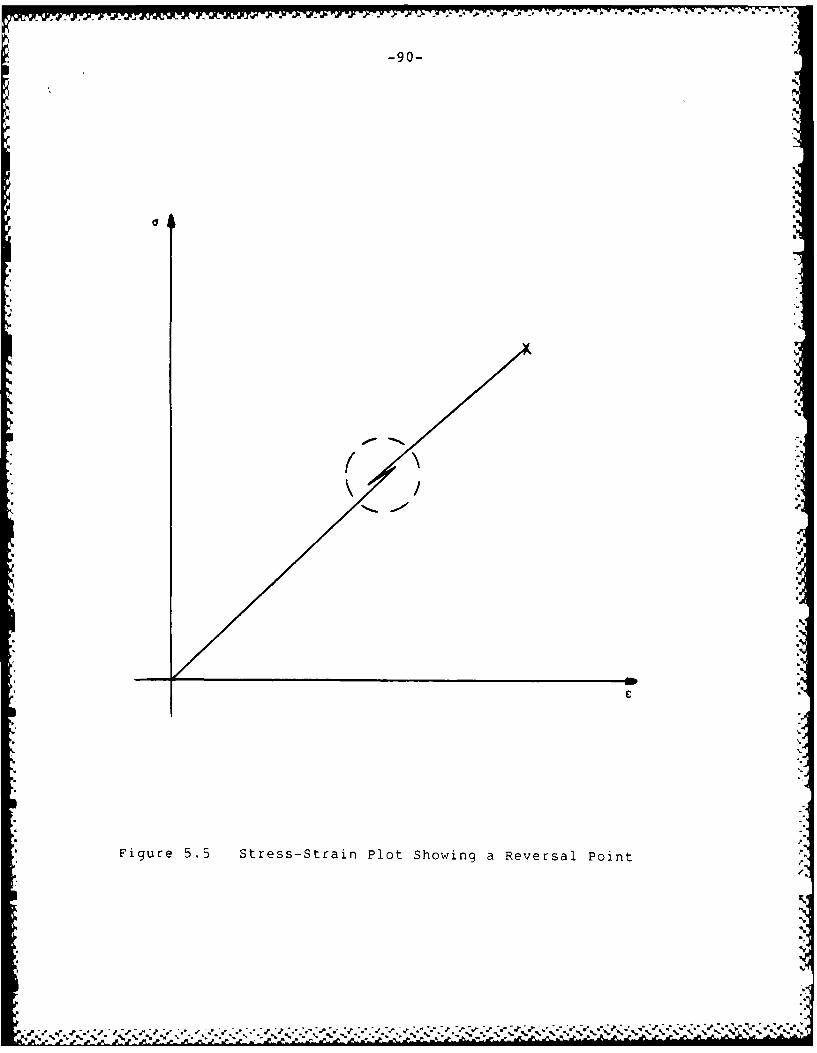
-90-
ac
Figue 55 StessStran Pot Sowig a evesal oin
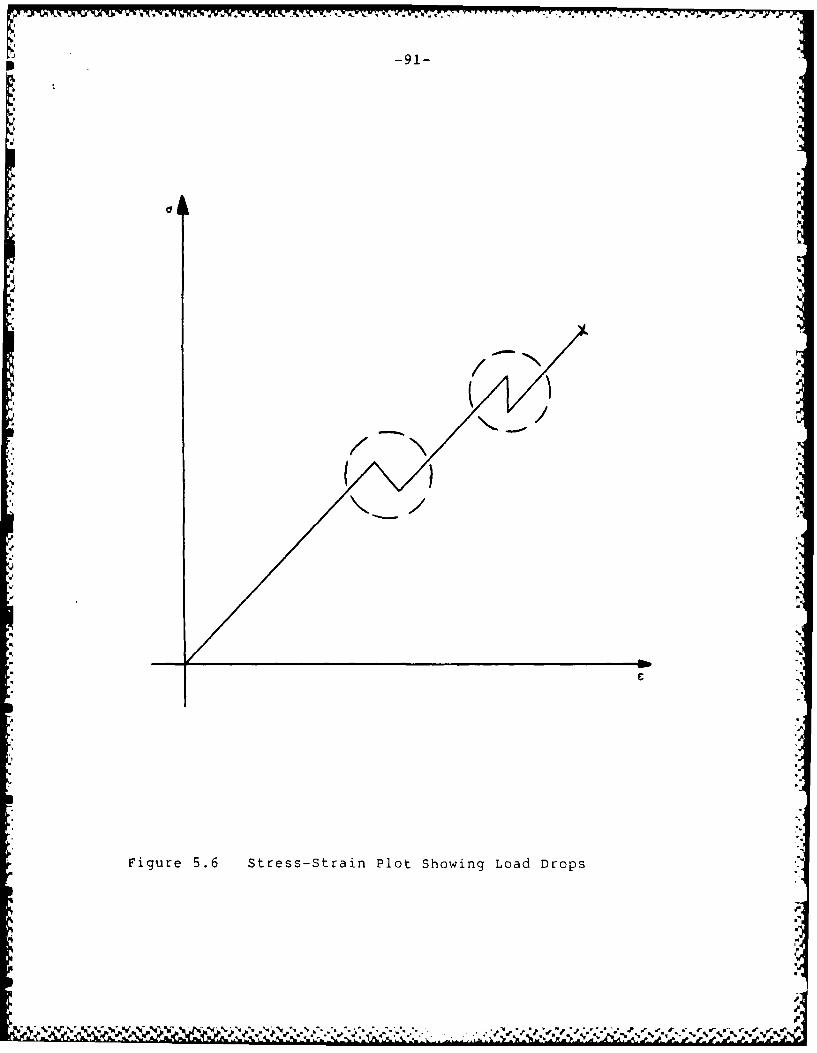
2 -91-
p%
I 1I
N'j
Figue 56 Sres -Strin lotShoing oadDros (
/q
.5'.

-92-
one.
Longitudinal moduli for the flat specimens are listed in
Table 5.1. Data for individual specimens are listed in the
Data Tables. Longitudinal moduli predicted for the flat
specimen using classical laminated plate theory are given in
the third column. The data agrees well with the predicted
values. The second column contains the coefficient of
variation for each laminate, with the average coefficient of
variation for all the flat specimens being about 5%.
Table 5.2 contains longitudinal moduli for the ply dropoff
laminates. Each column of this table corresponds to a single
gage position. The first two columns contain modulus data for
the undropped end of the specimen, column one being the data
for the tapered side of the specimen, or gage two, and column
two being the flat side of the specimen, or gage four. The
last two columns contain modulus data for the dropped end of
the laminate. The data from strain gage three, the tapered
side of the laminate, is in column three, while the data from
gage five, the flat side of the dropped section, is in column
four. The stress used in this calculation is based on the area
for that particular part of the specimen. The average
coefficient of variation for the ply dropoff laminates was also
about 5%.
Table 5.3 is a comparison of longitudinal moduli for ply
dropoff laminates and the corresponding flat laminates. The
first column of this table is the average moduli for the
undrupped section of the laminate and is the average of the
-WL

-93-
TABLE 5.1 A
LONGITUDINAL MODULI FOR FLAT SPECIMENS -
EL [GPa] Coefficient Predictedof variation [GPa] .5
"[±45/0S 58.4 5.9% 61.0
(±4 5/0/-+ 4 5]T 45.2 3.5% 44.9
[±(452)/02]S 60.4 0.8% 61.0
[±(452)/01s 46.0 1.7% 44.9
[(± 4 5 )2/02]s 60.6 7.4% 61.0
[±45/02] S 83.7 5.0% 80.9
.5,.
[±45/012S 62.9 0.9% 61.0
[±(152)/02)S 123.6 2.1% 125.7
[±15/01S 122.2 1.5% 125.7
S|
;5
,.)
-, ' - .-.. . ... ,. . .-.-.-. ........ .,..-.-.-.'...... .-. . .... '

-94-
TABLE 5.2
LONGITUDINAL MODULI FOR DROPPED AND UNDROPPED SECTIONS, FLATAND TAPERED SIDES OF PLY DROPOFF LAMINATES
LONGITUDINAL MODULUS [GPa]
UNDROPPED SECTION DROPPED SECTION
.-
Laminate Tapered Flat Tapered FlatSide Side Side Side
[± 4 5/0D/0/-+ 4 5]T 57.8 60.4 42.6 42.6
( 4 . 5 %)a (4.8%) (6.7%) (4.5%)
OI[±(452)/0/0D]S 60.3 58.9 42.5 41.2[ ) O(6.2%) (3.4%) (3.0%) (14.4%)
.( [+4 5/+ 4 5D/-45/-45D/O/ODS 58.6 59.4 57.5 56.9(9.6%) (7.2%) (5.4%) (5.8%)
[± 4 5/(± 4 5 )D/02]S 59.9 60.5 83.2 80.6(6.8%) (3.9%) (2.2%) (3.1%)
[±4 5/(± 4 5 )D/0/0D]S 59.5 60.1 56.3 59.6(6.5%) (6.1%) (6.4%) (3.2%)
[±4 5/0/(± 4 5/0)D]S 61.0 63.0 59.1 59.3(1.3%) (4.1%) (2.5%) (1.7%)
[+15/+15D/-15/-15D/0/0DSb 124.7 125.2 126.3 128.0D (2.0%) (2.2%) (1.5%) (1.3%)
b Numbers in parentheses are coefficients of variationGeometrically symmetric specimen, no flat or tapered side
S"
S.
S.
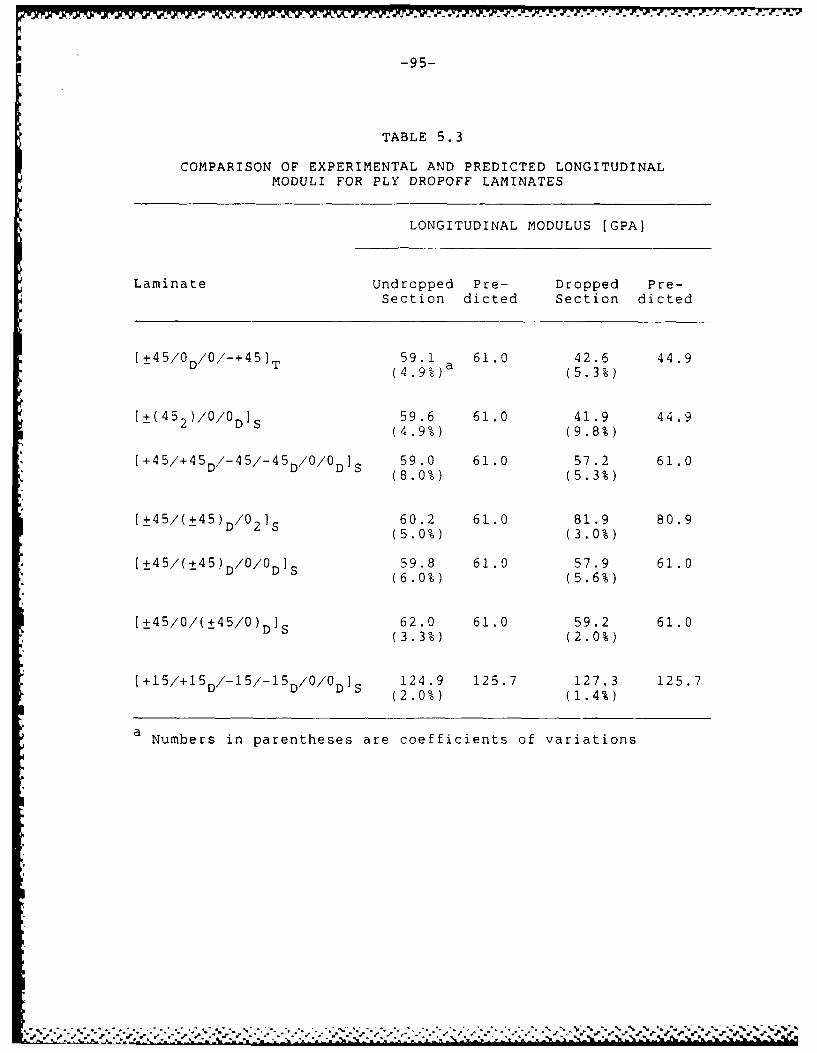
-95-
TABLE 5.3
COMPARISON OF EXPERIMENTAL AND PREDICTED LONGITUDINALMODULI FOR PLY DROPOFF LAMINATES
LONGITUDINAL MODULUS [GPA]
Laminate Undropped Pre- Dropped Pre-Section dicted Section dicted
[t45/0D/0/-+45] T 59.1 a 61.0 42.6 44.9(4. 9 %) 5.3%
[t(452)/0/0D]S 59.6 61.0 41.9 44.9(4.9%) (9.8%)
[+45/+45D/-45/-45D/0/0D] S 59.0 61.0 57.2 61.0(8.0%) (5.3%)
[±4 5/(± 4 5 )D/021 S 60.2 61.0 81.9 80.9(5.0%) (3.0%)
[±45/(±45) D/0/0 D]S 59.8 61.0 57.9 61.0(6.0%) (5.6%)
[±45/0/(±45/0)D]S 62.0 61.0 59.2 61.0(3.3%) (2.0%)
[+15/+15D /-15/-15D/0/0D S 124.9 125.7 127.3 125.7(2.0%) (1.4%)
a Numbers in parentheses are coefficients of variations
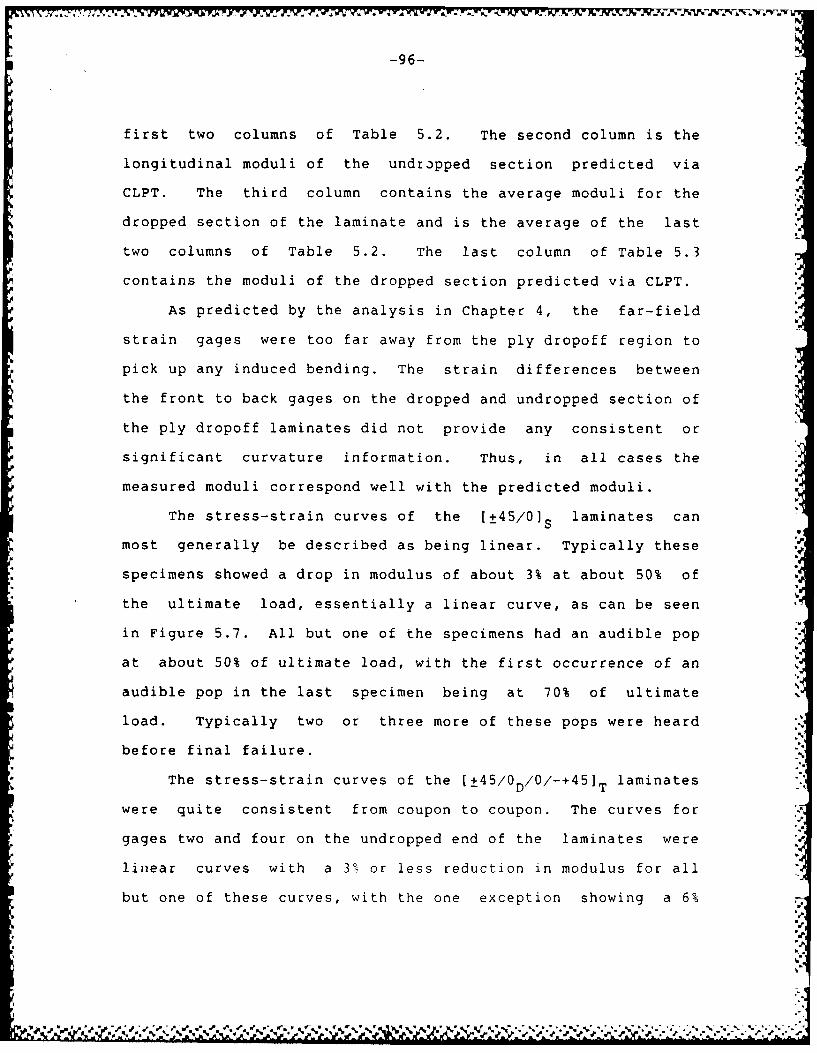
- TF IL -- ~. .
-96-
first two columns of Table 5.2. The second column is the
longitudinal moduli of the undropped section predicted via
CLPT. The third column contains the average moduli for the
dropped section of the laminate and is the average of the last
two columns of Table 5.2. The last column of Table 5.3
contains the moduli of the dropped section predicted via CLPT.
As predicted by the analysis in Chapter 4, the far-field
strain gages were too far away from the ply dropoff region to
pick up any induced bending. The strain differences between
the front to back gages on the dropped and undropped section of
the ply dropoff laminates did not provide any consistent or
significant curvature information. Thus, in all cases the
measured moduli correspond well with the predicted moduli.
The stress-strain curves of the [t4 5/0]s laminates can
most generally be described as being linear. Typically these
specimens showed a drop in modulus of about 3% at about 50% of
the ultimate load, essentially a linear curve, as can be seen
in Figure 5.7. All but one of the specimens had an audible pop
at about 50% of ultimate load, with the first occurrence of an
audible pop in the last specimen being at 70% of ultimate
load. Typically two or three more of these pops were heard
before final failure.
The stress-strain curves of the (±45/0D/0/-+45 T laminatesD TT
were quite consistent from coupon to coupon. The curves for
gages two and four on the undropped end of the laminates were
linear curves with a 3B or less reduction in modulus for all
but one of these curves, with the one exception showing a 6%
i• .
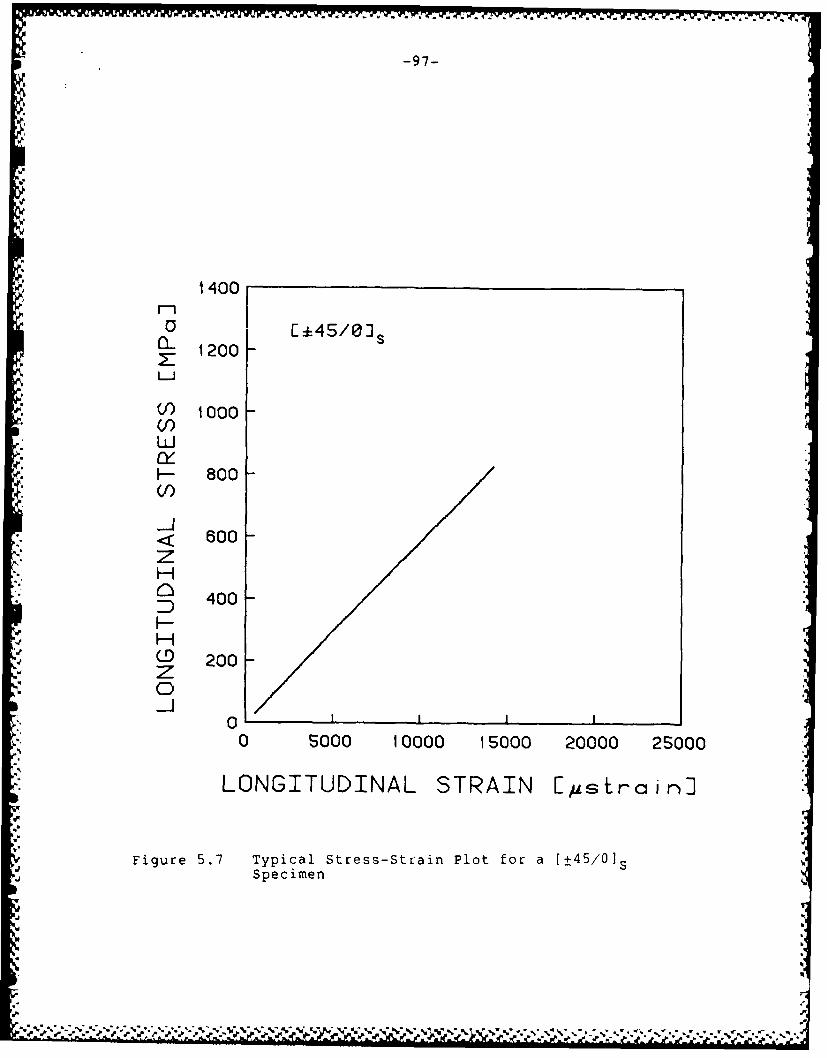
-97-
1400
E:45/030-_ 1200
"0 1000(/)LIJ0 800 -
LU
_J
< 600zH
D 400 .F-H
C!) 200z0
00 5000 10000 15000 20000 25000
LONGITUDINAL STRAIN [sirain]
Figure 5.7 Typical Stress-Strain Plot for a (t45/0 1-Specimen
a
; a- '-a ;? a-7. P-;a- , ., . a-kk- - ,-a--'. .-, % .-. '?. ,. .-- ,v,:... ;.

I.
-98-
reduction in modulus. The stress-strain curves from gages
three and five on the dropped end of the laminate showed
significant softening, typically beginning at about 15% of
ultimate load with about a 10% reduction in modulus and
decreasing to about 80% of the original modulus value near 60%
of ultimate. This can be seen in Figure 5.8. These specimens d.
were fairly quiet during testing, with half not emitting any
significant audible sounds, and half emitting loud pops only
after 95% of ultimate load was reached.
The [-45/0/-+45] T laminates all had a softening type of
stress-strain curve. This softening is expected since the
majority of plies are +45° which exhibit softening behavior
[35]. While the amount of softening varied between the
coupons, each showed a modulus of at least 20% less upon
failure than the inital linear region, with the average break
stress occurring at about 25% of ultimate load. The tangent
modulus of one of the specimens became horizontal, or zero,
before failure. These laminates were also quiet during
testing, with three of the five tested emitting one loud pop
each at about 65% of ultimate load, and the other two emitting
no significant sounds before failure. A typical curve is shown
in Figure 5.9.
The basic laminate of the second group is the [±( 4 52)/02]s
layup. All but one of these laminates exhibited a slightly
softening stress-strAin curve, an example of which can be seen
in Figure 5.10. The tangent modulus typically decreases in
these specimens by about 5< after about 50% of ultimate load.
I
.~.
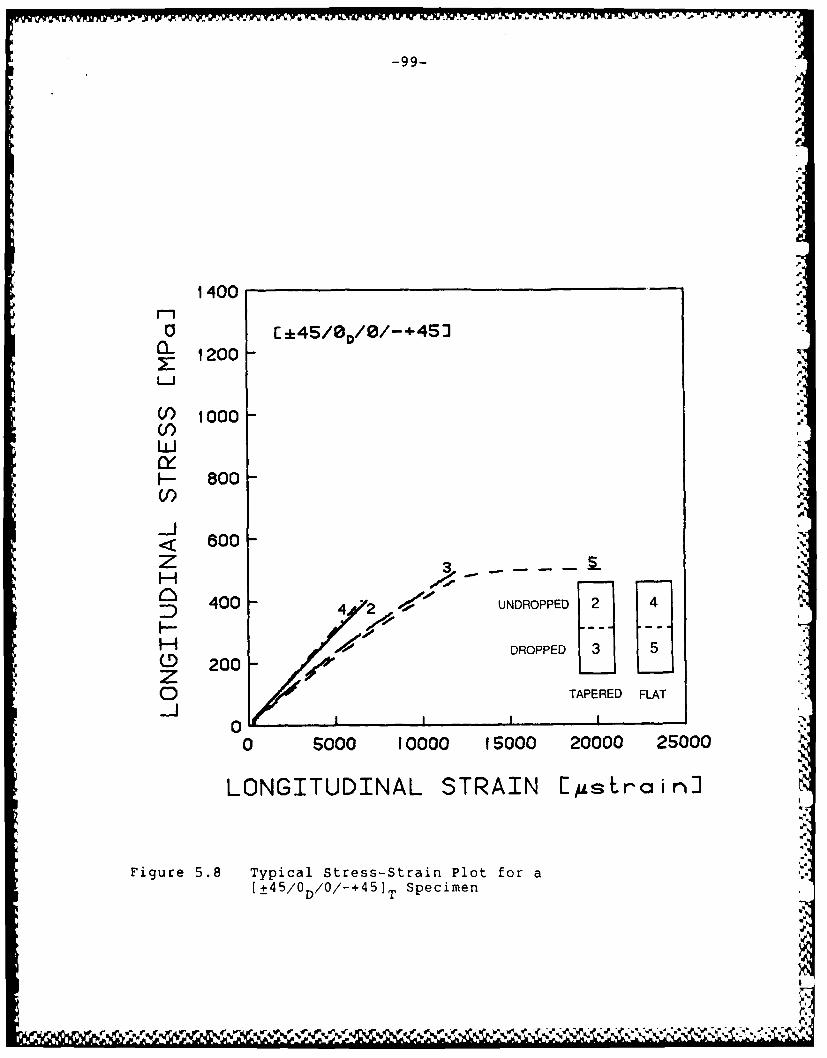
-99-
Pp
,P
1400
0 E .*45/0D/ 0 /-+ 4 5 3C_ 1200 -
V) 1000(I)LUJ
I-- 800
.. A.< 600
400 -4 '2 UNDROPPED 2 4
H -- --
4
HP' DROPPED
CD 200zo TAPERED FLAT-j
00 5000 10000 15000 20000 25000
LONGITUDINAL STRAIN [gstrain]
Figure 5.8 Typical Stress-Strain Plot for a[±4 5/0D/O/-+ 4 5J T Specimen
,p

-100-
1400
0 45/0/- 453
1200
1000
4O0
DK
7( 800
-00J
0 400H-HCD) 200z0
00 5000 10000 15000 20000 25000
LONGITUDINAL STRAIN [#str ain]
Figure 5.9 Typical Stress-Strain Plot for a
[+45/0/-+45] T Specimen
" 1JW " " ' S • " • " " "" ' ' . . . ."*• "** -**''" ' ,, '"' ' ',° , 'U ' = *"' , " ,' - -

-101- Ip
X
1400
o.(45 )/0 3$1200
- :800
<600zO.o-
D 400
H
0 200 0z0-j
0 6000 10000 16000 20000 25000
LONGITUDINAL STRAIN Estra in-
Figure 5.10 Typical Stress-Strain Plot for a[±(452)/02]S Specimen
7/

-102-
The stress-strain response of this laminate should be very
similar to that of the [±4 5/01 laminate, as it is, since
effective ply thickness is not important in stress-strain
response. Each of these coupons gave off several loud pops
during testing, beginning at about 35% and continuing until
about 85% of ultimate load, at about 10% intervals.
The [±( 4 52)/0/0D]S specimens exhibited linear
stress-strain behavior for the most part. Two of the coupons
were linear all the way through to failure while three coupons
were basically linear, but showed some anomalies along the
way. These normally occurred from about 85% of ultimate toS.
failure, with the undropped end of the laminate softening S
sligthly, and the dropped end having very small irregularities
of both stiffening and softening. An example of this type of
curve is shown in Figure 5.11. These lamiiiates were also quite
noisy, with loud pops typically beginning at about 50% of
ultimate load, and about four such pops occurring until 90% to
95% of ultimate load is reached.
The (+45/+45D/-45/-45D/0/0DIs laminates behaved similarly
to the above laminates, but with less variation from linear
behavior in the sections that did soften. The stress-strain
curves were basically linear, with some slight softening in the .
dropped section of the laminate. Break stresses are typically
in the 50% of ultimate range with softening of about 7%. A
stress-strain curve of this type can be seen in Figure 5.12.
Loud pops were heard from all specimens between 50% and 60% of
ultimate load. One other pop was heard in three of the 7
'e-AN .Affiwww.
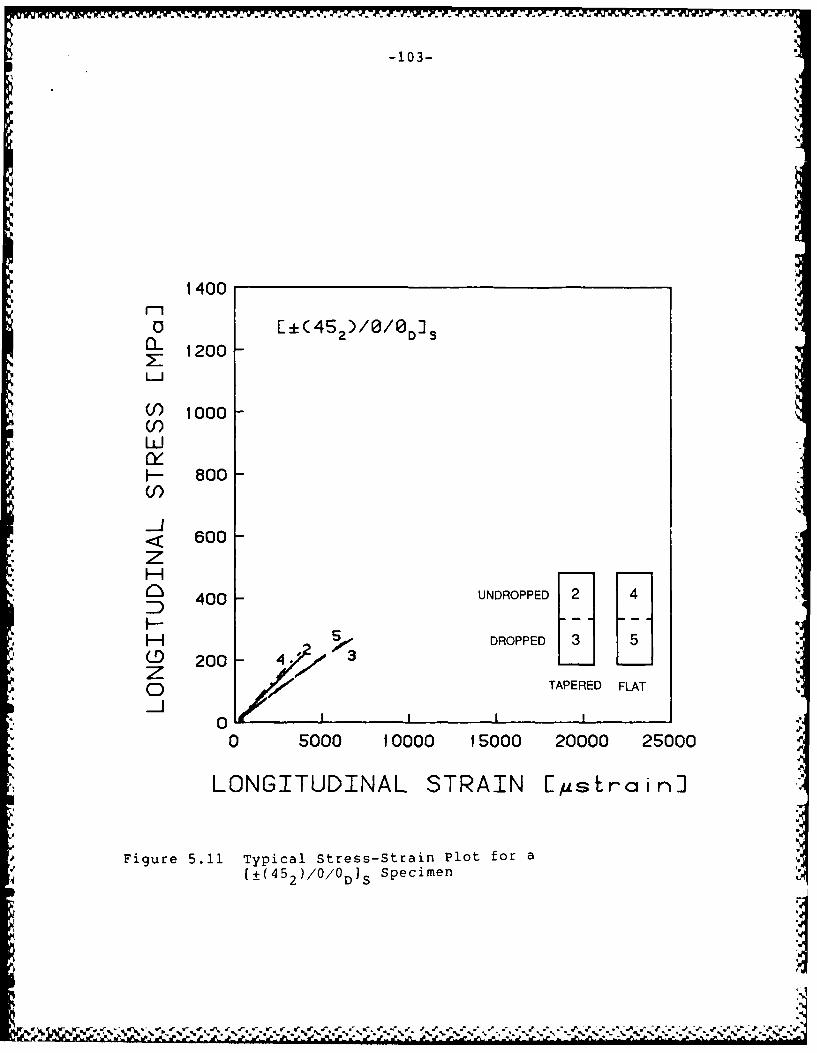
-103-
1400M
O E+(452)/0/0D JCL 1200 D
i
(1) 1000(F)
-- 800VJ)
600 ,z
UNDROPPEDD400
H DROPPED 3'C!) 200 - 3
TAPERED FLAT
0 5000 10000 15000 20000 25000
LONGITUDINAL STRAIN [gstrain]
Figure 5.11 Typical Stress-Strain Plot for a(±(45 2)/O/ODIs Specimen

s..- * -- 1 o 4 - - - -
-104-
'" '4
1400
C +4 5/+ 4 5D/- 4 S/-45D/S/ 0 OD sC- 1200 -
<,0 1000 -:U)
L I .
F- 800
< 600 - /.-z
400 UNDROPPED 22) 400
H 20 DROPPED 13A
z ,0 TAPERED FLAT__10
0 I I I
0 5000 10000 15000 20000 25000 .
LONGITUDINAL STRAIN [#strain]
Figure 5.12 Typical Stress-Strain Plot for a ',
[+45/+45 /-45/-D0 0 DS Specimen
D/ D/- D .
, - ..: ,.-,' .,, ", -.. ,'v , -- ,. , ",,..,. ,,.",.",",, ,,- , - -, -, . '. - -,. -, 'w ..- ,-. -. . -. '....',-. -. .. :,,

-- | . p J. -- |- -
-105-
specimens between 80% and 90% of ultimate.
The other flat laminate in the second group is the
(±(452)/0]S laminate. These laminates all had a softening type
of stress-strain curve, with a break stress of roughly 30% of
ultimate load. Maximum softening in these coupons was
typically in the 20% range of the initial linear portion of the
curve. A typical curve is shown in Figure 5.13. Several loud
pops were commonly heard during the testing of these laminates,
with the first one being heard between 50% and 75% of ultimate
load.
Three of the [(±45)2/02] s specimens had a slight softening
in the stress-strain curve with modulus values decreasing inI.
the 3% to 5% range. One of these also had a strain
discontinuity at about 40% of its ultimate load. Break
stresses were about 50% of ultimate. The other two coupons
showed more significant softening, beginning with reductions of
3% and 6% at about 40% of ultimate and running to about 10%.
Loud pops were heard beginning at 40% to 50% of ultimate load.
A typical curve is shown in Figure 5.14. These curves should
be, and are, similar to those of the 1±45/0] s and [±( 4 52)/02Js
laminates.
The [±4 5/(± 4 5)D/02 1s laminates were mostly linear in their
stress-strain response through to failure both in the undropped
and dropped sections. One of the coupons exhibited slight
softening in the undropped section of the laminate. This curve .'
is shown in Figure 5.15. Audible pops were heard from each of
these coupons at about 33% of ultimate load.
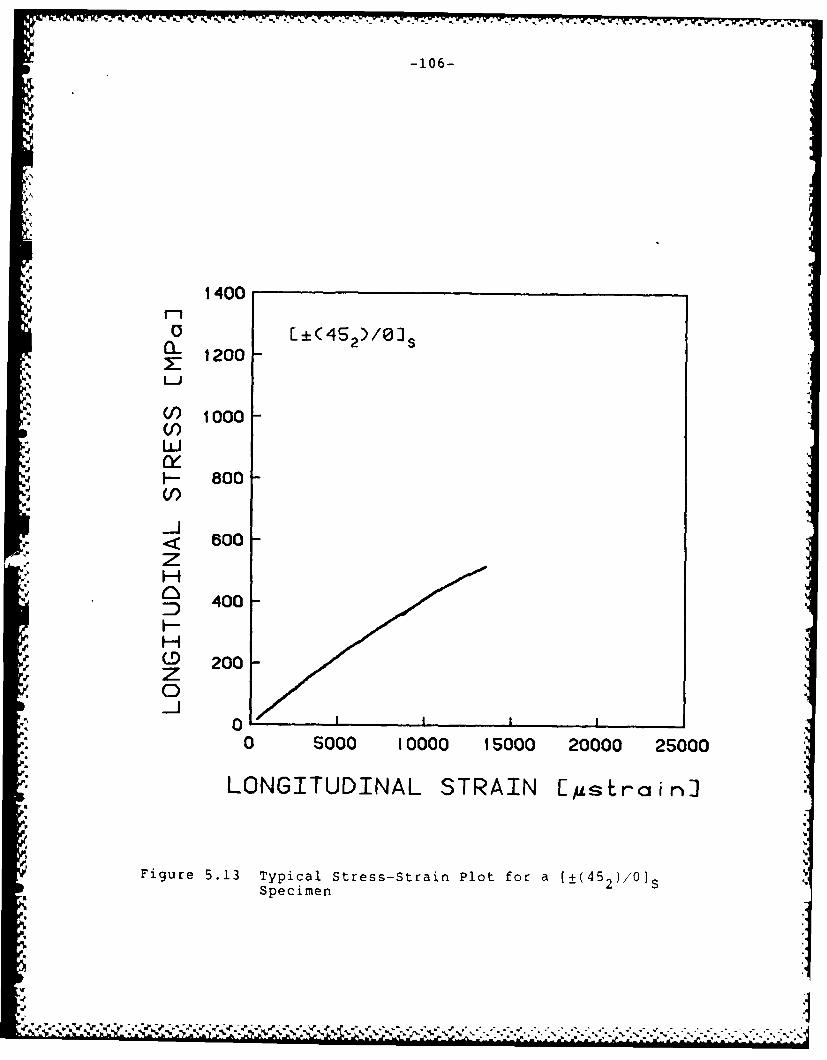
-106-
.',
1400
ai L±(452)/0Js
1200
1) 1000* CV)
LUJ
I- 800%U)
< 800zHn 400
( 200
0D __
00 5000 10000 15000 20000 25000
*m" LONGITUDINAL STRAIN [gstrain]
Figure 5.13 Typical Stress-Strain Plot for a (±(452)/01SSpecimen
-91
,/'.''''- 'W c 'W '" .' ., ',e --' -' .''''"'" # -.w " " " " .. ." ." ." ." " " " " ...." " " ... .. .. ... .9. . i -I I-'| "

.. '
-107-
5%
A
1400
0 E (±45) 2/02S
1200
(1) 1000
LUry-- 800V)
< 600zH
:D 400H-H
CD 200
0_J
00 5000 10000 15000 20000 25000
LONGITUDINAL STRAIN [strain]
Figure 5.14 Typical Stress-Strain Plot for a[(±4 5 )2/02]S Specimen
t5'
. .2zz2 q : .%. ~ l,.e, 2,, . , . .:...:.2 = . ,.... .'. ..'........ "," ,.," -'.* , ,.,/.-

-108-
1400
a LL45/C+4S)D0 2 S
1200 2
12oo/1
F- 1000 -0iLU //
800 2/4
Rflf/// .
'~ 40 /UNDROPPED 271400 -// "
H DROPPEDCD 200 - J
Z 2 TAPERED FLAT0
0 I iii,-
0 5000 10000 15000 20000 25000
LONGITUDINAL STRAIN [Astrain]
Figure 5.15 Typical Stress-Strain Plot for a[±4 5/(±4 5 )D/02]S Specimen
,' ". " , ." , . .. , " . ."-. . .j . . p - - . .- - . .. . - -",

-109-
The undropped ends of the [±4 5/(±4 5 )D/0/0s specimens
were all essentially linear with respect to stress-strain
behavior. The dropped sections of the coupons were not quite
as consistent. On the average, these curves could also best be
described as linear, although some of the curves either
stiffened slightly or softened slightly, with no real pattern,'.
emerging between the flat and tapered sides of the dropped
section of the specimen. Most of these changes in the dropped
ends of the specimens were in the 5% to 7% range which is
within data scatter. Loud pops were heard at about 50% of
ultimate load for all but one specimen, where a loud pop
occurred at about 80% of the ultimate load. A typical
stress-strain curve is shown in Figure 5.16.
The stress-strain curves of the [t4 5/0 21S specimens were
mostly linear, with three of the five curves having no more
than 3% softening. Three to four loud pops were typically
heard between 80% and 90% of ultimate load.
The basic laminate in the fourth group is the [±4 5/0 12S
laminate. A typical stress-strain curve is shown in Figure
5.17. The curves of this laminate show softening of a maximum
of about 10% with a break stress in the 40% range of ultimate
load. One of the curves had a load drop at about 75% of
ultimate, as can be seen in Figure 5.18. Initial loud pops
were heard at about 40% of ultimate, with another one or two
pops typically in the 80% to 90% load of ultimate load. These
curves are similar to those of the .45/01 and [±( 4 52)/02]s
laminates, as expected.
,A%, -%
C. % '~ ./'C.C/\~ C.--

-110-
1400
M 0 1:45/(*45D/ 0 3
CL 1200z
()1000
LI Bo oo - "
I-- 800-/3
• 600 -Z/"
TAERDF7] >400 - 2/H
CD 200 1000 0 Izo TAPERED FLAT
00 5000 10000 15000 20000 25000
LONGITUDINAL STRAIN [Astrain]
Figure 5.16 Typical Stress-Strain Plot for a[±4 5/(± 4 5 )D/0/0D]S Specimen

S" -
1400
o E*4S-/03 21200
,
z
)1000
Ld
~- 800 ",%
< 600 :
z400
Q. 200z0
_j0 II
0 S000 10000 15000 20000 25000
LONGITUDINAL STRAIN [#srain3:
.
Figure 5.17 Typical Stress-Strain Plot for a [±45/012SSpecimen
5..) . -.l!-I A ~ ~ A ~ A -A

-112-
1400
O 1*45/0321 1200 4
(/ 1000 '(I)W 800-
Boo - d:_j< 600z
400
H
(D 200z 5
0_j,
0 6000 1 0000 I000 20000 25000
LONGITUDINAL STRAIN E[sAz.ra in3
Figure 5.18 Stress-Strain Plot for a [±4 5/012S With aLoad Drop
- - A - - -- 5- -- , 1 d *5.5 S.- . . * * . *' .. . .* * '~* - -

-113-
The [+45/0/(±45/0)DIs laminates had varying types of
stress-strain curves. One laminate was entirely linear in its
stiffness response. One coupon was linear except for the flat
side of the dropped end of the specimen, where it softened by
about 25% at about 25% of its ultimate load. The dropped end
of the other two specimens initially softened and then
stiffened, while the undropped ends of the specimens softened.
This can be seen in Figure 5.19. Initial loud pops were
typically heard in the 60% range of ultimate load.
The basic laminate of the last group is the [±(152)/02]S
laminate. These laminates all exhibited stiffening
stress-strain curves, with stiffness increasing in the range of
1% to 8%, as can be seen in Figure 5.20. Two of these
specimens softened at about 90% of ultimate load. Break
stresses are about 60% of ultimate. Initial loud pops were
heard at 50% of ultimate for three of the coupons, and 65% and
75% for the other two. Between one and three more pops were
heard up to the 90% range of ultimate.
The next specimen in this group is the only geometrically
symmetric secimen. The [+15/+15D/-15/-15D/0/0D]S laminates
were linear in their stress-strain response for all the coupons
in the undropped end of the specimen and for one coupon in the
dropped end. The other three coupons stiffened in their
stress-strain curves, 1% to 5% in one coupon with a break
stress of about 80%, 12% in a small section of the curve at
about 90% of ultimate load in another coupon, and 3% to 4% in a
third. Initial loud pops were heard at 30% to 40% of ultimate

-114-
1400
0 E±45/0/(±45/0) D10- 1200 D s
LJ
(/ 1000 -U)Ld
800 3- 3V)
. 600
zH 00 UNDROPPED HI- DROPPED
HC) 200 TAPEREDz
._j0 " I
0 5000 10000 15000 20000 25000
LONGITUDINAL STRAIN [strain]
Figure 5.19 Typical Stress-Strain Plot for a[t4 5/0/(± 4 5/0)D]S Specimen
~ :-
N O.: - - '1 i " i 3 q I -•
1
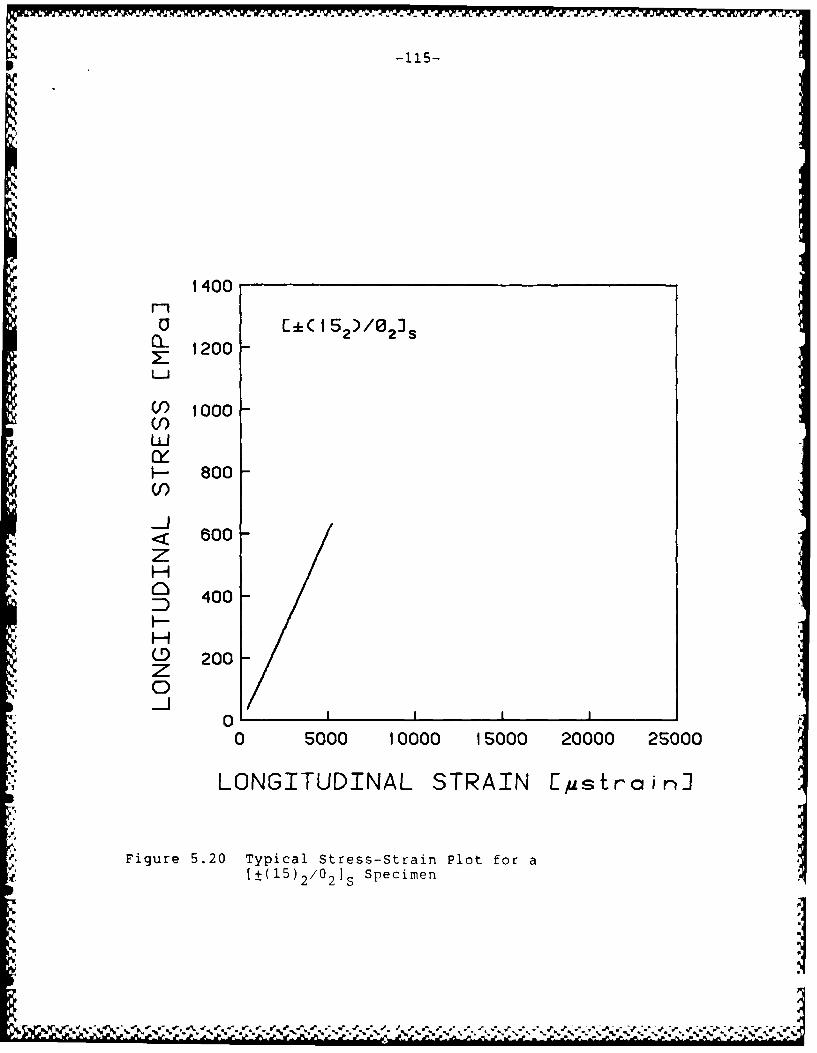
-115-
1400
a LkCi(5 2)/0 2JCl- 1200 -
LI
1 1000V)LUJ
- 800VO
< 600zHD 400
C) 200z0_J
0 5000 10000 15000 20000 25000
LONGITUDINAL STRAIN [Mstra in]
Figure 5.20 Typical Stress-Strain Plot for a[±(15) 2/02 ]S Specimen
%l % %
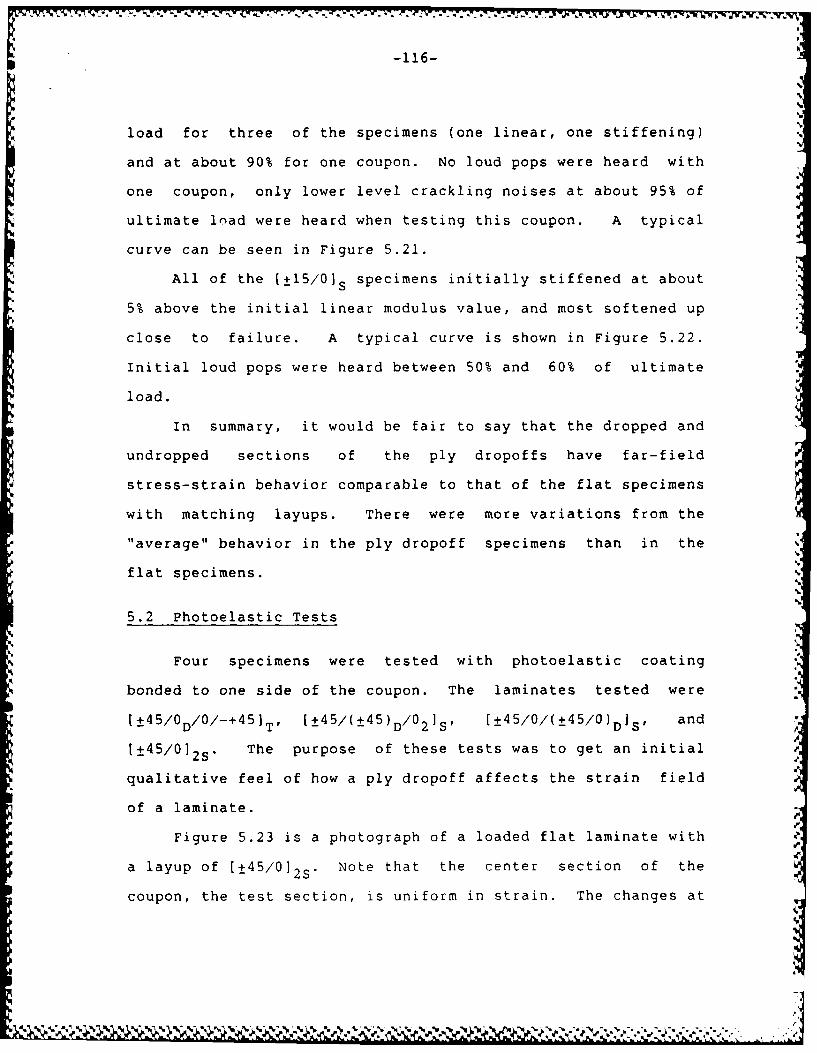
-116-
load for three of the specimens (one linear, one stiffening)
and at about 90% for one coupon. No loud pops were heard with
one coupon, only lower level crackling noises at about 95% of
ultimate load were heard when testing this coupon. A typical
curve can be seen in Figure 5.21.
All of the [±15/0]s specimens initially stiffened at about
5% above the initial linear modulus value, and most softened up
close to failure. A typical curve is shown in Figure 5.22.
Initial loud pops were heard between 50% and 60% of ultimate
load.
In summary, it would be fair to say that the dropped and
undropped sections of the ply dropoffs have far-field
stress-strain behavior comparable to that of the flat specimens
with matching layups. There were more variations from the
"average" behavior in the ply dropoff specimens than in the
flat specimens.
5.2 Photoelastic Tests
Four specimens were tested with photoelastic coating
bonded to one side of the coupon. The laminates tested were
[±4 5/0D/0/-+ 45]T , [±4 5/(± 4 5 )D/02]S# (±4 5/0/(± 4 5/0)DIs, and
[±45/01 2s. The purpose of these tests was to get an initial
qualitative feel of how a ply dropoff affects the strain field
of a laminate.
Figure 5.23 is a photograph of a loaded flat laminate with
a layup of [±45/012S. Note that the center section of the
coupon, the test section, is uniform in strain. The changes at

-117-
1400M
-- 1200 -D
L_j
V) 1000 -
F- 800 -/C,)
-J 00zH f t
3 400 4,' UNDROPPED 11
- DROPPED 30. 200 L; z i
0 TAPERED FLAT_J
0 5000 10000 15000 20000 25000
LONGITUDINAL STRAIN [Astrain]
Figure 5.21 Typical Stress-Strain Plot for a[+15/+15D/-15/ 15D/O/OD]S Specimen
%XL ,

~-118-
D
14004.' 0O " 1 5/e)l
1200L--
1) 1000 -
800
(I)
< 600 "zn 400
HQ 200z0
O I I
0 5000 10000 15000 20000 25000
LONGITUDINAL STRAIN EAsErain3
Figure 5.22 Typical Stress-Strain Plot for a [±15/0] S
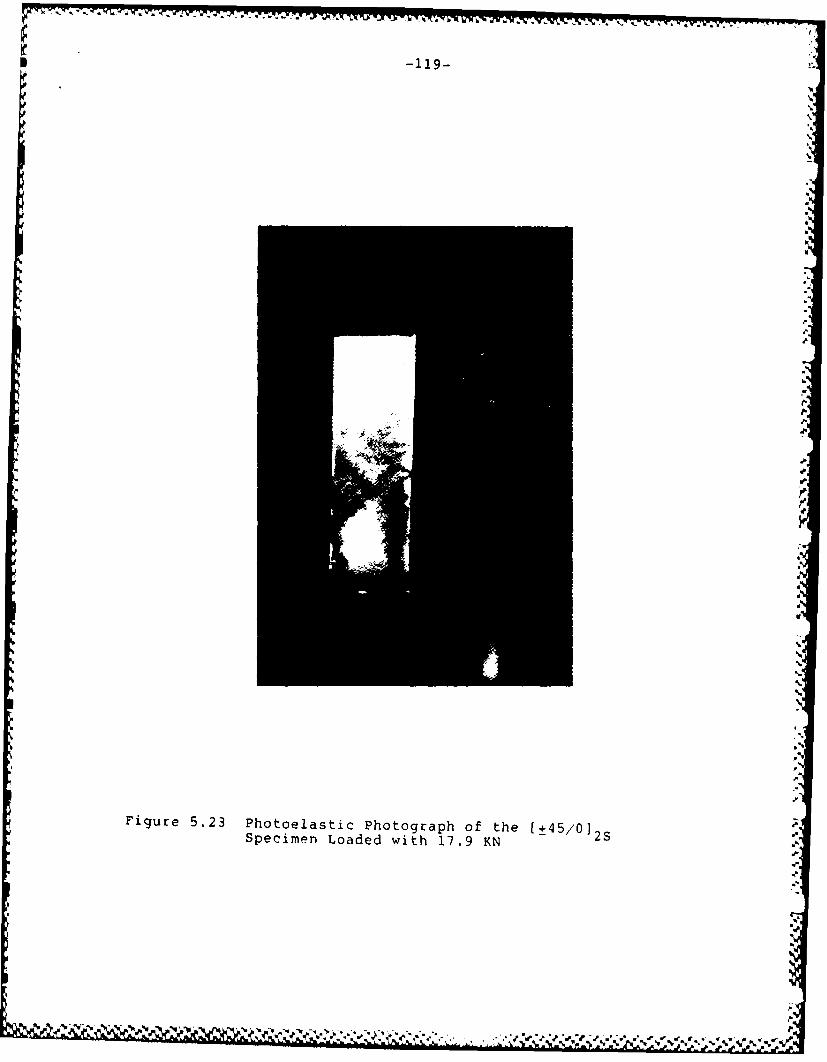
-119-
.
am
,,%
,. dS
Si.
. IS,
Spec men oade wi h 17 9 KN- '
IS.

-120-
the free edges of the specimen are due to bonding
irregularities of the photoelastic coating. The changes in
strain (and thus stress) which occur at the ply dropoff can be
readily seen in Figures 5.24-5.29. Figures 5.24 and 5.25 show
the [±45/0D/0/-+45] T laminate, with the coupon in the second
figure under the higher load. Figures 5.26 and 5.27 show the
[±4 5/(±4 5 )D/02]S laminate with the laminate in the first figure
lightly loaded. Figures 5.28 and 5.29 are photographs of the
[±4 5/0/(± 4 5/0)DJS laminate, again with the coupon in the first
photo lightly loaded.
The stress gradient in the region of the ply dropoff can
be easily seen in all of these photographs. The length of this
region in the (±4 5/0D/0/-+ 4 5 ]T laminate was about 60 mm, and
about 70 mm in the other two ply dropoff laminates. These
numbers remain fairly constant over the loading range. Two
important caveats must be stated. First, these measurements
are very rough in that they were taken off of three inch by
five inch photographs with a ruler in a relatively subjective
manner. These regions were not perfectly straight across the
width of the specimen, so an average value was estimated. The
second point is that the photoelastic coating started to debond
at about 40% of ultimate load with the [±4 5/(± 4 5)D/02 s
laminate, about 50% of ultimate load with the [±4 5/0/(± 4 5/0)D]S
laminate, and about 60% with the [±45/0D/0/-+45 T laminate.
This restricted the number of photographs which could be
expected to give accurate results. These values for the length
of the stress gradient of the ply dropoff region are on the
p.1
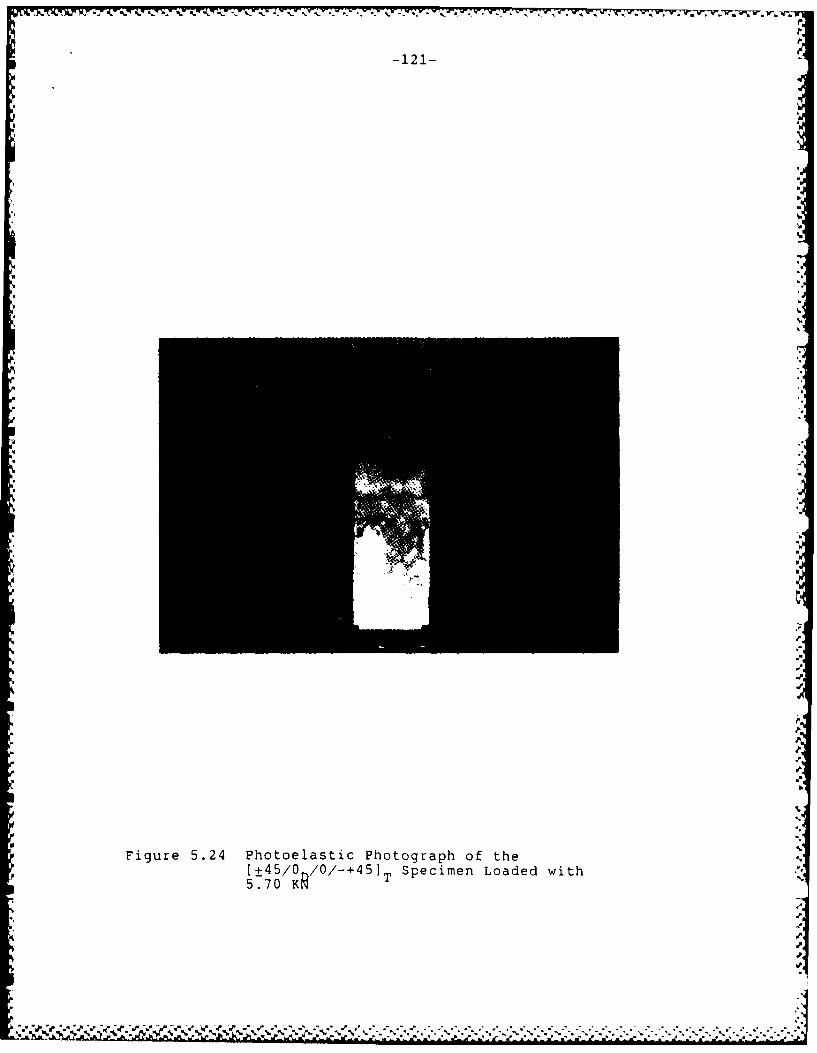
-121-
.i
U'
4.o
J.
U-
Figure 5.24 Photoelastic Photograph of the[+45/0 /0-45 Specimen Loaded with5.70 KR
U,
J
"U
%'
'p

-122- -~
-A
i.~.
I
A.
I
.Ji
U
Up.
-A
'-A
4.
'-A
I4VV
Ut
-Up
p-I
Figure 5.25 Photoelastic Photograph of the[+45/0 ~0 ~ ~~ 4 5 1T Specimen Loaded with9:36 K~
S.,
p
~ W4V'~.P~ %UpJb ~ ~ ~ ~ :.-.'.-.*.-x.*. -
* I~
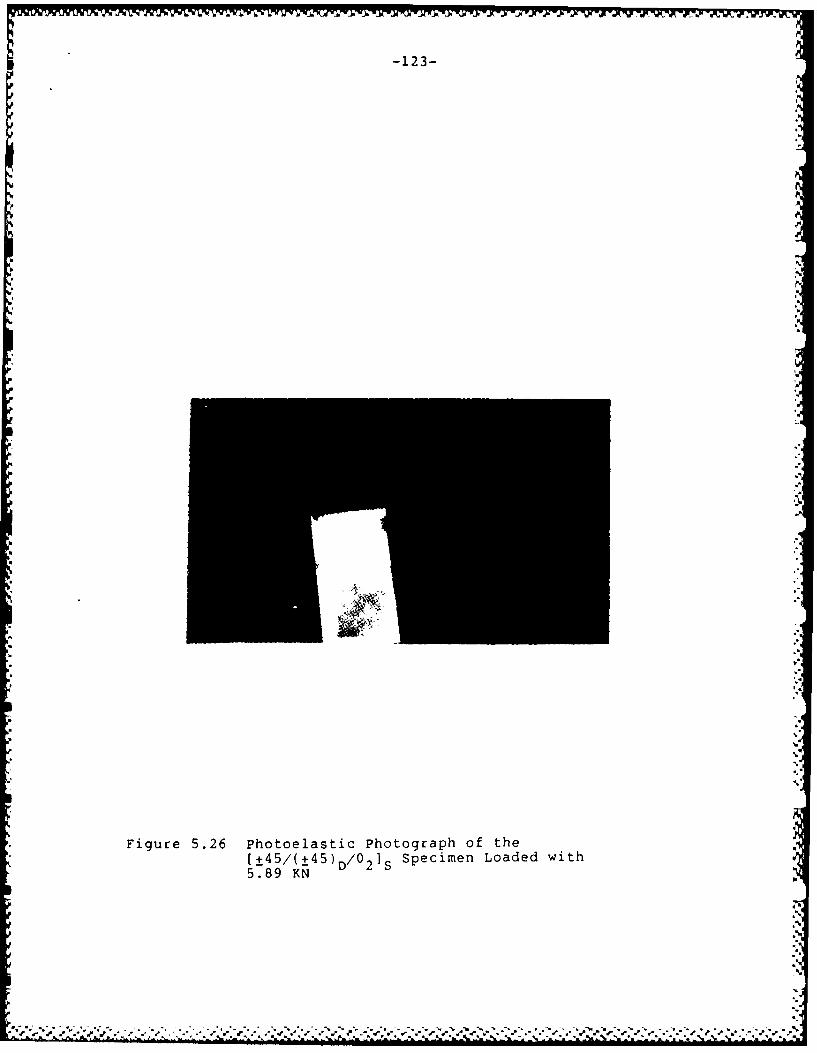
-123-
IWOs
5.89 KN
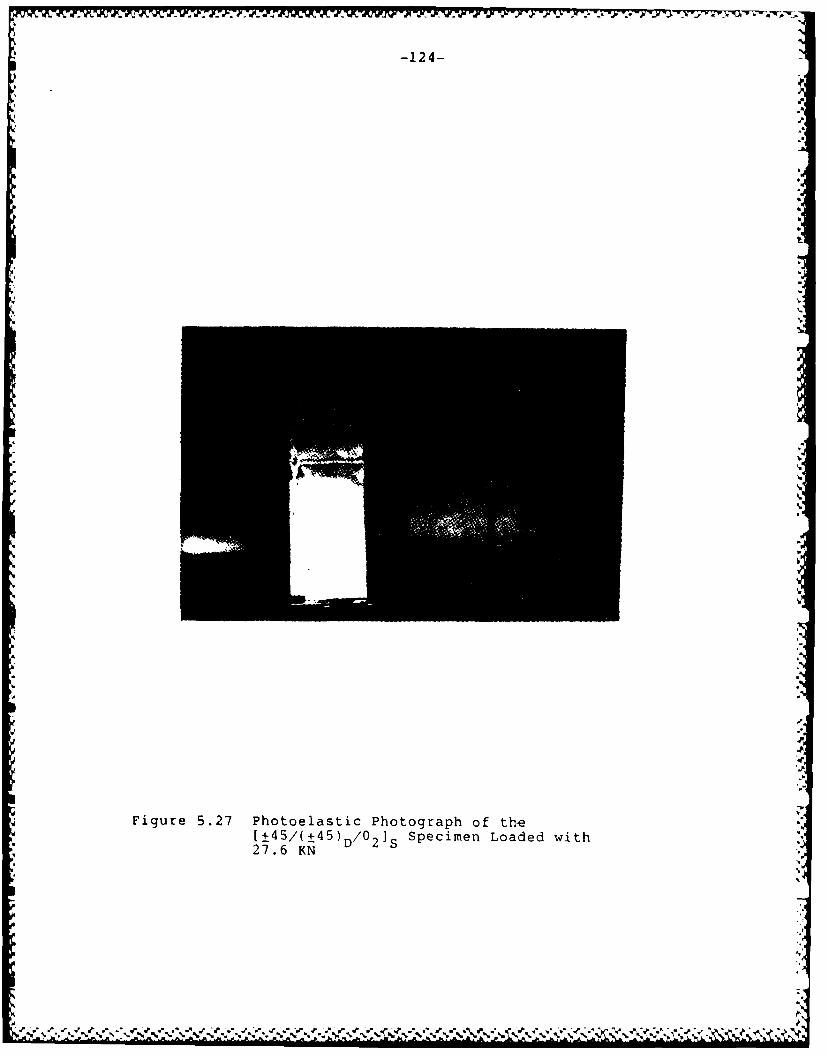
-124-
1.1*
J
Figure 5.27 Photoelastic Photograph of the[±45/(±45) D/0 2]S Specimen Loaded with27.6 KN '.
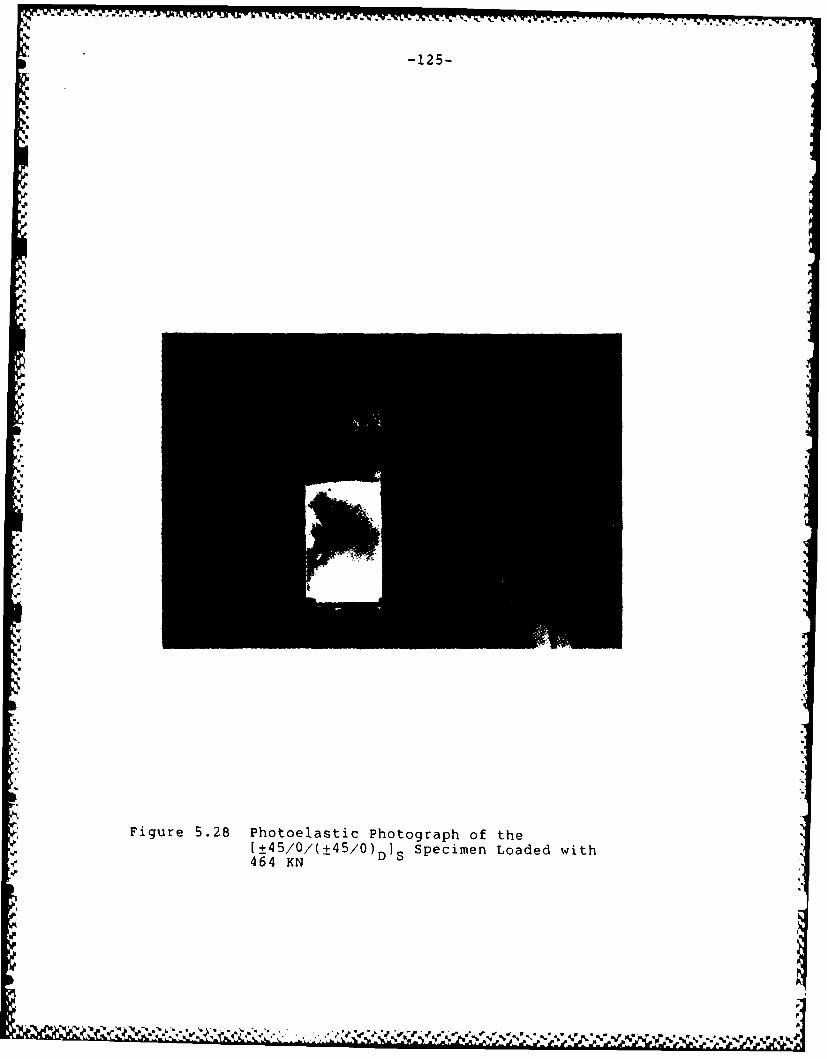
,.'.
-.
-125
Figure 5.28 Photoelastic Photograph of the[+45/0/(±45/0)D]S Specimen Loaded with464 KN

-126-
'44
Fiue52 hteati htgaho h
[t5S.4/ ) I pcmn oddwt
11. K
4., .. P
C CC,
S;, i %Ck

-127-
same order as that obtained by the curvature analysis done in
Chapter 4 to determine where the longitudinal curvature becomes
insignificant. This was calculated to be about 70 mm for the
[±4 5/0/(± 4 5/0)D]s and [±4 5/(± 4 5 )D/021s laminates and about 45
mm for the [±4 5/OD/0/-+ 4 5 ]T laminate.
5.3 Fracture Stresses
The average fracture stresses of the laminates tested in
this study are listed in Table 5.4 for the flat laminates and
in Table 5.5 for the ply dropoff laminates. Five coupons of
each layup were tested, except for the [±4 5/(± 4 5)D/O2]S, of
which only four were tested due to an error during the
machining of this plate. Also, one of these four was used in a
photoelastic test. As described in Section 3.3, the
photoelastic test requires bonding of a 1.0 mm thick
photoelastic coating to the surface of the laminate, which
could affect the overall stiffness and strength of the coupon.
Therefore, fracture stresses from photoelastic tests were not
used in computing the average values. One specimen each of the
[±4 5/0D/0/-+4 5]T and (±45/0/(± 4 5/0)DIS laminates was used for
photoelastic testing. The coefficient of variation (C.V.),
defined as the standard deviation divided by the mean, is also
listed for each laminate in Tables 5.4 and 5.5. This gives
information on the scatter of the data. Data for each
individual specimen are contained in the Data Tables. Note
that the coefficients of variation are relatively small and
that the ply dropoff laminates fail at about the same stress,
* V
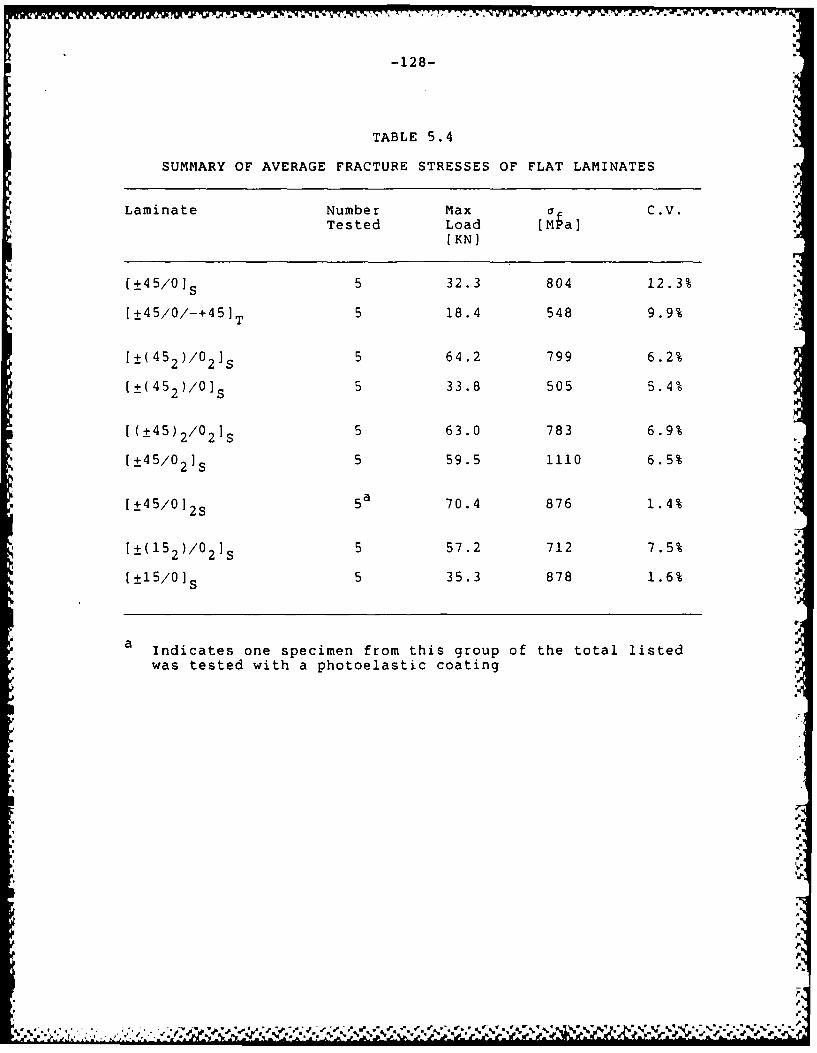
-128-
TABLE 5.4
SUMMARY OF AVERAGE FRACTURE STRESSES OF FLAT LAMINATES
Laminate Number Max a;C.v.Tested Load [Mba]
[KNJ
(±45/01~ 5 32.3 804 12.3%
[±4 5/0/-+ 4 5 ]T 5 18.4 548 9.9%
[±( 4 5 2)/0 2]S 5 64.2 799 6.2%
(±(45 )/0]S 5 33.8 505 5.4%
[(±4 5 )2/02IS 5 63.0 783 6.9%
(±45/0 21S 5 59.5 1110 6.5%
[±4 5/0J 2S 5 a 70.4 876 1.4%
[±(15 2)/0 2]S 5 57.2 712 7.5%
[±15/0] S 5 35.3 878 1.6%
a Indicates one specimen from this group of the total listed .
was tested with a photoelastic coating
JI.
% % % I

-129-
TABLE 5.5
SUMMARY OF AVERAGE FRACTURE LOADS AND FRACTURE STRESSES BASEDON UNDROPPED SECTION AND DROPPED SECTION AREA OF LAMINATES
WITH PLY DROPOFFS
af [MPa]
Laminate Number MaxTested Load Undropped Dropped
[KN] Area Area
[±4 5/0D/0/-+ 4 5]T 5a 18.1 a 451 541(3.1%) a
[±( 4 52)/0/0DIS 5 28.9 359 431(18.8%)
[+45/+45/-45/-45D/0/0D] 29.0 361 722(10.3%)
4b 64.4 801 1202[±4 5 /(±45 )D/02JS (4.2%)
5 32.2 401 801
[±4 5/(±4 5)D/0/0DJS (13.6%)
5b 29.8 371 741[±4 5/0/(± 4 5/0)DJS (9.6%)
b[+15/+5D /-15/-15D/0/0D] S 37.6 468 935
(2.8%)I,,
a Numbers in parenthese are coefficients of variationIndicates one specimen from this group of the total listedwas tested with a photoelastic coating
NFN PA
-~ - - - -..
-130-
basing this stress on the cross-sectional area of the dropped
end of the specimen, as that of the flat laminate having the
same layup as the dropped section. These results as a whole
indicate that the fracture stresses of the laminates were not
significantly affected by the ply dropoffs.
5.4 Fracture Modes
Fracture modes for each of the laminate types are
described in this section. The descriptions are based on
postmortem visual inspections. Typical photographs of each
laminate are included.
The basic laminate in the first group is [±45/0]. These-slaminates appeared to fail in a primarily in-plane mode.
Fairly clean transverse cracks can be seen beneath the outer
45 layers, where a clean fracture implies little or no
delamination with matrix splitting occurring at the fracture.
A secondary damage zone of outer ply splitting and delamination
occurred near one tab. A typical failure can be seen in Figure
5.30. The first specimen of this laminate was fractured
differently than the rest in that secondary delamination was
more prevalent at the fracture surface, rather than the
relatively clean in-pl.ane fracture.
The [±4 5/0/-+ 4 5 1T specimens which models the dropped end
of the [±45/0D/0/-+ 4 5]T laminate, remained in one piece after
failure and was held together by outer angle plies which split
but did not fracture. Outer ply splitting with some transverse
cracking and delamination occurred in the major damage area of
, N . . % %. % %
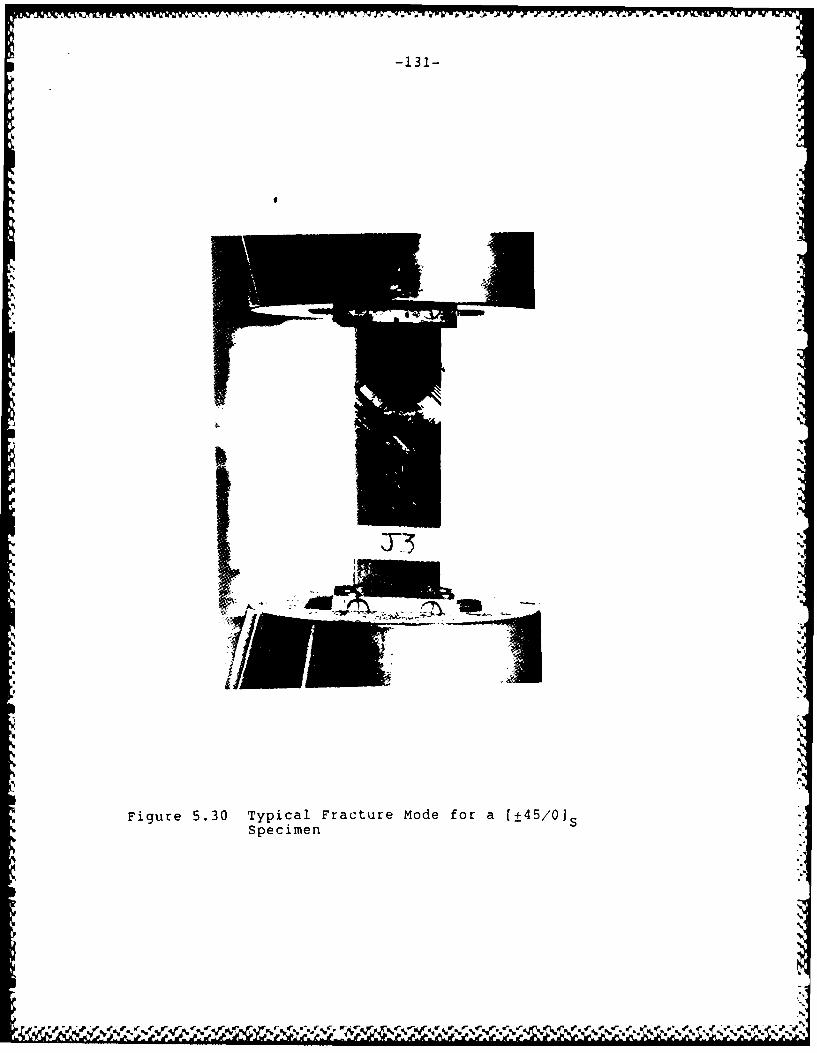
-- v aA--
-131-
T3;
low
Iz
-SS
..
Specimen
e -r
-A a,
#w.. "..

-132- I,-|
these laminates. Also present in all of these coupons was some
splitting and delamination of the outer plies near one tab. I
This failure can be seen in Figure 5.31.
The (±45/OD/ O/-+ 4 5] T specimens failed in an in-plane
mode. All of the specimens remained in one piece after
fracture, held together by some of the outer angle plies which
split but did not fracture. The main damage was splitting of
the outer angle plies at 45 at the ply dropoff, with one
specimen showing the same damage mode in the dropped section of
the specimen rather than at the ply dropoff region. There was
also splitting of the inner plies along with some delamination I
close to the damage area. Figure 5.32 is a photograph of a
typical failure. This is the same damage as observed in the
flat [±4 5/0/-+ 4 5 1T specimens. -
The basic laminate in the second group is [±( 4 52)/02]S
These laminates appeared to fail in a two step process, with
splitting occurring first in the 00 plies followed by major
delamination along the entire length of the coupon. These ,A
fractures were quite messy, in that alot of delamination and
splitting occurred along with the fracture. It was common for
these specimens to fracture in more than one place along the
length of the coupon, that is the coupon would often end up in
three pieces. A typical failed specimen is shown in FigureI
5.33.
The [±(452)/0] $ laminates failed in an in-plane mode.2 S
This laminate models the dropped section of the [±( 4 52)/0/0DeS
laminate. Typical damage here was a crisscrossed pattern of
'a
I
~ ~ .&S4%Iy ~ ~'.~4444 4 a .:.a. ...

-13 3-
*I k
Figure 5.31 Typical Fracture Mode for a [±45/0/-+4 5 'TSpecimen
a 'e.m-4U

*-~l -W-.r A. 1%.. . . . . . .
-134-
'.
K'
, ..
I ".2-p
Figure 5.32 Typical Fracture Mode for a [±4 5/0D/0/-+ 4 5 1TSpecimen
5'
pPp :P 1 * .. ,

-' - - 4 - -- 4 -4.--
-135- -b
.4,.
.4
.4-
P
tS..
.4.
.4
'4
4,.
4-
.4
-S
I45
.1'
.1~
I.4
.4
Figure 5.33 Typical Fracture Mode for a [±(452)/O2Is 4'
Specimen
I
44
~5.4
.4
.4
.4.4..
SSUSW ~ £**%,* *4~' 4
\P4 - P:'k4'~ ~ ~I4
*.4.4~44' *~5~~E 4.44- ~ a~%44 '4 44.4 *4'SS* .4 4 4 4' 4 . U %..f/..~ ~

-136-
+45° splitting with localized delamination. This is shown in
the photo in Figure 5.34.
The [±( 4 5 2)/0/0D]S coupons had two main types of damage.
Fracture occurred at the ply dropoff or slightly into the
dropped end of the specimen. In four of the five specimens,
the two 00 plies delaminated as a single unit away form the
rest of the laminate in the undropped end of the specimen. It
appears that this delamination was caused by the fracture and
not the other way around, and therefore can be considered
secondary delamination. In this respect, the failure mode is
similar to that of the [±( 4 52)/0/ 1S laminate which models the
dropped section. This failure mode is shown in Figure 5.35.
The [+45/+45D/-45/-45D/0/0 coupons failed in an
in-plane mode, as can be seen in a typical photo in Figure
5.36. Fracture occurred at a 450 angle with some splitting of
the inner plies as well. This fracture mode was similar to
that of the [±4 5/0]s (described in the second paragraph of this
section) specimen which models the dropped section of the
current laminate. This fracture began at or slightly below the
ply dropoff and continued into the dropped section of the
laminate. A fracture at -45° also occurred, sometimes
originating from the "main" fracture and sometimes running over
it in an "X" pattern.
The basic laminate of the third group is [(±4 5)2/02]S.
These laminates had significant delamination along the free
edge which appeared to be the primary cause of failure. The
fractu'es which occurred in these specimens was quite dirty.%"
- 5.%..5 ~ .% %V ,

-137-
"..4
,.q.4
13I"
4 '
i .
4
I 4'
Figure 5.34 Typical Fracture mode for a [±(45 2 )/OI5Specimen
.'0
-"4'
-
.4
~' ( (~~, / VtVt%# ~ ~ ~ 4V. % 4.*

-138-
-- MWe
Figue 535 Tpicl Frctue Moe fr a ±(42)/OODI
Specime

-139-
p
A
A
f "
7AC4K
-d
I I f .
Figure 5.36 Typical Fracture mode for a-+45/+45D/-45/-45D/0/0D]S Specimen
a."
' , . a

-_ W1 W
-140-
Delamination at the -45°/00 interface typically ran the entire
length of the specimen on one side and roughly half that on the
other side. This can be seen in Figure 5.37.
The [±4 5/021S laminates, which model the dropped section
of the [±4 5/(± 4 5 )D/021 S laminates, failed in an in-plane mode
with a somewhat dirty fracture roughly perpendicular to the
x-direction. A secondary damage area occurred near one of the
tabs in these laminates, a fracture in two of the specimens and
delamination and splitting in three of the specimens. A photo
of a failure of this laminate is shown in Figure 5.38.
It could not be determined conclusively from the
postmortem inspections of the [±45/(±45)D/021 S laminates
whether the failures were strictly in-plane failures or whether
delaminations occurred first causing in-plane failure. Varying
fractures occurred at and below (in the dropped section) the
ply dropoff from a relatively clean break perpendicular to the
loading direction, similar to that of the flat laminate
modeling the dropped section, the C±4 5/02]S laminate, to a
0roughly 45 , somewhat dirty fracture. One of the coupons had a
free edge delamination running the length of the undropped end
of the specimen. This failure is shown in the photo in Figure
5.39.
The [±4 5/(±4 5 )D/0/0DJS specimens appeared to fail in an
in-plane fracture mode as seen in Figure 5.40. These specimens
failed at the ply dropoff for most of the specimens with a
majority of the fracture perpendicular to the loading
direction. One of the coupons failed at the midpoint of the
g¢ , .. , .. 2 : . ? , .... € . -..... ,.' % ~v.. • • . ,,.U
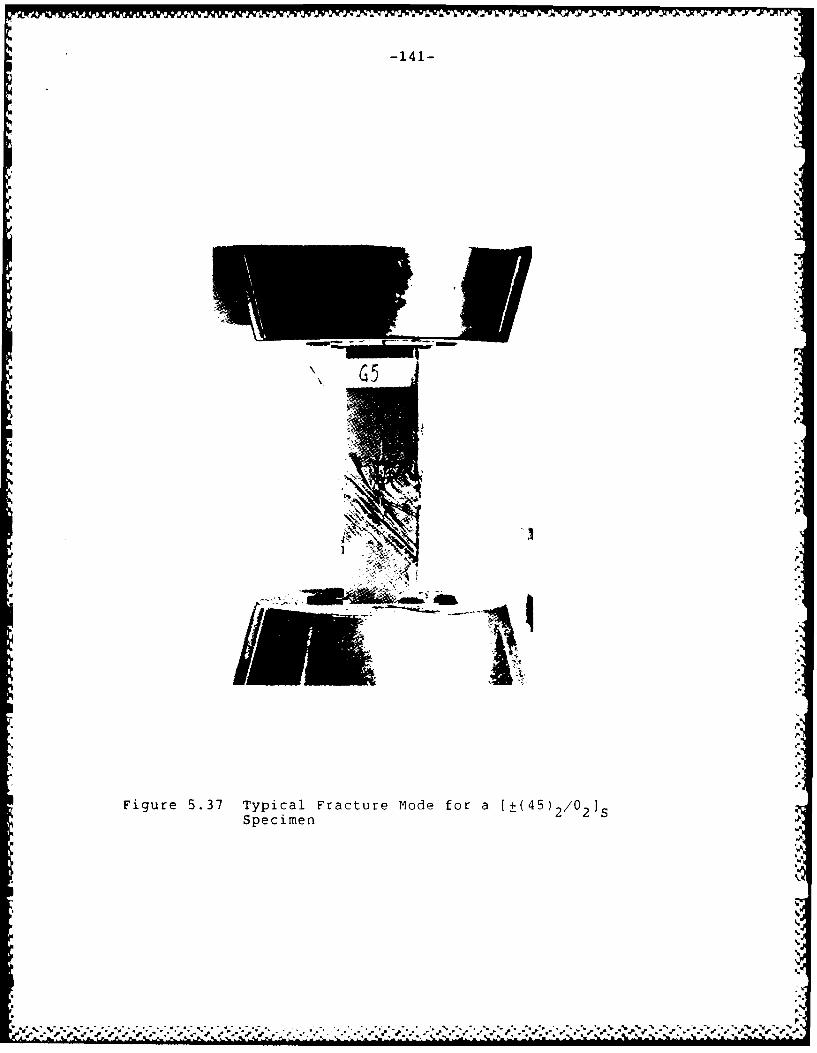
I. - - a - k - -
b
-141-
'V
'V
a 'a* a
I-
'I.
'V
I
V.
a
Im~- -1'V.
'a
Figure 5.37 Typical Fracture Mode for a [±(45)2/O2IsSpecimen
'VV.
'a
'VV.
'V
V..
'V.
* DV...
I.V~*% %~%~ .**..~. . V- -.--- V ~ .... ~V
a-........................ ~ V-~*s*'VVV.
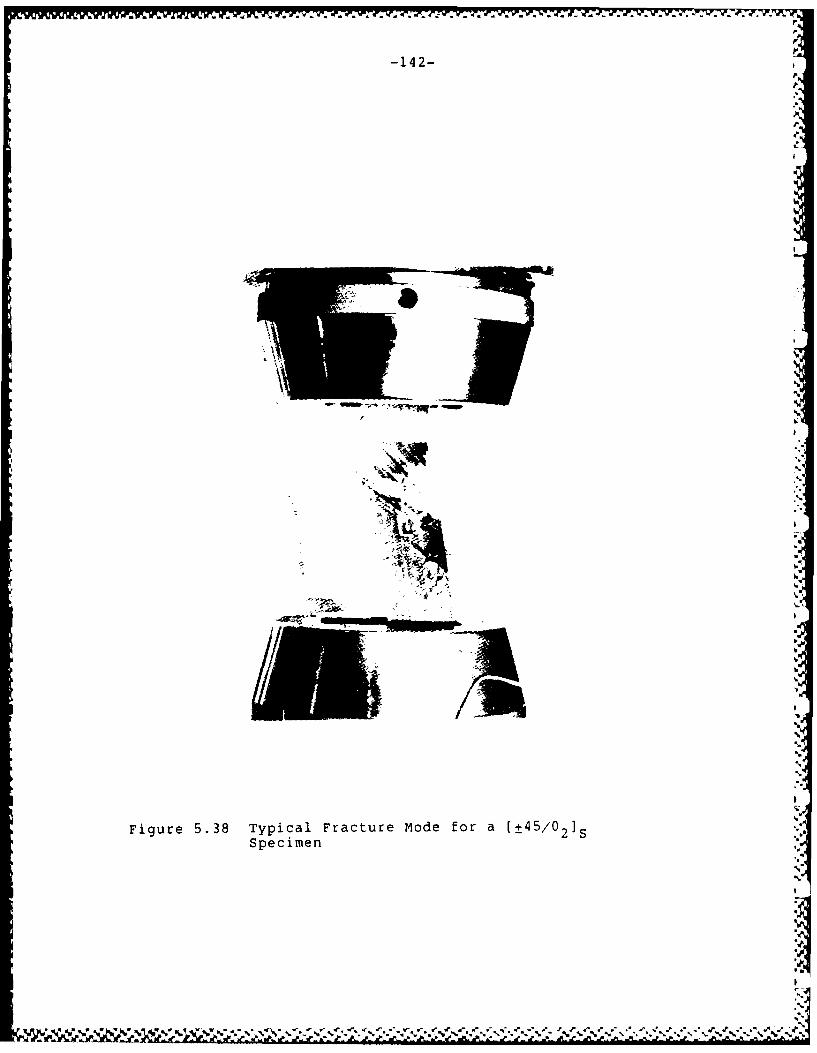
-142-
AILLII,"t
~E~I~I
f...
- -ft
Figure 5.38 Typical Fracture Mode for a [±45/021 s
Specimen
-"& ' "&'-'' " ' '....,,, , .,,< .. , , ,, ,.,.. ,. . - " " '""" . % "- "; ' . .' ? ' ,. "" "'.''.'.-;-S , ,.?. .'] _ -- - .- ;' _," -,,*--. ,-'". ",."--,
ift-.

-143-
Figure 5.39 Typical Fracture Mode for a [±4 5/(±4 5 ) D/0 21sSpecimen
T.
F..
N

-144-
bI
7T3
'
/
Figure 5.40 Typical Fracture Mode for a[± [±45/(± 4 ')D/0i0D]S Specimen
II. . . . .'- . - - o " - . , - . - ' .'' . '' "' 4 ,'" * -- +' "

[I.
-145-
dropped section of the laminate with a similar failure mode.
Some of the breaks were cleaner than others and two of the
coupons remained in one piece. Splitting of the outer plies
was present near the fractures. The fracture changed from
perpendicular to the loading direction to a 450 angle at the
free edges on two of the specimens. These fractures were
similar to those of the [±45/01 S laminates, which model the
dropped section of the laminate, in that they were both
in-plane and part of the fracture of the ply dropoff laminate
was at a 450 angle, like the fractures of the [±45/0] S
laminates. One coupon had a free edge delamination running the
length of the undropped section.
The basic laminate of the fourth group was the [±4 5/0)2S2S%
laminate. These laminates appeared to fail in an in-plane mode
with a 450 fracture, very much like that of the (±45/0]s
laminates. These fractures were relatively clean. One coupon
had a somewhat dirty fracture perpendicular to the loading
direction. A typical failure is shown in Figure 5.41.
Typical failure for the [±4 5/0/(± 4 5/0)D]S was a fracture
at the ply drop mostly perpendicular to the loading direction
and changing to a 450 angle near the free edges. In four of
the five coupons, the dropped sublaminate delaminated away from
the outside of the specimen. These laminates appeared to fail
in an out-of-plane mode leading away from the ply dropoffs in
the undropped section of the laminate. This failure mode is
therefore different from that of the [±4 5/0 12S and [±45/0] S
laminates, which model the undropped and dropped sections of4.
444-
4..'

-146-
Figure 5.41 Typical Fracture Mode for a [±45/01 2SSpecimen
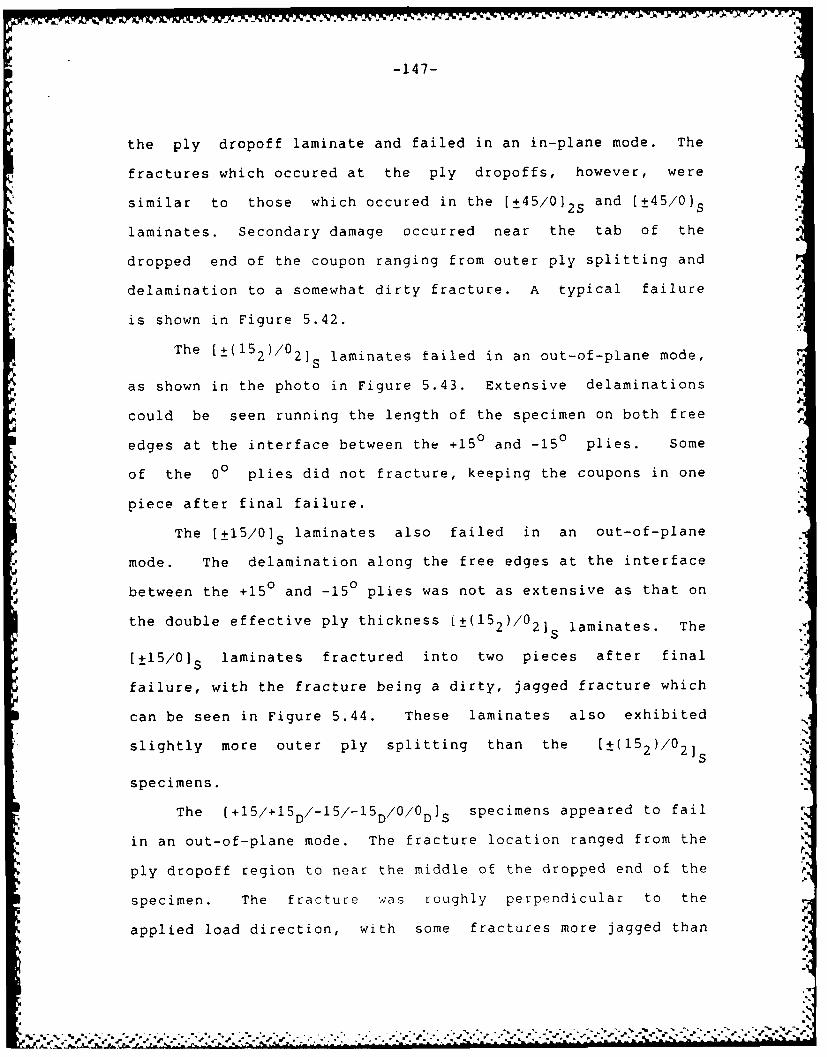
-147-
the ply dropoff laminate and failed in an in-plane mode. The
fractures which occured at the ply dropoffs, however, were
similar to those which occured in the [±45/012S and [±45/0] S
laminates. Secondary damage occurred near the tab of the
dropped end of the coupon ranging from outer ply splitting and
delamination to a somewhat dirty fracture. A typical failure• -
is shown in Figure 5.42.
The [±(152)/021 S laminates failed in an out-of-plane mode,
as shown in the photo in Figure 5.43. Extensive delaminations
could be seen running the length of the specimen on both free
edges at the interface between the +150 and -150 plies. Some
of the 00 plies did not fracture, keeping the coupons in one
piece after final failure.
The [±15/01S laminates also failed in an out-of-plane
mode. The delamination along the free edges at the interface ""
0 0. J
between the +15 and -15 plies was not as extensive as that on
the double effective ply thickness [±(152)/02] s laminates. The
[±15/0]S laminates fractured into two pieces after final
failure, with the fracture being a dirty, jagged fracture which
can be seen in Figure 5.44. These laminates also exhibited
slightly more outer ply splitting than the [±(152)/021S
specimens.
The [+1S/+15D/-15/-15D/0/0D]S specimens appeared to fail
in an out-of-plane mode. The fracture location ranged from the
ply dropoff region to near the middle of the dropped end of the p
specimen. The fracture was roughly perpendicular to the
applied load direction, with some fractures more jagged than
41

-148-
,
IW I
Figure 5.42 Typical Fracture Mode for a[±4 5/0/(± 4 5/0)D S Specimen
• %-
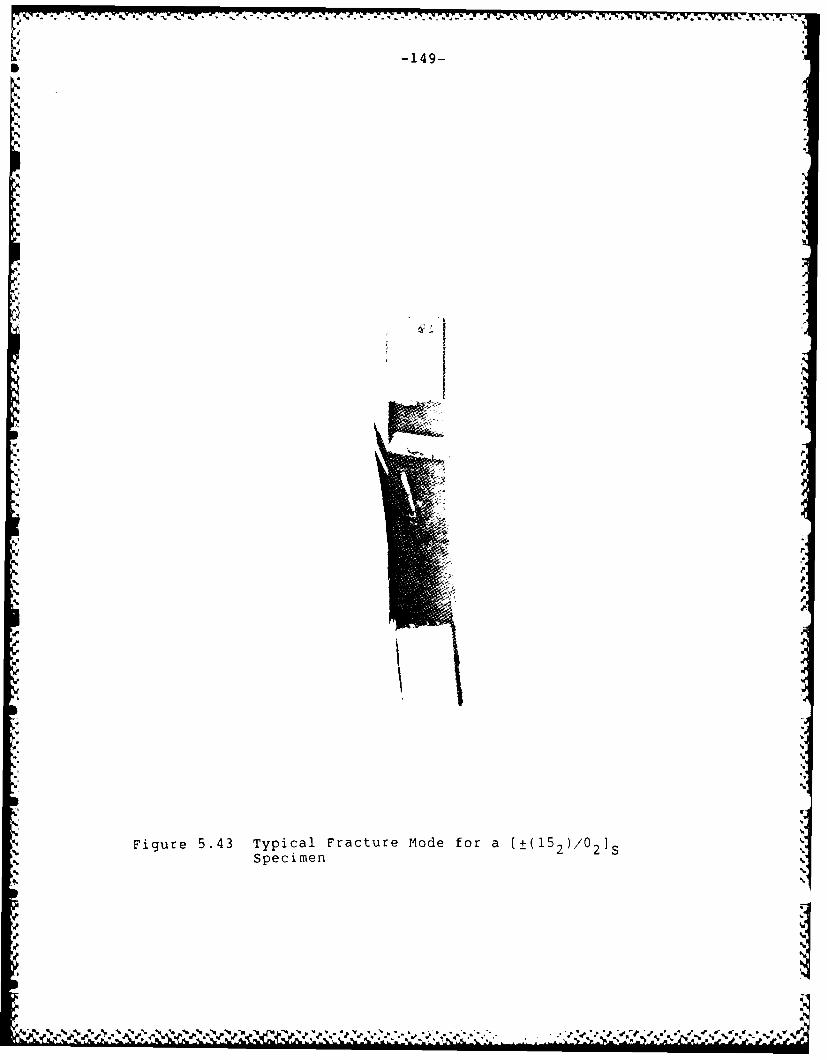
. .*~ ~ - * ~ -
N,
4
-149-B
N.
1*,
A $
N V
I
N, 'N
N, 'p.
N,
N. 4'
.1*
'p.
N,
N,
Figure 5.43 Typical Fracture Mode for a [±(l52)/02I5Specimen N.
N N.
"N
'I, I'wp.%N,.N, "%N N% W~N'p 'p ~' ~ * NN~~ **$* * N*~ * $*J~~4~N 4.0k
N ~ 4'~. ~ ~ N ,.~.N'N** %.,%.N. N, 4,4w

-150-
a,
I 4
F~ue .4 gicl Mrcu oe ora +50 S
Spcie
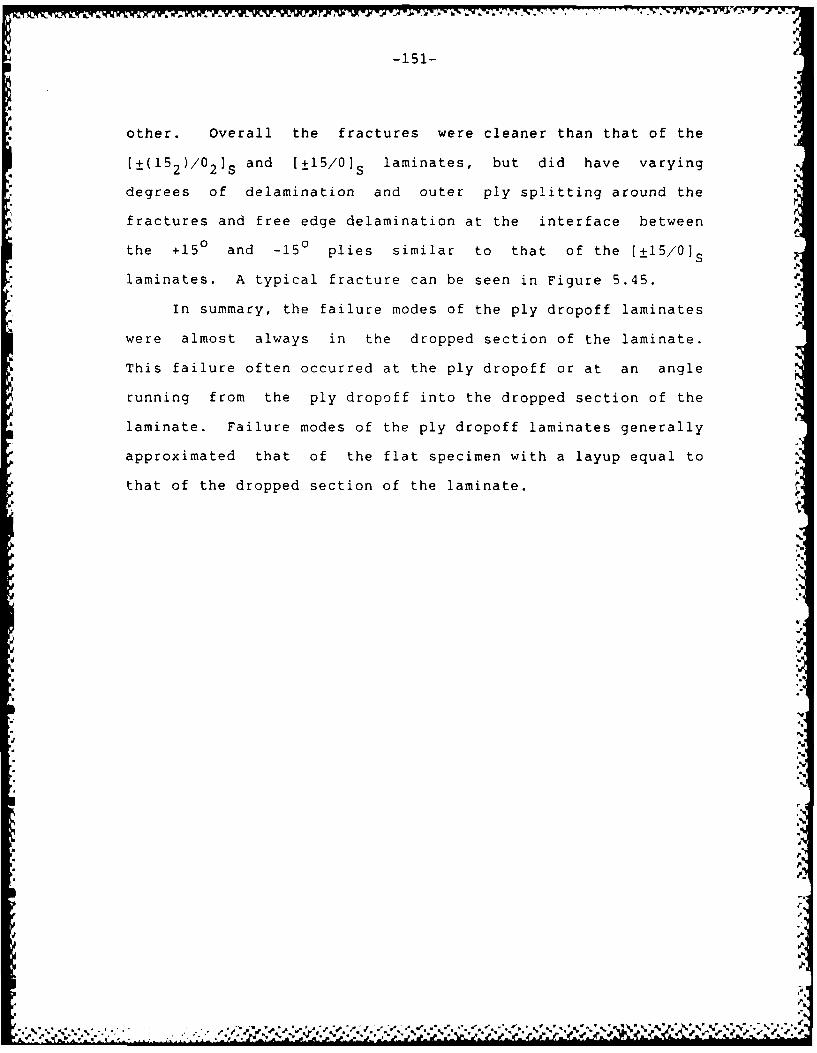
-151-
other. Overall the fractures were cleaner than that of the
[±( 1 5 2)/02]S and [±15/0]S laminates, but did have varying
degrees of delamination and outer ply splitting around the
fractures and free edge delamination at the interface between
the +150 and -150 plies similar to that of the [±15/0]S
laminates. A typical fracture can be seen in Figure 5.45.
In summary, the failure modes of the ply dropoff laminates
were almost always in the dropped section of the laminate.
This failure often occurred at the ply dropoff or at an angle
running from the ply dropoff into the dropped section of the
laminate. Failure modes of the ply dropoff laminates generally
approximated that of the flat specimen with a layup equal to
that of the dropped section of the laminate.
1P
%,
,%.
,4

-152-
30.
Figure 5.45 Typical Fracture mode for a+15/+15D /-15/-15D/0/0D] S Specimen
I .' t ,° ° " ° --" "* -" ." "1 • '° " -" • * ... . • ... ... .. .o I
-153-
CHAPTER 6
DISCUSSION
6.1 Effects of Ply Dropoffs on Stress-Strain Behavior
AS shown in Figure 3.12, strain was measured at the center
of the flat specimens and on the front and back of both the
dropped and undropped sections of the coupons with ply
dropoffs. Overall, the strain readings and longitudinal moduli
of the ply dropoff specimens were equal to that of the flat
specimens with the same layup, within the scatter of the data.
As described in Chapter 4, it was determined with the analysis
that the maximum longitudinal distance for the curvature to
decay from its maximum value at the ply dropoff to 1% of this
value was 70 mm in the undropped section and 25 mm in the
dropped section. The significance of this is that the
back-to-back strain gages were 75 mm from the ply dropoff and
therefore would not be able to measure the curvature of the
specimen. These gages were placed with the idea in mind to
measure far-field strain behavior.
A good recommendation would be to place back-to-back
strain gages as close as possible to the ply dropoffs to
measure this curvature caused by the induced bending effect of
the ply dropoff laminates with one side flat. This information
could be used to see how well the curvature predicted by the
analysis matches that measured experimentally. The
photoelastic tests provided a rough confirmation of the
~I
-154-p
p
anlysis. As discussed in Chapter 5, visible stress gradients
of the photelastic tests were on the order of 50 mm.
6.2 Effects of Ply Dropoffs on Failure Stresses
The average failure stresses of the laminates with ply
dropoffs are summarized in Table 6.1. The second column of
this table is the average value of the failure stress of the
ply based on the cross-sectional area of the dropped section of
the laminate. UnLess it is specifically stated that the
stresses are based on the undropped area of the ply dropoff
laminate, the dropped section of the laminate is used for the
stress calculations. The third column of this table is the
first ply failure stress of the dropped section as predicted by
classical laminated plate theory (CLPT). The last column of
this table contains the first ply failure stresses of the
dropped section taking into account the induced bending
stresses, as discussed in Chapter 4. For the CLPT analysis,
all first ply failures, except that of the
[+15/+15D/-15/-15'D'\0\00 DI laminate, were failure of the 450-S
plies in shear, a 12' First ply failure of the
DD\0\0D] laminate was due to a in the 00S 011
plies. When the analysis from Chapter 4 is used, the bending0I
effect causes first ply failure in the outer 450 ply on the
flat side of the laminate due to 012. This is where the
maximum additive effect of the induced bending moment with the
applied tension load is felt. As mentioned in Chapter 4, these
values for first ply failure are significantly below that of
I.
JP.. :: . F c Mrv %~f~t%
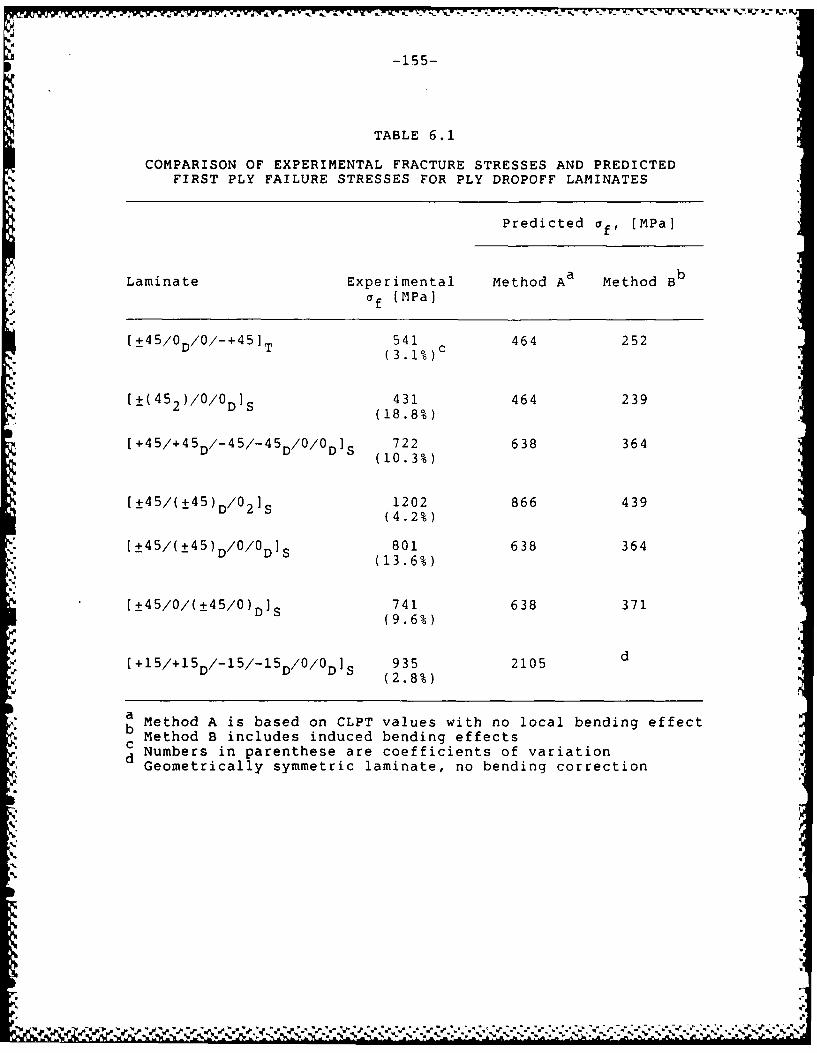
-155-
TABLE 6.1
COMPARISON OF EXPERIMENTAL FRACTURE STRESSES AND PREDICTEDFIRST PLY FAILURE STRESSES FOR PLY DROPOFF LAMINATES
Predicted af, [MPa]
Laminate Experimental Method A a Method B b
a f (MPa]
[±4 5/0D/0/-+ 4 5 ]T 541 464 252(3.1%)c -
[ ( 431 464 239,[±( 45 2)/O/0D~s(18)
~(18.8%)
[ 722 638 364(10.3%)
1202 866 439[± 4 5 /(± 4 5 )D/02]S (4.2%)
[±45/(±45)D/0/0 801 638 364D S(13.6%)
741 638 371[±45/0/(±45/0) D]S 746331
(9.6%)
[+I5/+I5D/-15/-15D/0/0 935 2105 d
(2.8%)
a Method A is based on CLPT values with no local bending effectc Method B includes induced bending effects
d Numbers in parenthese are coefficients of variationGeometrically symmetric laminate, no bending correction
..
-156-'A
the CLPT predicted first ply failures.
This analysis is only valid for first ply failure due to
the fact that after the first ply fails, the midplane of the
dropped section will change, making it no longer symmetric and
in turn affecting the B and D matrices of both undropped and
dropped sections of the specimen. This changes the energy
expression and the terms used in developing it, complicating
the problem to a large degree. Note that the
[+I5/+I5D/-15/-15D\0\0DIs laminates were geometrically
symmetric and therefore no induced bending effect was
predicted. The large overprediction of the strength of the
[±15/0] S family by CLPT is due to the tendency of these
laminates to delaminate at the free edge, as was previously %
discussed.
Table 6.2 is a comparative listing of the fracture
stresses. The first column, after the laminate column, is the
mean fracture stress and coefficient of variation for the
laminates with ply dropoffs. The second column is the mean
fracture stress and coefficient of variation for the flat
laminate which models the dropped section of the respective ply
dropoff laminate. The third column is the percentage of change
from the first column to the second. The last column is the
predicted fracture stress of the flat laminate modeling the ply
dropoff laminate using CLPT, which does not include any induced
bending effect or effect of interlaminar stresses. This is a
final failure, as opposed to first ply failure, prediction
accomplished with a progressive ply-by-ply analysis described
'p
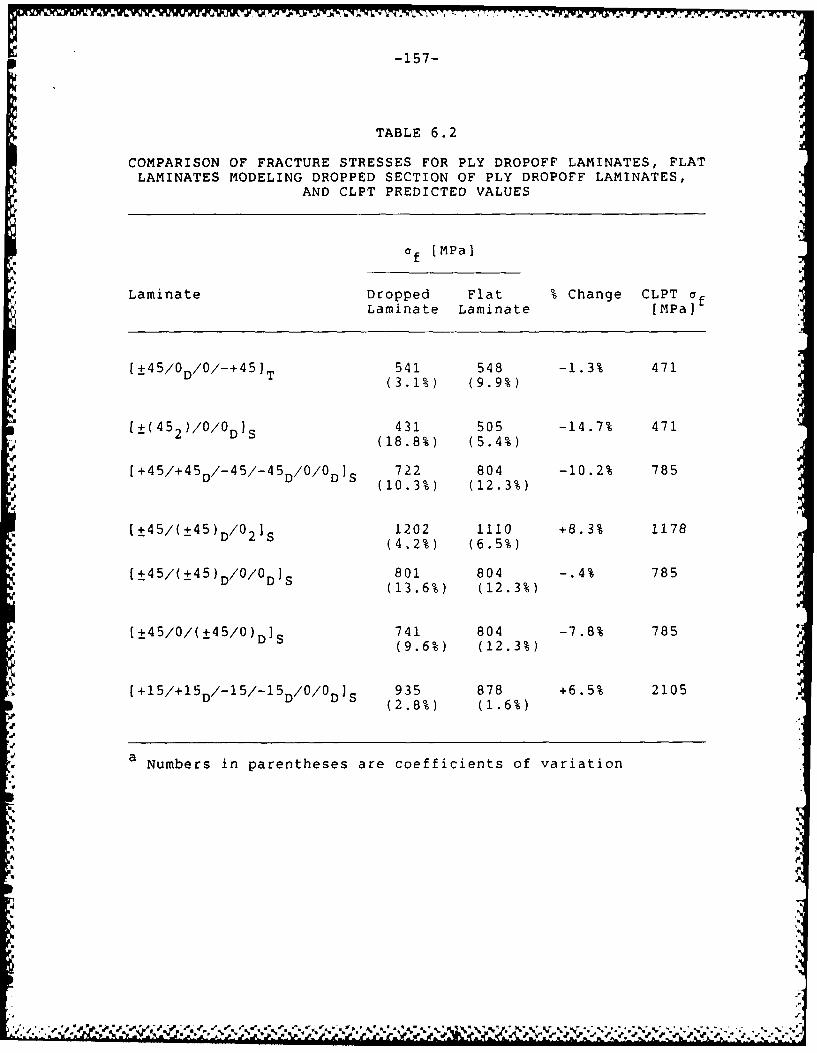
-157-
TABLE 6.2
COMPARISON OF FRACTURE STRESSES FOR PLY DROPOFF LAMINATES, FLATLAMINATES MODELING DROPPED SECTION OF PLY DROPOFF LAMINATES,
AND CLPT PREDICTED VALUES
of [MPa]
Laminate Dropped Flat % Change CLPT aLaminate Laminate [MPa]
541 548 -1.3% 471
[±4 5/0D/0/-+ 45 ]T (3.1%) (9.9%)
[±(452)/0/0DIS 431 505 -14.7% 471(18,8%) (5.4%)
1+45/+45D/-45/-45D/0/0D] S 722 804 -10.2% 785(10,3%) (12.3%)
[±45/(±45) D/ 0 21 S 1202 1110 +8.3% 1178
(4.2%) (6.5%)
[±45/(±45)D/0/0 D S 801 804 -. 4% 785(13.6%) (12.3%)
[± 45/0/(±4 5/0) 741 804 -7.8% 785(9.6%) (12.3%)
[+15/+15D/-15/-15D /0/0D s 935 878 +6.5% 2105(2.8%) (1.6%)
a Numbers in parentheses are coefficients of variation
'C
"C.,'C Cf "N ~ ~ C~- ~'~ ~ ,'s ** 4~ .~%'. ~ . * .*~.

-158-
described in Chapter 4.
The largest reduction in fracture stress from the ply
dropoff laminate to the flat laminate was that of the
[±(452)/0/0D]S, which failed at about 15% lower. Note,
however, that a fairly wide distribution of fracture stresses
for this laminate occurred, with a coefficient of variation of
about 19%. The [+45/+45D/-45/-45D/0/0 laminate showed about
a 10% decrease in fracture stress from that of the flat
laminate comparable to its dropped section, but the coefficient
of variation for this specimen was also about 10%. The other
laminates all showed differences of less than 10%, and two
laminates actually showed an increase in fracture stress over
their dropped se-tion comparable flat laminate, with the
[±45/(±45)D/021 S laminate showing an 8% increase and the
DI / D\0\0D] laminate showing a 6.5% increase.
These results as a whole indicate that the fracture stresses of
the laminates were not significantly affected by the ply
dropoffs.
6.3 Effects of Ply Dropoffs on Failure Modes
The general pattern which can be seen in the failure modes
of the laminates with ply dropoffs is that they are matched by
the failure mode of the flat laminate with a layup equal to
that of the dropped section. However, three of the ply dropoff
laminates did not follow this general rule as well as the other
four laminates did. These were the [±(452)/0/0D]S ,
[±45/(±45)D/02IS and [,5/0/(+4 5/0)D]S laminates. ]V%~~.D 2. . D.% ~ %'. ~ % S *

-159-
The [±(452)/0/0DI s laminates exhibited two forms of
damage, a fracture at or near the ply dropoff and, in four of
the five specimens, the dropped plies delaminated away from the
rest of the undropped section. It appeared that the fracture
at or near the ply dropoff was the primary cause of failure,
and therefore failure was classified as in-plane. The
undropped section of both of these laminates was modeled by the
(±(452)/021s laminate. These laminates appeared to fail in a
two step process, first with transverse cracking of the inner
plies followed by major delamination of the along the entire
length of the free edge. The dropped section of the
[±( 4 52)/0/0D]S laminate was modeled by the [±(452)/0]s
laminate, which failed in an in-plane mode. Therfore, while
the primary fracture mode of the ply dropoff laminate was an
in-plane fracture like that of the flat laminate modeling the
dropped section, the center two dropped plies also delaminated
in the undropped section of the laminate.
The [±4 5/0/(± 4 5/0)D]S laminates appeared to fail in an
out-of-plane mode. The sublaminate consisting of the inner six
dropped plies would normally delaminate away from the rest of
the undropped section. These laminates also had a fracture at
or near the ply dropoff region, showing signs of in-plane
failure. The undropped section of this laminate was modeled by
the [±4 5/012S laminate, which appeared to fail in an in-plane
mode with a fracture at a 450 angle. The dropped section of
this ply dropoff laminate was modeled by the [±45/0] s laminate,
which failed in an in-plane mode. This means that the

a - -W W)M ..P I- - - - -& a - V -. -W - .
-160-
[±4 5/0/(± 4 5/0)DIs laminates failed in a mode different from
that of the flat laminates modeling its dropped and undropped
section. One possible cause of this may be that this laminate
was laid up with all of the plies dropped off consecutively as
a single sublaminate. It appears that dropping these plies off
all at once rather than spreading them throughout the laminate
is more delamination critical. It is important to note here
that the failure stress of the [±45/0/(±45/0)D)s laminates was
only about 8% lower than that of the flat laminate modeling the
dropped section. Thus, there is essentially no strength
reduction when considering normal data scatter. So, although
delamination does appear at the ply dropoffs, it did not appear
to alter the final fracture stress.
Table 6.3 contains the first ply failure loads, rather
than stresses, as predicted by CLPT. By looking at this table,
it can be seen how much load is required to fail the first ply
of the undropped section of the ply dropoff laminate versus the
dropped section. For example, the undropped section of the
[±4 5/0/(± 4 5/0)D]S laminate would require twice the load as the
dropped section of the laminate to reach first ply failure
stress. First ply failure of the dropped section of the
(±4 5/(± 4 5 )D/021 S laminate, however, would require 90% of the
load required for first ply failure of the undropped section.
This would seem to indicate that damage in the undropped
section of the [±4 5/(±4 5 )D/0 2]S laminate would be more likely
than in the [±4 5/0/(± 4 5 O)D]S laminate. The [±4 5/(± 4 5 )D/02]S
laminate did indeed fail with damage in the undropped section
ELI.;

-161-
TABLE 6.3
CLPT PREDICTED FIRST PLY FAILURE LOADS FOR PLY DROPOFFLAMINATES
Laminate CLPT Predicted First Ply Failure Loads, [KN]
Dropped UndroppedSection Section
[±4 5/OD /0/-+ 4 5I T 15.5 25.6
[±( 4 5 2)/O/ D )S 31.1 51.3
[+5+5/4/4 0025.6 51.3
[±4 5/(± 4 5) D/0O2 1 S 46.4 51.3
±4/±5D/00DS25.6 51.3
- [±45/0/( ±45/0)~' 25.6 51.3
D a
[+5+5D/1/1 00DSa84.6 169.
-162-
of the laminate, but so did the [±4 5/0/(± 4 5/0)D]S laminate.
Other laminates which had the same 50% ratio between required
loads for first ply damage in the dropped section to the
undropped section did not show this damge in the undropped end
of the specimen. The [±( 4 52)/O/ODIS specimens, with a 60%
ratio between required first ply failure loads of the dropped
to the undropped section, also showed significant damage in the
undropped section. Note that the plies dropped off in this
lamminate were also dropped off in one sublaminate at the
center of the specimen, which gives more credence to the idea
that lumping the dropped off plies into one sublaminate rather
than distributing them through the thickness can lead to
delamination of the dropped plies.
The fracture mode of the [±4 5/(± 4 5 )D/021 S specimens was
somewhat in doubt. Free edge delamination of the undropped
section was common, but the fracture, which normally occurred
at or near the ply dropoff, appeared fairly clean, indicating
an in-plane fracture. The undropped section of this laminate
was modeled by the [(±45)2/021 laminate, which appeared to
fail in an out-of-plane mode, with delaminations at the -45°/0 °
interface typically running the length of the specimen. The
dropped section of the [±4 5/(± 4 5 )D/02]s laminate was modeled by
the [±45/021 s laminate, which failed in an in-plane mode. This
ply dropoff laminate, then, did fail in a mode similar to that
of the flat laminate modeling its dropped section but also
clearly showed evidence of the failure mode of the flat
laminate modeling its undropped section.
.

-163-Ii
In summary, most, but not all, of the ply dropoff
laminates failed in a mode similar to that of the flat specimen
modeling the dropped end of the ply dropoff laminate. The ply
dropoff laminate failed at about the same stress as that of the
flat laminate with the same layup as the dropped section. Even
the (+15/+15D/-15/-15 D laminates did not show a
reduction in strength from the flat laminate with the same
layup, which does delaminate due to the free edge effect.
However, the [±4 5/O/(± 4 5/O)D]s specimen showed that lumping a
significant amount of dropped plies together can change the
mode of failure from in-plane to delamination. Even though the
failure stress was not affected in this case, the change in
failure mode could be important in other instances, such as
fatigue.

-164-
d
CHAPTER 7
CONCLUSIONS AND RECOMMENDATIONS
An investigation was performed to examine the tensile
behavior of laminates with ply dropoffs. Experiments were
conducted to study the effects of number, order, angular
orientation, and effective ply thickness of dropped plies. An
analytical model was developed to account for the induced
bending effect of the geometrically unsymmetric laminates. The
following conclusions are made based on this work:
1. The stress-strain behavior of the ply dropoff laminates was
closely approximated by those of the flat laminates having
the same layups as the dropped and undropped sections.
2. Maximum regions of significant curvature were predicted to
be between 30 mm and 70 mm from the ply dropoff for the
undropped sections and between 10 mm and 25 mm from the ply
dropoff for the dropped section. This was verified
experimentally as an upper bcund value via far-field
back-to-back strain gages which indicated no curvature 75
mm from the ply dropoffs.
3. The failure stresses of the ply dropoff laminates were
equal to that of the flat laminate having the same layup as
the dropped section of the ply dropoff laminate, within
data scatter.
4. The failure modes of the ply dropoff laminates were
-165-
generally similar to those of the flat laminates modeling
the dropped sections of the ply dropoff laminates.
5. Of the number, order, angular orientation, and effective
ply thickness variables studied, only the order seemed to e
affect the ply dropoff laminates in comparison with the
flat laminates. Laminates with all dropped plies placed
adjacent to each other in the center of the laminate tended
to delaminate away from the rest of the laminate in the
undropped section. Failure stresses were still unaffected,
however.
6. The analysis method developed was inadequate in that only
first ply failure could be determined. Upper bound regions
of significant curvature predicted with the analysis method
were confirmed experimentally by the fact that no
consistent curvatures were measured by the back-to-back
far-field strain gages.
The following are recommendations for further work:
1. Extend the analysis method so that it would be applicable
after first ply failure. This would allow a ply-by-ply
failure analysis to predict final failure to be compared
with CLPT solutions and experimental results.
2. Conduct testing with strain gages closer to the ply
dropoffs. This would allow direct measurement of
longitudinal curvature, ;hich could be used to determine
z:

tA. . ~ s~.. . . . . .. **.~.-7 F. 7. 7.. ... .Irw .*ow~n
-166-
the effects of the loading eccentricity directly and
provide data to better prepare with the analysis.
3. Develop an analysis method to determine interlaminar
stresses caused by ply dropoffs in composite laminates.
4. Implement a nondestructive inpection method capable of
detecting delamination inside (away from the free edge) a
laminate at a ply dropoff.
-167-
REFERENCES
1. Autoweek, Vol. 37, No. 14, pg. 4, 6 April 1987.
2. Lagace, P. A., 16.292 Class Notes, Massachusetts Instituteof Technology, Spring 1986.
3. Pagano, N. J., and Soni, S. R., "Global-Local LaminateVariational Model," International Journal of Solids and ,.
Structures, Vol. 19, No. 3, 1983. r
4. Jones, R. M., Mechanics of Composite Materials, Mc-GrawHill, New York, 1975.
5. Pipes, R. B., and Pagano, N. J., "Interlaminar Stresses in
Composite Laminates Under Uniform Axial Extension,"Journal of Composite Materials, Vol. 4, 1970, pp.538-548.
6. Rybicki, E. F., "Approximate Three-Dimensional Soluitions
for Symmetric Laminates Under Inplane Loading," Journal ofComposite Materials, Vol. 5, 1971, pp. 354-360.
7. Wang, A. S. D., and Crossman, F. W., "Some New Results onEdge Effects in Symmetric Composite Laminates," Journal of
Composite Materials, Vol. 11, 1977, pp. 92-106.
8. Puppo, A. H., and Evensen, H. A., "Interlaminar Shear inLaminated Composites Under Generalized Plane Stress,"
Journal of Composite Materials, Vol. 4, 1970, pp.204-220.
9. Pagano, N. J., and Pipes, R. B., "The Influence ofStacking Sequence on Laminate Strength," Journal ofComposite Materials, Vol. 5, 1971, pp. 50-57.
10. Whitney, J. M., "Free-Edge Effects in the Characterizationof Composite Materials," Analysis of the Test Methods forHigh Modulus Eibers and Composites, ASTM STP 521, AmericanSociety for Testing and Materials, 1973, pp. 668-672.
11. Pipes, R. B., and Pagano, N. J., "Interlaminar Stresses inComposites - An Approximate Elasticity Solution,"Transactions of the ASME, September 1974, pp. 668-672.
12. Lagace, P. A., and Kassapoglou, C., "An Efficient Methodfor the Calculation of Interlaminar Stresses," TELACReport No. 85-4, Massachusetts Institute of Technology, .
March 1985.
-168-
13. Kassapoglou, C., and Lagace, P. A., "An Efficient Methodfor the Calculation of Interlaminar Stresses," Journalof Applied Mechanics, Vol. 53, December 1986.
14. Whitney, J. M., and Nuismer, R. J., "Stress FractureCriteria for Laminated Composites Containing StressConcentrations," Journal of Composite Materials, Vol. 8,January 1974, pp. 253-265.
15. Kim, R. Y., and Soni, S. R., "Experimental and AnalyticalStudies on the Onset of Delamination in LaminatedComposites," Journal of Composite Materials, Vol. 18,January 1984, pp. 70-80.
16. Kim, R. Y., and Soni, S. R., "Delamination of CompositeLaminates Stimulated by Intelaminar Shear," University ofDayton Research Institute, unpublished.
17. Brewer, J. C., "The Effect of Ply Thickness on the FreeEdge Delamination of Graphite/Epoxy Laminates", TELACReport No. 85-9, Massachusetts Institute of Technology,May 1985.
18. Rybicki, E. F., Schmeuser, D. W., and Fox, J., "An EnergyRelease Rate Approach for Stable Crack Growth in theFree-Edge Delamination Problem," Journal of CompositeMaterials, Vol. 14 Supplement, 1980, pp. 71-87.
19. Crossman, F. W., Warren, W. J., Wang, A. S. D., and Law,G. E., Jr., "Initiation and Growth of Transverse Cracksand Edge Delamination in Composite Laminates. Part 2.Experimental Correlation," Journal of Composite Materials,Vol. 14 Supplement, 1980, pp. 88-108.
20. O'Brien, T. K., "Characterization of Delamination and
Growth in a Composite Laminate," Damage in CompositeMaterials, ASTM STP 775, American Society for Testingand Materials, 1982, pp. 140-167.
21. Grimes, G. C. and Dusablon, E. G., "Study of CompressiveProperties of Graphite/Epoxy Composites withDiscontinuities," Composite Materials: Testing andDesign, ASTM STP 787, American Society for Testingand Materials, 1982, pp. 513-538.
22. Grimes, G. C., Adams, D. F., and Dusablon, E. G., "TheEffects of Discontinuities on Compression FatigueProperties of Advanced Composites," Northrop TechnicalReport NOR-80-158, Northrop Corporation, Hawthorne,Calif., October 1980.
N
f .- -,-,,-. , 'z '.- , ."z.' .' .. ".'." , .'.'.',.'.' " ." " -. " .,' '' .'''" .'' ' ' " " " '.' ' *1'

-169-
23. Ramkumar, R. L., and Adams, D. F., "CompressionProperties of Porous Laminates in the Presence of Ply pDrop-offs and Fastener Holes," Northrop Technical ReportNOR 84-1, Northrop Corporation, Hawthorne Calif., March1984.
24. Adams, D. F., Ramkumar, R. L., and Walrath, D. E.,"Analysis of Porous Laminates in the Presence of PlyDrop-offs and Fastener Holes," Northrop Technical Report %-NOR 84-113, Northrop Corporation, Hawthorne, Calif., May1984
25. Dinardo, M. T., and Lagace, P. A., "Buckling andPostbuckling of Laminated Composite Plates with PlyDropoffs," Proceedings of the AIAA/ASME/ASCE/AHS 28thStructures, Structural Dynamics and Materials Conference,Monterey, California, April, 1987, pp. 776-782.
26. Wu, C. M. L., and Webber, J. P. H., "Analysis ofTapered (in Steps) Laminated Plates Under Uniform InplaneLoad," Composite Structures, Vol. 5, 1986, pp. 87-100.
27. Kemp, B. L., and Johnson, E. R., "Response and FailureAnalysis of a Graphite-Epoxy Laminate ContainingTerminating Internal Plies," AIAA Paper 85-0608, 1985.
28. Curry, J. M., Johnson, E. R., and Starnes, J. H., Jr.,"Effect of Dropped Plies on the Strength of Graphite-Epoxy Laminates," Proceedings of the AIAA/ASME/ASCE/AHS28th Structures, Structural Dynamics and MaterialsConference, Monterey, California, April, 1987.
29. Lagace, P. A., and Brewer, J. C., TELAC MaunfacturinqCourse Notes, Edition 0-2, TELAC Report 81-14,Massachusetts Institute of Technology, September 1981.
30. "Standard Test Method for Tensile Properties of Fiber-Resin Composites," ASTM Designation D 3039-76.
31. Lagace, P. A., "Static Tensile Fracture of Graphite/Epoxy,TELAC Report No. 82-5, Department of Aeronautics andAstronautics, Massachusetts Institute of Technology, June1982.
32. Brewer, J. C., Weems, D. B., and Archard, K. A., "TheEffect of Ply Thickness on Delamination Failure ofGraphite/Epoxy Laminates," TELAC Report 84-20,Massachusetts Institute of Technology, 1984.
33. Vizzini, A. J., and Lagace, P. A., "Tebas-TELAC SoftwareUser's Manual," TELAC Report No. 84-14-2, 1984.
' %'
l- _17 -. V- 7 7.. -7- 77 Z-7 Z-77
-170-
34. Vizzini, A. J., "Delamination Failure and CompressionFracture of Graphite/Epoxy", Telac Report No. 86-12,Massachusetts Institute of Technology, May 1986.
35. Lagace, P. A., "Nonlinear Stress-Strain Behavior ofGraphite/Epoxy Laminates," AIAA Journal, Vol. 23,October, 1985, pp. 1583-1589.
.J.I
K*t

-171-
DATA TABLE 1
SUMMARY OF DATA FOR FLAT SPECIMENS
Specimen Thickness EL a
[mm] [GPa] [MPa]
. [±(452)/021s -1 1.48 60.1 712a, -2 1.56 59.9 818
-3 1.57 60.7 817-4 1.57 61.0 809-5 1.55 60.2 838
[±45/012S -1 1.58 62.2 873-2 1.58 63.3 886-3 1.59 63.2 859-4 1.59 64.6 895-5 1.61 62.2 885
[±(452)/OlS -1 1.29 45.4 523-2 1.30 47.4 532-3 1.32 45.6 516-4 1.32 45.8 470-5 1.31 45.7 482
,(±45) 2/02] -1 1.49 53.5 739-2 1.57 62.4 846-3 1.56 59.2 830-4 1.57 64.9 773-5 1.56 63.3 725
[±45/0] -1 .81 54.3 635-2 .84 62.5 893-3 .83 57.6 843-4 .84 59.4 826-5 .83 61.8 825
[±45/02]S -1 1.03 79.3 1034-2 1.06 82.5 1040-3 1.08 87.7 1204-4 1.10 88.5 1142-5 1.07 80.5 1128
[+4 //-+4q1 1 .72 44 .3 461- -2 .72 45.5 549-3 .73 46.0 608-4 .73 43.1 5595- -5 .73 47.2 564

r'
-172-
DATA TABLE I (Continued)
[±(152)/02]S -1 1.52 120.9 6322 1.55 126.9 739-3 1.56 122.7 689-4 1.54 125.8 731-5 1.52 121.9 770
[±15/01 S -2 .83 123.8 8822 .82 121.8 854
-3 .84 124.2 881-4 .83 120.3 893-5 .83 120.7 881
a Indicates specimen tested with a photoelatic coating
A'-
.1w
dq. .. ;., ,-.:, ...-......... .:- ;..

-173-
DATA TABLE 2
SUMMARY OF LONGITUDINAL MODULUS DATA FOR PLY DROPOFF LAMINATES
LONGITUDINAL MODULUS [GPa]
SPECIMEN UNDROPPED SECTION DROPPED SECTION
Tapered Flat Tapered FlatSide Side Side Side
[±45/0/(± 4 5/0)DIS -1 61.5 64.8 59.2 57.9-2 60.4 64.2 60.6 60.3-3 61.8 59.2 57.1 59.2- 4 a 61.7 a b a-5 60.2 63.6 59.5 59.6
[±( 4 52)/O/ODIS -l 59.9 55.8 43.1 42.1-2 66.2 60.9 43.2 45.6-3 60.4 58.8 43.8 44.2-4 58.8 58.8 42.1 43.4-5 56.0 60.3 40.5 30.9
[ -1 49.6 51.9 53.0 51.9-2 64.9 60.2 59.3 60.2-3 59.0 62.5 61.2 59.5-4 61.1 60.9 56.8 56.7-5 58.2 61.5 57.1 56.1
[±45/(±45)/02 -1 56.2 57.8 81.2 78.0-2 59.3 62.1 84.8 83.0-3 64.3 61.7 83.7 80.7-4a 64.3 a 83.1 a
[±45/(± 4 5 )D/0/0D]S -1 56.6 53.9 56.0 57.1-2 64.3 62.4 55.9 58.0-3 60.3 61.0 61.7 60.5-4 61.8 63.0 56.4 61.3-5 54.7 60.3 51.5 60.9
[±4 5/0D/0/-+ 4 51 T -1 56.5 56.1 42.0 39.7-2 58.9 61.7 45.7 41.4-3 60.9 62.2 44.3 45.4-4 67.4 a 51.3 a-5 55.0 61.5 40.7 41.5
I

-174-
DATA TABLE 2 (Continued)
[+15/+15 /-15/-15D/0/0D] -1c 121.1 122.6 125.6 126.1-2 124.8 124.8 124.9 127.2-3c 126.3 129.1 128.4 129.7-4c 126.4 124.3 b 128.9-5c b b b b
a Indicates specimen tested with a photoelastic coatingb No strain datac Geometrically symmetric specimen, no flat or tapered side
-.
p.?
5"
5%
,%.
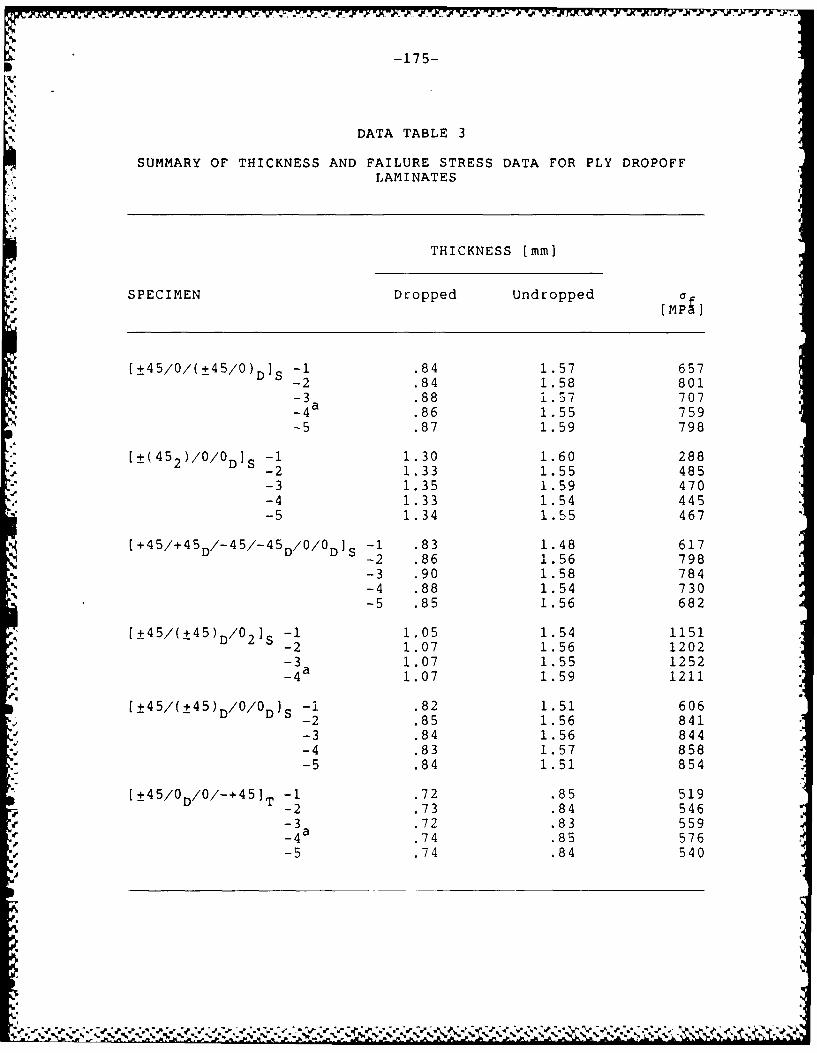
-175-
DATA TABLE 3
SUMMARY OF THICKNESS AND FAILURE STRESS DATA FOR PLY DROPOFFLAMINATES
THICKNESS [mm]
SPECIMEN Dropped Undropped 4(MP J
[± 4 5/0/(± 4 5/0)D]S -1 .84 1.57 657-2 .84 1.58 801-3 .88 1.57 707-4a .86 1.55 759-5 .87 1.59 798
[±( 4 5 2)/0/0D]S -1 1.30 1.60 288-2 1.33 1.55 485-3 1.35 1.59 470-4 1.33 1.54 445-5 1.34 1.55 467
[+45/+45D /-45/-45D/0/0D S -1 .83 1.48 617-2 .86 1.56 798-3 .90 1.58 784-4 .88 1.54 730-5 .85 1.56 682
[± 4 5/(±45)D/02]S -1 1.05 1.54 1151-2 1.07 1.56 1202-3 a31.07 1.55 1252,-4 a 1.07 1.59 1211
[± 4 5/(± 4 5 )D/0/0D)S -i .82 1.51 606-2 .85 1.56 841-3 .84 1.56 844-4 .83 1.57 858-5 .84 1.51 854
[±4 5/0D/0/-+4 51T -1 .72 .85 519-2 .73 .84 546-3 .72 .83 559-4a .74 .85 576-5 .74 .84 540
2
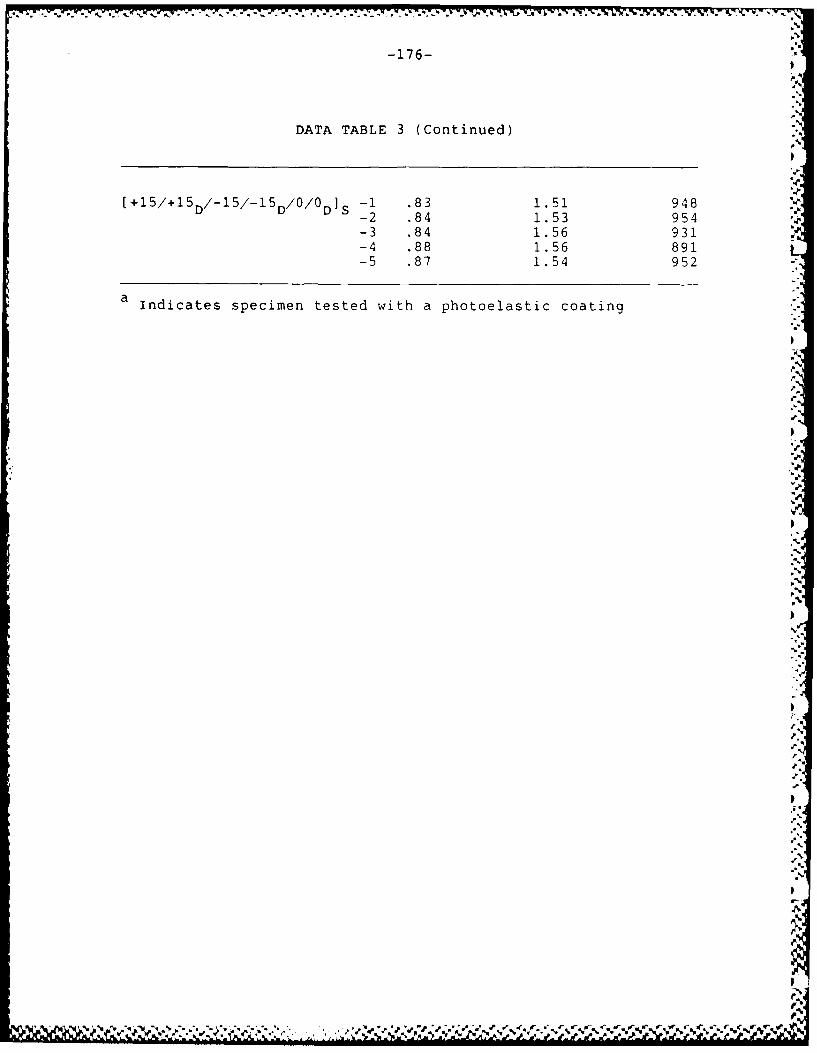
-176- I
...
DATA TABLE 3 (Continued)p
[+-5/+5 D/-15/-15D /0/0D S -1 .83 1.51 948-2 .84 1.53 954-3 .84 1.56 931-4 .88 1.56 891-5 .87 1.54 952
a Indicates specimen tested with a photoelastic coating
' p
.1L €- , ?.., j '.'.' '- -2/" .," ' "€"* 2, • i' £' ' € ..,'-" V . " . .V. .,". < % 'N
a i ~nil~mIII Ni I Ii e i