Embed Size (px)
Citation preview
k-G
test probpracapprprobprac
Group ANC
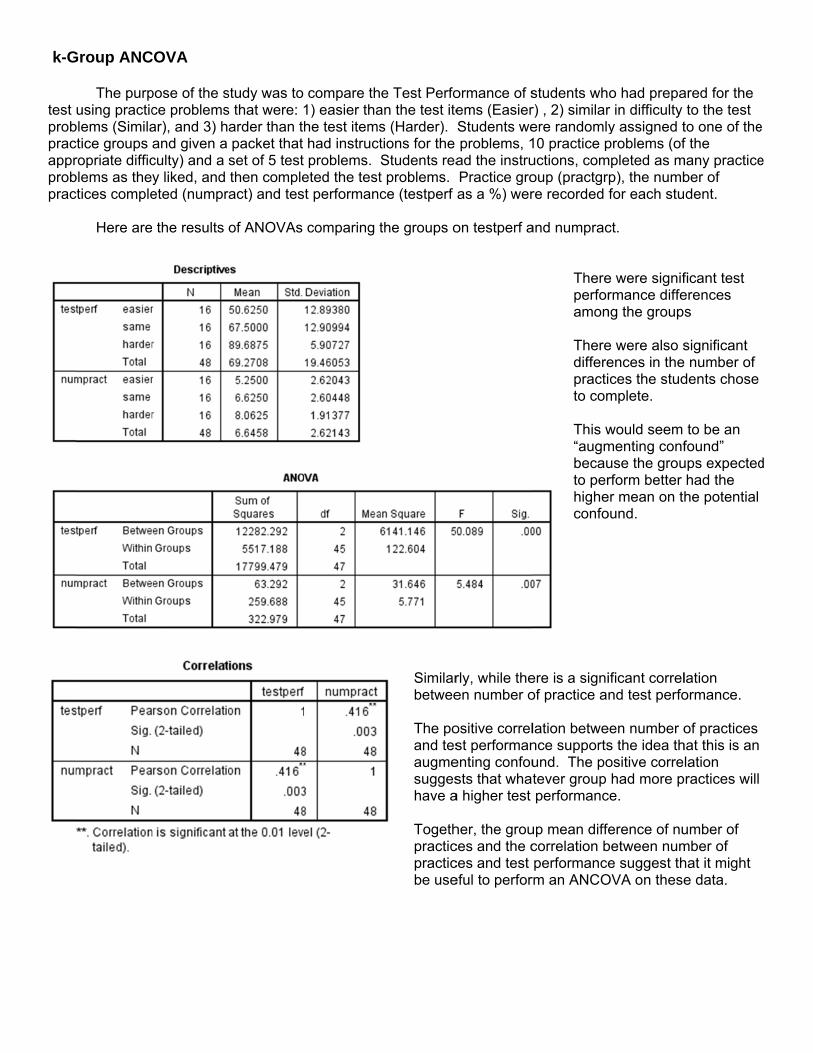
The purpusing practic
blems (Similactice groups ropriate difficblems as thectices comple
Here are
COVA
pose of the sce problemsar), and 3) hand given a culty) and a y liked, and eted (numpr
the results
study was to s that were: 1arder than thpacket that set of 5 test then comple
ract) and tes
of ANOVAs
compare th1) easier thahe test itemshad instructproblems.
eted the testt performanc
comparing t
e Test Perfoan the test ites (Harder). tions for the Students reat problems. ce (testperf
the groups o
Similarbetwee The poand tesaugmesuggeshave a Togethpracticpracticbe use
ormance of sems (EasierStudents weproblems, 1
ad the instruPractice groas a %) wer
on testperf a
rly, while theen number o
ositive correlst performan
enting confousts that wha
a higher test
her, the grouces and the cces and test eful to perfor
students whr) , 2) similarere randomly10 practice puctions, comoup (practgrre recorded
and numprac
Thereperforamon Theredifferepractito com This w“augmbecauto perhigheconfo
ere is a signiof practice a
lation betwence supportsund. The potever group performanc
up mean diffecorrelation bperformance
rm an ANCO
o had prepar in difficulty y assigned tproblems (of
mpleted as mp), the numbfor each stu
ct.
e were signifrmance diffe
ng the group
e were also sences in theces the stud
mplete.
would seem menting confuse the grourform better
er mean on thound.
ificant correlnd test perfo
een number os the idea thositive correhad more p
ce.
erence of nubetween nume suggest th
OVA on these
ared for the to the test
to one of thef the
many practiceber of dent.
ficant test erences s
significant number of
dents chose
to be an found”
ups expectedhad the he potential
lation ormance.
of practices hat this is an lation ractices will
umber of mber of hat it might e data.
e
e
d

Data Preparation – Mean-centering the Covariate It is a good idea to work with “mean-centered” quantitative covariate scores. Mean-centering simplifies the math involved in constructing and plotting the results of the analysis, as well as limiting collinearities among the models terms that can lead to mis-estimation and statistical conclusion errors. Mean-centering is just what it sounds like… You compute a new variable for each person that is their covariate score minus the mean of covariate. compute numpract_cen = numpract - 6.6458. exe. “Kinds” of ANCOVA models Even for this, the simplest type of ANCOVA with a 2-group IV and a single covariate, there are different possible models. Main Effects ANCOVA models include the IV and the Covariate. A main effects model makes the “homogeneity of regression slope” assumption. That is, the model is constructed assuming that the slope of the linear relationship between the covariate and the DV is the same for all IV groups. Put differently, this is an assumption that there is no interaction between the covariate and the IV as they related to the DV. This regression slope homogeneity assumptions makes the comparison of the IV groups simpler, in that, it assumes that the corrected mean DV difference between the groups is the same for all values of the covariate. In terms of this example, the assumption is that the test performance difference between the Easy, Similar and Harder difficulty practice groups is the same for every amount of practice. Full Model ANCOVA models include the IV, the Covariate, and the IV-Covariate interaction. This model does not make the homogeneity of regression slope assumption, and allows there to be different corrected mean DV difference between the groups for different values of the covariate. Just like with factorial ANOVA, often the most important part of the model is the interaction! Also, sometimes, without careful attention to the pattern of the interaction, one or both main effects are misleading. Getting the Main Effects ANCOVA Model Some of the useful output isn’t available using the SPSS GUI, so we will use SPSS syntax code for these analyses. The simplest code for an ANCOVA is shown below. UNIANOVA testperf BY practgrp WITH numpract_cen /METHOD = SSTYPE(3) /EMMEANS = TABLES(practgrp) WITH(numpract_cen= mean) COMPARE (practgrp) /PRINT = DESCRIPTIVE PARAMETER /DESIGN = practgrp numpract_cen.
dv BY iv WITH covariate be sure to use the mean-centered cov uses formulas that work well with ≈n gets dv means for each group corrected for the mean covariate value gets simple effects test for that cov value gets descriptive/uncorrected means and the regression model parameters (we will use to plot the model) specifies that the IV and the Covariate are both in the model (notice the period)

Main
n Effects ANNCOVA output
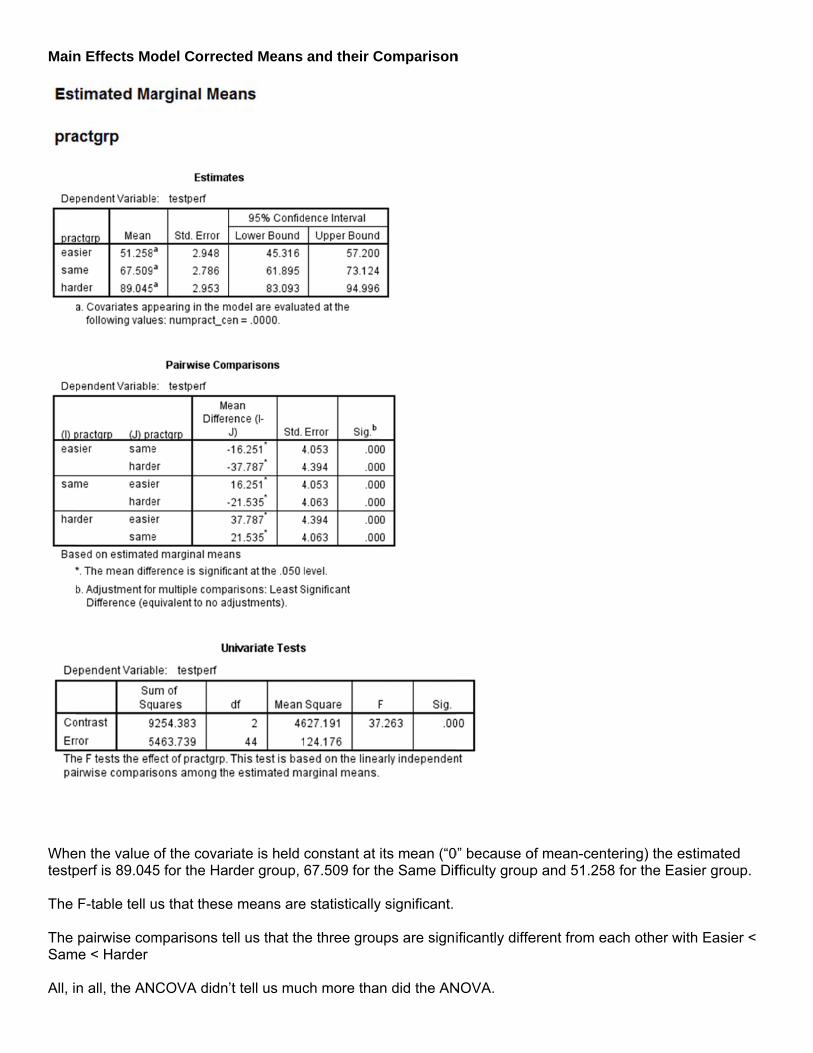
These arperformaANOVA.
The F tapractgrp of practic
There is betweengroup me
Notice thin this ANANOVA didn’t adwon’t cha
The para“expresstable, buregressiothis table
Becauseslope asthe numpgroups. For eachANOVA
re the same ance means
ble shows theffect after
ces.
not a signifin numpract aembership i
hat the SSerNCOVA modmodel, tellin
dd much to thange the gro
ameter estimsion” of the inut presented on weights. e to plot the
e of the homsumption thpract_cen te
h t-test, df = model just a
(uncorrectewe got from
hat we havecontrolling f
cant relationand testperf, nto account
rror is not mudel than in thng us that thhe model, anoup compari
mates are annformation inas t-tests of We will primmodel.
ogeneity of e regression
ells the slope
44, the dferabove.
ed) m the
a significanfor number
nship after taking
.
uch smaller he original e covariate nd probably ison much.
nother n the F f the multiple
marily use
regression n weight for e for all three
ror from the
t
e
e
Main
Whetestp The The Sam All, i
n Effects Mo
en the value perf is 89.04
F-table tell u
pairwise comme < Harder
n all, the AN
odel Correc
of the covar5 for the Ha
us that these
mparisons te
NCOVA didn
cted Means
riate is held rder group,
e means are
ell us that th
’t tell us muc
and their C
constant at 67.509 for th
e statistically
e three grou
ch more tha
Comparison
its mean (“0he Same Dif
y significant.
ups are signi
n did the AN
n
0” because officulty group
ificantly diffe
NOVA.
of mean-centp and 51.258
erent from ea
tering) the e8 for the Eas
ach other wi
estimated sier group.
ith Easier <
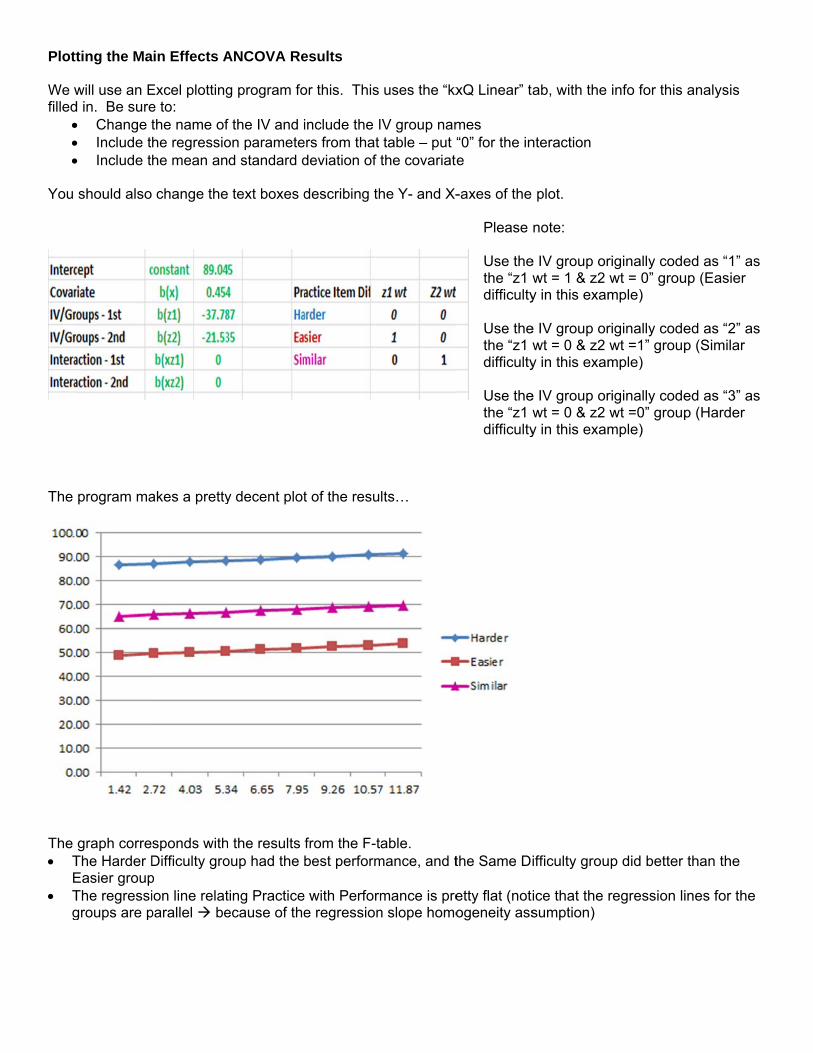
Plott We wfilled
You
The
The T
E T
g
ting the Ma
will use an Ed in. Be sure Change t Include t Include t
should also
program ma
graph correThe Harder DEasier groupThe regressigroups are p
ain Effects A
Excel plottinge to: the name ofhe regressiohe mean an
change the
akes a pretty
sponds withDifficulty grop ion line relat
parallel be
ANCOVA Re
g program fo
f the IV and ion parameted standard d
text boxes d
y decent plot
the results oup had the
ting Practiceecause of the
esults
or this. This
include the Iers from that deviation of
describing th
t of the resu
from the F-tbest perform
e with Performe regression
uses the “kx
IV group namtable – put the covariate
he Y- and X-
lts…
able. mance, and t
mance is pren slope homo
xQ Linear” ta
mes “0” for the ine
-axes of the
Please Use thethe “z1 wdifficulty Use thethe “z1 wdifficulty Use thethe “z1 wdifficulty
the Same Di
etty flat (notogeneity ass
ab, with the
nteraction
plot.
note:
e IV group orwt = 1 & z2 y in this exam
e IV group orwt = 0 & z2 y in this exam
e IV group orwt = 0 & z2 y in this exam
ifficulty grou
ice that the sumption)
info for this
riginally codewt = 0” groumple)
riginally codewt =1” groupmple)
riginally codewt =0” groupmple)
up did better
regression li
analysis
ed as “1” as up (Easier
ed as “2” as p (Similar
ed as “3” as p (Harder
than the
ines for the

Getting the Full Model ANCOVA There only a couple of differences when asking SPSS for the full model ANCOVA including the interaction term. First, you will include the interaction term in the “DESIGN” subcommand. Represent this by listing the IV and Covariate, with “*” between them numpract_cen*practgrp (be sure to use the centered covariate) Second, since the model allows for an interaction, and the slopes of the regression lines might be different, the corrected group mean difference may be different for different values of the covariate (i.e., different practgrp simple effects for different values of numpract). So, it is usually a good idea to ask for group comparisons at several values of the covariate. For this analysis, it makes sense to ask for group comparisons for 1, 3, 5, 7, & 9 practices. However, remember that the number of practices variable we’ve included in the model has been mean-centered. So, we have to take that mean centering into account!
1 raw practices corresponds with a mean-centered value of 1 – 6.6458 = -5.6458 3 raw practices corresponds with a mean-centered value of 3 – 6.6458 = -3.6458 5 raw practices corresponds with a mean-centered value of 5 – 6.6458 = -1.6458 7 raw practices corresponds with a mean-centered value of 7 – 6.6458 = .3542 9 raw practices corresponds with a mean-centered value of 9 – 6.6458 = 2.3542
UNIANOVA testperf BY practgrp WITH numpract_cen /METHOD = SSTYPE(3) /EMMEANS = TABLES(practgrp) WITH (numpract_cen = -5.6458) COMPARE (practgrp) /EMMEANS = TABLES(practgrp) WITH (numpract_cen = -3.6458) COMPARE (practgrp) /EMMEANS = TABLES(practgrp) WITH (numpract_cen = -1.6458) COMPARE (practgrp) /EMMEANS = TABLES(practgrp) WITH (numpract_cen = .3542) COMPARE (practgrp) /EMMEANS = TABLES(practgrp) WITH (numpract_cen = 2.3542) COMPARE (practgrp) /PRINT = DESCRIPTIVE PARAMETER /DESIGN=practgrp numpract_cen numpract_cen*practgrp.
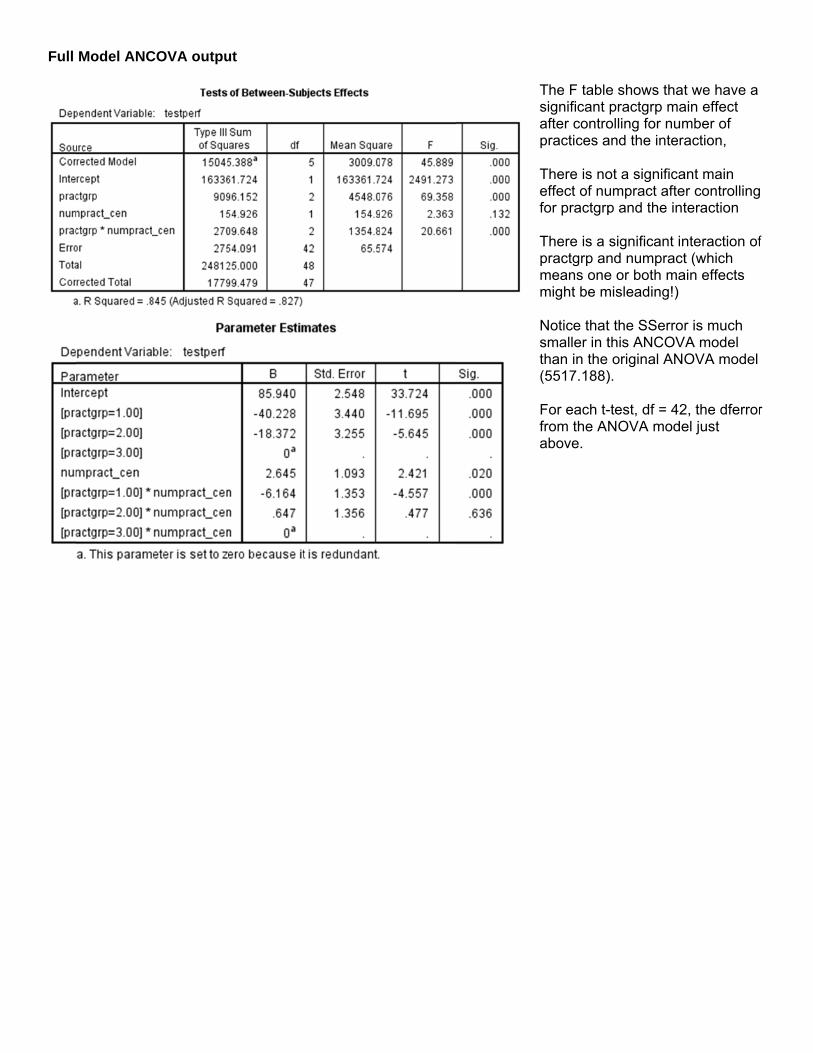
Full
Model ANCCOVA outpuut
The F tablesignificant after contropractices a There is noeffect of nufor practgrp There is a practgrp anmeans onemight be m Notice thatsmaller in tthan in the (5517.188) For each t-from the ANabove.
e shows thatpractgrp maolling for numand the intera
ot a significaumpract aftep and the int
significant innd numpracte or both ma
misleading!)
t the SSerrorthis ANCOVoriginal ANO
).
-test, df = 42NOVA mode
t we have a ain effect mber of action,
ant main er controllingteraction
nteraction oft (which
ain effects
r is much VA model
OVA model
2, the dferrorel just
f
r
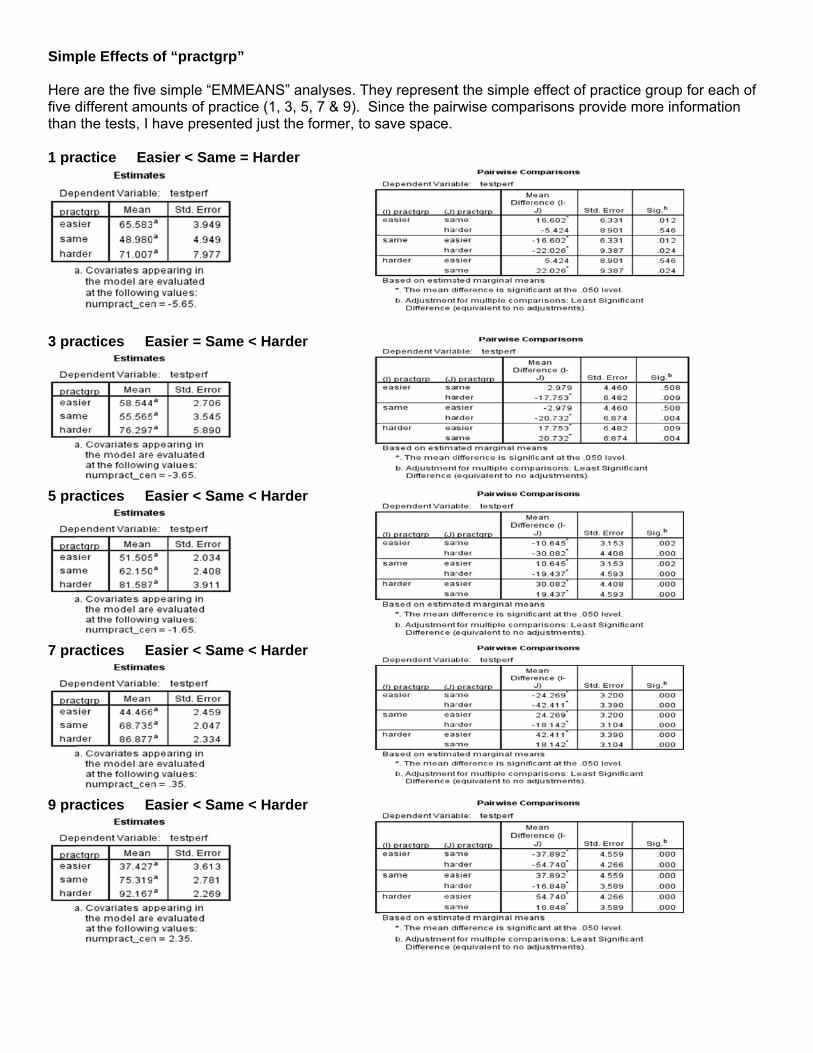
Simp Herefive dthan 1 pra
3 pra
5 pra
7 pra
9 pra
ple Effects
e are the fivedifferent am the tests, I
actice Ea
actices E
actices E
actices E
actices E
of “practgr
e simple “EMounts of prahave presen
asier < Sam
Easier = Sam
Easier < Sam
Easier < Sam
Easier < Sam
rp”
MMEANS” anactice (1, 3, 5nted just the
e = Harder
me < Harder
me < Harder
me < Harder
me < Harder
nalyses. The5, 7 & 9). Siformer, to s
r
r
r
r
ey representnce the pair
save space.
t the simple rwise compa
effect of praarisons provi
actice group ide more info
for each of ormation

Simp The regre The ANC f
c f
o b
o To gvaria Gett reco UNIAnum/MET/PRI/DESnum Gett reco UNIAnum /ME /PR /DEnum
The Hard Simi Easi
ple Effects
simple effecession line fo
problem is tCOVA from the ANOcovariate-DVfrom the Paroriginally codbut, we don’originally cod
get the slopeable, and the
ing regressio
de practgrp
ANOVA tespract_cen THOD = SSTNT = PARA
SIGN=practgpract_cen*p
ing regressio
de practgrp
ANOVA tespract_cen
ETHOD = SSRINT = PARAESIGN=pracpract_cen*p
models rela
der group
lar group
er group t
of “numpra
ct of the quaor that group
that we only
OVA table wV regressionrameter Estimded “3” (Har’t get the moded “1” (Eas
e of the covaen rerun the
on model fo
(1=3) (2=2)
stperf BY
TYPE(3) AMETER grpSHE nupractgrpSHE
on model fo
(1=1) (2=3)
stperf BY
STYPE(3) AMETER
ctgrpEHS npractgrpEHS
ating Numbe
testperf’ = (
testperf’ = (
testperf’ = (
act”
ntitative varip.
get part of t
we get the F- line is signimates table,der practice
odel or signifsier) or the g
riate-DV regANCOVA, u
r Easier grou
(3=1) into p
practgrpSHE
mpract_cenE.
r Similar gro
(3=2) into p
practgrpEHS
umpract_ceS.
r of Practice
2.645 * num
3.292 * num
-3.519 * num
iable for eac
the informati
-test of the inficantly diffe, we get the ) and an t-teficance test f
group origina
gression lineusing the rec
up
practgrpSHE
E WITH
oup
practgrpEHS
S WITH
en
es to Test Pe
mpract_cen )
mpract_cen )
mpract_cen
ch IV group i
on we need
nteraction, werent for the
model the cest of whethefor the covar
ally coded “2
e for the groucoded group
E.
S.
erformance f
) + 85.940
) + 67.568
) + 45.713
is represente
to describe
which tells usthree groups
covariate-DVer the slope riate-DV reg
2”(Similar).
up coded “1”p variable.
for the three
the slope is
the slope is
the slope is
ed as the slo
e the interact
s whether ors
V regression is significan
gression line
”, we have to
e groups are:
s significantl
s significantl
s significantl
ope of the co
tion this way
r not the slo
line for the gntly different e for either th
o recode the
:
y positive p
y positive p
ly negative
ovariate-DV
y from the
ope of the
group from 0 (flat)
he group
e group
p =.02
p <.001
p <.001
.
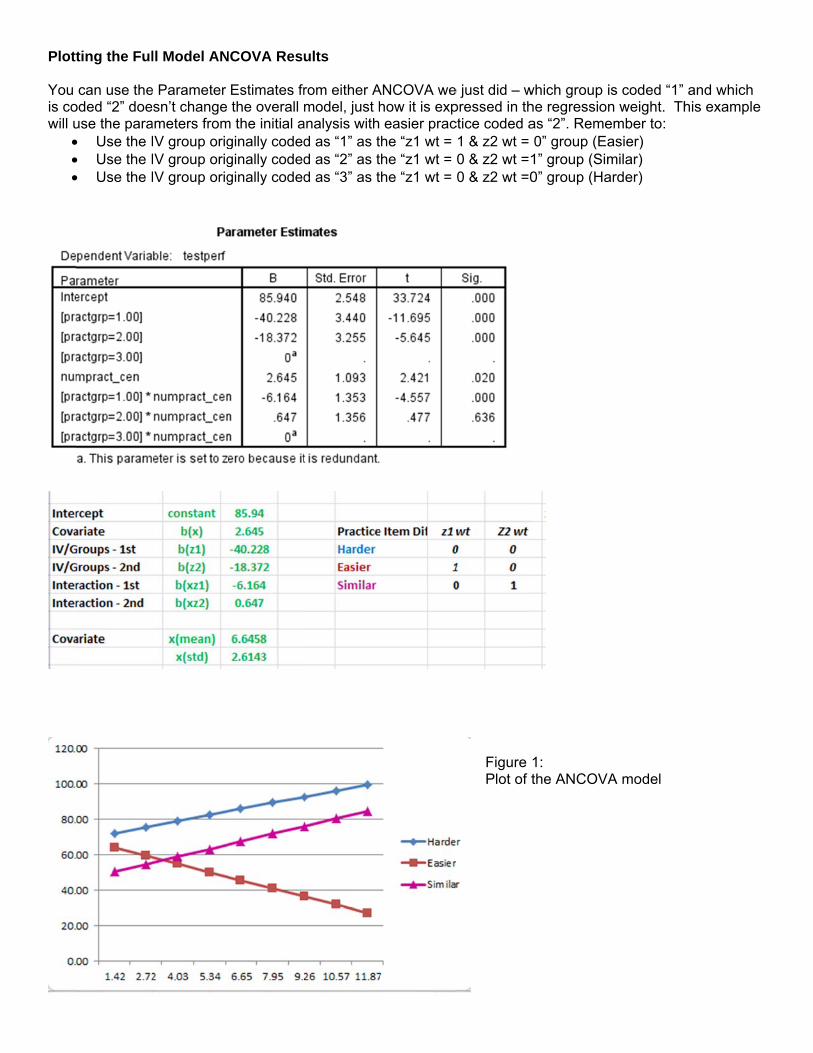
Plott You is cowill u
ting the Ful
can use theoded “2” doeuse the para Use the I Use the I Use the I
ll Model AN
e Parameter esn’t change ameters fromIV group origIV group origIV group orig
NCOVA Resu
Estimates frthe overall m
m the initial aginally codedginally codedginally coded
ults
rom either Amodel, just h
analysis with d as “1” as td as “2” as td as “3” as t
ANCOVA wehow it is expeasier prac
he “z1 wt = he “z1 wt = he “z1 wt =
e just did – wpressed in thctice coded a1 & z2 wt = 0 & z2 wt =10 & z2 wt =0
Figure Plot of t
which group ihe regressionas “2”. Reme0” group (Ea
1” group (Sim0” group (Ha
1: the ANCOVA
is coded “1” n weight. Thember to: asier) milar) arder)
A model
and which his example
Write-up for the ANCOVA
An ANCOVA was performed including Practice Difficulty Group (Easier, Similar & Harder Difficulty), Number of Practices and their interaction. The plot of the ANCOVA model is shown in Figure 1.
There is an interaction of Practice Item Difficulty and Number of Practices as they relate to Test Performance, F(2, 42) = 20.661, MSe = 65.574, p < .001. The pattern of the interaction is that, as can be seen in Figure 1, the Harder and Easier groups performed significantly better than the Similar group following 1 practice, the Harder group perform significantly better than the Same and Easier groups following 3 practices, and following 5, 7 & 9 practices, the Harder group performed best while the Easier group performed poorest.
An alternative description of the pattern of the interaction is that the slope of the Number of Practice regression line is positive for the Harder, b = 2.645, p = .02, and Similar, b = 3.292, p < .001, groups, while this slope is negative for the Easier group, b = -3.519, p < .001.
The main effect for Number of Practices was non-significant, F(1,42)= 2.363, MSe = 65.574, p = .132. However this main effect was not descriptive for any of the three Practice Difficulty groups, because of the pattern of the interaction. Although there is no relationship between number of practices and test performance on average, there was a positive relationship for the Harder and Similar groups and a negative relationship for Easier group.
The main effect of Practice Group was significant, F(1,42) = 69358, MSe = 65.574, p < .001. However, this main effect was not descriptive, as whether the pattern of Test Performance differences among the groups changed with the Number of Practices.


![Overview of Stata estimation commands · [U] 27 Overview of Stata estimation commands3 27.3 Continuous outcomes 27.3.1 ANOVA and ANCOVA ANOVA and ANCOVA fit general linear models](https://img.dokumen.tips/doc/110x75/5e84977f61452326865f32a4/overview-of-stata-estimation-commands-u-27-overview-of-stata-estimation-commands3.jpg)