Embed Size (px)
Citation preview

Please cite this paper as:
Palumbo, G. et al. (2013), “The Economics of Civil Justice:New Cross-country Data and Empirics”, OECD EconomicsDepartment Working Papers, No. 1060, OECD Publishing.http://dx.doi.org/10.1787/5k41w04ds6kf-en
OECD Economics Department WorkingPapers No. 1060
The Economics of CivilJustice
NEW CROSS-COUNTRY DATA AND EMPIRICS
Giuliana Palumbo, Giulia Giupponi,Luca Nunziata, Juan S. Mora Sanguinetti
JEL Classification: D02, K40, K41

Unclassified ECO/WKP(2013)52 Organisation de Coopération et de Développement Économiques Organisation for Economic Co-operation and Development 14-Aug-2013 ___________________________________________________________________________________________
English - Or. English ECONOMICS DEPARTMENT
THE ECONOMICS OF CIVIL JUSTICE: NEW CROSS-COUNTRY DATA AND EMPIRICS ECONOMICS DEPARTMENT WORKING PAPERS No. 1060
By Giuliana Palumbo, Giulia Giupponi, Luca Nunziata and Juan S. Mora-Sanguinetti
All Economics Department Working Papers are available through OECD's Internet website at http://www.oecd.org/eco/Workingpapers
JT03343606
Complete document available on OLIS in its original format This document and any map included herein are without prejudice to the status of or sovereignty over any territory, to the delimitation of international frontiers and boundaries and to the name of any territory, city or area.
ECO
/WK
P(2013)52 U
nclassified
English - O
r. English

ECO/WKP(2013)52
2
Abstract/Résumé
The economics of civil justice: new cross-country data and empirics
Combining existing information with a newly collected dataset, the paper develops indicators of the performance and the institutional characteristics of OECD judicial systems. It provides cross-country comparisons of measures of trial length, accessibility to justice services and predictability of decisions. It then investigates how trial length is related to some of the underlying characteristics of the systems. There is a large cross-country variation in trial length and in appeal rates (a proxy of the predictability of decisions), which are only partially explained by restrictions to appeal. Cross-country differences in trial length are related to the shares of the justice budget devoted to computerisation, the systematic production of statistics on case-flow, the active management of the progress of cases by courts, the presence of specialised commercial courts and systems of court governance assigning greater managerial responsibilities to the chief judge. Indicators of good public governance are associated with lower litigation, which in turn has a significant impact on trial length. Free negotiation of lawyers’ fees, as opposed to regulated fees, appears to be associated with lower litigation.
JEL classification codes: K40; K41; D02. Key words: judicial performance; trial length; appeal rates; accessibility; litigation; institutional characteristics of judicial systems.
************
L'économie de la justice civile: nouvelles données comparatives et analyse empirique
En combinant l’information existante avec une nouvelle base de données, le document produit des indicateurs qui mesurent la performance et les caractéristiques institutionnelles des systèmes judiciaires de l’OCDE. Ceci permet une comparaison internationale de la performance des systèmes . Le document examine ensuite la façon dont la durée des procédures est liée aux caractéristiques sous-jacentes des systèmes concernés. Il existe une grande variation entre les pays en ce qui concerne la durée des procès, qui semble être liée à la part du budget de la justice consacrée à l’informatisation, à la production systématique de statistiques et à la gestion active des dossiers par les tribunaux, à la présence de tribunaux de commerce spécialisés et aux responsabilités de gestion assignées au juge principal. Une gouvernance publique de bonne qualité, réduit le recours aux procédures judiciaires, ce qui à son tour a un impact significatif sur la durée des procédures. La libre négociation des honoraires des avocats est associée à un moindre taux de procédures judiciaires.
Classification JEL : K40 ; K41 ; D02. Mots clefs : fonctionnement de la justice ; durée de procès ; taux d'appel ; accessibilité ; taux de litige ; caractéristiques des systèmes judiciaires. © OECD (2013) You can copy, download or print OECD content for your own use, and you can include excerpts from OECD publications, databases and multimedia products in your own documents, presentations, blogs, websites and teaching materials, provided that suitable acknowledgment of OECD as source and copyright owner is given. All requests for commercial use and translation rights should be submitted to [email protected].

ECO/WKP(2013)52
3
TABLE OF CONTENTS
THE ECONOMICS OF CIVIL JUSTICE: NEW CROSS-COUNTRY DATA AND EMPIRICS ............... 5
1. Introduction ............................................................................................................................................. 5 2. Conceptual framework ............................................................................................................................ 9
2.1 Defining judicial performance ........................................................................................................... 9 2.2 A demand-supply approach ............................................................................................................... 9
3. Comparing civil justice outcomes ......................................................................................................... 13 3.1 Trial length....................................................................................................................................... 13 3.2 Accessibility .................................................................................................................................... 14 3.3 Predictability of court decisions ...................................................................................................... 18
4. Exploring the determinants of some civil justice outcomes .................................................................. 24 4.1 Supply side factors ........................................................................................................................... 25
4.1.1 Financial resources .................................................................................................................... 25 4.1.2 Production structure .................................................................................................................. 29 4.1.3 Governance structure ................................................................................................................ 33
4.2 Demand side factors ........................................................................................................................ 36 4.2.1 External factors ......................................................................................................................... 38 4.2.2 Internal factors .......................................................................................................................... 42 4.2.3 Other factors influencing the demand for justice ...................................................................... 44
5. Conclusion ............................................................................................................................................. 45
REFERENCES ............................................................................................................................................. 46
ANNEX 1. DETAILS ON THE CONSTRUCTION OF THE CIVIL JUSTICE INDICATORS ............... 49
A.1 Treatment of federal countries ............................................................................................................ 49 A.2 Civil justice indicators ........................................................................................................................ 49
ANNEX 2. BACKGROUND ANALYSIS ................................................................................................... 54
Tables
1. Measures of trial length ......................................................................................................................... 16 2. Restrictions to appeal before the second instance and the highest court by legal origin ....................... 22 3. The allocation of public budget across budgetary items ....................................................................... 27 4. The availability of assistance to judges is associated with shorter trial length ..................................... 31 5. Governance models and trial length ...................................................................................................... 37 6. Trial length is positively and significantly related to litigation per capita ............................................ 38 7. The sectoral composition of the economy has a significant impact on litigation .................................. 39 8. Government effectiveness, regulatory quality and the integrity of the public sector are significantly associated with litigation ........................................................................................................................... 41 9. Litigation is significantly associated with unitary cost of trial and the free negotiation of lawyers' fees42 A2.1 Classification of national legal systems into major legal origins ..................................................... 54

ECO/WKP(2013)52
4
A2.2 The productivity of judges is greater where investment in computerisation and computer skills in the population are higher ........................................................................................................................... 54 A2.3 Trial length is positively and significantly related to litigation per capita ....................................... 55 A2.4 Trial length is positively and significantly related to litigation per capita: an IV approach ............. 55 A2.5 Influence of the recent crisis on log litigation per capita .................................................................. 56 A2.6 Freely-negotiated lawyers' fees are associated with lower trial costs ............................................... 56
Figures
1. Factors acting in the market for justice ................................................................................................. 10 2. Trial length in days ................................................................................................................................ 14 3. Trial length in first and second instance ................................................................................................ 15 4. Measure of trial cost net of legal aid ..................................................................................................... 17 5. Trial length and trial cost net of legal aid .............................................................................................. 18 6. Appeal rates before the second instance ................................................................................................ 19 7. Appeal rates before the second instance as a percentage of population ................................................ 20 8. Appeal rates before the highest court .................................................................................................... 21 9. Appeal rates before the highest court as a percentage of population .................................................... 22 10. Appeal rates before the second instance as a percentage of population by type of restrictions .......... 23 11. Appeal rates before the highest court as a percentage of population by type of restrictions............... 24 12. Budget allocated to courts as a percentage of GDP ............................................................................ 26 13. ICT justice budget and judicial performance ...................................................................................... 28 14. Commercial court specialisation and judicial performance ................................................................ 30 15. Implementation of information and communication technology ........................................................ 32 16. Caseflow management and judicial performance ................................................................................ 34 17. Production of statistics and judicial performance ............................................................................... 35 18. Litigation rates ..................................................................................................................................... 37 19. Litigation and trust .............................................................................................................................. 40 A1.1 DB and OECD trial length, first instance ......................................................................................... 53 A2.1 Distribution of accountability and authority ..................................................................................... 57
Boxes
Box 1. Empirical evidence on the main determinants of judicial efficiency and its effects on economic performance ................................................................................................................................................. 7 Box 2. The OECD, CEPEJ and DB datasets ............................................................................................... 8 Box 3. Trial length and confidence in justice ............................................................................................ 12
The statistical data for Israel are supplied by and under the responsibility of the relevant Israeli authorities. The use of such data by the OECD is without prejudice to the status of the Golan Heights, East Jerusalem and Israeli settlements in the West Bank under the terms of international law.

ECO/WKP(2013)52
5
THE ECONOMICS OF CIVIL JUSTICE: NEW CROSS-COUNTRY DATA AND EMPIRICS
By Giuliana Palumbo, Giulia Giupponi, Luca Nunziata, Juan S. Mora-Sanguinetti1
1. Introduction
1. As emphasised by a large body of empirical evidence (Box 1), well-functioning judiciaries are a crucial determinant of economic performance. They promote the efficient production and distribution of goods and services by securing two essential prerequisites of market economies: security of property rights and enforcement of contracts. Security of property rights gives agents incentives to save and invest, by protecting returns from these activities. This enhances the development and deepening of financial and credit markets, innovation efforts and increases the ability of countries to attract investments. A good enforcement of contracts stimulates agents to enter into economic transactions, by dissuading opportunistic behaviour and reducing transaction costs. This has a positive impact on growth through various channels. It promotes competition by encouraging buyers to enter into transactions with sellers without established reputation; facilitates firm growth by fostering investments and innovation, lessening financial constraints and enhancing decentralisation in organisations; increases efficiency by promoting market transactions relative to hierarchical organisations. Conversely, weak contract enforcement could lead firms to adopt inefficient technologies (for example those that minimise dependence on other firms), with detrimental effects on productivity. The quality of contract enforcement is also an important determinant of the direction of trade flows. Countries with better contract enforcement tend to specialise in sectors that are more dependent on good institutions, that is, those where relationship-specific investments are more important.
2. However, judicial systems can suffer from inefficiencies, which may be sufficiently serious to have a negative impact on economic performance. Even though in the OECD area the average length of civil proceedings is around 240 days in first instance, in some countries a trial may require almost twice as many days to be resolved. On top of being lengthy, judicial decisions are sometimes too uncertain, inducing litigants to undergo a long process of appeal before the higher courts, which in some cases may last more than 7 years. This paper suggests that, independent of the fundamental features of different legal systems (e.g. civil law vs. common law), such inefficiencies are related to specific characteristics that contribute to shape incentives – for courts (judges and staff) to perform efficiently and for lawyers to correctly channel the demand of judicial services and supply the right quantity and quality of service – and that could effectively be addressed by structural reforms. The goal of this paper is precisely to investigate the links between such characteristics and outcomes, while taking procedural rules and legal origins as given.
1 Giuliana Palumbo (corresponding author) ([email protected]) from the Bank of Italy, Giulia Giupponi
([email protected]) from Bocconi University, Luca Nunziata ([email protected]) from the University of Padua and IZA, Juan S. Mora-Sanguinetti ([email protected]) from the Bank of Spain. The authors would like to thank Giuseppe Nicoletti for supervising the project and for insightful suggestions throughout the analysis, and Magda Bianco for support and helpful comments. Special thanks to Andrea Tiseno for methodological insights. Additional thanks to Bruno Deffains, Jørgen Elmeskov, Silvia Giacomelli, Pablo Hernández de Cos, Szuszanna Lonti, Natalia Nolan Flecha, Paul O’Brian, Jean-Luc Schneider, Paolo Sestito, and Tatyana Teplova for valuable inputs, and Catherine Chapuis and Irene Sinha for statistical and editorial assistance. The authors are also most grateful to the European Commission for the Efficiency of Justice (CEPEJ) for providing access to their dataset and for their cooperation. The project was supported by the Bank of Italy and the Bank of Spain. Financial support from the Presidency of the Council of Ministers of Italy is also gratefully acknowledged. The views expressed in this paper are those of the authors and do not necessarily reflect those of the OECD and its member countries, the Bank of Italy or the Bank of Spain.

ECO/WKP(2013)52
6
3. The analysis uses a new dataset and a new set of indicators measuring the performance and the institutional features of judicial systems across a subset of OECD and non-member countries. Based on this information, it informs about the different functioning of judicial systems in the OECD area and provides a preliminary investigation of how selected measures of judicial performance are related to some of the underlying characteristics of the systems. Some tentative policy recommendations for reforms to raise efficiency in the civil justice area are inferred from the analysis.
4. The OECD dataset covers 35 legal systems of 31 OECD countries, one key partner and one accession country. The discrepancy reflects the fact that, among the surveyed countries, the United Kingdom has a distinct legal jurisdiction for each of the sub-national entities (England and Wales, Northern Ireland, and Scotland). The dataset complements, extends and refines (in some areas) existing data provided by other international institutions, such as the European Commission for the Efficiency of Justice (CEPEJ), which covers Council of Europe countries, and the World Bank, which has a narrower focus but wider country coverage. The data cover the whole civil justice domain and are based on information provided by national authorities (Box 2). The CEPEJ data and the World Bank Doing Business (DB) indicators have been used in various parts of the analysis to extend time and country coverage, investigate aspects that are not covered by the OECD dataset, or when this was found methodologically more appropriate.
5. The performance of judicial systems comprises various dimensions, including independence and fairness of adjudication. Here, the focus is mainly on trial length, with the related dimensions of accessibility to justice services and predictability of judicial decisions. There are two main motives for this choice. First, the fundamental reason for looking at judicial systems from an economic standpoint is to assess their ability to work as institutions that sustain the proper functioning of markets. Timeliness and predictability of judicial decisions and accessibility to the service are essential properties in this respect. Second, these dimensions can be quantitatively measured and therefore lend themselves to cross-country comparisons.
6. A reasonable trial length is not only a desirable property per se, but it is also important to achieve good performance in other dimensions, including access to the service and predictability of decisions. In light of this, the investigation of the relationship between performance and characteristics of judicial systems concentrates on length. The analysis takes an efficiency perspective. The goal is to identify causes of inefficiencies in the use of resources that might be responsible for low productivity or high litigation rates and that, if addressed, might improve the speed of dispute resolution, while not bringing a priori prejudice to other performance dimensions.
7. The analysis provides comparative information possibly useful for decision-makers in designing and assessing judicial reforms, in a field plagued by scarcity of cross-country data. At the same time, remaining flaws in the available data and their cross-sectional nature imposed constraints to the type of empirical analysis that could be carried out. Therefore, caution should be applied in the interpretation of the results.
8. The paper is structured as follows: after describing the different dimensions that concur to the efficiency and the effectiveness of judicial systems, Section 2 frames the approach taken in this study. Section 3 benchmarks the relative performance of judicial systems in the OECD area along the chosen dimensions. Section 4 looks at the proximate and institutional determinants of civil justice outcomes. It analyses supply and demand side factors that influence the performance of judicial systems, focusing on trial length, as well as, to a lesser extent, the productivity of judges and litigation rates. Section 5 concludes by pointing to data shortcomings and suggesting ways to improve the policy relevance of future work in this area.

ECO/WKP(2013)52
7
Box 1. Empirical evidence on the main determinants of judicial efficiency and its effects on economic performance
This box reviews recent studies examining the factors that influence court performance as well as some of the evidence concerning the impact of judicial efficiency on economic performance.
Determinants of court performance
Procedural formalism – Djankov et al. (2003) show that procedural formalism is detrimental to court performance and that the degree of formalism is associated with the legal origin: French law countries are the most formal, while the least so are those of common law tradition. Yet, the impact of higher formalism on trial length may well not be unequivocal. For instance, in Spain the reduction of formalism granted by the civil procedural law reform in 2000 may have increased trial length through increased demand of judicial services (Mora-Sanguinetti, 2010). Using the CEPEJ dataset, Voigt and El-Bialy (2012) do not find any significant correlation between the degree of procedural formalism and the resolution rate (number of resolved cases divided by the caseload), once controlling for legal origins.
Supply and demand influencing factors – A second group of studies analyses possible determinants of civil justice inefficiencies by looking at either the demand or the supply side of the market. Among demand-side studies, the papers by Carmignani and Giacomelli (2010), and Buonanno and Galizzi (2010), using Italian data, find a positive and causal relationship between the number of lawyers and the level of litigation, supporting the hypothesis of induced demand. Ginsburg and Hoefker (2006) obtain similar results for the case of Japan. Several other factors may play a role. For instance, higher uncertainty on judicial outcomes seems to affect, and potentially increase, demand (Dari Mattiacci and Deffains, 2007). On the supply side, various papers analyse the impact of judicial resources (Buscaglia and Dakolias, 1999, Rosales-López, 2008, Cross and Donelson, 2010), salaries (Buscaglia and Dakolias, 1999, Deyneli, 2012), specialisation of courts (Garoupa et al. 2010; Voigt and El Bialy, 2012), size of courts (Marchesi, 2003; Voigt and El Bialy, 2012), presence of judicial councils and judges’ incentives (Voigt and El Bialy, 2012) on various measures (subjective and objective) of court performance. In general, these studies agree on the absence of a clear-cut relationship between budget and performance. However, Deyneli (2012) finds a positive effect of increasing judicial salaries. Buscaglia and Dakolias (1999) argue that such an increase is effective only if underpinned by the introduction of judicial reform indicators to track efficiency and its improvement. They also argue that investments in infrastructure and information technology are the most effective means to increase clearance rates and reduce expected length.
Impact of judicial efficiency on economic performance
Competition – Johnson et al. (2002) show that a timely enforcement of contracts promotes competition by encouraging buyers to enter into transactions with sellers lacking established reputation, and in this way reducing barriers to entry.
Firm growth and specialisation – Kumar et al. (2001), analysing firm level data for 15 European countries, find that more efficient judicial systems are associated with larger firms and that this effect is more pronounced for low capital-intensive firms. The finding is explained by the fact that a more sophisticated legal system is necessary to protect intangible assets, like reputation or client relationships. Beck et al. (2006), using firm level data on the largest industrial firms in 44 countries, find that firm size is positively associated with institutional development (including judicial efficiency) and with the development of financial intermediaries. Similar findings have been produced in analyses exploiting within-country variations. Laeven and Woodruff (2007) and Dougherty (2012), using an instrumental variable approach, document a positive impact of judicial efficiency on firm size in Mexico, and García-Posada and Mora-Sanguinetti (2013) obtain similar findings for Spain. Using an identification strategy based on spatial discontinuity design, Giacomelli and Menon (2013) suggest that if the length of Italian civil proceedings decreased by 10%, average firm size in the country may increase by around 2%, everything else equal.
Investment and specialisation – Chemin (2012) uses a court reform implemented in India in 2002 to show that increased court speed reduces breach of contracts and influences firms’ investment decisions, encouraging purchases of plant and machinery assets. Nunn (2007) finds evidence that shorter length of trials fosters the specialisation in industries where relationship-specific investments are most important. Potential reverse causality is corrected by instrumenting trial length with legal origins.
Credit markets - Djankov et al. (2008) provide evidence that better debt enforcement (in terms of time, cost and percentage of credit recovery in bankruptcy or insolvency procedures) enhances the development of debt markets. Exploiting cross-country variation, different papers (Bae and Goyal, 2009; Qjan and Strahan, 2007, among others) document that better contract enforcement induces credit suppliers to increase loan size, lengthen loan maturity, and reduce loan spreads. This effect has also been found exploiting the variance of judicial efficiency at the national level (Jappelli et al., 2005, for Italy; Fabbri, 2010, for Spain; Shvets, 2012, for Russia). Demirgüç-Kunt and Maksimovic (1998) show that better contract enforcement increases firms' use of external financing to fund growth.
Other effects - Malfunctioning judicial systems hamper growth also by inducing an inefficient use of resources and technology (Ferguson and Formai, 2011), by distorting labour relations (Ichino, 2003), and by hindering the functioning of the rental housing market (Casas-Arce and Saiz, 2010; Mora-Sanguinetti, 2012).
ECO/WKP(2013)52
8
Box 2. The OECD, CEPEJ and DB datasets
The data used in this study come primarily from three sources: the OECD dataset, the dataset collected by the CEPEJ, and the Doing Business (DB) dataset collected by the World Bank.
The OECD dataset combines replies to an OECD questionnaire distributed to member and partner countries and data from the CEPEJ survey. Overall the dataset covers 35 legal systems in 31 OECD countries, one key partner and one accession country (the United Kingdom having distinct legal jurisdiction for each sub-national entity). Replies to the questionnaire have been provided for 27 legal systems of 26 countries: Australia, Belgium, the Czech Republic, Denmark, Finland, France, Germany, Greece, Hungary, Ireland, Israel, Italy, Japan, Korea, Mexico, the Netherlands, New Zealand, Poland, Portugal, the Slovak Republic, Slovenia, South Africa, Spain, Sweden, Switzerland, and the United Kingdom.1 For the 7 countries that are not members of the Council of Europe (Australia, Israel, Japan, Korea, Mexico, New Zealand, South Africa), all information was collected through the questionnaire. For the remaining 20 countries, information that was already available from the CEPEJ survey (quantitative information on judicial inputs and outcomes) was retrieved from this source. The questionnaire was used to collect information on institutional features of judicial systems that are not covered by the CEPEJ survey or to add greater detail. The OECD questionnaire contains information about: flow of cases and length of proceedings, access to court, predictability of court decisions, resources available for the judiciary, specialisation of courts, caseflow management techniques introduced in the judicial system, court accountability and models of governance, regulation of the profession (lawyers). The dataset also includes 8 legal systems of countries that were not able to reply to the questionnaire but for which part of the information was available from the CEPEJ survey: Austria, Estonia, Iceland, Luxemburg, Northern Ireland, Norway, Russia and Turkey.2 Data refer to 2011 (2010 for countries member of the Council of Europe).
The CEPEJ dataset collects (among others) data on: flow of cases, access to court, organisation of the court system, lawyers status and regulation (the questionnaire is available at https://wcd.coe.int/ViewDoc.jsp?Ref=CEPEJ%282010%2911&Language=lanEnglish&Ver=original&BackColorInternet=DBDCF2&BackColorIntranet=FDC864&BackColorLogged=FDC864). It covers the 47 Council of Europe member countries. Data are for 4 different years (2004, 2006, 2008 and 2010).
The DB dataset provides information on time, cost and number of procedural steps needed to resolve a specific standardised commercial dispute between two domestic businesses for a large set of economies. The data are collected through surveys completed by local lawyers and judges (the data are available at http://www.doingbusiness.org/data/exploretopics/enforcing-contracts).3
The OECD and the CEPEJ surveys share some common features and are close in spirit: both collect information on a wide array of aspects concerning the functioning of judicial systems; in both cases the replies come from national competent administrations and quantitative data are based on official statistics. Instead, the DB dataset follows a different approach, focusing on a specific case and relying on evaluations of national experts. With reference to the specific case considered, it provides information on aspects (costs and number of procedural steps) that are not covered in the other two datasets, since they are specific to each dispute, reflecting its monetary value and complexity.
____________
1. At the time of writing information for Mexico was only available for the federal courts. 2. The dataset does not cover the United States. 3. See Figure A1.1 for a comparison of the OECD and the DB measures of length.

ECO/WKP(2013)52
9
2. Conceptual framework
2.1 Defining judicial performance
9. For the purposes of this paper, the performance of judicial systems is defined along three main dimensions – speed of adjudication, accessibility to justice services and predictability of judicial decisions. Other important dimensions, such as independence and fairness of adjudication, are ignored as they are difficult to measure and relatively less closely related to economic efficiency. A timely resolution of disputes is crucial to reduce the risk of opportunistic lawsuits and prevent firms from suffering undue costs that may hurt their competitiveness and, for small firms, may even determine exit from business. Also, trial length and predictability of decisions are key to guarantee the certainty of rules. This assures that firms can make better investment choices because they know what “rules” will apply ex post. Accessibility is influenced by the costs of using the service, which need to be sufficiently low to avoid exclusion from the service.
10. Designing a system satisfying these three properties – access, speed and predictability – is complicated by the existence of trade-offs. For example, the need to guarantee access to justice must be balanced against the risk of excessively increasing the workload of courts, which is likely to generate congestion and delays. Similarly, the introduction of restrictions to the right to appeal before higher instances with the purpose of reducing trial length and increase predictability of decisions must be balanced against the need to preserve the right of the losing party to obtain a revision of the lower court judgment. The investigation of these trade-offs and their possible solutions lies beyond the scope of this paper. The goal is rather to construct new quantitative indicators of each of the three dimensions (trial length, access, predictability) in order to benchmark the relative cross-country performance of judicial systems along each of them and to identify potential symptoms of inefficiency.
11. The analysis of the relationship between the performance and the characteristics of judicial systems takes an efficiency perspective and mainly concentrates on trial length, trying to identify factors that may explain observed cross-country variations in this dimension. The focus on length is motivated not only by the importance of a timely resolution of disputes for the correct functioning of the economy, but also by the fact that a reasonable trial length is a necessary (though not a sufficient) condition for good performance in other dimensions. By forcing litigants to endure long delays before a judgment is rendered, lengthy trials compromise legal certainty. Also, as emphasised by the adage “justice delayed is justice denied”, timeliness is a prerequisite for achieving justice. Moreover, the length of trials is also generally associated with other crucial measures of performance such as confidence in the justice system. For instance, the length of trials (as measured in this case by the DB indicator) is inversely related to the index of confidence of individuals in the justice system reported in the World Value Survey (Box 3). Finally, as discussed below, in the absence of effective price mechanisms, trial length is a crucial equilibrating variable in the market for justice services.2
2.2 A demand-supply approach
12. The performance of judicial systems is shaped by many factors. The conceptual approach adopted in this paper is to view judicial systems as “markets”, where demand and supply of justice meet.3 The demand for justice is measured by the number of incoming cases per year, while the supply is given by the number of cases resolved over the same period. While traditional markets are cleared by the price, the market for justice clears through variations in the length of proceedings: the inability of the system to
2 Trial length is also used as a proxy for judicial efficiency in many papers on the effects of judicial performance on
economic outcomes (among others, Fabbri, 2010, Giacomelli and Menon, 2013; Nunn, 2007). 3 A more in depth discussion can be found in Deffains (2011). See also Marchesi (2003) for an analysis of the Italian case.

ECO/WKP(2013)52
10
satisfy the demand for justice (i.e. resolve in each given period a number of cases equal to that brought to court) generates congestion and delays.4 Following this approach, factors affecting the length of proceedings can be grouped into two main categories, according to whether they influence the demand or the supply of justice (Figure 1).
Figure 1. Factors acting in the market for justice
Measures of trial length
Source: OECD
4 The demand for justice also depends on the costs that are borne by the litigants, part of which are set by public policy.
Their level could then be used (and it actually is) to discourage the recourse to court in situations characterised by excess demand. However, there are limitations to the extent to which costs can be used as a market clearing mechanism: high costs could harm the poorest parties and hence violate the principle of equity before the law.
Procedural rules and legal traditions
TRIAL LENGTH
SUPPLY Number of resolved cases
Financial and human resources and their composition Efficiency of the production process: - Task specialisation - Caseflow management techniques - ICT Structure of incentives of the service providers Governance of courts: distribution of accountability and authority over different tasks
DEMAND Number of incoming cases
Litigation rate
External factors: Cultural factors Structural socio-economic factors Business cycle fluctuations Quantity and quality of substantive law
Internal factors: Costs and rules for their allocation between parties Lawyers' incentives Alternative dispute resolution mechanisms Degree of certainty of the law

ECO/WKP(2013)52
11
13. On the supply side, the main potential influencing factors are:
• the quantity and quality of financial and human resources devoted to justice;
• the efficiency of the production process as influenced, among other aspects, by the degree of task specialisation, the use of techniques for the efficient management of cases, the diffusion of information and communication technologies (ICT);
• the governance structure of the courts and the structure of incentives of the service providers, where the first encompasses the distribution of accountability and authority over different tasks, while the second is partly shaped by the definition of performance objectives, the specific entity that sets the standards, and the consequences attached to negative performance.
Factors that in principle influence the demand for justice can be separated into those that are “internal” to the organisation and functioning of the judicial system, and those that are “external” and related to general characteristics of the countries. External factors include:
• cultural traits;
• structural, social and economic characteristics of the economy;
• the business cycle;
• the quality and quantity of legislation;
Among internal factors the following are particularly relevant:
• the costs of accessing the service, and the rules for allocating them between the parties (fee-shifting rules);
• the incentives that apply to lawyers, as shaped by the joint effect of the fee regulation, including rules on pricing transparency, and the organisation of the supply of legal services;
• the diffusion of mechanisms of alternative dispute resolution (ADR);5
• the degree of certainty of the law, as influenced by the ability of the judiciary to guarantee uniformity in the interpretation and application of the law.
Finally, both the supply and the demand of judicial services are affected by procedural rules and institutional arrangements that reflect different legal origins and judicial traditions.
14. The empirical relevance of some of these factors on both sides of the market in explaining cross-country variation in the length of proceedings can be explored, though the paucity of data often prevents from going much beyond correlation analyses.
5 ADR refers to different processes and methods of resolving disputes outside the judicial process, such as mediation,
conciliation, or arbitration.

ECO/WKP(2013)52
12
Box 3. Trial length and confidence in justice
Cross-country comparisons of civil justice systems also include qualitative assessments obtained through international surveys aimed at capturing how individuals and firms evaluate different aspects of judicial systems. The World Value Survey (WVS) collects information on individuals’ confidence in the justice system. The World Business Environment Survey (WBES) assesses firms’ perceptions about the quality of the judicial system and its effectiveness in enforcing property rights. The Global Competitiveness Report (GCR) includes a Global Competitiveness Index composed of 12 “pillars” measuring factors that are deemed to drive productivity and competitiveness. The first pillar is precisely that of institutions, and includes an indicator of judicial independence. Since 2004, the World Bank provides an indicator of “enforcing contracts” on the efficiency of judicial systems in resolving commercial disputes. The indicator is derived from three sub-indicators measuring time, cost and procedural complexity (See Box 2).1
Using the measure of confidence in the justice system derived from the WVS and the DB indicator of trial length, the table below reports regression estimates of individual confidence in the justice system on trial length. The analysis covers Australia, France, Finland, Germany, Italy, Japan, Mexico, New Zealand, the Netherlands, Norway, Poland, Russia, Slovenia, Spain, Sweden, Switzerland, Turkey and the United Kingdom, observed from 2005 to 2008. The dependent variable is represented by a dummy equal to one if the respondent answered he/she has a great deal or quite a lot of confidence in the justice system and equal to zero if the answer is not very much or none at all. Standard errors are clustered at the country level and each regression includes legal origin dummies – distinguishing between French, common, German, Nordic and former socialist law origins – educational attainment and employment status dummies, gender and age. Data on legal origins are taken from Djankov et al. (2007) and summarised in Table A2.1.
As shown in the table below, the logarithm of trial length is consistently negatively correlated with confidence in the judicial system at the individual level. The estimates suggest that a 10% increase in the length of trials is associated with around 2 percentage point decrease in the probability to have confidence in the justice system. Individuals living in countries with a Nordic legal origin are consistently more likely to have higher confidence in the justice system than countries with a French legal origin (the excluded dummy).
Log trial length is negatively and significantly related to confidence in the justice system
Note: Robust standard errors in parentheses, *** p<0.01, ** p<0.05, * p<0.1. All regressions control for age, gender, educational attainment and employment status. The excluded legal origin dummy is French law.
Source: Authors' estimates based on WVS and DB data ___________ 1. Batra et al. (2003) observed that countries in which firms declared higher discontent with affordability and quickness of the judicial system also perceived less fairness and impartiality. Similar results have been found in other surveys conducted at the national level, for instance the Círculo de Empresarios (2003) in Spain.
(1) (2) (3) (4) (5)
Confidence in justice system
Confidence in justice system
Conf idence in justice system
Confidence in justice system
Confidence in justice system
Log trial length -0.178** -0.202***(0.074) (0.062)
Cost 0.006 0.005(0.005) (0.004)
Number of procedures -0.001 0.007(0.006) (0.008)
Common law 0.047 0.002 0.06 0.037 0.057(0.046) (0.062) (0.046) (0.062) (0.041)
Nordic 0.287*** 0.230*** 0.326*** 0.283*** 0.279***(0.053) (0.060) (0.086) (0.055) (0.053)
Former Socialist -0.157*** -0.266*** -0.092 -0.156*** -0.225***(0.039) (0.069) (0.058) (0.041) (0.063)
German 0.046 0.053 0.083 0.042 0.112**(0.080) (0.068) (0.072) (0.085) (0.047)
Observations 20846 20846 20846 20846 20846R-squared 0.072 0.088 0.077 0.072 0.094Clustered SE by country YES YES YES YES YES

ECO/WKP(2013)52
13
3. Comparing civil justice outcomes
15. This section illustrates how judicial systems perform with respect to trial length, accessibility to justice services and predictability of judicial decisions. The analysis uses quantitative indicators of each of these dimensions based on the data collected through the OECD questionnaire and the CEPEJ survey, as well as on some data provided by the World Bank (Box 2 and Annex 1).
16. Cross-country comparisons of justice outcomes are complicated by definitional and methodological issues, as well as by the limited amount of statistics available. Different approaches can be used to address these difficulties, each having its pros and cons. Here, trial length and appeal rates at different instances are assessed relying on official statistics on the flow of various categories of civil cases, which are then used to construct average measures of these dimensions.6 This approach has a clear advantage in terms of generality and ability to provide an overall picture of the functioning of judicial systems. However, by averaging across different categories of cases, measures are prone to error in that they incorporate possible differences in the complexity of cases and in the way court statistics are organised across countries. A different measure of trial length is provided by the DB database. This measure guarantees greater cross-country comparability, as it refers to a hypothetical standardised case, but suffers from some drawbacks. First, it lacks generality and is only available for the first instance. Second, it has a less objective nature, being based on survey responses provided by lawyers and judges. The nature of the OECD questionnaire does not allow collecting information on the private costs of the service, which are largely dependent on the monetary value and complexity of each dispute. For this information, the analysis relies on the DB database, which provides data on the cost of resolving the specific case considered (Annex 1).
3.1 Trial length
17. There is a large cross-country variation in trial length across all instances (Figure 2). As reported in Table 1 the average length of first instance civil disputes is 238 days; it rises to more than 350 days in the upper decile of the distribution. Data on the time it takes to solve a civil dispute that goes through all the three instances are available only for 16 countries. The average for these countries is 788 days. The cross-country variation is again fairly large: average total length is below 395 days in the first decile of the length distribution, and above 1 152 days in the last.
18. With some exceptions, countries in which the length of trials in first instance is longer are also characterised by longer duration in second instance (Figure 3). However, some countries are clear outliers. For example, Italy is characterised by relatively long trial duration in first instance, with duration being 2.5 times larger than the sample average. Figures become even larger when looking at the second instance, in which it takes almost 4.5 times longer to solve a case in Italy than on average in the OECD. On average and across the two instances, trial length is lower in Nordic and German law systems than in common law ones; it is highest in French law systems.
6 See Annex 1 for details. Civil cases include all civil cases over matters in controversy between parties except, if
possible, administrative cases. They comprise the following sub-categories: contracts, labour, insolvency and bankruptcy, intellectual property, family, tort and personal injury, real property, social security, antitrust and competition.

ECO/WKP(2013)52
14
Figure 2. Trial length in days
Distribution across countries by type of instance
Note: Trial length is estimated through a formula commonly used in the literature: (Pendingt-1+Pendingt)/(Incomingt+Resolvedt)*365 (see Annex 1 for details). Each of the plots illustrates the main summary statistics of the sampled data. The diamond represents the median. The end points of the two whiskers represent the minimum and the maximum values in the sample. The spacing between the main parts of the plot illustrates the degree of dispersion and skewness in the data.
Source: OECD, CEPEJ and DB
3.2 Accessibility
19. The accessibility of judicial systems can be evaluated along three main dimensions: informational, geographical, and financial. While the development of communication and information technologies has weakened the access constraints related to the first two dimensions, financial accessibility remains a key issue. Financial access constraints relate to the costs borne by the litigants to achieve a resolution of their dispute through the court system (court fees, expert fees, lawyers’ fees). However, these costs must be evaluated in combination with the availability of public financial support to litigation (legal aid) and other instruments aimed at easing possible liquidity constraints faced by the litigants, such as arrangements under which the lawyer is entitled to payment only in case of victory (e.g. contingency fees) or the possibility to resort to external investors to finance the court proceedings (e.g. third-party financing). A synthetic indicator comprising all these dimensions could not be constructed due to lack of data on the actual diffusion of contingency fees and third-party financing.7 Thus, accessibility to court has been assessed using an indicator for total private costs that combines the cost of trial8 and the probability of
7 Contingency (or conditional) fees are allowed by law in 37% of surveyed countries. 8 The cost of trial refers to the total cost needed to resolve a standardised dispute and is drawn from the DB database.
The DB indicator records three types of costs: court costs, i.e. all the fees that the plaintiff must advance to the court; enforcement costs, i.e. all the costs the plaintiff must advance to enforce the judgment; and average lawyers’ fees. The cost is recorded as a percentage of the claim, assumed to be equivalent to 200% of income per capita in the country.
(Japan) (Poland) (Portugal)
(Switzerland)
(Italy)
(Italy) (Italy)
(Italy)
-400-200
0200400600800
100012001400160018002000220024002600280030003200
First instance(35 obs.)
Second instance(23 obs.)
Highest court(16 obs.)
Total(16 obs.)
Minimum Median Maximum

ECO/WKP(2013)52
15
receiving legal aid in each country.9 Specifically, assuming that the availability of legal aid resets trial costs to zero, the indicator is constructed as the total private cost discounted by the expected value of legal aid (see Annex 1 for details). Figure 4 reports the values of the indicator for some OECD countries. A higher value of the indicator denotes a lower degree of accessibility, once accounting for the contribution of legal aid.
Figure 3. Trial length in first and second instance
Note: Trial length is estimated with a formula commonly used in the literature: (Pendingt-1+Pendingt)/(Incomingt+Resolvedt)*365 (see Annex 1 for details).
Source: OECD, CEPEJ and DB
9 The probability of receiving legal aid refers to all cases other than criminal across all instances and is computed as the
ratio of the number of cases that are granted legal aid to the total number of incoming cases across all instances.
Australia
Switzerland
Czech Republic
GermanyDenmark
Spain
Estonia
Finland
FranceGreece
Hungary
Israel
Japan
Korea
Luxembourg
New Zealand
Poland
Scotland
Sweden
Italy
Portugal
Slovak RepublicSlovenia
0
200
400
600
800
1000
1200
100 150 200 250 300 350 400 450 500 550 600
Trial length in days, second instance
Trial length in days, first instance
Correlation coefficient: 0.57***
Correlation coefficient(without Italy, Portugal, Slovak Republic and Slovenia): 0.62***

ECO/WKP(2013)52
16
Table 1. Measures of trial length
Number of days
Note: In columns 1-4 trial length is estimated through a formula commonly used in the literature: (Pendingt-
1+Pendingt)/(Incomingt+Resolvedt)*365. Where information on the number of pending cases was not available but the country was able to provide information on the actual length, the latter was used (England and Wales, Mexico, New Zealand and the Netherlands). For the first instance only, for those countries for which neither the estimated nor the actual length was available, length has been calculated imputing the predicted value of the regression of the estimated length on the DB length (marked by an asterisk). Total length is the sum of trial length across the three instances (available for 16 countries). The DB length (column 4) refers to a hypothetical standardised commercial case in first instance. The table includes total averages and averages by legal origin. See Annex 1 for details.
Source: OECD, CEPEJ and DB
Country
Trial length 1st instance
Trial length 2nd instance
Trial length highest court
Total trial length
Trial length Doing
BusinessAustralia 192 287 395Austria 129 397Belgium* 233 505Czech Republic 135 77 313 524 611Denmark 199 127 410England and Wales 350 399Estonia 209 121 92 422 425Finland 219 221 168 609 375France 274 343 333 950 331Germany 200 207 394Greece 155 272 819Hungary 200 111 142 454 395Iceland* 211 417Ireland* 270 650Israel 294 359 890Italy 564 1113 1188 2866 1210Japan 107 114 146 368 360Korea 144 179 255 579 230Luxembourg 262 555 321Mexico 342 415Netherlands 305 514New Zealand 171 191 286 648 216Northern Ireland* 206 399Norw ay 160 280Poland 167 43 830Portugal 425 120 90 635 547Russia* 176 281Scotland* 206 350 350 906 399Slovak Republic 354 76 194 624 565Slovenia 420 103 831 1354 1290South Africa* 258 600Spain 272 189 316 778 515Sw eden 186 117 225 528 508Sw itzerland 131 142 95 368 390Turkey* 212 420
Common Law 243 297 318 777 494French 304 432 482 1307 560German 200 117 259 587 535Nordic 195 155 197 568 398Former socialist 176 281
Mean 238 236 314 788 506

ECO/WKP(2013)52
17
Figure 4. Measure of trial cost net of legal aid
Trial cost net of legal aid as a percentage of the value of the claim
Note: The indicator is a measure of the total cost of trial (as a percentage of the value of the claim, which is assumed to be equivalent to 200% of the economy’s income per capita) net of the probability of receiving legal aid (see Annex 1 for details). The cost of trial refers to the cost of a specific civil law case (a commercial dispute), from beginning to end. It is obtained from the World Bank Doing Business database and encompasses three different types of costs necessary to resolve a specific commercial dispute: court fees, enforcement costs and average lawyers’ fees. The information on legal aid is drawn from the CEPEJ and OECD databases. The small number of observations is due to data availability.
Source: OECD, CEPEJ and DB
20. Figure 5 reports the correlation between the indicator of trial costs net of legal aid and the average length of trials for civil cases in first instance. As a general trend, systems characterised by lengthy trials tend to be more costly, suggesting that a reasonable trial length is a condition for the accessibility of the judicial system. However, there are exceptions, such as Japan where costs are estimated to be high and yet trial length is relatively low, or Slovenia where the opposite appears to be true.
0
5
10
15
20
25
30
35

ECO/WKP(2013)52
18
Figure 5. Trial length and trial cost net of legal aid
Note: Trial length is estimated through a formula commonly used in the literature: (Pendingt-1+Pendingt)/(Incomingt+Resolvedt)*365 (see Annex 1 for details). The indicator on the x-axis is a measure of the total cost of trial (as a percentage of the value of the claim, which is assumed to be equivalent to 200% of the economy’s income per capita) net of the probability of receiving legal aid. The cost of trial refers to the cost of a specific civil law case (a commercial dispute), from beginning to end. It is taken from the World Bank Doing Business database and encompasses three different types of costs necessary to resolve a specific commercial dispute: court fees, enforcement costs and average lawyers’ fees. The reduced number of observations is due to data availability.
Source: OECD, CEPEJ and DB
3.3 Predictability of court decisions
21. Predictability of court decisions, that is, the possibility to predict ex ante how the law will be applied by the court ex post, is extremely important from an economic point of view. It guarantees the certainty of the law and enables economic agents to anticipate the potential legal consequences of their actions. The latter in turn is key to making correct decisions ex ante. The predictability of court decisions is influenced by the uniformity in the application of the law, i.e. the equal treatment of similar disputes, and the ease with which court decisions can be accessed and known.
22. Although measuring predictability per se is difficult, some information on this dimension can be inferred from appeal rates before higher instances. The underlying argument can be understood by recalling that the probability that a decision is appealed depends on how much the parties are uncertain on the expected outcome of litigation before the higher court. Such expectations in turn depend on the extent to which the lower court decision reduces the uncertainty about how the law will be enforced by the higher court. Appeals will occur when this uncertainty is high. Indeed, since litigation is costly, when the parties are able to predict with sufficient precision what will be the decision of the higher court, it will be in their interest to accept the lower court decision or to find an out-of-court settlement and therefore save on trial costs. Accordingly, appeal rates will reach a maximum when the expectation about the probability of a
Austria
DenmarkEstoniaFinland
France
England and Wales
Hungary
Korea
Netherlands
NorwayNew Zealand
Turkey
Slovak Republic
Slovenia
Italy
Japan100
150
200
250
300
350
400
450
500
550
600
6 8 10 12 14 16 18 20 22 24 26 28 30 32
Trial length in days, first instance
Total cost of trial net of legal aid (as a percentage of the value of the claim)
Correlation coefficient(without Italy, Japan and Slovenia): 0.56**
Correlation coefficient: 0.31

ECO/WKP(2013)52
19
reversal by the higher court is close to 50%, and will be low when such probability is either very low or very high.10 While this relationship makes appeal rates a useful variable to assess the predictability of court decisions, two important caveats need to be considered.
23. First, since the decision to bring a dispute to court is endogenous, it is important to account for the possibility of a sample selection bias arising from the fact that, in countries where predictability of court decisions is high, only complex cases are brought to court, which are also those more likely to be appealed. Second, when applying the reasoning above to cross-country comparisons, other country-specific factors that may explain rates of appeal have to be considered, the most relevant one being the presence of restrictions imposed by law to the possibility for the litigants to bring an appeal. Thus, in order to assess whether a relatively low (high) appeal rate results from the difficulty (ease) for the litigants to resort to higher courts, or is the outcome of an equilibrium where the judicial system is capable (incapable) of reducing uncertainty, it is necessary to look at appeal rates in combination with the presence of restrictions to appeal. Both caveats are addressed in turn.
24. Figure 6 displays “face value” appeal rates before the second instance for OECD countries. To make the most of available data, appeal rates are estimated as the ratio of incoming cases in the higher instance at period t, to resolved cases in the lower instance at period t-1. Common law countries generally exhibit lower appeal rates, while cross-country dispersion of appeal rates is higher in other legal systems.
Figure 6. Appeal rates before the second instance
Cases appealed before the second instance as a percentage of cases resolved in first instance
Note: The appeal rate is estimated as the ratio of incoming civil cases in second instance at period t to resolved civil cases in first instance at period t-1. Included countries are those for which data are available and jurisdiction is reasonably homogeneous.
Source: OECD and CEPEJ
10 See Shvets (2012) and the references therein for a more detailed discussion of the link between uncertainty
and appeals rates.
0
5
10
15
20
25
30
35
40
45Appeal rate before second instance
Common law Nordic German French

ECO/WKP(2013)52
20
25. The appeal rates in Figure 6 measure the average probability that a case is brought before the second instance court conditional on having reached the first instance court. However, as emphasised, the decision to bring a dispute to court is influenced by the degree of uncertainty faced by the litigants about how the law will be enforced. For reasons explained above, this circumstance may result in appeal rates being higher precisely in those countries where the predictability of court decisions is higher and only complex disputes are litigated. To take this into account, a “modified” measure of appeal rates has been constructed, according to which the number of incoming cases before the second instance is related to the number of potential disputes in the country. Assuming that this is a constant fraction of the population, the relevant measure is thus calculated as the number of incoming cases in second instance as a percentage of population. Figure 7 displays the modified appeal rates before the second instance court. As expected, once accounting for some degree of sample selection, the estimated performance of countries with low litigation rates (Nordic and common law countries) improves relative to that of the countries with high litigation rates (French law).
Figure 7. Appeal rates before the second instance as a percentage of population
Note: The appeal rate is estimated as the ratio of incoming civil cases in second instance to population. Included countries are those for which data are available and jurisdiction is reasonably homogeneous.
Source: OECD and CEPEJ
26. Data on appeal rates before the highest court are available only for a small set of countries. Abstracting from Italy and Korea, variation in “face value” appeal rates before the highest court does not seem to be so pronounced, though the small number of observations invites caution in generalising this conclusion (Figure 8). Nonetheless, the change between “face value” and “modified” appeal rates is similar to the one observed for the second instance court (Figure 9).
0.0
0.1
0.2
0.3
0.4
0.5
0.6
0.7
0.8Appeals before second instance relative to population
Common law Nordic German French

ECO/WKP(2013)52
21
Figure 8. Appeal rates before the highest court
Cases appealed before the highest court as a percentage of cases resolved in second instance
Note: The appeal rate is estimated as the ratio of incoming civil cases in highest court at period t to resolved civil cases in second instance at period t-1. Included countries are those for which data are available and jurisdiction is reasonably homogeneous.
Source: OECD and CEPEJ
27. Differences in appeal rates across countries may be partly explained by restrictions to appeal. These may take two forms: filing an appeal may be either limited to cases with a monetary value of the claim above a given threshold (monetary restrictions), or it may be subject to obtaining leave from the lower or the appellate court (leave to appeal).11 Monetary restrictions are more common in German and French law countries, while restrictions based on leave to appeal are more frequent in common and Nordic law countries (Table 2).
11 In this case the appellant must seek and obtain the permission of the court before she can start the appeal. Depending
on the country, the permission is granted by the lower court or the appellate court.
0
10
20
30
40
50
60
Common law Nordic German French
Appeal rate before highest court

ECO/WKP(2013)52
22
Figure 9. Appeal rates before the highest court as a percentage of population
Note: The appeal rate is estimated as the ratio of incoming civil cases in highest court to population. Included countries are those for which data are available and jurisdiction is reasonably homogeneous.
Source: OECD and CEPEJ
Table 2. Restrictions to appeal before the second instance and the highest court by legal origin
Number of countries by type of restriction
Note: Monetary restrictions refer to systems in which the right to appeal is limited to cases with a monetary value of the claim above a given threshold. Leave to appeal refers to systems in which the appellant must seek and obtain the permission of the (lower or appellate) court before she can start the appeal.
Source: OECD
28. The plots in Figures 10 and 11 report the distribution of the modified appeal rates by different types of restrictions before the second instance and the highest court respectively. Restrictions based on
0
0.01
0.02
0.03
0.04
0.05
0.06
0.07Appeals before the highest court relative to population
Common law Nordic German French
Legal origin None Monetary Leave to appeal Total
Common law 2 0 5 7French 1 6 0 7German 5 3 1 9Nordic 0 1 2 3Total 8 10 8 26
Legal origin None Monetary Leave to appeal Total
Common law 2 0 5 7French 2 1 0 3German 1 3 2 6Nordic 0 0 2 2Total 6 4 8 18
Restrictions to appeal before the second instance
Restrictions to appeal before the highest court

ECO/WKP(2013)52
23
leave to appeal are associated with a reduction in the average and the cross-country variance of appeal rates, both in second instance and in the highest courts. On the contrary, the impact of monetary restrictions is not statistically significant.12 Interestingly, with the exclusion of restrictions based on leave to appeal, there is wide variation in appeal rates at all levels. Thus, restrictions may in principle explain part but not all of the cross-country differences in appeal rates, leaving potential scope for increasing predictability of court decisions (i.e. lower appeal rates) without increasing the strength of restrictions.
Figure 10. Appeal rates before the second instance as a percentage of population by type of restrictions
Note: The plots display the appeal rate before the second instance by type of restriction (see note to Figure 2 for details on how to interpret the plots). The appeal rate is estimated as the ratio of incoming civil cases in second instance to population. The first plot refers to countries where filing an appeal is subject to obtaining leave from the lower or the appellate court (Leave to appeal), the second plot refers to countries where filing an appeal is limited to cases with a monetary value of the claim above a given threshold (Monetary), the third plot refers to countries where no restrictions apply (No). Differences in the distributions of appeal rates without restrictions and with monetary restrictions are not statistically significant. Included countries are those for which data are available and jurisdiction is reasonably homogeneous.
Source: OECD and CEPEJ
12 For both second instance and highest courts, differences in the distributions of appeal rates with and without monetary
restrictions are not statistically significant.
(England and Wales)
(Switzerland)
(Ireland)
(Scotland)
(Czech Republic)
(Slovenia)
-0.1
0.0
0.1
0.2
0.3
0.4
0.5
0.6
0.7
0.8
Leave to appeal Monetary No

ECO/WKP(2013)52
24
Figure 11. Appeal rates before the highest court as a percentage of population by type of restrictions
Note: The plots display the appeal rate before the highest court (see note to Figure 2 for details on how to interpret the plots). The appeal rate is estimated as the ratio of incoming civil cases in highest court to population. The first plot refers to countries where filing an appeal is subject to obtaining leave from the lower or the appellate court (Leave to appeal), the second plot refers to countries where filing an appeal is limited to cases with a monetary value of the claim above a given threshold (Monetary), the third plot refers to countries where no restrictions apply (No). Included countries are those for which data are available and jurisdiction is reasonably homogeneous.
Source: OECD and CEPEJ
4. Exploring the determinants of some civil justice outcomes
29. Following the conceptual framework illustrated in Section 2, some of the institutional factors that may explain observed cross-country variations in trial length, via their influence on either the supply or the demand for justice, are analysed in this section using summary indicators:13
• On the supply side, the amount of financial resources allocated to justice and some characteristics of the production structure of judicial services (composition of resources, task specialisation, diffusion of caseflow management techniques and ICT, the governance structure of the courts) have been considered. The production structure is likely to influence the supply of justice mainly through its effects on the productivity of the resources used in the provision of
13 Institutional features are assessed through synthetic quantitative indicators based on the data collected through the
OECD questionnaire and the CEPEJ survey (see Annex 1 for details on the methodology used). In some cases measures based on principal component analysis or multiple correspondence analysis have been constructed.
(Sweden)
(Switzerland)
(France)
(Scotland)
(Hungary)
(Italy)
-0.01
0.01
0.02
0.03
0.04
0.05
0.06
Leave to appeal Monetary No
Minimum Maximum Median

ECO/WKP(2013)52
25
civil justice services. When the data are available, the relationship between institutional factors and productivity is also analysed, in addition to trial length.
• On the demand side, the analysis investigates the relevance of some macro variables (such as socio-economic characteristics and cultural attitudes towards conflict resolution) and institutional factors (regulation of profession, costs of the service). In principle, these factors affect trial length through their impact on the litigation rate. The analysis explores these linkages as well as the correlation between the litigation rate and trial length.
30. Given the limited number of observations and the cross-sectional nature of the data, in most cases the empirical analysis takes the form of correlations, to which it is not possible to attach causal relationships. However they still provide a general picture of the associations between relevant judicial variables. The analysis employs the DB measure of trial length. This was found methodologically more appropriate given the greater cross-country comparability of this measure, which does not incorporate differences in the composition of case flows across judicial systems.14
4.1 Supply side factors
4.1.1 Financial resources
31. The functioning of judicial systems may be influenced by the quantity and the quality of financial resources, such as the level and the composition of the public budget allocated to courts (salaries, computerisation, and justice expenses).
Justice budget
32. As found in other studies (Cross and Donelson, 2010; Voigt and El Bialy, 2012), no statistically significant correlation between the budget allocated to justice and the performance of the systems emerges from the analysis of the data assembled by the OECD. Figure 12 displays the amount of financial resources devoted to the functioning of courts as a percentage of GDP across OECD countries.15 Slovenia and Poland allocate the largest shares of GDP to justice, and Japan and Norway the lowest. Countries with similar budgets (as a percentage of GDP) display very different civil justice outcomes, as measured by trial length. For instance, Italy, the Slovak Republic, Switzerland and the Czech Republic all allocate around 0.2% of GDP to the courts’ budget, but, while in Switzerland and the Czech Republic the average trial duration is around 130 days (OECD measure), it is 2.7 times larger in the Slovak Republic and even 4 times larger in Italy.
14 Legal origins are taken as given in this study. To this end, they are included as a control variable in all estimates. 15 The budget includes the amount of financial resources allocated to all courts, excluding resources for legal aid and
public prosecution services. Cross-country comparisons of judicial budgets may be affected by differences in the distribution of tasks related to the functioning of the judiciary between the public judicial system and the private sector.

ECO/WKP(2013)52
26
Figure 12. Budget allocated to courts as a percentage of GDP
Note: The budget is computed as the amount of financial resources allocated to all courts, excluding resources for legal aid and public prosecution services. The bar height displays the ratio of budget to GDP, in percent.
Source: OECD and CEPEJ
Composition of the justice budget
33. How efficiently resources are spent is likely to be more important for performance than the sheer amount of resources devoted to courts. A key aspect in this respect is the allocation of resources across budget items (e.g. salaries, computerisation, justice expenses, operating costs, investments in real estate and training). Given the high labour intensity of judicial services, all countries devote the largest share of the public budget to gross salaries, 65% on average (the only exception being Ireland that in 2010 devoted 36% to salaries and an approximately equal share to real estate investment). However, the share drops to 51% for common law countries, and rises to 77% in French law ones (Table 3). Hence, common law systems appear to be less labour intensive, as they also display the lowest number of judges per 100 000 inhabitants (around 5 compared with a cross-country average of 16)16 and invest the largest share of budget in informatisation (6% compared to an average 4%). Countries belonging to other legal traditions tend to allocate similar shares of GDP to the various budget items and to have a similar number of judges per 100 000 inhabitants.
16 These figures refer to professional judges working full time and on an occasional basis (i.e. not performing their duty
on a permanent basis but being fully paid for their function as judges). They do not include “non-professional judges” such as lay judges, judges of peace, “juges consulaires”, etc.
0
0.1
0.2
0.3
0.4
0.5
0.6
Japa
n
Norway
Austra
lia
Icelan
d
Denmark
Irelan
d
Englan
d and
Wale
s
Scotla
nd
Finlan
d
Sweden
Netherl
ands
Israe
l
Estonia
Ita
ly
Slovak
Rep
ublic
Switzerl
and
Czech
Rep
ublic
Northe
rn Ire
land
Russia
New Zea
land
Hunga
ry
Portug
al
Poland
Sloven
ia

ECO/WKP(2013)52
27
Table 3. The allocation of public budget across budgetary items
Data expressed as a percentage of the budget
Note: The table illustrates the allocation of court budget across budgetary items. The budget is computed as the amount of financial resources allocated to all courts, excluding resources for legal aid and public prosecution services. The missing values are actually included in the residual category “Other” as they could not be separated out (except for Iceland). The table includes total averages and averages by legal origin.
Source: OECD and CEPEJ
34. Figure 13 (panel A) suggests that systems devoting a larger share of the budget to ICT investment display on average shorter trial length (as measured by the DB indicator)17. Investments in informatisation appear to have some weakly positive relationship with the productivity of judges, proxied by the number of cases disposed of by each judge (Panel B). Further estimates confirm the significance of this relationship, when controlling for the logarithm of real GDP per capita, legal origins and time trends (Table A2.2, columns 1 and 2). The correlation of investments in computerisation and productivity is larger when the degree of computer literacy (as proxied by the share of people with basic computer skills in the population) in the country is higher (columns 3 and 4). For instance, moving from the 25th to the 75th percentile of the ICT literacy distribution (corresponding to 33% and 54% of computer users in the population, respectively), the elasticity of judges’ productivity to investment in informatisation would increase by four 17 The share of budget allocated to ICT may under-estimate the effective amount of resources devoted to ICT for it does
not include co-financing by supranational bodies (e.g. EU structural funds).
Salaries Informatisation Justice expences
Operating costs
Real estate Training & Education
Other
Czech Republic 58.0 2.1 3.5 1.3 0.0 0.0 35.1Denmark 68.5 7.9 0.0 15.4 - 0.9 7.3England and Wales 60.7 2.5 5.4 20.1 0.1 0.1 11.1Estonia 77.0 1.0 3.1 18.0 - 0.8 0.1Finland 76.0 4.9 3.3 13.0 0.0 - 2.8Hungary 80.7 2.9 6.2 10.1 - 0.1 0.0Iceland - 1.7 - - - - -Ireland 35.6 3.7 0.1 12.1 38.4 0.8 9.3Israel 67.9 5.6 4.9 10.5 6.8 0.7 3.5Italy 74.5 1.9 10.4 8.8 - 0.0 4.3Japan 61.1 1.8 4.7 0.6 1.7 2.5 27.5Netherlands 74.1 9.9 0.4 11.1 0.0 2.1 2.5New Zealand 50.7 9.7 17.2 13.6 - 0.4 8.5Northern Ireland 56.3 12.0 2.9 28.4 - 0.4 -Norw ay 63.4 3.6 0.0 22.4 0.8 1.2 8.5Poland 65.5 0.8 10.9 5.1 3.1 0.2 14.5Portugal 81.2 2.0 5.2 7.3 0.0 4.3 -Russia 64.0 3.4 0.4 6.4 7.8 0.3 17.7Scotland 39.8 2.9 5.7 19.3 6.8 0.1 25.4Slovak Republic 64.5 1.5 0.2 6.4 0.0 1.0 26.4Slovenia 70.8 2.3 21.3 4.3 0.6 0.7 0.0Sw eden 70.7 2.4 - 14.0 - 1.2 12.7Sw itzerland 77.2 4.2 9.6 6.5 0.8 0.4 1.3
Common Law 51.8 6.1 6.0 17.3 13.0 0.4 11.6French 76.6 4.6 5.3 9.1 0.0 2.1 3.4German 69.4 2.1 7.4 6.5 1.0 0.7 13.1Nordic 69.7 4.1 1.1 16.2 0.4 1.1 7.8Former socialist 64.0 3.4 0.4 6.4 7.8 0.3 17.7
Mean 65.4 3.9 5.5 11.6 4.5 0.9 10.9

ECO/WKP(2013)52
28
times (from 0.2% to 0.8%). Thus, investments in computerisation and policies aimed at increasing the computer literacy of the population would seem to be complementary vis-à-vis this measure of justice productivity.
Figure 13. ICT justice budget and judicial performance
A. ICT justice budget and trial length
B. ICT justice budget and productivity of judges
Note: The share of the justice budget allocated to informatisation (ICT justice budget) is computed as the ratio of annual public budget allocated to computerisation to the public budget allocated to the functioning of the courts (excluding financial resources devoted to legal aid and public prosecution services). Trial length is taken from the World Bank Doing Business. The productivity of judges is defined as the ratio of resolved civil cases across all instances to the total number of judges (see Annex 1 for details).
Source: OECD, CEPEJ and DB
Switzerland
Czech Republic
DenmarkEstoniaFinland
England and WalesHungary
Ireland
Iceland
Israel
Italy
Japan Northern Ireland
Netherlands
Norway
New Zealand
Poland
Portugal
Russia
Scotland
Slovak Republic
Slovenia
Sweden
5.0
5.5
6.0
6.5
7.0
7.5
-5.0 -4.5 -4.0 -3.5 -3.0 -2.5 -2.0
Log trial length, first instance (DB)
Log ICT justice budget
Correlation coefficient: -0.35*
Switzerland
Czech RepublicDenmark
Estonia
FinlandEngland and Wales
Hungary
Israel
Italy
Japan
Netherlands
Norway
New Zealand
Poland
Portugal
RussiaScotland
Slovak Republic
Slovenia Sweden
2.5
3.0
3.5
4.0
4.5
5.0
5.5
6.0
6.5
7.0
-5.0 -4.5 -4.0 -3.5 -3.0 -2.5 -2.0
Log productivity of judges
Log ICT justice budget
Correlation coefficient: 0.18

ECO/WKP(2013)52
29
4.1.2 Production structure
35. The supply of justice also depends on how the “production process” is organised, once taking into account the constraints imposed by the specific nature of this service. Three factors are likely to be relevant: the degree of task specialisation, the management of the flow of cases and the use of ICT. Another crucial and related element is the governance structure of the judicial system. These aspects will be discussed in turn below.
Task specialisation
36. Task specialisation is often advocated as a major performance-enhancing factor (World Bank, 2012). The argument is that specialisation enhances court efficiency by allowing judges to acquire detailed knowledge of a given area of law and of the issues that may arise in the related disputes. Furthermore, it favours a more efficient organisation of the work, by preventing judges from being assigned to widely different categories of disputes, and is likely to guarantee better consistency of decisions. A potential disadvantage of specialisation is the inability for judges to benefit from knowledge spillovers. Also, specialisation may introduce rigidity in the use of resources, limiting the possibility to reallocate judges from one area to another. Specialisation can be achieved both “vertically” and “horizontally”. One example of vertical specialisation is the creation of a two-tier first instance court system with lower courts dealing with lower-value cases and higher courts treating more complex cases. Horizontal specialisation refers, instead, to the existence of courts, sections or judges specialised in specific matters. A different kind of specialisation is related to the presence of non-judge staff providing legal assistance to judges. Legal assistance may enhance performance by freeing judges from lower-skill tasks (legal research, drafting of memoranda, case preparation and management), enabling them to concentrate only on adjudication.
37. Court specialisation has been assessed using two synthetic indicators.18 The first captures the overall degree of court specialisation; the second is positively correlated with the presence of specialised commercial courts or sections covering at least three commercial matters.19 Specialisation in commercial matters appears to be of some relevance for performance, though evidence is not clear-cut. As illustrated in Figure 14, trial length is inversely related to the indicator capturing commercial specialisation (panel A), while the productivity of judges does not show any clear correlation with it (panel B).20 The result could be due to non-homogeneity of the specialisation and the productivity measures, the former only referring to commercial cases while the latter encompassing different matters and instances. Also, it should be emphasised that there could be other ways different from the creation of specialised courts to ensure specialisation of judges – such as the appointment of judges for specific positions based on their specialisation and expertise – that are not captured by the specialisation indicator.
18 The indicators were identified and computed by means of principal components analysis (see Annex 1 for details). 19 Specifically, the indicator opposes presence of specialised commercial courts or sections covering at least three
matters, with positive sign, and presence of specialised labour, rent, and administrative courts or sections with negative sign and less weight.
20 The impact of court specialisation on performance is also analysed in Voigt and El Bialy (2012). Using the CEPEJ dataset, the authors find a negative correlation between court specialisation, as measured by the ratio of specialised first instance courts to all first instance courts of a country, and the number of resolved cases divided by caseload. Using data from a sample of Spanish family courts in the region of Madrid, Garoupa et al. (2010) do not find conclusive evidence that specialised family courts are faster than regular ones. However, Marchesi (2003) shows that increasing the average size of Italian courts would enhance their productivity, mainly as a result of increased judges’ specialisation.

ECO/WKP(2013)52
30
Figure 14. Commercial court specialisation and judicial performance
A. Commercial court specialisation and trial length
B. Commercial court specialisation and productivity of judges
Note: The indicator for commercial court specialisation is a factor obtained through principal component analysis (PCA). The factor positively correlates with the existence of commercial courts covering at least three commercial matters. Trial length is taken from the World Bank Doing Business and refers specifically to a commercial dispute. The productivity of judges is defined as the ratio of resolved civil cases across all instances to the total number of judges (see Annex 1 for details).
Source: OECD, CEPEJ and DB
AustraliaAustria
Belgium
Switzerland
Czech Republic
GermanyDenmark
SpainEstonia
FinlandFrance
England and Wales
Greece
Hungary
Ireland
Iceland
Israel
Italy
Japan
Korea
Luxembourg
Mexico
Northern Ireland
Netherlands
Norway
New Zealand
Poland
Portugal
Russia
Scotland
Slovak Republic
Slovenia
Sweden
Turkey
South Africa
5.0
5.5
6.0
6.5
7.0
7.5
-3.0 -2.0 -1.0 0.0 1.0 2.0 3.0
Log trial length, first instance (DB)
Indicator of commercial court specialisation (from low to high specialisation)
Correlation coefficient: -0.29*Correlation coefficient (without Slovenia) -0.36**
AustraliaSwitzerland
Czech Republic
GermanyDenmark
Spain
Estonia
Finland
France
England and Wales
Hungary
Israel
Italy
Japan
Korea
Luxembourg
Netherlands
Norway
New Zealand
Poland
Portugal
Russia
Scotland
Slovak Republic
SloveniaSweden
0
100
200
300
400
500
600
-3.0 -2.0 -1.0 0.0 1.0 2.0 3.0
Productivity of judges
Indicator of commercial court specialisation (from low to high
Correlation coefficient: 0.26

ECO/WKP(2013)52
31
38. As concerns the availability of legal assistance to judges, each professional judge has on average 1.6 legal assistants in the countries covered by the OECD questionnaire. This ratio tends to be higher in common and German law countries (2.2 and 2 respectively), and lower in Nordic law ones (0.6). Assistance to judges appears to have some relationship with trial length. Table 4 reports the average length of trials by type of legal assistance to judges.21 The availability of assistance is always associated with shorter trial length.
Table 4. The availability of assistance to judges is associated with shorter trial length
Average trial length in days by type of assistance
Note: Cells display country averages of the DB trial length by availability and type of legal assistance. The DB length refers to a hypothetical standardised commercial case in first instance.
Source: OECD, CEPEJ and DB
ICT and caseflow management
39. Electronic communication and technologies for the exchange of information within the courts and their environment may serve many purposes, from automating court processes to increasing the flow of information and facilitating communication between courts and lawyers, to enhancing transparency and accessibility of judicial services. The availability of these technologies is synthesised by means of an indicator increasing in the implementation of several ICT applications (see Figure 15).22
21 The definition of legal assistance considered herein is assistance in judges’ day-to-day work and can be distinguished
into three typologies: legal research, case preparation and management, and drafting of memoranda. When available, assistants can be assigned specifically to the judge or to the court.
22 The specific computer facilities considered are: electronic web forms, website, follow-up of cases online, electronic registers, electronic processing of small claims, electronic processing of undisputed debt recovery, electronic submission of claims and videoconferencing. For each of these technologies, the indicator measures the extensive margin, i.e. the percentage of courts in the country that have adopted them. Its informational content is thus different from that of the indicator measuring the total annual budget allocated to informatisation within each country.
Availability of assistance Legal researchCase preparation and
managementDrafting of memoranda,
orders and opinions
No assistance to judges 578 613 541Assistance to judges 524 517 534
Type of legal assistanceTrial length in days by type of legal assistance available to judges

ECO/WKP(2013)52
32
Figure 15. Implementation of information and communication technology
Scale from 0 to 6, increasing in degree of implementation of ICT
Note: The indicator is the simple average of eight sub-indicators measuring the adoption by the courts of different technologies of electronic communication and exchange of information with their environment (electronic web forms, website, follow-up of cases online, electronic registers, electronic processing of small claims, electronic processing of undisputed debt recovery, electronic submission of claims, and videoconferencing). See Annex 1 for details.
Source: OECD and CEPEJ
40. Cross-country variability in the implementation of these ICT applications is wide. Based on the median values of the sub-indicators referring to various ICT applications, the majority of courts in OECD countries appear to have electronic forms, websites and electronic registers.23 But, many countries either have not yet implemented online facilities and the possibility for lawyers to follow up cases online, or have done so only in a minority of courts. Indeed, the median values of the sub-indicators (ranging from 0 to 6) for electronic processing of small claims, electronic processing of undisputed debt recovery and electronic submission of claims are zero. Thus, there seems to be scope for more informatisation, given its potential benefits for civil justice effectiveness (Buscaglia and Dakolias, 1999).
41. A court system with a good degree of informatisation is also essential for the development of a whole set of instruments – so-called caseflow management techniques – that allow for a smoother functioning of courts and have beneficial effects on the performance of the systems. Caseflow management broadly indicates the set of actions that a court can take to monitor the progress of cases and to make sure that they are managed efficiently. It includes for example the monitoring and enforcement of deadlines, the screening of cases for the selection of an appropriate dispute resolution track, and the early identification of potentially problematic cases.
23 The median value of the sub-indicators (ranging from 0 to 6) for these ICT form are: 5.7 for electronic web forms, 6 for
website and for electronic registers, 4.2 for follow-up of cases online and videoconferencing.
0
1
2
3
4
5
6
7

ECO/WKP(2013)52
33
42. Among the different caseflow management techniques covered in the OECD survey,24 the early identification of long or otherwise potentially problematic cases in first instance appears to be associated with shorter trial length (Figure 16, panel A). It also displays some association with the productivity of judges (Figure 16, panel B).
43. An important condition for the implementation of caseflow management techniques is the systematic collection of detailed statistics on case flows (incoming, pending, resolved cases), trial length, judges’ workload and other operational dimensions. Recording data on the functioning of courts on a regular basis allows soundly monitoring and managing the performance of judges and staff. Indeed, there appears to be a positive relationship between the productivity of judges and the production of statistics (Figure 17, panel B), as measured by an indicator increasing in the number of statistics produced across all instances.25 The production of statistics also appears to have some weaker association with shorter trial length (Figure 17, panel A).
4.1.3 Governance structure
44. As for any type of organisation, whether private or public, the governance structure is a critical element for performance, since it is the main channel through which incentive schemes can be designed and implemented for a better functioning of the organisation itself. The governance structure can be assessed along several dimensions. An important one, which is specific to the administration of courts and can be analysed using replies to the OECD questionnaire, is related to the distribution of responsibilities over managerial and jurisdictional tasks inside the court.26 Jurisdictional tasks are those functional to the adjudicative function strictu sensu (rendering and writing judgments) and, hence, are performed by judges. Managerial tasks can be grouped into three broad categories: organisation and supervision of judges;27 organisation, supervision and appointment of quasi-judicial officers and administrative staff; administration of the budget.
24 Specifically the dimensions considered are: court supervision of the progress of cases and prompt intervention in the
definition of issues; establishment, monitoring and enforcement of timeliness for completion of different steps in litigation; early identification of long or otherwise problematic cases; early screening for the selection of an appropriate dispute resolution track; early screening of cases for appropriate use of alternative dispute resolution (ADR).
25 The types of statistics examined in the questionnaire are: incoming cases by case type, type of plaintiff/defendant, and monetary value of the claim; clearance rates by case type; pending cases and backlogs by case type; average length of proceedings by case type and stage of proceeding; average number of hearings by case type; average number and length of adjournments by case type; resolved cases by method of disposition; percentage of appeals; judges’ workload.
26 Another important dimension is the degree of alignment between accountability and authority. However, this dimension could not be investigated given the structure of the data.
27 Examples are office hours, presence in court, case management, and hearings calendar.

ECO/WKP(2013)52
34
Figure 16. Caseflow management and judicial performance
A. Caseflow management and trial length
B. Caseflow management and productivity of judges
Note: The variable on the x-axis of both panels represents a factor (obtained through principal component analysis) that strongly correlates with the early identification of long or otherwise potentially problematic cases in first instance. Trial length is taken from the World Bank Doing Business database. The productivity of judges is defined as the ratio of resolved civil cases across all instances to the total number of judges (see Annex 1 for details).
Source: OECD, CEPEJ and DB
Australia Switzerland
Czech Republic
GermanyDenmark
Spain
Hungary
Israel
Italy
Japan
Korea
Mexico
Netherlands
New Zealand
Poland
Portugal
Scotland
Slovak Republic
Slovenia
Sweden
FinlandEngland and Wales
5.0
5.5
6.0
6.5
7.0
7.5
-2.0 -1.5 -1.0 -0.5 0.0 0.5 1.0 1.5 2.0
Log trial length, first instance (DB)
Indicator of early identification of long or problematic cases (from weak to strong)
Correlation coefficient: -0.49**
AustraliaSwitzerland
Czech Republic
GermanyDenmark
Spain
Hungary
Israel
Italy
Japan
Korea
Netherlands
New Zealand
Poland
Portugal
Scotland
Slovak Republic
Slovenia Sweden
FinlandEngland and Wales
2.5
3.0
3.5
4.0
4.5
5.0
5.5
6.0
6.5
-2.0 -1.5 -1.0 -0.5 0.0 0.5 1.0 1.5 2.0
Log productivity of judges
Indicator of early identification of long or problematic cases (from weak to strong)
Correlation coefficient: 0.26 Correlation coefficient(without Finland and England and Wales): 0.43**
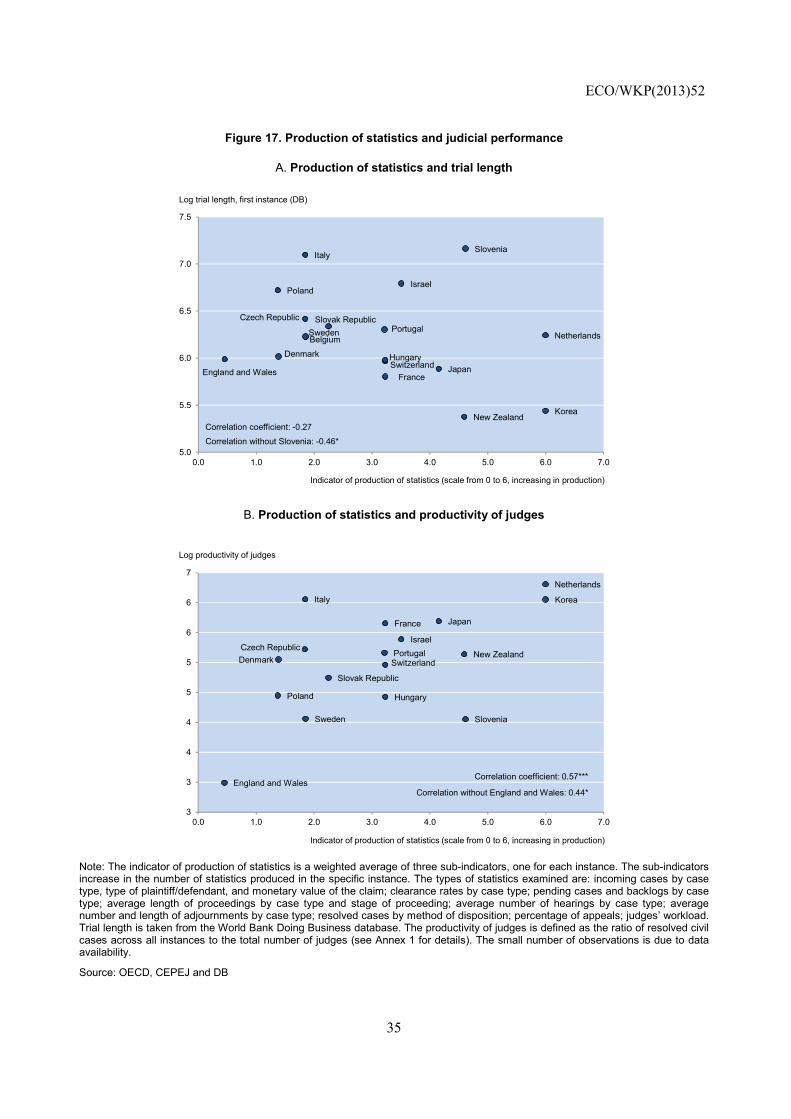
ECO/WKP(2013)52
35
Figure 17. Production of statistics and judicial performance
A. Production of statistics and trial length
B. Production of statistics and productivity of judges
Note: The indicator of production of statistics is a weighted average of three sub-indicators, one for each instance. The sub-indicators increase in the number of statistics produced in the specific instance. The types of statistics examined are: incoming cases by case type, type of plaintiff/defendant, and monetary value of the claim; clearance rates by case type; pending cases and backlogs by case type; average length of proceedings by case type and stage of proceeding; average number of hearings by case type; average number and length of adjournments by case type; resolved cases by method of disposition; percentage of appeals; judges’ workload. Trial length is taken from the World Bank Doing Business database. The productivity of judges is defined as the ratio of resolved civil cases across all instances to the total number of judges (see Annex 1 for details). The small number of observations is due to data availability.
Source: OECD, CEPEJ and DB
Belgium
Switzerland
Czech Republic
Denmark
FranceEngland and Wales
Hungary
Israel
Italy
Japan
Korea
Netherlands
New Zealand
Poland
PortugalSlovak Republic
Slovenia
Sweden
5.0
5.5
6.0
6.5
7.0
7.5
0.0 1.0 2.0 3.0 4.0 5.0 6.0 7.0
Log trial length, first instance (DB)
Indicator of production of statistics (scale from 0 to 6, increasing in production)
Correlation coefficient: -0.27
Correlation without Slovenia: -0.46*
Switzerland
Czech RepublicDenmark
France
England and Wales
Hungary
Israel
Italy
Japan
Korea
Netherlands
New Zealand
Poland
Portugal
Slovak Republic
SloveniaSweden
3
3
4
4
5
5
6
6
7
0.0 1.0 2.0 3.0 4.0 5.0 6.0 7.0
Log productivity of judges
Indicator of production of statistics (scale from 0 to 6, increasing in production)
Correlation coefficient: 0.57***
Correlation without England and Wales: 0.44*

ECO/WKP(2013)52
36
45. The goal of the analysis is to provide a first assessment of whether combining responsibilities over jurisdictional and managerial tasks in the hands of the chief judge is beneficial to court performance, or the latter is better enhanced by assigning managerial tasks to a distinct non-judge manager, either alone or jointly with the chief judge, or to a different body. To this end, based on statistical procedures specifically designed for categorical variables, different models of court governance are identified, and their relationship with length of trials explored.28 The models are characterised by different allocations of accountability (who is the subject responsible for the performance related to the task) and authority (who is the subject with decisional power over the specific task) over the three broad categories of managerial tasks identified above. The considered subjects are: chief judge (CJ), chief administrative officer (CAO), jointly the CJ and the CAO (Joint), any other subject different from the CJ and the CAO (Other).29
46. Results from the analysis show that while the organisation and the supervision of judges’ activity tend to be prerogatives of the chief judge, countries differ with regard to the delegation of accountability and authority over the organisation and supervision of quasi-judicial officers and administrative staff, and the administration of the budget. Some countries assign most of the responsibilities over these tasks to the CJ and Other (group 1). In other countries, accountability and authority over these tasks lie mainly with the CAO and Other (group 3). Where accountability and authority over most of the tasks are jointly assigned to the CJ and the CAO, some countries give predominance to the CJ (group 4) and other countries give predominance to the CAO (group 5). Finally, there are countries (group 2) that display a higher dispersion of responsibilities (see Figure A2.1 for a visual inspection of the groups). Different governance models are associated with different average trial lengths (Table 5). The model associated with the best performance appears to be the one in which the chief judge has broader management responsibilities (group 1).
4.2 Demand side factors
47. The demand for justice services can be proxied by litigation rates, which vary considerably across countries, ranging from around one case every ten people in Russia to one every fifty people in Switzerland and less than one every three hundred people in Finland (Figure 18).30 An increase in litigation implies that courts are faced with a larger amount of cases to be solved. The increase in workload is likely to generate congestion and hence to lengthen the duration of trials, if the supply of justice does not adjust accordingly. OECD estimates (based on the DB measure of length to maximise available observations) confirm this conjecture, both with OLS and IV regressions, in which the litigation rate is instrumented with the main religious affiliation of each country (Tables 6, A2.3 and A2.4).31
28 Countries have been compared along the dimensions described below using multiple correspondence analysis (MCA).
See Annex 1 for details on the methodology. 29 “Chief judge” is used as a general term to refer to a judge designated to the management of the court, who takes up
leadership and organisational responsibilities while possibly maintaining his adjudicative duties. “Chief administrative officer” refers on general terms to a subject – non-judge – appointed to an exclusively managerial position. The term “Joint” refers to a situation in which both the chief judge and the chief administrative officer share managerial power and accountability. This would be the case, for instance, of a court administered by a board in which both the chief judge and the chief administrative officer seat. Governance arrangements differing from these are labeled as “Other”.
30 Litigation rates are defined as the ratio of the number of new civil cases commenced in a given year to population or GDP.
31 The validity of the IV model rests on the assumption of valid exclusion restrictions. In this case it is assumed that religious traditions have an impact on trial length through litigation only, i.e. excluding any direct effect. However, in principle it cannot be excluded that religious traditions may affect trial length through other channels, like for example judges’ and lawyers’ work ethic.

ECO/WKP(2013)52
37
Table 5. Governance models and trial length
Note: Groups are ordered by average trial length in first instance. Models of court governance are identified by the distribution of authority and accountability over a set of managerial tasks falling within the broad categories of: organisation and supervision of judges, organisation and supervision of quasi-judicial officers and administrative staff and their appointment, budget administration. The distribution can take different configurations, depending on the subject with authority or accountability: the chief judge (CJ), the chief administrative officer (CAO), jointly the CJ and the CAO (Joint), any other subject different from the CJ and the CAO (Other).
Source: OECD and DB
Figure 18. Litigation rates
Note: The civil litigation rate is defined as the ratio of the number of new civil cases commenced in a given year to the population (per capita litigation rate) or to GDP (in PPP current US dollar). Australia, England and Wales, the Netherlands, New Zealand and Turkey are not included in the figure as their litigation rates have been estimated (as explained in the Annex 1) and are therefore not fully comparable. These countries are included in the regression estimations, with the addition of a specific fixed effect.
Source: OECD and CEPEJ
Governance models Country Trial length (in days)
Standard deviation
Group 1 Authority and accountability to CJ and Other
Hungary, Finland, Czech Republic, Australia, Korea, Germany
400 122
Group 2 More dispersed authority and accountability
The Netherlands, Portugal, Belgium, Mexico, France
462 88
Group 3 Authority and accountability to CAO and Other
England and Wales, Ireland, Spain, Slovak Republic, Greece
590 157
Group 4Authority and accountability jointly to CJ and CAO w ith CJ predominance
Denmark, Poland, Sw itzerland, Scotland, Slovenia, Sw eden
638 360
Group 5Authority and accountability jointly to CJ and CAO w ith CAO predominance
Italy, New Zealand, South Africa 675 501
0
0.5
1
1.5
2
2.5
3
3.5
4
4.5
5
0
0.02
0.04
0.06
0.08
0.1
0.12Per capita litigation rate (left scale) Litigation rate relative to GDP (right scale)

ECO/WKP(2013)52
38
Table 6. Trial length is positively and significantly related to litigation per capita
Note: Standard errors in parentheses, *** p<0.01, ** p<0.05, * p<0.1. Column 1 reports the estimates of a between-group model (one observation for each country obtained as the time-average of the variables by country). Column 2 reports the estimates of a pooled regression, including time fixed effects. Column 3 reports second stage estimates of an IV regression (using a pooling model with time fixed effects). Litigation is instrumented using the main religious affiliation of each country. The first stage regression reads: Log litigation per capita = - 6.15** + 0.320 Log GDP PPP per capita - 0.014 Number of procedures - 0.215 Catholic + 0.053 Orthodox - 0.389 Muslim - 1.477*** Protestant (see Table A2.4 for details). The regression includes year fixed effects and clustered standard errors by country. Each religion dummy refers to the main religious affiliation of the country, the excluded being Atheism. Legal origin dummies are omitted because of possible collinearity with religion dummies.
Source: CEPEJ and DB
48. Aside from possible measurement and accounting issues, cross-country differences in litigation rates can be related to various factors. These can be separated into those that are “internal” to the organisation and the functioning of the justice system, and those that are “external” and related to cultural traits and general characteristics of the economies. The number of cases that are brought to court is a function of the frequency of disputes in a society, which is influenced by the volume and complexity of economic transactions, the quantity and quality of social relationships (social capital), the efficiency and integrity of the public administration. Also, the frequency of disputes may be affected by the business cycle. Some of these factors are examined below.
4.2.1 External factors
Cultural traits
49. Litigation may be affected by cultural elements rooted in deep historical processes. The influence of these factors is here evaluated using a set of dummies representing the main religious affiliation of each country. Table A2.4 (columns 2 and 4) shows that Protestantism is associated with lower litigation rates than other religious traditions. While a thorough understanding of the interrelationships between cultural factors and litigation would require a more in-depth investigation, this finding lends some empirical support to the idea that different cultural backgrounds are likely to generate different propensities to litigate.
(1) (2) (3)Log trial length Log trial length Log trial length
1st inst. 1st inst. 1st inst.Log litigation per capita 0.190** 0.166*** 0.301***
(0.093) (0.052) (0.089)Number of procedures 0.018* 0.022* 0.021*
(0.010) (0.012) (0.011)Log GDP PPP, per capita 0.082 0.142*
(0.117) (0.073)
Observations 40 151 151R-squared 0.406 0.386 0.159Instance 1 1 1Length measure DB DB DBLegal origin dummies YES YES NOYear dummies NA YES YESClustered SE by country NA YES YES

ECO/WKP(2013)52
39
Sectoral composition of the economy
50. The volume and complexity of economic transactions is related to the sectoral composition of the economy, through its association with the number and size of firms in the market, and the type and content of stipulated contracts (e.g. degree of incompleteness). Controlling for time-invariant unobservable characteristics of each country and non-linear common time trends in litigation, empirical estimates suggest that the sectoral composition of the economy – as measured by the shares of employment in agriculture and services relative to the share of employment in industry – significantly affects litigation rates, even though the impact is quantitatively modest (Table 7). Specifically, higher shares of employment in agriculture and services relative to industry are related to higher litigation. This may reflect the higher fragmentation of the agricultural and service sectors, the greater uncertainty of returns in agriculture (due, for instance, to their higher dependence on climatic conditions) or the higher degree of contract incompleteness in the service sector (due for instance to larger asymmetry of information between suppliers and final and intermediate consumers).
Table 7. The sectoral composition of the economy has a significant impact on litigation
Note: Robust standard errors in parentheses, *** p<0.01, ** p<0.05, * p<0.1. Fixed effects regression. The excluded variable is employment in industry as a percentage of total employment.
Source: CEPEJ
Social capital
51. Social capital could affect litigation in two different ways. First, social norms can impose a stigma on bad behaviour that is likely to reduce the propensity of parties to breach contracts and enter into a dispute. Second, social trust may reduce the likelihood of conflict and litigation by favouring out-of-court settlement of disputes. In the spirit of Putnam (1993), social capital is here proxied with the average level of trust in the country, as measured by the World Value Survey. Figure 19 provides some evidence of a negative relationship between litigation and trust. However, the correlation loses significance when conditioning on the level of GDP and the legal origin of the country, suggesting that the correlation is likely to be explained by other factors correlated with legal origins. 32
32 The relationship between litigation and social capital is also analysed in Ramseyer (2012), using data on divorce and
traffic accidents in Japan. In communities with high levels of social capital divorces are less frequent. However, holding constant the number of divorces, divorces are more likely to be litigated in communities with higher social capital. Conversely, social capital reduces litigation over traffic accidents.
Log litigation per capita
Employment in agriculture (% of total employment) 0.032***(0.009)
Employment in services (% of total employment) 0.034**(0.014)
Log GDP PPP, per capita 0.164(0.158)
Observations 141R-squared 0.171Number of clusters 38Country f ixed effects YESYear fixed effects YESClustered SE by country YES

ECO/WKP(2013)52
40
Figure 19. Litigation and trust
Note: The measure of trust is taken from the World Value Survey, in which respondents are asked whether “most people can be trusted or not”. The indicator reported on the x-axis represents the percentage of interviewees for each country who responded that “most people can be trusted” (country averages are computed on available years from 1981 to 2008). The per capita civil litigation rate is defined as the ratio of the number of new civil cases commenced in a given year to the population.
Source: OECD, CEPEJ and WVS
Government effectiveness, regulatory quality and integrity of the public sector
52. Good-quality regulation and a timely and effective implementation of policies reduce the likelihood of conflicts both between private parties, and between the State and the private sector. By reducing the transparency and certainty of the business environment, the presence of corruption can have an opposite influence on the frequency of disputes. Table 8 provides empirical evidence on the association between these factors and litigation using World Bank indicators of government effectiveness, regulatory quality and integrity of public administration.33 Countries in which the public sector is perceived as more
33 The indicator of government effectiveness “captures perceptions of the quality of public services, the quality of the
civil service and the degree of its independence from political pressures, the quality of policy formulation and implementation, and the credibility of the government’s commitment to such policies” (http://info.worldbank.org/governance/wgi/pdf/ge.pdf). The indicator of regulatory quality “reflects perceptions of the ability of the government to formulate and implement sound policies and regulations that permit and promote private sector development” (http://info.worldbank.org/governance/wgi/pdf/rq.pdf). The indicator of integrity of the public administration “reflects perceptions of the extent to which public power is exercised for private gain, including both petty and grand forms of corruption, as well as “capture” of the state by elites and private interests” (http://info.worldbank.org/governance/wgi/pdf/cc.pdf). While these indicators offer a useful picture of the perceptions of the quality of governance, significant methodological shortcomings in their construction should be pointed out.
Australia
Switzerland
Czech Republic
GermanySpain
Estonia
Finland
France England and Wales
Hungary
Israel
Italy
Japan
Korea
Netherlands
Norway
New Zealand
Poland
Slovak RepublicSlovenia
Sweden
Turkey
Russia
-6.0
-5.5
-5.0
-4.5
-4.0
-3.5
-3.0
-2.5
-2.0
0 10 20 30 40 50 60 70 80
Log per capita litigation rate
Percentage of people agreeing that "most people can be trusted"
Correlation coefficient: -0.58***

ECO/WKP(2013)52
41
effective in implementing public policies and delivering quality services display lower litigation rates.34
Moreover, the design and implementation of quality regulations favouring the development of the private sector are also estimated to reduce litigation. Finally, legal conflicts are significantly less frequent in countries that are perceived to promote the integrity of the public sector and the control of corruption.35
Table 8. Government effectiveness, regulatory quality and the integrity of the public sector are significantly associated with litigation
Note: Robust standard errors in parentheses, *** p<0.01, ** p<0.05, * p<0.1.
Source: CEPEJ and WG indicators
Business cycle fluctuations
53. During downturns, economic agents have more difficulties in fulfilling their obligations and honour their contracts, and firms are more likely to experience financial distress. Consistent with this, fixed effects estimates suggest that litigation strongly increased during the recent recession (Table A2.5).36 The economic downturn induced an increase in litigation that in turn may have affected the effectiveness of the judicial system by generating congestion, thereby exerting a possible further negative influence on economic activity.
34 The impact of government effectiveness on per capita litigation remains significant also when controlling for country
fixed effects (on top of the logarithm of real GDP per capita, the number of procedures and time fixed effects) and clustering the standard errors by countries (not shown).
35 The positive impact on litigation of a corrupt public service is confirmed when measuring perceived corruption by means of the Corruption Perceptions Index developed by Transparency International, which scores and ranks countries on the basis of how much the country’s public sector is perceived as corrupt by various institutions.
36 The regressions include a set of country-fixed effects and clustered standard errors by country. The effect is robust, to including 2008 as a recession year. The result is consistent with the literature that finds that litigation is countercyclical (Ginsburg and Hoetker, 2006).
(1) (2) (3)Log litigation per
capitaLog litigation per
capitaLog litigation per
capitaNumber of procedures -0.012 -0.008 -0.015
(0.015) (0.015) (0.014)Log GDP PPP, per capita 0.937** 0.688* 0.829**
(0.425) (0.359) (0.324)Government effectiveness -0.694**
(0.282)Regulatory quality -0.592**
(0.270)Control of corruption -0.580***
(0.196)
Observations 148 148 148R-squared 0.525 0.502 0.533Legal origin dummies YES YES YESYear dummies YES YES YESClustered SE by country YES YES YES

ECO/WKP(2013)52
42
4.2.2 Internal factors
Costs
54. Turning to the internal factors, the private costs of trial are an obvious candidate for explaining litigation rates, with higher costs expected to lower litigation. However, no clear association emerges between the DB measure of trial costs and litigation rates.37 As the DB indicator measures total private costs including lawyers’ fees, it also reflects the length of trials. Total cost may be difficult to predict ex ante, i.e. at the stage in which the decision of bringing the case to court is taken. Also, other aspects could be important for explaining litigation, such as the structure of lawyers’ fees (hourly-rate, flat-rate, contingent fee), for which information is not available, or the rules determining the allocation of trial costs between the litigants (fee-shifting rules). Taking this into consideration, as a first step, the relationship between costs and litigation has been analysed using a very simple measure of “unitary” cost (i.e. cost per day of trial), constructed as the ratio of the DB measure of trial costs to trial length. Column 1 of Table 9 provides some evidence of a weakly significant negative correlation between the per capita litigation rate and this measure of unitary cost of trial, controlling for the number of procedures,38 the logarithm of real GDP per capita and legal origins. However, this evidence is based on a very small number of observations and should be taken with extreme caution, as the correlation could just reflect the positive relationship between litigation and length, rather than some meaningful relationship between costs and litigation.
Table 9. Litigation is significantly associated with unitary cost of trial and the free negotiation of lawyers' fees
Note: Standard errors in parentheses, *** p<0.01, ** p<0.05, * p<0.1. The regressions include a fixed effect, which controls for those countries whose litigation rates have been imputed according to the methodology described in Annex 1. In column 2, the excluded variable is "regulated lawyers' fees".
Source: OECD, CEPEJ and DB
37 This is true also if the availability of legal aid is taken into account. 38 The number of procedures refers to the number of procedural steps needed to complete the specific standardised
commercial dispute considered in the DB database. A procedure is defined as any interaction between the parties or between them and the judge or the court officer. Procedural steps include steps to file and serve the case, steps to assign the case to a judge, steps for trial and judgment and steps necessary to enforce the judgment.
(1) (2)Log litigation per
capitaLog litigation per
capitaNumber of procedures 0.006 0.061
(0.052) (0.054)Unitary cost of trial -16.645*
(8.174)Log GDP PPP, per capita -0.057 0.223
(0.566) (0.564)Freely negotiated fees -0.709*
(0.389)
Observations 29 29R-squared 0.513 0.496Legal origin dummies YES YES

ECO/WKP(2013)52
43
The cost-shifting rules
55. Litigation can be influenced by the rules determining the allocation of trial costs between the litigants (fee-shifting rules). In this regard, a distinction is often made between the American and the British fee-shifting rule. Under the American rule, each litigant pays its own costs; conversely, under the British rule costs are fully borne by the losing party. In between these two, there are arrangements under which only a fraction of the costs is borne by the losing party (“halfway” rule). The British rule is claimed to induce better litigation decisions, by filtering out non-meritorious cases.39 According to OECD data (Table 10), the British rule is the most widely adopted across countries (23% of respondents to the survey). A “halfway rule” applies in 7% of the countries, while the American rule is in force in 7% of them. In the remaining systems, either more than one rule can apply or the judge has discretion on the allocation of costs between parties or both. Despite that in some of these cases information has been retrieved on the standard practice, the absence for many countries of a definite rule makes it difficult to empirically investigate the relationship with litigation. A simple correlation analysis based on the information available does not display any meaningful association between litigation and fee-shifting rules.
Table 10. Fee-shifting rules and regulation of lawyers' fees by country
Note: Information marked by an asterisk was not provided in the answers to the questionnaire, and has been constructed using various online sources. For judicial systems in which different fee-shifting rules apply or the judge has discretion on the allocation of fees, the usual practice has been retrieved, where possible, from various online sources.
Source: OECD and CEPEJ
39 Shavell (1982) shows that the British rule encourages the litigation of cases with relatively small claims but an ex-ante
relatively high probability of victory, while the American rule that of cases with relatively larger claims but a lower probability of victory.
Country British rule "Halfway" rule
American rule
Discretion of the judge Usual practice* Freely
negotiatedRegulated by
bar Regulated by law
Australia x xAustria x* xBelgium x* x Halfway xCzech Republic x x British xDenmark x xEngland and Wales x x British xEstonia x* xFinland x xFrance x* x Halfway xGermany x xGreece x* xHungary x* x British xIceland xIreland x xIsrael x xItaly x x Halfway xJapan x xKorea x xLuxembourg x* xMexico x xNetherlands x* x* x Halfway or American xNew Zealand x xNorthern Ireland xNorway xPoland x x xPortugal x xRussia xScotland x xSlovak Republic x x British xSlovenia x xSouth Africa x xSpain x xSweden x x British xSwitzerland x xTurkey x
Regulation of lawyers' feesFee-shifting rule

ECO/WKP(2013)52
44
Lawyers’ incentives
56. One implication of the asymmetric information between lawyers and clients that characterises the market for legal services is that the decision of whether to file a case in court or not is often effectively taken by the lawyer. In taking this decision lawyers respond to their incentives as shaped by the joint effect of the fee regulation – including rules on pricing transparency – and the organisation of the supply of legal services40.
57. Lawyers’ fees may be freely negotiated between lawyers and clients, or regulated by professional associations or by law. The OECD dataset provides information on fee regulation for 35 countries. 29% of the countries declared to have freely negotiated fees, 40% to have fees regulated by law and 31% to have fees regulated by the bar association (Table 10). Subject to the same cautionary notes as for costs, estimates suggest that freely negotiated fees show some association with lower litigation rates, even after controlling for legal origins (Table 9, column 2). 41 The relationship could be explained by the fact that market competition constrains the rents available for sharing. This limits the scope for rent extraction by lawyers and therefore reduces the number of cases that they find profitable to bring to court (rather than settle).
4.2.3 Other factors influencing the demand for justice
58. Cross-country variations in the demand for justice could also be explained by other factors not analysed here due to the lack of cross-country comparable information. Litigation is clearly influenced by the quantity and quality of the substantive law. First, regulatory systems differ in the scope assigned to the judiciary in the implementation and interpretation of legal provisions. Some countries rely more on rules while others assign a more active role to the courts (labour market regulation is an example in this respect). Thus, cross-country differences in litigation are also likely to reflect the impact of the existing regulation.42 Within the same regulatory framework, litigation is affected by the clarity of legislation. A complex, opaque and inconsistent legislation generates uncertainty, which in turn increases litigation. Policies aimed at improving the clarity of legislation can be important instruments to reduce court congestion.
59. Litigation is also likely to be influenced by the availability of procedures to resolve disputes outside the court system, such as mechanisms of alternative dispute resolution (ADR).43 Because such mechanisms are often administered by private bodies, data on the number of cases resolved through ADR or the cost of ADR procedures relative to that of court proceedings are hard to collect. Data based on country estimates of the percentage of domestic commercial disputes resolved through arbitration (as opposed to going to court) and the relative costs of this procedure have been collected for 8 countries. Based on this very limited information, there seems to be no relationship between the use of arbitration and its costs. While the costs of arbitration are lower or comparable to that of court proceedings in 7 of the 8
40 Differences in definitions and classifications of the legal profession across countries as well as obvious endogeneity
issues make it difficult to empirically investigate the correlation between litigation and the supply of service (the number of lawyers over population). However, a positive and causal relationship between the number of lawyers and the level of litigation has been found in analysis exploiting within-country variations (Carmignani and Giacomelli, 2010, and Buonanno and Galizzi, 2010 for Italy; and Ginsburg and Hoefker, 2006, for Japan).
41 Also, freely negotiated fees tend to be associated with lower trial costs (Table A2.6). 42 Conversely, when structural reforms are designed, one should take into account to what extent their impact depends on
a well-functioning civil justice. 43 Alternative dispute resolution mechanisms are of two types: i) methods for resolving disputes outside of the official
judicial mechanisms, and ii) informal methods attached to or pendant to official judicial mechanisms. The OECD questionnaire concentrated on the former. Questions were asked with reference to arbitration and mediation/conciliation.

ECO/WKP(2013)52
45
respondent countries, in just 3 of them the percentage of domestic commercial disputes resolved through arbitration is above 20%; in the remaining 4 the same percentage is below 5%. For mediation, the costs are lower or comparable to those of court proceedings in 8 of the 9 respondent countries. Still, in 6 of them the percentage of domestic commercial disputes that are resolved through mediation is very low (below 5%). While these figures should be taken with extreme caution, they seem to suggest that other factors are more important than costs in inducing economic agents to resort to ADR mechanisms. Adequate regulation, incentives for lawyers to encourage their clients to use these instruments, and measures to improve information on their availability and potential advantages are possible candidates.
5. Conclusion
60. The paper provides new cross-country evidence on the characteristics of judicial systems and analyses systematically the factors that may help explaining differences in performances, especially trial length. The analysis suggests that measures that are likely to reduce trial length can differ depending on whether poor performance tends to arise from inefficiencies on the demand or the supply side. Among the countries with the lengthiest trials, some display high litigation rates (e.g. Greece, Italy and the Czech Republic), while others (e.g. the Slovak Republic, Slovenia, Poland and Israel) have litigation rates comparable to those of the best performers. In this second group of countries, priority could be given to policies increasing the capacity of the system to meet the demand for justice, such as raising investments in computerisation (especially in Poland and Slovak Republic), adopting more advanced caseflow management techniques (Slovenia, Poland and Israel), or enhancing the degree of court specialisation (Israel). Conversely, in countries displaying high litigation rates (e.g. Greece, Italy and Czech Republic), policies could be primarily aimed at reducing the number of disputes resolved through the court system. Nonetheless, there is scope for improvements also on the supply side, for instance expanding the use of caseflow management techniques (e.g. in Italy).
61. The new OECD dataset provides insights on some of the characteristics of judicial systems that were not covered by previously available data. Unfortunately not all countries or dimensions could be covered. The resulting dataset therefore contains a number of missing observations and variables that have inevitably limited the scope of the analysis. The scarcity of comparable data is a more general problem in this field and a major obstacle to cross-country analyses of judicial systems. Importantly, much analysis in this report is of necessity confined to cross-country correlations, raising issues about the causal links behind the findings. Data limitations reflect large differences in the systems, but also dissimilarities in the way court statistics are collected across countries. The production of harmonised official statistics on judicial system characteristics and outcomes, including trial length and costs, would be desirable for exploring the factors that can promote efficiency in civil justice. Statistical agencies may coordinate in this respect in order to produce and make available data on judicial system performance across countries and over time. The time dimension would be particularly useful for overcoming the problems of system comparability and for analysing the causal effects of judicial reforms by means of quantitative methods. The benefits that would arise in terms of analytical development, information availability for policymakers, accountability and transparency could well outweigh the costs.

ECO/WKP(2013)52
46
REFERENCES
Bae, K.H. and V.K. Goyal (2009), "Creditor Rights, Enforcement, and Bank Loans", Journal of Finance, 64(2), 823-860.
Batra, G., D. Kaufmann and A. Stone (2003). Voices of the firms: investment climate and governance findings of the world business environment survey, World Bank, Washington, DC.
Beck, T., A. Demirguc-Kunt, and V. Maksimovic (2006), "The Influence of Financial and Legal Institutions on Firm Size", Journal of Banking & Finance: 2995–3015.
Buonanno, P. and M.M. Galizzi (2010), Advocatus, et non latro? Testing the Supplier-Induced-Demand Hypothesis for Italian Courts of Justice. Working Papers 2010.52, Fondazione Eni Enrico Mattei.
Buscaglia, E. and M. Dakolias (1999). "Comparative International Study of Court Performance Indicators", Legal and Judicial Reform Series, World Bank Publications and Research on Law and Justice Institutions, available at http://www.worldbank.org/external/default/WDSContentServer/WDSP/IB/2000/08/04/000094946_00072605391760/Rendered/PDF/multi_page.pdf.
Carmignani, A. and S. Giacomelli (2010). Too many lawyers? Litigation in Italian civil courts. Temi di discussione (Working Papers) 745. Banca d’Italia.
Casas-Arce, P. and A. Sais (2010), "Owning versus Renting: Do Courts Matter?", Journal of Law and Economics, 53(1): 137-165.
Chemin M., (2012), "Does Court Speed Shape Economic Activity? Evidence from a Court Reform in India", Journal of Law, Economics, & Organisation, 28(3): 460: 485.
Círculo De Empresarios (2003), Justicia, economía y empresa. Círculo de Empresarios. Madrid.
Clark, D.S., and J.H. Merryman (1976), "Measuring the Duration of Judicial and Administrative Proceedings, Michigan Law Review, 75(1): 89-99.
Cross, F.B. and D.C. Donelson (2010), "Creating Quality of Courts", Journal of Empirical Legal Studies 7(3): 490–510.
Dari-Mattiacci, G. and B. Deffains (2007), "Uncertainty of Law and the Legal Process", Journal of Institutional and Theoretical Economics, 163(4): 627-656.
Deffains, B. (2011), "Economics of Civil Justice: An Explorative Study", ECO/CPE/WP1(2011)17/ANN1. OECD, Paris.
Demirgüç-Kunt, A. and V. Maksimovic (1998), “Law, Finance, and Firm Growth”, Journal of Finance, 53(6): 2107-2137.
Deyneli, F. (2012), "Analysis of Relationship between Efficiency of Justice Services and Salaries of Judges with Two-Stage DEA Method", European Journal of Law and Economics, 34: 477-493.

ECO/WKP(2013)52
47
Djankov, S., R. La Porta, F. Lopez-de-Silanes and A. Shleifer (2003), "Courts", Quarterly Journal of Economics, 453-517.
Djankov, S., C. McLiesh and A. Shleifer (2007), "Private Credit in 129 Countries", Journal of Financial Economics, Elsevier, 84(2): 299-329.
Djankov, S., O. Hart, C. McLiesh and A. Shleifer (2008), "Debt Enforcement Around the World", Journal of Political Economy, 116(6): 1105-49.
Dougherty, S. (2012), Legal Reform, Contract Enforcement and Firm Size in Mexico, mimeo.
Fabbri, D. (2010), "Law Enforcement and Firm Financing: Theory and Evidence", Journal of the European Economic Association, 8(4): 776-816.
Ferguson, S. M. and S. Formai (2011). Institution-Driven Comparative Advantage, Complex Goods and Organisational Choice, Stockholm University Department of Economics Research Paper n.2011:10.
García-Posada, M. and J.S. Mora-Sanguinetti (2013), Firm Size and Judicial Efficacy: Evidence for the new civil procedures in Spain. Documentos de Trabajo 1303. Banco de España.
Garoupa, N., N. Jorgensen and P. Vazquez (2010), "Assessing the Argument for Specialised Courts: Evidence from Family Courts in Spain", International Journal of Law, Policy and the Family, 24 (1): 54-66.
Giacomelli, S. and C. Menon (2013), Firm Size and Judicial Efficiency in Italy: Evidence from the Neighbour's Tribunal, Temi di discussione (Working Papers) 898. Banca d’Italia.
Ginsburg and Hoetker (2006), "The Unreluctant Litigant? An Empirical Analysis of Japan’s Turn to Litigation", Journal of Legal Studies, 35: 31-59
Ichino, A., M. Polo and E. Rettore (2003), "Are Judges Biased by Labor Market Conditions?", European Economic Review, 47(5): 913–944.
Jappelli, T., M. Pagano and M. Bianco (2005), "Courts and Banks: Effects of Judicial Enforcement on Credit Markets", Journal of Money Credit and Banking, 37(2): 223-244.
Johnson, S., J. McMillan and C. Woodroof (2002), "Courts and Relational Contracts", Journal of Law, Economics and Organisation, 18: 221-277.
Kumar, B., R. Rajan and L. Zingales (2001), What Determines Firm’s Size, NBER Working Paper 7208.
Laeven, L. and C. Woodruff (2007), "The Quality of the Legal System, Firm Ownership and Firm Size", The Review of Economics and Statistics, 89: 601-614.
Marchesi, D. (2003), Litiganti, avvocati e magistrati: Diritto ed economia del processo civile. Il Mulino.
Mora-Sanguinetti, J.S. (2010), "A Characterisation of the Judicial System in Spain: Analysis with Formalism Indices", Economic Analysis of Law Review 1 (2): 210-240.
Mora-Sanguinetti, J.S. (2012), "Is Judicial Inefficacy Increasing the Weight of the House Property Market in Spain? Evidence at the Local Level", SERIEs, Journal of the Spanish Economic Association 3(3): 339-365.

ECO/WKP(2013)52
48
Nunn, N. (2007), "Relationship-Specificity, Incomplete Contracts and the Pattern of Trade", The Quarterly Journal of Economics 122(2): 569-600.
Putnam, R.D. (1993), “The Prosperous Community: Social Capital and Public Life”, in the American Prospect, 4:13.
Qian, J. and P. Strahan (2007), "How Law and Institutions Shape Financial Contracts: The Case of Bank Loans", Journal of Finance, 62(6): 2803-2834.
Ramseyer, J.M. (2012), “Litigation and Social Capital: Divorces and Traffic Accidents in Japan”, The Harvard John M. Olin Discussion Paper Series, No. 727.
Rosales-López, V. (2008), "Economics of Court Performance: An Empirical Analysis", European Journal of Law and Economics 25(3): 231-251.
Shavell, S. (1982), “Suit, Settlement and Trial: A Theoretical Analysis Under Alternative Methods for the Allocation of Legal Costs”, Journal of Legal Studies 11(1): 55-81.
Shvets, J. (2012) Judicial Instituions and Firms’ External Finance: Evidence from Russia, Journal of Law, Economics, and organization doi:10.1093/jleo/ews006.
Voigt, S. and N. El Bialy (2012), Identifying the Determinants of Judicial Performance: Taxpayers’Money Well Spent?, Working Paper available at: http://papers.ssrn.com/sol3/papers.cfm?abstract_id=2241224.
World Bank (2012), Doing Business 2011. Washington, DC: World Bank Group.

ECO/WKP(2013)52
49
ANNEX 1. DETAILS ON THE CONSTRUCTION OF THE CIVIL JUSTICE INDICATORS
62. The Annex describes the OECD dataset (see Box 2) and provides methodological details on the construction of the indicators used in the analysis.
A.1 Treatment of federal countries
63. Federal countries were asked to complete the questionnaire both for the federal jurisdiction and for the state jurisdiction of the most representative sub-national entity. Four federal countries appear in the OECD dataset: Germany, Switzerland, Australia and Mexico. Germany and Switzerland provided data for all sub-national courts and for federal courts. Australia provided data for federal courts and for those of the state of Victoria. Information for Mexico is only available for federal courts.44 In the case of Australia the following procedure was adopted in order to combine into a unique record the information at the federal and the state level:
• For quantitative answers (case flows, human resources, financial resources), the state-to-federal population ratio was used to make the proportion of state-level figures to the whole-country ones; then the figure at the federal level was added. In this way, a virtual figure for the whole country (state and federal) was built.
• For qualitative answers, the “merged” record (i.e. Australia) reports those answers that were the same at the state and federal level; on the contrary, in those cases in which the answer at the state level did not correspond to that at the federal level, a value equal to the average of the values assumed by the indicator at sub-national levels was attributed to the country as a whole.
A.2 Civil justice indicators
64. Categories of cases – The indicators of length, appeal rates, litigation rate, and productivity refer to all civil cases over matters in controversy between the parties except, if possible, administrative cases. Civil cases include: contracts, labour, insolvency and bankruptcy, intellectual property, family, tort and personal injury, real property, social security, antitrust and competition law.
65. Length – Most countries do not produce statistics on the actual length of proceedings, i.e. the number of days elapsed from the date of filing to the date of disposition. Length has thus been estimated using the following formula proposed in the literature and commonly used in cross-country comparisons:
365*IRPP fi
+
+, where Pi stands for pending cases at the beginning of the year, Pf for pending cases at the
end of the year, I for incoming and R for resolved.45 Where information on the number of pending cases was not available but the country was able to provide information on the actual length, the latter was used.46 For the first instance only, for those countries for which neither the estimated length nor the actual
44 Mexico provided information on state courts only at a later stage and, therefore, information could not be incorporated
in the study. 45 See Clark and Merryman (1976) for a discussion of different methods for estimating the length of proceedings using
data on case flows. 46 These countries are England and Wales, Mexico, New Zealand, and the Netherlands. For the Netherlands, length is
calculated as the average actual length of contracts, bankruptcy and family disputes in district courts excluding summary proceedings.

ECO/WKP(2013)52
50
length was available,47 length has been calculated imputing the predicted value of the regression of the estimated length on the DB length.48 It should be noted that by averaging across different categories of cases, the OECD measure of length incorporates the actual composition of case flows in each country.49 Figure A1.1 illustrates the correlation between the OECD (excluding imputed values) and the DB measures of length. While they are positively correlated, differences emerge in the relative performance of some countries according to the two measures. Such differences may reflect dissimilarities in the type and complexity of case flows across judicial systems.
66. Appeal rates – The vast majority of countries does not produce statistics on appeal rates for appeals before the second instance and the highest court. Average appeal rates before the second instance (highest) courts have thus been estimated as the ratio of incoming civil cases in the second instance (highest) courts at time t, to resolved cases in the first (second) instance courts at time t-1. A modified measure of appeal rates has also been constructed, which relates the number of incoming cases before the higher instance (second instance or highest court) to the number of potential disputes in the economy. Assuming that the latter is a constant fraction of the population, the modified appeal rate before the second instance (highest court) is calculated as the number of incoming cases in second instance (highest court) as a percentage of population.
67. Litigation rate – The per capita civil litigation rate is defined as the ratio of new civil cases commenced in a given year to population. To make the most of available data, in part of the analysis, when not available, the number of new civil cases was reconstructed residually, subtracting the least pertinent cases from the “other than criminal” figure.50 This imputation method was used only for those countries for which it was judged methodologically appropriate: Australia, England and Wales, the Netherlands, New Zealand and Turkey.51
68. Productivity of judges – The productivity of judges is defined as the ratio of resolved civil cases across all instances to the total number of judges. When not available, the number of resolved civil cases was reconstructed using the same methodology as for the litigation rate. The imputation method was used only for those countries for which it was judged methodologically appropriate: the Netherlands, New Zealand and Norway.52 The total number of judges refers to professional judges working full-time and on an occasional basis (i.e. not performing their duty on a permanent basis but being fully paid for their function as judges). It does not include “non-professional judges” such as lay judges, judges of the peace, “juges consulaires”, etc.
47 These countries are: Belgium, Iceland, Ireland, Northern Ireland, Russia, Scotland, South Africa and Turkey. Russia
has been included in the group of countries for which estimated length was not available, as 12 days cannot be considered consistent with other comparable data.
48 The DB length refers to a standardised commercial dispute in first instance. Recorded in days, it includes: the time to file and serve the case, the time for the trial and the obtaining the judgment, and the time for the enforcement of the judgment.
49 For those countries for which trial length has been imputed, the composition of case flows corresponds to the average composition in the sub-sample of countries for which both the estimated and the DB length are available.
50 “Other than criminal” cases also include non-litigious cases (civil cases over matters not opposed or controverted), enforcement cases (proceedings started with the purpose of seeking enforcement of a court's previous judgment), land and business registry cases (registration of property or business), and administrative cases (disputes brought against local, regional, or national authorities).
51 The data for Turkey also include civil non-litigious cases; the data for Australia, England and Wales, New Zealand and the Netherlands also include civil non-litigious and enforcement cases; the data for Australia also include civil non-litigious, enforcement and administrative cases.
52 The data for New Zealand and Norway also include civil non-litigious cases and enforcement cases; the data for the Netherlands also include civil non-litigious cases and administrative cases.

ECO/WKP(2013)52
51
69. Total costs – The indicator is a measure of the total private cost of trial (as a percentage of the value of the claim) net of legal aid. More formally, it is constructed as the expected value of the cost, weighted by the probability of receiving legal aid: Totalcost = Pr legalaid * cost|legalaid +1- Pr legalaid * cost|nolegalaid , where Pr legalaid is computed as the ratio of cases “other than criminal” granted legal aid in all instances, to the total number of cases “other than criminal” in all instances. cost|legalaid equals zero, as the availability of legal aid eliminates the cost burden. The measure for cost is taken from the DB database and encompasses three different types of costs necessary to resolve a specific commercial dispute: court costs, i.e. all the fees that the plaintiff must advance to the court; enforcement costs, i.e. all the costs the plaintiff must advance to enforce the judgment; and average lawyers’ fees. The cost is recorded as a percentage of the claim, assumed to be equivalent to 200% of income per capita. The indicator is available for 46% of the surveyed countries.
70. Budget allocated to courts – The indicator is defined as the ratio of the budget allocated to court to GDP. The budget includes financial resources allocated to salaries of judicial and non-judicial staff working within courts, informatisation (installation, use and maintenance of computer systems), justice expenses (experts, court interprets, etc.), operating costs (maintenance, rental, utilities, etc.), investments in real estate (new court buildings), training and education, and a residual category of expenses; it does not include resources devoted to legal aid and public prosecution services. The budget refers to all courts. Some countries could not be included because the provided data did not allow separating the budget for legal aid and/or public prosecution services, thus making total budget not comparable across countries. The indicator is available for 69% of the surveyed countries.
71. Specialisation – Specialisation is assessed by looking at the existence of courts or sections with exclusive jurisdiction in one specific field of the law. Countries were asked to provide information on the existence of stand-alone specialised courts in first instance or alternatively specialised sections within courts of general jurisdiction in the following matters: commercial, labour, family, rent and tenancies, insurance and/or social welfare, administrative, other specialised courts. The existence of stand-alone courts has been considered equivalent to that of specialised sections.53 Additional information was asked on the types of cases falling within the jurisdiction of commercial courts, distinguishing among: commercial transactions, intellectual property, competition, corporate matters, and other commercial matters. Information has been summarised by means of principal component analysis. Two components have been considered: the first positively correlates with the presence of all types of specialised courts or sections considered and the number of matters covered by commercial courts, and therefore can be interpreted as a measure of the overall degree of specialisation; the second component opposes presence of specialised commercial courts or sections covering at least three matters, with positive sign, and presence of specialised labour, rent, and administrative courts or sections with negative sign and less weight. The indicators are available for 100% of the surveyed countries.
72. Implementation of information and communication technology – The indicator assesses the degree of implementation of different technologies of electronic communication and exchange of information within the courts. It is computed as a simple average of eight sub-indicators measuring the adoption by the courts of the following technologies: electronic web forms, website, follow-up of cases online, electronic registers, electronic processing of small claims, electronic processing of undisputed debt recovery, electronic submission of claims, and videoconferencing. Ranging from 0 to 6, each sub-indicator is increasing in the level of implementation of such technologies, as measured by the percentage of courts in the country that have adopted them: a value of 0 corresponding to a percentage of adopting courts of
53 In some countries specialised sections/divisions for some/all matters only exist in larger courts. The analysis was
repeated considering as specialised only systems with sections/divisions within all courts of general jurisdiction. Results proved robust to the change.
ECO/WKP(2013)52
52
0%, 1.5 to less than 10%, 4.2 to more than 10% and less than 50%, 5.7 to more than 50% and less than 100%, and 6 to 100%. The indicator is available for 94% of the surveyed countries.
73. Caseflow management techniques – The indicator measures the use of caseflow management techniques by the courts of first instance. The dimensions of caseflow management considered are: court supervision of the progress of cases and prompt intervention in the definition of issues; establishment, monitoring and enforcement of timeliness for completion of different steps in litigation; early identification of long or otherwise problematic cases; early screening for the selection of an appropriate dispute resolution track; early screening of cases for appropriate use of alternative dispute resolution (ADR). Information concerning the use of these caseflow management techniques consisted in dummies equal to one in cases in which the relevant technique is applied. It has been summarised by means of principal component analysis (PCA). Two main components were identified: the first correlates positively with all dimensions considered and therefore can be interpreted as a measure of the overall diffusion of caseflow management techniques; the second is strongly positively correlated with the use of early identification of long or otherwise problematic cases and mainly captures the use of this technique54. The indicators are available for 63% of the surveyed countries.
74. Production of statistics – The indicator (ranging from 0 to 6) assesses the extent to which courts produce statistics on their activity on a systematic basis. It is a weighted average of three sub-indicators of production of statistics, one for each instance (first, second, highest court), and is increasing in production. The weight for each of the sub-indicators is the ratio of the number of incoming cases in the considered instance over the sum of the number of incoming cases in all three instances. Each sub-indicator is increasing in the number of different statistics produced in the corresponding instance, on a scale from 0 to 6. The types of statistics examined are: incoming cases by case type, type of plaintiff/defendant, and monetary value of the claim; clearance rates by case type; pending cases and backlogs by case type; average length of proceedings by case type and stage of proceeding; average number of hearings by case type; average number and length of adjournments by case type; resolved cases by method of disposition; percentage of appeals; judges’ workload. All types of statistics produced are equally weighted. The indicator is available for 51% of the surveyed countries.
75. Governance systems – Governance systems refer to the distribution of accountability and authority over managerial tasks within the courts. The latter is assessed by a set of categorical variables indicating the subject (chief judge, chief administrative officer, the two subjects jointly, any other subject) having accountability and or authority on each of a set of identified tasks. Specifically, two sets of questions were asked. In the first, four main dimensions (length of proceedings, productivity, cost effectiveness, quality of the service provided) were considered and for each of them information was collected on who is accountable for the performance of the court. In the second, a bundle of tasks was identified that influences performance on each of the dimensions considered.55 Information was then collected on who has authority over each task. The distribution of these variables is summarised by means of multiple correspondence analysis (MCA), a methodology that allows to map each country on a bi-dimensional space and to detect countries with similar configurations (i.e. governance systems). The origin of the axes corresponds to the average distribution in the sample. The larger the distance of a country from 54 The second component is also but more weakly correlated with the court supervision of the progress of cases and
prompt intervention in the definition of issues (with a positive sign) and the early screening of cases for appropriate use of alternative dispute resolution (with a negative sign).
55 The considered tasks are: assignment of cases to judges; arrangement and supervision of calendaring of cases or hearing; design of the court internal organisation; administrative and supervisory authority over administrative staff; administrative and supervisory authority over judicial and quasi-judicial officers, and legal and judicial assistants; organisation and supervision of the organisational aspects of judges; management and supervision of the court budget; appointment of judicial and quasi-judicial officers, and legal and judicial assistants; appointment of administrative staff.

ECO/WKP(2013)52
53
the origin, the larger is the dissimilarity from the average, according to the dimensions indicated by the axes. The indicator is available for 71% of the surveyed countries.
Figure A1.1 DB and OECD trial length, first instance
Note: The Doing Business (DB) trial length refers to a specific commercial dispute. The OECD trial length in first instance is estimated with a formula commonly used in the literature: (Pendingt-1+Pendingt)/(Incomingt+Resolvedt) *365. The figure excludes those countries for which length has been imputed.
Source: OECD, CEPEJ and DB
Australia
AustriaSwitzerland Czech Republic
Germany Denmark
Spain
EstoniaFinland
France
England and Wales
Greece
Hungary
Israel
Italy
JapanKorea
Luxembourg
Netherlands
NorwayNew Zealand Poland
Portugal
Slovak Republic
Slovenia
Sweden
100
150
200
250
300
350
400
450
500
550
600
200 400 600 800 1000 1200
Trial length in days, first instance (OECD)
Trial length, first instance (DB)
Correlation coefficient: 0.6***

ECO/WKP(2013)52
54
ANNEX 2. BACKGROUND ANALYSIS
Table A2.1. Classification of national legal systems into major legal origins
Source: Djankov et al. (2007)
Table A2.2. The productivity of judges is greater where investment in computerisation and computer skills in the population are higher
Note: Standard errors in parentheses, *** p<0.01, ** p<0.05, * p<0.1. "Computer users" is defined as the share (on a 0-1 basis) of people with basic computer skills in the population.
Source: CEPEJ and Eurostat
Legal origin Countries
Common law Australia, England and Wales, Ireland, Israel, New Zealand,Northern Ireland, Scotland, South Africa
French Belgium, France, Greece, Italy, Luxembourg, Mexico, theNetherlands, Portugal, Spain, Turkey
German Austria, Czech Republic, Estonia, Germany, Hungary, Japan,Korea, Poland, Slovak Republic, Slovenia, Switzerland
Nordic Denmark, Finland, Iceland, Norway, Sweden
Former socialist Russia
(1) (2) (3) (4)Log Productivity of
JudgesLog Productivity of
JudgesLog Productivity of
JudgesLog Productivity of
Judges
0.517** 0.532** 1.454** 1.556***(0.210) (0.219) (0.549) (0.545)
1.121* 1.217**(0.558) (0.563)
Log computer users in the population 5.169** 5.534**(2.453) (2.464)
Log GDP per capita -0.696 -0.763 -0.913 -0.966(0.496) (0.524) (0.591) (0.593)
Observations 74 74 74 74R-squared 0.280 0.314 0.371 0.415Legal Origin Dummies YES YES YES YESYear Dummies NO YES NO YESClustered SE by Country YES YES YES YES
Log budget to informatization
Log computer users*Log budget toinformatization

ECO/WKP(2013)52
55
Table A2.3. Trial length is positively and significantly related to litigation per capita: OLS estimates
Standard errors in parentheses *** p<0.01, ** p<0.05, * p<0.1. Column 1 reports between-group estimates (one observation for each country obtained as the time-average of the variables by country). Year dummies included only in pooled regressions.
Source: CEPEJ and DB
Table A2.4. Trial length is positively and significantly related to litigation per capita: an IV approach
Note: Robust standard errors in parentheses, *** p<0.01, ** p<0.05, * p<0.1. Legal origin dummies are omitted because of possible collinearity with religion dummies.
Source: CEPEJ and DB
(1) (2) (3) (4) (5)Log Trial length Log Trial length Log Trial length Log Trial length Log Trial length
1st inst. 1st inst. 1st inst. 1st inst. 1st inst.Log Litigation Per Capita 0.190** 0.157*** 0.165*** 0.165*** 0.166***
(0.093) (0.043) (0.044) (0.053) (0.052)Number of Procedures 0.018* 0.020*** 0.020*** 0.020** 0.022*
(0.010) (0.005) (0.005) (0.010) (0.012)Log GDP PPP, Per Capita 0.082
(0.117)
Observations 40 153 153 153 151R-squared 0.406 0.373 0.378 0.378 0.386Instance 1 1 1 1 1Length Measure DB DB DB DB DBLegal Origin Dummies YES YES YES YES YESYear Dummies NA NO YES YES YESClustered SE by Country NA NO NO YES YES
(1) (2) (3) (4)
Log trial length 2nd Stage
Log trial length 1st Stage
Log trial length 2nd Stage
Log trial length 1st Stage
Log litigation per capita 0.323*** 0.301***(0.102) (0.089)
Log GDP PPP, per capita 0.082 0.321 0.142* 0.32(0.057) (0.281) (0.073) (0.286)
Number of procedures 0.021* -0.014(0.011) (0.023)
Main religion: Catholic -0.273 -0.215(0.290) (0.305)
Main religion: Orthodox -0.062 0.053(0.411) (0.463)
Main religion: Muslim -0.516 -0.389(0.534) (0.564)
Main religion: Protestant -1.507*** -1.477***(0.440) (0.423)
Observations 151 151 151 151R-squared 0.072 0.323 0.159 0.328Instance 1 1 1 1Year dummies YES YES YES YESClustered SE by country YES YES YES YES

ECO/WKP(2013)52
56
Table A2.5. Influence of the recent crisis on log litigation per capita
Note: Robust standard errors in parentheses, *** p<0.01, ** p<0.05, * p<0.1. Fixed effects regression. Post 2008 dummy is equal to 1 when year is 2010.
Source: CEPEJ
Table A2.6. Freely-negotiated lawyers’ fees are associated with lower trial costs
Note: Robust standard errors in parentheses, *** p<0.01, ** p<0.05, * p<0.1.
Source: CEPEJ and DB
(1) (2) (3) (4)Log per capita other
than criminal litigation rate
Log per capita civil law litigation rate
Log per capita other than criminal litigation rate
Log per capita civil law litigation rate
Post 2008 0.162*** 0.154*** -0.056 -0.028*(0.055) (0.042) (0.094) (0.014)
Post 2008 * French 0.203 0.187**(0.122) (0.079)
Post 2008 * German 0.337** 0.141***(0.141) (0.037)
Post 2008 * Nordic 0.056 0.186**(0.202) (0.076)
Post 2008 * Former socialist 0.217 0.356*(0.183) (0.185)
Observations 183 176 183 176R-squared 0.939 0.937 0.941 0.939Country dummies YES YES YES YESClustered SE by country YES YES YES YES
(1)Cost of trial
Freely negotiated fees -3.316*(1.965)
French * Freely negotiated fees
German * Freely negotiated fees
Nordic * Freely negotiated fees
Former socialist * Freely negotiated fees
Number of procedures -0.259(0.262)
Log GDP PPP, per capita -8.848***(2.634)
French -2.128(2.770)
German -4.076(2.794)
Nordic -1.673(4.866)
Former socialist -10.282*(5.222)
Observations 164R-squared 0.297Clustered SE by country YES
(2.611)5.019***(1.766)
1640.315YES
-9.018***(2.611)2.399
(4.474)0.55
(4.842)-13.722**(5.395)-0.235(0.261)
-7.824(4.907)-8.132**(3.557)-9.843**
(2)Cost of trial
3.644(2.763)

ECO/WKP(2013)52
57
Figure A2.1. Distribution of accountability and authority
Note: The x-axis opposes delegation of accountability and authority to the Chief Administrative Officer (CAO, left), to delegation of accountability and authority to the Chief Judge (CJ, right). The y-axis opposes delegation of accountability and authority jointly to the CJ and CAO (Joint, bottom), to delegation of accountability and authority to other entities (Other, top). The methodology of multiple correspondence analysis (MCA) is used to map each country on this bi-dimensional space and to detect countries with a similar concentration/dispersion of accountability/authority (see Annex 1 for details).
Source: OECD
Australia
England and WalesIreland
New Zealand ScotlandSouth Africa
Belgium
Spain
France
Greece
Italy
Mexico
Netherlands
Portugal
Switzerland
Czech Republic
Germany
HungaryKorea
Poland
Slovak Republic
Slovenia
Denmark
Finland
Sweden
-1.5
-1
-0.5
0
0.5
1
1.5
2
2.5
-2.5 -2 -1.5 -1 -0.5 0 0.5 1 1.5
Common law French German Nordic
Mov
ing
from
Joi
nt to
Oth
er
Moving from Chief Administrative Officer to Chief Judge
Group 3
Group 2
Group 4
Group 1
Group 5

ECO/WKP(2013)52
58
WORKING PAPERS
The full series of Economics Department Working Papers can be consulted at www.oecd.org/eco/workingpapers/
1059. Banks’ restructuring and smooth deleveraging of the private sector in Slovenia (June 2013) by Olena Havrylchyk 1058. Assessing the efficiency of welfare spending in Slovenia with data envelopment analysis (June 2013) by Matevz Hribernik and Rafał Kierzenkowski 1057. Policy determinants of school outcomes under model uncertainty: evidence from South Africa (June 2013) by Thomas Laurent, Fabrice Murtin, Geoff Barnard, Dean Janse van Rensburg,
Vijay Reddy, George Frempong and Lolita Winnaar 1056. Improving education quality in South Africa (June 2013) by Fabrice Murtin 1055. The 90% public debt threshold: the rise and fall of a stylised fact (June 2013) by Balázs Égert 1054. Challenges to sustain Poland’s growth model (June 2013) by Balázs Égert and Rafał Kierzenkowski 1053. Reforming agriculture and promoting Japan’s integration in the world economy (May 2013) by Randall S. Jones and Shingo Kimura 1052. Inequality and poverty in the United States: public policies for inclusive growth (May 2013) by Oliver Denk, Robert Hagemann, Patrick Lenain and Valentin Somma 1051. Fiscal federalism and its impact on economic activity, public investment and the performance
of educational systems (May 2013) by Hansjörg Blöchliger, Balázs Égert and Kaja Fredriksen 1050. Restoring Japan’s fiscal sustainability (May 2013) by Randall S. Jones and Satoshi Urasawa 1049. Measuring total factor productivity at the firm level using OECD-ORBIS (May 2013) by Peter Gal 1048. A projection method for public health and long-term care expenditures (June 2013) by Christine de la Maisonneuve and Joaquim Oliveira) Martins 1047. R&D, patenting and growth: the role of public policy (May 2013) by Ben Westmore 1046. Knowledge-based capital, innovation and resource allocation (May 2013) by Dan Andrews and Chiara Criscuolo 1045. Reforms for a Cleaner, Healthier Environment in China (April 2013) by Sam Hill

ECO/WKP(2013)52
59
1044. Making the tax system less distortive in Switzerland (April 2013) by Andrés Fuentes 1043. The determinants of informality in Mexico's states (April 2013) by Sean M. Dougherty and Octavio Escobar 1042. Legal reform, contract enforcement and firm size in Mexico (April 2013) by Sean M. Dougherty 1041. Improving the economic situation of young people in France (April 2013) by Hervé Boulhol Améliorer la situation économique des jeunes en France (avril 2013) par Hervé Boulhol 1040. Improving employment prospects for young workers in Spain (April 2013) by Anita Wölfl 1039. Youth labour market performance in Spain and its determinants - a micro-level perspective (April 2013) by Juan J. Dolado, Marcel Jansen, Florentino Felgueroso, Andres Fuentes and Anita
Wölfl 1038. The efficiency and equity of the tax and transfer system in France (April 2013) by Balázs Égert Efficacité et équité du système de prélèvements et de transferts en France (avril 2013) par Balázs Égert 1037. Income inequality and poverty in Colombia. Part 2. The redistributive impact of taxes and transfers (April 2013) by Isabelle Joumard and Juliana Londoño Vélez 1036. Income inequality and poverty in Colombia. Part 1. The role of the labour market (April 2013) by Isabelle Joumard and Juliana Londoño Vélez 1035. Policy options to durably resolve euro area imbalances (March 2013) by Yvan Guillemette and Dave Turner 1034. Labour market, welfare reform and inequality in the United Kingdom (March 2013) by Christophe André, Clara Garcia, Giulia Giupponi and Jon Kristian Pareliussen 1033. Work incentives and Universal Credit – reform of the benefit system in the United Kingdom (March 2013) by Jon Kristian Pareliussen 1032. Strengthening social cohesion in Luxembourg: making efficiency and equity go hand in hand (March 2013) by Jean-Marc Fournier and Clara Garcia 1031. The price of oil – Will it start rising again? (March 2013) by Jean-Marc Fournier, Isabell Koske, Isabelle Wanner and Vera Zipperer 1030. The system of revenue sharing and fiscal transfers in China (February 2013) by Xiao Wang and Richard Herd