Embed Size (px)
Citation preview
Just Doing IT? India’s Fabled Services Revolution Myths, Reality, Prospects and Challenges
Dr. Anupam Khanna November 17, 2014
Asian Regional Cooperation & Integration Roundtable Conference
Asian Development Bank, Manila
Outline
• India’s Fabled Services (Export) Revolution • Composition
• Sophistication
• Resilience
• Really All About IT and IT-enabled Services • Growth and Evolution
• Concentration (Markets, Geography,…)
• Trends and Potential Discontinuities
• Broadening the Base
3
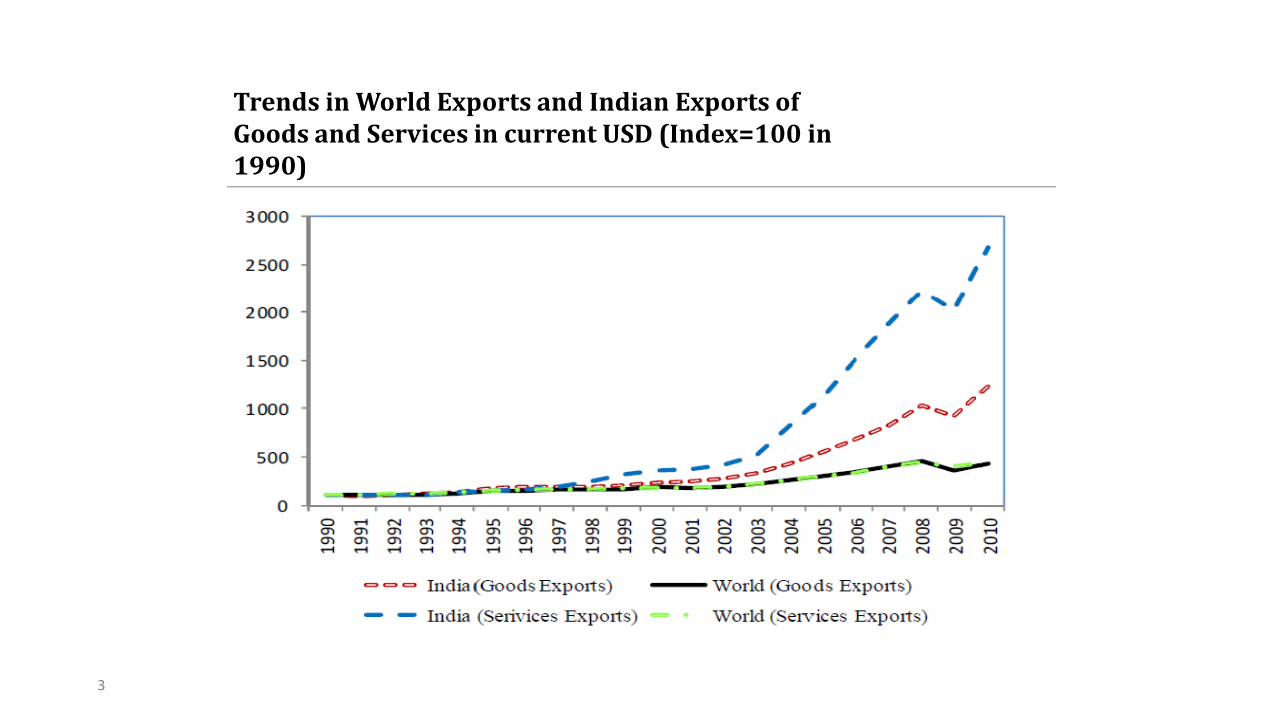
Trends in World Exports and Indian Exports of Goods and Services in current USD (Index=100 in 1990)
4
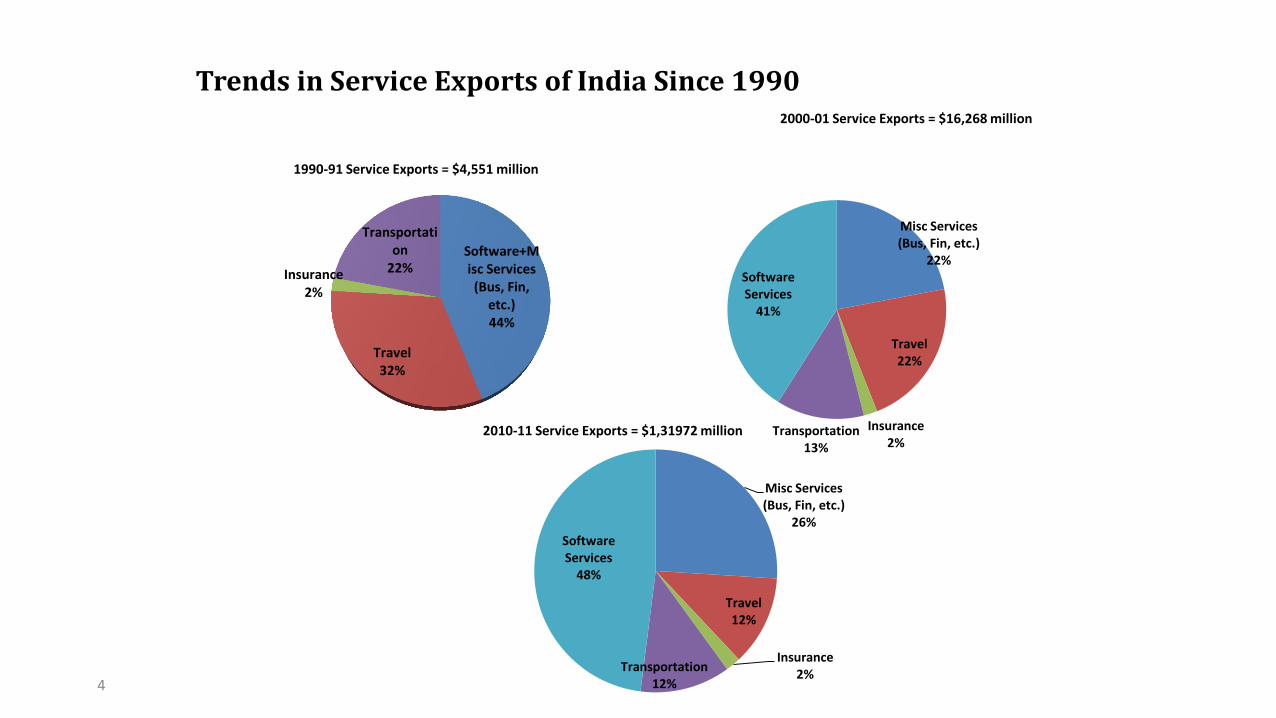
Trends in Service Exports of India Since 1990
Software+Misc Services (Bus, Fin,
etc.) 44%
Travel 32%
Insurance 2%
Transportation
22%
1990-91 Service Exports = $4,551 million
Misc Services (Bus, Fin, etc.)
22%
Travel 22%
Insurance 2%
Transportation 13%
Software Services
41%
2000-01 Service Exports = $16,268 million
Misc Services (Bus, Fin, etc.)
26%
Travel 12%
Insurance 2%
Transportation 12%
Software Services
48%
2010-11 Service Exports = $1,31972 million
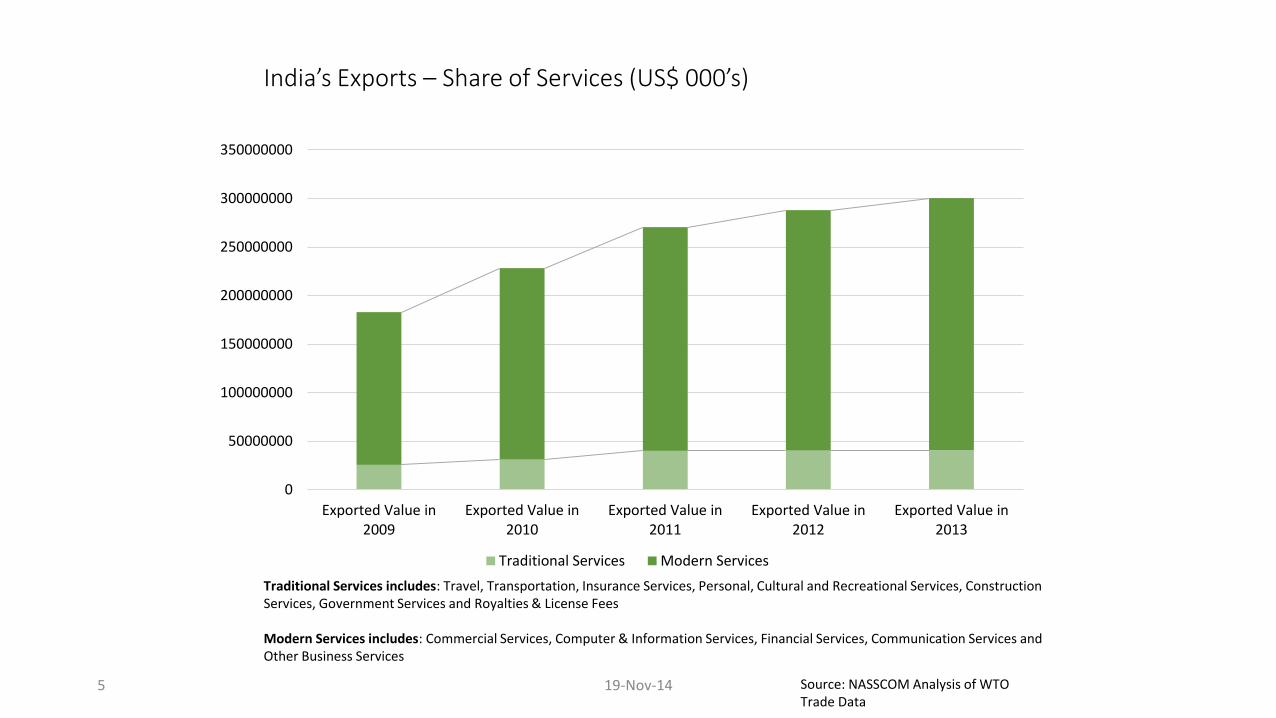
India’s Exports – Share of Services (US$ 000’s)
5 19-Nov-14
0
50000000
100000000
150000000
200000000
250000000
300000000
350000000
Exported Value in2009
Exported Value in2010
Exported Value in2011
Exported Value in2012
Exported Value in2013
Traditional Services Modern Services
Traditional Services includes: Travel, Transportation, Insurance Services, Personal, Cultural and Recreational Services, Construction Services, Government Services and Royalties & License Fees Modern Services includes: Commercial Services, Computer & Information Services, Financial Services, Communication Services and Other Business Services
Source: NASSCOM Analysis of WTO Trade Data
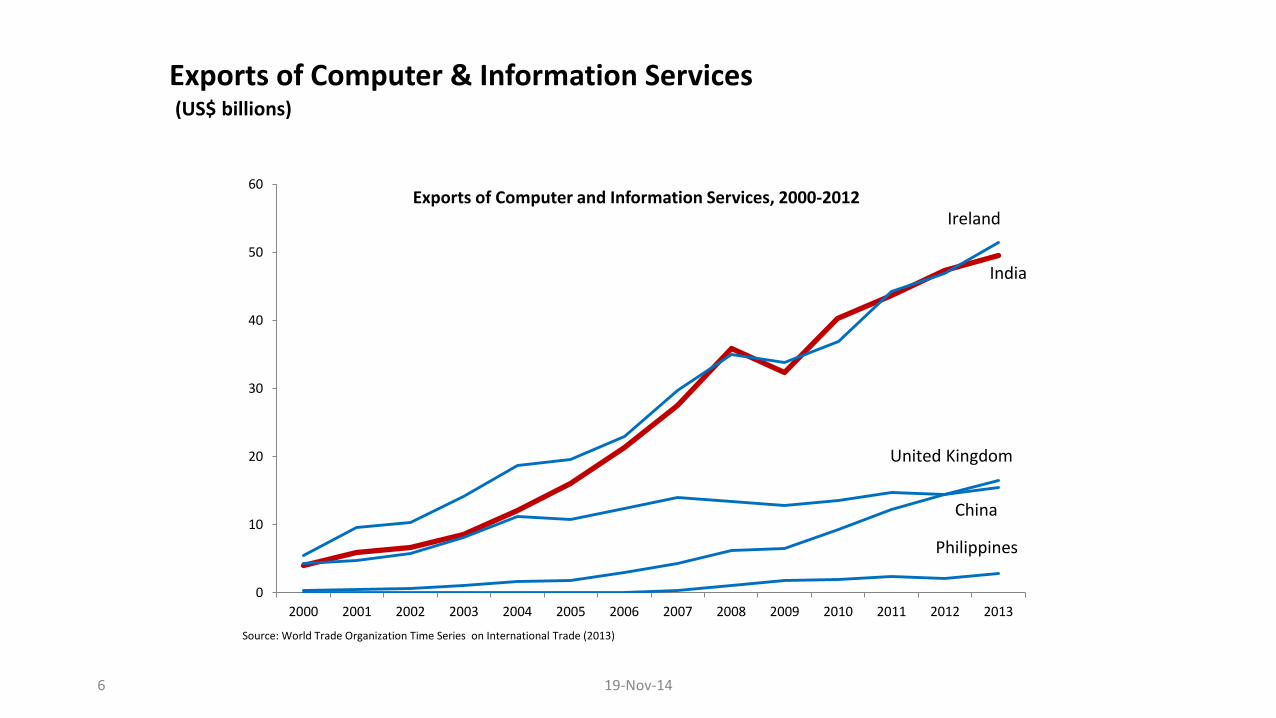
Exports of Computer & Information Services (US$ billions)
6 19-Nov-14
0
10
20
30
40
50
60
2000 2001 2002 2003 2004 2005 2006 2007 2008 2009 2010 2011 2012 2013
Exports of Computer and Information Services, 2000-2012
Source: World Trade Organization Time Series on International Trade (2013)
India
Ireland
United Kingdom
China
Philippines
7
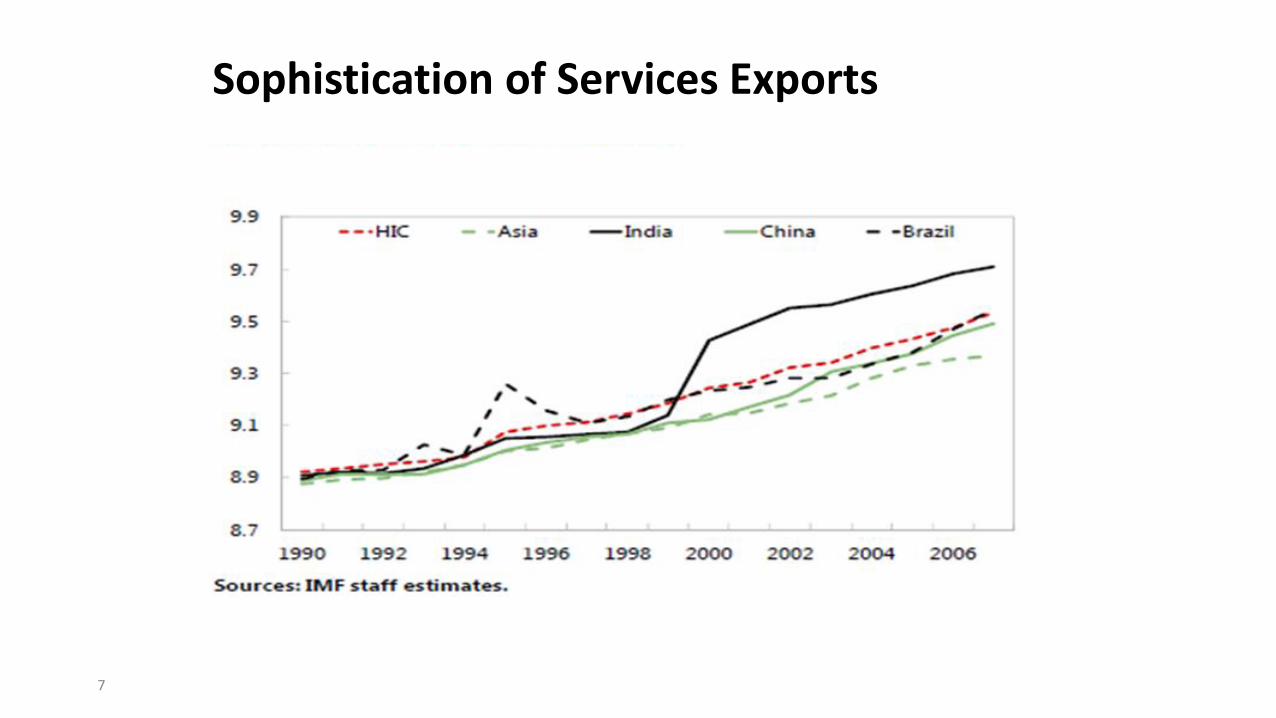
Sophistication of Services Exports
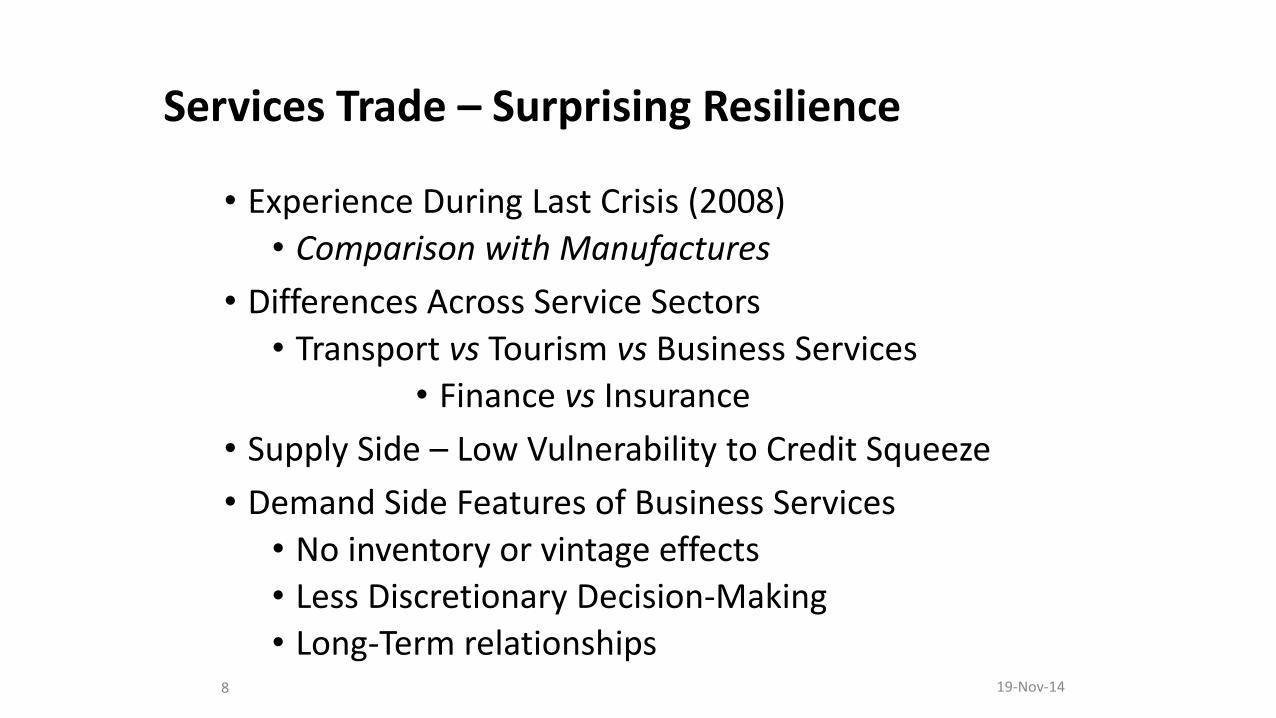
Services Trade – Surprising Resilience
• Experience During Last Crisis (2008)
• Comparison with Manufactures
• Differences Across Service Sectors
• Transport vs Tourism vs Business Services
• Finance vs Insurance
• Supply Side – Low Vulnerability to Credit Squeeze
• Demand Side Features of Business Services
• No inventory or vintage effects
• Less Discretionary Decision-Making
• Long-Term relationships
8 19-Nov-14
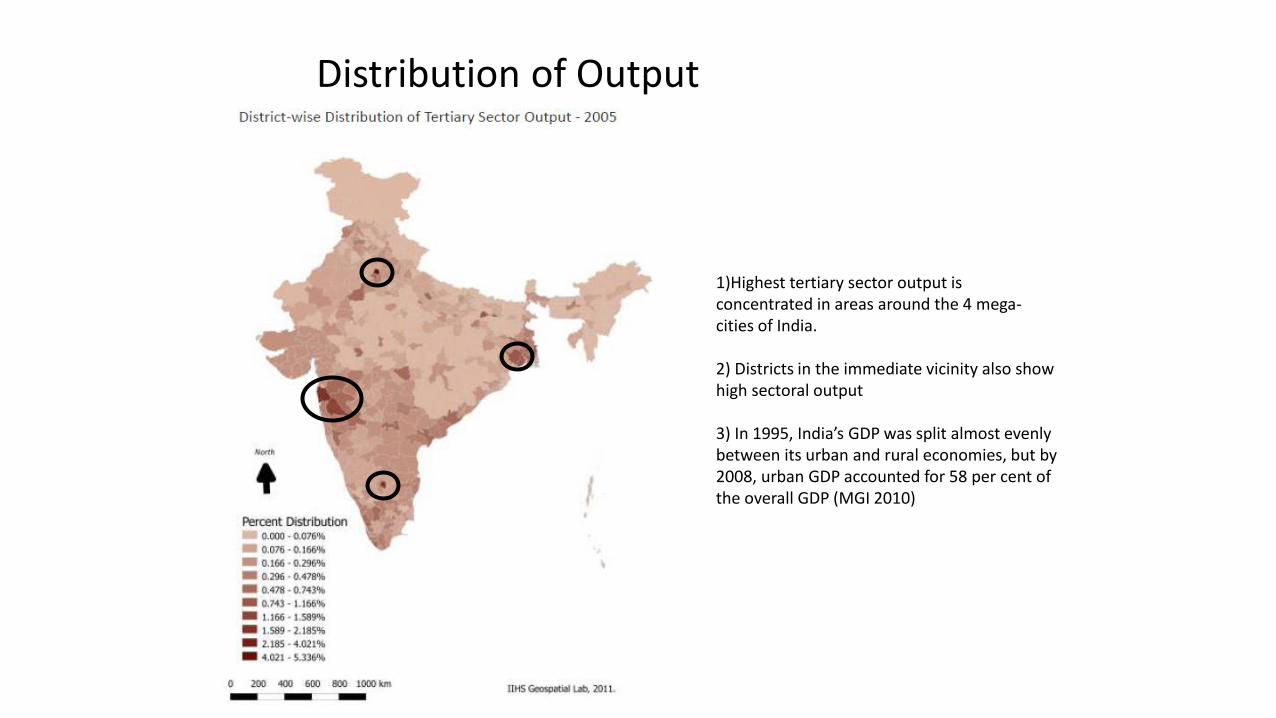
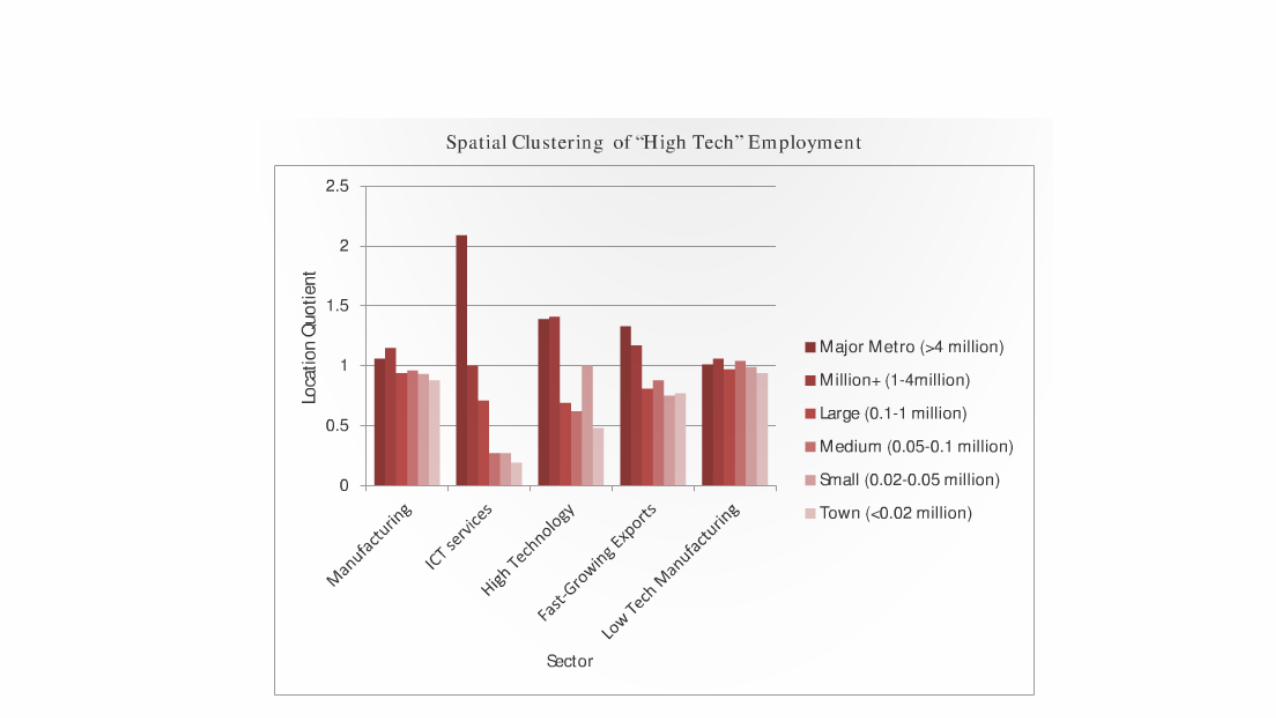
1)Highest tertiary sector output is concentrated in areas around the 4 mega-cities of India. 2) Districts in the immediate vicinity also show high sectoral output 3) In 1995, India’s GDP was split almost evenly between its urban and rural economies, but by 2008, urban GDP accounted for 58 per cent of the overall GDP (MGI 2010)
Distribution of Output
Source: World Bank. 2013
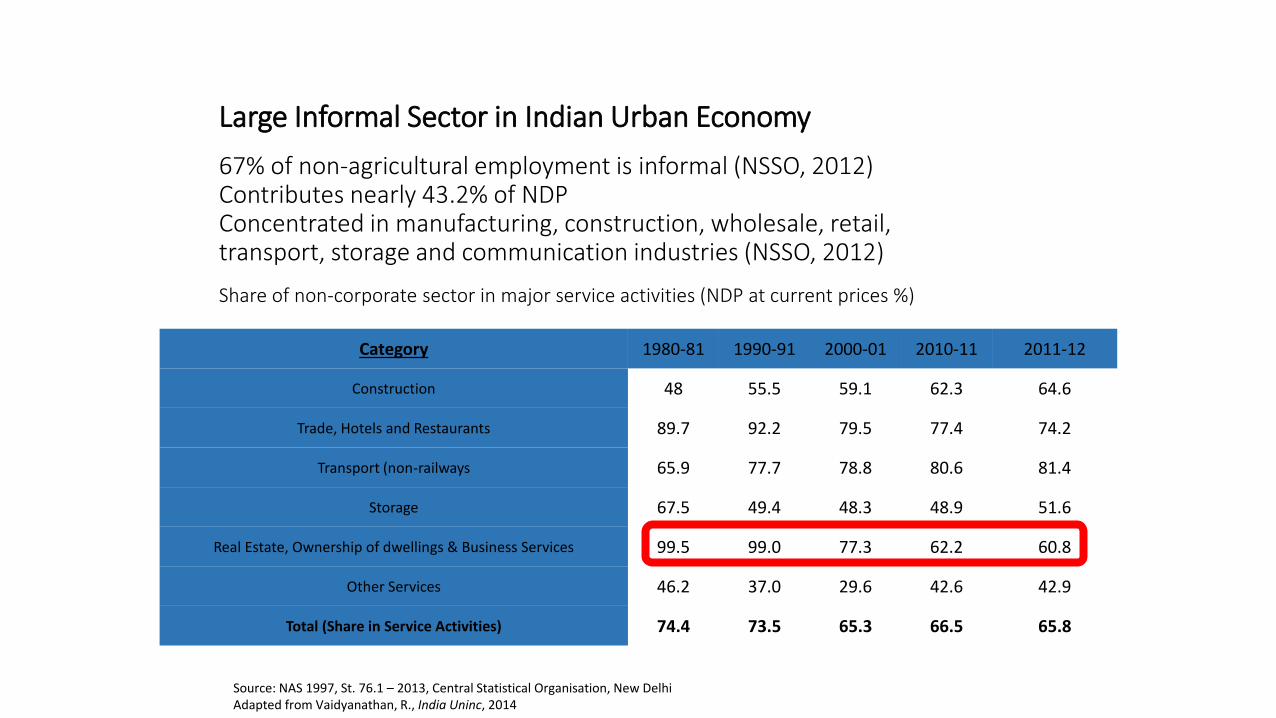
Large Informal Sector in Indian Urban Economy
67% of non-agricultural employment is informal (NSSO, 2012) Contributes nearly 43.2% of NDP Concentrated in manufacturing, construction, wholesale, retail, transport, storage and communication industries (NSSO, 2012)
Share of non-corporate sector in major service activities (NDP at current prices %)
Category 1980-81 1990-91 2000-01 2010-11 2011-12
Construction 48 55.5 59.1 62.3 64.6
Trade, Hotels and Restaurants 89.7 92.2 79.5 77.4 74.2
Transport (non-railways 65.9 77.7 78.8 80.6 81.4
Storage 67.5 49.4 48.3 48.9 51.6
Real Estate, Ownership of dwellings & Business Services 99.5 99.0 77.3 62.2 60.8
Other Services 46.2 37.0 29.6 42.6 42.9
Total (Share in Service Activities) 74.4 73.5 65.3 66.5 65.8
Source: NAS 1997, St. 76.1 – 2013, Central Statistical Organisation, New Delhi Adapted from Vaidyanathan, R., India Uninc, 2014
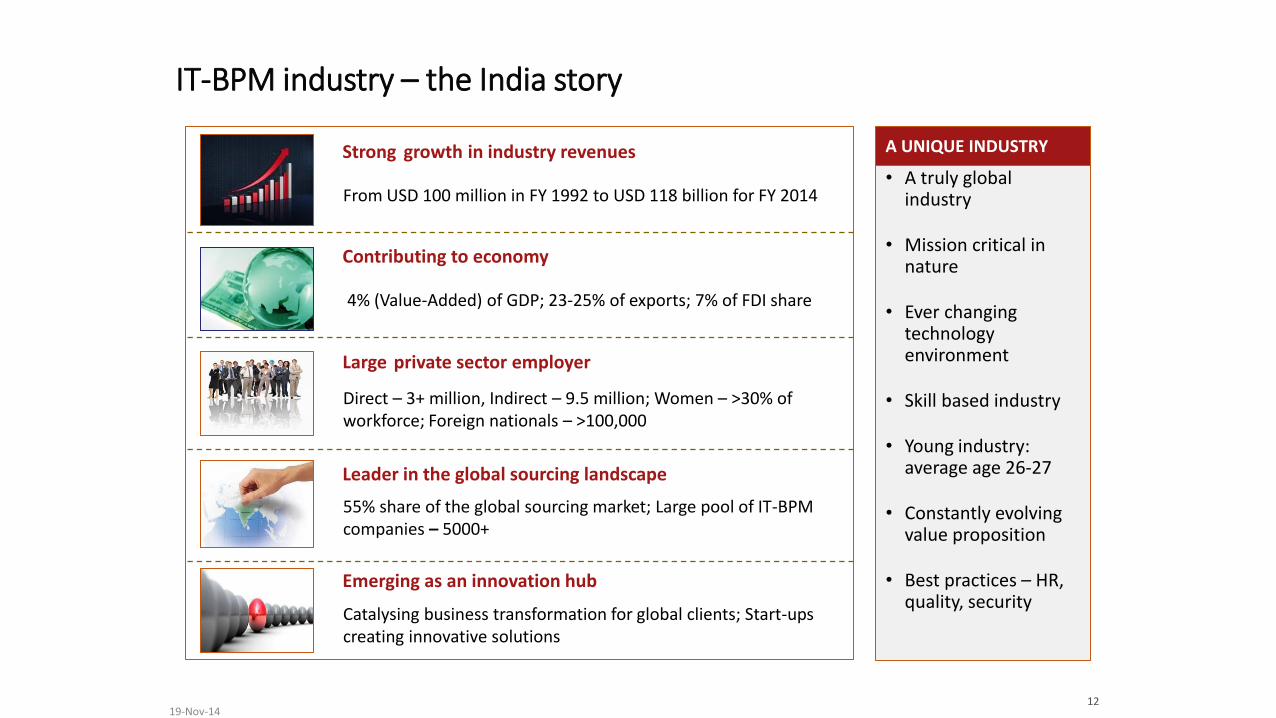
IT-BPM industry – the India story
Direct – 3+ million, Indirect – 9.5 million; Women – >30% of workforce; Foreign nationals – >100,000
Catalysing business transformation for global clients; Start-ups creating innovative solutions
From USD 100 million in FY 1992 to USD 118 billion for FY 2014
4% (Value-Added) of GDP; 23-25% of exports; 7% of FDI share
55% share of the global sourcing market; Large pool of IT-BPM companies – 5000+
Strong growth in industry revenues
Contributing to economy
Large private sector employer
Leader in the global sourcing landscape
Emerging as an innovation hub
• A truly global industry
• Mission critical in nature
• Ever changing technology environment
• Skill based industry
• Young industry: average age 26-27
• Constantly evolving value proposition
• Best practices – HR, quality, security
A UNIQUE INDUSTRY
12 19-Nov-14
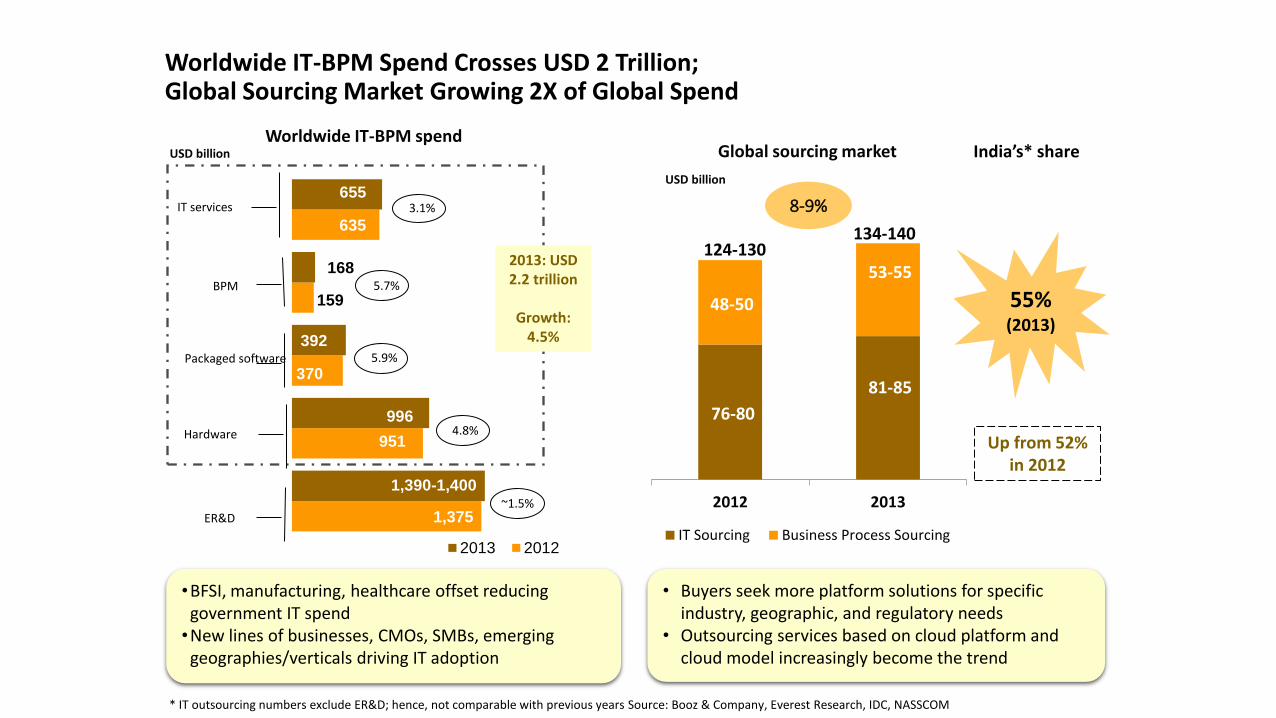
Worldwide IT-BPM spend
1,375
951
370
159
635
1,390-1,400
996
392
168
655
2013 2012
* IT outsourcing numbers exclude ER&D; hence, not comparable with previous years Source: Booz & Company, Everest Research, IDC, NASSCOM
5.7%
5.9%
4.8%
~1.5%
3.1%
76-80
48-50
2012 2013
IT Sourcing Business Process Sourcing
Global sourcing market
124-130 134-140
81-85
53-55
Worldwide IT-BPM Spend Crosses USD 2 Trillion; Global Sourcing Market Growing 2X of Global Spend
•BFSI, manufacturing, healthcare offset reducing government IT spend •New lines of businesses, CMOs, SMBs, emerging
geographies/verticals driving IT adoption
IT services
BPM
Packaged software
Hardware
ER&D
USD billion
USD billion
8-9%
• Buyers seek more platform solutions for specific industry, geographic, and regulatory needs
• Outsourcing services based on cloud platform and cloud model increasingly become the trend
55% (2013)
Up from 52% in 2012
India’s* share
2013: USD 2.2 trillion
Growth:
4.5%
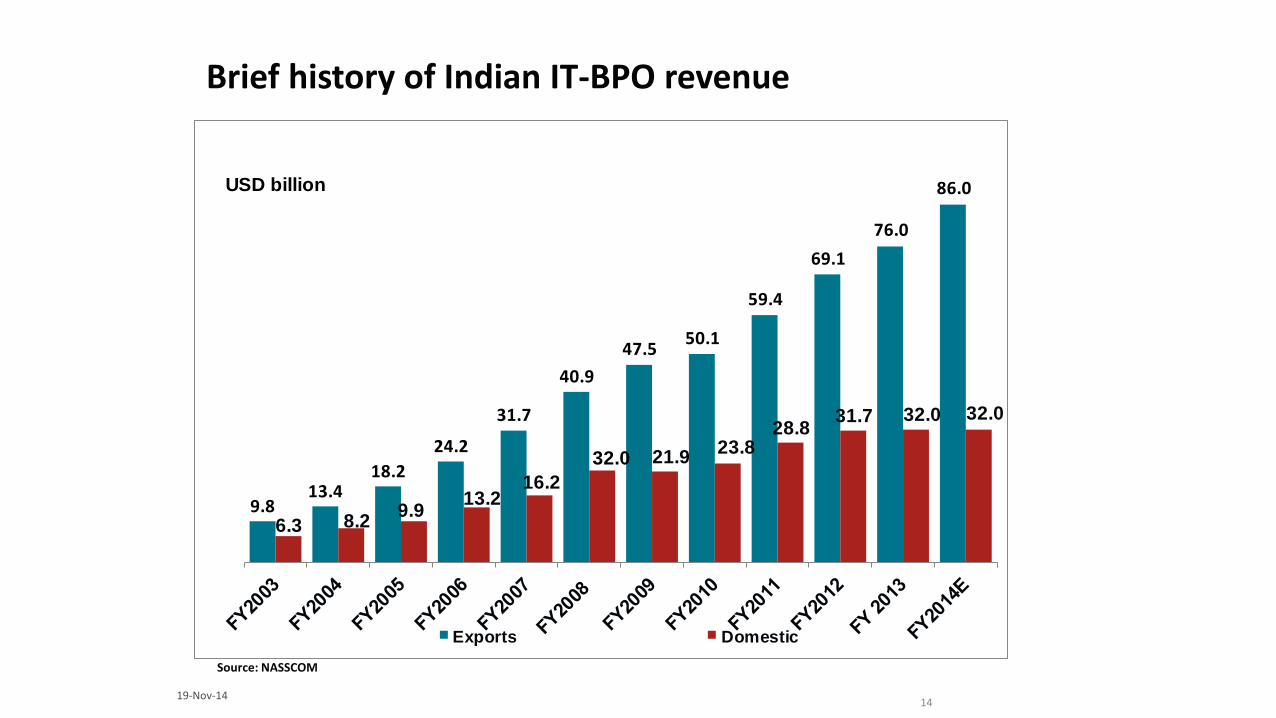
9.813.4
18.2
24.2
31.7
40.9
47.550.1
59.4
69.1
76.0
86.0
6.3 8.29.9
13.216.2
32.0 21.923.8
28.831.7 32.0 32.0
Exports Domestic
USD billion
Source: NASSCOM
Brief history of Indian IT-BPO revenue
14 19-Nov-14
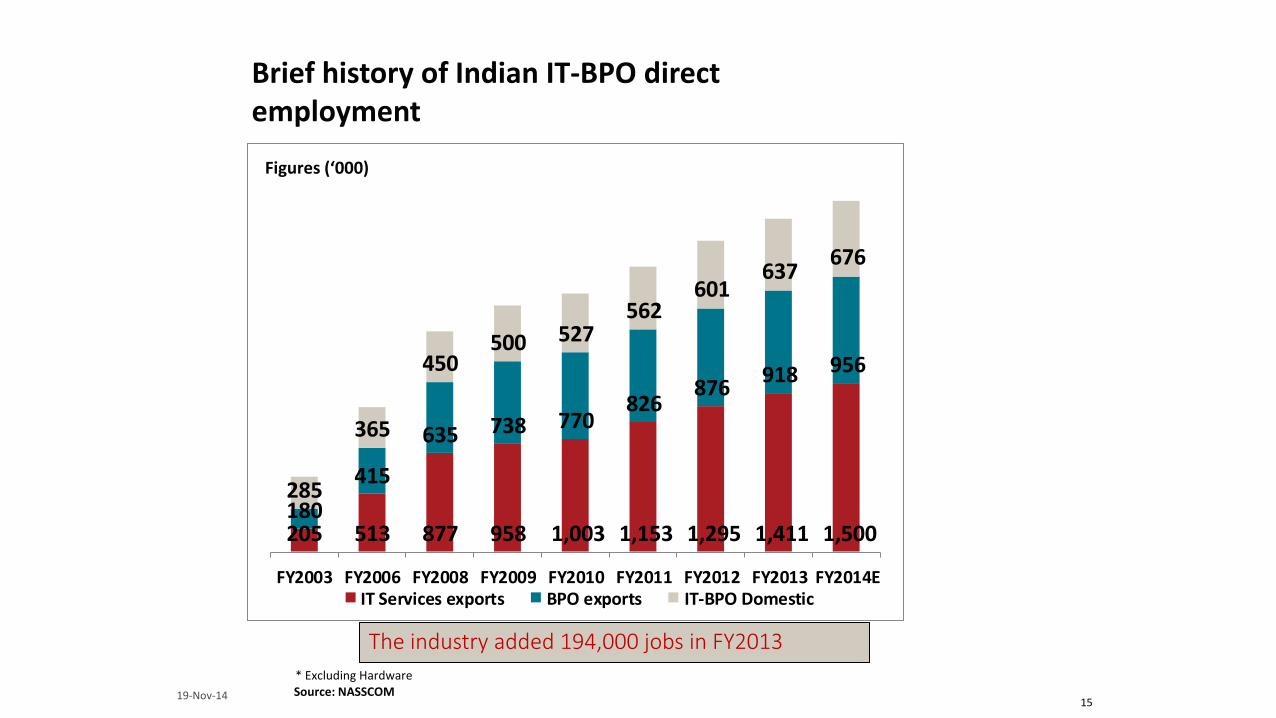
The industry added 194,000 jobs in FY2013
205 513 877 958 1,003 1,153 1,295 1,411 1,500 180
415
635 738 770826
876918 956
285
365
450500 527
562601
637676
FY2003 FY2006 FY2008 FY2009 FY2010 FY2011 FY2012 FY2013 FY2014EIT Services exports BPO exports IT-BPO Domestic
Brief history of Indian IT-BPO direct employment
Source: NASSCOM * Excluding Hardware
Figures (‘000)
15 19-Nov-14
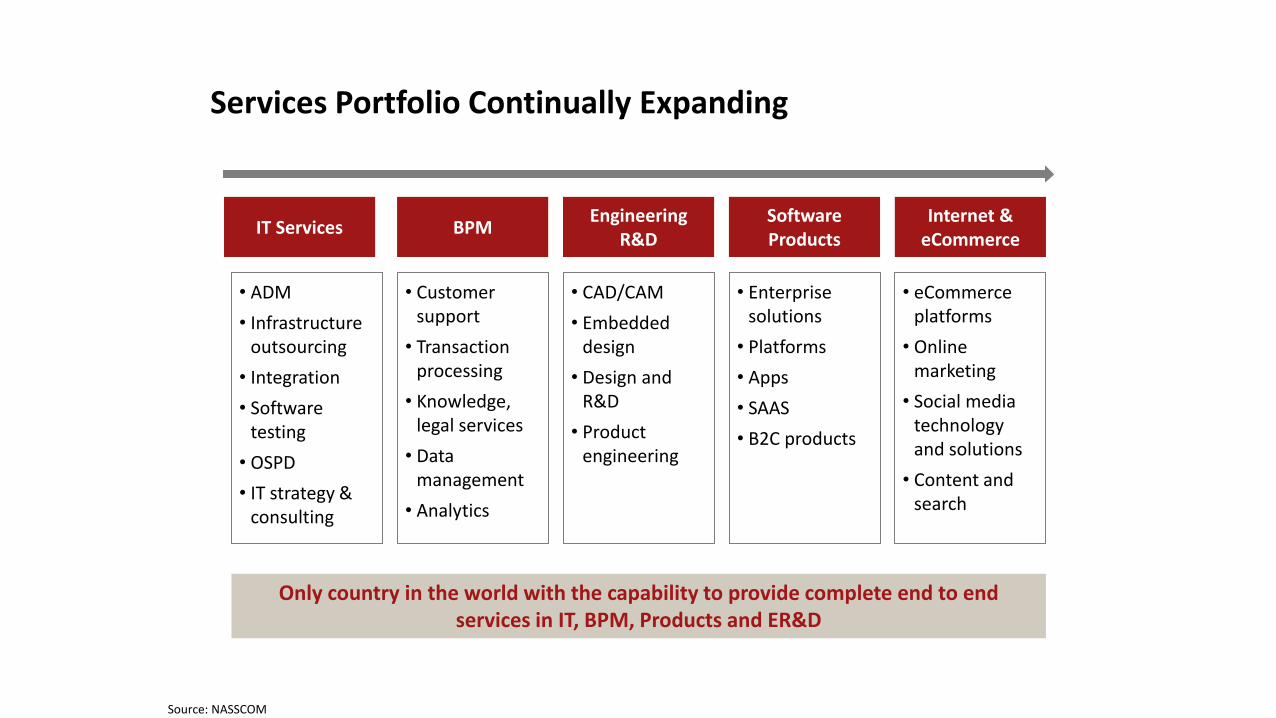
IT Services BPM Engineering
R&D Internet &
eCommerce Software Products
• ADM
• Infrastructure outsourcing
• Integration
• Software testing
• OSPD
• IT strategy & consulting
Services Portfolio Continually Expanding
• Customer support
• Transaction processing
• Knowledge, legal services
• Data management
• Analytics
• CAD/CAM
• Embedded design
• Design and R&D
• Product engineering
• Enterprise solutions
• Platforms
• Apps
• SAAS
• B2C products
• eCommerce platforms
• Online marketing
• Social media technology and solutions
• Content and search
Only country in the world with the capability to provide complete end to end services in IT, BPM, Products and ER&D
Source: NASSCOM
Source: NASSCOM
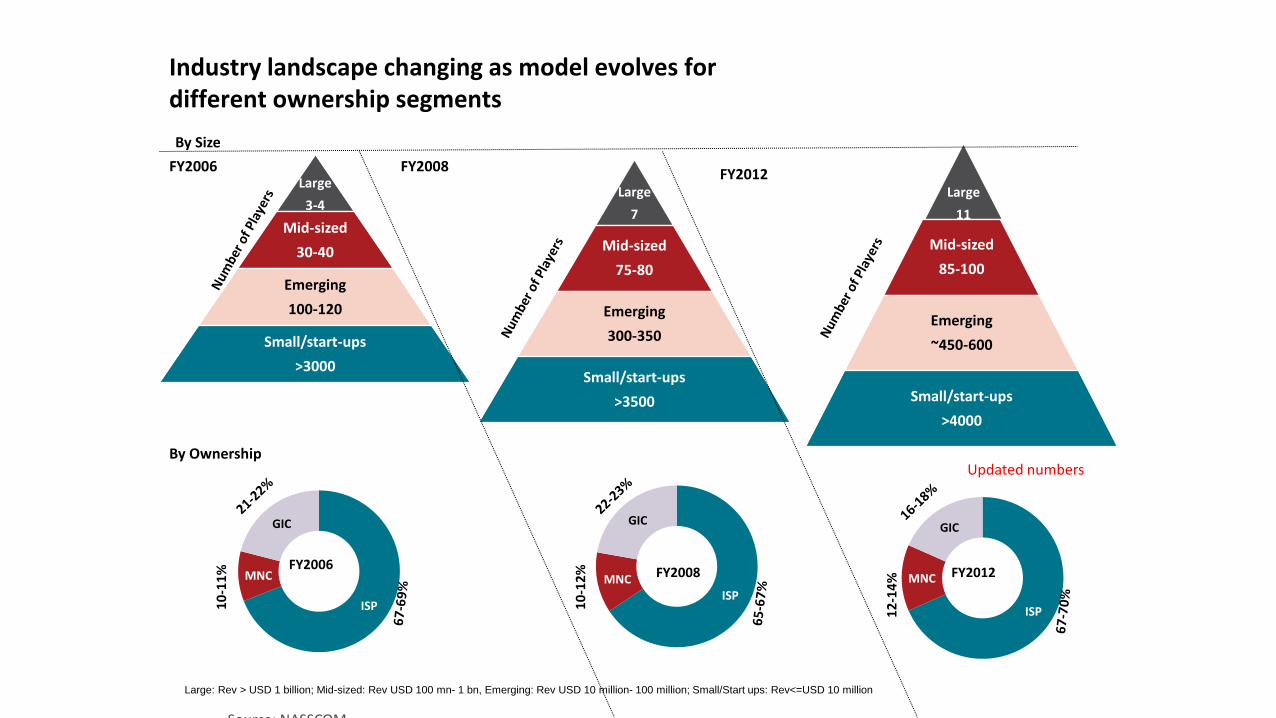
Large
3-4
Mid-sized
30-40
Emerging
100-120
Small/start-ups
>3000
Large
11
Mid-sized
85-100
Emerging
~450-600
Small/start-ups
>4000
ISP
MNC
GIC
12
-14
% FY2012
Industry landscape changing as model evolves for different ownership segments
By Ownership
By Size
FY2006 FY2012
Large: Rev > USD 1 billion; Mid-sized: Rev USD 100 mn- 1 bn, Emerging: Rev USD 10 million- 100 million; Small/Start ups: Rev<=USD 10 million
INDUSTRY STRUCTURE
Large
7
Mid-sized
75-80
Emerging
300-350
Small/start-ups
>3500
FY2008
ISP MNC
GIC
10
-12
%
FY2008
ISP
MNC
GIC
10
-11
% FY2006
Updated numbers
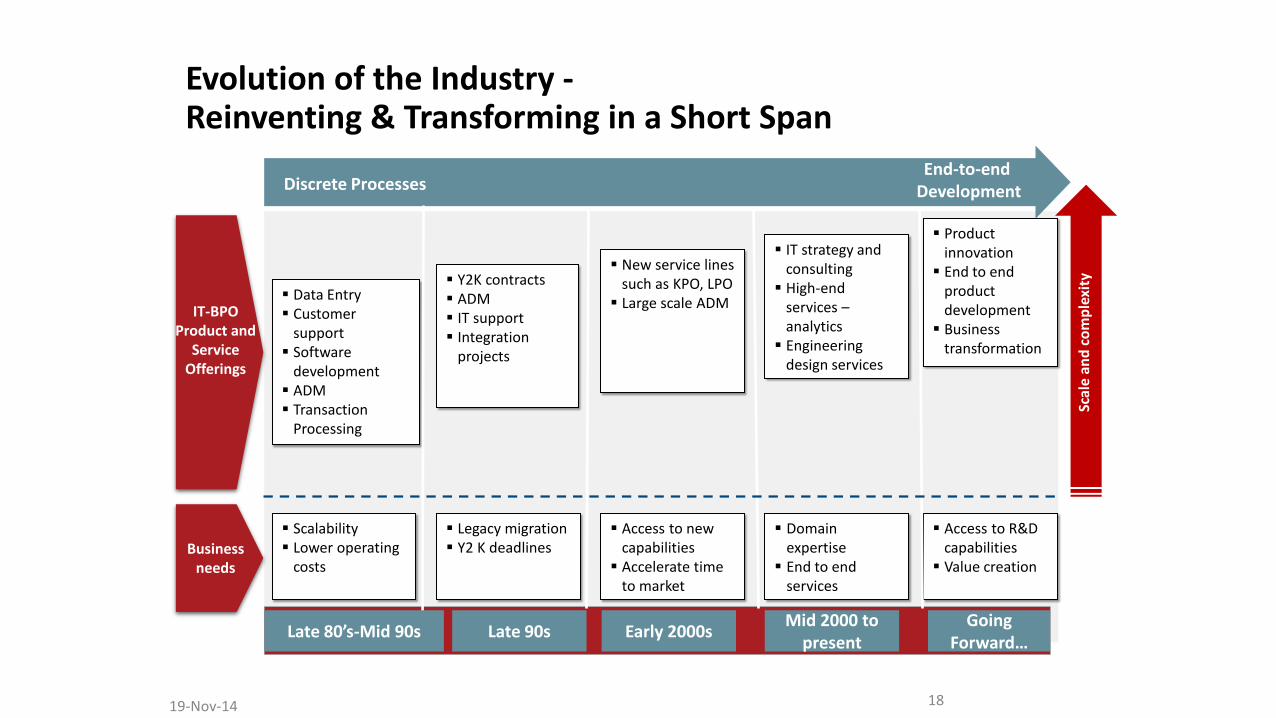
Evolution of the Industry - Reinventing & Transforming in a Short Span
Scalability Lower operating
costs
Discrete Processes End-to-end
Development
Access to new capabilities
Accelerate time to market
Legacy migration Y2 K deadlines
Mid 2000 to present
Domain expertise
End to end services
Access to R&D capabilities
Value creation
Data Entry Customer
support Software
development ADM Transaction
Processing
Y2K contracts ADM IT support Integration
projects
New service lines such as KPO, LPO
Large scale ADM
IT strategy and consulting
High-end services – analytics
Engineering design services
Product innovation
End to end product development
Business transformation
Going Forward…
Early 2000s Late 90s Late 80’s-Mid 90s
S
cale
an
d c
om
ple
xity
18 19-Nov-14
IT-BPO Product and
Service Offerings
Business needs
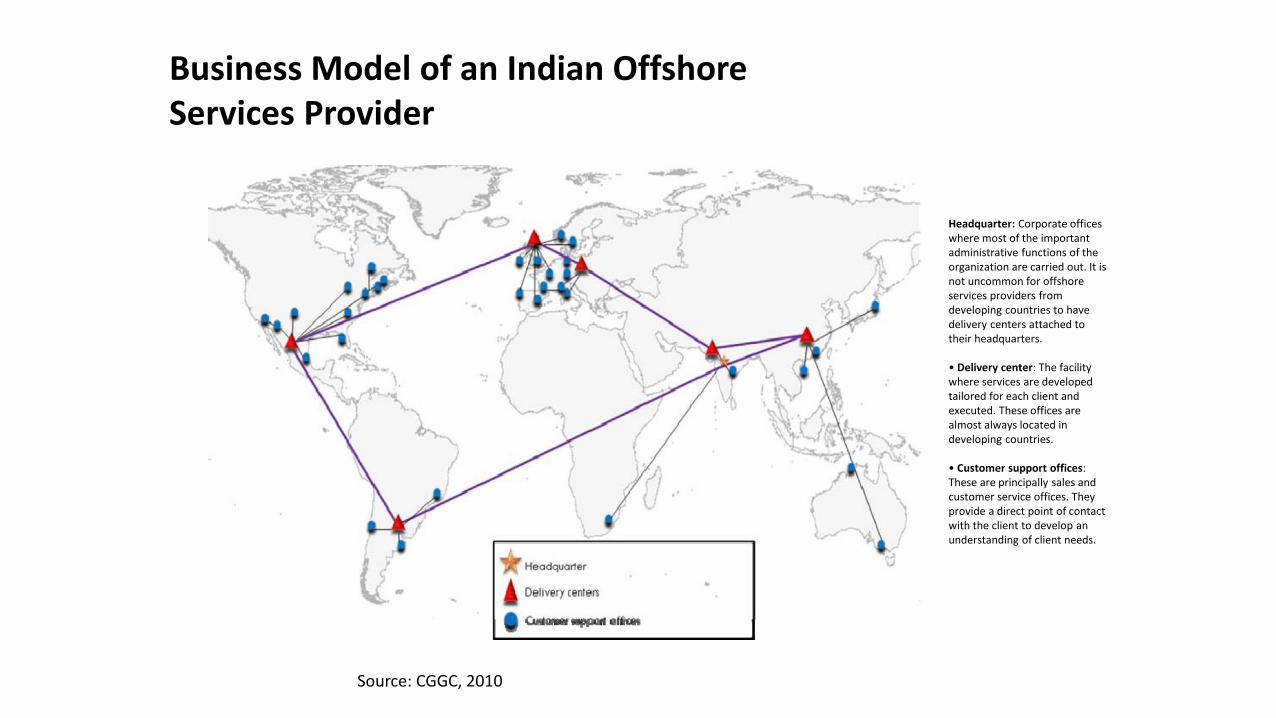
Headquarter: Corporate offices where most of the important administrative functions of the organization are carried out. It is not uncommon for offshore services providers from developing countries to have delivery centers attached to their headquarters. • Delivery center: The facility where services are developed tailored for each client and executed. These offices are almost always located in developing countries. • Customer support offices: These are principally sales and customer service offices. They provide a direct point of contact with the client to develop an understanding of client needs.
Source: CGGC, 2010
Business Model of an Indian Offshore Services Provider
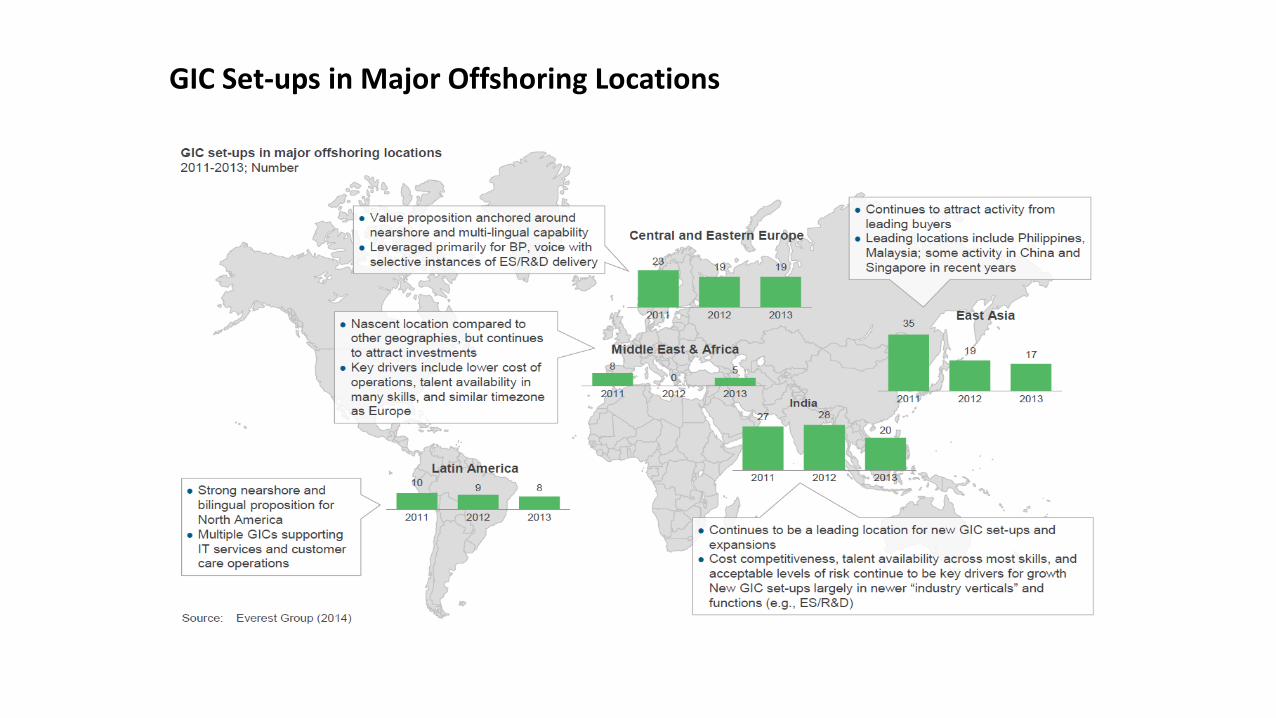
GIC Set-ups in Major Offshoring Locations
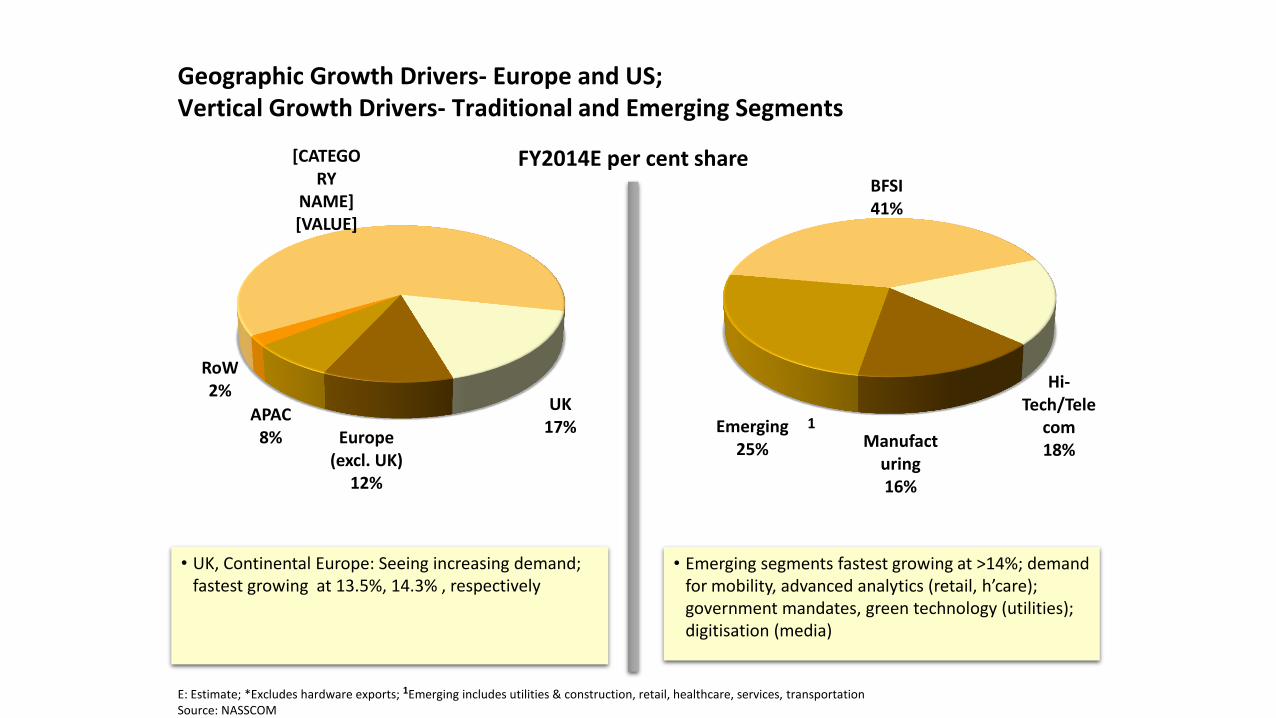
BFSI 41%
Hi-Tech/Tele
com 18% Manufact
uring 16%
Emerging 25%
[CATEGORY
NAME] [VALUE]
UK 17%
Europe (excl. UK)
12%
APAC 8%
RoW 2%
• UK, Continental Europe: Seeing increasing demand; fastest growing at 13.5%, 14.3% , respectively
• Emerging segments fastest growing at >14%; demand for mobility, advanced analytics (retail, h’care); government mandates, green technology (utilities); digitisation (media)
E: Estimate; *Excludes hardware exports; 1Emerging includes utilities & construction, retail, healthcare, services, transportation Source: NASSCOM
Geographic Growth Drivers- Europe and US; Vertical Growth Drivers- Traditional and Emerging Segments
FY2014E per cent share
1
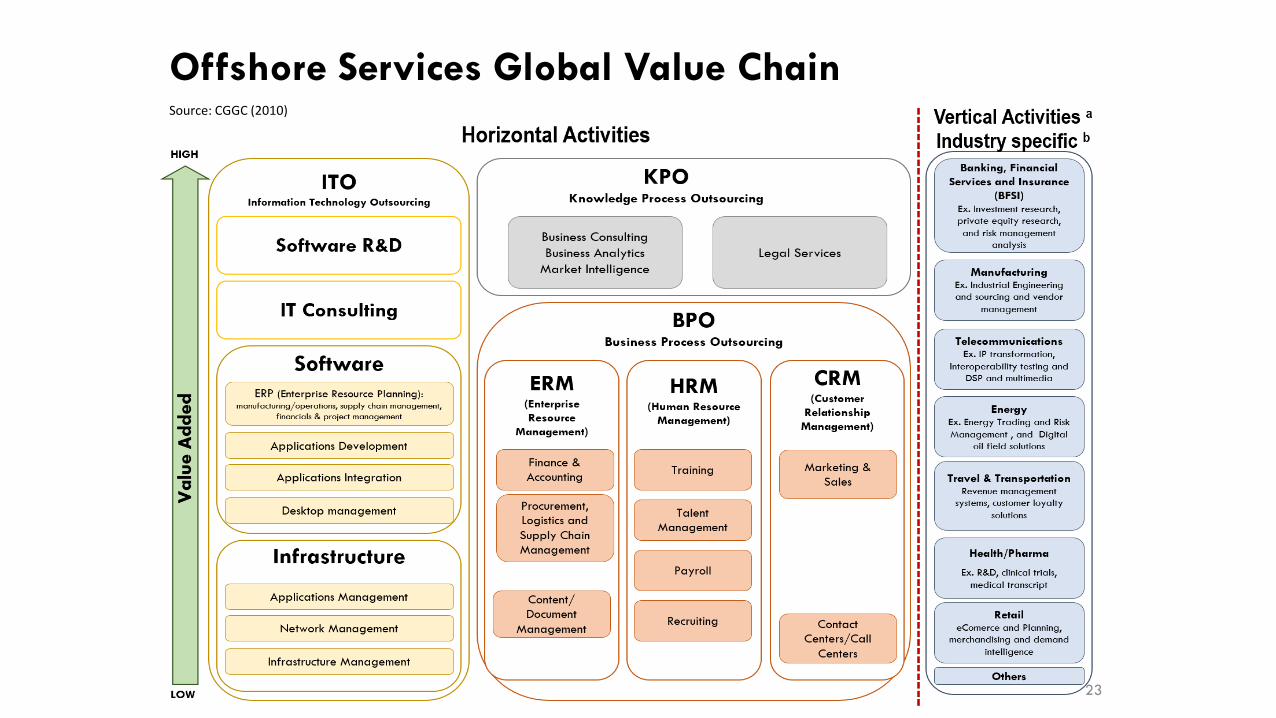
Offshore Services Global Value Chain
23
Source: CGGC (2010)
Competitiveness in Service Value Chains Source: Drake-Brockman (2011)
• Human Capital
• Intangible Assets
• Digital Infrastructure
• Institutional Quality
• Domestic Regulations
• International Connectedness
• Stakeholder Involvement
• Policy focus
24 19-Nov-14
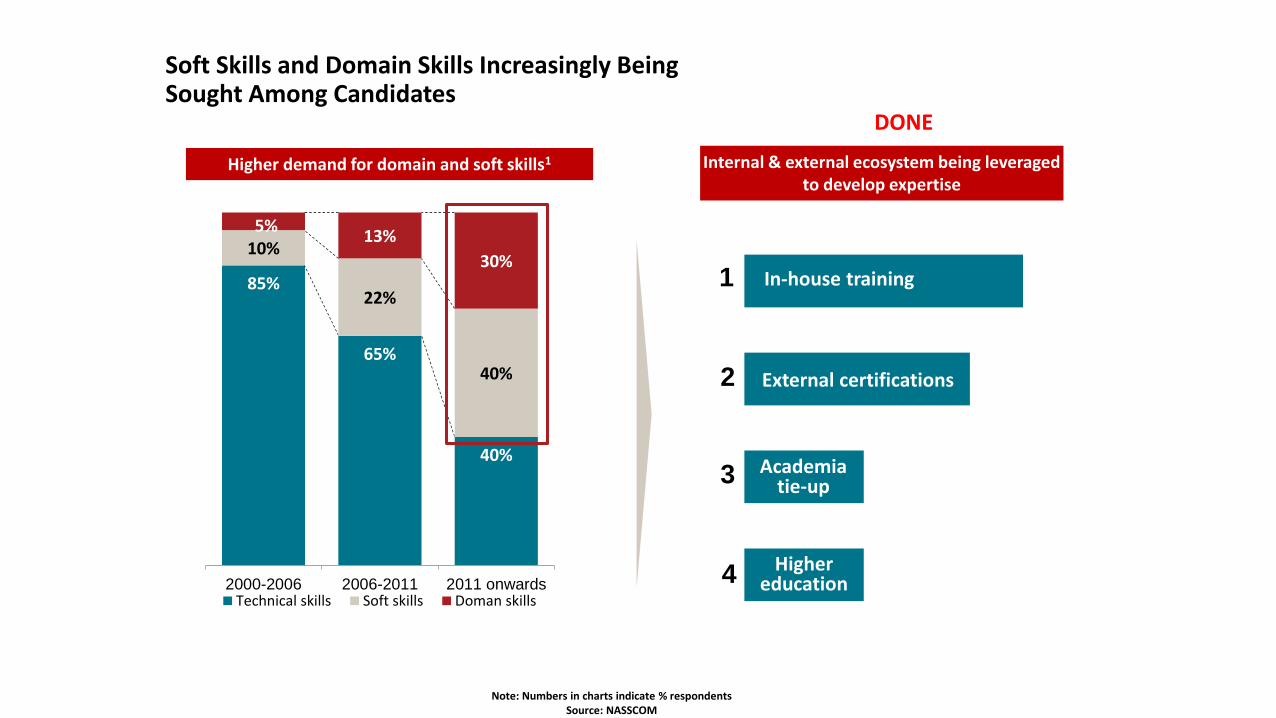
Soft Skills and Domain Skills Increasingly Being Sought Among Candidates
85%
65%
40%
10%
22%
40%
5% 13%
30%
2000-2006 2006-2011 2011 onwardsTechnical skills Soft skills Doman skills
Internal & external ecosystem being leveraged to develop expertise
Higher demand for domain and soft skills1
In-house training
External certifications
Academia tie-up
Higher education
1
2
4
3
Note: Numbers in charts indicate % respondents Source: NASSCOM
DONE
Source: NASSCOM
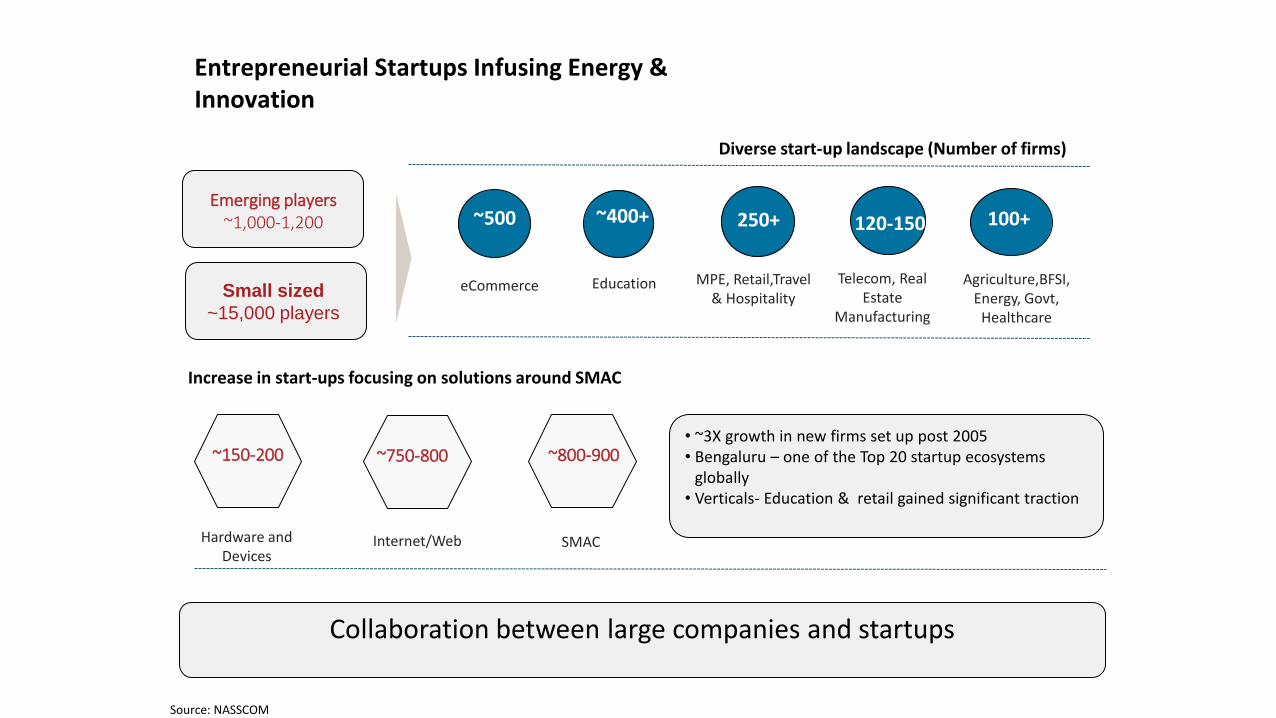
Entrepreneurial Startups Infusing Energy & Innovation
~500 ~400+
eCommerce Education
250+
MPE, Retail,Travel & Hospitality
120-150
Telecom, Real Estate
Manufacturing
100+
Agriculture,BFSI, Energy, Govt,
Healthcare
Diverse start-up landscape (Number of firms)
Collaboration between large companies and startups
Emerging players ~1,000-1,200
Small sized
~15,000 players
Increase in start-ups focusing on solutions around SMAC
~150-200 ~750-800 ~800-900
Hardware and Devices
Internet/Web SMAC
• ~3X growth in new firms set up post 2005 • Bengaluru – one of the Top 20 startup ecosystems
globally • Verticals- Education & retail gained significant traction
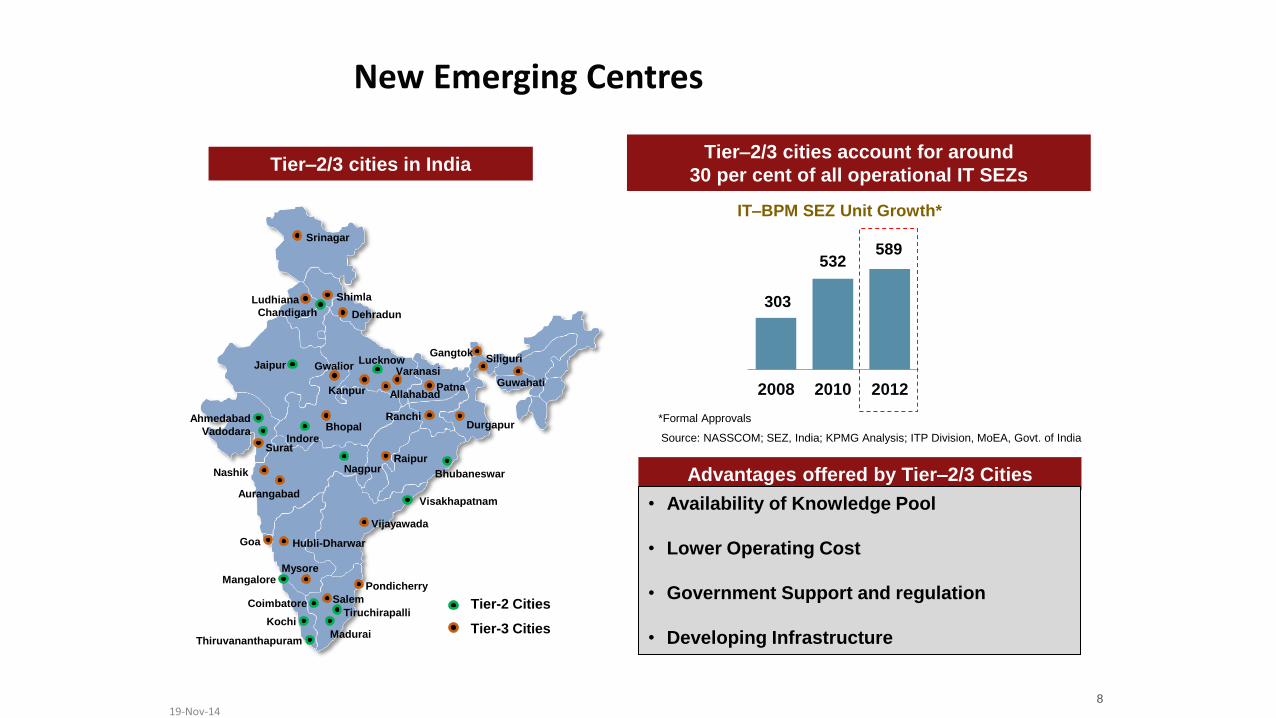
New Emerging Centres
19-Nov-14 8
Ahmedabad
Surat
Bhopal
Bhubaneswar
Chandigarh
Indore
Jaipur Lucknow
Madurai
Mangalore
Nagpur
Thiruvananthapuram
Vadodara
Visakhapatnam
Gwalior
Kanpur
Dehradun
Ranchi
Shimla
Srinagar
Goa
Gangtok
Raipur
Guwahati Allahabad
Varanasi
Siliguri
Pondicherry
Nashik
Aurangabad
Mysore
Salem Coimbatore
Kochi Tiruchirapalli
Hubli-Dharwar
Vijayawada
Ludhiana
Durgapur
Patna
Tier-2 Cities
Tier-3 Cities
Advantages offered by Tier–2/3 Cities
Tier–2/3 cities in India
• Availability of Knowledge Pool
• Lower Operating Cost
• Government Support and regulation
• Developing Infrastructure
Source: NASSCOM; SEZ, India; KPMG Analysis; ITP Division, MoEA, Govt. of India
IT–BPM SEZ Unit Growth*
*Formal Approvals
303
532 589
2008 2010 2012
Tier–2/3 cities account for around
30 per cent of all operational IT SEZs
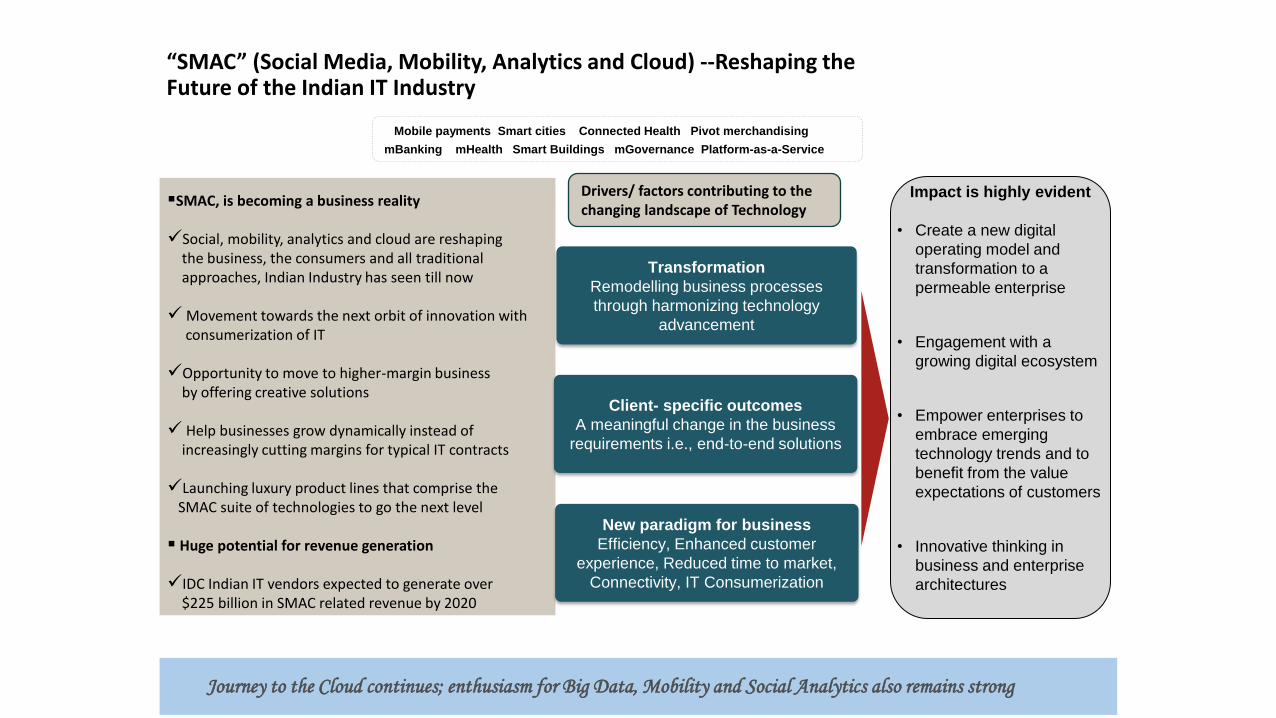
“SMAC” (Social Media, Mobility, Analytics and Cloud) --Reshaping the Future of the Indian IT Industry
Impact is highly evident
• Create a new digital
operating model and
transformation to a
permeable enterprise
• Engagement with a
growing digital ecosystem
• Empower enterprises to
embrace emerging
technology trends and to
benefit from the value
expectations of customers
• Innovative thinking in
business and enterprise
architectures
SMAC, is becoming a business reality Social, mobility, analytics and cloud are reshaping the business, the consumers and all traditional approaches, Indian Industry has seen till now Movement towards the next orbit of innovation with consumerization of IT Opportunity to move to higher-margin business by offering creative solutions Help businesses grow dynamically instead of increasingly cutting margins for typical IT contracts Launching luxury product lines that comprise the SMAC suite of technologies to go the next level Huge potential for revenue generation IDC Indian IT vendors expected to generate over $225 billion in SMAC related revenue by 2020
Drivers/ factors contributing to the changing landscape of Technology
Transformation
Remodelling business processes
through harmonizing technology
advancement
Client- specific outcomes
A meaningful change in the business
requirements i.e., end-to-end solutions
New paradigm for business
Efficiency, Enhanced customer
experience, Reduced time to market,
Connectivity, IT Consumerization
Journey to the Cloud continues; enthusiasm for Big Data, Mobility and Social Analytics also remains strong
Mobile payments Smart cities Connected Health Pivot merchandising
mBanking mHealth Smart Buildings mGovernance Platform-as-a-Service

Hypermobility…but only for some ??
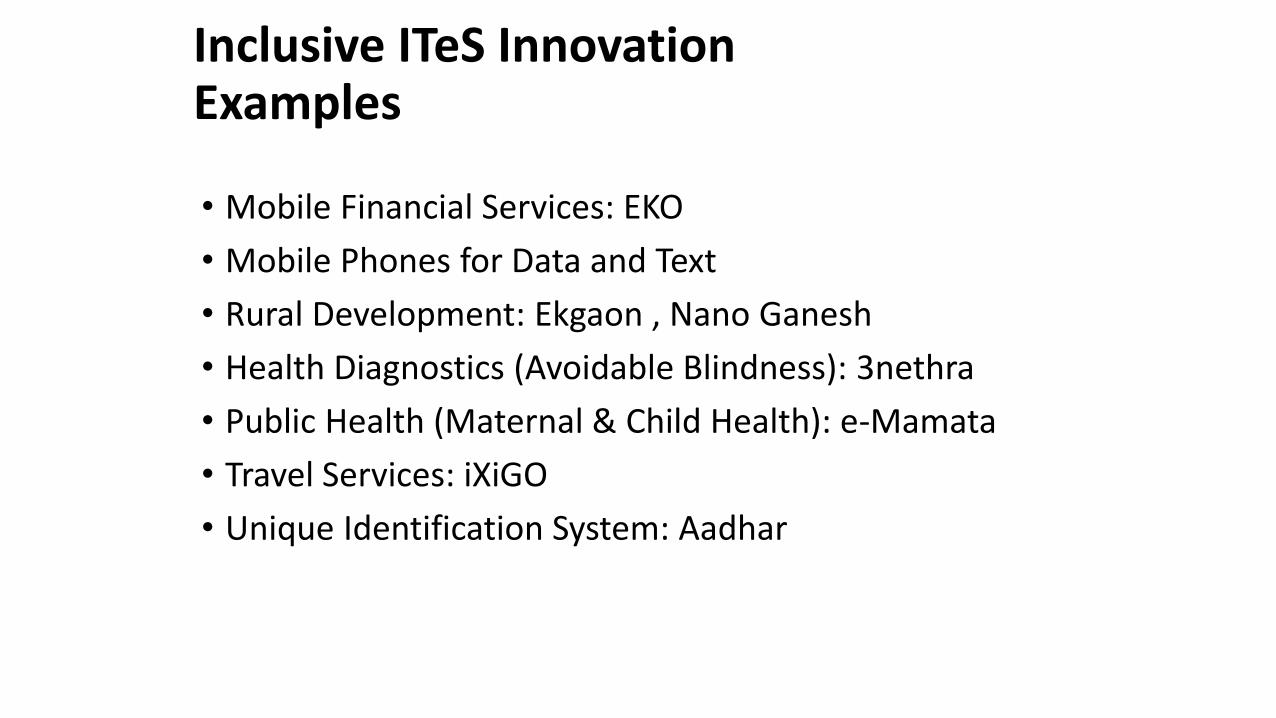
Inclusive ITeS Innovation Examples
• Mobile Financial Services: EKO
• Mobile Phones for Data and Text
• Rural Development: Ekgaon , Nano Ganesh
• Health Diagnostics (Avoidable Blindness): 3nethra
• Public Health (Maternal & Child Health): e-Mamata
• Travel Services: iXiGO
• Unique Identification System: Aadhar
31 19-Nov-14
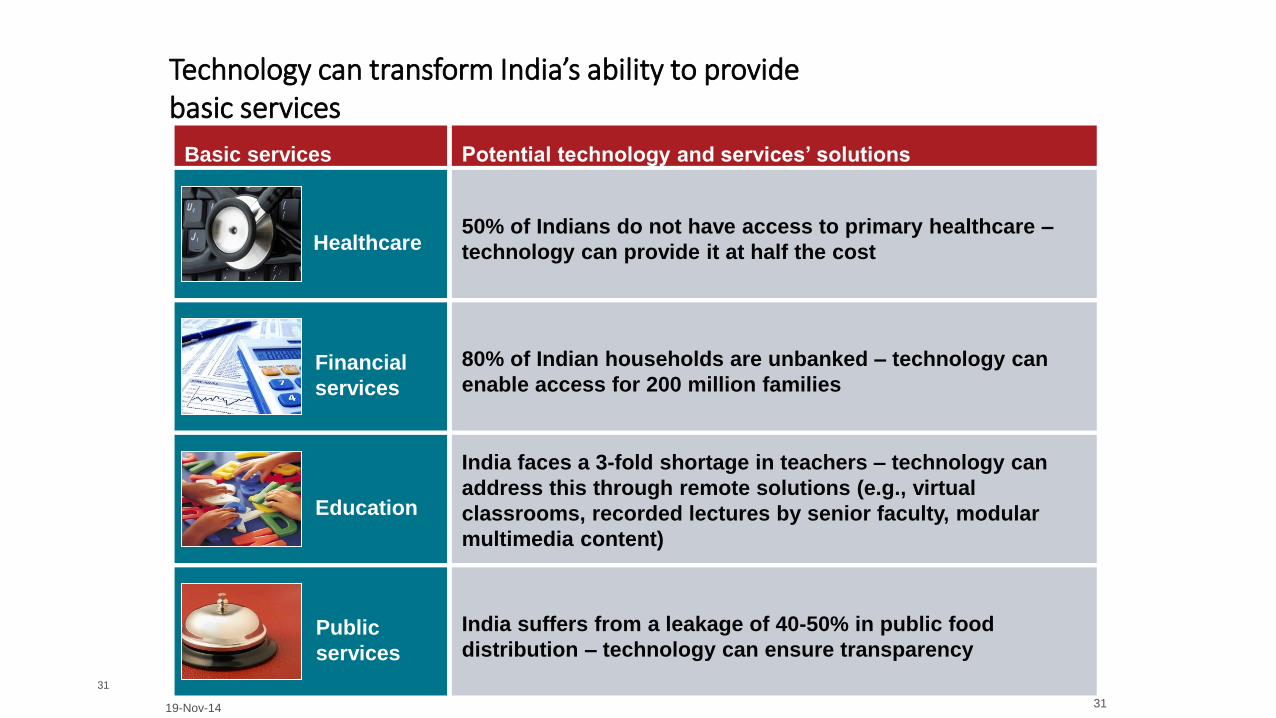
Technology can transform India’s ability to provide basic services
Basic services Potential technology and services’ solutions
Healthcare 50% of Indians do not have access to primary healthcare –
technology can provide it at half the cost
Financial
services
80% of Indian households are unbanked – technology can
enable access for 200 million families
Education
India faces a 3-fold shortage in teachers – technology can
address this through remote solutions (e.g., virtual
classrooms, recorded lectures by senior faculty, modular
multimedia content)
Public
services
India suffers from a leakage of 40-50% in public food
distribution – technology can ensure transparency
19-Nov-14 31
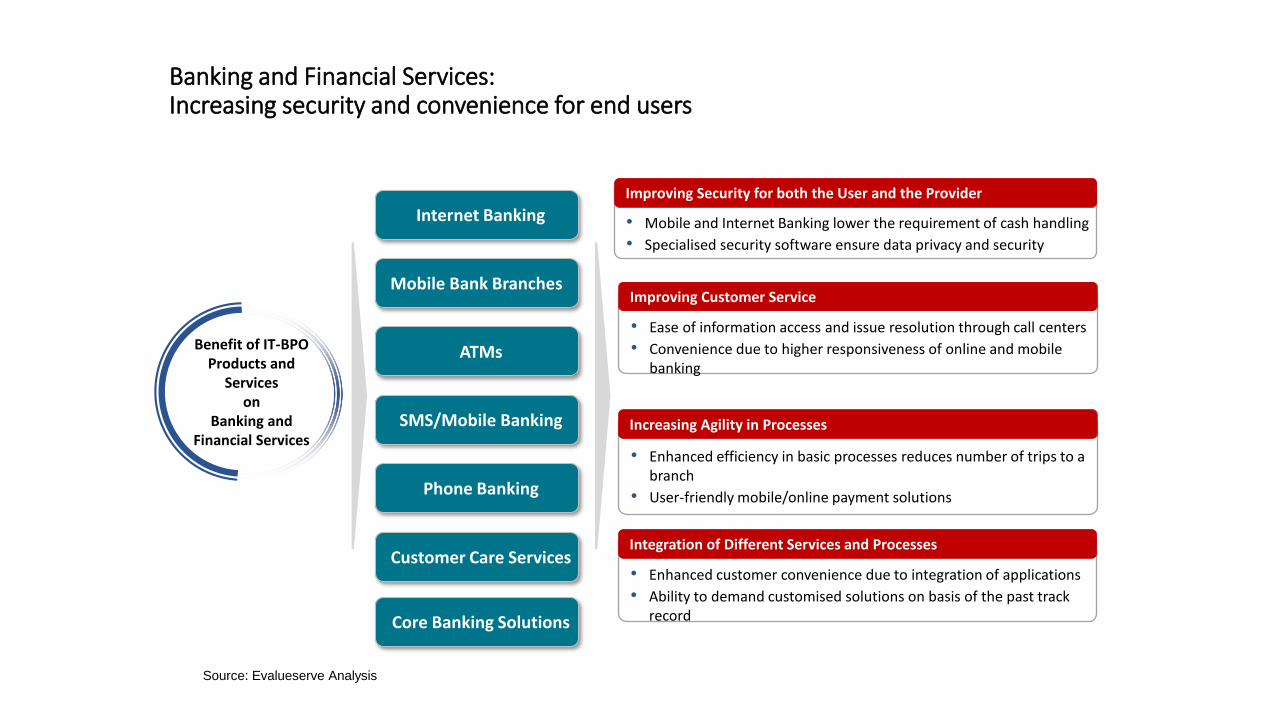
Banking and Financial Services: Increasing security and convenience for end users
• Mobile and Internet Banking lower the requirement of cash handling
• Specialised security software ensure data privacy and security
Improving Security for both the User and the Provider
• Ease of information access and issue resolution through call centers
• Convenience due to higher responsiveness of online and mobile banking
Improving Customer Service
• Enhanced efficiency in basic processes reduces number of trips to a branch
• User-friendly mobile/online payment solutions
Increasing Agility in Processes
• Enhanced customer convenience due to integration of applications
• Ability to demand customised solutions on basis of the past track record
Integration of Different Services and Processes
Internet Banking
Mobile Bank Branches
ATMs
SMS/Mobile Banking
Phone Banking
Benefit of IT-BPO Products and
Services on
Banking and Financial Services
Customer Care Services
Core Banking Solutions
Source: Evalueserve Analysis
33
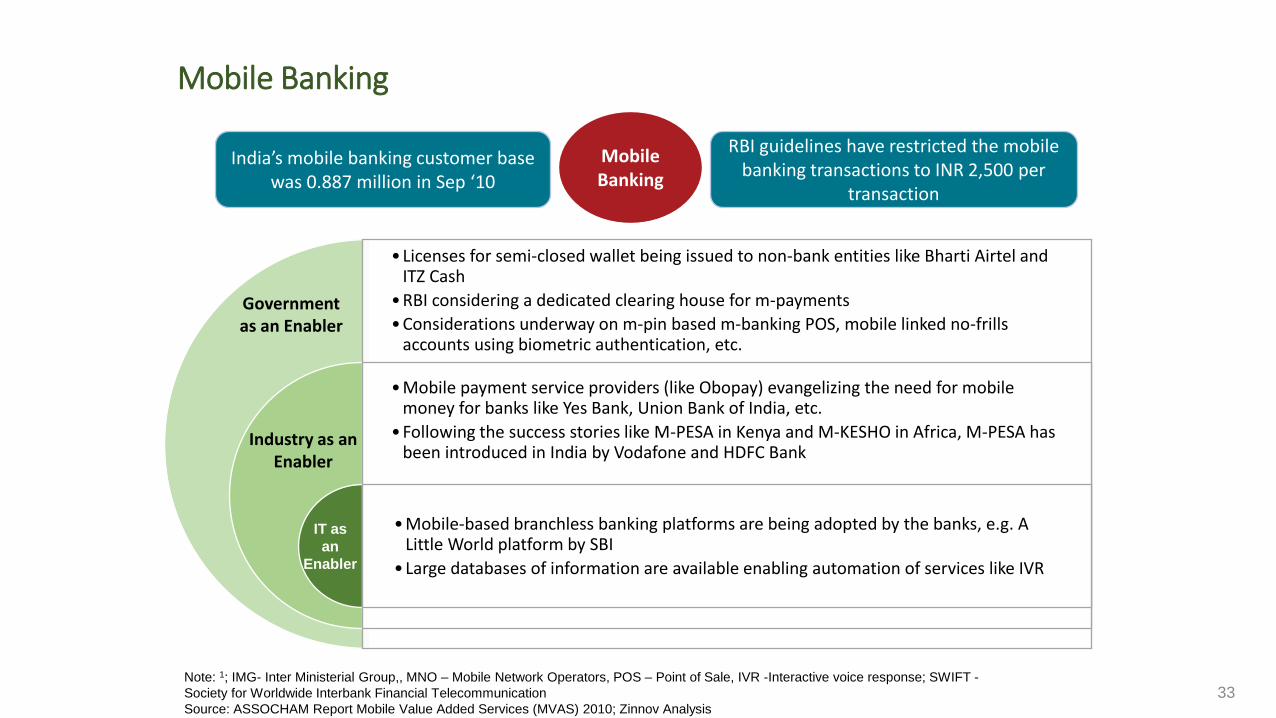
• Licenses for semi-closed wallet being issued to non-bank entities like Bharti Airtel and ITZ Cash
• RBI considering a dedicated clearing house for m-payments
• Considerations underway on m-pin based m-banking POS, mobile linked no-frills accounts using biometric authentication, etc.
• Mobile payment service providers (like Obopay) evangelizing the need for mobile money for banks like Yes Bank, Union Bank of India, etc.
• Following the success stories like M-PESA in Kenya and M-KESHO in Africa, M-PESA has been introduced in India by Vodafone and HDFC Bank
• Mobile-based branchless banking platforms are being adopted by the banks, e.g. A Little World platform by SBI
• Large databases of information are available enabling automation of services like IVR
IT as
an
Enabler
Industry as an Enabler
Government as an Enabler
Mobile Banking
India’s mobile banking customer base was 0.887 million in Sep ‘10
RBI guidelines have restricted the mobile banking transactions to INR 2,500 per
transaction
Mobile Banking
Note: 1; IMG- Inter Ministerial Group,, MNO – Mobile Network Operators, POS – Point of Sale, IVR -Interactive voice response; SWIFT -
Society for Worldwide Interbank Financial Telecommunication
Source: ASSOCHAM Report Mobile Value Added Services (MVAS) 2010; Zinnov Analysis
34
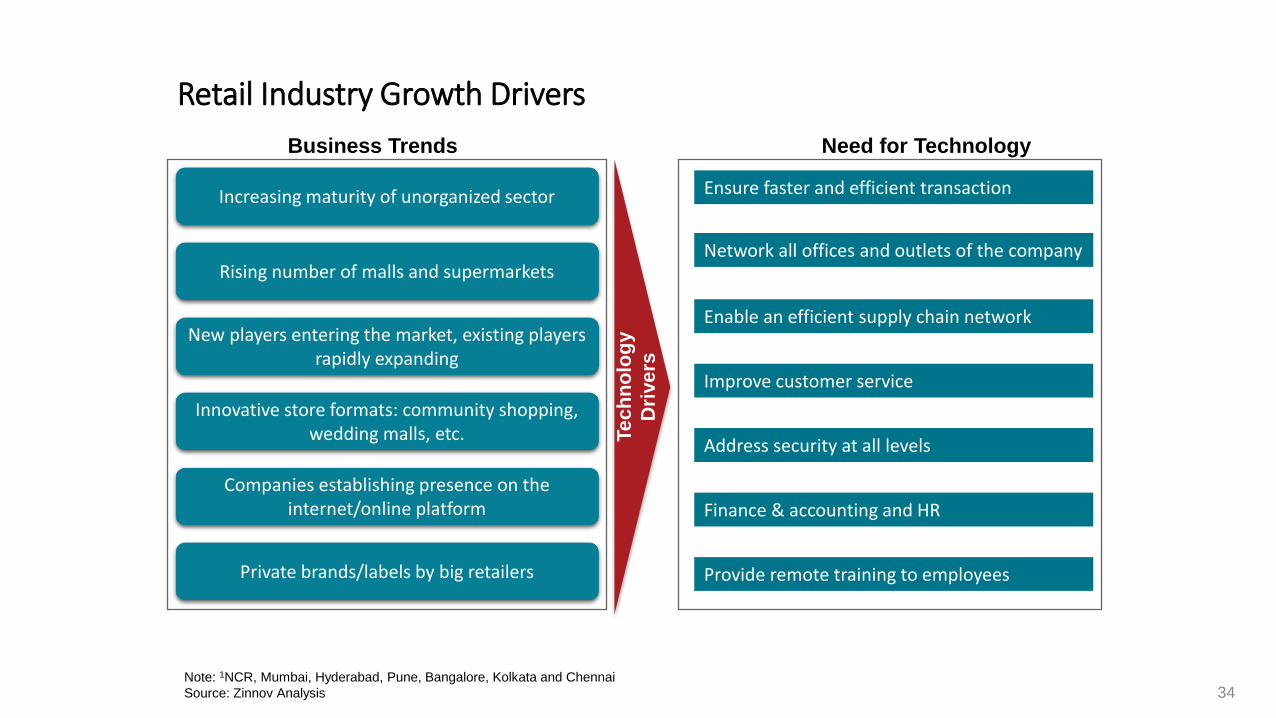
Retail Industry Growth Drivers
Increasing maturity of unorganized sector
Rising number of malls and supermarkets
New players entering the market, existing players rapidly expanding
Innovative store formats: community shopping, wedding malls, etc.
Private brands/labels by big retailers
Network all offices and outlets of the company
Provide remote training to employees
Enable an efficient supply chain network
Improve customer service
Address security at all levels
Finance & accounting and HR
Note: 1NCR, Mumbai, Hyderabad, Pune, Bangalore, Kolkata and Chennai
Source: Zinnov Analysis
Ensure faster and efficient transaction
Te
ch
no
log
y
Dri
ve
rs
Business Trends Need for Technology
Companies establishing presence on the internet/online platform
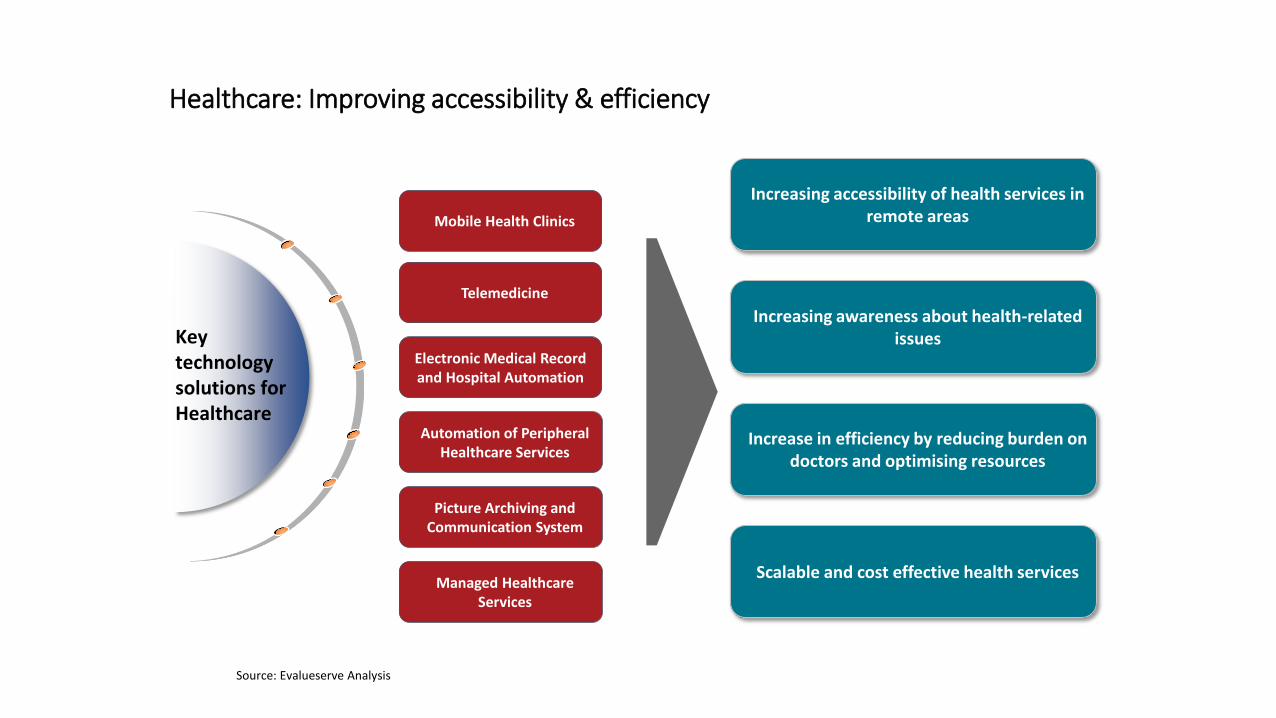
Healthcare: Improving accessibility & efficiency
Increasing accessibility of health services in remote areas
Increasing awareness about health-related issues
Increase in efficiency by reducing burden on doctors and optimising resources
Scalable and cost effective health services
Telemedicine
Electronic Medical Record and Hospital Automation
Automation of Peripheral Healthcare Services
Picture Archiving and Communication System
Managed Healthcare Services
Mobile Health Clinics
Key technology solutions for Healthcare
Source: Evalueserve Analysis
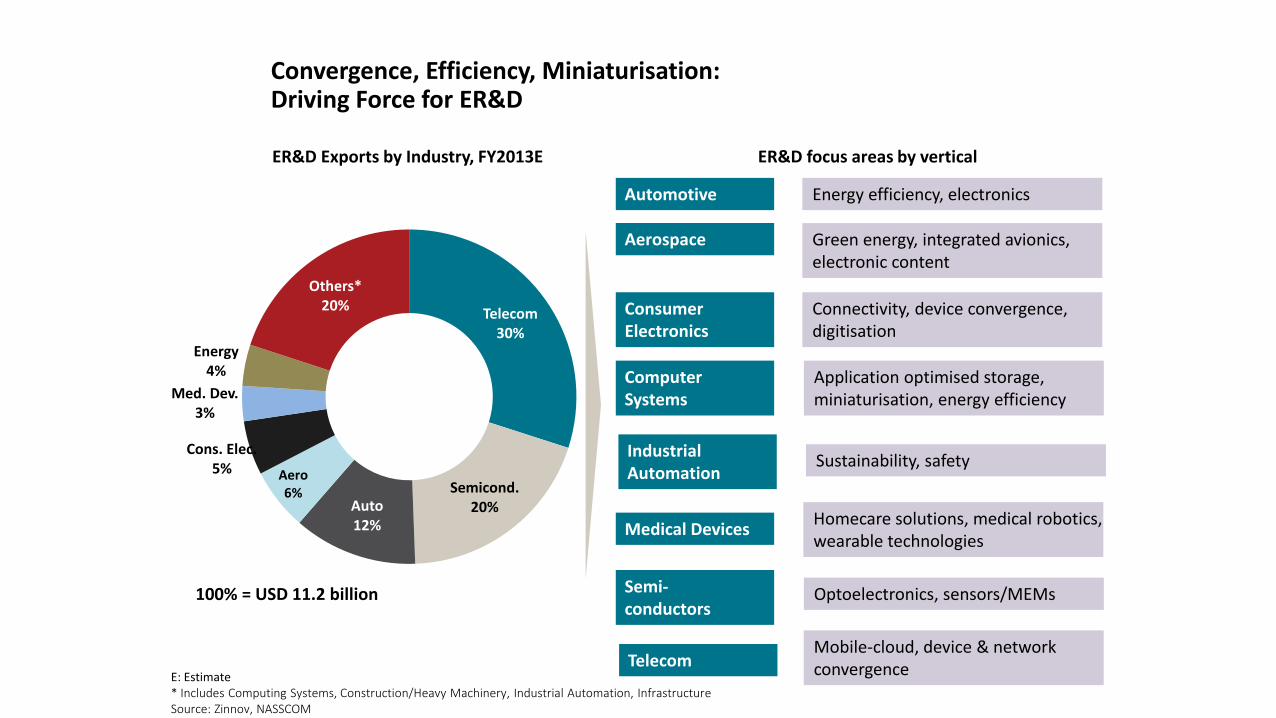
Convergence, Efficiency, Miniaturisation: Driving Force for ER&D
Telecom 30%
Semicond. 20% Auto
12%
Aero 6%
Cons. Elec. 5%
Med. Dev. 3%
Energy 4%
Others* 20%
E: Estimate * Includes Computing Systems, Construction/Heavy Machinery, Industrial Automation, Infrastructure Source: Zinnov, NASSCOM
100% = USD 11.2 billion
ER&D Exports by Industry, FY2013E ER&D focus areas by vertical
Automotive
Aerospace
Consumer Electronics
Computer Systems
Semi- conductors
Medical Devices
Telecom
Industrial Automation
Energy efficiency, electronics
Green energy, integrated avionics, electronic content
Connectivity, device convergence, digitisation
Application optimised storage, miniaturisation, energy efficiency
Optoelectronics, sensors/MEMs
Homecare solutions, medical robotics, wearable technologies
Mobile-cloud, device & network convergence
Sustainability, safety
Japanese IT Innovation
• World Leader in the 1990’s….Disappeared Last Decade
• Resurgent Silicon Valley
• Increasing Software Intensity of IT Innovation
• Documented by Many Japanese Researchers (Kojima & Kojima, Kurokawa & Hayashi, Nagaoka,…)
• Literature Offers Two Explanations
• Management Practices (Bloom, et al)
• Human Resource Constraints (Arora, et al)
• Persuasive Evidence in Favour of Latter
37
Factors Supporting Entry & Competitiveness
• Facilitating Infrastructure for Knowledge Economy
• Vibrant Innovation System
• Easy Movement of People (including Cross-Border)
• International Connectivity (Hard & Soft Infrastructure) • Telecommunications, Airports
• Global Standards, Interoperability
• Conducive Business Environment (Stable, Predictable)
• Effective Talent Management Ecosystem
38 19-Nov-14
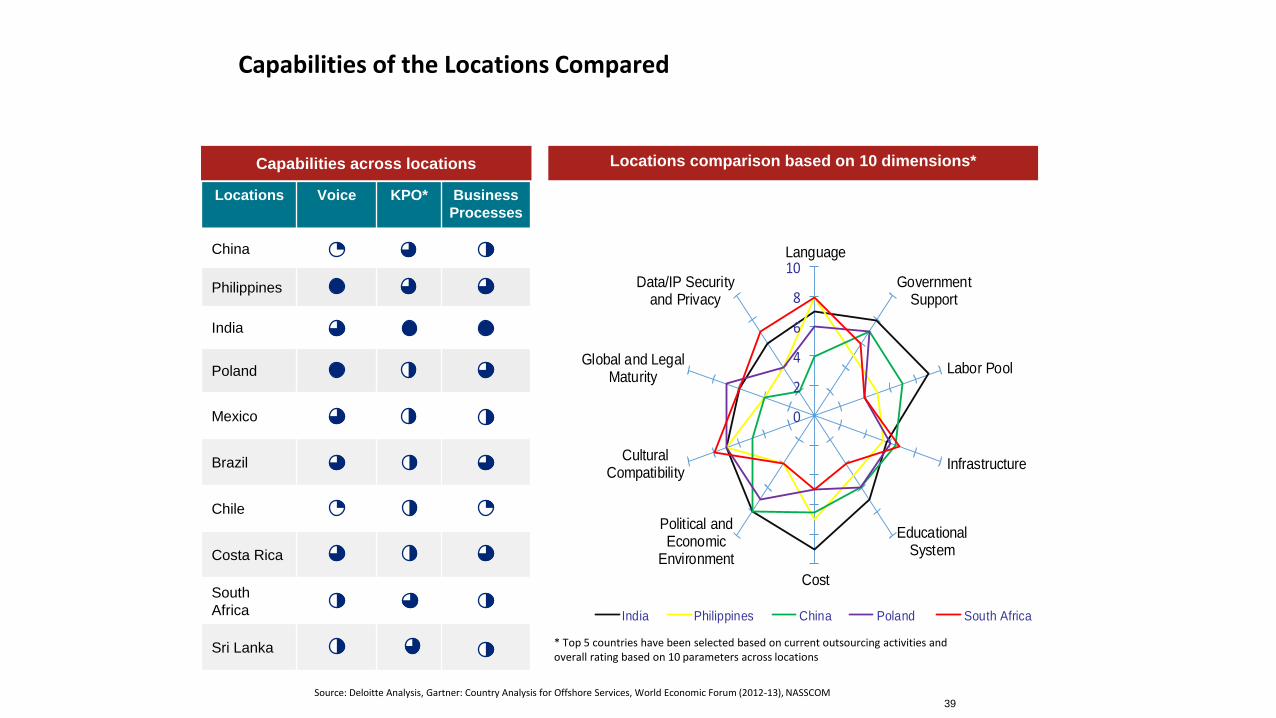
Locations comparison based on 10 dimensions*
Capabilities of the Locations Compared
39 Source: Deloitte Analysis, Gartner: Country Analysis for Offshore Services, World Economic Forum (2012-13), NASSCOM
* Top 5 countries have been selected based on current outsourcing activities and overall rating based on 10 parameters across locations
0
2
4
6
8
10Language
GovernmentSupport
Labor Pool
Infrastructure
EducationalSystem
Cost
Political andEconomic
Environment
CulturalCompatibility
Global and LegalMaturity
Data/IP Securityand Privacy
India Philippines China Poland South Africa
Locations Voice KPO* Business
Processes
China
Philippines
India
Poland
Mexico
Brazil
Chile
Costa Rica
South
Africa
Sri Lanka
Capabilities across locations
Policy Implications
• Industrial (more broadly, Development) Strategy • New Avenues (Entry and Diversification) • Small- and Medium-Enterprises
• Foreign Direct Investment (including “Captives”)
• International Trade Policies & Agreements • Mode 4 Services • Cross-Border Data Flows
• Tax Regime and Fiscal Issues • Transfer Pricing
• Government Critical to Shaping “Demand” or Ecosystem • Advance Market Commitment (e.g. Laptops for Students) • Platforms (e.g. Aadhar) • Incentives and Regulation
40 19-Nov-14
Policy and Institutional Challenges • Ensure Favourable Business Environment
• Stable, consistent and predictable tax regime • Elimination of administrative hassles & protracted litigation
• Monitor and Maintain Cost Competitiveness
• Support for SME’s & Start-ups
• Innovation is More Than R&D, Even D&E of Products ...Service Dimensions and “Business Models” also Salient
• Attract FDI to move up ladder of “Sophistication”
• Skill Development
• Strategic Priority on Exports • Special Economic Zones • Institutional & Fiscal Support for New Market Development
• Immigration & Regulatory Barriers to Services Trade
Moving the IT/ITeS Industry to the Next Orbit • Improving the Business Environment
• Broaden & Deepen Role in Indian Economy & Society
• Support SME’s and Start-Ups
• Optimize Spatial Distribution (Agglomeration Economies)
• FDI to Maximize Technology Spill-overs & Market Access
• Maintain Fundamental Economic Competitiveness
• Develop New Geographies and New Verticals
• Watch for Disruptive Technologies & Business Models
42 19-Nov-14
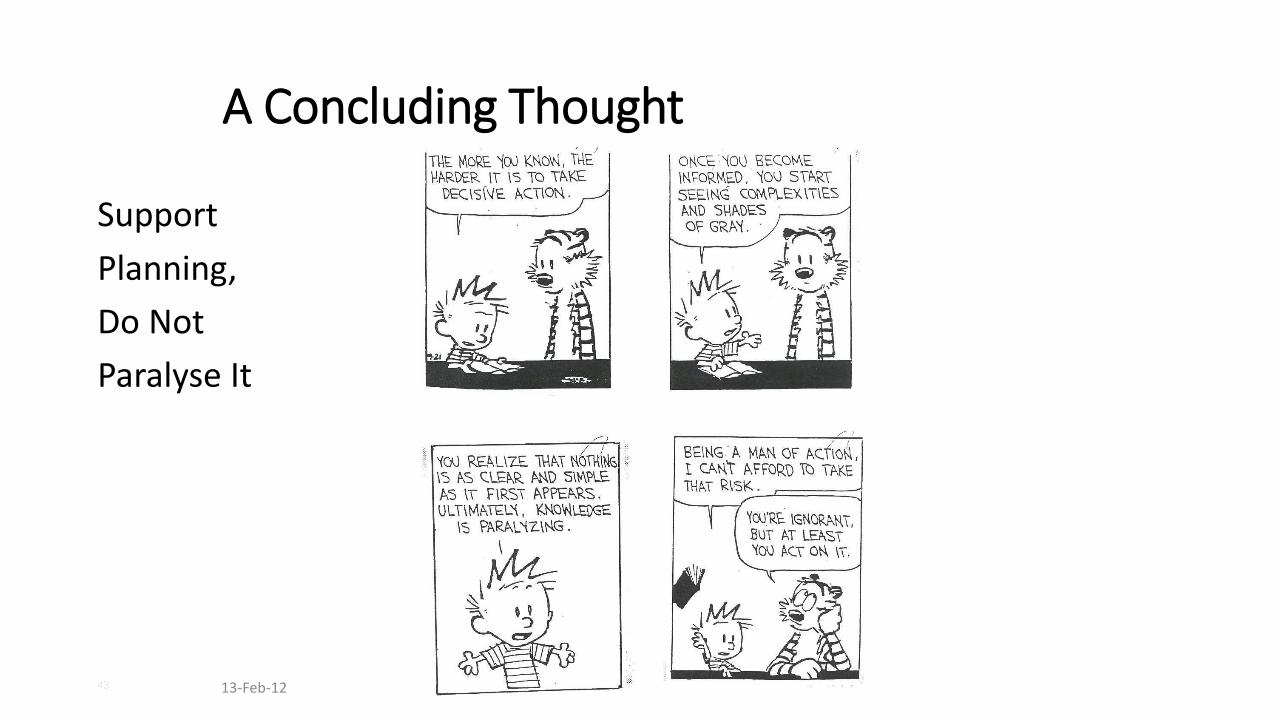
A Concluding Thought
Support
Planning,
Do Not
Paralyse It
13-Feb-12 43