Embed Size (px)
Citation preview
Component of Statistics Canada catalogue no. 85-002-X Juristat
Youth court statistics in Canada, 2011/2012
by Mia Dauvergne
Canadian Centre for Justice Statistics Released on June 13, 2013
Juristat Article
ISSN 1209-6393
How to obtain more informationFor information about this product or the wide range of services and data available from Statistics Canada, visit our website, www.statcan.gc.ca.
You can also contact us by
email at [email protected],
telephone, from Monday to Friday, 8:30 a.m. to 4:30 p.m., at the following toll‑free numbers:
• Statistical Information Service 1‑800‑263‑1136• National telecommunications device for the hearing impaired 1‑800‑363‑7629• Fax line 1‑877‑287‑4369
Depository Services Program• Inquiries line 1‑800‑635‑7943• Fax line 1‑800‑565‑7757
To access this productThis product, Catalogue no. 85-002-X, is available free in electronic format. To obtain a single issue, visit our website, www.statcan.gc.ca, and browse by “Key resource” > “Publications.”
Standards of service to the publicStatistics Canada is committed to serving its clients in a prompt, reliable and courteous manner. To this end, Statistics Canada has developed standards of service that its employees observe. To obtain a copy of these service standards, please contact Statistics Canada toll‑free at 1‑800‑263‑1136. The service standards are also published on www.statcan.gc.ca under “About us” > “The agency” > “Providing services to Canadians.”
Published by authority of the Minister responsible for Statistics Canada
© Minister of Industry, 2013
All rights reserved. Use of this publication is governed by the Statistics Canada Open Licence Agreement (http://www.statcan.gc.ca/reference/licence‑eng.html).
Cette publication est aussi disponible en français.
Standard symbolsThe following symbols are used in Statistics Canada publications:
. not available for any reference period
.. notavailableforaspecificreferenceperiod
... not applicable0 true zero or a value rounded to zero0s value rounded to 0 (zero) where there is a meaningful
distinction between true zero and the value that was rounded
p preliminaryr revisedx suppressedtomeettheconfidentialityrequirementsofthe
Statistics ActE use with cautionF too unreliable to be published* significantlydifferentfromreferencecategory(p<0.05)
Note of appreciationCanada owes the success of its statistical system to a long‑standing partnership between Statistics Canada, the citizens of Canada, its businesses, governments and other institutions. Accurate and timely statistical information could not be produced without their continued co‑operation and goodwill.

Statistics Canada—Catalogue no. 85-002-X
3
Juristat Article—Youth court statistics in Canada, 2011/2012
Youth court statistics in Canada, 2011/2012: highlights
Canadian youth courts (involving 12-to 17-year olds) completed just over 48,000 cases in 2011/2012,
representing a 10% decline from the previous year and the third consecutive annual decline. The
2011/2012 decrease resulted in the lowest number of cases completed in youth courts since national
data were first collected 20 years ago.
Recent declines in completed youth court cases occurred across the country. The largest decreases were
in the territories, where drops ranged from -23% to -36% between 2010/2011 and 2011/2012. Among
the provinces, British Columbia recorded the largest decrease in youth court cases (-16%), followed by
New Brunswick (-14%) and Ontario (-12%).
Similar to previous years, ten types of cases accounted for 70% of completed youth court cases. The
most common were cases involving theft (14%), common assault (8%), and break and enter (8%).
Virtually all types of completed youth court cases decreased between 2010/2011 and 2011/2012. Some
of the largest declines were for cases involving theft (-17%), break and enter (-15%) and major assault
(-15%). Cases involving the possession of drugs (+7%) as well as those for other drug crimes (+2%)
were among the few types of cases to increase.
The majority (77%) of youth court cases completed in 2011/2012 involved male accused. In addition,
most (61%) youth court cases involved those aged 16 or 17 years at the time of the offence.
In 2011/2012, nearly 6 in 10 (57%) completed youth court cases resulted in a finding of guilt. While
similar to the previous year, longer-term data show that the proportion of cases resulting in a finding of
guilt has decreased while the proportion of cases with a stayed, withdrawn, dismissed or discharged
outcome has increased.
Probation continued to be the most common type of youth court sentence in 2011/2012, imposed in
about 6 in 10 guilty cases. The median length of probation sentences was 1 year.
Custody sentences were imposed in 15% of 2011/2012 guilty youth court cases, down from 24% to 29%
throughout the 1990s and early 2000s. The decrease in custody has been offset somewhat by sentences
to deferred custody and supervision, imposed in about 4% to 5% of cases since being introduced as a
sentencing option in 2003.
The median length of time taken to complete a youth court case fell to 108 days (or about 3½ months),
the third consecutive annual decline. For the fifth year in a row, Manitoba recorded the longest median
case time (140 days or 4½ months) among the provinces, nearly five times longer than the shortest
median case time in Prince Edward Island (29 days).

Statistics Canada—Catalogue no. 85-002-X
4
Juristat Article—Youth court statistics in Canada, 2011/2012
Youth court statistics in Canada, 2011/2012
by Mia Dauvergne
In Canada, the youth justice system has operated separately from that for adults for over a century. From
the inception of the Juvenile Delinquents Act in 1908, to the Young Offenders Act in 1984 and the Youth
Criminal Justice Act (YCJA) in 2003, it has long been recognized that the principles that govern the adult criminal justice system are not necessarily suitable for young people accused of crime.
The YCJA legislation currently in place applies to young persons aged 12-to-17 years and emphasizes the
principles of the protection of society, crime prevention, rehabilitation and reintegration, meaningful
consequences and timely interventions. In this regard, emphasis is placed upon diverting youth who commit
crime away from the traditional justice system and reserving the most serious sentences for the most serious
types of crime. That said, although the number of youth court cases has dropped substantially under the YCJA, many cases continue to be processed through the courts.
Using data from the Integrated Criminal Court Survey, this article presents information on youth court cases
completed in Canada in 2011/2012.1 It discusses short and long-term trends in the number and types of
cases, the characteristics of youth who appear in court, case decisions, sentencing outcomes and the length of time taken to complete youth court cases.
Cases completed in youth courts reach lowest point in 20 years
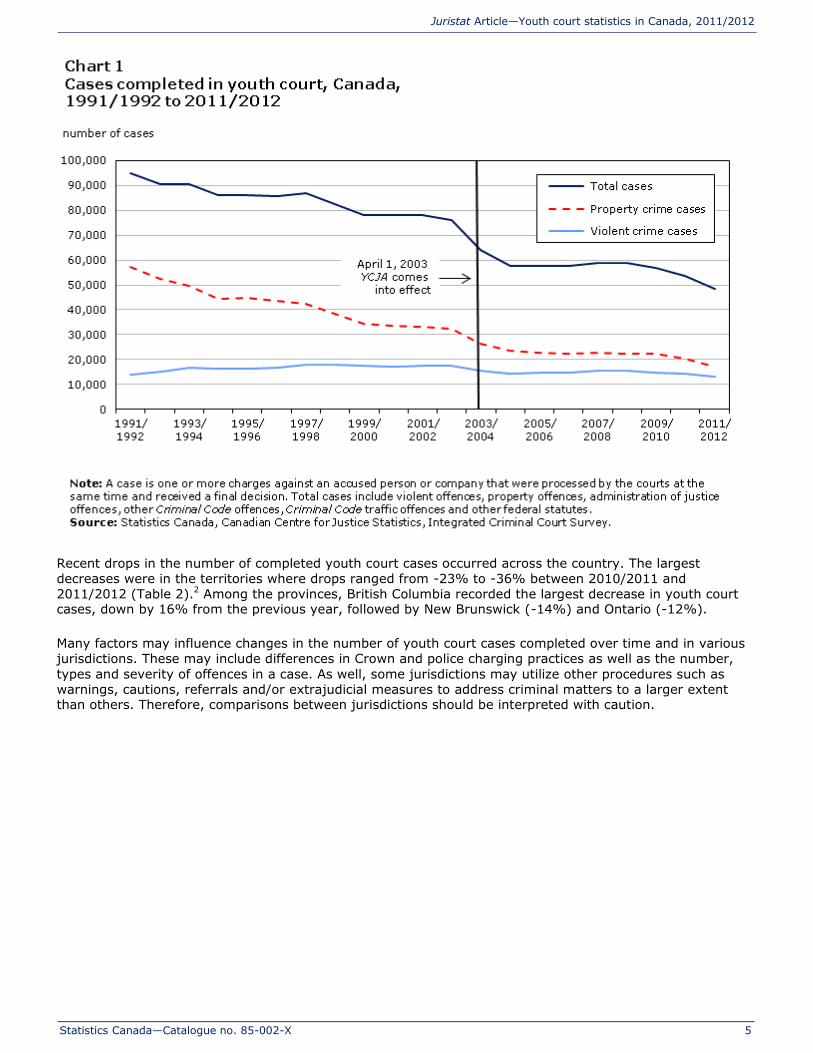
In 2011/2012, Canada’s youth courts completed just over 48,000 cases involving about 166,000 Criminal
Code and other federal statute offences, such as those contrary to the Youth Criminal Justice Act (YCJA)
(Table 1). This number represented a 10% drop from the previous year (almost 5,300 fewer cases) and the
third consecutive annual decline. The 2011/2012 decrease reflects the lowest number of completed youth court cases since these data were first collected by Statistics Canada in 1991/1992 (Chart 1).
Statistics Canada—Catalogue no. 85-002-X
5
Juristat Article—Youth court statistics in Canada, 2011/2012
Recent drops in the number of completed youth court cases occurred across the country. The largest
decreases were in the territories where drops ranged from -23% to -36% between 2010/2011 and
2011/2012 (Table 2).2 Among the provinces, British Columbia recorded the largest decrease in youth court cases, down by 16% from the previous year, followed by New Brunswick (-14%) and Ontario (-12%).
Many factors may influence changes in the number of youth court cases completed over time and in various
jurisdictions. These may include differences in Crown and police charging practices as well as the number,
types and severity of offences in a case. As well, some jurisdictions may utilize other procedures such as
warnings, cautions, referrals and/or extrajudicial measures to address criminal matters to a larger extent than others. Therefore, comparisons between jurisdictions should be interpreted with caution.

Statistics Canada—Catalogue no. 85-002-X
6
Juristat Article—Youth court statistics in Canada, 2011/2012
Virtually all types of youth court cases decline in 2011/2012
Similar to previous years, ten types of cases accounted for most (70%) of the youth court caseload, the
majority of which involved non-violent offences such as theft (14%)3 and break and enter (8%) (Chart 2).4 The most common type of violent youth court case involved common assault, at 8% of all completed cases.
The decrease in the total number of completed youth court cases between 2010/2011 and 2011/2012 was
driven by fewer cases involving virtually every type of offence (Table 3). More specifically, decreases were
seen among all types of property crime cases, including the two most common ones: theft (-17%) and break
and enter (-15%). Among violent crime cases, drops included fewer major assault (-15%) and criminal
harassment (-14%) cases. Other types of cases, namely those involving impaired driving (-21%),
administration of justice offences (-8%), and those against the YCJA (-5%), also declined from the year
before. For many types of cases, including, attempted murder, major assault, common assault, theft, break
and enter, fraud, mischief, failure to appear, breach of probation, unlawfully at large and impaired driving, the number completed in 2011/2012 was the lowest since data were first collected in 1991/1992.
The main exception to the decrease in the youth court caseload involved cases for drug offences, which
accounted for 8% of all cases in 2011/2012. Cases for possession of drugs rose 7% while cases for other
types of drug crime (e.g. trafficking, production, exporting/importing) were up 2% from the previous year.
There was also one more homicide case in 2011/2012 than in 2010/2011 and six more cases involving the combined category of “other sexual offences”, such as sexual interference and invitation to sexual touching.

Statistics Canada—Catalogue no. 85-002-X
7
Juristat Article—Youth court statistics in Canada, 2011/2012
Most youth court cases involve 16- and 17-year-olds
Police-reported data consistently show that crime rates tend to peak during late adolescence and early
adulthood (Brennan 2012). Information from youth courts supports this finding despite the fact that not all crimes that come to the attention of police necessarily proceed through the court system.
In 2011/2012, 16- and 17-year-olds accounted for 61% of cases completed in youth court while 12- to 15-
year-olds accounted for 39%.5 The larger proportion of older youth held consistent for both males and
females and across most types of cases. For cases involving sexual assault and other sexual offences, however, accused persons were more often younger youth (12- to 15-year-olds) than older youth.
As is also the case for crime in general, the majority of completed youth court cases involve male accused
(Chart 3). In 2011/2012, about three-quarters (77%) of youth accused were male and one-quarter (23%)
were female.6 The representation of females was highest among cases for fraud, disturbing the peace and
failure to appear (each accounting for 37% of all accused youth) and lowest for sexual assault (3%), other sexual offences (6%), homicide (7%) and weapons offences (9%).

Statistics Canada—Catalogue no. 85-002-X
8
Juristat Article—Youth court statistics in Canada, 2011/2012
Guilty findings lower than a decade ago
Cases completed in youth court typically result in one of three outcomes. The first, and most common, is a
finding of guilt in which the accused person either pleads guilty or is found guilty by the court. Second, cases
may be stayed (suspended for up to 1 year), withdrawn, dismissed or discharged as a result of proceedings
being stopped or interrupted (e.g., due to lack of sufficient evidence or referral to an extrajudicial measures
program). Lastly, each year, a relatively small proportion of cases result in an acquittal in which the accused youth is found not guilty of the charge presented before the court.7,8
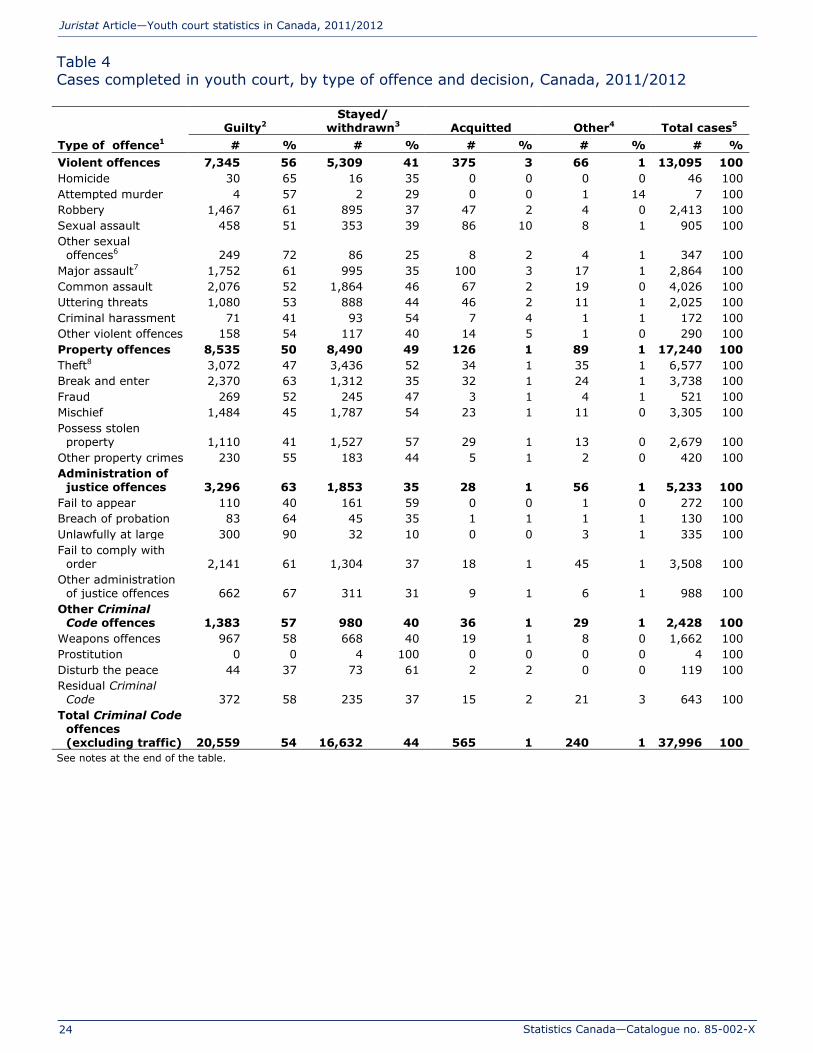
In 2011/2012, nearly 6 in 10 (57%) completed youth court cases resulted in a guilty finding. There were
some types of cases that resulted in a finding of guilt more (or less) often than others. For example,
unlawfully at large and impaired driving cases had the highest proportions of guilty findings (90% and 88%,
respectively) while those for drug possession and disturbing the peace (33% and 37%, respectively) had the lowest (Table 4).
Another 42% of completed youth court cases were stayed, withdrawn, dismissed or discharged, and about
1% were acquitted. In addition, less than 1% of cases resulted in another type of decision, such as the accused being found not criminally responsible or unfit to stand trial.
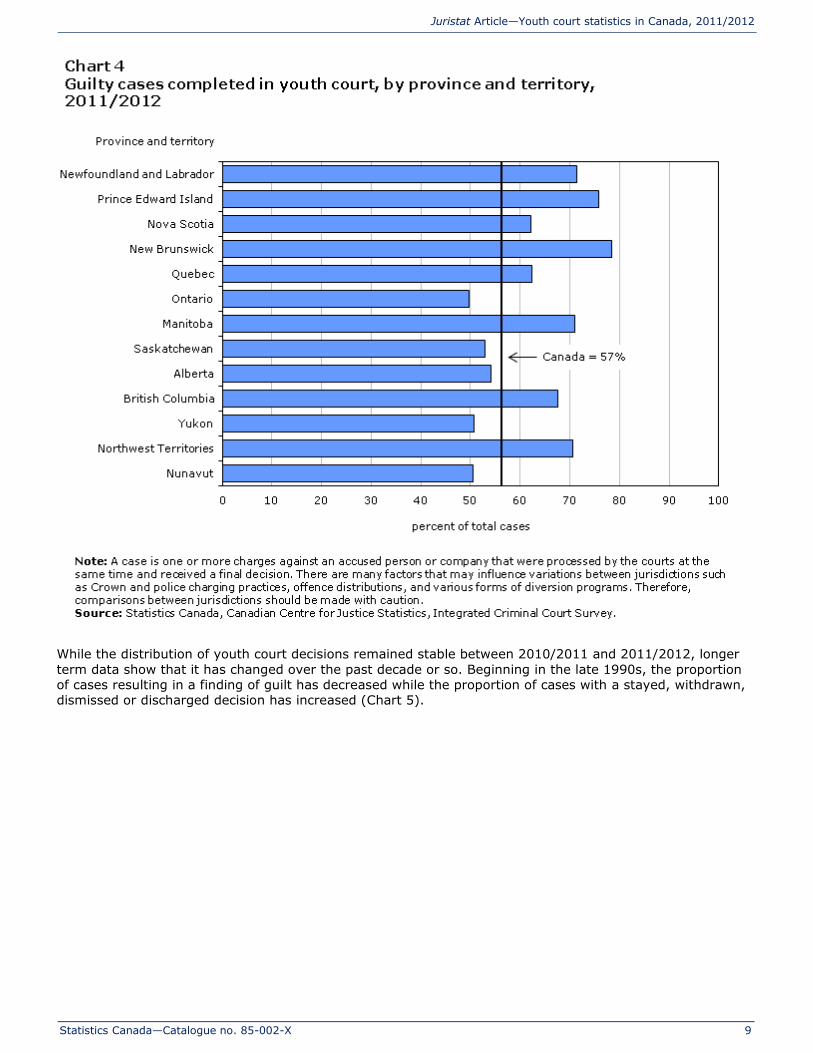
There is considerable variation in the types of decisions reached by courts across different provinces and
territories.9 For example, in 2011/2012, the proportion of guilty findings ranged from a low of 50% in Ontario
and Nunavut to a high of 79% in New Brunswick (Chart 4). Some of the difference may be explained by the
use of pre-charge screening practices in which Crown prosecutors (rather than police) decide whether or not
to lay charges. These types of practices exist in New Brunswick, Quebec and British Columbia where the
proportions of guilty findings were each above the Canadian average. Jurisdictional differences in the use of
extrajudicial measures programs may also influence court decisions.
Statistics Canada—Catalogue no. 85-002-X
9
Juristat Article—Youth court statistics in Canada, 2011/2012
While the distribution of youth court decisions remained stable between 2010/2011 and 2011/2012, longer
term data show that it has changed over the past decade or so. Beginning in the late 1990s, the proportion
of cases resulting in a finding of guilt has decreased while the proportion of cases with a stayed, withdrawn,
dismissed or discharged decision has increased (Chart 5).

Statistics Canada—Catalogue no. 85-002-X
10
Juristat Article—Youth court statistics in Canada, 2011/2012
Probation most common type of youth court sentence
There are many types of sentences that may be imposed upon a youth found guilty of a crime. In
determining the most appropriate sentence, judges must ensure meaningful consequences while balancing
the principles of the YCJA, including the protection of society and the rehabilitative needs of the young
person (Department of Justice Canada 2012). Given the complexities involved, many youth court cases result in more than one type of sentence (e.g., probation and community service order).
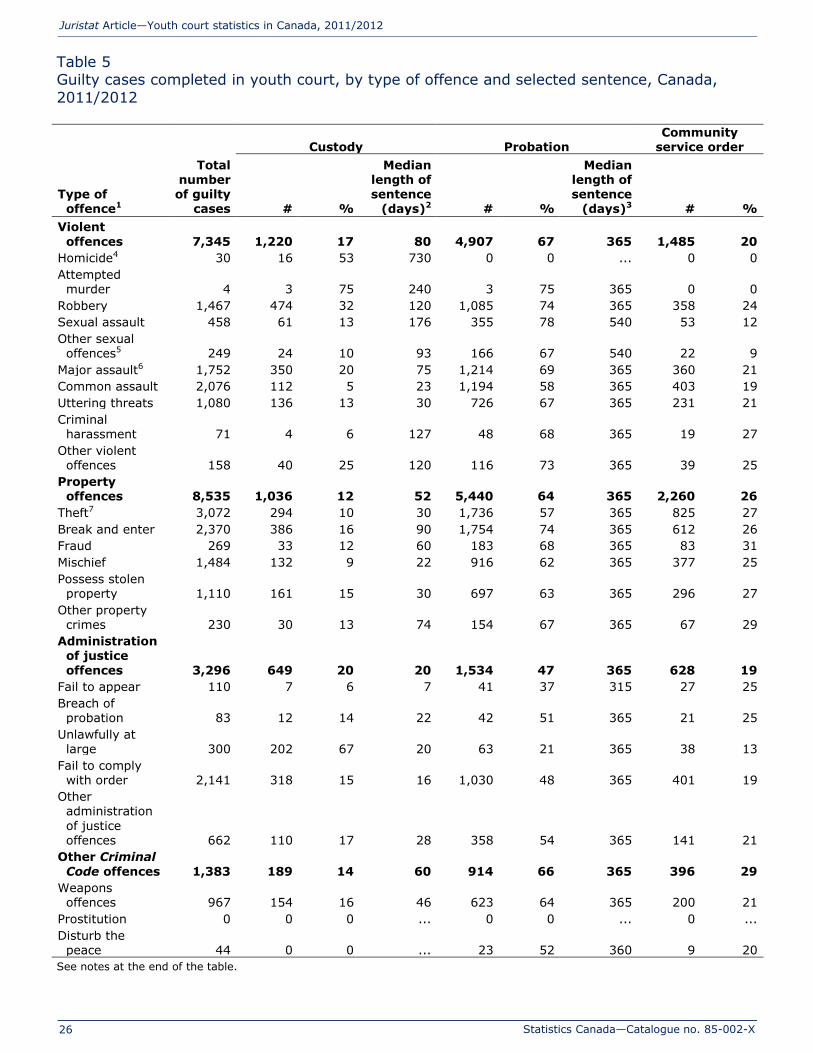
As in previous years, probation, either on its own or in combination with another type of sentence, was the
most common type of sentence, imposed in about 6 in 10 (58%) guilty youth court cases in 2011/2012
(Table 5, Chart 6). Probation is a community-based sentence that requires youth to abide by certain
conditions, such as reporting to a probation officer and/or keeping the peace. The median length of most types of 2011/2012 youth court cases in which probation was imposed was 365 days (or 1 year) (Table 5).
A community service order, in which a youth is required to perform unpaid work, was issued in one-quarter
(25%) of all guilty youth court cases in 2011/2012 (Table 5). This type of sentence, often issued in
combination with probation, was most commonly associated with cases involving the category of “other drug
offences”, namely those for drug trafficking, exportation and importation, and production (39%), and drug possession (33%).

Statistics Canada—Catalogue no. 85-002-X
11
Juristat Article—Youth court statistics in Canada, 2011/2012
Youth court sentences to custody decline from 10 years ago
Another type of youth court sentence is a custody disposition which requires a youth to be detained in a
correctional facility or youth justice centre. This type of sentence is the most severe and, according to the YCJA, is to be reserved for the most serious of crimes committed by youth.
Overall, 15% of guilty youth court cases resulted in a sentence to custody in 2011/2012 (Table 5). A custody
sentence was most often imposed in attempted murder cases (75%), followed by unlawfully at large cases
(67%) and homicide cases (53%). In contrast, guilty cases for disturbing the peace, impaired driving, and
drug possession seldom resulted in a youth court sentence to custody.
Statistics Canada—Catalogue no. 85-002-X
12
Juristat Article—Youth court statistics in Canada, 2011/2012
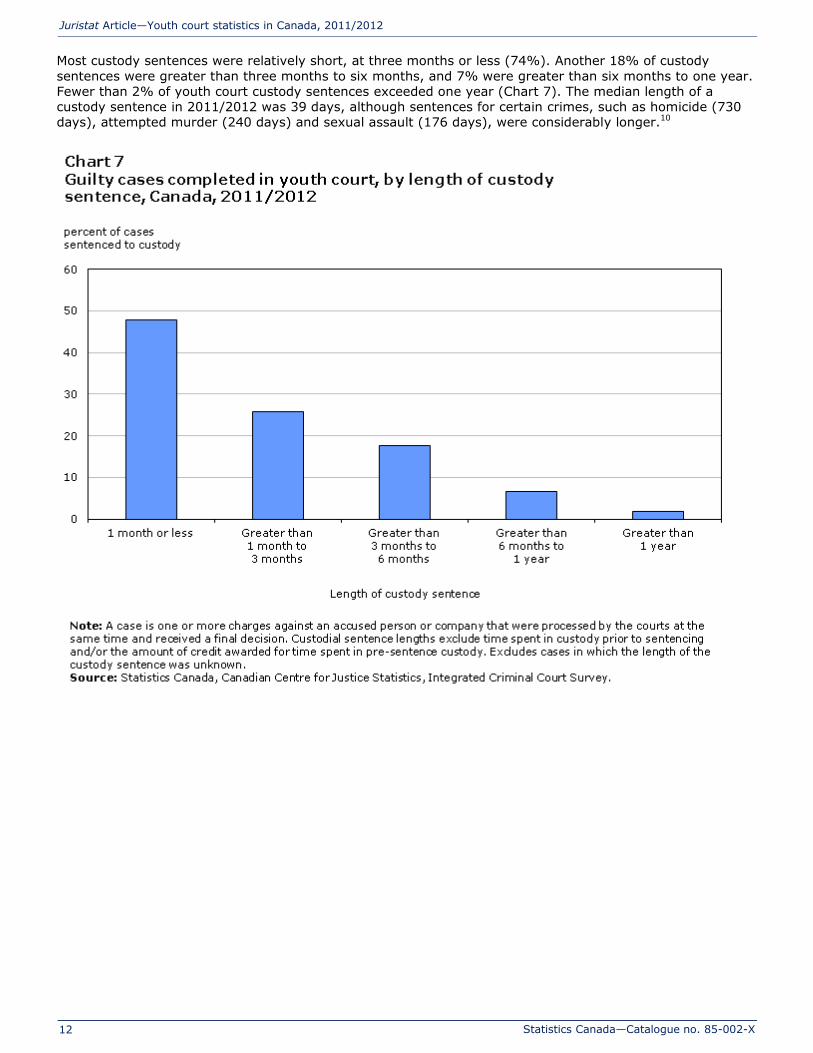
Most custody sentences were relatively short, at three months or less (74%). Another 18% of custody
sentences were greater than three months to six months, and 7% were greater than six months to one year.
Fewer than 2% of youth court custody sentences exceeded one year (Chart 7). The median length of a
custody sentence in 2011/2012 was 39 days, although sentences for certain crimes, such as homicide (730
days), attempted murder (240 days) and sexual assault (176 days), were considerably longer.10
Statistics Canada—Catalogue no. 85-002-X
13
Juristat Article—Youth court statistics in Canada, 2011/2012
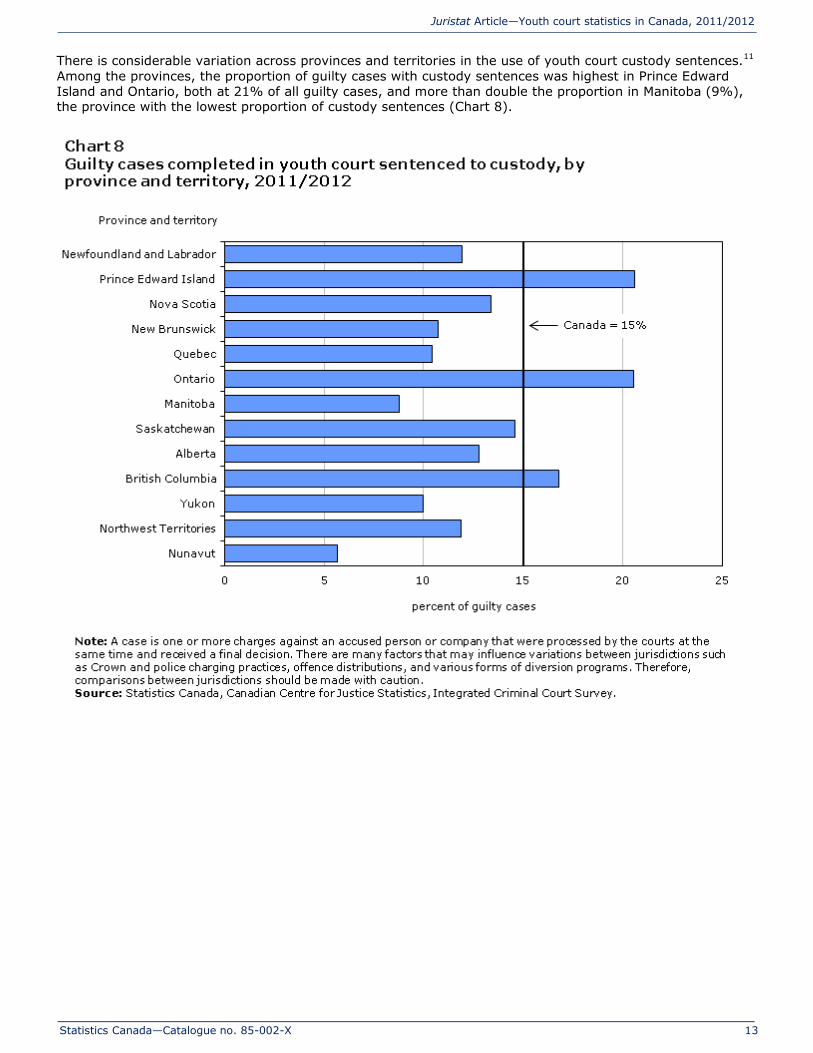
There is considerable variation across provinces and territories in the use of youth court custody sentences.11
Among the provinces, the proportion of guilty cases with custody sentences was highest in Prince Edward
Island and Ontario, both at 21% of all guilty cases, and more than double the proportion in Manitoba (9%), the province with the lowest proportion of custody sentences (Chart 8).
Statistics Canada—Catalogue no. 85-002-X
14
Juristat Article—Youth court statistics in Canada, 2011/2012
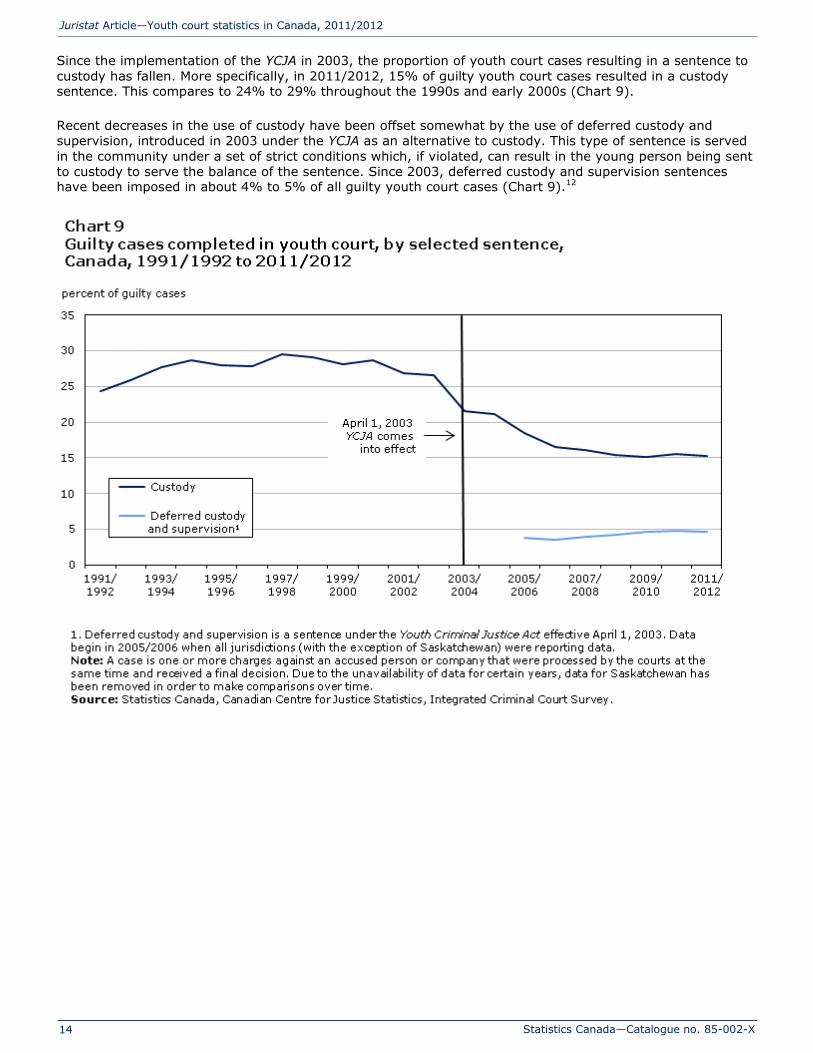
Since the implementation of the YCJA in 2003, the proportion of youth court cases resulting in a sentence to
custody has fallen. More specifically, in 2011/2012, 15% of guilty youth court cases resulted in a custody sentence. This compares to 24% to 29% throughout the 1990s and early 2000s (Chart 9).
Recent decreases in the use of custody have been offset somewhat by the use of deferred custody and
supervision, introduced in 2003 under the YCJA as an alternative to custody. This type of sentence is served
in the community under a set of strict conditions which, if violated, can result in the young person being sent
to custody to serve the balance of the sentence. Since 2003, deferred custody and supervision sentences have been imposed in about 4% to 5% of all guilty youth court cases (Chart 9).12
Statistics Canada—Catalogue no. 85-002-X
15
Juristat Article—Youth court statistics in Canada, 2011/2012
Time taken to complete youth court cases declines for third year in a row
According to the YCJA, the measures taken against young persons who commit an offence should be
administered within a timely manner. While a specific time frame is not stated, historical court cases suggest
that, in general, an 8-to 10-month period is considered acceptable.13 For cases involving a trial, an additional
6-to-8 months is acceptable.14
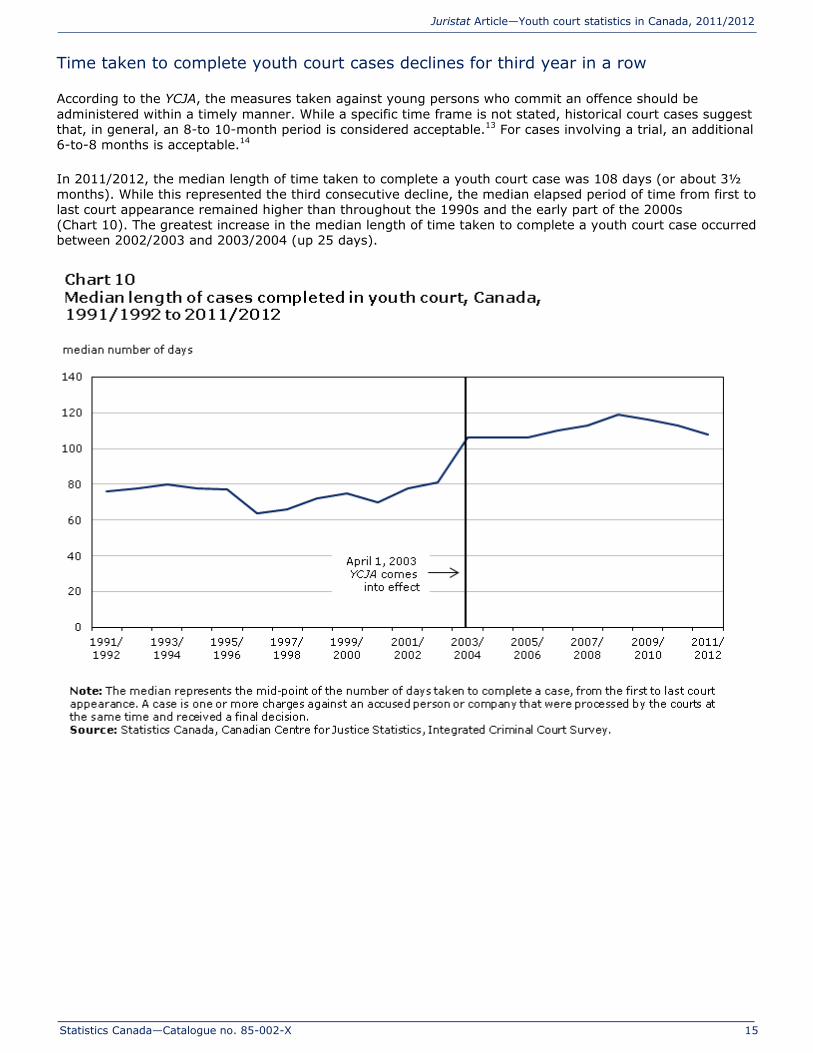
In 2011/2012, the median length of time taken to complete a youth court case was 108 days (or about 3½
months). While this represented the third consecutive decline, the median elapsed period of time from first to
last court appearance remained higher than throughout the 1990s and the early part of the 2000s
(Chart 10). The greatest increase in the median length of time taken to complete a youth court case occurred
between 2002/2003 and 2003/2004 (up 25 days).

Statistics Canada—Catalogue no. 85-002-X
16
Juristat Article—Youth court statistics in Canada, 2011/2012
Some types of court cases tend to take longer than others. In 2011/2012, the median time for homicide
cases was the longest at 395 days (about 13 months), followed by those for sexual assault (252 days or
about 8½ months) and attempted murder (247 days or about 8 months) (Chart 11). Longer case times for
violent offences may be partly related to trials which, in 2011/2012, were held more often in violent cases
than non-violent cases (10% versus 5%).15
Statistics Canada—Catalogue no. 85-002-X
17
Juristat Article—Youth court statistics in Canada, 2011/2012
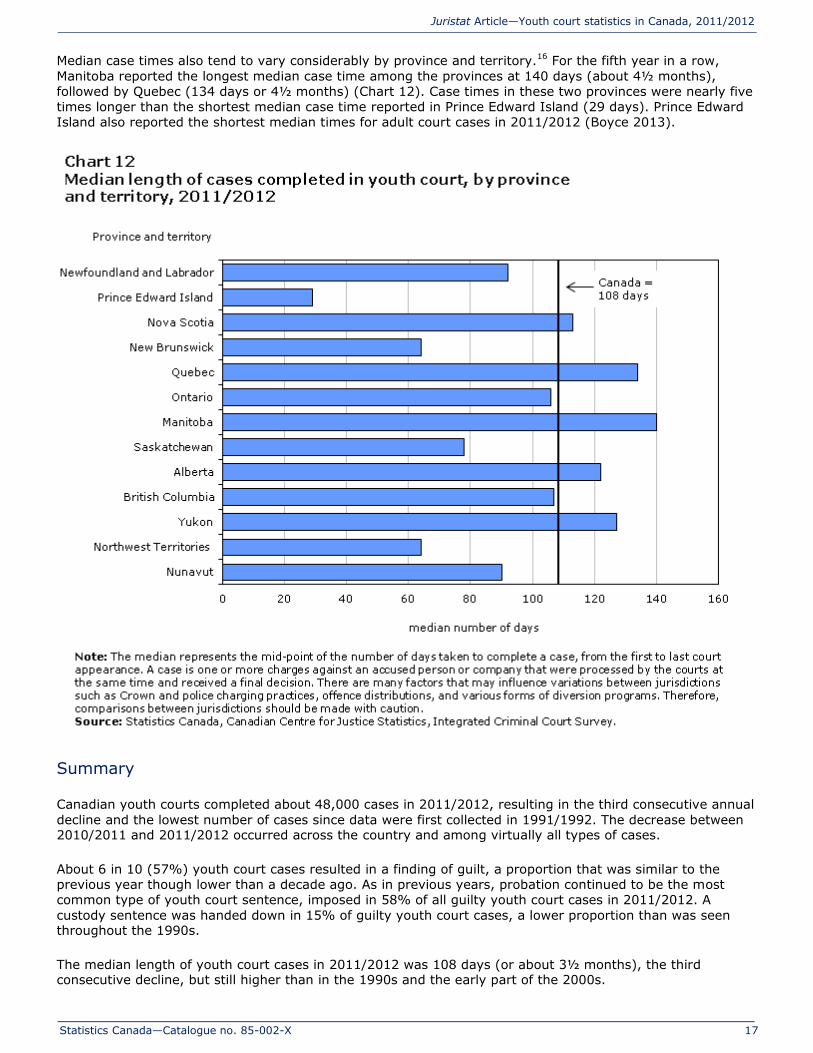
Median case times also tend to vary considerably by province and territory.16 For the fifth year in a row,
Manitoba reported the longest median case time among the provinces at 140 days (about 4½ months),
followed by Quebec (134 days or 4½ months) (Chart 12). Case times in these two provinces were nearly five
times longer than the shortest median case time reported in Prince Edward Island (29 days). Prince Edward
Island also reported the shortest median times for adult court cases in 2011/2012 (Boyce 2013).
Summary
Canadian youth courts completed about 48,000 cases in 2011/2012, resulting in the third consecutive annual
decline and the lowest number of cases since data were first collected in 1991/1992. The decrease between 2010/2011 and 2011/2012 occurred across the country and among virtually all types of cases.
About 6 in 10 (57%) youth court cases resulted in a finding of guilt, a proportion that was similar to the
previous year though lower than a decade ago. As in previous years, probation continued to be the most
common type of youth court sentence, imposed in 58% of all guilty youth court cases in 2011/2012. A
custody sentence was handed down in 15% of guilty youth court cases, a lower proportion than was seen throughout the 1990s.
The median length of youth court cases in 2011/2012 was 108 days (or about 3½ months), the third consecutive decline, but still higher than in the 1990s and the early part of the 2000s.

Statistics Canada—Catalogue no. 85-002-X
18
Juristat Article—Youth court statistics in Canada, 2011/2012
Survey description
The Integrated Criminal Court Survey (ICCS) is administered by the Canadian Centre for Justice
Statistics (Statistics Canada) in collaboration with provincial and territorial government departments
responsible for criminal courts in Canada. The survey collects statistical information on adult and youth court
cases involving Criminal Code and other federal statute charges. Data contained in this article represent the
youth court portion of the survey. The individuals involved are persons aged 12 to 17 years (up to the 18th
birthday) at the time of the offence. All youth courts in Canada have reported data to the youth component of the survey since the 1991/1992 fiscal year.
The primary unit of analysis is a case. A case is defined as one or more charges against an accused person or
company that were processed by the courts at the same time and received a final decision. A case combines
all charges against the same person having one or more key overlapping dates (date of offence, date of initiation, date of first appearance, date of decision, or date of sentencing) into a single case.
A case that has more than one charge is represented by the charge with the "most serious offence" (MSO).
The most serious offence is selected using the following rules. First, court decisions are considered and the
charge with the “most serious decision” (MSD) is selected. Court decisions for each charge in a case are
ranked from most to least serious as follows: 1) guilty, 2) guilty of a lesser offence, 3) acquitted, 4) stay of
proceeding, 5) withdrawn, dismissed and discharged, 6) not criminally responsible, 7) other, and 8) transfer of court jurisdiction.
Second, in cases where two or more charges result in the same MSD (e.g., guilty), Criminal Code sentences
are considered. The charge with the most serious offence type is selected according to an offence seriousness
scale, based on actual sentences handed down by courts in Canada.17 Each offence type is ranked by looking
at (a) the proportion of guilty charges where custody was imposed and (b) the average (mean) length of
custody for the specific type of offence. These values are multiplied together to arrive at the final seriousness
ranking for each type of offence. If, after looking at the offence seriousness scale, two or more charges
remain tied then information about the sentence type and duration of the sentence are considered (e.g., custody and length of custody, then probation and length of probation, etc.).
Cases are counted according to the fiscal year in which they are completed. Each year, the ICCS database is
“frozen” at the end of March for the production of court statistics pertaining to the preceding fiscal year.
However, these counts do not include cases that were pending an outcome at the end of the reference
period. If a pending outcome is reached in the next fiscal year, then these cases are included in the
completed case counts for that fiscal year. However, if a one-year period of inactivity elapses, then these
cases are deemed complete and the originally published counts for the previous fiscal year are subsequently
updated and reported in the next year’s release of the data. For example, upon the release of 2011/2012
data, the 2010/2011 data are updated with revisions for cases that were originally pending an outcome in
2010/2011 but have since been deemed complete due to a one-year period of inactivity. Data are revised
once and are then permanently “frozen”. Historically, updates to a previous year’s counts have resulted in an increase of about 2%.
Lastly, there are many factors that influence variations between jurisdictions. These may include Crown and
police charging practices, the number, types and severity of offences, and various forms of diversion programs. Therefore, any comparisons between jurisdictions should be interpreted with caution.
References
Boyce, Jill. 2013. “Adult criminal court statistics, 2011/2012.” Juristat. Statistics Canada Catalogue no. 85-002-X.
Brennan, Shannon. 2012. “Police reported crime statistics, 2011.” Juristat. Statistics Canada Catalogue
no. 85-002-X (accessed December 13, 2012).
Department of Justice Canada. 2012. “The Youth Criminal Justice Act: Summary and Background.” Ottawa. (accessed December 13, 2012).
Statistics Canada—Catalogue no. 85-002-X
19
Juristat Article—Youth court statistics in Canada, 2011/2012
Notes
1. For information on adult court statistics in Canada, see Boyce 2013.
2. In general, jurisdictions with smaller completed case counts tend to see more fluctuation in year-
over-year percentage changes.
3. Includes, for example, theft over $5,000, theft $5,000 or under, as well as motor vehicle theft.
4. Unless otherwise stated, youth court cases that involve more than one charge are represented by the
most serious offence. For further information, see Survey description section.
5. The analysis of youth court cases by age is based upon the accused person’s age at the time the
alleged offence was committed. Excludes cases for which the age of the accused was unknown.
6. The analysis of youth court cases by sex excludes Manitoba due to the unavailability of information.
Also excludes cases for which the sex of the accused was unknown.
7. In Newfoundland and Labrador, the terms “acquittal” and “dismissed” are used interchangeably,
resulting in an under-count of the number of acquittals in that province. In other provinces, the
number of acquittals may be over-counted due to administrative practices.
8. A small proportion of cases result in other outcomes, such as not criminally responsible, waived in/out
of province, a mistrial, the court’s acceptance of a special plea (e.g., autrefois acquit), cases that
raise Charter arguments, and cases where the accused was found unfit to stand trial following a
fitness hearing.
9. There are many factors that may influence variations between jurisdictions such as Crown and police
charging practices, offence distributions, and various forms of diversion programs. Therefore,
comparisons between jurisdictions should be interpreted with caution.
10. Median custodial sentence lengths exclude time spent in custody prior to sentencing and/or the
amount of credit awarded for time spent in pre-sentence custody. Also excludes cases in which the
length of the custody sentence was unknown.
11. See Note 9.
12. Excludes Saskatchewan due to the unavailability of data for certain years.
13. See R. v. Askov [1990], 2 S.C.R. 1199.
14. See R. v. Morin [1992], 2 S.C.R. 1199.
15. The analysis of trial cases excludes Manitoba due to data quality concerns.
16. See Note 9.
17. The offence seriousness scale is calculated using data from both the Adult Criminal Court (ACCS) and
Youth Court Survey (YCS) components of the Integrated Criminal Court Survey (ICCS) from
2002/2003 to 2006/2007.

Statistics Canada—Catalogue no. 85-002-X
20
Juristat Article—Youth court statistics in Canada, 2011/2012
Detailed data tables
Table 1 Cases and charges completed in youth court, Canada, 1991/1992 to 2011/2012
Year
Total charges1 Total cases2
number
Percent change in
number of charges
from
previous year (%) number
Percent change in
number of cases
from
previous year (%)
1991/1992 218,802 .. 94,728 ..
1992/1993 211,904 -3.2 90,561 -4.4
1993/1994 212,660 0.4 90,333 -0.3
1994/1995 203,723 -4.2 86,044 -4.7
1995/1996 204,546 0.4 85,882 -0.2
1996/1997 208,124 1.7 85,634 -0.3
1997/1998 214,492 3.1 86,904 1.5
1998/1999 208,246 -2.9 82,578 -5.0
1999/2000 200,434 -3.8 77,969 -5.6
2000/2001 200,571 0.1 77,859 -0.1
2001/2002 209,106 4.3 77,869 0.0
2002/2003 206,215 -1.4 76,204 -2.1
2003/2004 194,894 -5.5 64,029 -16.0
2004/2005 179,056 -8.1 57,675 -9.9
2005/2006 180,585 0.9 57,467 -0.4
2006/2007 185,409 2.7 57,482 0.0
2007/2008 191,194 3.1 58,710 2.1
2008/2009 194,142 1.5 58,968 0.4
2009/2010 189,494 -2.4 56,859 -3.6
2010/2011 181,835 -4.0 53,494 -5.9
2011/2012 166,125 -8.6 48,229 -9.8
Percent
change
2001/20
02 to
2011/20
12 ... -20.6 ... -38.1
.. not available for a specific reference period
... not applicable 1. A charge refers to a formal accusation against an accused person or company involving a federal statute offence that has been processed by the courts and received a final decision. 2. A case is one or more charges against an accused person or company that were processed by the courts at the same time and received a final decision. Source: Statistics Canada, Canadian Centre for Justice Statistics, Integrated Criminal Court Survey.

Statistics Canada—Catalogue no. 85-002-X
21
Juristat Article—Youth court statistics in Canada, 2011/2012
Table 2 Cases completed in youth court, by province and territory, 2010/2011 and 2011/2012
Province or
territory
2010/2011 2011/2012
Percent change in
number of cases
2010/2011 to
2011/2012 (%)
Difference in median
length of cases
2010/2011 to
2011/2012 (days) number1
Median
length
of case
(days)2 number1
Median
length
of case
(days)2
Newfoundland
and Labrador 608 114 587 92 -3.5 -22
Prince Edward
Island 188 36 173 29 -8.0 -7
Nova Scotia 1,390 134 1,285 113 -7.6 -21
New Brunswick 1,245 66 1,066 64 -14.4 -2
Quebec 7,669 122 7,554 134 -1.5 12
Ontario 22,204 113 19,548 106 -12.0 -7
Manitoba 3,459 142 3,316 140 -4.1 -2
Saskatchewan 5,066 85 4,564 78 -9.9 -7
Alberta 7,574 124 6,789 122 -10.4 -2
British Columbia 3,477 105 2,915 107 -16.2 2
Yukon 124 147 79 127 -36.3 -20
Northwest
Territories 216 67 143 64 -33.8 -3
Nunavut 274 65 210 90 -23.4 25
Canada 53,494 113 48,229 108 -9.8 -5
1. A case is one or more charges against an accused person or company that were processed by the courts at the same time and received a final decision. 2. Refers to the mid-point in the number of days taken to complete a case, from first to last court appearance. Note: There are many factors that may influence variations between jurisdictions such as Crown and police charging practices, offence distributions, and various forms of diversion programs. Therefore, comparisons between jurisdictions should be made with caution. Source: Statistics Canada, Canadian Centre for Justice Statistics, Integrated Criminal Court Survey.

Statistics Canada—Catalogue no. 85-002-X
22
Juristat Article—Youth court statistics in Canada, 2011/2012
Table 3 Cases completed in youth court, by type of offence, Canada, 2010/2011 and 2011/2012
Type of offence1
2010/2011 2011/2012
Percent change in
number of cases 2010/2011 to
2011/2012 (%)
Difference in
median length of cases 2010/2011 to
2011/2012 (days) number2
Median
length of case
(days)3 number2
Median
length of case
(days)3
Violent offences 14,275 156 13,095 155 -8.3 -1
Homicide 45 322 46 395 2.2 73
Attempted murder 24 275 7 247 -70.8 -28
Robbery 2,605 178 2,413 182 -7.4 4
Sexual assault 965 244 905 252 -6.2 8
Other sexual offences4 341 225 347 210 1.8 -15
Major assault5 3,361 163 2,864 156 -14.8 -7
Common assault 4,208 127 4,026 126 -4.3 -1
Uttering threats 2,171 137 2,025 134 -6.7 -3
Criminal harassment 201 148 172 127 -14.4 -21
Other violent offences 354 196 290 180 -18.1 -16
Property offences 20,408 114 17,240 107 -15.5 -7
Theft6 7,879 106 6,577 99 -16.5 -7
Break and enter 4,410 130 3,738 130 -15.2 0
Fraud 641 113 521 125 -18.7 12
Mischief 3,752 116 3,305 106 -11.9 -10
Possess stolen property 3,147 120 2,679 106 -14.9 -14
Other property
crimes 579 157 420 151 -27.5 -6
Administration of justice offences 5,702 77 5,233 78 -8.2 1
Fail to appear 305 54 272 63 -10.8 9
Breach of probation 179 64 130 51 -27.4 -13
Unlawfully at large 426 10 335 10 -21.4 0
Fail to comply with order 3,738 85 3,508 82 -6.2 -3
Other administration of justice offences 1,054 89 988 90 -6.3 1
Other Criminal Code offences 2,709 140 2,428 134 -10.4 -6
Weapons offences 1,834 142 1,662 140 -9.4 -2
Prostitution 14 130 4 154 -71.4 24
Disturb the peace 165 106 119 85 -27.9 -21
Residual Criminal Code 696 135 643 122 -7.6 -13
Total Criminal
Code offences (excluding traffic) 43,094 124 37,996 120 -11.8 -4
Criminal Code traffic offences 963 99 838 106 -13.0 7
Impaired driving 571 71 453 67 -20.7 -4
Other Criminal Code
traffic offences 392 140 385 152 -1.8 12
Total Criminal Code offences
(including traffic) 44,057 123 38,834 120 -11.9 -3
See notes at the end of the table.

Statistics Canada—Catalogue no. 85-002-X
23
Juristat Article—Youth court statistics in Canada, 2011/2012
Table 3
Cases completed in youth court, by type of offence, Canada, 2010/2011 and 2011/2012 (continued)
Type of offence1
2010/2011 2011/2012
Percent change in number of cases
2010/2011 to 2011/2012 (%)
Difference in median length of
cases 2010/2011 to 2011/2012 (days) number2
Median length of
case (days)3 number2
Median length of
case (days)3
Other federal
statute offences 9,437 64 9,395 63 -0.4 -1
Drug possession 2,560 90 2,734 92 6.8 2
Other drug offences7 1,220 148 1,246 141 2.1 -7
Youth Criminal Justice Act 5,603 42 5,326 36 -4.9 -6
Other federal statutes 54 29 89 34 64.8 5
Total offences 53,494 113 48,229 108 -9.8 -5
1. Cases that involve more than one charge are represented by the most serious offence. 2. A case is one or more charges against an accused person or company that were processed by the courts at the same time and received a final decision. 3. Refers to the mid-point in the number of days taken to complete a case, from first to last court appearance. 4. Includes, for example, sexual interference, invitation to sexual touching, child pornography, luring a child via a computer and sexual exploitation. 5. Includes, for example, assault with a weapon (level 2) and aggravated assault (level 3). 6. Includes, for example, theft over $5,000, theft $5,000 or under, as well as motor vehicle theft. 7. Includes drug trafficking, exportation and importation, and production. Source: Statistics Canada, Canadian Centre for Justice Statistics, Integrated Criminal Court Survey.
Statistics Canada—Catalogue no. 85-002-X
24
Juristat Article—Youth court statistics in Canada, 2011/2012
Table 4 Cases completed in youth court, by type of offence and decision, Canada, 2011/2012
Type of offence1
Guilty2 Stayed/
withdrawn3 Acquitted Other4 Total cases5
# % # % # % # % # %
Violent offences 7,345 56 5,309 41 375 3 66 1 13,095 100
Homicide 30 65 16 35 0 0 0 0 46 100
Attempted murder 4 57 2 29 0 0 1 14 7 100
Robbery 1,467 61 895 37 47 2 4 0 2,413 100
Sexual assault 458 51 353 39 86 10 8 1 905 100
Other sexual offences6 249 72 86 25 8 2 4 1 347 100
Major assault7 1,752 61 995 35 100 3 17 1 2,864 100
Common assault 2,076 52 1,864 46 67 2 19 0 4,026 100
Uttering threats 1,080 53 888 44 46 2 11 1 2,025 100
Criminal harassment 71 41 93 54 7 4 1 1 172 100
Other violent offences 158 54 117 40 14 5 1 0 290 100
Property offences 8,535 50 8,490 49 126 1 89 1 17,240 100
Theft8 3,072 47 3,436 52 34 1 35 1 6,577 100
Break and enter 2,370 63 1,312 35 32 1 24 1 3,738 100
Fraud 269 52 245 47 3 1 4 1 521 100
Mischief 1,484 45 1,787 54 23 1 11 0 3,305 100
Possess stolen property 1,110 41 1,527 57 29 1 13 0 2,679 100
Other property crimes 230 55 183 44 5 1 2 0 420 100
Administration of justice offences 3,296 63 1,853 35 28 1 56 1 5,233 100
Fail to appear 110 40 161 59 0 0 1 0 272 100
Breach of probation 83 64 45 35 1 1 1 1 130 100
Unlawfully at large 300 90 32 10 0 0 3 1 335 100
Fail to comply with order 2,141 61 1,304 37 18 1 45 1 3,508 100
Other administration of justice offences 662 67 311 31 9 1 6 1 988 100
Other Criminal Code offences 1,383 57 980 40 36 1 29 1 2,428 100
Weapons offences 967 58 668 40 19 1 8 0 1,662 100
Prostitution 0 0 4 100 0 0 0 0 4 100
Disturb the peace 44 37 73 61 2 2 0 0 119 100
Residual Criminal Code 372 58 235 37 15 2 21 3 643 100
Total Criminal Code offences (excluding traffic) 20,559 54 16,632 44 565 1 240 1 37,996 100
See notes at the end of the table.

Statistics Canada—Catalogue no. 85-002-X
25
Juristat Article—Youth court statistics in Canada, 2011/2012
Table 4 Cases completed in youth court, by type of offence and decision, Canada, 2011/2012
(continued)
Type of offence1
Guilty2 Stayed/
withdrawn3 Acquitted Other4 Total cases5
# % # % # % # % # %
Criminal Code traffic offences 697 83 121 14 17 2 3 0 838 100
Impaired driving 399 88 45 10 8 2 1 0 453 100
Other Criminal Code traffic offences 298 77 76 20 9 2 2 1 385 100
Total Criminal Code offences (including traffic) 21,256 55 16,753 43 582 1 243 1 38,834 100
Other federal
statute offences 6,015 64 3,273 35 73 1 34 0 9,395 100
Drug possession 902 33 1,807 66 19 1 6 0 2,734 100
Other drug offences9 728 58 481 39 31 2 6 0 1,246 100
Youth Criminal Justice Act 4,341 82 944 18 23 0 18 0 5,326 100
Other federal statutes 44 49 41 46 0 0 4 4 89 100
Total offences 27,271 57 20,026 42 655 1 277 1 48,229 100
1. Cases that involve more than one charge are represented by the most serious offence. 2. Guilty findings include guilty of the offence, of an included offence, of an attempt of the offence, or of an attempt of an included offence. This category also includes cases where an absolute or conditional discharge has been imposed. 3. Includes stays, withdrawals, dismissals and discharges at preliminary inquiry as well as court referrals to alternative or extrajudicial measures and restorative justice programs. 4. Includes final decisions of found not criminally responsible and waived out of province/territory. This category also includes any order where a conviction was not recorded, the court's acceptance of a special plea, cases which raise Charter arguments and cases where the accused was found unfit to stand trial. 5. A case is one or more charges against an accused person or company that were processed by the courts at the same time and received a final disposition. 6. Includes, for example, sexual interference, invitation to sexual touching, child pornography, luring a child via a computer and sexual exploitation. 7. Includes, for example, assault with a weapon (level 2) and aggravated assault (level 3). 8. Includes, for example, theft over $5,000, theft $5,000 or under, as well as motor vehicle theft 9. Includes drug trafficking, exportation and importation, and production. Source: Statistics Canada, Canadian Centre for Justice Statistics, Integrated Criminal Court Survey.
Statistics Canada—Catalogue no. 85-002-X
26
Juristat Article—Youth court statistics in Canada, 2011/2012
Table 5 Guilty cases completed in youth court, by type of offence and selected sentence, Canada,
2011/2012
Type of offence1
Total number of guilty
cases
Custody Probation Community
service order
# %
Median length of sentence
(days)2 # %
Median length of sentence
(days)3 # %
Violent
offences 7,345 1,220 17 80 4,907 67 365 1,485 20
Homicide4 30 16 53 730 0 0 ... 0 0
Attempted murder 4 3 75 240 3 75 365 0 0
Robbery 1,467 474 32 120 1,085 74 365 358 24
Sexual assault 458 61 13 176 355 78 540 53 12
Other sexual
offences5 249 24 10 93 166 67 540 22 9
Major assault6 1,752 350 20 75 1,214 69 365 360 21
Common assault 2,076 112 5 23 1,194 58 365 403 19
Uttering threats 1,080 136 13 30 726 67 365 231 21
Criminal harassment 71 4 6 127 48 68 365 19 27
Other violent offences 158 40 25 120 116 73 365 39 25
Property offences 8,535 1,036 12 52 5,440 64 365 2,260 26
Theft7 3,072 294 10 30 1,736 57 365 825 27
Break and enter 2,370 386 16 90 1,754 74 365 612 26
Fraud 269 33 12 60 183 68 365 83 31
Mischief 1,484 132 9 22 916 62 365 377 25
Possess stolen property 1,110 161 15 30 697 63 365 296 27
Other property crimes 230 30 13 74 154 67 365 67 29
Administration of justice
offences 3,296 649 20 20 1,534 47 365 628 19
Fail to appear 110 7 6 7 41 37 315 27 25
Breach of probation 83 12 14 22 42 51 365 21 25
Unlawfully at large 300 202 67 20 63 21 365 38 13
Fail to comply with order 2,141 318 15 16 1,030 48 365 401 19
Other
administration
of justice offences 662 110 17 28 358 54 365 141 21
Other Criminal
Code offences 1,383 189 14 60 914 66 365 396 29
Weapons offences 967 154 16 46 623 64 365 200 21
Prostitution 0 0 0 ... 0 0 ... 0 ...
Disturb the peace 44 0 0 ... 23 52 360 9 20
See notes at the end of the table.

Statistics Canada—Catalogue no. 85-002-X
27
Juristat Article—Youth court statistics in Canada, 2011/2012
Table 5 Guilty cases completed in youth court, by type of offence and selected sentence, Canada,
2011/2012
Type of offence1
Total number
of guilty cases
Custody Probation Community
service order
# %
Median length of sentence
(days)2 # %
Median length of sentence
(days)3 # %
Residual Criminal
Code 372 35 9 74 268 72 360 187 50
Total Criminal Code (excluding
traffic) 20,559 3,094 15 50 12,795 62 365 4,769 23
Criminal Code traffic offences 697 50 7 80 298 43 365 143 21
Impaired driving 399 2 1 x 119 30 360 80 20
Other Criminal Code traffic offences 298 48 16 80 179 60 365 63 21
Total Criminal
Code (including traffic) 21,256 3,144 15 51 13,093 62 365 4,912 23
Other federal
statute offences 6,015 1,000 17 20 2,767 46 360 1,847 31
Drug possession 902 10 1 7 412 46 270 296 33
Other drug offences8 728 53 7 90 563 77 360 285 39
Youth Criminal
Justice Act 4,341 932 21 19 1,777 41 360 1,257 29
Other federal statutes 44 5 11 60 15 34 360 9 20
Total offences 27,271 4,144 15 39 15,860 58 365 6,759 25
... not applicable x suppressed to meet the confidentiality requirements of the Statistics Act 1. Cases that involve more than one charge are represented by the most serious offence. 2. Custodial sentence lengths exclude time spent in custody prior to sentencing and/or the amount of credit awarded for time spent in pre-sentence custody. Also excludes cases in which the length of the custody sentence was unknown. 3. Excludes cases in which the length of the probation sentence was unknown or greater than three years. 4. The number of custody sentences for homicide may be under-reported due to the unavailability of information on credit for time served in pre-sentence custody. 5. Includes, for example, sexual interference, invitation to sexual touching, child pornography, luring a child via a computer and sexual exploitation. 6. Includes, for example, assault with a weapon (level 2) and aggravated assault (level 3). 7. Includes, for example, theft over $5,000, theft $5,000 or under, as well as motor vehicle theft 8. Includes drug trafficking, exportation and importation, and production. Note: Cases may involve more than one type of sentence and/or other sentences not shown (e.g. deferred custody and supervision, fine, reprimand, intensive support and supervision, etc.), therefore, percentages do not total 100%. A case is one or more charges against an accused person or company that were processed by the courts at the same time and received a final decision. Source: Statistics Canada, Canadian Centre for Justice Statistics, Integrated Criminal Court Survey.


![RECEDIE]O)...ARTICLE I ARTICLE lI ARTICLE lil ARTICLE IV ARTICLE V ARTICLE VI ARTICLE VU ARTICLE VIII ARTICLE IX ... performed by student employees and such work now so performed may](https://img.dokumen.tips/doc/110x75/5fbe427613830030ce69a61a/recedieo-article-i-article-li-article-lil-article-iv-article-v-article-vi.jpg)