Embed Size (px)
Citation preview
,.
.. IS
]
\ i
ALASKA DEP ARn.NT OF FISH AND GAME JUNEAU, ALASKA
DALL SHEEP MOVEMERTS ArJD MIUERAL ~
- ___ ....
LICK USE sle'4 srA .....
ST Ail: OF ALASKA William A. Egan, Governor
DEPARTMLNT OF FISH AND GAME James -.J. Brooks, Commissioner
By Wayae E. IHeimer v--
Final B.epor-
• •c: Doc
DIVISION OF GAME Frank Jone~, Director Donald M~ight, Research Chief
Federal Aid in Wildlffe Restoration
QL 737 U533 H4
·Projects W-17-2, W-17-3, w-17-+, and W-17-5, Job 6.1R
(Printed Decemb•!r 1973)
ALASKA RESOURCES LIBRARY U.S. D~PT. OF INTERIOR
CONTENTS
Summary . . . . . . . . . . . . . . .. . . . . . . . . . . . . . ...Background. . .. . . . . . . . . . . . . . . . . . . . . . . . . . 1Objectives . . . . . . . . . . . . . .. . . . . . . . . . . . . .. 2Procedures. .. . ... . . . . . . . . . . . . . . . . . . . . . . . . . 2
Study Area and General Method. . . . . . . . . . . . . . . . . . 2Characterization and Definition of Sheep Populations . . . . . . 2
Determination of Daily Movement Pattern and Seasonal Home Range. 6Findings . . . . . . . . . . . . . . . . . . . . . . . . . . . . .. 10
Characterization and Definition of Sheep Populations . . . . .10
Determination of Daily Movement Pattern and Seasonal Home Range.32Management Recommendations. . . . . . . . . . . . . . . . . . . . .64
Acknowledgments ... . . . . . . . . . . . . . . . . . . . . . . . .65Literature Cited . . . . . .. .... . . .. .... . . .. .65Appendices . . . . . . . . . . . . . . . . . . . . . . . . . . . . .
BACKGROUND
Investigations of general group movements and seasonal distribution ofDall sheep (Ovis daZZi) have been conducted previously in various areas inAlaska. Distribution of sheep in June, July and early August 1962 in DryCreek, Alaska Range was plotted by Viereck (1963b). His data suggested an
up-valley and up-slope movement trend from June through early August.Palmer (1941) listed areas used by sheep at different seasons in Dry Creek,the Little Delta River and Wood River areas. Scott (1951) outlined seasonalranges and trails in the Indian Creek area of the Tonzona River region.Murie (1944) described sheep movements in Mount McKinley National Park,and Gross (1963) described sheep movements on Victoria and Schwatkamountains in the White Mountains. These studies indicated that sheep wereseasonally present in certain habitats, but failed to establish whetherthey were wandering animals which were attracted to a given area orresidents that were there each year.
In order to determine whether or not these are resident sheep itwas necessary to mark individuals so they could be identified yearafter year. Information defining discrete populations is necessarybefore meaningful management programs can be instituted. These needsformed the basis for this study.
Mineral lick utilization by sheep is thought to have primary and pro-found effects on sheep distribution and movements. Pitzman (1970 p.28)stated "Sheep distribution...is also influenced by the use of mineral licks....Mineral licks seem to be a characteristic of most Alaska sheep habitatsthat have been studied." Erickson (1970 p.1) agreed that, "One of thefactors which may influence sheep population distribution is the presenceof mineral licks." Palmer (1941) and Viereck (1963a and b) also madespecific references to this concept. Regardless, few specific dataare available to credibly support this seemingly reasonable idea.
1
M

To provide this information, observations of sheep mineral lick usewere made incidental to sheep marking operations in 1969, 1970, and 1971.These observations have been reported earlier by Erickson (1970) andSmith (Nichols and Smith 1971). Because of the secondary nature of theobservations and the disruptive effects of trapping it was deemednecessary to observe mineral lick use cycles without disruptive effectsafter animals had been marked. The results of all facets of recentinterior Alaska Dall shee1 investigations are presented in this report.
OBJECTIVES
To define and characterize the discrete sheep population or populationsinfluenced by the main mineral lick in Dry Creek.
To determine the daily movement patterns and seasonal home rangesof sheep captured and marked at the main Dry Creek mineral lick; and toextrapolate to seasonal home ranges of the untagged population or popu-lations.
To describe mineral lick use patterns in relation to age and sex ofsheep using the main mineral lick at Dry Creek, and to relate lick usepatterns to possible causative factors.
To gather information relating to the population dynamics of thepopulation or populations influenced by the main mineral lick in Dry Creek.
PROCEDURES
Study Area and General Method
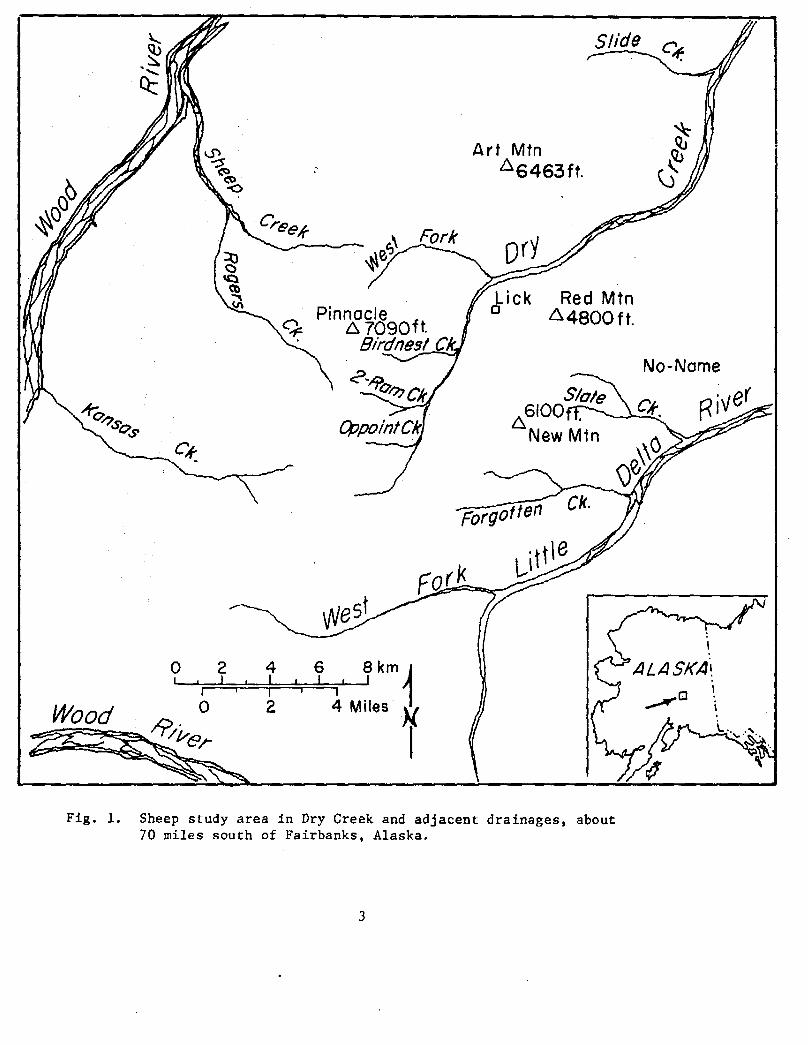
The sheep study area is centered on the Dry Creek drainage in theAlaska Range south of Fairbanks and includes adjacent drainages (Fig. 1).Animals for the movement and lick utilization portions of thestudy were captured and marked during June and July of 1968-1971 at themain mineral lick on Dry Creek using the drop net method described byErickson (1970). Other animals were collected throughout the year frompopulations in the Dry Creek area and the Granite Mountains south ofDelta Junction.
Characterization and Definition of Sheep Populations
Growth and Morphology of Dry Creek Sheep: After capture the livingsheep were weighed using a spring balance and the following measurementswere taken:
1. Contour length - measured from the tip of the nose to the endof the tail.
2. Shoulder height - measured from the hoof tip of the front foot tothe top of the back.
2
Art MtnA6463ft.
ick Red MtnA 4800 ft.
No-Nome
C4
0 2 4 6 8kmI - J I J I I -
0 2 4 Miles
z·
Fig. 1. Sheep study area in Dry Creek and adjacent drainages, about70 miles south of Fairbanks, Alaska.
3
Wood
3. Chest girth - measuredbehind the front legs.
4. Hind foot length - measthe tuber calcis with t
5. Other measurements (hortaken but were not usedtheir inherent variatio
Age was determined by the hwas not random; an effort was mapossible from all age classes ofsome younger animals and selectistructure of the population cann
Similar morphological dataprovided by Lyman Nichols, Alaskwere taken on Crescent Mountaincollections taking place in Febdescribed previously.
Thirty ewe sheep made up thsample consisted of 293 sheep of
Population Blood Genetics:Dall sheep at Dry Creek, Alaskaremoved from the clotted blood aAfter transport to Fairbanks theShaughnessy of the Institute ofexamined by acrylamide gel electVertical Gel Cell (EC 470). Fora gel buffer system similar to twas used. It consisted of 0.013solution consisted of 0.8 gm/l 1pH 7.5. Each slot was loaded wicent sucrose. Gels were run forcell, and then stained with amid
For the examination of lactsystem of Fine and Costello (1963 ml of serum diluted 1:1 with 2run for four hours with about 20incubated at 37 C in a mixture o(see Fine and Costello 1963) for
Blood samples from 22 Dallanalyzed. These samples were prDepartment of Fish and Game. Thcollected on Crescent Mountain,
4
_ _
1971. Nichols (Nichols and SmiThe serum samples had been stoiTransferrin mobilities were alsdomestic sheep supplied by Dr.Davis.
Population Size and Composwas determined by classifying afrequency of visitation by sheevisits by collared sheep by thethe lick. It was assumed thattative of the population. Thelick during the observation peicollared animal provided an estall classes using the lick. SEclassification of all sheep usicomposition percentages were cathe lick derived. During one Itaken of rams between yearlingdata revealed that rams in thiE(Heimer and Smith, unpublishedassumed that the number of indinumber of ewes of the same age.used to calculate the number ofThis number was added to the ni
Food Habits, General Condjyearlings were collected throuýlation characterization and paito Fairbanks for autopsy. Morysamples, organ weights, and incBlood samples were collected itquestionable worth because of 1parasite burden was assayed byabomasa, and intestinal tractshave been reported by Ericson a
Rumen samples were frozenthey were rapidly thawed and wamaterial retained on the sievescategories. The categories weifragments, Dryas, and other spsthe volume of each category wasvolume of identified material vvolumes, and the percentage of
Indices of body conditionmarrow fat (Neiland 1970) and tKidney fat index was determinediated fat, stripping the fat fr
II
alone. The weight of the kidney fat was then divided by the weight ofthe kidney alone to give an indication of fat present relative to kidneysize. It is assumed that kidney mass is rather constant.
Digestive function was evaluated for 16 animals taken in Novemberand April. Immediately following death the rumen was opened, its contentsmixed, and a sample placed in a polyethylene bottle for incubation. Thebottle was maintained at .n incubation temperature of about 37 C by usingan insulated water-bath. Samples of rumen liquor were removed from theincubator at half-hour intervals. Later, the concentration of volatilefatty acids was determined. It has been shown that the rate of volatilefatty acid production is an indicator of fermentation rates in the rumen(Gasaway and Coady 1973).
Determination of Daily Movement Pattern and Seasonal Home Range
Daily Movement Pattern: Daily movement patterns were observed byfollowing marked sheep as they left the mineral lick. Observers wereequipped with standard backpacking equipment and food for three days.They were to follow sheep at a distance and record feeding, nursing(if applicable), locations during the day at half-hourly intervals andany other incidental information obtainable without influencing themovement of the sheep selected.
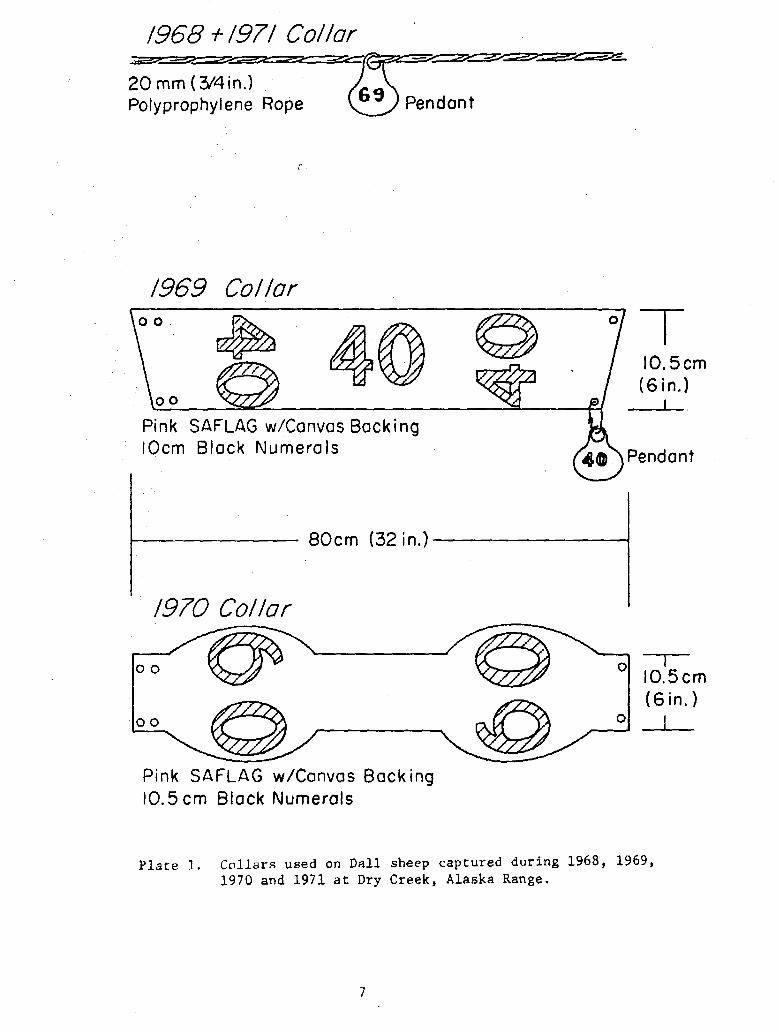
Seasonal Home Range: Dall sheep captured with a drop net (Erickson1970) at the main Dry Creek lick were marked with collars and ear tags.In 1969 and 1970 large, safety-orange, plastic collars with canvas back-ing and black numerals were used (see Plate I). In 1971 collars consistingof polypropylene rope strung through a numbered pendant and secured aroundthe sheep's necks using hog rings were used. Several similar collars wereapplied in 1968. Most animals were also marked with ear tags (Jumbo Rototagby Dalton Henley of England). Some metal ear tags were also used in 1968and 1969.
The large collars are visible at great distances; numbers on thependants are discernible at distances of up to 250 or 300 meters usinga 60X spotting scope in good light.
Sheep were identified on home ranges throughout the year, and loca-tions were plotted on topographical maps. Most observations were madeon foot surveys, but some aircraft surveillance was utilized. Success
of aerial survey techniques was limited to occasional sightings ofcollars which were used in 1969 and 1970. The smaller pendant collarsused in 1968 and 1971 were impossible to identify from aircraft.
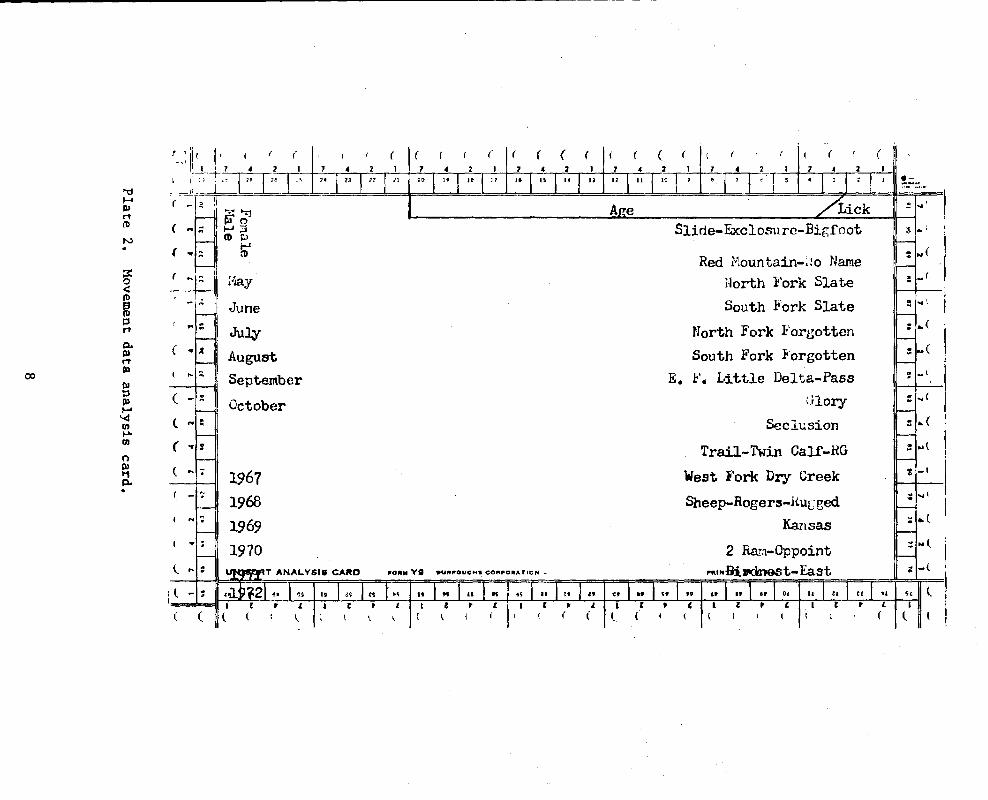
For purposes of analysis the individual sightings were recorded on"Unisort Analysis Cards" (Plate II). This data transformation allowedrapid selection of resightings by location, sex and season. Once re-sightings had been separated in this manner the locations of resightingson different seasonal ranges were plotted on 1:63,360 topographical mapsof the study area.
6
I
I
Pendant
/969 Collor
'T-10.5cm(6in.)
Pendant
80cm I
/970 Collar
---1-10.5cm(6 in.)
I_ _
Pink SAFLAG w/Canvas E10.5 cm Black Numerals
Plate 1. Collars used on Dal1970 and 1971 at Dr
7
1968 +197/ Collar
Are2 tFor.
t-'3H0?
May
June
July
August
September
October
rt0D
0
00
p.002
Dl0i
a,0'*p.
( -:i
(I
it
/LickSlide- Exclosu re-Bigfoot
Red Mountain-lo Name
North Fork Slate
South Fork Slate
North Fork Forgotten
South Fork Forgotten
E. F. Little Delta-Pass
.lory
Seclusion
Trail-Twin Galf-HG
West Fork Dry Creek
Sheep-Rogers-Rugged
Kansas
2 Ran-Oppoint.. IBitires t- East
01~121 · · ii ti .. s·_I I·1~4 -I~l{"- 1~_ [U·L n 1IYk i [<LV "~ Lrr 0Ijy)Z 11N *4rl
( t P £ j ( P g Sr t 9 P F ' . V ( L~ 1 1' i ( ' 1 ( <. I i l ! * (
I i 7 4 2 7 4 2 1 7 1 2 7 t , 1 7 4 2 1 2 IS 21 Ž 1 1 12 i\ S IS 1 1 ItI 1 11 12 f i I 1 T J
196719681969
1970U1fS9T ANALYSIS CARD
oo
FORM YV *URRouoGS COrAORAlTIO -
T~1
-1
.4
-{
r(
21
-r(
• , J · · -- -·-
I
I
travel fromes. Few ofassumed to besumption issummer ranges.ty of return)hols and
to 28 pairedr range).Ly representas defined asearly October.area carrying
y, March, Aprily were not con-as been found
fter resightings
ck utilizationsince 1969.from 0300 to
om June 3o organizedas theyuant to therk sheep andinuous 24-hour19 through
n, observerslick. In 1973h June 30.
Lassifiedso classifiedtions were alsovements andmarked sheeping the yearscticed becauseon was gathered.
ct the animalss and controleral and ionics and the half-
9

10
hour classifications were recorded by zone. This provided a use-index oflicking sites within each zone and allowed discrimination of intensity oflicking and comparison of intensity of use with mineral and ionic content.The use zones were as follows: Zone A was the upper end of the ravine whichcontains the lick, Zone B was the east side, Zone C the ravine floor, Zone Dthe west side and Zone E the mouth of the ravine.
Returns of the collared sheep to the lick allowed calculation offidelity constants (Geist 1971) of sheep in different age and sex classesfor the main mineral lick at Dry Creek. Lick use as a function of the timeof day was recorded, the "lick use cycle" was described, weather influenceswere observed and the average length of time spent in the lick was calculated.Data on the diurnal activity of sheep not involved with the lick were alsogathered.
FINDINGS
Characterization and Definition of Sheep Populations
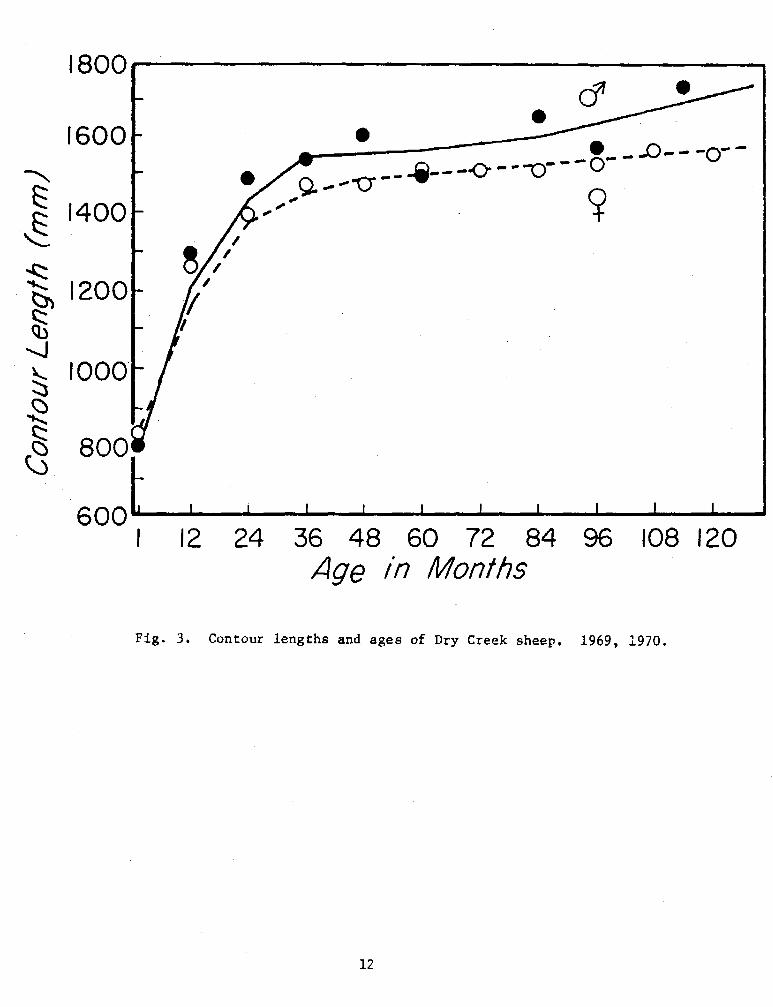
Growth and Morphology of Dry Creek Sheep: The morphological datagathered appear in Appendix I. Critical analysis was limited to thoseparameters which were considered either of special interest, e.g. weight,or parameters which were independent of seasonal variation. It appearsthat sheep continue to grow throughout life, but growth is minimal formost of the morphological characteristics after the age of three years.A notable exception is body weight. Body weight for the Dry Creek samplewas always taken at the end of winter; it appears to increase at a notice-able rate until the age of seven years. Further increases may occur afterthat time, but they are minimal. It appears likely that growth as reflectedby body weight may continue at a greater rate for ewes in later years thanfor rams. This is the only parameter of those investigated which conformsto this pattern.
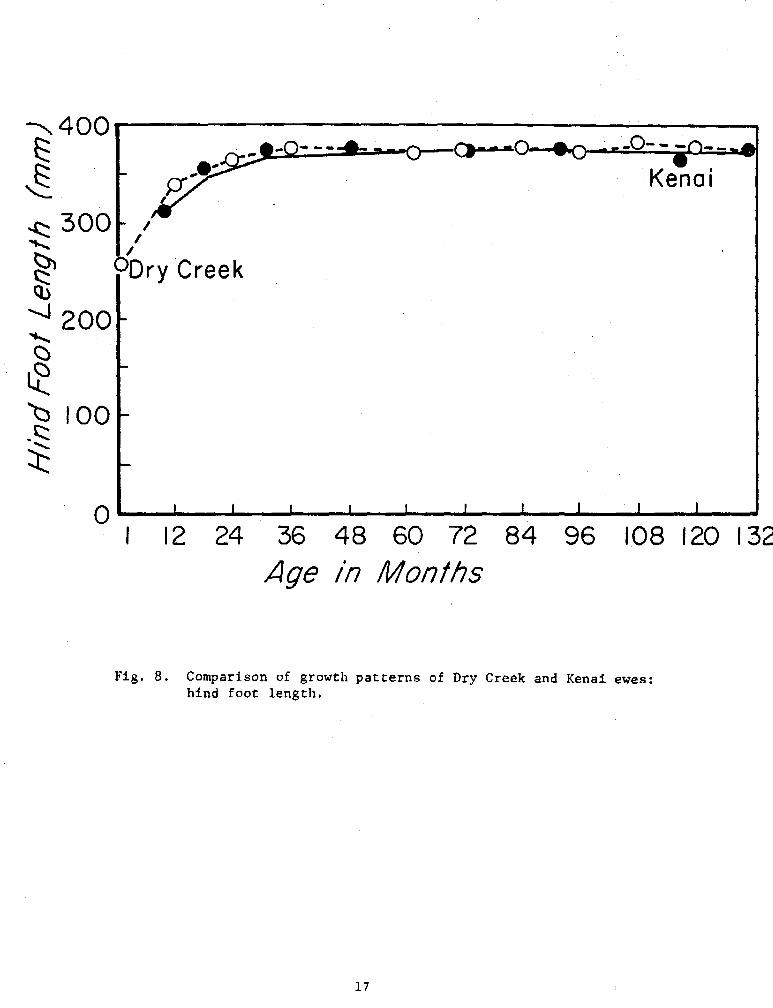
Figs. 2, 3, 4 and 5 show growth patterns of Dall sheep capturedat Dry Creek in the Alaska Range. Growth patterns for Dall sheep ewesfrom the Kenai Peninsula are compared with those of Dry Creek ewes inFigs. 6, 7, and 8. Growth patterns and ultimate sizes of ewes fromboth populations are very similar. Consequently, it appears that thereis little reason to separate the Ovis dalli ewes of the Kenai Peninsulafrom those of the Alaska Range on the basis of gross morphology.
Population Blood Genetics: No differences in serum transferrin orLDH mobility were detected among the 109 blood samples analyzed from theDry Creek sheep. Serum transferrlns from the 22 Kenai Peninsula sheepwere found to have the same mobility as those of the 109 Alaska Rangeanimals. These transferrins were compared with domestic sheep referencesera and found to have the same mobility as domestic sheep transferrin-D.No differences in LDH mobility patterns between the Kenai Peninsula andthe Alaska Range were discovered.

1 12 24 36 48 60 72 84 96 1Age in Months
Fig. 2. Body weights and ages of .Dry Creek sheep in early springof 1969 and 1970.
38 120+
11
I
*^
c
co
I 12 24 36 48 60 72 84 96 108 120Age in Months
Fig. 3. Contour lengths and ages of Dry Creek sheep. 1969, 1970.
12
Q)
K2:
%J WJl\/
I ^e I%^I'

I
1 12 24 36 48 60 72 84 96 108Age in Months
Fig. 4. Shoulder heights and ages of Dry Creek sheep, 1969 & 1970.
13
S120
1000
\ 800
& 600
•0Qb$ 400
200
0

SN
^
I 12 24 36 48 6(Age in ,
Fig. 5. Hind foot lengths and ages a
14
132

I ^ .1%I-
%cz
K
rI00-
K)
I 12 24 36 4Age
Fig. 6. Comparison of growthcontour length.
8
pa
15
I

1000lOO~-
800-
600-O
% 400
: 200
O-0-
I
' - -- - - -
/Dry Creek
I 12 24 36 48 60 72 84 96 108 120 132Age in Months
Fig. 7. Comparison of growth patterns of Dry Creek and Kenai ewes:shoulder height.
16
1 __
· 1 · · ·i I I I aI I
Age in /
Fig. 8. Comparison of growth pattihind foot length.
¾SI
cz:
~I
OO
Q)
00K
$
YUU
300
200
100
n
17
I 12 24 36 48
A A
\^
nsferrin and LDH mobility:enai Peninsula suggestsie two populations, .orancestral stock whichferences in bloodIce was somewhat surprisingconsidered to be a differ-of the Alaska Range,that if these animalsin structures would be' have been reported:ory, and 0. d. daZli. Our findings suggestthan any other discrete1i comparisons also support
'2, the population ofleep at the end of mineralusing the lick in 1972
Calculated No.
43 animals147 animals256 animals256 animals505 animals
1207 animals: includes no lambs
.th composition dataSof 1972. Smith (1973)It 3.3 percentLal survey indicated a:e of only 256 sheep maySthat Smith referred only
Lambs are added the per-further stated, "It should
g the hunting season occurreda aerial survey in Decemberduring the aerial survey."
Dm three percent to two percentof one percent of 1473)ry Creek and the West Forkarvest from these drainages in
18

19
C
1972 was 15 animals. This lends credibility to the population estimate ofabout 1500 animals in the study area.
Further support for a figure of this magnitude comes from populationestimation data gathered in the summer of 1973. Using the same techniquesas described for 1972 the population was estimated to be 1600 animals andcomposition was essentially the same as in 1972.
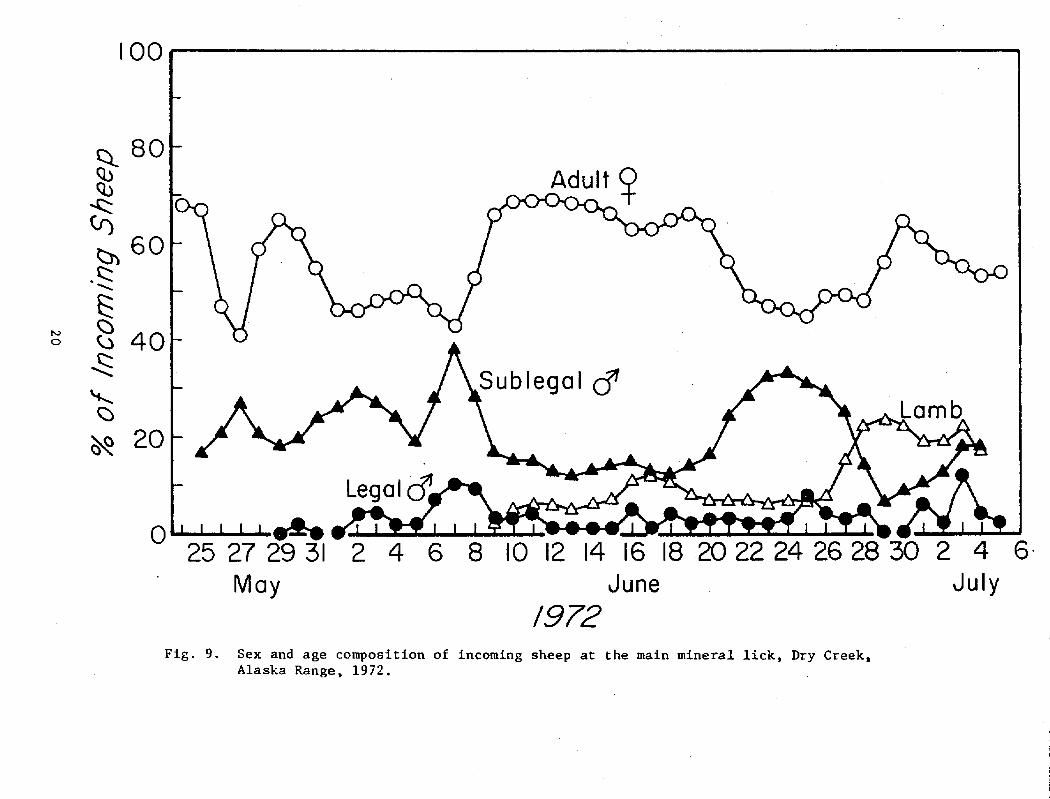
From June 28, 1972 to July 5, 1972 (a period of stable lamb percentageamong sheep using the lick, Fig. 9) 474 ewes and 167 lambs were seen. Thisgave an observed ratio of 35 lambs per hundred ewes. Nichols (Nichols andHeimer 1972) showed that all ewes above two years of age are capable ofproducing lambs. Consequently, the number of productive ewes was calculatedto be 761. Multiplication of 35 lambs/100 ewes times 7.61 hundred ewes gavea crop of 266 lambs. Addition of these 266 lambs to the 1207 animals calculatedabove provided a population estimate of 1473 sheep using the lick in 1972.
Because this population estimate is a product of extrapolation, theassumptions used in its derivation must be carefully reviewed. First,it is assumed that all animals entering the lick were seen. Observerswere stationed at the lick at all times throughout the period of observa-tion. The possibility that there were significantly more visits than5080 is remote because it is usually a simple task to count the numberof incoming sheep.
The second assumption is that all animals entering the lick did so at
the frequency demonstrated by collared sheep. It was found (see Lick UsePatterns) that ewes with lambs used the lick more than ewes without lambs.
If the collared sheep contained a disproportionately low number of lactat-ing ewes the average number of visits per sheep might be too low and theresultant estimate of population size too high. The observed lamb:ewe
ratio for all sheep was 35 lambs/100 ewes. The known lamb:ewe ratio among
collared sheep was 27/100. It should be noted here that a ewe was considered
to be lactating only if seen to nurse a lamb at the lick. Also, it was
observed that lambs did not always accompany ewes known to be lactating.
This strict definition may easily have led to the artificially low
estimated lamb:ewe ratio among collared sheep, which apparently occurred.
Ewes #58, G-2, and #194 had licking patterns which are characteristic of
lactating females (Table 5 presented later), but were never seen to nurse
a lamb. If they are considered on this basis to be lactating the ratio
of lambs to ewes among the collared sheep increases from 27:100 to 35:100.
Hence, it appears that there is little chance for error in this regard.
Furthermore, there were 29 rams with an average of four visits per animaland 27 ewes having lick use patterns not characteristic of lactation with
an average of four visits per animal. When the number of possible lactating
ewes which were not seen is averaged with all collared animals, the average
remains unchanged at four visits per animal.
The third assumption was that sheep did not lose collars between
visits. Collared animals were also marked with ear tags. Only onecollared animal was seen which was identified later by ear tag only.
Q)
0o a
0 ..
s^.
June July
Fig. 9. Sex and age composition of incoming sheep at the main mineral lick, Dry Creek,Alaska Range, 1972.
100
80
60
40
20
020 22 24 26 28 30
May
N
j
throughout the course ofboth collars and ear tags
ly apparent ones whichsize. Consequently, it
enced by the lick, and
nimals using the lick ashic areas during the
r, that the defined studyibution for sheep marked
study area as a wholeon Dry Creek and may in
ulated number of sheepthe aerial count by
e in a PA-18-150 Supercubthe area at that time.
g the same techniques.st of about 1600 animals.
nal Status: Analyses ofled in the sheep harvest
lamb are shown in Tablearent change in the foodnts of ewes taken from
grasses and sedges.practical because theventional taxonomic keys.
willow (Salix sp.) leaves,
ence of Dryas leaves iny none in the winterhe volume of willow, andSummer rumen samples weretly higher digestibilitysted and not identifiable.
reement with those of Muried animals. His data showedgrasses, sedges, willow
nd sedges, 10 percentted that there wasThis is also suggested byd the reliability of summer
21

Table 1. Food habits of Alaska Range sheep, 1972 and 1973.
PercentUnidentified Percent Percent
Accession Age Date Grasses Willow Percent VacciniumNumber (yrs) Sex Collected and Sedges Parts (green) Other Plant Species Location Comments
Nov. 17, 72
May 5, 72
Mar. 20, 72
Nov. 17, 72
May 5, 72
May 5, 72
Nov. 18, 72
Nov. 19, 72
May 4, 72
Nov. 19, 72
Apr. 5, 73
Apr. 5, 73
Apr. 5, 73
Apr. 5, 73
Apr. 5, 73
96
88
97
97
94
95
94
99
94
99
84
81
93
52
99
1
12
1
1
5
5
1
T
6
1
T-
1
T
T
3868
3559
3578
Fld-2
3579
3580
3870
Fld-5
3581
Fld-6
3888
3889
3890
3891
3892
3
4
4
6
7
7
5
5
1
0.5
10
10
10
10
10
3
T
-
1 1% Ledwn, Saxifrage, moss
- Trace of Saxifrage
- 1% Lichen
1 1% Lichen
T
1
T
T
3% Ledum
Trace of Moss
- 7% Lichen, moss
5 23% Ledwmn Lichen, fungus
.5 0.5% Lichen
Exclosure *
Slate *
Slide*
Exclosure*
Slide*
Exclosure*
Exclosure*
Icing*
Slide*
Icing*
Granite Mtns.
Granite Mtns.
Granite Mtns.
Granite Mtns.
Granite Mtns.
T
17
16
20
Lactating
Pregnant
0I
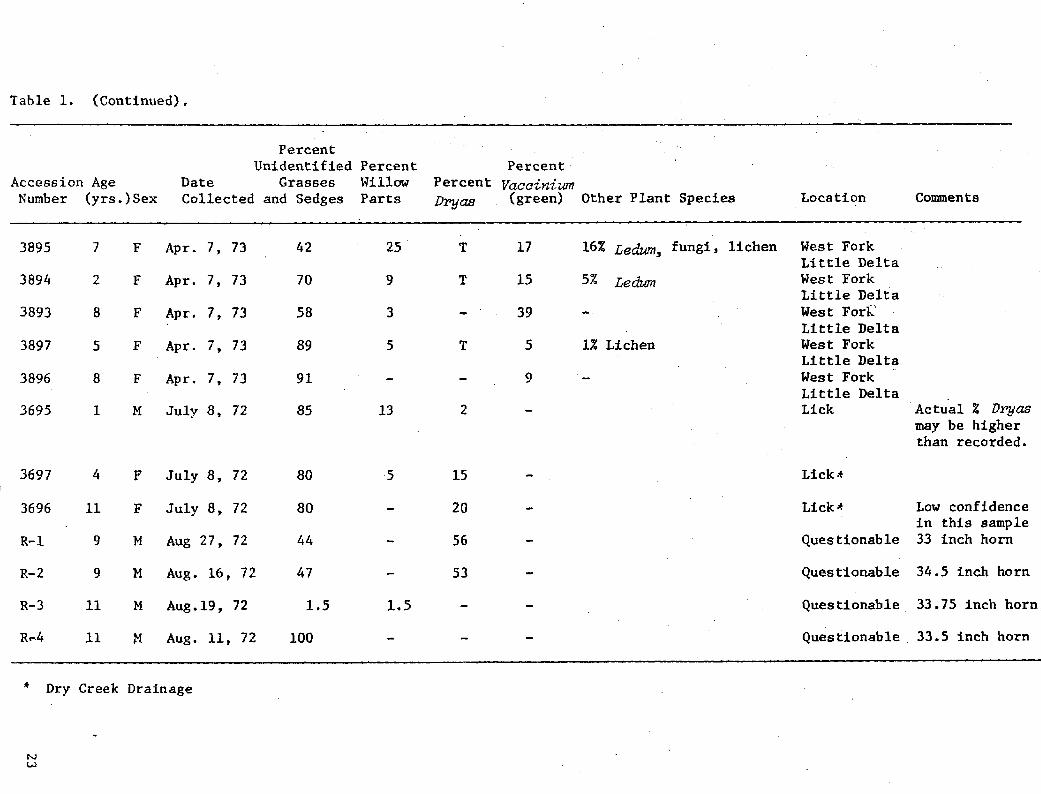
Table 1. (Continued).
PercentUnidentified Percent Percent
Accession Age Date Grasses Willow Percent VacciniumNumber (yrs.)Sex Collected and Sedges Parts Dryas (green) Other Plant Species Location Comments
16% Ledum, fungi, lichen
5% Ledum
1% Lichen
West ForkLittle DeltaWest ForkLittle DeltaWest ForkLittle DeltaWest ForkLittle DeltaWest ForkLittle DeltaLick Actual % Dryas
may be higherthan recorded.
July 8, 72
July 8, 72
Aug 27, 72
Aug. 16, 72
Aug.19, 72
Aug. 11, 72
80
80
44
47
1.5
100
5 Lick*
Lick*
15
20
56
53
Questionable
Questionable
Questionable
Questionable
1.5
Low confidencein this sample33 inch horn
34.5 inch horn
33.75 inch horn
33.5 inch horn
* Dry Creek Drainage
3895
3894
3893
3897
3896
3695
7
2
8
5
8
1
F
F
F
F
F
M
Apr.
Apr.
Apr.
Apr.
Apr.
July
7,
7,
7,
7,
7,
8,
73
73
73
73
73
72
42
70
58
89
91
85
25
9
3
5
13
17
15
39
5
9
-
T
T
T
2
3697
3696
R-1
R-2
R-3
R-4
4
11
9
9
11
11
F
F
M
M
M
M
--
Our data appear to be somewhat at odds with those presented by Viereck(1963a). He stated that sheep in the Tonzona drainage relied on bunch-grassmeadows and Dryas mat communities for the bulk of winter grazing, and thatduring winter months Dryas leaves remain on the plant and provide largequantities of plant material for sheep. However, in a subsequent publica-tion, Viereck (1963b) observed that Dry Creek sheep did not seem to feedextensively on Dryas leaves during the winter. This observation is con-sistent with the observations of Murie (1944) and our present data. Based onthe further observations of Viereck (1963b) it appears likely that thespecies most likely to be important in the grass-sedge component are asmall sedge, Kobresia myosuroides, and the grass Festuca altaica.
Analysis of rumen contents taken from four rams killed by huntersduring the month of August revealed a clear dichotomy. Two animals hadfed almost exclusively on grasses and sedges; the other two had valuesfor Dryas of greater than 50 percent.
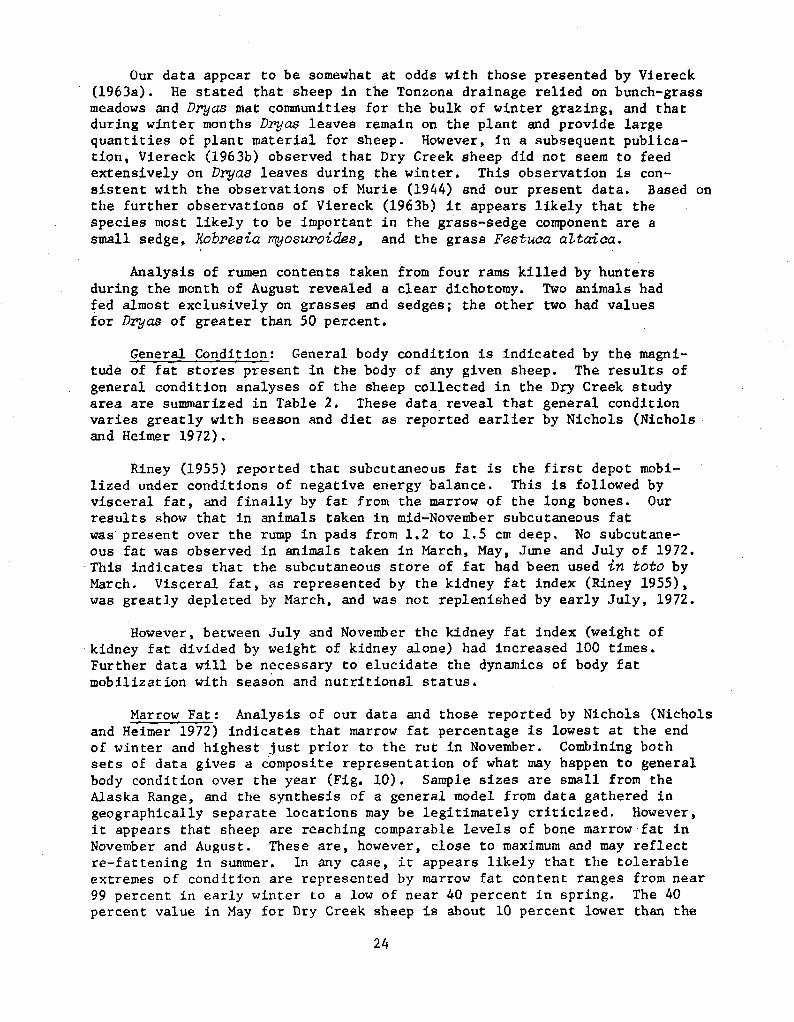
General Condition: General body condition is indicated by the magni-tude of fat stores present in the body of any given sheep. The results ofgeneral condition analyses of the sheep collected in the Dry Creek studyarea are summarized in Table 2. These data reveal that general conditionvaries greatly with season and diet as reported earlier by Nichols (Nicholsand Heimer 1972).
Riney (1955) reported that subcutaneous fat is the first depot mobi-lized under conditions of negative energy balance. This is followed byvisceral fat, and finally by fat from the marrow of the long bones. Ourresults show that in animals taken in mid-November subcutaneous fatwas present over the rump in pads from 1.2 to 1.5 cm deep. No subcutane-ous fat was observed in animals taken in March, May, June and July of 1972.This indicates that the subcutaneous store of fat had been used in toto byMarch. Visceral fat, as represented by the kidney fat index (Riney 1955),was greatly depleted by March, and was not replenished by early July, 1972.
However, between July and November the kidney fat index (weight ofkidney fat divided by weight of kidney alone) had increased 100 times.Further data will be necessary to elucidate the dynamics of body fatmobilization with season and nutritional status.
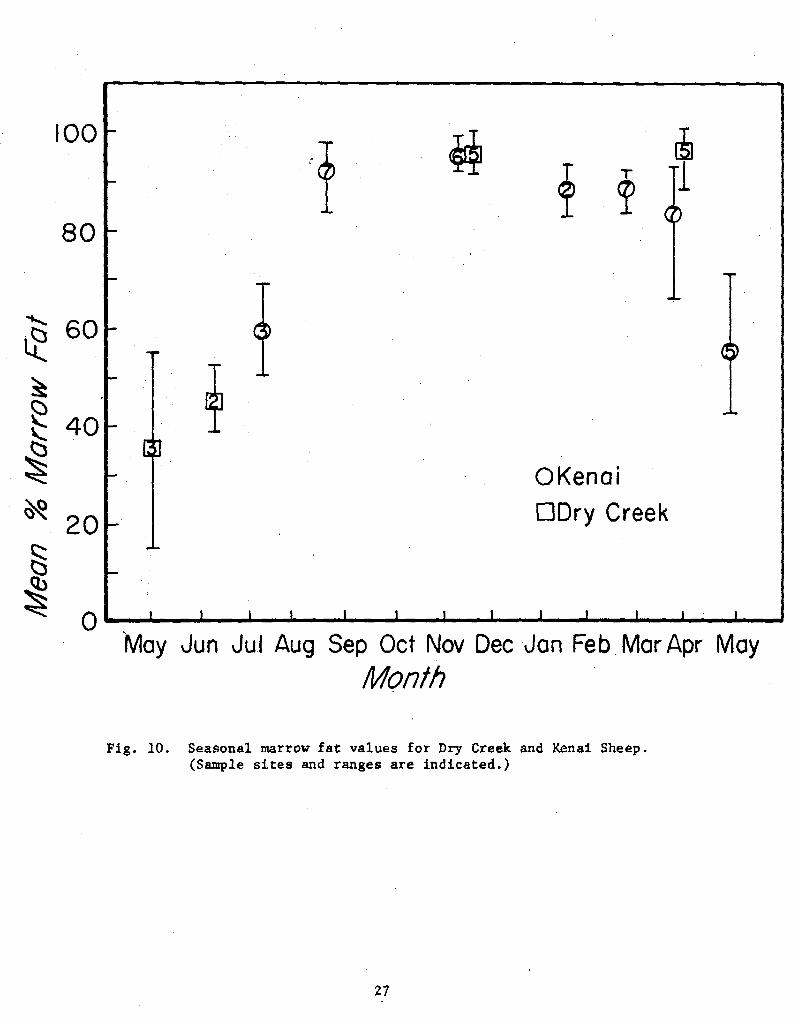
Marrow Fat: Analysis of our data and those reported by Nichols (Nicholsand Heimer 1972) indicates that marrow fat percentage is lowest at the endof winter and highest just prior to the rut in November. Combining bothsets of data gives a composite representation of what may happen to generalbody condition over the year (Fig. 10). Sample sizes are small from theAlaska Range, and the synthesis of a general model from data gathered ingeographically separate locations may be legitimately criticized. However,it appears that sheep are reaching comparable levels of bone marrow fat inNovember and August. These are, however, close to maximum and may reflectre-fattening in summer. In any case, it appears likely that the tolerableextremes of condition are represented by marrow fat content ranges from near99 percent in early winter to a low of near 40 percent in spring. The 40percent value in May for Dry Creek sheep is about 10 percent lower than the
24
I

Table 2. Body condition parameters of Alaska Range sheep.
Kidney Depth of MarrowAccession Date Body Fat Hip Fat Omental Fat
Number Age Sex Collected wt. kg Index Pad cm. Fat Percent Comments Location
Mar 20, 72
May 4, 72
May 5, 72
May 5, 72
May 5, 72
June 5, 72
June 5, 72
3559
3581
3578
3579
3580
3623
3624
3695
3696
3697
3868
3870
Pld-2
3
1
4
7
7
1
13
1
11
4
3
5
6
6
5
39.7
28.4
36.8
41.8
49.5
30.2
47.7
25.0
48.6
36.3
48.6
59.9
52.2
54.5
51.3
0.23
9.06
0.46
0.23
0.16
0.11
0.31
0.25
10.89
0.0
0.0
0.0
0.0
0.0
0.0
0.0
0.0
1.2
1.5
nil
nil
nil
nil
nil
nil
Trace
Heavy
Heavy
46
55
47
15
46
37
52
63
68
50
96
96
92
96
97
Lactating
Pregnant(fetus 2.7 kg)
Pregnant (fetus3.2 kg, kidney fatindex = 0.49)
Lactating
Lactating
July 8,
July 8,
July 8,
Nov 17,
Nov 18,
Nov 18,
Nov 19,
Nov 19,
Fld-4
Fld-5
72
72
72
72
72
72
72
72
Dry
Dry
Dry
Dry
Dry
Dry
Dry
Dry
Dry
Dry
Dry
Dry
Dry
Dry
Dry
Creek
Creek
Creek
Creek
Creek
Creek
Creek
Creek
Creek
Creek
Creek
Creek
Creek
Creek
Creek
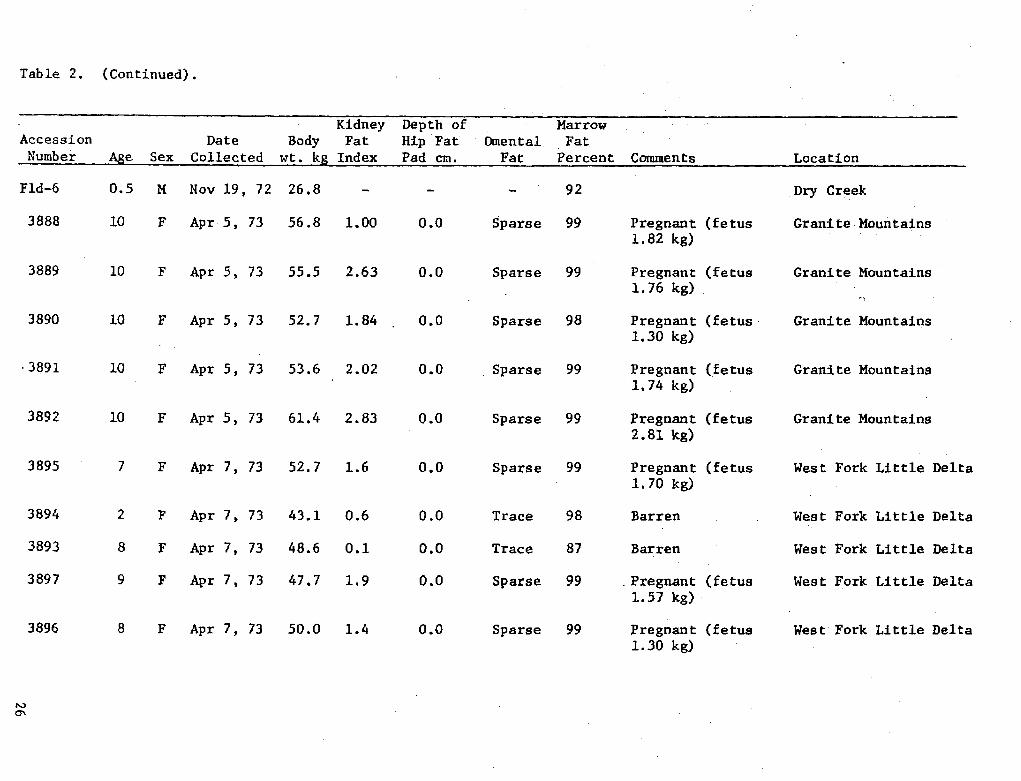
Table 2. (Continued).
Kidney Depth of MarrowAccession Date Body Fat Hip Fat Omental Fat
Number Age Sex Collected wt. kg Index Pad cm. Fat Percent Comments Location
Fld-6 0.5 M Nov 19, 72 26.8 - - - 92 Dry Creek
3888 10 F Apr 5, 73 56.8 1.00 0.0 Sparse 99 Pregnant (fetus Granite Mountains1.82 kg)
3889 10 F Apr 5, 73 55.5 2.63 0.0 Sparse 99 Pregnant (fetus Granite Mountains1.76 kg)
3890 10 F Apr 5, 73 52.7 1.84 0.0 Sparse 98 Pregnant (fetus Granite Mountains1.30 kg)
3891 10 F Apr 5, 73 53.6 2.02 0.0 Sparse 99 Pregnant (fetus Granite Mountains1.74 kg)
3892 10 F Apr 5, 73 61.4 2.83 0.0 Sparse 99 Pregnant (fetus Granite Mountains2.81 kg)
3895 7 F Apr 7, 73 52.7 1.6 0.0 Sparse 99 Pregnant (fetus West Fork Little Delta1.70 kg)
3894 2 F Apr 7, 73 43.1 0.6 0.0 Trace 98 Barren West Fork Little Delta
3893 8 F Apr 7, 73 48.6 0.1 0.0 Trace 87 Barren West Fork Little Delta
3897 9 F Apr 7, 73 47.7 1.9 0.0 Sparse 99 Pregnant (fetus West Fork Little Delta1.57 kg)
3896 8 F Apr 7, 73 50.0 1.4 0.0 Sparse 99 Pregnant (fetus West Fork Little Delta1.30 kg)
s3
-d
SI 'T
OKenaiODry Creek
II I I III I I I I • I
May Jun Jul Aug Sep Oct NovMonth
Dec Jan Feb MarApr May
Fig. 10. Seasonal marrow fat values for Dry Creek and Kenai Sheep.(Sample sites and ranges are indicated.)
27
100
80
K
tzz
c
60
40
20
nv
values reported for sheep on the Kenai Peninsula. This may be attributableto differences in winter severity or range quality, population differences,or insufficient sample size (n=3 for Dry Creek sheep).
Weight Loss in Winter: Mature ewes, five and six years old, collectedin mid-November, 1972 had an average body weight of 54.5 kg in Dry Creek(n-4). The average early June weight of five- and six-year-old ewescaptured at the lick was 46.5 kg (n=18). This represents a winter weightloss of 15 percent. Ewe sheep taken on the Kenai Peninsula had winterweights in November of 57.8 kg (n=6) and weights in spring of 50.4 kg (n=10),representing a weight loss of 13 percent. Ewes on the Kenai were about 4 kgheavier (7-8%), but the percentage of weight lost from mid-November to theend of winter was approximately the same as in Dry Creek. This suggestssome similarity between the energetic requirements of sheep in both locations.The limited data available are only suggestive and firm conclusionscannot be made at this time,
One male lamb of the year was taken in November, 1972, at the age of sixmonths. His body weight was 26.8 kg. The average weight of lambs consideredto be one month old in early June at the Dry Creek mineral lick was 8.4 kg.This means that in the five intervening months the collected lamb had increasedits body weight about three times. However, this animal was exceptionallysmall. The average body weight measured at the lick for animals of hisage class at the end of winter was 29.3 kg or 9 percent greater than thisindividual at his peak yearly weight. Nichols (Nichols and Heimer 1972)presented data which indicate that a male lamb will lose 25 percent of hismid-November weight by spring. This means the lamb in question might havehad a body weight of 20.1 kg had he survived the winter. If so, the animalwould have been smaller than any yearling ram ever weighed in spring (thesmallest male yearling ever weighed (n-20) was 22.2 kg). Consequently,he would have been only 2/3 as heavy as the average individual of hisage class. It should be noted that when collected this animal had bonemarrow fat of 92 percent and copious amounts of visceral fat.
It may be that the small size of this individual was exceptional,but the possibility also exists that his reduced size was a result of anexceptionally hard winter in 1971-72. The lamb:ewe ratio of this animal'syear class was low, and the winter of 1971-72 was one of heavier thannormal snowfall. Consequently, it might be expected that all offspringconceived and carried through this strenuous winter might be physicallystunted. Robinson et al. (1961) reported that in domestic sheep, animalsmaintained on a bare subsistence diet have smaller lambs, and that theseanimals are stunted throughout life.
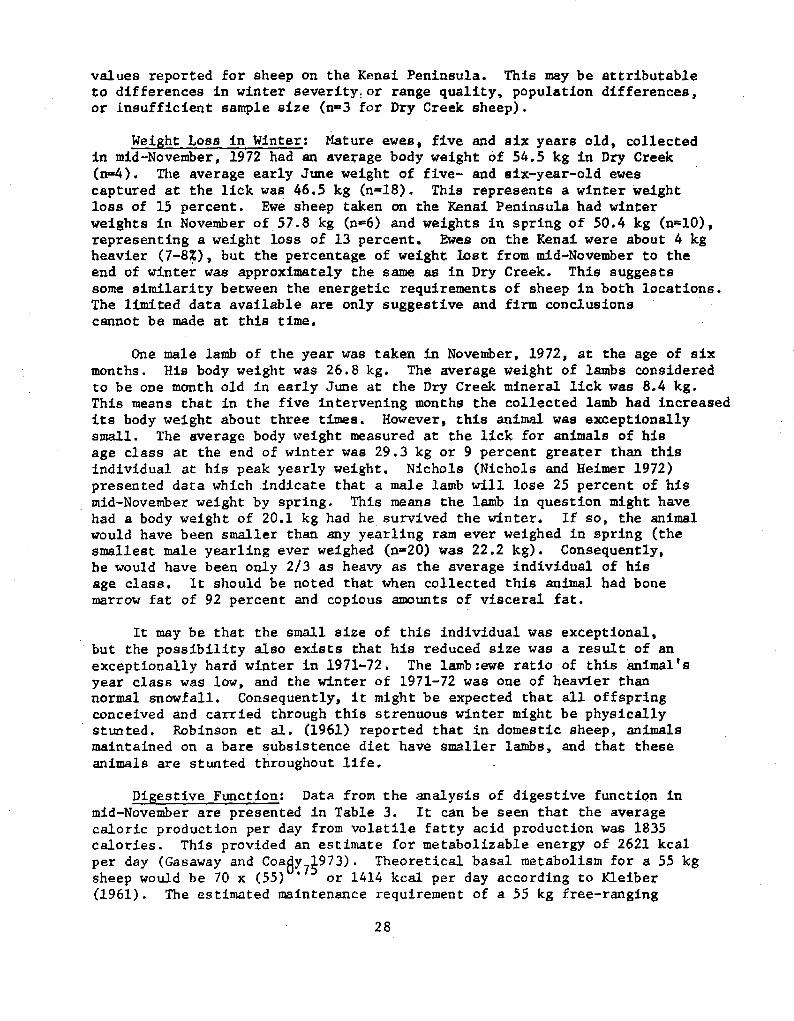
Digestive Function: Data from the analysis of digestive function inmid-November are presented in Table 3. It can be seen that the averagecaloric production per day from volatile fatty acid production was 1835calories. This provided an estimate for metabolizable energy of 2621 kcalper day (Gasaway and CoaVy7 973). Theoretical basal metabolism for a 55 kgsheep would be 70 x (55) or 1414 kcal per day according to Kleiber(1961). The estimated maintenance requirement of a 55 kg free-ranging
28
L - --
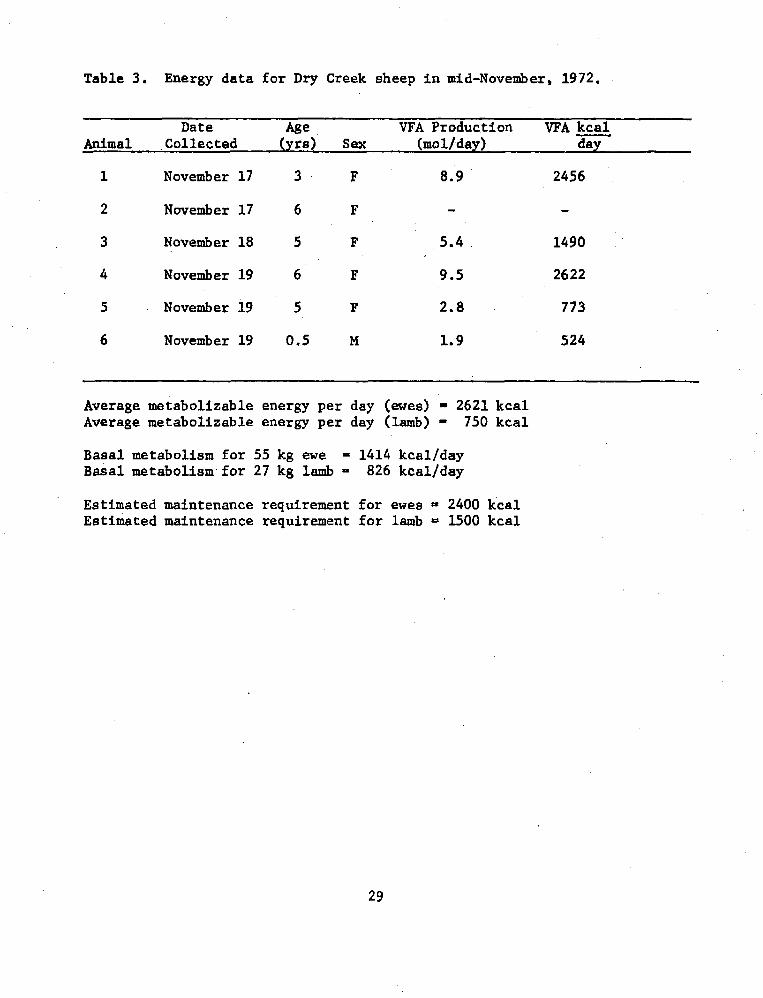
Table 3. Energy data for Dry Creek sheep in mid-November, 1972.
Date Age VFA Production VFA kcalAnimal Collected (yrs) Sex (mol/day) day
1 November 17 3 F 8.9 2456
2 November 17 6 F -
3 November 18 5 F 5.4 1490
4 November 19 6 F 9.5 2622
5 November 19 5 F 2.8 773
6 November 19 0.5 M 1.9 524
Average metabolizable energy per day (ewes) - 2621 kcalAverage metabolizable energy per day (lamb) - 750 kcal
Basal metabolism for 55 kg ewe - 1414 kcal/dayBasal metabolism for 27 kg lamb - 826 kcal/day
Estimated maintenance requirement for ewes = 2400 kcalEstimated maintenance requirement for lamb = 1500 kcal
29

sheep is about 2400 kcal per day (1414 kcal/day x 1.7). This calculation,though admittedly somewhat arbitrary, shows that the calories obtainedfrom the diet are about equal to maintenance requirements in adult ewesin mid-November.
Similar calculations for the lamb revealed that this animal had adietary input of about 750 kcal per day and a requirement of about 1500kcal per day. Consequently, this lamb was in negative energy balancewhile the ewes were just meeting their energetic needs with rumen fermenta-tion products. The ewe accompanying this lamb was lactating, and this mayhave been providing energy to the lamb which we were not able to assess.The probable negative energy balance indicated in this lamb is in agree-ment with Nichols' (Nichols and Heimer 1972) data which suggest thatyoung animals lose proportionately more of their body weight than doadults over the course of winter. Furthermore, it correlates with thesmall body size of the lamb and leads to doubts about its viability inother than a very mild winter.
The observation that ewes were meeting caloric demands by dietaryinput indicates that they may represent the extreme of seasonal fattening.This suggests that hip fat pads of 1.5 cm in depth and kidney fat indicesof near 10 are the upper limits of fattening.
Ewes collected from the Dry Creek study area in early April 1973,showed lower fermentation rates than the animals collected in mid-November1972. This is presumably due to lower quality forage which had lostavailable nutrients over the winter. Animals taken at this time had nofat deposits over the hips and little visceral fat (mean kidney fat indexfor the five animals was 1.12). Marrow fat, however, was about 96 percent.These indicators suggest that even though the ewes of the study area hadbeen in negative energy balance for five months there were still somebody fat stores present. The indicators also suggest that the winter of1972-73 was milder than the winter of 1971-72.
Data from animals collected at winter's end in 1972 (Table 2) showthat kidney fat indices and marrow fat were both lower than those foundin animals after the milder winter of 1973. It seems likely that rangequality may also influence the condition of ewes at the end of winter.
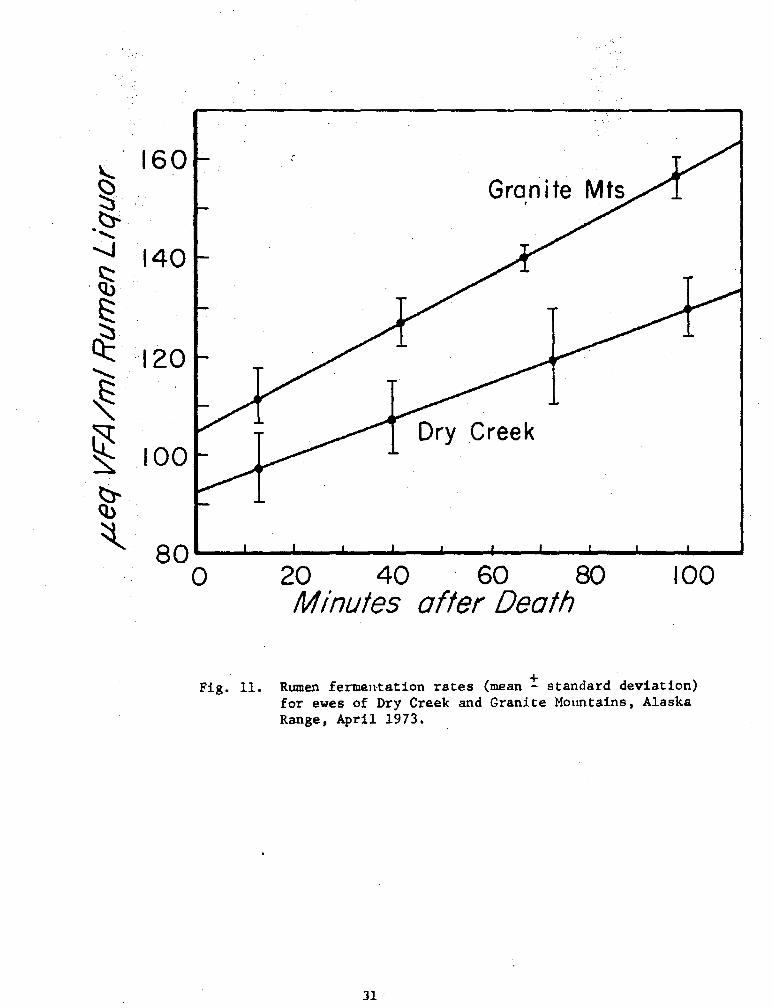
Five ewes collected from the Granite Mountains, an area about 70 milesto the east of the Dry Creek study area, were in better condition than ewestaken at the same time from Dry Creek. Table 2 contains data which indicatethat ewes from the Granite Mountains had greater body weight, greater remain-ing stores of visceral fat, and those carrying fetuses had in utero lambswhich were about 25 percent heavier. Range quality is implicated in thesedifferences because the fermentation rates for ewes of the Granite Mountainsare about 30 percent greater than those found for ewes in Dry Creek (Fig. 11).Differences in weather severity may also influence end-of-winter condition,and it is not known whether winter severity was the same on both ranges.
Gross chemical analysis of the rumen contents did not reveal differencesin range quality.
30
I
0 20 40 60 80 10Minutes after Death
+Fig. 11. Rumen fermentation rates (mean - standard deviation)
for ewes of Dry Creek and Granite Mountains, AlaskaRange, April 1973.
31
0
16 0
" 140
120
100
Sn
Daily Movement Pattern: Data gathered on daily movement patterns werefew and of questionable worth. Inability of observers to keep track ofindividual animals coupled with the influence of the observers' presenceon the movements of sheep combined to nullify this effort. In retrospectit seemed that there was little of management interest in the daily movementsof Dall sheep in Dry Creek. For this reason, efforts to determine dailymovement patterns were terminated in 1972.
Seasonal Home Range - Ewes: Analysis of collared sheep resighting datacompiled since 1968 has revealed that there are two wintering populationsof ewes on the west side of Dry Creek and at least one on the east side(Fig. 12).
Ewes wintering on the west side of Dry Creek are divided into two popu-lations by Pinnacle Ridge and the West Fork of Dry Creek. Population #1winters on Slide Ridge, Exclosure Creek, Bigfoot Creek and may move as faras upper Sheep Creek to the west. Its range is bounded on the south bythe West Fork of Dry Creek and on the north by the precipitous terrainwhich drops away from the main chain of the Alaska Range proper. Population#2 winters south of Pinnacle Ridge as far up Dry Creek as Two Ram Creek, andas far west as upper Rogers Creek. Dry Creek is the eastern limit of itswinter range.
Insufficient data preclude definitive delineation of the seasonalranges of population #1. However, summer resightings indicate that popu-lation #1 (those ewes wintering on the Slide-Exclosure-Bigfoot area) movesto summer ranges on the south side of Pinnacle Ridge or perhaps into upperSheep Creek. It may occupy some of the same drainages used by population#2 in winter. However, during summer vegetation is available at lowerelevations, and this may support most summer foraging. Total distancefrom the southern extent of winter range to summer range is about nineaerial miles (14.4 km).
The ewes of population #2 move further up Dry Creek (to the south) inwinter and occupy the area bounded on the north by Two Ram Creek, and eastby Dry Creek and the south by the extreme upper reaches of Dry Creek. Theseanimals occupy upper Dry Creek, upper Kansas Creek, and some areas ofupper Rogers Creek. Populations #1 and #2 may overlap on the summerranges but because they are clearly divided during the breeding seasonthey are considered to be separate.
Seasonal range relationships of ewes which winter on the east side ofDry Creek are unclear because there is overlap between animals which winteron the ridge system from Red Mountain to No Name Creek, south to thenorthern limit of Slate Creek, and the animals which winter on the ridgesystems between the South Fork of Slate Creek and the South Fork of For-gotten Creek. Some individuals have been seen wintering in both areasduring different years, and the summer ranges seem to be vaguely definedas well. It is probable, however, that animals are confined to the areabetween Dry Creek and the West Fork of the Little Delta River. The northernlimit of winter range is the edge of the Alaska Range proper. The westbranch of the West Fork of the Little Delta River proper forms the southernlimit of these seasonal ranges (Fig. 12).
32
Determination of Daily Movement Pattern and Seasonal Home Range
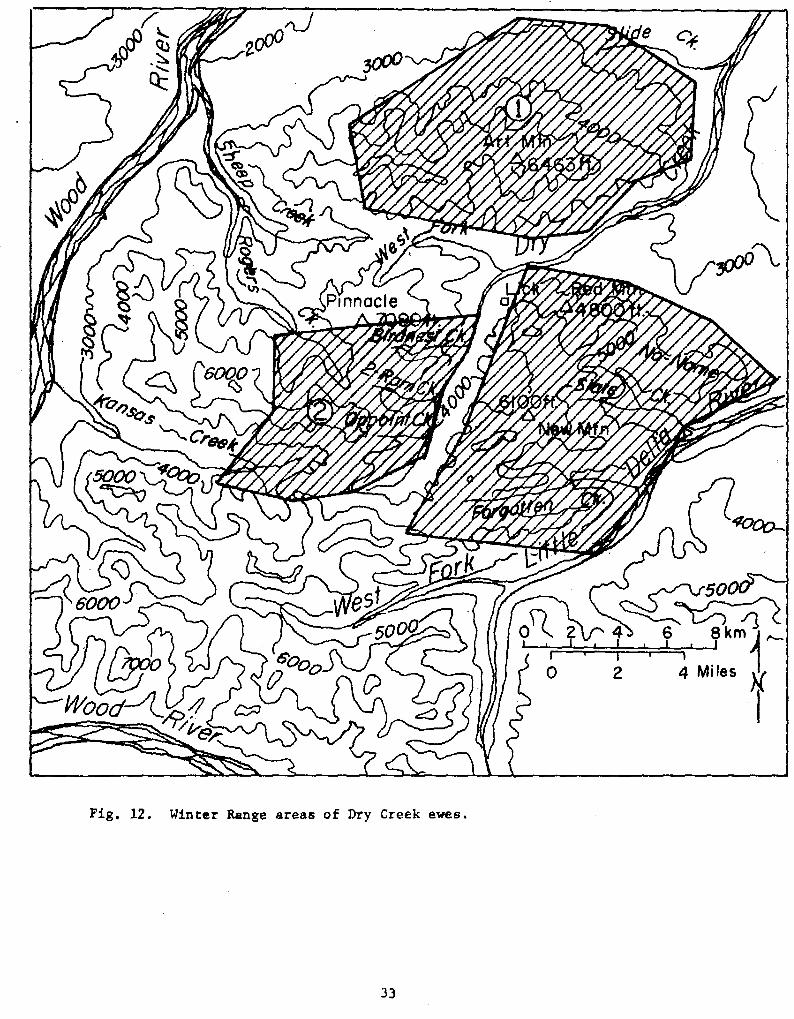
iter Range areas of Dry Creek ewes.
33
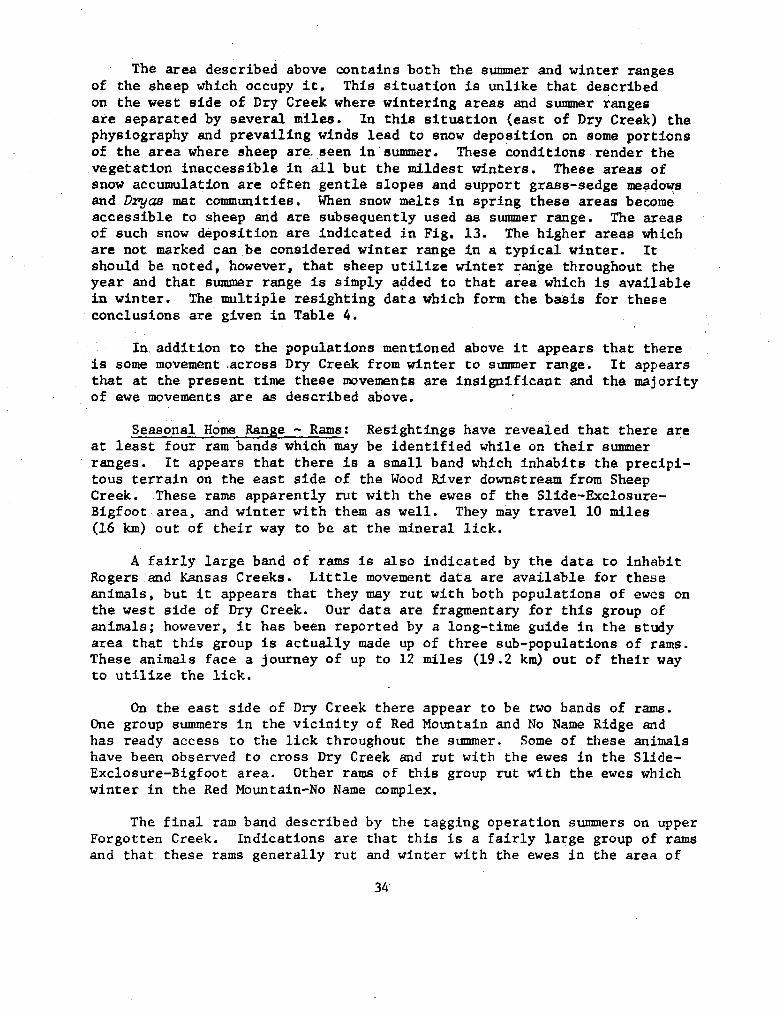
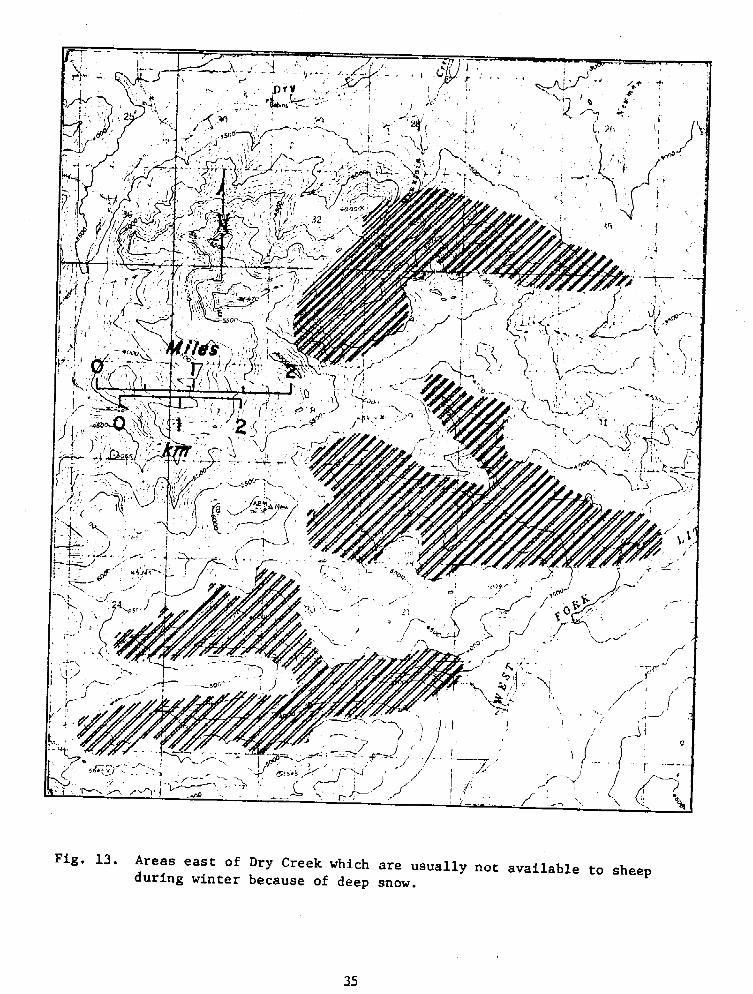
The area described above contains both the summer and winter rangesof the sheep which occupy it. This situation is unlike that describedon the west side of Dry Creek where wintering areas and summer rangesare separated by several miles. In this situation (east of Dry Creek) thephysiography and prevailing winds lead to snow deposition on some portionsof the area where sheep are seen in summer. These conditions render thevegetation inaccessible in all but the mildest winters. These areas ofsnow accumulation are often gentle slopes and support grass-sedge meadowsand Dryas mat communities. When snow melts in spring these areas becomeaccessible to sheep and are subsequently used as summer range. The areasof such snow deposition are indicated in Fig. 13. The higher areas whichare not marked can be considered winter range in a typical winter. Itshould be noted, however, that sheep utilize winter range throughout theyear and that summer range is simply added to that area which is availablein winter. The multiple resighting data which form the basis for theseconclusions are given in Table 4.
In addition to the populations mentioned above it appears that thereis some movement across Dry Creek from winter to summer range. It appearsthat at the present time these movements are insignificant and the majorityof ewe movements are as described above.
Seasonal Home Range - Rams: Resightings have revealed that there areat least four ram bands which may be identified while on their summerranges. It appears that there is a small band which inhabits the precipi-tous terrain on the east side of the Wood River downstream from SheepCreek. These rams apparently rut with the ewes of the Slide-Exclosure-Bigfoot area, and winter with them as well. They may travel 10 miles(16 km) out of their way to be at the mineral lick.
A fairly large band of rams is also indicated by the data to inhabitRogers and Kansas Creeks. Little movement data are available for theseanimals, but it appears that they may rut with both populations of ewes onthe west side of Dry Creek. Our data are fragmentary for this group ofanimals; however, it has been reported by a long-time guide in the studyarea that this group is actually made up of three sub-populations of rams.These animals face a journey of up to 12 miles (19.2 km) out of their wayto utilize the lick.
On the east side of Dry Creek there appear to be two bands of rams.One group summers in the vicinity of Red Mountain and No Name Ridge andhas ready access to the lick throughout the summer. Some of these animalshave been observed to cross Dry Creek and rut with the ewes in the Slide-Exclosure-Bigfoot area. Other rams of this group rut with the ewes whichwinter in the Red Mountain-No Name complex.
The final ram band described by the tagging operation summers on upperForgotten Creek. Indications are that this is a fairly large group of ramsand that these rams generally rut and winter with the ewes in the area of
34
eep
Table 4. Ewe resightings on the east side of Dry Creek, Alaska Range,animals seen at least twice when not involved with lick.
Collar Number Sex Location Date Seen
No Name-Red Mountain ComplexNorth Fork Forgotten Creek
South Fork Slate CreekSouth Fork Slate CreekNorth Fork Slate CreekNo Name-Red Mountain Complex
South Fork Forgotten CreekSouth Fork Forgotten Creek
South Fork Slate CreekNo Name-Red Mountain Complex
South Fork Slate CreeekNo Name-Red Mountain ComplexNo Name-Red Mountain ComplexNo Name-Red Mountain ComplexNo Name-Red Mountain ComplexSouth Fork Forgotten Creek
South Fork Forgotten CreekSouth Fork Forgotten CreekSouth Fork Slate Creek
3232.3232
3838
5050
585858585858
626262
787878
909090
G-2G-2G-2
55
FF
FFFF
FF
FF
FFFFFF
FFF
FFF
FFF
FFF
FF
ForgottenForgottenForgotten
ComplexComplexCreek
CreekCreekCreek
Forgotten CreekSlate CreekForgotten Creek
South Fork Slate CreekNo Name-Red Mountain Complex
June 1969July 1972
Winter 1969June 1969Winter 1972May 1972
Winter 1970July 1970
June 1969Winter 1970
July 1971July 1971August 1971May 1972June 1972July 1972
July 1971Winter 1972June 1972
July 1971August 1971July 1972
Winter 1971July 1971July 1972
July 1970August 1970July 1971
July 1971Winter 1973
36
ForkForkFork
ForkForkFork
No Name-Red MountainNo Name-Red MountainNorth Fork Forgotten
106106
SouthSouthNorth
SouthSouthSouth
- - -
c


"New" Mountain and Slate Creek Ridge. These rams must travel 6 miles (9.8 km)out of their way in order to utilize the main mineral lick at Dry Creek.
Mineral Lick Influence on Seasonal Movement Patterns: Heimer (Nicholsand Heimer 1972) reported that fidelity of adult ewes to the mineral lickon Dry Creek was quite high (78% to 93%). These estimates have beenrevised upward with the acc'-mulation of more data (Appendix II), andfidelity is now considered to be 100 percent. This means that everyewe seen at the lick in the previous year will visit the lick the ensuingyear if able. The period of maximum lick use has been found to correspondto the movement of sheep from winter to summer ranges. During 1972 thisperiod was observed to be from about the 16th to the 23rd of June. Thismay represent a later than normal movement. Other data indicate that themovement may occur as early as the first week in June.
Observed fidelity of rams to the main mineral lick at Dry Creek isless than that of ewes. However, ram fidelity has been observed to increasewith each year of observation and the increased fidelity constants areprobably due to more intensive observation. Ram fidelity has been observedto be as high as 90 percent. It is not known whether this represents theloyalty of older rams to the lick, and it is not certain that ram travelwill definitely involve a visit to the lick at the time of movement tosummer range.
The traditional use of the main mineral lick on Dry Creek by theanimals of all sub-populations means that movement from winter to summerrange is often much greater than the physical distance involved. Forexample, ewes wintering in Birdnest Creek and Two Ram Creek move to thelick and then to upper Dry and Kansas Creeks (Fig. 14); consequently thedistance travelled is increased from approximately 2 miles (3.2 km) toabout 10 miles (16 km). Ewes wintering on the Slide-Exclosure-Bigfootarea on the other hand, pass through the vicinity of the lick on theirway to summer range. Ewes wintering on the east side of Dry Creek maybe considered to have the lick on the periphery of their ranges. Journeysof 4 miles (6.2 km) to summer range are extended to approximately 8miles (12.8 km) for those on the Red Mountain-No Name complex, whileanimals which winter on Slate Ridge increase their distance travelled fromabout 2 miles (3.2 km) to nearly 12 miles or 20 km (Fig. 14).
It appears that several populations of sheep inhabiting the study areaoverlap or mingle only at the main mineral lick on Dry Creek. The time oflick use corresponds with the time of movement to summer range, and it appearsthat animals travel out of their way to spend time at the lick during thisperiod. It is not currently known whether the drive to use the mineral lickis physiological or social.
Mineral Lick Use Patterns: During the course of the study severaltrends in mineral lick use have emerged. One such trend is that rams havebeen observed to use the lick earlier than ewes. This was stated to be thecase by Jones (Jones and Merriam 1963) and Smith (Nichols and Smith 1971)._Data gathered in continuous observation of the lick throughout the period ofuse in 1972 indicate that this was not the case during that year. Fig. 9
38
heep entering the lick fromcan be seen that apparent.were June 7 and June 24. Fig. 15,
ep per day in 1972, indicatesThe apparent increases of
ts of presentation becausethe lick on those days.ehavior of sheep is considered.mer ranges; this results inbs. Consequently, a low numberesence at that time of a fairlyeferential utilization by rams.ave occurred leading to theis by rams.
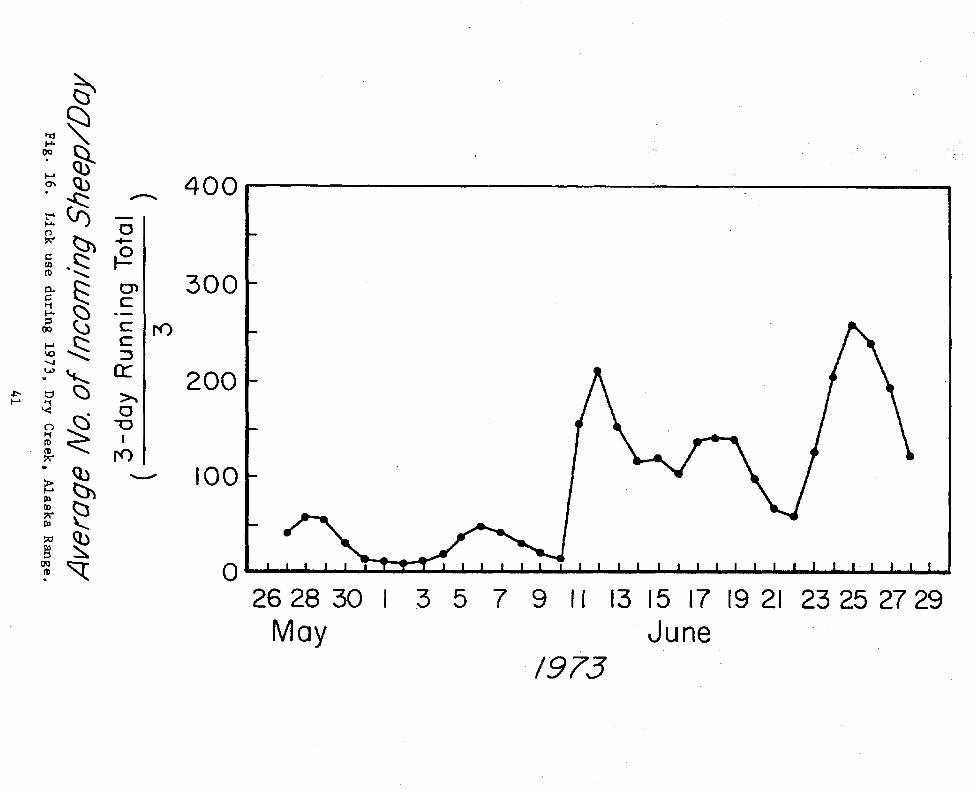
ling age in incoming sheep did0 the average percentage ofune 9 through June 14 it wast was 12 percent. It shouldse dates (shown in Fig. 16)could be misleading. It iso monitor a lick for thenot accurately reflect the
ral lick at Dry Creek hasthe day of highest useh 1971), in 1972 the day7 was the day of maximumiod is apparently dependentthe conditions of warming
In 1972 snow accumulationmid-June. Peak use thate closely with local ambient0 F at that time. Snows essentially complete byid not reach daily means ofr these conditions lick use:ensity was less than in 1972.
ed by the entry of 580 sheepIn 1973 about 350 sheep
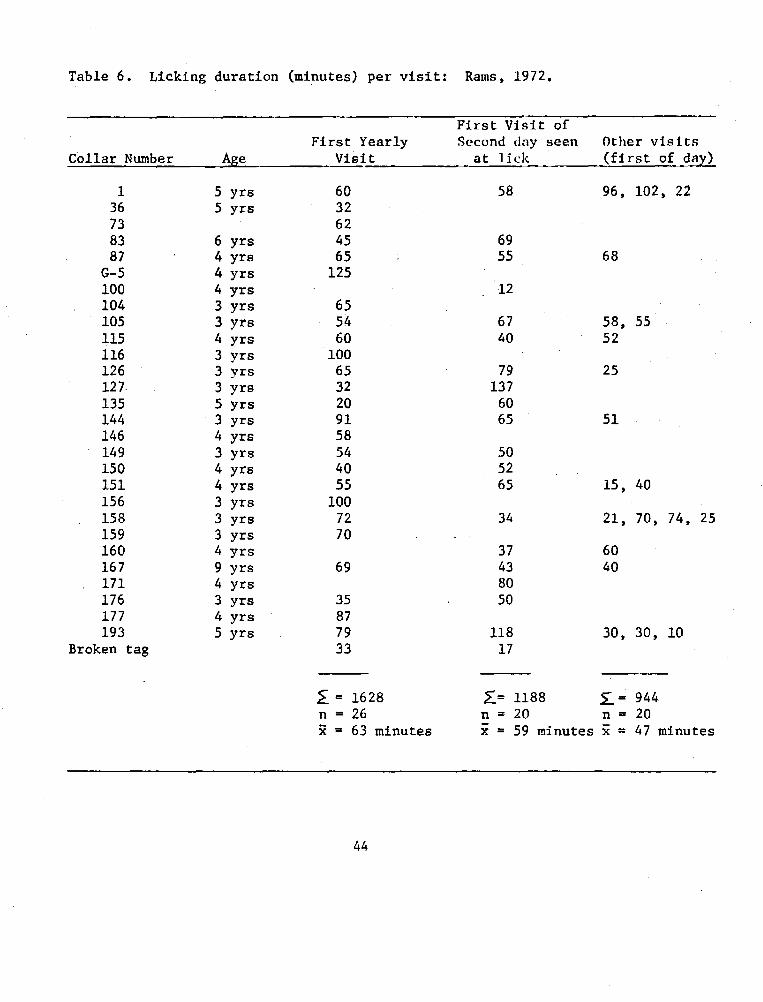
itation: The length of timew many times it has been atzation as well as the sex andare nursing lambs appear tof time spent by collared
39
I

23 27 31
May4 8 12 16 20 24
June/972
500
400FA.
..l
U-'
FI-
rb.
cCO
a.T1
00rl
I-s'0o1
noNJ
0
Co03
00
1
(B
rc?f
>li-"inl
(BPT-
1r-C
(b
,z)
N
E~S0
N.
0
93
t^=t-$
0t2C
cCn
300
ro
200
100
030 3
July
I
0 0
0 0
00
0 0
0J-
rO)n C\-
( lo• 6uiuung
Dop-D
e
/DoO
/de99S
u/JWO
Oul
/o J
ON
o96 5
J9AV"
Fig
. 16.
Lic
k
use
du
ring
1
97
3,
Dry
Creek
, A
lask
a
Ran
ge.
41
0)C\Joc
Or)o~J
N-
LO0O0CN

a the lick eating soil ort in the lick during thewas 75 minutes. The averageminutes. Data presented in
eep spent 93 percent of thecalculations for the seconda second day an individualtime present in the lickthe average time spent
:ions were pooled regard-:ually 100 percent it istime in the lick perform-
3 visits to the lick; an:hese animals 29 were rams;)ur visits per ram duringever seen to nurse a lamb.rage of four visits pere seen to nurse lambs;average of five visitss no difference in lick useie average age of ramsese rams were generallyhorn development.
sits in 71 sheep days forThe average length of time
ing the lick on separateper ram was four. Thisys involved with the lick.ie time (perhaps for four5, 149, 160 and 193 (Tableby 7 to 19 days. Ofduring summer when rotvicinity of the lick andOther populations ofThe reasons for preferen-
i.
s in 79 days for an averagef time which elapsed betweens 198 days between 118 visitse number of visits by thisith no lamb spent four daysam.
42
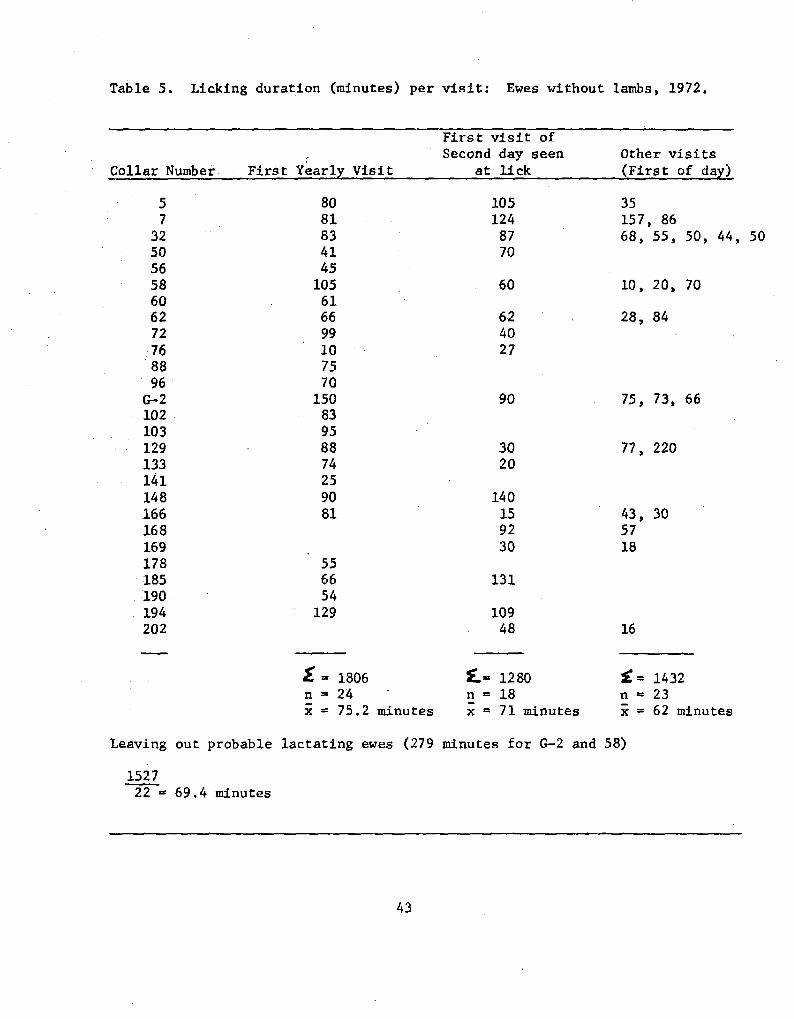
Table 5. Licking duration (minutes) per visit: Ewes without lambs, 1972.
First visit ofSecond day seen Other visits
Collar Number First Yearly Visit at lick (First of day)
35157, 8668, 55, 50, 44, 50
5732505658606272768896
G-2102103129133141148166168169178185190194202
= 1806n 24x = 75.2 minutes
t= 1280n 18x = 71 minutes
n£n c
x =
14322362 minutes
Leaving out probable lactating ewes (279 minutes for G-2 and 58)
152722 = 69.4 minutes
43
8081834145105616699107570
15083958874259081
556654
129
1051248770
60
624027
90
3020
140159230
131
10948
10, 20, 70
28, 84
75, 73, 66
77, 220
43, 305718
16
I
I
I
First Visit ofFirst Yearly Second day seen Other visits
Collar Number Age Visit at lick (first of day)
1 5 yrs 60 58 96, 102, 2236 5 yrs 3273 6283 6 yrs 45 6987 4 yrs 65 55 68
G-5 4 yrs 125100 4 yrs 12104 3 yrs 65105 3 yrs 54 67 58, 55115 4 yrs 60 40 52116 3 yrs 100126 3 yrs 65 79 25127. 3 yrs 32 137135 5 yrs 20 60144 3 yrs 91 65 51146 4 yrs 58149 3 yrs 54 50150 4 yrs 40 52151 4 yrs 55 65 15, 40156 3 yrs 100158 3 yrs 72 34 21, 70, 74, 25159 3 yrs 70160 4 yrs 37 60167 9 yrs 69 43 40171 4 yrs 80176 3 yrs 35 50177 4 yrs 87193 5 yrs 79 118 30, 30, 10
Broken tag 33 17
-= 1628 1= 1188 j= 944n = 26 n = 20 n = 20S= 63 minutes x = 59 minutes x = 47 minutes
44
Table 6. Licking duration (minutes) per visit: Rams, 1972.
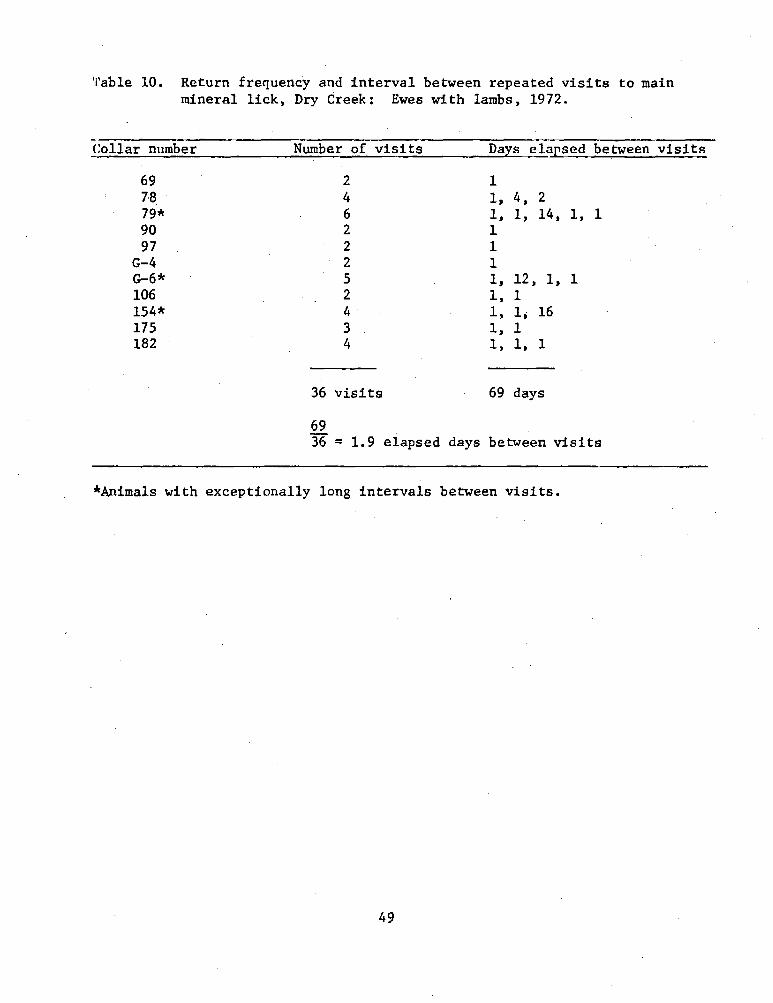
ide 57 visits in 36 sheep daysterage length of time whichrevisited the lick was 69 days'able 7). The average number
five. Hence, these animalsrolved with the lick. This is:hout lambs. The more extended:ed by the data shown in Tablesi in this section were arbi-:urred on different days. Theiequent visits that day werelecond visit of the year was:he initial visit of the
sr it appeared that ewes with; more time than rams and ewesLr; ewes with lambs 93 minutes,.nutes (Tables 8, 9, and 10).as well defined, with ewes withS71 minutes, and rams 59 minutes.ewes with lambs had an averageSrage of 62 minutes and rams an
nes throughout the course of the:ime involved with the lick, and>ther ewes and rams.
abs also may return to the lickiter regularity than otherles 6 and 7 that several ewes,
G-2 and 68, 129, 169, 22, andSfrom 10 to 17 days between76, 79, G-6 and 154 had summer;-2 had summer ranges on the, 269 and 202 were not observed!tween lick use "bouts" in theseSand returned to winter rangeange. Alternatively, they may*se of the summer. The dates76 indicate that she may have
ranges in area 2east side of Dryon their summeranimals suggestsand then used ithave returned tcduring which the
Sone time.ierhaps just
Her second visitat the beginning
nered in area 2 (Fig. 12), 79,is. Their dates of lick utiliza->f the dates of general movement
45
OEM

Table 7. Licking duration (minutes) per visit: Ewes with lambs, 1972.
First visit ofSecond day seen Other visits
Collar Number First Yearly Visit at lick (First of day)
69 50 90 50, 5078 98 38 65, 61, 33, 7879 165 7390 4097 55 70
G-4 125 46G-6 103, 50, 50106 90 77 78154 82 36 55, 217175. 71 31 108182 102 140 63
:= 838 E= 641 S= 1064n = 9 n = 10 n = 14x = 93 minutes x - 64 minutes x = 76 minutes
46
I
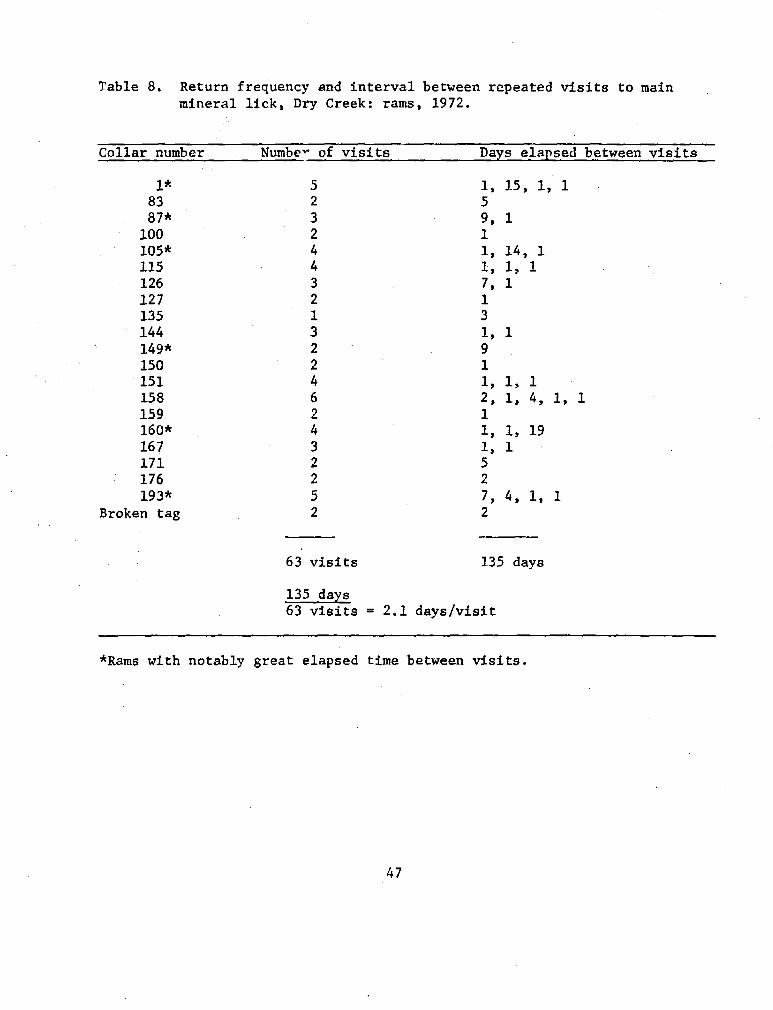
Table 8. Return frequency and interval between repeated visits to mainmineral lick, Dry Creek: rams, 1972.
Collar number Number of visits Days elapsed between visits
1* 5 1, 15, 1, 183 2 587* 3 9, 1
100 2 1105* 4 1, 14, 1115 4 1, 1, 1126 3 7, 1127 2 1135 1 3144 3 1, 1149* 2 9150 2 1151 4 1, 1, 1158 6 2, 1, 4, 1, 1159 2 1160* 4 1, 1, 19167 3 1, 1171 2 5176 2 2193* 5 7, 4, 1, 1
Broken tag 2 2
63 visits 135 days
135 days63 visits = 2.1 days/visit
*Rams with notably great elapsed time between visits.
47

I
*Animals with notably great elapsed time between visits.+Animals with use pattern characteristic of ewes with lambs.
48
Table 9. Return frequency and interval between repeated visits to mainmineral lick, Dry Creek: Ewes without lambs, 1972.
Collar number Number of visits Days elapsed between visits
5 2 47 2 7
22* 2 1632 7 3, 6, 2, 6, 2, 550 1 158*+ 5 6, 1, 4, 160 2 362* 4 1, 1, 1768* 3 5, 1072 2 176* 2 10
G-2*+ 5 2, 1, 3, 10129* 4 14, 1, 4133 2 1141 2 1148 2 1166 4 1, 1, 4168 3 1, 1169* 7 1, 1, 2, 1, 11, 3185 2 1194 2 7202* 2 13
118 visits 198 elapsed days
198118 = 1.7 elapsed days between visits
I
49
Table 10. Return frequency and interval between repeated visits to mainmineral lick, Dry Creek: Ewes with lambs, 1972.
Collar number Number of visits Days elapsed between visits
69 2 178 4 1, 4, 279* 6 1, 1, 14, 1, 190 2 197 2 1
G-4 2 1G-6* 5 1, 12, 1, 1106 2 1, 1154* 4 1, 1, 16175 3 1, 1182 4 1 1, 1
36 visits 69 days
6936 = 1.9 elapsed days between visits
*Animals with exceptionally long intervals between visits.
imals used the lickn upper Kansas Creekn the main licktilize these licks.
G-2, have datesG-2 apparently
s on 6/1 and 6/15).th of these animalshan the lower lickwhy they preferoted that theseeral lick on Dryner.
are not con-returned to
wes.
Linked to weather,ing device capablei humidity wasd 1973.
i lick use.when they precede)ssible meteoro-a 1973 there wasressure.
ured, temperatureD the mineral licklick utilization
eable warmingcaused a generalak of utilization:her of May 30use observedweek in May andean of 40.5 Fe. This is arise in tempera-
>ut 80 animals
:he heavy snowje to snow melt.-stimated to haverossing site. Ita cataract. This
50
4 8 12 16 20 24June
/972
303July
r 1 t-%0
4
3
m
1
00
*
ha-J
m
un
0
V(CHtortCIr
(C
ha
Ia.
n
ft
(A0f14
prha'O0
WI)Q)
cc:,
C3
0
,ZZ
0ci
t
K
I)
r0
2
0
F-
C
I
acor>^0-0>r
WI)
K~t
04-
F-01
=3
C)
3123 27May
m m m m m m m m
rý
I
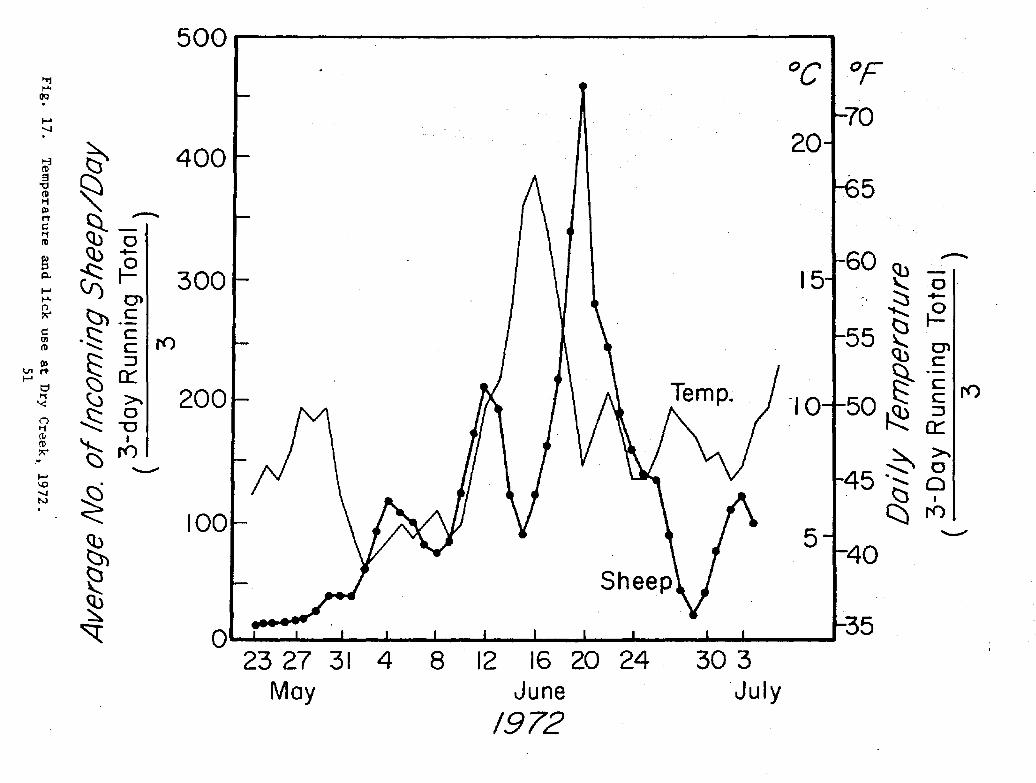
resulted in sheep from the west side of Dry Creek being prevented frommoving to the lick, and may have caused the decline in utilization seenaround the 15th of June (incoming numbers were cut in half) even thoughthe main peak of lick use may have begun with the sudden warming trend ofJune 6th through 13th. When the waters receded to normal there was anexplosion of lick activity which resulted in the 580 animals being seenentering the lick on June 20. As this peak of activity declined animalswere no longer seen on their winter ranges, and it was assumed that themajor peak of lick use had ended. Further use was limited to those animalsin the local area.
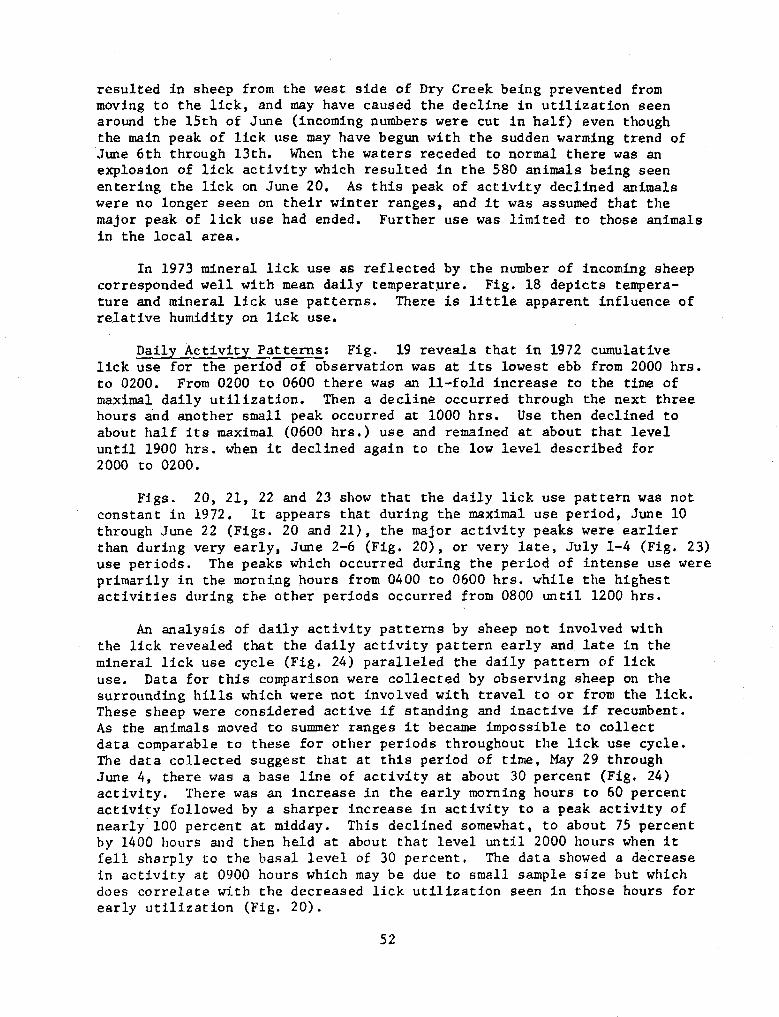
In 1973 mineral lick use as reflected by the number of incoming sheepcorresponded well with mean daily temperature. Fig. 18 depicts tempera-ture and mineral lick use patterns. There is little apparent influence ofrelative humidity on lick use.
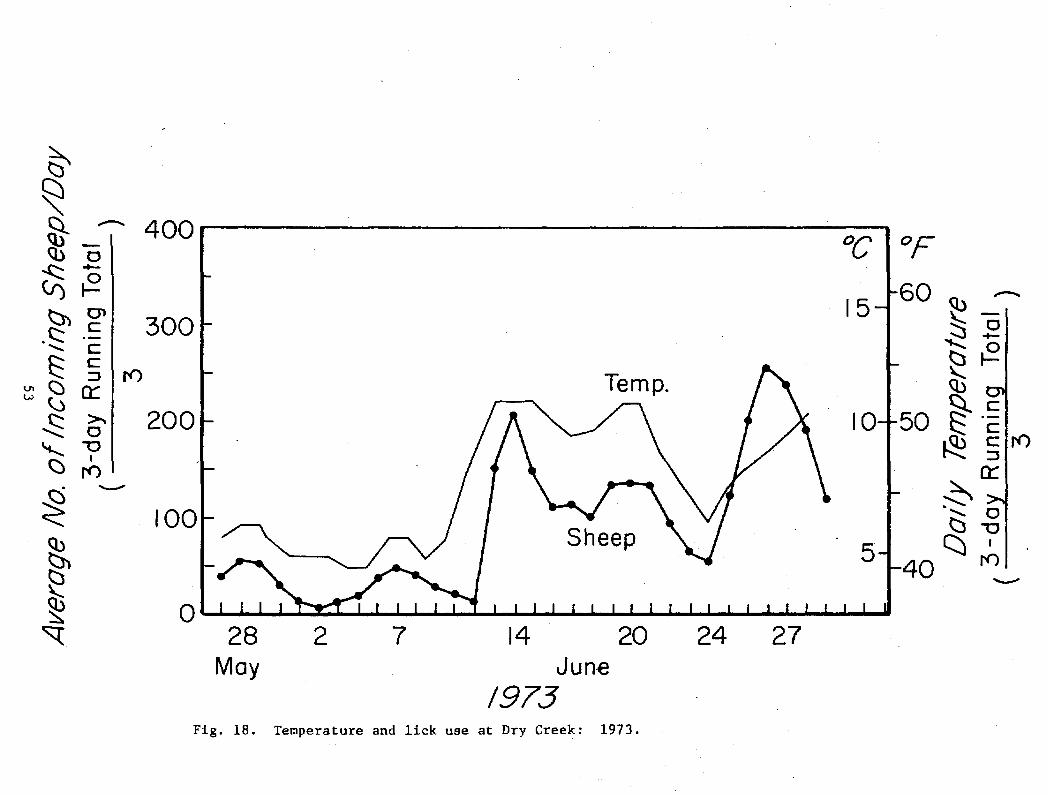
Daily Activity Patterns: Fig. 19 reveals that in 1972 cumulativelick use for the period of observation was at its lowest ebb from 2000 hrs.to 0200. From 0200 to 0600 there was an 11-fold increase to the time ofmaximal daily utilization. Then a decline occurred through the next threehours and another small peak occurred at 1000 hrs. Use then declined toabout half its maximal (0600 hrs.) use and remained at about that leveluntil 1900 hrs. when it declined again to the low level described for2000 to 0200.
Figs. 20, 21, 22 and 23 show that the daily lick use pattern was notconstant in 1972. It appears that during the maximal use period, June 10through June 22 (Figs. 20 and 21), the major activity peaks were earlierthan during very early, June 2-6 (Fig. 20), or very late, July 1-4 (Fig. 23)use periods. The peaks which occurred during the period of intense use wereprimarily in the morning hours from 0400 to 0600 hrs. while the highestactivities during the other periods occurred from 0800 until 1200 hrs.
An analysis of daily activity patterns by sheep not involved withthe lick revealed that the daily activity pattern early and late in themineral lick use cycle (Fig. 24) paralleled the daily pattern of lickuse. Data for this comparison were collected by observing sheep on thesurrounding hills which were not involved with travel to or from the lick.These sheep were considered active if standing and inactive if recumbent.As the animals moved to summer ranges it became impossible to collectdata comparable to these for other periods throughout the lick use cycle.The data collected suggest that at this period of time, May 29 throughJune 4, there was a base line of activity at about 30 percent (Fig. 24)activity. There was an increase in the early morning hours to 60 percentactivity followed by a sharper increase in activity to a peak activity ofnearly 100 percent at midday. This declined somewhat, to about 75 percentby 1400 hours and then held at about that level until 2000 hours when itfell sharply to the basal level of 30 percent. The data showed a decreasein activity at 0900 hours which may be due to small sample size but whichdoes correlate with the decreased lick utilization seen in those hours forearly utilization (Fig. 20).
52
L
I
NY
CS-0
I)
=3Ci)
Z3 -Qw11)»S c
Sro,
q 28 2 7 14 20 24 27May June
/973Fig. 18. Temperature and lick use at Dry Creek: 1973.
I
0 N E E w 0 M M M
600
500
-4 400
_ 300-4--.
Q3
S200
S100
2 4 6 8 10 12 14 16 18 20 22 24Hour of the Day
Fig. 19. Cumulative hourly mineral lick use at main mineral lick on Dry Creek, 1972.

Is
QO
( b
q-i
'S
60
40
20
n
Fig. 20. Hourly lick use early in the licking cycle.i /t%/%
I 2U
100
80
60
40
20 I2 I 4 I8 10 1 2 16 18 20 2
2 4 6 8 10 12 14 16 18 20 22 24Hour
Fig. 21. Hourly lick use midway through licking cycle, 1972.
55
SI I I I I I J 1 I I I I I I I I I I .J
2 4 6 8 10 12 14 16 18 20 22 24
(Z)
t zC L
ajclt
ZZLO^
Cr1
Orz
,

0)
C<"
.t
c~J)*$
<bt0
Q)tC
2 4 6 8 10 12 14 16 18 20 22 24Hour
Fig. 22. Hourly lick use at peak of licking cycle, 1972.
56
160
SI 1 1 1 I 1111111 1 I
140
120
100
80
60
40
20I -

r 60
b" q 40
"20
2 4 6 8 10 12 14 16 18 2022 24Fig. 23. Hourly lick use late in licking cycle, 1972.
q3Ci)Qi)CIz½
q-)
(3
Q\
100
80
60
40
20 2I I I I I 0I I I I I I I I 2 I I I I I24
2 4 6 8 10 12 14 16 18 20 22 24Hour
Fig. 24. Daily activity of sheep not involved with the mineral lick.
57
I
It appears that daily activity patterns were probably related to thoseshown by sheep at the mineral lick. It may be, however, that patterns ofactivity change greatly after movement to summer range, or in response toother factors such as overriding weather events and day length. The state-ments which were made in the past indicated that there were generally twoseparate peaks of sheep utilization for any given day at the mineral lick.Since the daily pattern observed is a function of either the time in thelick use cycle or the number of sheep seen, it is unlikely that the twopeaks seen in the past represent the total picture, but more probablyreflect the situation during the shorter periods of observation. Forpopulation composition survey purposes at mineral licks it is importantto know temporally where in the "use cycle" one is in order to adjust hisschedule to the best advantage.
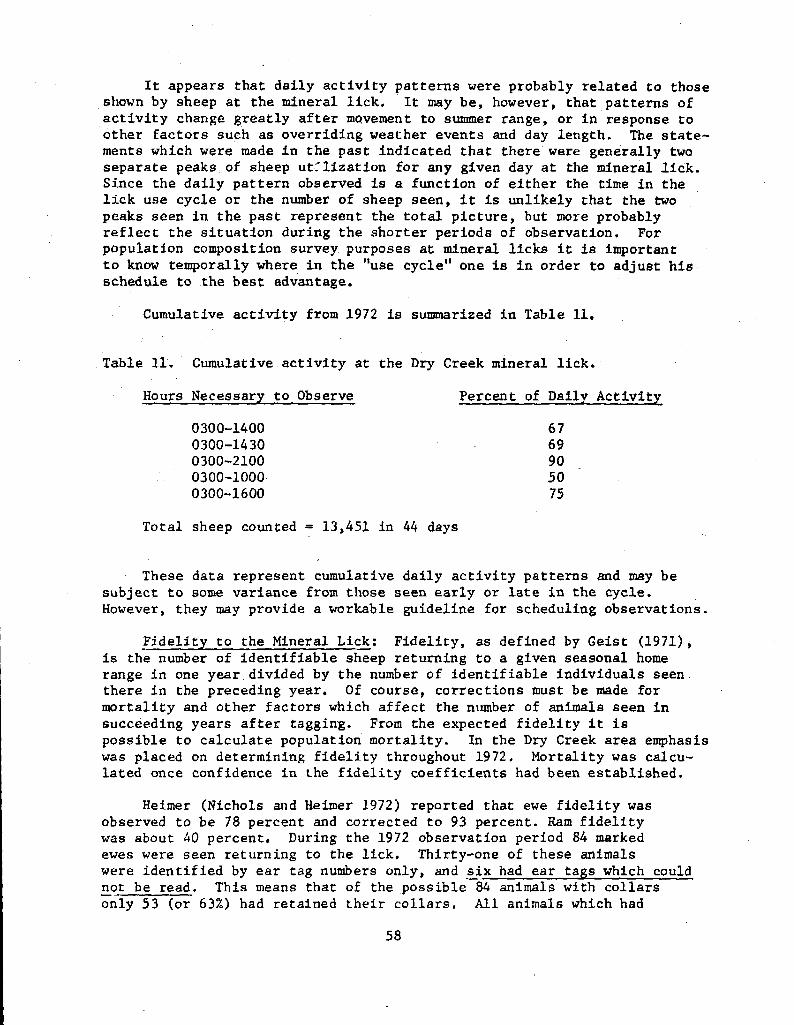
Cumulative activity from 1972 is summarized in Table 11.
Table 11. Cumulative activity at the Dry Creek mineral lick.
Hours Necessary to Observe Percent of Daily Activity
0300-1400 670300-1430 690300-2100 900300-1000 500300-1600 75
Total sheep counted = 13,451 in 44 days
These data represent cumulative daily activity patterns and may besubject to some variance from those seen early or late in the cycle.However, they may provide a workable guideline for scheduling observations.
Fidelity to the Mineral Lick: Fidelity, as defined by Geist (1971),is the number of identifiable sheep returning to a given seasonal homerange in one year divided by the number of identifiable individuals seenthere in the preceding year. Of course, corrections must be made formortality and other factors which affect the number of animals seen insucceeding years after tagging. From the expected fidelity it ispossible to calculate population mortality. In the Dry Creek area emphasiswas placed on determining fidelity throughout 1972. Mortality was calcu-lated once confidence in the fidelity coefficients had been established.
Heimer (Nichols and Heimer 1972) reported that ewe fidelity wasobserved to be 78 percent and corrected to 93 percent. Ram fidelitywas about 40 percent. During the 1972 observation period 84 markedewes were seen returning to the lick. Thirty-one of these animalswere identified by ear tag numbers only, and six had ear tags which couldnot be read. This means that of the possible 84 animals with collarsonly 53 (or 63%) had retained their collars. All animals which had
58
I
lost collars were collared in 1971 when pendants with engraved numberswere attached to the sheep using polypropylene rope (Smith in Nichols andSmith 1971). Either this is not a good design for sheep collars, or someother factor resulted in loss.
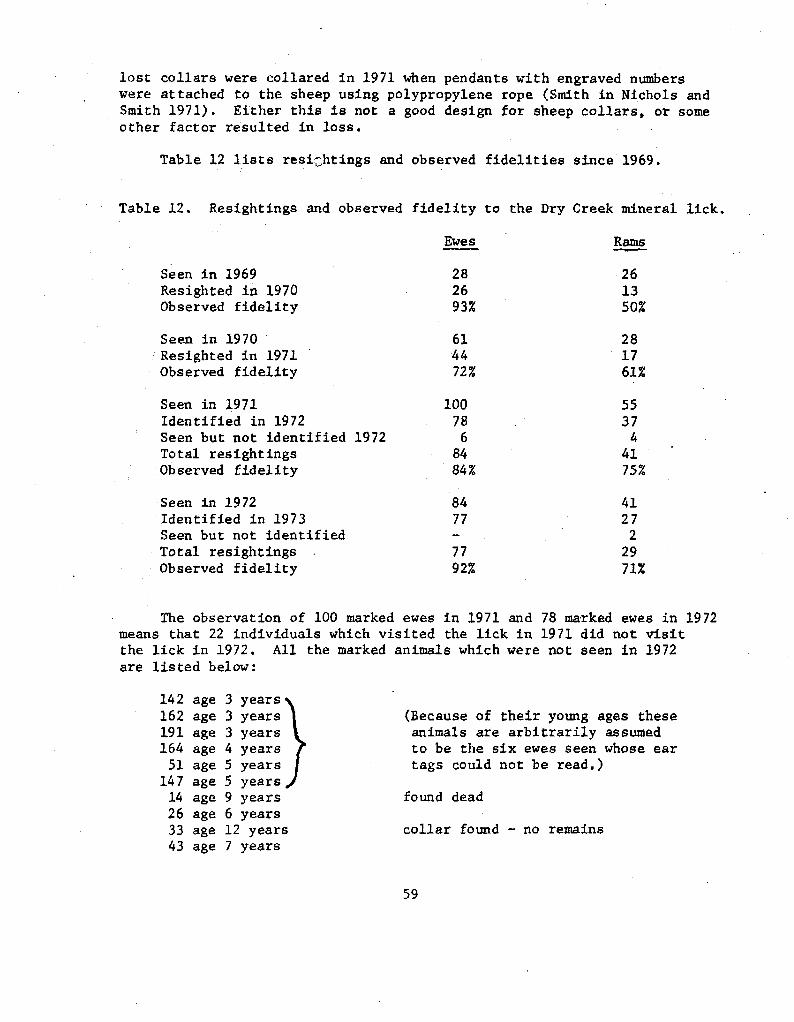
Table 12 lists resikhtings and observed fidelities since 1969.
Table 12. Resightings and observed fidelity to the Dry Creek mineral lick.
Ewes Rams
Seen in 1969 28 26Resighted in 1970 26 13Observed fidelity 93% 50%
Seen in 1970 61 28Resighted in 1971 44 17Observed fidelity 72% 61%
Seen in 1971 100 55Identified in 1972 78 37Seen but not identified 1972 6 4Total resightings 84 41Observed fidelity 84% 75%
Seen in 1972 84 41Identified in 1973 77 27Seen but not identified - 2Total resightings 77 29Observed fidelity 92% 71%
The observation of 100 marked ewes in 1971 and 78 marked ewes in 1972means that 22 individuals which visited the lick in 1971 did not visitthe lick in 1972. All the marked animals which were not seen in 1972are listed below:
142 age 3 years162 age 3 years (Because of their young ages these191 age 3 years animals are arbitrarily assumed164 age 4 years to be the six ewes seen whose ear51 age 5 years tags could not be read.)
147 age 5 years14 age 9 years found dead26 age 6 years33 age 12 years collar found - no remains43 age 7 years
59
I M
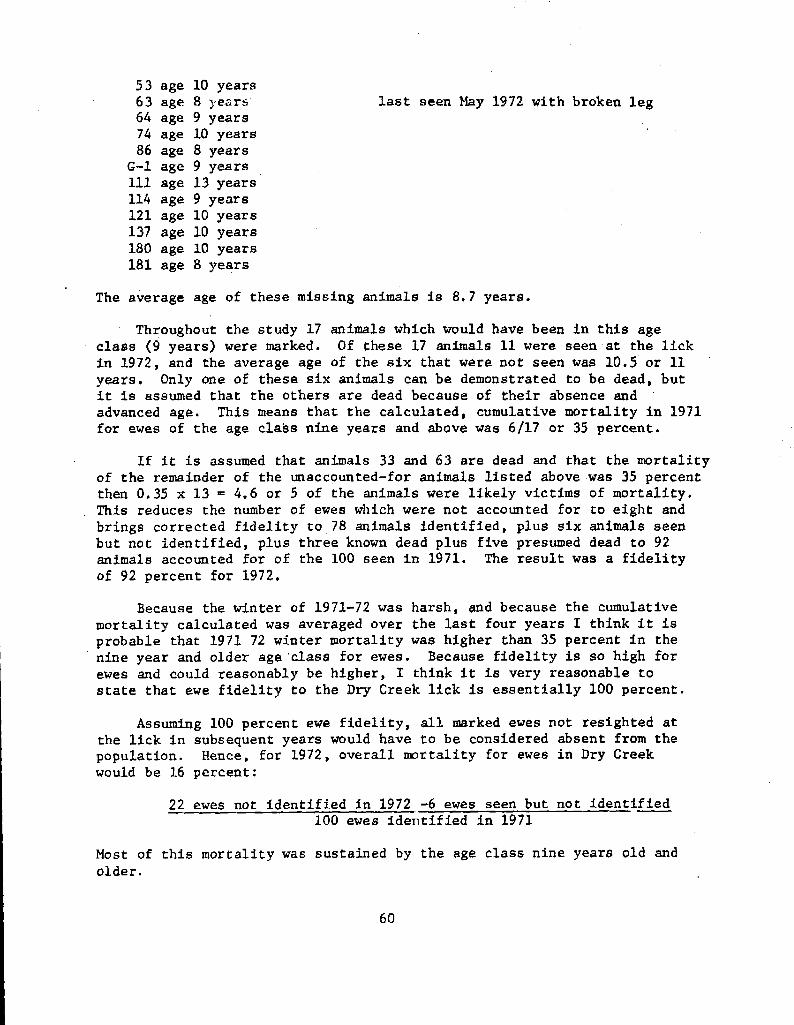
53 age 10 years63 age 8 years last seen May 1972 with broken leg64 age 9 years74 age 10 years86 age 8 years
G-1 age 9 years111 age 13 years114 age 9 years121 age 10 years137 age 10 years180 age 10 years181 age 8 years
The average age of these missing animals is 8.7 years.
Throughout the study 17 animals which would have been in this ageclass (9 years) were marked. Of these 17 animals 11 were seen at the lickin 1972, and the average age of the six that were not seen was 10.5 or 11years. Only one of these six animals can be demonstrated to be dead, butit is assumed that the others are dead because of their absence andadvanced age. This means that the calculated, cumulative mortality in 1971for ewes of the age class nine years and above was 6/17 or 35 percent.
If it is assumed that animals 33 and 63 are dead and that the mortalityof the remainder of the unaccounted-for animals listed above was 35 percentthen 0.35 x 13 = 4.6 or 5 of the animals were likely victims of mortality.This reduces the number of ewes which were not accounted for to eight and
brings corrected fidelity to 78 animals identified, plus six animals seenbut not identified, plus three known dead plus five presumed dead to 92animals accounted for of the 100 seen in 1971. The result was a fidelityof 92 percent for 1972.
Because the winter of 1971-72 was harsh, and because the cumulative
mortality calculated was averaged over the last four years I think it is
probable that 1971 72 winter mortality was higher than 35 percent in the
nine year and older age class for ewes. Because fidelity is so high for
ewes and could reasonably be higher, I think it is very reasonable to
state that ewe fidelity to the Dry Creek lick is essentially 100 percent.
Assuming 100 percent ewe fidelity, all marked ewes not resighted at
the lick in subsequent years would have to be considered absent from the
population. Hence, for 1972, overall mortality for ewes in Dry Creek
would be 16 percent:
22 ewes not identified in 1972 -6 ewes seen but not identified100 ewes identified in 1971
Most of this mortality was sustained by the age class nine years old and
older.
60
1
VL Consequently, mortality in age classes 9 years and older calculates at-\\ I L 11/17, (11 of the 16 animals not seen in 1972 were in that age class, and
there should have been 17 animals if all were alive) or 65 percent.
During 1973 seven ewes were not seen which were observed in 1972.These animals were considered to be no longer in the population. Threeof these ewes were less than nine years old, and the number of ewesexpected between the ages of 3 and 9 years was 55. Mortality for thisgroup of ewes then calculates at 3/55 or 5 percent.
In summary pprs that ewe fidelity is 100 percent. Animals whichdo not visit th lck "in subsequent years maybe considered dead. Mortalityof ewes between the ages of 3 and 9 years was 5 percent. Once a ewe reaches9 years of age the mortality of her age class increases to 65 percent.Here it should be noted that the winter of 1972-73 was considered a mildone, but predators were rumored to be abundant.
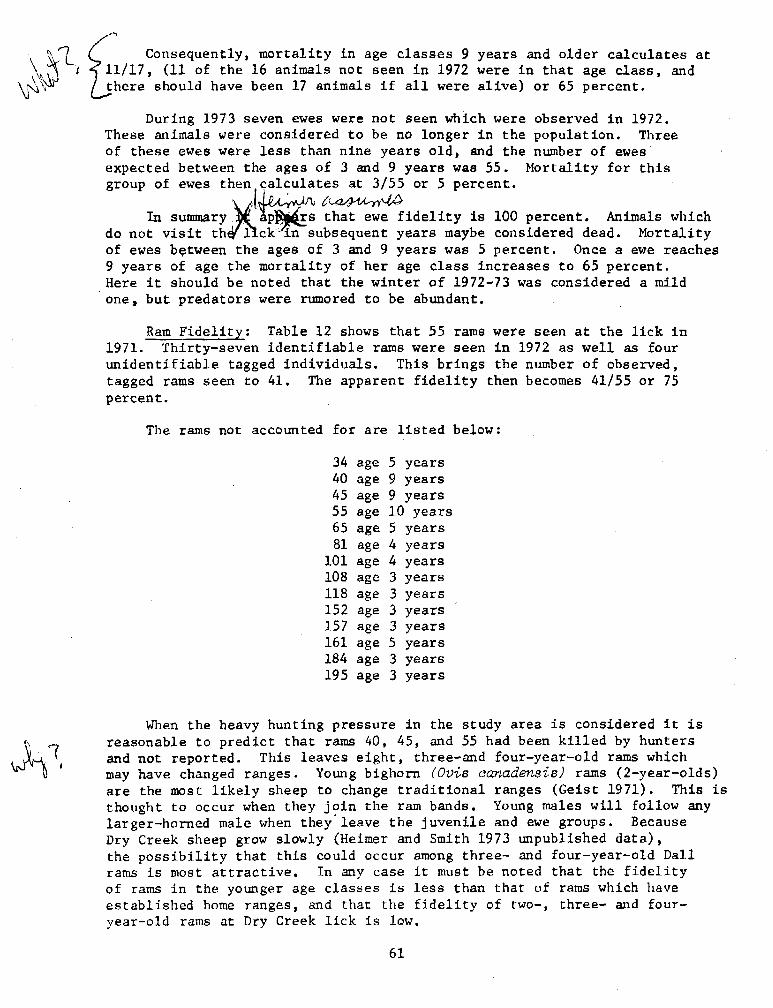
Ram Fidelity: Table 12 shows that 55 rams were seen at the lick in1971. Thirty-seven identifiable rams were seen in 1972 as well as fourunidentifiable tagged individuals. This brings the number of observed,tagged rams seen to 41. The apparent fidelity then becomes 41/55 or 75percent.
The rams not accounted for are listed below:
34 age 5 years40 age 9 years45 age 9 years55 age 10 years65 age 5 years81 age 4 years
101 age 4 years108 age 3 years118 age 3 years152 age 3 years157 age 3 years161 age 5 years184 age 3 years195 age 3 years
When the heavy hunting pressure in the study area is considered it isreasonable to predict that rams 40, 45, and 55 had been killed by hunters
and not reported. This leaves eight, three-and four-year-old rams whichmay have changed ranges. Young bighorn (Ovis canadensis) rams (2-year-olds)are the most likely sheep to change traditional ranges (Geist 1971). This isthought to occur when they join the ram bands. Young males will follow anylarger-horned male when they leave the juvenile and ewe groups. BecauseDry Creek sheep grow slowly (Heimer and Smith 1973 unpublished data),the possibility that this could occur among three- and four-year-old Dallrams is most attractive. In any case it must be noted that the fidelityof rams in the younger age classes is less than that of rams which haveestablished home ranges, and that the fidelity of two-, three- and four-year-old rams at Dry Creek lick is low.
61
I
I
62
If it is accepted that the three old rams not seen in 1972 were probablydead, fidelity could be adjusted to 44/55 or 80 percent for rams. Here itshould be noted that the average age of rams resighted in 1972 was lessthan five years. These animals usually occurred in ram bands, but were notyet legal to hunt. Also, fidelity may change as the animals mature.
When the low fidelity of young rams is considered, and it is knownfrom Geist (1971) that young rams are likely to change ranges as they joinram society, one purpose the Dry Creek lick appears to serve is maintenanceof genetic homogenity among the sheep of the study area. All populationsof the area appear to come to the lick at approximately the same time eachyear. Ram band use is apparently not separated from the use by ewes andjuvenile (1-4 yrs. old) rams. Consequently, young rams which are ready tojoin ram society are exposed by chance, it appears, to the opportunity tojoin any of the four known ram bands in the area depending on the coincidenceof their arrival at the lick. This is thought to be of major significance inthe prevention of genetic drift among the isolated populations of ewes andthe rams which traditionally rut with them and to result in the preservationof genetic stability.
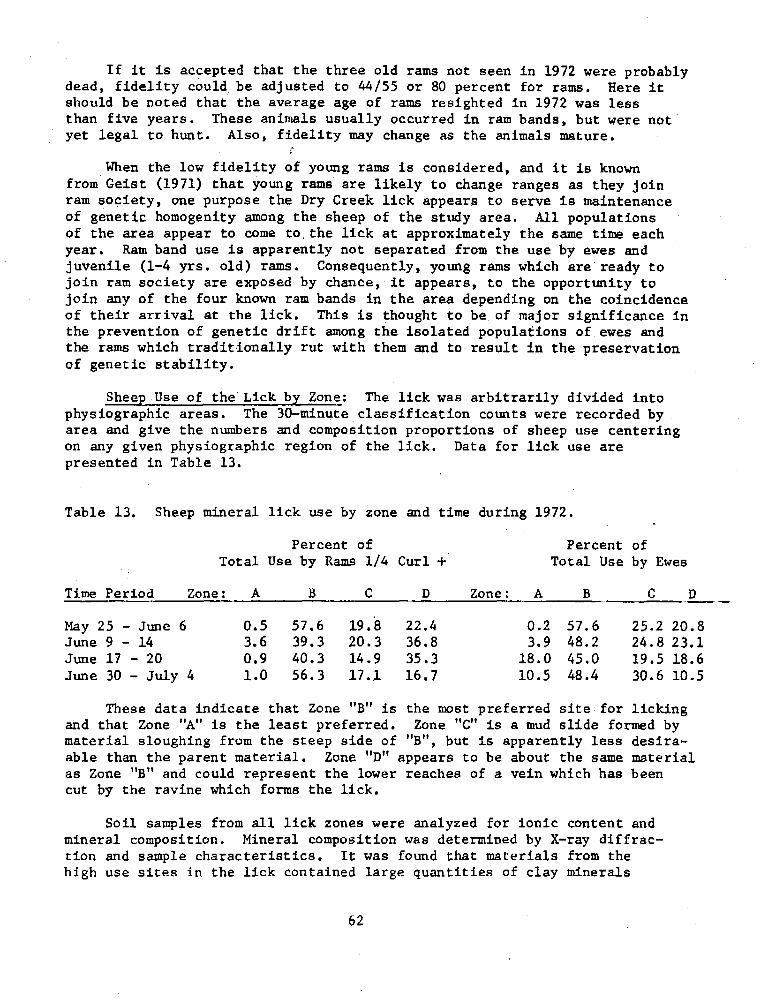
Sheep Use of the Lick by Zone: The lick was arbitrarily divided intophysiographic areas. The 30-minute classification counts were recorded byarea and give the numbers and composition proportions of sheep use centeringon any given physiographic region of the lick. Data for lick use arepresented in Table 13.
Table 13. Sheep mineral lick use by zone and time during 1972.
Percent of Percent ofTotal Use by Rams 1/4 Curl + Total Use by Ewes
Time Period Zone: A B C D Zone: A B C D
May 25 - June 6 0.5 57.6 19.8 22.4 0.2 57.6 25.2 20.8June 9 - 14 3.6 39.3 20.3 36.8 3.9 48.2 24.8 23.1June 17 - 20 0.9 40.3 14.9 35.3 18.0 45.0 19.5 18.6June 30 - July 4 1.0 56.3 17.1 16.7 10.5 48.4 30.6 10.5
These data indicate that Zone "B" is the most preferred site for lickingand that Zone "A" is the least preferred. Zone "C" is a mud slide formed bymaterial sloughing from the steep side of "B", but is apparently less desira-able than the parent material. Zone "D" appears to be about the same materialas Zone "B" and could represent the lower reaches of a vein which has beencut by the ravine which forms the lick.
Soil samples from all lick zones were analyzed for ionic content andmineral composition. Mineral composition was determined by X-ray diffrac-tion and sample characteristics. It was found that materials from thehigh use sites in the lick contained large quantities of clay minerals
I
63
called zeolites. These are quartz-forming minerals which are said to beof hydrosomic origin and contain the following:
1. quartz2. crystobalite3. montmorillonite and possibly mordenite and water-glass
These minerals have in common the occurrence of an imperfect quartzcrystal structure. Because of their "immature geological condition" (themature form of which would be quartz, homogenous sodium silicate) they havecations (other than sodium) of suitable size filling "slots" in the crystallattice. The possible cations are lithium, sodium, potassium, beryllium,magnesium, calcium, strontium and barium. Of these, sodium, potassium,magnesium, and calcium are of great biological significance. The presenceof the others, because of their chemical similarities, would be evident ascontamination in analysis for the physiologically important elements. Forthis reason the ionic content of soil samples was determined for thosephysiologically important elements. Contaminants were apparently not present.
The elements mentioned above proved to be present and readily available.Analytical techniques involved a cold water leach in which the loosly boundions were dissolved in water. Because of the ion-exchange properties ofthe minerals involved, a change in pH such as would take place in the diges-tive tract of a sheep could probably extract four or five times the quantitiesliberated by cold water. Consequently, it appears that vast quantities ofphysiologically important ions are available to sheep in the lick soil ofhighly preferred areas.
Because the sample compositions were similar from all zones the sampleswere grouped simply into high use sites, moderate use sites and control areaswhere little or no licking occurred. Soil samples from high use areas had7.3 times as much sodium, 3.0 times as much potassium, 3.6 times as muchcalcium and 14.9 times as much magnesium as did soil from nearby areas whichreceived no attention from sheep. High-use sites also had 9.1 times as muchwater per unit of soil. Sites receiving intermediate attention had valueswhich were intermediate to these extremes.
It is my speculation that the high phosphorus content of alpine vegeta-tion throughout winter (Herbert 1972)and as it begins to grow in the spring,results in the sheep having an excessive phosphorus load. Excretion of thisphosphorus calls for the expenditure of cations (perhaps calcium and magnesium)and may aggravate an already critical situation with respect to low levels ofthese two essential metal ions. Analyses of the water in the lick and thesoil of the lick have revealed that there is little phosphorus present(Linderman, unpublished data). It may be that these sheep come to the lickto attain calcium and magnesium which are free of large accompanying quanti-ties of phosphorus. This is speculative and could only be tested in furtherwork.

Gross observations indicated that the water content may have changedsignificantly (the surface in some licking sites dried and became quite hard)throughout the course of the licking cycle. This may have caused the changein licking by zone between Zones B and D during mid-June seen for rams, how-ever, the change in ewe preference is less striking. If there is a set ofcircumstances which renders a licking site desirable or perhaps on a broaderscale defines a lick it is probably the following. First, there must bethe necessary, sought after mineral or minerals (whether their attractionis physiological or as a condiment). Secondly, there must be a suitablesubstrate for ingestion by sheep. In the Dry Creek lick this is an extremelyfine clay which has been described as bentonite or montmorillonite. Finally,there must be.sufficient moisture to allow ingestion of the substrate. Itappears that at the Granite Creek lick in the Granite Mountains these con-ditions are present and the substrate there seems to be a fine sand ratherthan a clay-like substance. Many dry licks have been reported, but it isnot known whether these licks are dry during the times that sheep utilizethem.
Miscellaneous Observations: Appendix III presents an observation ofattempted predation by a wolf (Canis Zupus) at the Dry Creek lick.
MANAGEMENT RECOMMENDATIONS
Because of the demonstrated high fidelity of Dall sheep to theirseasonal home ranges (in this case specifically the main mineral lick atDry Creek) and the concentration of animals at this mineral lick immediatelyafter lambing, it is recommended that observations of mineral licks beemployed as a method to obtain relative composition data of Dall sheeppopulations.
It has been demonstrated that all segments of the population utilizethis mineral lick, that populations of sheep in the area may travel distancesup to 10 air miles (16 km) to visit the lick, that sheep utilize the lick atabout the same time every year, that daily and seasonal patterns of use allowscheduling of observations in order to observe maximal numbers of animalswith minimal effort, that mortality and population size can be estimatedfrom mineral lick observations involving tagged animals, that extremelyaccurate classification of ewes, lambs, yearlings, and rams can be made atmineral licks, and that observations can be made with little or no disturbanceto sheep. These data are important in the status-assessment of Dall sheeppopulations.
It has been shown that there is a preferential use of the Dry Creekmineral lick by lactating ewes. This preferential use is reflected in morevisits but not in more frequent visits. This could lead to an excessivelyhigh estimate of production if observations were prolonged. However, ina survey and inventory situation the observations should be made for fourto seven days. This should preclude excessive recounting of lactating ewes.Data gathered during these observations would probably accurately reflectthe productivity of sheep populations in the surrounding area.
64
__
ot exist, the relative numbersfrom year to year, and as a
hould provide better data thanexpense involved in mineralaircraft surveys, and the
much less.
t wherever feasible, routineby the techniques set forthreof.
is study shows sheep populationsey and inventory efforts shouldd movements of sheep populations
ance of the Dry.Creek lick to themineral licks be consideredpulations in Interior Alaska.
onception of, and the earlyimely death in 1970 lefta leader. Tony Smith capablyghout the major portions ofphases. I am also gratefulpatient review of reportperformed much of the routinethout their contribution thehave been completed. Thanks
od samples and morphological
ation in the native sheep of80.
Aid in Wildl. Rest. Annu. Proj.
isease report. Fed. Aid in1. XIV.
65

I
66
Fine, I. H., and L. A. Costello. 1963. The use of starch electrophoresisin dehydrogenase studies. Methods in Enzymology. VI:958-972.
Gasaway, W. C., and J. Coady. 1973. A review of energy requirements andrumen fermentation in moose and other ruminants. 1st Int. Symp.Moose Ecology. Quebec, Quebec. (in press).
Geist, V. 1966. Validity of horn segment counts in aging bighorn sheep.J. Wildl. Manage. 30:634-646.
. 1971.. Mountain sheep; a study in behavior and evolution.Univ. Chicago Press, Chicago and London.
Gross, J. E. 1963. Range and use of range by Dall sheep (Ovis dalli dzli)on Victoria Mountain and Mount Schwatka, Alaska. M.S. Thesis. Univ.Alaska, College. 89pp.
Herbert, D. M. 1972. Forage and serum phosphorus values for bighorn sheep.J. Range Manage. 25(4):292-296.
Jones, F. F. and H. R. Merriam. 1963. Sheep and goat report. Fed. Aid inWildl. Rest. Annu. Proj. Prog. Rep. W-6-R-4, Work Plan E., Vol. 4.
Kleiber, M. 1961. The fire of life. Wiley and Sons, New York.
Kristjansson, F. K., and C. G. Hickman. 1965. Subdivision of the alleleTfD for transferrin in holstein and ayrshire cattle. Genetics.52:627-630.
Murie, A. 1944. The wolves of Mount McKinley. U.S. Nat. Park Serv.,Fauna Series No. 5. 2 83pp.
Nadler, C. F., A. Woolf, and K. E. Harris. 1971. The transferrins andhemoglobins of bighorn sheep (Ovis canadensis), Dall sheep (Ovis dalli)and Mouflon (Ovis musimon). Comp. Biochem. Physiol. 40B:567-570.
Neiland, K. A. 1970. Weight of dried marrow as indicator of fat in cariboufemurs. J. Wildl. Manage. 34(4):904-907.
Nichols, L., and A. C. Smith. 1971. Sheep report. Fed. Aid in Wildl. Rest.Annu. Proj. Prog. Rep. Vol. XII.
. and W. Heimer. 1972. Sheep report. Fed. Aid in Wildl. Rest.Annu. Proj.Prog. Rep. Vol. XIII.
Palmer, L. J. 1941. Dall sheep in the Mount Hayes region. U.S. Fish Wildl.Serv. Prog. Rep. 27pp. Typescript.
Pitzman, M. S. 1970. Birth behavior and lamb survival in mountain sheep inAlaska. M.S. Thesis. Univ. Alaska, College. 11 6 pp.
Riney, T. 1955. Evaluating condition in free ranging red deer with specialreference to New Zealand. New Zealand J. Sci. Technol. 36B:429-463.
Robinson, F. F., D. C. Currie, and J. N. Peart. 1961. Feeding hill ewes.Trans. Royal Highland Agric. Soc., Scotland. pp.1-16.
Scott, R. F. 1951. Mountain sheep studies.Prog. Rep. Work Plan No. 9. 5(3):11-21.
U.S. Fish and Wildl. Serv. Q.Typescript.
Smith, A. C. 1973. Annu. Rep. Survey Inventory Activities. Fed. Aid inWildl. Rest. Rep. Proj. W-17-4, Part I. (in press).
Viereck, L. A. 1963a. Range survey. Pages 8-27 in F. F. Jones, R. F.Batchelor, H. R. Merriam, and L. A. Viereck. Sheep and goatinvestigations. Fed. Aid in Wildl. Rest. Annu. Proj. Seg. Rep.W-6-R-3, Work Plan E., Vol. 3.
. 1963b.H. R. Merriam.Proj. Seg. Rep.
PREPARED BY:
Wayne HeimerGame Biologist
Survey of range ecology. Pages 6-28 in F. F. Jones andSheep and goat report. Fed. Aid in Wildl. Rest. Annu.W-6-R-4, Work Plan E., Vol, 4.
APPROVED BY:
recto D ision of Game
SUBMITTED BY:
Richard H. BishopRegional Research Coordinator Research Chief, Division f Game
67
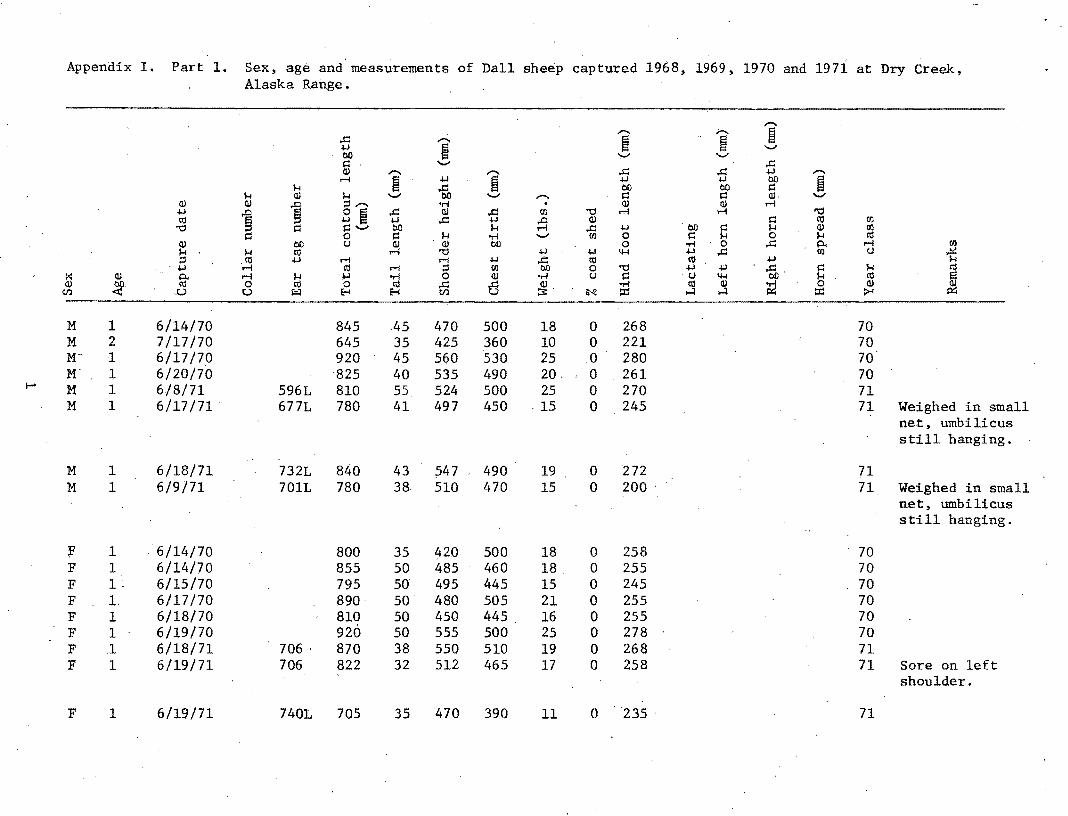
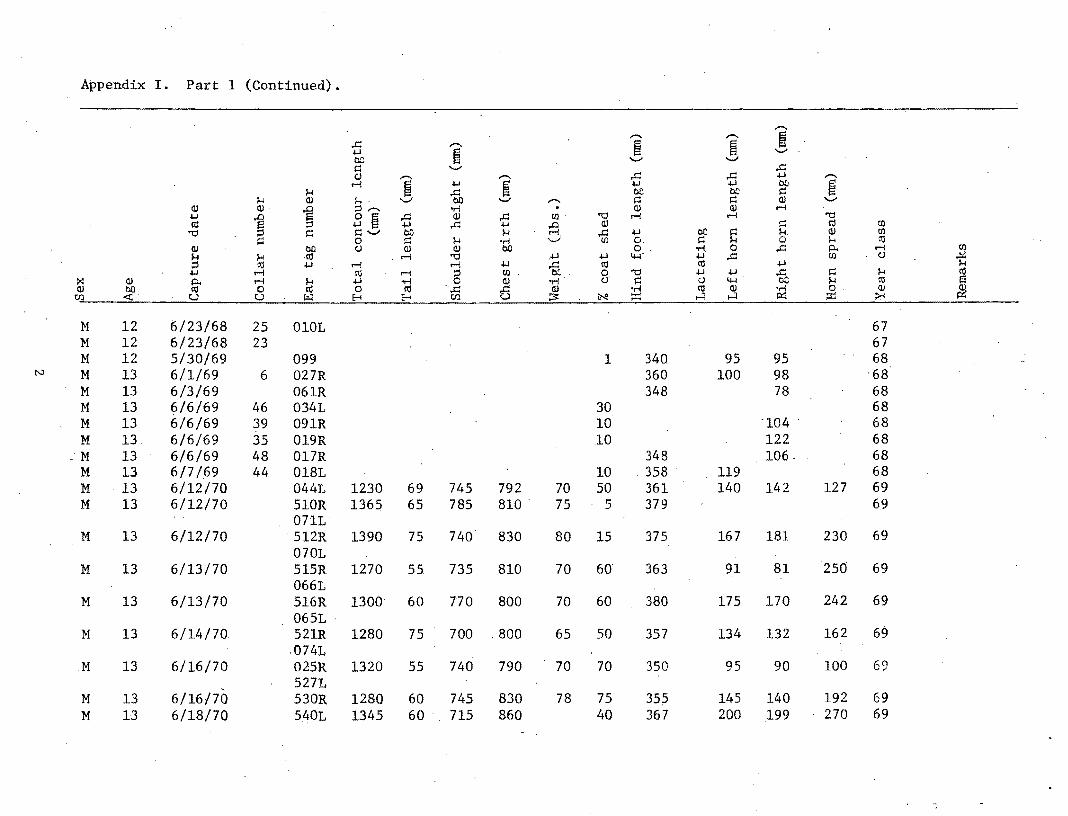
Appendix I. Part 1 (Continued).
,...... ,...... ,-...
~ ..c ,..... ~ ~ ~ ~ '-"
be '-" ...._,
l=l '-" ..c (l) ........ ........ ..c ..c ~ ,......
r-l ~ ~ ! ~ ~ 00 ~ !-< ..c 00 oc l=l
!-< (l) !-< ...._, b() ......... !=: l=l (l) '-" (l) (l)
~ ;:::! ......... •r-1 . (l) Q,l r-l
~ ~ 0 ~ ..c Q,l ..c (/)· "d r-l r-l "d ttl ;:::l ~ ~ ..c ~
~. (l) !=: ttl (/)
"d ;:::l l=l l=l ...._, . 00 !-< ..c ~ b.C l=l !-<. (l) (/)
l=l 0 !=: !-< •r-1 ..._; (/) 0. l=l !-< 0 "-' ttl (l) b() <J (l) (l) b() 0. -r-1. 0 ..c p.. r-l (/)
!-< !-< ttl . r-l "d .~ ~ 4-1' ~ ..c (/) <J ~ ;:::l ro ~ r-l r-l ~ ..c ro ro ~ ~ ~ r-l ro r-l ;:::l (/) o;;.. 0 "d ~ ~ ..c !=: !-< ro
:< (l) p.. r-l !-< ~ ar-1 0 (l) •r-1 . <J' l=l <J 4-1 bC !-< ro ! (l) ~ ttl 0 ttl 0 ro ',.C B ~ •r-1 ro Q,l ;g 0 (l)
Cll u u I'Ll E-< E-< Cll iN! ;:r:! ....::1 ....::1 ;:r:! :>-<
M 12 6/23/68 25 OlOL 67 M 12 6/23/68 23 67 M 12 5/30/69 099 1 340 95 95 68
N M 13 6/1/69 6 027R 360 100 98 ·68 M 13 6/3/69 061R 348 78 68 M 13 6/6/69 46 034L 30 68 M 13 6/6/69 39 091R 10 104 . 68 M 13 6/6/69 35 019R .10 122 68
.M 13 6/6/69 48 017R 348 106. 68 M 13 6/7/69 44 018L 10 358 . 119 68 M 13 6/12/70 044L 1230 69 745 792 70 50. 361 140 142 127 69 M 13 6/12/70 51 0R 1365 65 785 810 75 5 379 69
071L M· 13 6/12/70 ·s12R 1390 75 740 830 80 15 375 167 181 230 69
070L M 13 6/13/70 515R 1270 55 735 810 70 60 363 91 81 250 69
066L M 13 6/13/70 516R 1300 60 770 800 70 60 380 175 170 242 69
065L · M 13 6/14/70 521R 1280 75 700 . 800 65 50 357 134 132 162 69
.074L M 13 6/16/70 025R 1320 55 740 790 70 70 350 95 90 100 69
527L M 13 6/16/70 53 0R 1280 60 745 830 78 75 355 145 140 192 69 M 13 6/18/70 540L 1345 60 . 715 860 40 367 200 199 270 69
-;
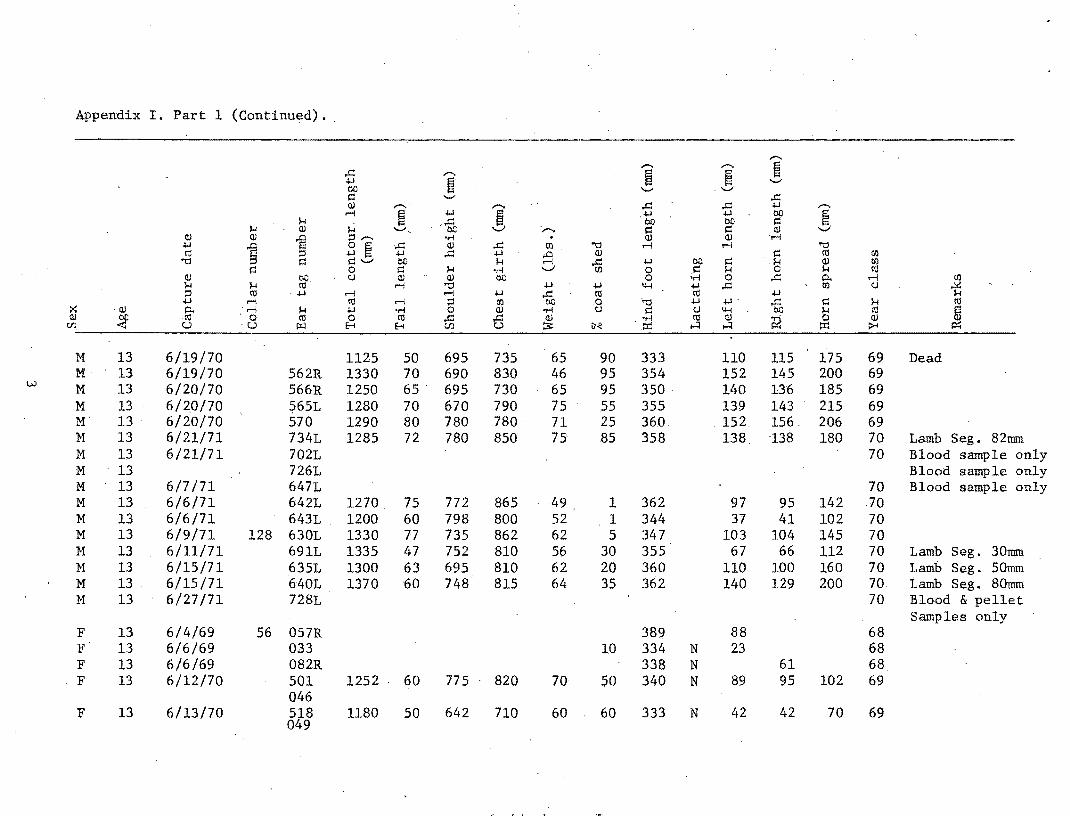
Appendix I. Part 1 (Continued) ..
-- ~ ..c: - ~ +.! ~ '-' 00 '-' 1:1 '-" ..c: (I) ,-...- - ..c: ..c: +.! -...-{
~ +.! ~ ,+.! +.! 00 ! 1-i •' ..c: 00 00 1:1
"" (I) J.-1 '-'' bC ...:..; ·- 1:1 1:1 (I) (I) (I)
~ :::3- •r-l . (I) (I) '...-{ +.! § 3 ~ ..c: (I) ..c: til '0 ...-{ ...-{ '0 c;l ;::3 +.! ..c: +.!
~ (I) 1:1 Ill til
'0 1:1 1:1'-' 00 "" ..c: +.! be 1:1 1-1 (I) Cll 1:1 0 1:1 1-1 ·rl '-" ' Cll 0 1:1 1-1 0 H Cll
(I) bC. c.J (I) (I) be 0 •r-l 0 ..c: l:l. ...-{ Cll J.-1 J.-1 Ill ...-{ "0 +.! -1-l 4-l +.! ..c: Cll c.J ,.!:<! ;::3 Ill ·+.! ...-{ ...-{ -1-l ..c: Ill Ill -1-l 1-1 -1-l ...-{ Ill ...-{ ;::3 00 b.C .0 '0 -1-l +.! ..c: 1:1 1-i Ill
>: w ~ ...-{ H +.! •rl 0 w •r-l c.J 1:1 c.J 4-l b.C "" Ill ~ (I) ~ .1\l ·a Ill 0 Ill ..c: ..c: Q) ·r-l Ill Q) p;! 0 (I)
Cl.l u u I'Ll E-i E-i Cl.l u ::s: ~ ·p:: ...:t ...:t p:: .,._. p:;
M 13 6/19/70 1125 50 695 735 65 90 333 110 115 175 69 Dead M 13 6/19/70 562R 1330 70 690 830 46 95 354 152 145 200 69
w M 13 6/20/70 566R 1250 65' 695 730 65 95 350- 140 136 185 69 M 13 6/2.0/70 :?65L 1280 70 670 790 75 55 355 139 143 215 69 M 13 - 6/20/70 570 1290 80 780 780 71 25 360 152 156' 206 69 M 13 6/21/71 7341 1285 72 780 850 75 85 358 138 138 180 70 Lamb Seg. 8 2mm M 13 6/21/71 7021 70 Blood sample only M 13 7261 Blood sample only M 13 6/7/71 6471 70 Blood sample only M 13 6/6/71 642L 1270 75 772 865 49 1 362 97 95 142 70 M 13 6/6/71 643L- 1200 60 798 800 52 1 344 37 41 102 70 M 13 6/9/71 128 630L 1330 77 735 862 62 5 347 103 104 145 70 M 13 6/11/71 6911 1335 47 752 810 56 30 355 67 66 112 70 Lamb Seg. 30mm M 13 6/15/71 6351 1300 63 695 810 62 20 360 110 100 160 70 Lamb Seg. 50mm M 13 6/15/71 6401 1370 60 748 815 64 35 362 140 129 200 70 iamb Seg. 80mm M 13 6/27/71 7281 70 Blood & pellet
Samples only F 13 6/4/69 56 057R 389 88 68 F 13 6/6/69 033 10 334 N 23 68 F 13 6/6/69 082R 338 N 61 68 F 13 6/12/70 501 1252 60 775 820 70 50 340 N 89 95 102 69
046 F 13 6/13/70 518
049 1180 50 642 710 60 60 333 N 42 42 70 69
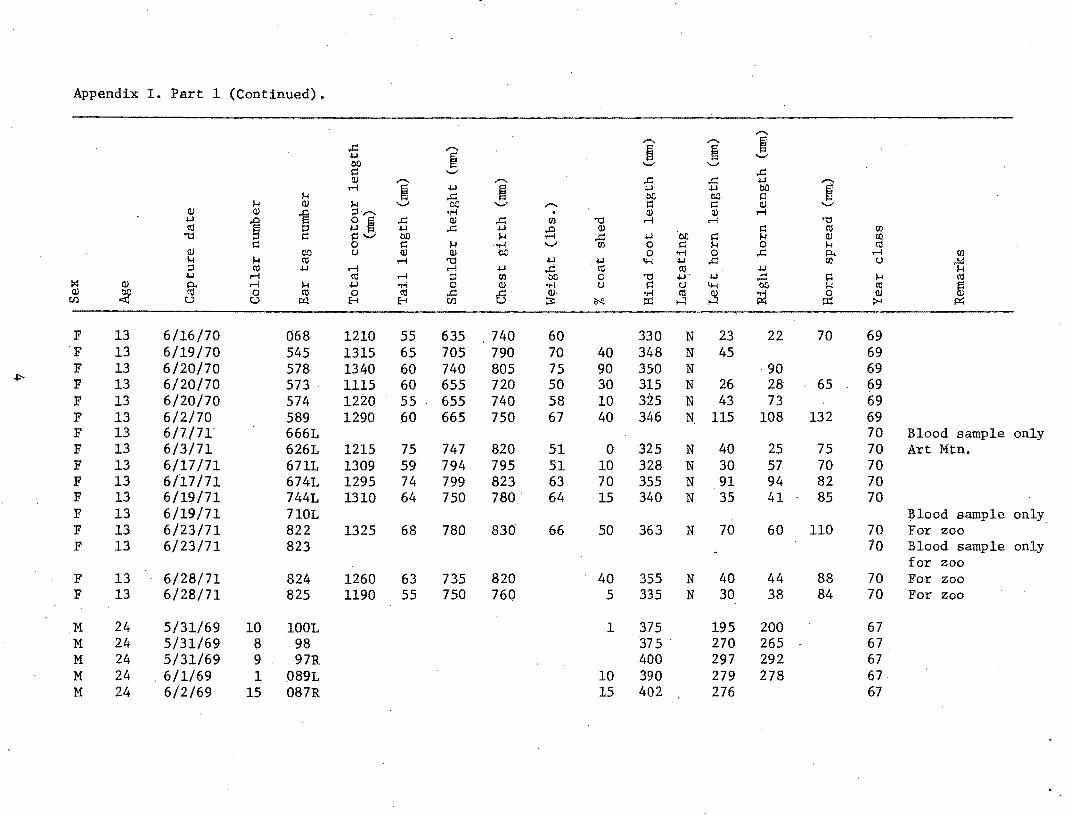
Appendix I. Part 1 (Continued).
....... ....... ....... ~ ..c:: ....... ~ ~ +-I ~· '-"
00 '-" '-" ~ '-" ..c:: Q) ....... ....... ..c:: ..c: +-I
1 r-1 ~ +-I
~ +-I +-I 00. 1-! ..c:: bC eo l=l
1-! Q) 1-! '-" tJ) '-" - l=l ~ Q) '-" Q) Q) ] ;:::1,.-,. •.-! . Q) Q) r-1 +-I
~ ~! ..c:: Q) ..c:: (/) '"0 r-1 r-1 '"0 ro +-I ..c:: +-I
~ Q) l=l ro (/)
'"0 ;:::1 l=l 00 1-! ..c:: +-I ec· l=l 1-! Q) (/)
~ 0 ~ 1-! . .,.; .._, (/) 0 ~ 1-! 0 1-! ro Q) 00 c..J Q) Q) 00 0 •.-! 0 ..c:: p. r-1 (/) 1-! 1-! ro r-1 '"0 +-I ·til IH +-I ..c: (/) c..J ,.!:4 ;:::1 ro +-I r-1 r-1 +-I .c: ro +-I 1-! +-I r-1 ro r-1 ;:::1 (/) 00 0 '"0 +.J• +.J' ..c:: 1=1 1-! ro
:< Q) §' r-1 1-! +-I •.-! 0 Q) .,.; c..J l=l ti 4-! 00 1-! ro ~ Q)
~ 0 ro 0 ro ..c:: tf Q). .,.; ro Q) ~ 0 Q) tl.) u u ~ t-1 t-1 tl.) =s: ~ ;:c H H ::r: >< p:;
F 13 6/16/70 068 1210 55 635 . 740. 60 330 N 23 22 70 69 .F 13 6/19/70 545 1315 65 705 790 70 40 348 N 45 69 F 13 6/20/70 578 1340 60 740 805 75 90 35{) N . 90 69 F 13 6/20/70 573 1115 60 655 720 50 30 315 N 26 28 65 69 F 13 6/20/70 574 1220 55 655 740 58 10 325 N 43 73 69 F 13 6/2/70 589 1290 60 665 750 67 40 346 N 115 108 132 69 F 13 6/7/71. 666L 70 Blood sample only F 13 6/3/71 626L 1215 75 747 820 51 0 325 N 40 25 75 70 Art Mtn. F 13 6/17/71 671L 1309 59 794 795 51 10 328 N 30 57 70 70 F 13 6/17/71 674L 1295 74 799 823 63 70 355 N 91 94 82 70 F 13 6/19/71 744L 1310 64 750 780.· 64 15 340 N 35 41 85 70 F 13 6/19/71 710L Blood sample only F 13 6/23/71 822 1325 68 780 830 66 50 363 N 70 60 110 70 For zoo F 13 6/23/71 823 70 Blood sample only
for zoo F 13 6/28/71 824 1260 63 735 820 40 355 N 40 44 88 70 For zoo F 13 6/28/71 825 1190 55 750 760 5 335 N 30 38 84 70 For zoo
M 24 5/31/69 10 lOOL 1 375 195 200 67 M 24 5/31/69 8 98 375. 270 265 67 M 24 5/31/69 9 97R 400 297 292 67 M 24 . 6/1/69 1 089L 10 390 279 278 67 M 24 6/2/69 15 087R 15 402 276 67
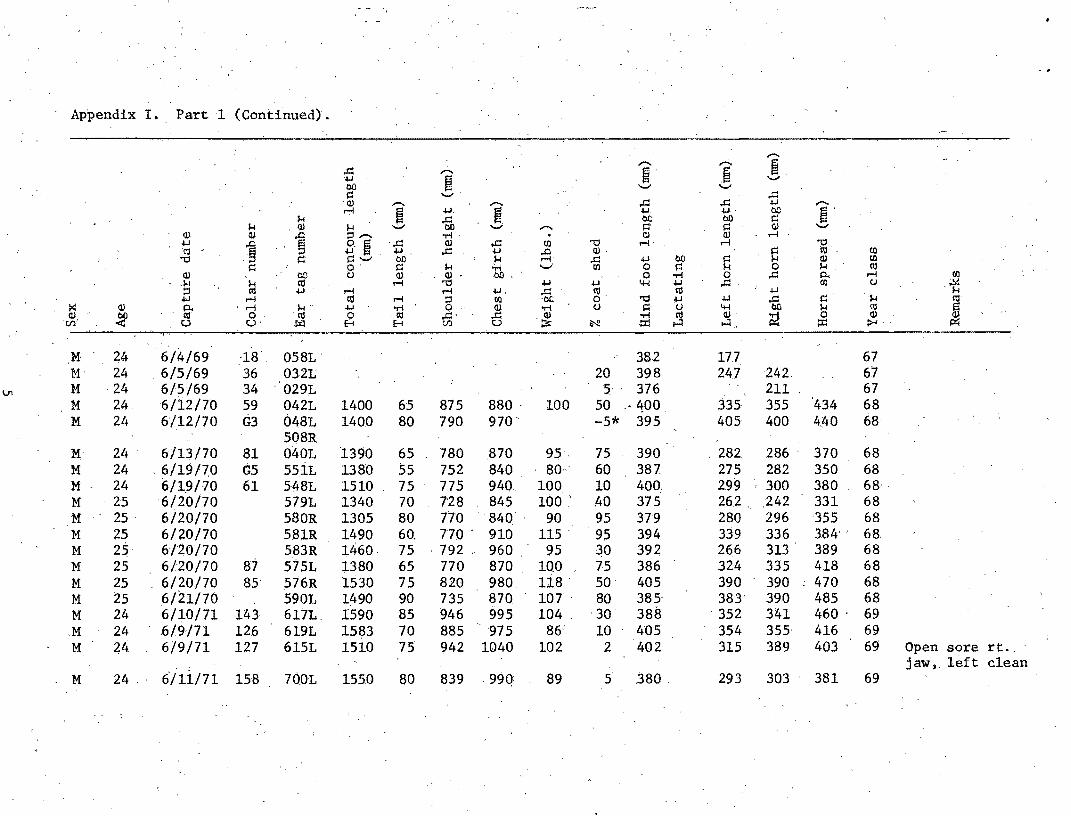
Appendix I. Part 1 (Continued).
,...... - _...;. ~ ..c - ~· .~ ......
~· ......,
00 ......, ......, J:l ......, ' ..c U) ·- - ..c ..c +J -r-l ~
+J. ~. +J +J 00 ~· J.l ..c 00 00 J:l
J.l Q) H ....,; 00 ......, - J:l J:l ' U) -Q), U) 'E ;:I,-.. "ri' . U) U) r-l +J ] 0. ~ ..r::: U) ..c Cl.l '"0 r-l ' r-l '"0 '(\) :;::1 +J +J, ..c +J ..c Q) . J:l co. Cl.l '"0 J:l ~"""' 00 H r-l ..c +J 00 ~ H U) Cl.l
~ o· ~ H -i-1 """' Cl.l 0 ~ H 0 H. (\) U) 00 (.) U) . U) ' .oo ' 0 "r"i 0 ..c P< r-l .CI.)
.1-1 H ct1 r-l '"0 +J +J '-1-1 +J ..c Cl.l u· ~ :;::1 Cll +J r-l r-l +J. ..c ct1 ct1 +J 'I-I +J r-l ct1 r-l :;::1 Cl.l ·or: o· '"0 ,1-J +J ..c ~ H ct1
:< U) p.. ' r-l H .. +J •r-i o. U) "r"i (.) ~· (.) 4-l 00 H (\) s U) ~ Cll 0 ct1 0 .(\) ..c· ..c U) "r"i ct1 U) p;t 0 U)
·oo· 0 0 ~ 8 E-t Ul 0 !3: ~ ·::C: ...:l ....:1. p:: >'
M 44 6/4/69 ·18' 058L. 382 17.7 67 M· 24 6/5/69 36 032L 20 398 247 242 61
Vt M 24 6/5/69 34 . 029l 5.· 376 211 67 M 24 6/l2/70 59 042L 1400 65 875 880' 100 50 ·' 400 335 355 434 68. M 24 6/,12/70 G3 048L 1400 80 790 970 -5* 395 . 405 400 4.40 68
508R M 24 . 6/13/70 81 040L 1390 65 780 .870 95' 75 390 ' 282 286 ' 370 68 M 24 . 6/19/70 G5 551L 1380 55 752 840 8o· 60 38 7. 275 282 350 68 M 24 6/1.9/70 . 61 548L 1510 75 775 940. 100 10 400 299 300 380 68· M 25 6/20/70 57.9L 1340 70 728 845 100 ' ,40 375 262' 242 331 68 M 25. 6/20/70 58 0R 1305 80 no 840.' 9Q 95 379 280 296 355 68 M 25 6/20/70 581R 1490 60. 770' 910 115 95 394 339 336 384'' 68 M 2.5 6/20/70 583R 1460. 75 . 792 ' 960 95 30 392 2~6 313 389 68 M 25 6/20/70 87 515L 1380 65 770 870 lQO 75 386 324 335 418 68 M 25 . 6/20/70 85' 576R 1530 75 820 980 li8 so· 405 390 390 470 68 M 25 6/21/70 590L 1490 90 735 870 107'' 80 385 383 390 485 68 M 24 6/10/71 143 617L. 1590 85 946 995 104 30 388 '352 341 460' 69 .M 24 .6/9/71 126 619L 1583 70 885 975 86 10 405 354 355 416 69 M 24 6/9/71 127 615L 1510 75 942 1040 102 2 402 315 389 403 69 Open sore rt ..
jaw, left clean M 24. 6'/li/71 158 70.0L 1550 80 839 99Q 89 5 380 293 303 ' 381 69 .
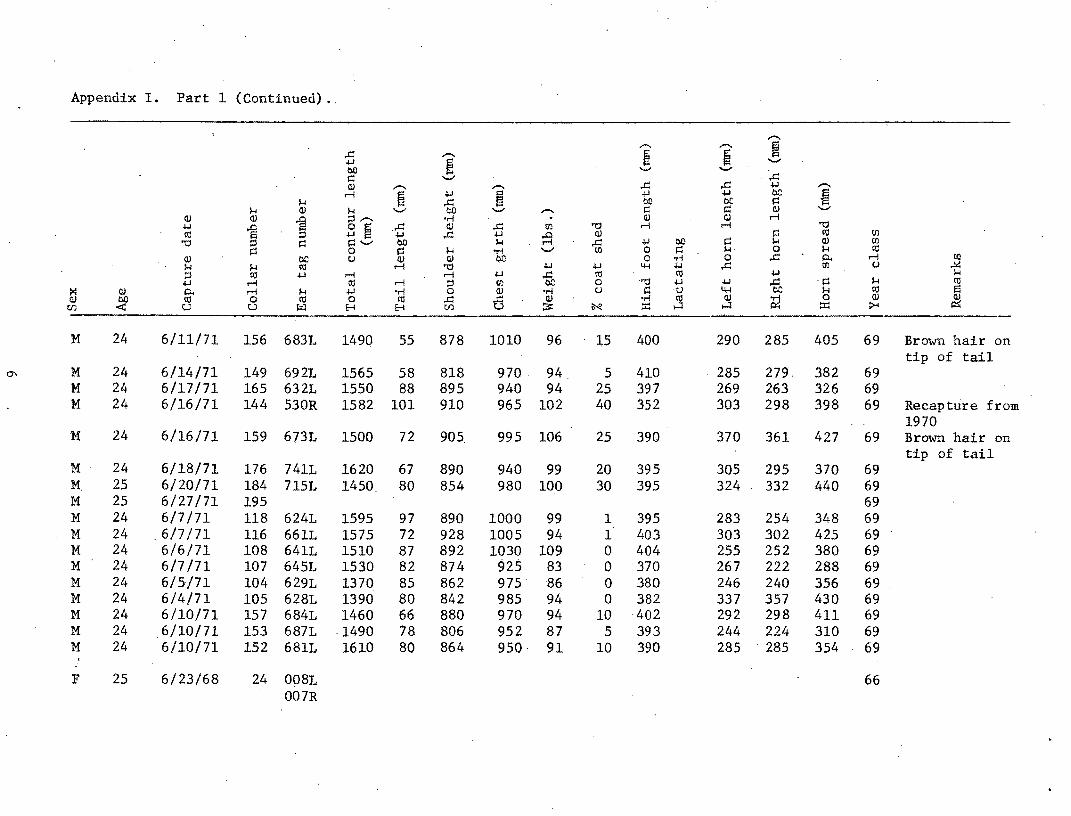
Appendix I. Part 1 (Continued) ..
-,-... - ~ ..c - ~ ~ .w ~ ..._,
00 '-' '-' ·..c s:: ..;...; Q) - - .c:: ..c .w -l'""i ~ .w ~
.w .w bC ~ ).; ..c bO oc s:: ).; Q) ).; ..._, c.o '-' - >:: s:: Q) '-'
Q) Q)
~ ;:l,-., •r-i . OJ Q) l'""i
.w ~ B ~ . ..C Q) ..c rJl '0 l'""i l'""i '0
Cll ;:l .w ..c .w ~ Q) s:: Cll rJl
'0 ;:l s:: S::'-' 00 ).; ..c .w bO s:: ).; Q) rJl
s:: 0 s:: ).; ..,., -......; rJl 0 s:: ).;. 0 ).; Cll Q) bO (.) Q) Q) bO 0 ·r-l 0 ..c p. l'""i rJl ).; ).; Cll l'""i '0 .w .w 4-l .w ..c rJl (.) ,.!<! ;:l Cll .w l'""i l'""i .w ..c Cll Cll .w ).;
.w l'""i Cll l'""i ;:l rJl bC 0 ·'\j .w .w ..c ·s:: ).; Cll :< Q) 0. l'""i ).; .w •r-i 0 Q) ..,., (.) !=: ·U 4-l bC ).; Cll s Q)
~ Cll 0 Cll 0 Cll ..c 6 Q) .,.; Cll Q) ~ 0 Q) ~ r:n u u J;:t:l E-1 E-1 r:n ;3:: ~ ::n ...:I ...:l :::c: :>-<
M 24 6/11/71 156 683L 1490 55 878 1010 96 15 400 290 285 405 69 Brown hair on tip of tail
(j\ M 24 6/14/71 149 692L 1565 58 818 970. 94 5 410 285 279. 382 69 M 24 6/17/71 165 632L 1550 88 895 940 94 25 397 269 263 326 69 M 24 6/16/71 144 53 0R 1582 101 910 965 102 40 352 303 298 398 69 Recapture from
1970 M 24 6/16/71 159 673L 1500 72 905. 995 106 25 390 370 361 427 69 Brown hair on
tip of tail M 24 6/18/71 176 741L 1620 67 890 940 99 20 395 305 295 370 69 M. 25 6/20/71 184 715L 1450. 80 854 980 100 30 395 324 332 440 69 M 25 6/27/71 195 69 M 24 6/7/71 118 624L 1595 97 890 1000 99 1 395 283 254 348 69 M 24 . 6/7/71 116 661L 1575 72 928 1005 94 1 403 303 302 425 69 M 24 6/6/71 108 641L 1510 87 892 1030 109 0 404 255 252 380 69 M 24 6/7/71 107 645L 1530 82 874 925 83 0 370 267 222 288 69 M 24 6/5/71 104 629L 1370 85 862 975 86 0 380 246 240 356 69 . M 24 6/4/71 105 628L 1390 80 842 985 94 0 382 337 357 430 69 M 24 6/10/71 157 684L 1460 66 880 970 94 10 402 292 298 411 69 M 24 . 6/10/71 153 687L ·1490 78 806 952 87 5 393 244 224 310 69 M 24 6/10/71 152 681L 1610 80 864 950 91 10 390 285 . 285 354 69
F 25 6/23/68 24 008L 66 007R

Appendix I. Part 1 (Continued).
.-.. .-.. .-.. ~ ..c: ,-.. ~ ~· .j..l
~ ........ 00 '-" '-" r::: '-" ..c: Q) ,-.. ,-.. ..c: ..c: .j..l -r-1 ~
.j..l
~ .j..l .j..l bO ~ "' ..c: bO bC r:::
"' Q) "' '-" bC ........ ,-.. r::: r::: Q) '-" Q) Q)
~ ::l.-.. •r-l . Q) Q) r-1 .j..l
~ 3 ~ ..c: Q) ..c: til "1:1 ,...., ,...., "1:1 ell ::l .j..l ..c: .j..l ;::j Q) r::: t1l. .til
"1:1 ::l r::: Cl'-" bO "' ..c: -1-1 00 r::: "' Q) til .r::: 0 r::: "' •r-1 .....; til o· r::: !-1 0 !-1 t1l
Q) bC C) . _Q) Q) 00 0 •r-l 0 ..c: p.. ,...., til
"' "' ro ,...., "1:1 -1-1 .+.l 1.!-! .j..l ..c: til c.>. 11 ::l ro .j..l ,...., r-1 -1-1 ..c: ro ro -1-1 .j..l r-1 ro r-1 ::l til 00 0 "1:1 -1-1 -1-1 ..c: r::: !-1 ro
:< Q) p. ,...., "' .j..l '!'"! 0 Q) '!'"! C) r::: C) 1.!-! bC "' t1l w Q)
~ ell 0 ell 0 ro ..c: a Q) '!'"! ro Q) p{ 0 Q) (/) u u l'r-1 E-l E-l (/) ~ ~ ::r: ..:t ..:t ::r: >< >XI
F 25 6/23/68 22 66 '-l
F 25 6/23/68 26 y 66 F 24 5/30/69 7 028L 1 375 N 150 140 67 F 24 5/31/69 5 026 360 125 67 F 24 6/2/69 12 095R 10 114 115 67 F 24 6/3/69 19 077L 360 122 67 F 24 6/3/69 57 081L 376 121 67 F 24 6/6/69 51 031 5 357 N 112 67 F 24 6/13/70 84 514L 1370 75 .762 860 75 -5* 360 N 142 134 90 68
092R F 24 6/17/70 536R 1370 60 795 850 90 90 365 N 158 13.5 145 68 F 24 6/18/70 68 538R 1340 75 770 810 70 -5* 365 y 142 140 140 68 F 24 6/18/70 72 539R 1420 75 751 840 85 85 376 N 125 150 150 68 F 24 6/18/70 54.4L 1455 60 815 880 95 80 375 N 141 170 180 68 F 24 6/19/70 553L 1450 75 770 870 90 . -5* 365 N 147 140 165 68 F 25 6/20/70 657R 1480 80 771 890 110 . 40 378 N 165 160 156 68 F 25 6/20/70 563L 1320 50 770 860 80 -5* 368 y 130 165 68 F 25 6/20/70 569L 1410 70 710 860 81 5 367 y 145 154 170 68 F 24 6/6/71 112 518 1350 75 785 ... 950 62 0 356 N 105 77 108 69 ~ecapture
F 24 6/6/71 110 650L 1490 115 865 980 104 0 387 N 135. 180 187 69 F 24 6/3/71 103 627L 1360 80 820 890. 80 2 360 N 138 125 180 69 Art Mtn. F 24 6/10/71 142 620L 1290 70 875 920 85 30 366 N 120 145 115 . 69 Both jaws
moderate swelling

Appendix I. Part 1 (Continued).
,....._ ,-.... ,....._
~ ..c ,..._ ~ ~ +-1 ~
......... bO" '-" '-" 1=1 ........ ..c Q.) ,..._ ,..._ ..c ..c +-1 ,....._
..--1 ! +-1 ~ +-1 • +-1 bO ~ H ..c bO ti.C 1=1 H Q.) H ti.C ~ " ,..._ 1=1 ~ Q.) .._,
Q.) Q.)
~ ;::l,..._ -r-1 . Gl Q.) ..--1
+-1 ~ B ~ ..c Q.) ..c (li "0 ..--1 ..--1 "0
co ;::l +-1 ..c +-1 ~ Q.) 1=1 co r]J
"0 ;::l 1=1 ~=!'-" bO H ..c +-1 bO 1=1 H Q.) rJl 1=1 0 1=1 H ·rl ........ (li 0 1=1 H 0 H co
Q.) bO C) Q.) Q.) bO 0 •rl 0 ..c p. ..--1 rJl H H co ..--1 "0 +-1 +-1 1.!-4 +-1 ..c (li C) " ;::l co +-1 ..--1 ..--1 +-1 ..c co co +-1 ~ +-1 ..--1 co ..--1 ::l rJl bt 0 "0 +-1 +-1 ..c 1=1 H co
:< Q.) p. ..--1 H +-1 ....... 0 Gl •rl C) ~ C) 1.!-4 b:) H Cll w Q.) ~ co 0 co 0 co ..c ..c ~ ·rl co Q.) ;;;! 0 Q.)
tr.l u u til C-l C-l tr.l u !N! ::tl ...:1 ...:1 lJ:l :><· ~
F 24 6/10/71 145 611L 1450 80 832 905 65 -10 370 N 147 149 175 69 F 24 6/8/71 130 6231 1355 61 870 940 80 0 388 N 157 165 195 69 Both jaws slight
swelling F 24 6/8/71 122 6641 1375 87 880' 900 81 1 362 N 157 166 215 69 F 24 6/17/71 133 6791 1380 85 . 850 866. 70 35 355 N 100 76 92 69 Slight swelling
left jaw F 24 6/17/71 166 695L 1335 74 861 845 81 80 360 N 153 150 192 69 Slight swelling
right jaw F 24 6/18/71 174 7371 1395 85 832 860 73 40 355 N 75 104 122 69 F 25 6/23/71 191 745L 69 Blood and pellet
samples only, two sores left shoulder
F 25 6/23/71 192 7031 y 69 Blood and pellet samples, only
F 25 6/23/71 162 7311 69 Blood and pellet samples, only
F 25 6/23/71 190 7081 69 Pellet sample, only
M 36 6/17/70 . 65 5371 1465 55 818 880 110 30 395 431 435 495 67 Q88R
M 36 6/19/70 89 5521 1480 80 870 970 130 90 410' 465 468 475 67
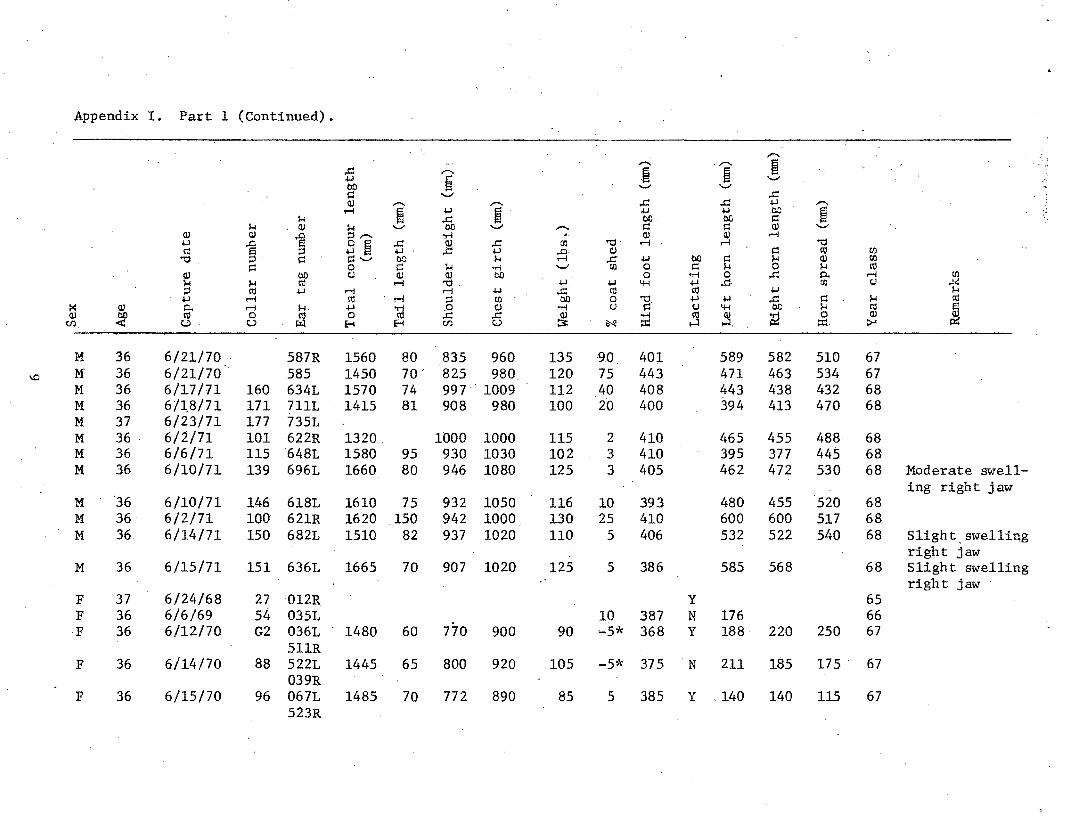
Appendix I. Part 1 (Continued).
,...... ,...... . ,.....
~ ..c:: ,...... ·~ ~ ~ ~· ......-
I'J!l ......- ......-c ......- ..c:: Q) ,..... ,-.... ..c:: ..c:: ~ ,......
....-! ~ ~ ~· ~ ~ co ~ H ..c:: bC ()() c
l-1 Q) l-1 '-' 00 ......- - c l:::l Q) ......-Q) Q) ·..c. ::::~- Tl . Q) Q) ....-! ~ § 9 B ~ .c Q) .c (jj "0 ....-! r-1 "0 til ~ ,.t: ~ :::l Q) c til (jj
"0. c C'-' co l-1 ..c:: ~ 00 l:::l l-1 Q) (jj
c 0 c l-1 •r-l '-' (jj 0 c l-1 0 l-1 til Q) 00 tJ Q) Q) co 0 •r-l 0 .c p. ....-! (jj
l-1 l-1 til ....-! "0. ~ ~ 4-; ~ ..c:: (jj tJ ~ ::I til ~ ....-! ....-! ~ .c til til ~ l-1 ~ ....-! til . .-1 ::I (jj 00 0 '"0. ~ -1.1 .c c l-1 rC
:< Q) p. ....-! !-1. ~ Tl .0 Q) •r-l (.) c tJ 4-; bC l-1 til s Q)
~ til 0 til 0 td ..c:: .c ~ •r-l til Q) ;g 0 Q) Q)
CJ:l u. u ~ E-1 E-1 CJ:l u ~ ::c ....::1 ...:l. ::c :>< p:::
M 36 6/21/70 . 587R 1560 80 835 960 135 90 401 589 582 510 67 M 36 6/21/70 585 1450 70' 825 980 120 75 443 471 463 534 67 M 36 6/17/71 160 634L 1570 74 997 1009 112 40 408 443 438 432 68 M 36 6/18/71 171 7111 1415 81 908 980 100 20 400 394 413 470 68 M 37 6/23/71 177 7351 M 36 6/2/71 101 622R 1320 1000 1000 115 2 410 465 455 488 68 M 36 6/6/71 115 648L 1580 95 930 1030 102 3 410 395 377 445 68 M 36 6/10/71 139 696L 1660 80 946 1080 125 3 405 462 472 530 68 Moderate swell-
ing right jaw M 36 6/10/71 146 6181 1610 75 932 1050 116 10 393 480 455 520 68 M 36 6/2/71 100 621R 1620 .150 .942 1000 130 25 410 600 600 517 68 M 36 6/14/71 150 682L 1510 82 937 1020 110 5 406 532 522 540 68 Slight. swelling
right jaw M 36 6/15/71 151 636L 1665 70 907 1020 125 5 386 585 568 68 Slight swelling
right jaw F 37 6/24/68 27 012R y 65 F 36 6/6/69 54 035L 10 387 N 176 66 F 36 6/12/70 G2 036L 1480 60 770 900 90 --5* 368 y 188 220 250 67
·511R F 36 6/14/70 88 522L 1445 65 800 920 105 -5* 375 N 211 185 175. 67
039R F 36 6/15/70 96 0671 1485 70 772 890 85 . 5 385 y .140 140 115 67
523R
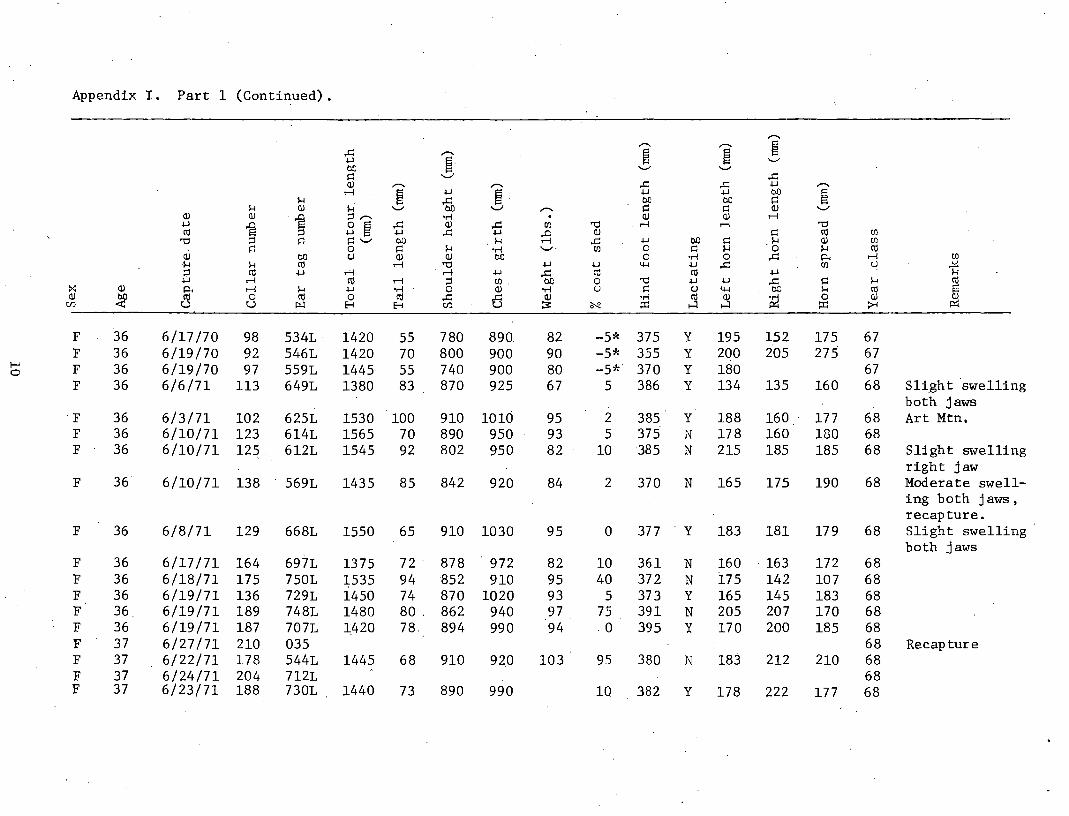
Appendix I. Part 1 (Continued).
..--.. ......._ ..--.. ~ ,..c: ..--.. ~ ~ .1-J . ~· '-" b!) '-" '-' l=l "-../ ,..c: Q) ..--.. ..--.. ,..c: ,..c: .1-J ..--..
r-i § .1-J ~
.1-J .1-J b!)
~ 1-l ,..c: bO bC l=l 1-l Q) 1-i '-' b!) "-../ ..--.. l=l l=l Q) '-"
Q) Q) § ;:::l..-.. •r-i . Q) Q) r-i .1-J
~ B ~ ,..c: Q) ,..c: 00 '"0 .r-i r-i '"0 C1j .1-J ,..c: .1-J ..c Q) l=l r:O 00
'"0 ;:::l l=l l=l'-' co .1-l r-i ,..c: .1-J bO l=l 1-l Q) 00 l=l 0 l=l 1-l ·r-i '-'' 00 0 l=l 1-i ·o 1-l r:O
Q) b!) CJ Q) Q) bO 0 ·r-i 0 ,..c: p.. r-i 00 1-l 1-l C1j r-i '"0 .1-J .1-J l+-l .1-J ,..c: 00 CJ ~ ;:::l r:O .1-J r-'-1 r-i .1-J ,..c: r:O r:O .1-J 1-l
.1-J r-i r:O r-i ;:::l 00. b!) 0 '"0 .1-J .1-J ,..c: I=: 1-l r:O :><: Q) p.. r-i 1-l .1-J ·r-i 0 Q) 'r-i CJ l=l CJ l+-l bC 1-l C1j @ Q)
~ r:O 0 r:O 0 r:O ,..c: 6 Q) •r-i r:O Q) p;j 0 Q) U) u u ~ H H U) ::::: ~ ::r:: .....:t .....:t ::r: :>-< p::<
F 36 6/17/70 98 534L · 1420 55 780 890. 82 -5* 375 y 195 152 175 67 F 36 6/19/70 92 546L 1420 70 800 900 90 -5* 355 y 200 205 275 67
I-' F 36 6/19/70 97 559L 1445 55 740 900 80 -5* 370 y 180 67 0
F 36 6/6/71 113 649L 1380 83 870 925 67 5 386 y 134 135 160 68 Slight swelling both jaws
F 36 6/3/71 102 625L 1530 100 910 1010 95 2 385 y 188 160 . 177 68 Art Mtn. F 36 6/10/71 123 614L 1565 70 890 950 93 5 375. N 178 160 180 68 F 36 6/10/71 125 612L 1545 . 92 802 950 82 10 385 N 215 185 185 68 Slight swelling
right jaw F 36 6/10/71 138 569L 1435 85 842 920 84 2 370 N 165 175 190 68 Moderate swell-
ing both jaws, recapture.
F 36 6/8/71 129 668L 1550 65 910 1030 95 0 377 y 183 181 179 68 Slight swelling both jaws
F 36 6/17/71 164 697L 1375 72 . 878 972 82 10 361 N 160 . 163 172 68 F 36 6/18/71 175 750L 1535 94 852 910 95 40 372 N i75 142 107 68 F 36 6/19/71 136 729L 1450 74 870 1020 93 5 373 y 165 145 183 68 F 36 6/19/71 189 748L 1480 80. 862 940 97 75 391 N 205 207 170 68 F 36 6/19/71 187 707L 1420 78 894 990 94 0 395 y 170 200 185 68 F 37 6/27/71 210 035 68 Recapture F 37 6/22/71 178 544L 1445 68 910 920 103 95 380 N 183 212 210 68 F 37 6/24/71 204 712L 68 F 37 6/23/71 188 730L 1440 73 890 990 10 382 y 178 222 177 68
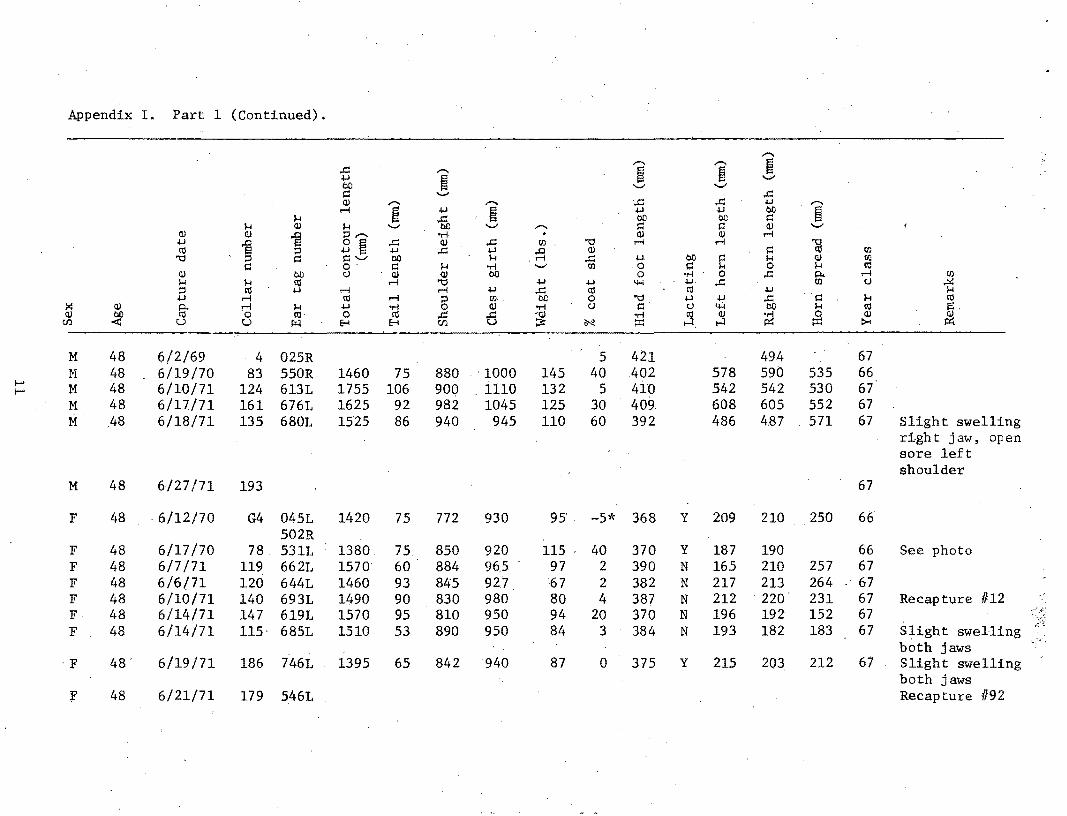
Appendix I. Part 1 (Continued).
,....,. ,....,. ,....,.
~ .c ,....,. ~ ~ +l ~
....... 00 ....... ....... l=l ......... .c (]) ,....,. ,...... .c .c +l ,......
...-I ~ +l ~ +l -!.J 00 . ~ 1-1 § 00 OJ:; l=l
1-1 (]) 1-1 ....... ......... ,..... l=l 1=1 (]) ......... (]) (])
~ ;:I,-.. •r-i . (]) QJ ...-I
+l ~ 3 ~ .c (]) .c {/), ""d ...-I ...-I ""d
C'O ;:I -!.J .c +l ::1 (]) >:: C'O {/)
""d ;:I l=l .:: ....... 00 1-1 .c -!.J 00 1=1 1-1 (]) CJl l=l o· l=l 1-1 •r-i ..__; {/) .o l=l 1-4 0 1-1 C'O
(]) 00 C) (]) <l) 00 0 •r-i 0 .c p. ...-I {/)
1-1 1-1 C'O ...-I "0 +l -!.J 4-1 -!.J. .c {/) C) ~ ;:I C'O -!.J ,...., ...-I -!.J .c ttl C'O -!.J 1-1 +l ,...., C'O ,...., ;:I {/). Ol) 0 "0 -!.J -!.J .c l=l 1-1 C'O
X (]) ~
,...., 1-1 +l .,., 0 (]) .,., C) >:: C) ~ 00 1-1 ttl !=i. (])
~ 0 ttl· 0 C'O .c 6 -·(]) •r-i C'O QJ ;:;1 0 (]) 3a tf.l u u r:LI E-l E-l tf.l ::>: IN! ;:I:: H ...:l ;:I:: :>-<
M 48 6/2/69 4 025R 5 421 494 67 M 48 6/19/70 83 550R 1460 75 880 ·1000 145 40 .402 578 590 535 66
1-' M 48 6/10/71 124 613L 1755 106 900 1110 132 5 410 542 542 530 67. 1-'
M 48 6/17/71 161 676L 1625 92 982 1045 125 30 409 608 605 552 67 M: .48 6/18/71 135 680L 1525 86 940 945 110 60 392 486 4.87 571 67 Slight swelling
right jaw, open sore left shoulder
M 48 6/27/71 193 67
F 48 6/12/70 G4 045L 1420 75 772 930 95' -5* 368 y 209 210 250 66 502R
F 48 6/17/70 78 531L 1380 75 850 920 115 40 370 y 187 190 66 See photo F 48 6/7/71 119 662L 1570 60 884 96.5 97 2 390 N 165 210 257 67 F 48 6/6/71 120 644L 1460 93 845 927 67 2 382 N 217 213 264 67 F 48 6/10/71 140 693L 1490 90 830 980 80 4 387 N 212 . 220. 231 67 Recapture //12 F 48 6/14/71 147 619L 1570 95 810 950 94 20 370 N 196 192 152 67 F 48 6/14/71 115· 685L 1510 53 890 950 84 3 384 N 193 182 183 67 Slight swelling
both jaws ·F 48" 6/19/71 186 746L 1395 65 842 940 87 0 375 y 215 203 212 67 Slight swelling
both jaws f 48 6/21/71 179 546L Recapture /192
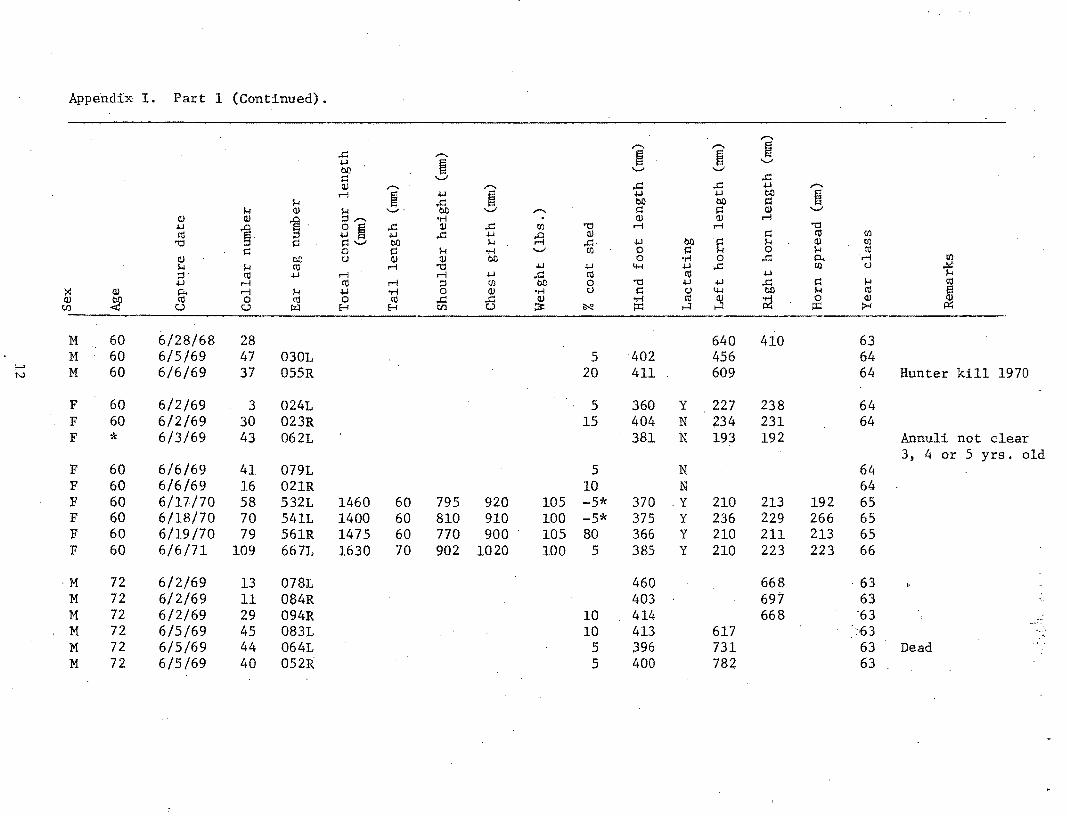
Appendix I. Part 1 (Continued).
,.-... ,.-... ,.-...
~ ..c: ,.-... ~ ~ -1-1 ~ .........
00 ......... ......... r:: ......,; ..c: QJ ,.-... ,-... ..c: ..c: -1-1 ,.-...
,....; ~
-1-1 ~ -1-1 -1-1 00 ~ l-; ..c: 00 00 l=l
l-; QJ l-; ......... ' 00 ......,; ,.-... l=l l=l QJ ......,; QJ QJ
~· ::l,.-... •r-1 . QJ QJ ,....;
-1-1 ~. E ~ ..c: QJ ..c: Ul "0 ,....; ,....; "0 co -1-1 ..c: -1-1 ~· OJ r:: co Ul
"0 ::l l=l l=l'-" eo I-< ..c: -1-1 00 r:: H OJ Ul r:: 0 r:: H .,.., '-" Ul 0 l=l l-; 0 H co
OJ en C) QJ OJ 00 0 -r-1 0 ..c: p.. ,....; Ul H H co ,....; "0 -1-1 -1-1 4-1 -1-1 ..c: Ul C) ..!<: ::l co -1-1 ,....; ,....; -1-1 ..c: co co -1-1 H -1-1 ,....; co r-1 ::l Ul 00 0 "0 -1-1 -1-1 ..c: l=l H co
:< QJ ~ r-1 H -1-1 -r-1 0 QJ .,.., C) l=l C) 4-1 00 1-1 co 13
OJ ~ 0 co 0 co ..c: ..c: QJ -r-1 co OJ ;g 0 QJ ~ U) c.:> c.:> J;J:.1 E-! E-! U) u !3: ~ ::r: ....:! ....:! ::r: :>-<
M 60 6/28/68 28 640 410 63 M 60 6/5/69 47 030L 5 ·402 456 64
f-' M 60 6/6/69 37 055R 20 411 609 64 Hunter kill 1970 N
F 60 6/2/69 3 024L 5 360 y 227 238 64 F 60 6/2/69 30 023R 15 404 N 234 231 64 F * '6/3/69 43 062L 381 N 193 192 Annuli not clear
3, 4 or 5 yrs. old F 60 6/6/69 41 0791 5 N 64 F 60 6/6/69 16 021R 10 N 64 F 60 6/17/70 58 5321 1460 60 795 920 105 -5* 370 .Y 210 213 192 65 F 60 6/18/70 70 5411 1400 60 810 910 100 -5* 375 y 236 229 266 65 F 60 6/19/70 79 561R 1475 60 770 900 105 80 366 y 210 211 213 65 F 60 6/6/71 109 667L 1630 70 902 1020 100 5 385 y 210 223 223 66
M 72 6/2/69 13 078L 460 668 . 63 M 72 6/2/69 11 084R 403 697 63 M 72 6/2/69 29 094R 10 414 668 '63 M 72 6/5/69 45 083L 10 413 617 ':63 M 72 6/5/69 44 064L 5 396 731 63 Dead M 72 6/5/69 40 052R 5 400 782 63

Appendix I. Part 1 (Continued).
,-...
'i ',-... m ,.c:: ,-... m +J m '-"
00 '-" '-" 1:1 '-" '
,.c:: OJ ,-... ..-... ,.c:: ,.c:: oi.J ..-...
..-1 m oi.J ~ +J +J 00 ! f.-1 ~ 00 ·00 1:1
1-1 OJ 1-1 '-" '-" ' ,-... 1:1 s:: OJ
OJ OJ ~ ;::1,-... ..-! . OJ OJ ..-1
oi.J il 3 ~ ,.c:: OJ ,.c:: ell "tl ;--! ..-1 "tl ·Cil ' ;::l +J ,.c:: +J ~ OJ 1:1 Cll ell "tl ;::l 1:1 1=1'-" 00 1-1 ,.c:: '+J 00 1:1
""' OJ ell
1:1 0 1:1 ""'
•r-t' '-" ell 0 1:1 lo-1 0 1-1 Cll OJ ', 00 CJ OJ OJ 00 0 ..-! 0 ,.c:: p. ..-1 ell
lo-1 lo-1 Cll ..-1 "tl oi.J +J 4-1 oi.J ,.c:: ell CJ ~ ;::1 Cll oi.J ..-1 ..-1 oi.J ,.c:: Cll Cll oi.J 1-1 +J ..-1. Cll ..-1 ;::1 ell 00 0 "tl oi.J +J ,.c:: 1:1 lo-1 Cll
X OJ 0. ..-1 ~ +J •r-t 0 OJ ..-! (J s:: (J 4-1 00 lo-1 SCI E Q) ~ Cll O· 0 Cll .,.C:: t5 ~
..-! Cll OJ P:1 '0 Q) ~ tf.l u u r:x:l E-l E-'1 tf.l ~ ;:x::. ..:I ...::1 ::X:: :>-<
F 72 6/2/69 14 086L 400 y 211 210 63 F 72 6/3/69 32 15-20 370 N 259 63
f-' F 72 6/4/69 20 056L 391 205 6;3 w F 72 6/6/69 31 OllL 5 y 63 F 72 6/6/69 38 080R 10 y 63 F 72 6/12/70 . G6 043L 1525 75 870 960 110 -5* 380 y 294 326 314 64
505R F 72 6/14/70 86 OSOL 1535 85 789 940 115· -5* 390 y 225 234 64
519R F 72 6/17/70 82 528L 1465 50 815 885 105 -5* 385 y 215 215 225 64 F 72 '6/18/70 69 542L 1570 70 830 935 120 30 372 y 215 215 175 64 F 72 6/18/70 67 543L 1560 60 800 900 100 5 370 ·y 199 170 140 64 F 72 6/19/70 66 547L 1535 65 820 940 101 10 365 y 240 230 212 64 F 72 6/19/70 63 56 0R 1485 so 790 970 115 ... 5* 380 y 273 250 395 64 f· 72 6/19/70 75 557L 1405 70 750 850 85 5 343 y 248 254 190 64 F 72 6/20/70 564R 1410 65 770 880 95 -5* 360 y 221 213 155 64 F 72 6/21/70 586R 1510 80 766 915 111 5 372 y 217 226 197 64 F 72 6/11/71 154 699R 1540 55 842 1020' 98 2 377 N 236 232 268 65 Major swelling
with open sore right jaw Recapture 1170
F 72 6/16/71 163 637L 1460 68 920 ' 925 92 ' 20' 365 N 210 203 162 65 Large swelling right jaw, open sore
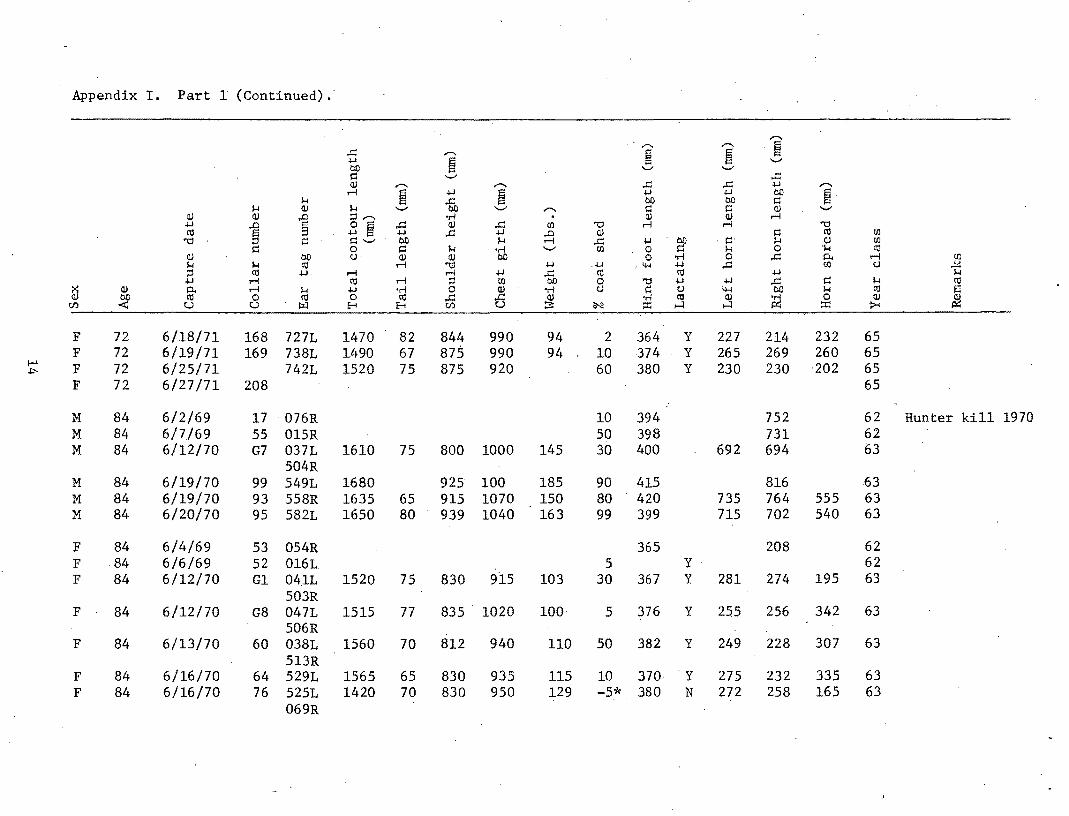
Appendix I. Part 1 (Continued).·
"'""' ,..._
..c: ,..._ ~ § +-' § 0.0 '-' '-"
r:: '-" ..c: (]) ,...... ,-.. ..c ..c: +-' ,-..
,--; § +-' § +-' +-' 0.0 ~ "" -Eb 0.0 0.0 r:: H (]) "" '-" '-" ,...... c: r:: (]) '-"
(]) (]) ..0 ;:l..-.. •.-i . Q) (]) ,--; +-' il 9 3 ~ ..c: (]) ..c: Ul "0 r-1 ,--; "0 \"d +-' ..c: +-' ..0 (]) r:: \"d Ul
"0 ::l r:: r::'-" 0.0 "" ,--; ..c: +J ' 0.0 ' r::· H (]) Ul
r:: 0 r:: "" '•.-i '-' Ul 0 r:: "" 0 "" Cll (]) 0.0 C) (]) (]) 0.0 0 •.-i 0 ..c: p. ,--; Ul
"" "" Cll ,--; "0 +J +J .~ +J ..c: 00 C) ~ ::l \"d +J ,--; ,--; +J ..c: Cll Cll +J "" +J ,--; \"d ,--; ::l 00 0.0 0 't:l +-' +J ..c: r:: "" Cll
X (]) p. ,--; "" +J •.-i 0 (]) ·.-i C) c: C) 4-l oc "" \"d El
(]) :1 \"d 0 Cll 0 Cll ..c: ..c: (]) .,.; Cll (]) ~ 0 (])
~ UJ u u IJ:l E-1 E-1 UJ u ::;: ON! p:: ~ ~ ::c: ><
F 72 6/18/71 168 727L 1470 82 844 990 94 2 364 y 227 214 232 65 F 72 6/19/71 169 738L L490 67 875 990 94 10 374 y 265 269 260 65
1-" F 72 6/25/71 742L 1520 75 875 920 60 380 y 230 230 ·202 65 .1:'-
F 72 6/27/71 208 65
M 84 6/2/69 17 · 076R 10 394 752 62 Hunter kill 1970 M 84 6/7/69 55 015R 50 398 731 62 M 84 6/12/70 G7 037L 1610 75 800 1000 145 30 400 692 694 63
504R M 84 6/19/70 99 549L 1680 925 100 185 90 415 816 63 M 84 6/19/70 93 558R 1635 65 915 1070 150 80 420 735 764 555 63 M 84 6/20/70 95 582L 1650 80 939 1040 163 99 399 715 702 540 63
F 84 6/4/69 53 054R 365 208 62 F 84 6/6/69 52 016L 5 y 62 F 84 6/12/70 Gl 04JL 1520 75 830 915 103 30 367 y 281 274 195 63
503R F 84 6/12/70 G8 047L 1515 77 835 1020 100· 5 376 y 255 256 342 63
506R F 84 6/13/70 60 038L 1560 70 812 940 110 50 382 y 249 228 307 63
513R F 84 6/16/70 64 529L 1565 65 830 935 115 10 370 y 275 232 335 63 F 84 6/16/70 76 525L 1420 70 830 950 129 -5* 380 N 272 258 165 63
069R

Appendix I. Part t (Continued).
,.....,.
1 ,.....,.
·~ ..c: ,.....,. ~ .j..J
~· .......... 00 ~- .......... l=l .......... ..c: Q) ,.....,. ,.....,. ..c: ..c: .j..J ,.....,.
.-i ~· .j..J
~ .j..J .j..J 00 ~ 1-4.· ,.C:· 00 ·oc l=l
1-4 Q) 1-4 .......... on .......... ,.....,. l=l l=l Q) ·~ Q) Q)
1 ;:l,-... •rl ... Q) Q) .-i .j..J ,.o· ~ § ..c: Q)' ..c: Cll '1:)· .-i . .-i '1:) ro 9 .j..J ..c: .j..J
~ Q) l=l ro Cll
'1:). l=l -l=l .......... 00 1-4 ..c: .j..J 00 'i=l 1-4 Q) CJl. l=l 0 l=l 1-4 . "r"i .. . .......... Cll 0 l=l 1-4 .0 -~ ro
Q) 00 CJ Q) Q) .oo 0 ·r-i 0 ..c: p. .-i ·Cil 1-4 ·J..j ro .-i '1:) .j..J .j..J 4-! .j..J . ..C: Cll . CJ . ..!<: ;:l ro .j..J .-i .-i .j..J ..c:· ro .ro .j..J H
.j..J .-i ro. .-i ;:l Cll 00 0 .'1:l .j..J .j..J ..c: l=l H ro >: Q) §' .-i 1-4' .j..J "r"i 0 Q) "r"i CJ l=l CJ 4-! 00 1-4 ro ! Q)
~ 0 ro 0 ro ..c: 6 Q) "r"i ro .. Q) ;g 0 Q) UJ u u ~ E-:-1 E-t UJ ::::· ~ ::I! ~ ~- ::I! ~
F . 84 6/17/70 62 53SL 1460. 55 ·845 940 50 . 380 .• y 201 194 212 63 F 84 6/20/70 571R 1430 70 820 . 820. 106 -5* 365 y 227 221 307 63 ...... F 84 6/23/71 181 739L 1565 65. 870 990 10 383 y~ ·. 207 2ll 255 . 64 Large ·swelling V1
\ left jaw F 84 6/14/71 148 .689L 1610 62 912 970. llO 10 378 ... y 272 221 256 64 F 84 6/15/71 690L 1510 57 . 900 1000 90 5 410 N 207 226 262 64 Fbks. -Massive
swelling both . jaws, infection by teat
F. 84 6/16/71 141 ·639L 1430 67 875 990 91 20 366 y 268 274 267 64 Jaw clean F 84 6/18/71 172 716L 1490 60' 852 980 87 0 373 y 260 230 347 64 Brown secretion
from vagina
M 96 6/7/69 .42 020R 20 403 822 61 M . 96 6/19/70 91 554L 1557 80 930 940 140 95 400 678 692 635 62 Hunter kill 1970 M 96 6/18/71 167 631L 1580 78 985 1109 137 15 398. N 769 767 698 63 Slight swelling
left jaw M 96 6/18/71 . 170 672L 1570 77 981 1035 124 25 409 N 636 . 665 585 63 Slight swelling
right jaw
F 96 6/16/70 80 072L 1530 70 875 1005 125 25 380 N 265 257 242 62 542R
F 96 6/14/70 74 526L 1470 70 850 920 95 -5* 360 y 244 210 180 .62 073R
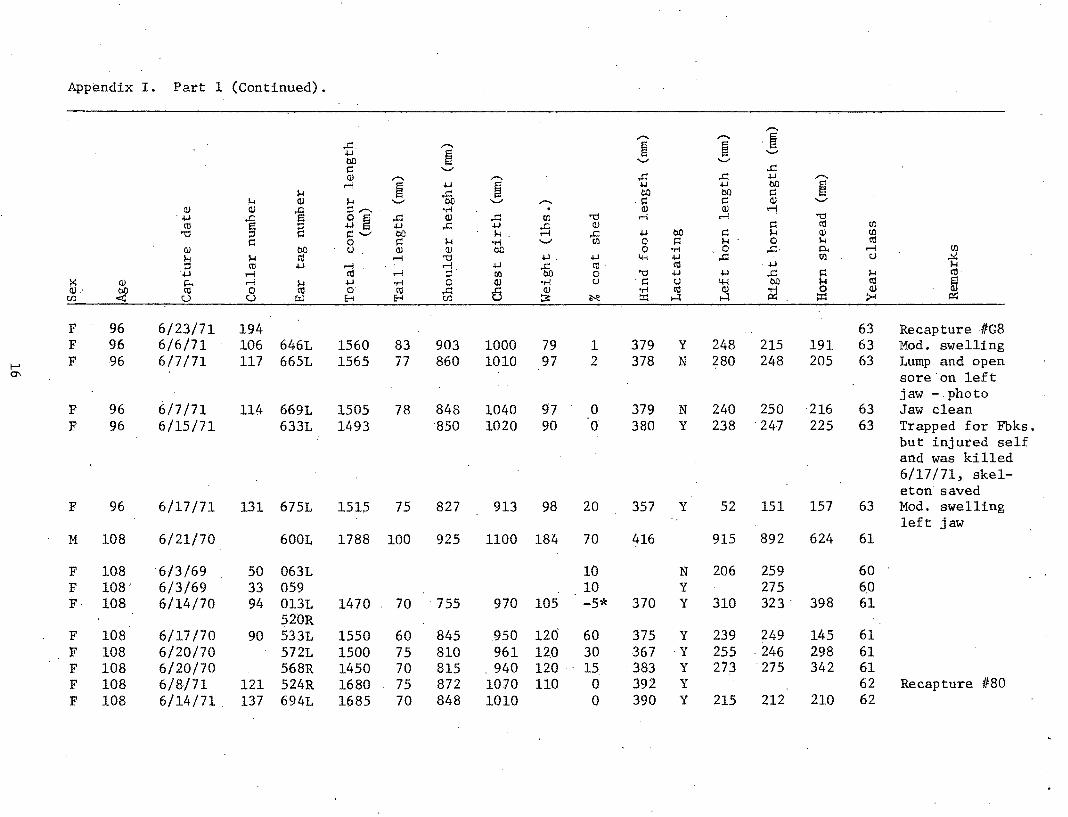
Appendix I. Part 1 (Continued).
........ ,...... ,....,. § ..c. ........ ~ ~ +-1 ~ '-' 00 - '-' ~ '-' ...c: (J) ........ ,....,. ..r::: ..r::: +-1 -,..., § +-1 § .1.1 +-1 00 ~ 1-4 ib bO 00 l=l
1-4 Q) 1-4 '-' '-' - -~ ~ (J) '-' (J) Q)
~ ::lr-. •.-l . (!) QJ ...-j ·+..~
~ 3 § ...c: Q) ...c: {/J '"Cl ,...; ,..., '"Cl co ::I +-1 ...c: +-1 ~
Q) ~ co {/J
'"Cl ~ ~'-' 00 1-4. ..c +-1 00 ~ H (J) {/J
~ 0 ~ H •.-l '-' {/J 0 l=l 1-4 0 1-l co QJ 00 u QJ QJ 00 0 •.-l . .0 ,.c. p.. ,..., {/J
H H co ,..., '"Cl +-1. +-1 4-l +-1 ..r::: {/J u ~ ::I co +-1 ,..., rj. +-1 ..c: co· co +-1 .+-I ,..., co ,..., ,.., {/J 00 0 "d +-1 +-1 ..c l=l H co
X QJ ~ ,..., H +-1 •r-l 0 Q) •r-l u -~ u 4-1 00 H co m (J)
~ co 0 co o· co ...c: 0 QJ •r-l co Q) ;g 0 Q)
UJ u u ;:.:l E-i E-i UJ :;:; ~ ::c ...::1 ...::1 ::c >< P'l
F 96 6/23/71 194 63 Recapture IFG8 F 96 6/6/71 106 646L 1560 83 903 1000 79 1 379 y 248 215 191 63 Mod. swelling
1-' F 96 6/7/71 117 665L 1565 77 860 1010 97 2 378 N 280 248 205 63 Lump and open 0'> sore'on left
jaw - photo F 96 6/7/71 114 669L 1505 78 848 1040 97 0 379 N 240 250 -216 63 Jaw clean F 96 6/15/71 633L 1493 850 1020 90 0 380 y 238 '247 225 63 Trapped for Fbks.
but injured self and was killed 6/17/71, skel-eton saved
F 96 6/17/71 131 6751 1515 75 827 913 98 20 357 y 52 151 157 63 Mod. swelling left jaw
M 108 6/21/70 6001 1788 100 925 1100 184 70 416 915 892 624 61
F 108 6/3/69 50 063L 10 N 206 259 60 F 108' 6/3/69 33 059 10 y 275 6_0 F 108 6/14/70 94 013L 1470 70 755 970 105 -5* 370 y 310 323. 398 61
520R F 108 6/17/70 90 533L 1550 60 845 .950 120 60 375 y 239 249 145 61 F 108 6/20/70 572L 1500 75 810 961 12_0 30 367 ·Y 255 246 298 61 F 108 6/20/70 568R 1450 70 815 . 940 120 15 383 y 273 275 342 61 F 108 6/8/71 121 524R 1680 75 872 10.70 110 0 392 y 62 Recapture IF80 F 108 6/14/71 . 137 694L 1685 70 848 1010 0 390 y 215 212 210 62

Appendix I. Part 1 (Continued).
......... ......... ......... ~ .c: ...... ~ -~ ~ ~ '-"
00 '-" '-" l=l '-" .c: aJ ...... - .c: .c: ~ .........
r-1 ~ ~ ~ ~ ~ bO ~ 1-1 'fc bO bO l=l
1-1 QJ 1-1 '-" '-" •· ......... l=l l=l QJ '-" QJ QJ 1 :::1.---. •r-l . aJ aJ r-1 ~ .0 ~ ~ .c: QJ .c: CJl .. "Cl r-1 ·r-~ "Cl co s .1-) .c: ~ ;:; _!l) l=l co CJl
"Cl l=l l=l'-" bO 1-1 .c: ~ QIJ· c: 1-1 aJ CJl l=l 0 c: 1-1 •r-l '-" CJl 0 l=l 1-1 0 ·I-I (;)
QJ bO tJ QJ aJ bO 0- •r-l 0 .c: '"' rl CJl 1-1 1-1 co r-1• "Cl .1-) ~ 4-l ~ .c: CJl .<:.! •,.!:..1 ::I co ~ r-1 r-1 .1-) 'fc (;) qj .1-) 1-1 w r-1 qj r-1 ::I tb 0 "Cl ~ ~ .c: c: 1-1 co
X aJ p. r-1 1-1 .1-) •rl 0 QJ. ·ri tJ c: tJ 4-l bO 1-1 Ci) ! aJ ~ co 0 qj 0 qj .c: 0 QJ -rl co Q) P2 0 aJ C/) u u ll:l E-t E-t C/) .:::0: ~ ::c: ....:~ ...:I ::c: >-<
F 108 6/17/71 132 638L 1485 74 925 1004 100 35 377 y 291 285 204 62 Jaw clean F 108 6/19/71 185 743L 1610 70 83.7 1050 97- 0 400 y 310 290 250 62 Lamb captured
1-' F 108 6/27/71 207 62 -...!
F 108 6/27/71 202 62. F 108 6/21/71 180 716L y 62 Blood sample
only
M '120 ' 6/18/71 134 '678L 1655 101 1000 1125 153 10 395 875 805 540 61
F 120 6/20/70 ' 571L 1540 60 810 960 120 -5* :no y 248 250 217 60 Dead F 120 6/21/70 71 584L 1559 80 839 1010 125 5 372 y 229 199 256 60 F 120 6/22/71 182 714L 1610 65 815 1040 114 0 380 y 240 250 225 61
F 132 6/19/70 77 556L 1555 75 793 940 118 -5* 365 y 275 264 282 .F 132 6/7/71 111 584L 1510 86 838 910 110 2 392 N 232 200 257 60 Yearling w/ewe~
recapture tnl F 132' 6/18/71 173 749L 1505 54 870 1020 100 0 378 N 236 262 255 60 Mod. swelling
right jaw
F 144+ . 6/23/70 591L 1530' 80 800 935 123 30 381 N 223 239 272 57 F 144+ 6/1/69 2 090L 370 N 281 288 56
-* indicates less than
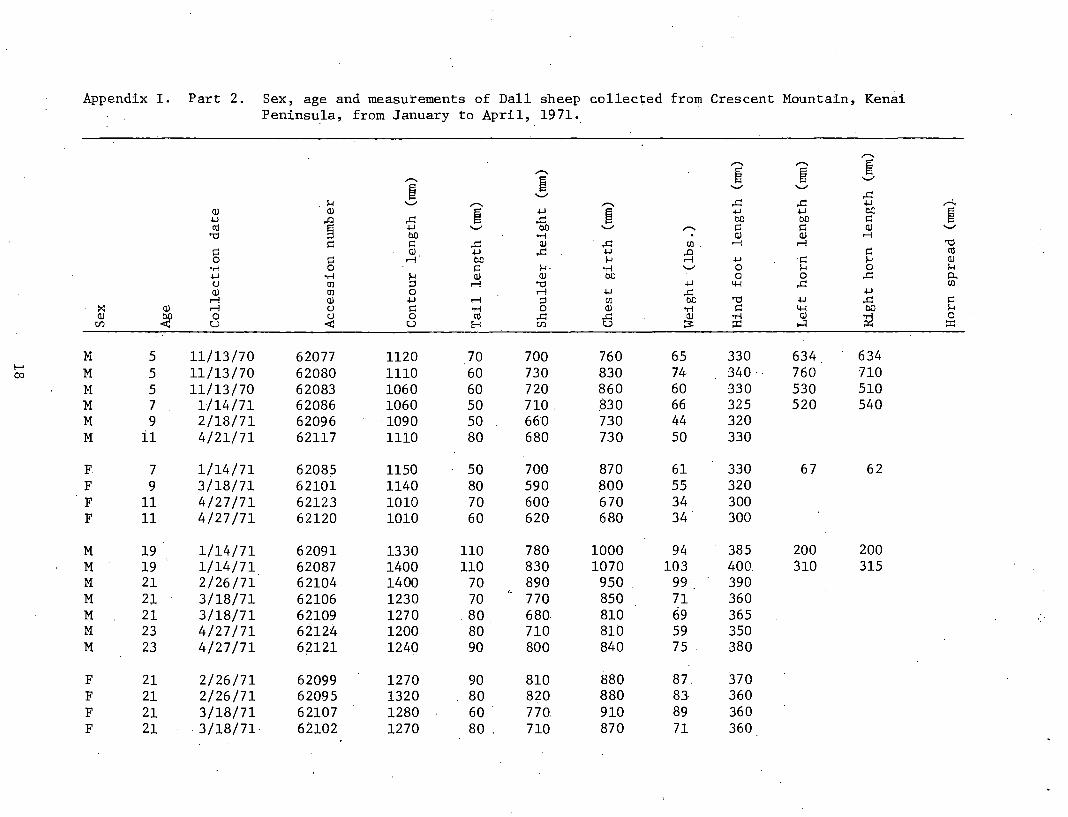
Appendix I. Part 2. Sex, age and measurements of Dall sheep collected from Crescent Mountain, Kenai Peninsula, from January to April, 1971.
,....... ,....... ,.......
~ ,....... ~ ~ ,.......
~ ...._,
~ ......... .........
......... ,..c .H ......... ,....... ,....... ,..c ,..c ~ ,....:..
Q) Q)
~ ~ ~ ~ ~ e.:: ~ ~ ,.0 ,..c ,..c eo ec I=!
(\j 9 ~ ......... ec ......... ,....... I=! I=! Q) ......... "0 bD •ri . Q) Q) ,...,
I=! I=! ,..c Q) ·,..c Ul. ,..., ,..., "0 I=! Q) ~ ,..c .w ,.0 I=! (\j 0 I=!
,...,. ec H ,..., ~ ·I=! H Q)
•ri 0 I=! H· •ri ......... 0 H 0 H ~ •ri H Q) Q) e.:: 0 0 ,..c 0.. (.) Ul :l ,..., "0 .w 44 ,..c Ul Q) Ul 0 ,..., ~ ,.c: ~ ,..., Q) ~ ,..., :l Ul bC "0 .w ,..c I=!
·l< Q) ,..., (.) I=! •ri 0 Q) 'r'i I=! 44 ec H Q)
~ 0 (.) 0 (\j ,..c 6 Q) 'r'i Q) ;:2 0 Cl) u < u f:-1 Cl) ::::;::: :I! ...:I :I!
M 5 11/13/70 62077 1120 70 700 760 65 330 634 634 t-' M 5 11/13/70 62080 1110 60 730 830 74 340· 760 710 O:l
M 5 11/13/70 62083 1060 60 720 860 60 330 530 510 M 7 1/14/71 62086 1060 50 710. ,830 66 325 520 540 M 9 2/18/71 62096 ·1090 50 66'0 730 44 320 M il 4/21/71 62117 lliO 80 680 730 50 330
F 7 1/14/71 62085 1150 50 700 870 61 330 67 62 F 9 3/18/71 62101 1140 80 590 ~00 55 320 F 11 4/27/71 62123 1010 70 600 670 34 300 F 11 4/27/71 62120 1010 60 620 680 34 300
M 19 1/14/71 62091 1330 110 780 1000 94 385 200 200 M 19 1/14/71 62087 1400 110 830 1070 103 400. 310 315 M 21 2/26/71 62104 1400 70 890 950. 99 390 M 21 3/18/71 62106 1230 70 770 850 71 360 M 21 3/18/71 62109 1270 . 80 680 810 69 365 M 23 4/27/71 62124 1200 80 710 810 59 350 M 23 4/27/71 62121 1240 90 800 840 75 . 380
F 21 2/26/71 62099 1270 90 810 880 87. 370 F 21 2/26/71 62095 1320 80 820 880 83 360 F 21 3/18/71 62107 1280 60 770. 910 89 360 F 21 3/18/71· 62102 1270 80 . 710 870 71 360

Appendix I. Pait 2 (Continued).
-,....._, - ~ - ~· ~ - ~ .........
~ ......... ......... ...._, .c:
1-l ......... - ,....._, .C:· . .c: +J ..-.. Q) ·QJ
~ +J ~ +J +J bO ~ +J ..c .c: .c: bO bO .l=l
tl) s +J ......... bO ......... ,....._, j:l s:: Q) '-' "0 bO •n . Q) Q) .-I
s:: j:l .C:- Q) .c: Cl.l .-I .-I "0 j:l Q) +J .C:. +J ~ e tl) 0 j:l .-I bO 1-l +J s:: Q)
.,..; 0 j:l 1-l .,..;· ......... 0 1-l 0 1-l +J .,..; 1-l Q) Q) bO 0 0 .c: p. (J Cl.l ::l .-I "=' +J 4-l . .c: Cl.l Q) Cl.l 0 r-t• +J .c:· +J
.-I Q) +J rl ::l .CI.) bO "=' +J .c: s:: X Q) rl (J l=l .,..; 0 Q) .,..; l=l 4-l 00 1-l Q)
~ 0 (J 0 tl) .c: .c: • Q) •.-,!. Q) ;g· 0 f.I:J u < u .H f.I:J. u :=:: ::X:: ...:I ;:x::·
M 33 2/26/71 62094 1420 70 820 960 103 .390.
1-' F 29 11/13/70 62082 1140 70 760 910 91 350 110 120 1.0
F 29 11/13/70 62081 1410 90 790 1010 122 370 190 220 181 F 33 2/26/71 62100' 1400 80 860 .990 110 370 F. 33 2/26/71 62103 1590 100 950 1120 152 400
F 41 11/13/70 62078 1440 100. 860 10·40 129 380 199 F 41 1/14/71 62088 ·1550' 95 •840 . 1040 111 385 F 45 3/18/71 62108 1420 90 830 950 103 360 F 5.9 4/27/71 62125 1440 100 860 930 101 370 F 59 4/27/71 62119 1370 120 850 890 99 370
F 69 2/26/71 62100 1460 100 890 1010 121 380 F 69 3/18/71 62112 1480 90 880 980 121 380. F 71 4/27/71 62113 1380 100 900 950 114 370 F 77 11/13/70 62076 1440 70 750 1040 120 360 F 79 1/14/71 62090 1450 60 890 1090. 123 370 230 205 175
F 81 2/26/71 62105 1380 100 910 990 110 370 F 84 3/18/71 62098 1400 90 860 930. 99 370 F 101. 11/13/70 62079. 1410 90 880 108 139 370 F 103 1/14/71 62092 1450 70 870 1020 102 ~70
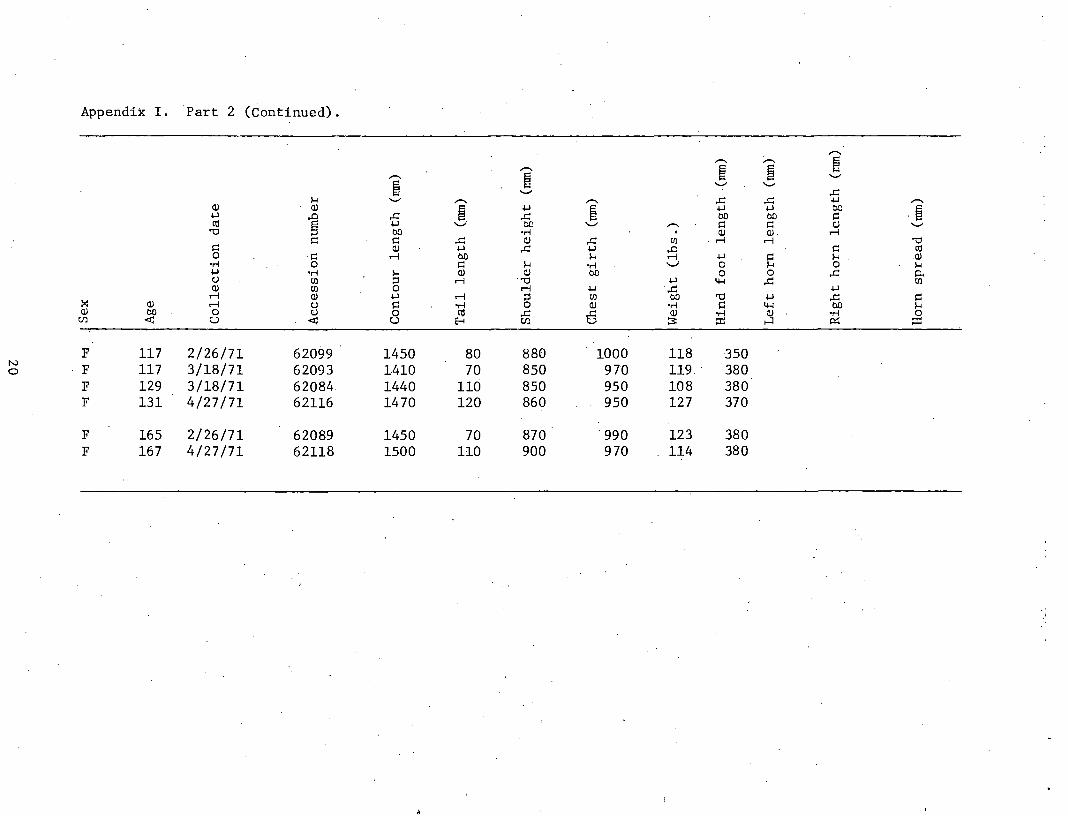
Appendix I. Part 2 (Continued).
;-.. ;-.. ;-.. g ;-.. g g ;-.. g '-"
g '-" '-" .._, ,.r:: 1-< '-" ;-.. ;-.. ,.r:: ,.r:: .j...J ;-..
Q) Q) g .j...J g .j...J .j...J ec .g .j...J .0 ,.r:: ,.r:: bO bO ~ co 5 .j...J .._, oc '-" ;-.. ~ ~ Q) '-" "0 bO ·rl . Q) Q) . .-:i
~ ~ ,.r:: Q) ,.r:: (/) ,..., ,..., "0 ~ Q) .j...J ,.r:: .j...J .0 ~ co 0 ·~ ,..., bO 1-< ,..., .j...J ~ 1-< Q)
•rl 0 ~ 1-< •rl .._, 0 1-< 0 1-< .j...J •rl 1-< Q) Q) ec 0 0 ,.r:: p. () til :l ,..., '"0 .j...J 4-l ,.r:: til Q) (/) 0 ,..., .j...J ,.r:: .j...J ,..., Q) .j...J ,..., :l (/) bO "'C .j...J ,.r:: ~
X Q) ,..., () ~ •rl 0 Q) •rl ~ 4-l bO 1-< Q) bO 0 () 0 co ,.r:: 6 Q) •rl Q) •rl 0
U:l -c:t: u -c:t: u ~ U:l :::::: ::r:: ...:I ~ ::c:
F 117 2/26/71 62099 1450 80 880 1000 118 350 N
F 117 3/18/71 62093 1410 70 850 970 119 380 0
F 129 3/18/71 62084 1440 110 850 950 108 380 F 131 4/27/71 62116 1470 120 860 950 127 370
F 165 2/26/71 62089 1450 70 870 990 123 380 F 167 4/27/71 62118 1500 110 900 970 114 380
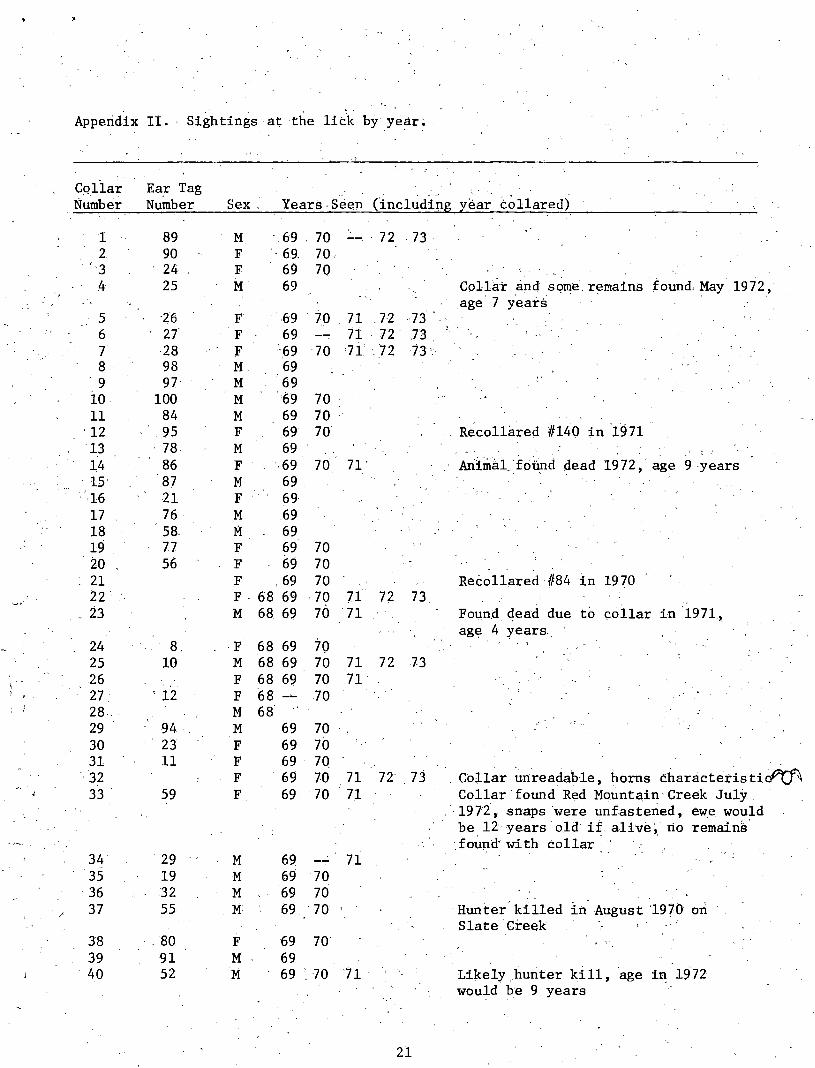
•
Appendix II. Sightings at the lick by year.
Collar Number
1 2
.. 3
4
5 6 7 8
'9 10 ll
. 12 13 14 15· 16 17 18 19 20 .21 22' 23
24 25 26 27 28. 29 30 31
.• 32 33 .
34 35 36 37.
38 39 40
Ear Tag Number Sex .· Years. Seen (incl~dfrtg year collared)
89 90 24 25
26 27 28 98 97·
100 84
. 95 . 78
86 87 21 76 58 7.7 56
8. 10 ..
. 12
94 23 11
59
. 29 19 32 55
. 80 91 52
M ·.69 70 72 .73 F . · 69. 70, F 69 70 M 69
F ·69 F 69
7.0 71 .n -73 1i . 72 . .73
F ~69 ·70 7i ·. 72 73 M. .69 M 69 M 69 M 69 F 69 M 69
70 70 70'
F ·-69 70 71' M 69 F 69 M 69 M 69 F 69 F 69 F . 69
70 70 70
F · 68 69 M 68 69
. 70 71 72 73 70 71
F 68 69 7o M 68 69 70
. F 68 69 70 F 68 .70 M 68 M 69 70 F 69 70 F 69 70 F . 69 70 F 69 70
71 72 73 71
71 72 73 71
M M M M·
69 71
F M M
69 '70 69 70 69 '70
69 70 69 69 . 70 71 ..
21
Collar and some. remains .found May 1972, _age 7 years
. Recollared l/140 in 1971
Ariimal. foiind dead 1972, age 9 -years
Recollared /184 in 19 70
Found dead due to collar in 1971 '· age 4 years ..
. Collar. unreadable, horns characterfs tiOV(j"\ Collar found Red Mountain-Creek July 1972, snaps were unfastened, ewe would be. 12 years old if. alive~. no remains
·found· with collar
·Hunter killed in August ·1970 on Slate Creek
Likely hunter kill, age in 1972 wouid he 9 years
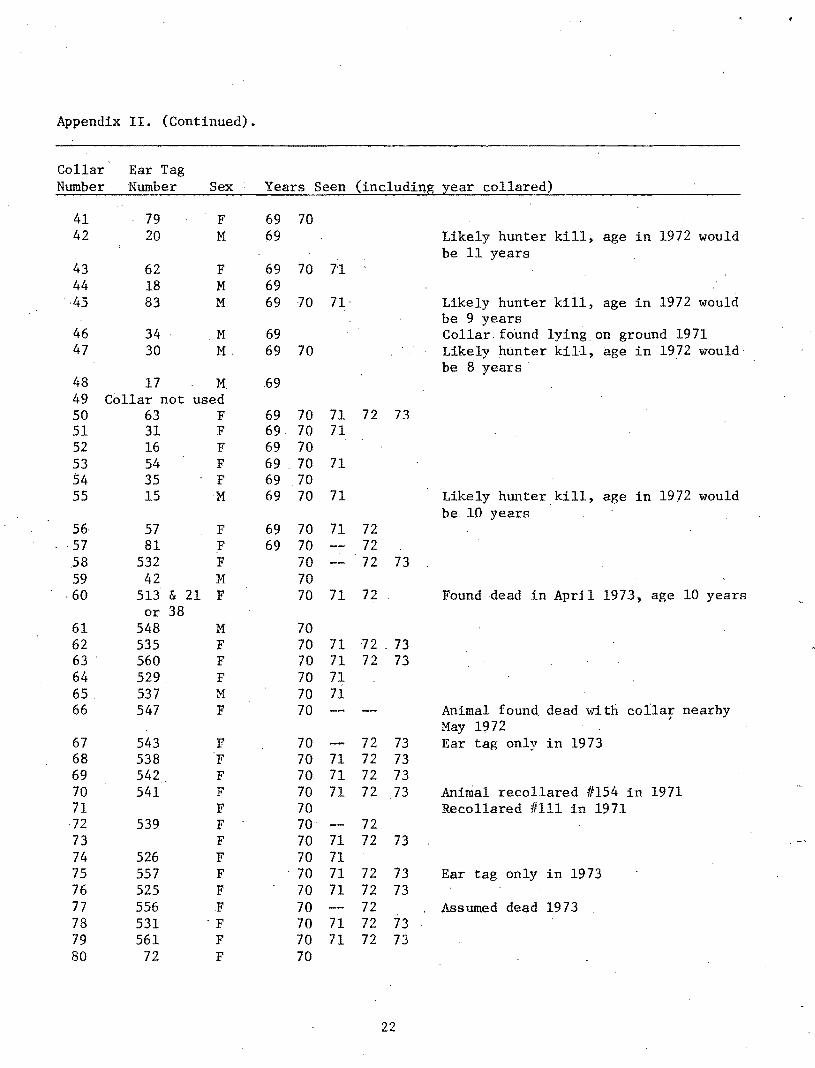
Appendix II. (Continued).
Collar Ear Tag Number Number Sex Years Seen (including year collared)
41 79 F 69 70 42 20 M 69 Likely hunter kill, age in 1972 would
be 11 years 43 62 F 69 70 7'1 44 18 M 69 ·45 83 M 69 70 71· Likely hunter kill, age in 1972 would
be 9 years 46 34 M 69 Collar fo'und lying_ on ground 1971 47 30 M. 69 70 Likely hunter kill, age in 1972 would
be 8 years 48 17 M 69 49 Collar not used 50 63 F 69 70 71 72 73 51 31 F 69 70 71 52 16 F 69 70 53 54 F 69 70 71 54 35 F 69 70 55 15 M 69 70 71 Likely hunter kill, age in 1972 would
be 10 years 56 57 F 69 70 71 72 57 81 F 69 70 72 58 532 F 70 72 73 59 42 M 70 60 513 & 21 F 70 71 72 Found dead in April 1973, age 10 years
or 38 61 548 M 70 62 535 F 70 71 72 . 73 63 560 F 70 71 72 73 64 529. F 70 71 65. 537 M 70 71 66 547 F 70 Animal found. dead with collar nearby ,
May 1972 67 543 F 70 72 73 Ear tag only in 1973 68 538 F 70 71 72 73 69 542 F 70 71 72 73 70 541 F 70 71 72 73 Animal recollared #154 in 1971 71 F 70 Recollared #111 in 1971
·72 539 F 70 72 73 F 70 71 72 73 --74 526 F 70 71 75 557 F . 70 71 72 73 Ear tag only in 1973 76 525 F 70 71 72 73 77 556 F 70 72 Assumed dead 1973 78 531 ·y 70 71 72 73 79 561 F 70 71 72 73 80 72 F 70
22

Appendix II. (Continued).
Collar Ear Tag. Number Number Sex · Years Seen (including year collared)
81 40 M 70 71 82 528 F 70 83. 550 M 70 71 72 73 Ear tag only in 1973 84 514 F 69 70 71 72 73 Animal recollared //21 in 1969 85 576 M 70 72 Animal identified by ear tag in 1972,
collar found in 19 71 86 50 F 70 71 87 575 M 70 71 72 73 88 522 F 70 71 72 73 89 552 M 70 .71 72 Hunter kill 1972, age 5 years 90 533 F 70 71. 72 73 91 554 M 70 Hunter kill 1970, age 8 years 92 F ' 70· 71 72 73 Recollared #179 in 1971, ear tag only
in 1973 93 558 M 70 Likely hunter kill, age in 1972 would
would be 9 years 94 520 &13 F 70 Collar found 1971, age then would have·
been 11 years 95 582 M 70 71 · Hunter kill in 1971, age 8 years 96 67 F 70 71 72 97 559 F 70 72 73 . 98 534 F 70 71 72 73 99 549 ·M 70 Animal remains found 1972, age 8 or 9
' years, collar had. been lost; only ear tag remained with skull
G'\""1 503 & 4J- F 70 71 Age in 19 72 would have been 9 years G-2 36 F 70 71 72 73 G-3 48 M 70 72 73 G-4 45 F 70 71 72 73 G-5 551 M 70 71 72 G-6 43 F 70 71 72 73 G-7 504 & 37 M 70 Likely hunter kill~ age in 1972 would
be 9 years G-8 506 & 47 F 70 71 72 73 Recollared /1194 in 1971 100 621 M 71 72 73 101 622 M 71 102 625 F 71 72 73 103 627 F 71 72 104 629 M 71 72 73 Ear tag only in 1973 105 628 M 71 72 106 646 F 7i 72 Killed April 1973, nutritional study,
age 10. years 107 645 M 71 72 73 Ear tag only in 1972 108 641 M 71 109 667 F 71 72 73 . Ear tag only in 1972 110 650 F 71 ·72. 73 Ear tag only in 1972 111 584 F 70 71 72 73
23
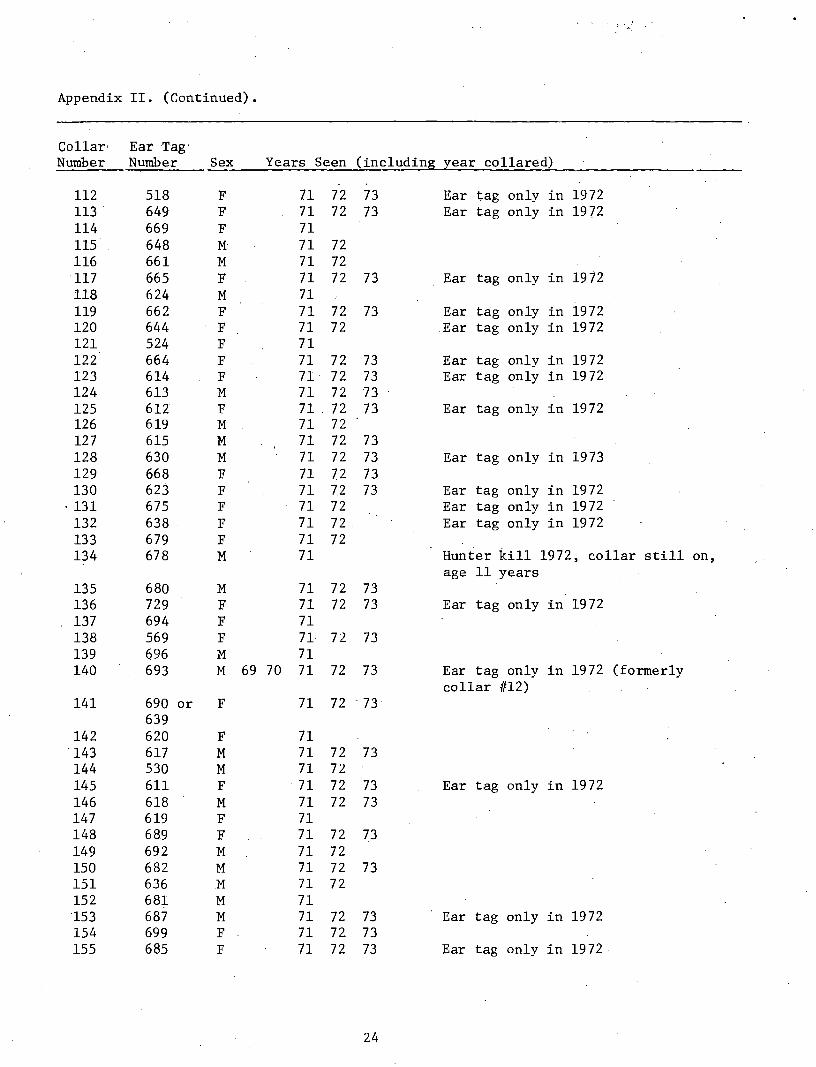
Appendix II. (Continued).
Collar· Ear Tag· Number Number Sex Years Seen (including year collared)
ll2 518 F 71 72 73 Ear tag only in 1972 ll3 649 F 71 72 73 Ear tag only in 1972 ll4 669 F 71 115 648 M 71 72 116 661 M 71 72 117 665 F 71 72 73 Ear tag only in 1972 118 624 M 71 119 662 F 71 72 73 Ear tag only in 1972 120 644 F 71 72 .Ear tag only in 1972 121 524 F 71 122 664 F 71 72 73 Ear tag only in 1972 123 614 F 71 72 73 Ear tag only in 1972 124 613 M 71 72 73 125 612 F 71 . 72 73 Ear tag only in 1972 126 619 M 71 72 127 615 M 71 72 73 128 630 M 71 72 73 Ear tag only in 1973 129 668 F 71 72 73 130 623 F 71 7.2 73 Ear tag only in 1972
. 131 675 F 71 72 Ear tag only in 1972 132 638 F 71 72 Ear tag only in 1972 133 679 F 71 72 134 678 M 71 Hunter kill 1972, collar still on,
age 11 years 135 680 M 71 72 73 136 729 F 71 72 73 Ear tag only in 1972 137 694 F 71 138 569 F 71· 72 73 139 696 M 71 140 693 M 69 70 71 72 73 Ear tag only in 1972 (formerly
collar 1112) 141 690 or F 71 72 . 73
639 142 620 F 71 143 617 M 71 72 73 144 530 M 71 72 145 611 F 71 72 73 Ear tag only in 1972 146 618 M 71 72 73 147 619 F 71 148 689 F 71 72 73 149 692 M 71 72 150 682 M 71 72 73 151 636 M 71 72 152 681 M 71 153 687 M 71 72 73 Ear tag only in 1972 154 699 F 71 72 73 155 685 F 71 72 73 Ear tag only in 1972.
24

Appendix II. (Continued).
-
Collar Ear Tag Number Number Sex Years Seen (including year collared)
156 683 M 71 72 157 684 M 71 158 700 M 71 72 73 159 673 M 71 72 73 160 634 M 71 72 73 161 676 M 71 162 633 or F 71
731 163 637 F 71 72 73 164 697 F 71 165 632 M 71 72 166 695 F. 71 72 73 167 631 M 71 72 168 727 F 71 72 73 169 738 F 71 72 73 170 672 M 71 Hunter kill 1971, age 8 years 171 711 M 71 72 73 172 713 M 71 }2 . 73 173 749 F 71 72 174 737 F 71 72 73 Ear tag only in 1972 175 750 F 71 72 73 176 741 M 71 72 177 735 M 71 72 178 544 F 71 72 73 . 179 546 F 71 72 Recollared #92 ~n 1971 see 92 180 716 F 71 72 73 181 739 F 71 182 714 F 71 72 Ear tag only in 1972 183 Collar not used 184 715 M 71 185 743 F 71 72 73 186 746 F 71 72 73 187 707 F 71 72 73 Ear tag only in 1972 188 730 F 71 72 73 Ear tag only in 1972 189 748 F 71 72 73 Ear tag only in 1972 190 708 F 71 72 73 191 745 F 71 .192 703 F 71 72 73 Ear tag only in 1972 193 M 71 72 194 F 70 71 72 Formerly G-8 195 M 71 196 Collar not used 197 Collar not used 198 Collar not used 199 Collar not used
25
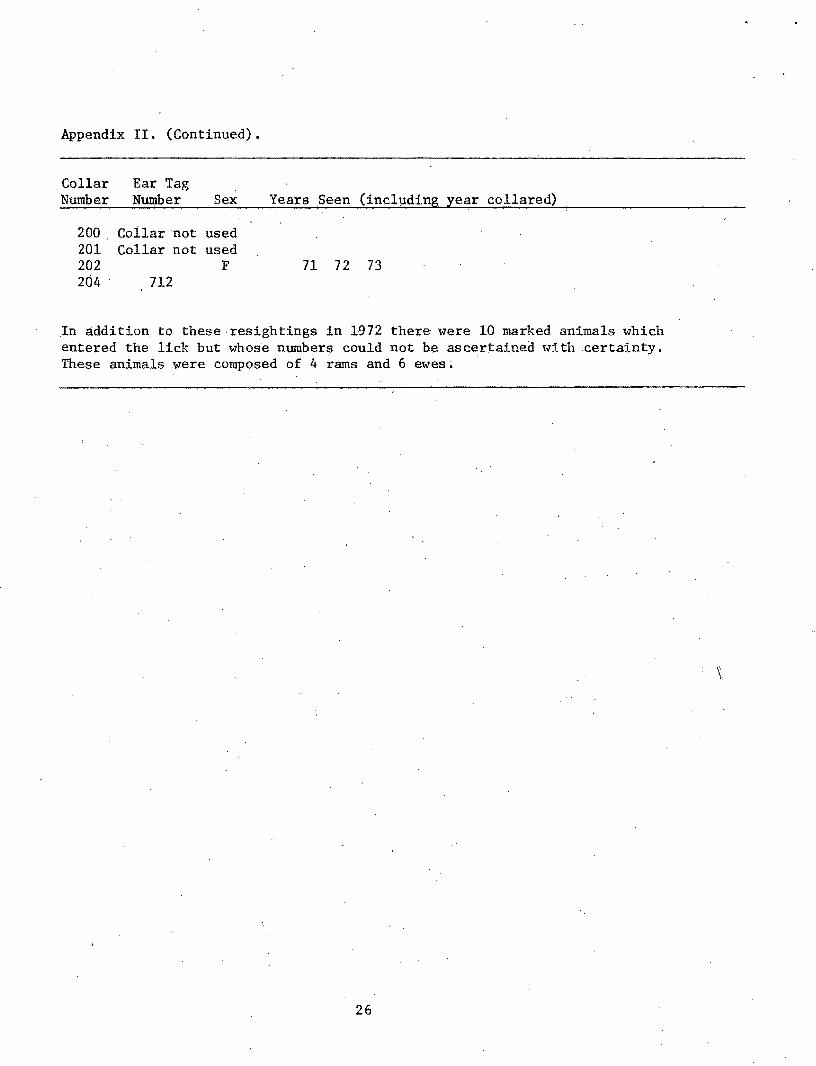
Appendix II. (Continued),
Collar Ear Tag Number Number Sex Years Seen (incl~ding year collared)
200 Collar not used 201 Collar not used 202 F 71 72 73 204 712
.In addition to these ·resightings in 1972 there were 10 marked animals which entered the lick but whose m.nnbers could not be ascertained with .certainty. These animals were composed of 4 rams and 6 ewes;
26

Appendix III. Part 1. Time spent by collared rams at main mineral lick on Dry Creek.
Total minutes spent Minutes spent licking Minutes spent in during first visit during fi~st Visit subsequent visits
Collar Number Date of day of day during same day
1 6/1/72 60 60 1 6/2/72 . 58 58 . 1 6/17/72 96 96 1 6/18/72 102 102 54 1 . 6/19/72 22 . 22 45
36 6/9/72 32 32
73 6/16/72 62 62
83 6/3/72 45 45 66 83 . 6/8/72 69 69
87 6/3/72 65 65 87 . 6/12/72 . 55 55 65
. 87 6/13/72 68 68
G-5 6/2/72 12.'5 125 35' 21' 25' 10
100 6/21/72 100 6/22/72 12 12
104 6/4/72 65 65 10
105 5/30/72 54 54 . 105 5/31/72 67 67
105 6/13/72 81 58 105 6/14/72 99 55 22
115 6/17/72 60 60 30' 5 115 6/18/72 40 40 115 6/19/72 57 52
116 6/11/72 100 100 15
126 6/11/72 . 65 65 62' 22 126 6/18/72 119 79 126 6/19/72 30 25
127 6/18/72 67 32 27, 67 127 . 6/19/72 137 137
135 6/12/72 20 20 25' 10' 7' 5 135 6/15/72 60 60
27
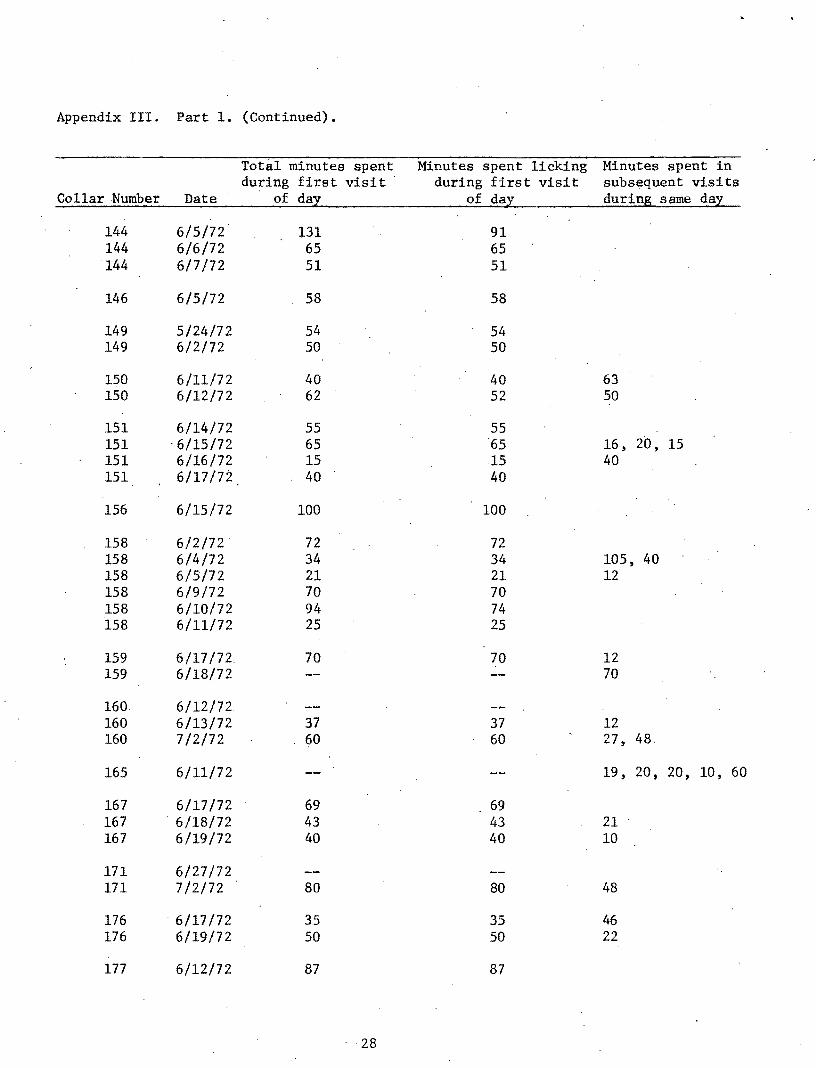
Appendix III. Part 1. (Continued).
Total minutes spent Minutes spent licking Minutes spent in during first visit during first visit subsequent visits
Collar Number Date of day of day during same day
144 6/5/72 131 91 144 6/6/72 65 65 144 6/7/72 51 51
146 6/5/72 58 58
149 5/24/72 54 54 149 6/2/72 50 50
150 6/11/72 40 40 63 150 6/12/72 62 52 50
151 6/14/72 55 55 151 . 6/15/72 65 '65 16' 20, 15 151 6/16/72 15 15 40 151 6/17/72 40 40
156 6/15/72 100 100
158 6/2/72' 72 72 158 6/4/72 34 34 105, 40 158 6/5/72 21 21 12 158 6/9/72. 70 70 158 6/10/72 94 74 158 6/11/72 25 25
159 6/17/72 70 70 12 159 6/18/72 70
160 6/12/72 160 6/13/72 37 37 12 160 7/2/72 60 60 27, 48
165 6/11/72 19' 20, 20, 10, 60
167 6/17/72 69 69 167 ' 6/18/72 43 43 21 167 6/19/72 40 40 10
171 6/27/72 171 7/2/72 80 80 48
176 6/17/72 35 35 46 176 6/19/72 50 50 22
177 6/12/72 87 87
28

Appendix III. Part 1. (Continued).
Total minutes spent Minutes spent licking Minutes spent in during first visit during first visit subsequent visits
Collar Number Date of day of day during same day-
193 6/5/72 79 79 193 6/12/72 118 118 193 6/16/72 30 30 21, 20 193 6/17/72 30 30 5 193 6/18/72 10 10 38
Broken. tag 6/11/72 33 33 Broken tag 6/13/72 17 17 22 J 5; 30
29
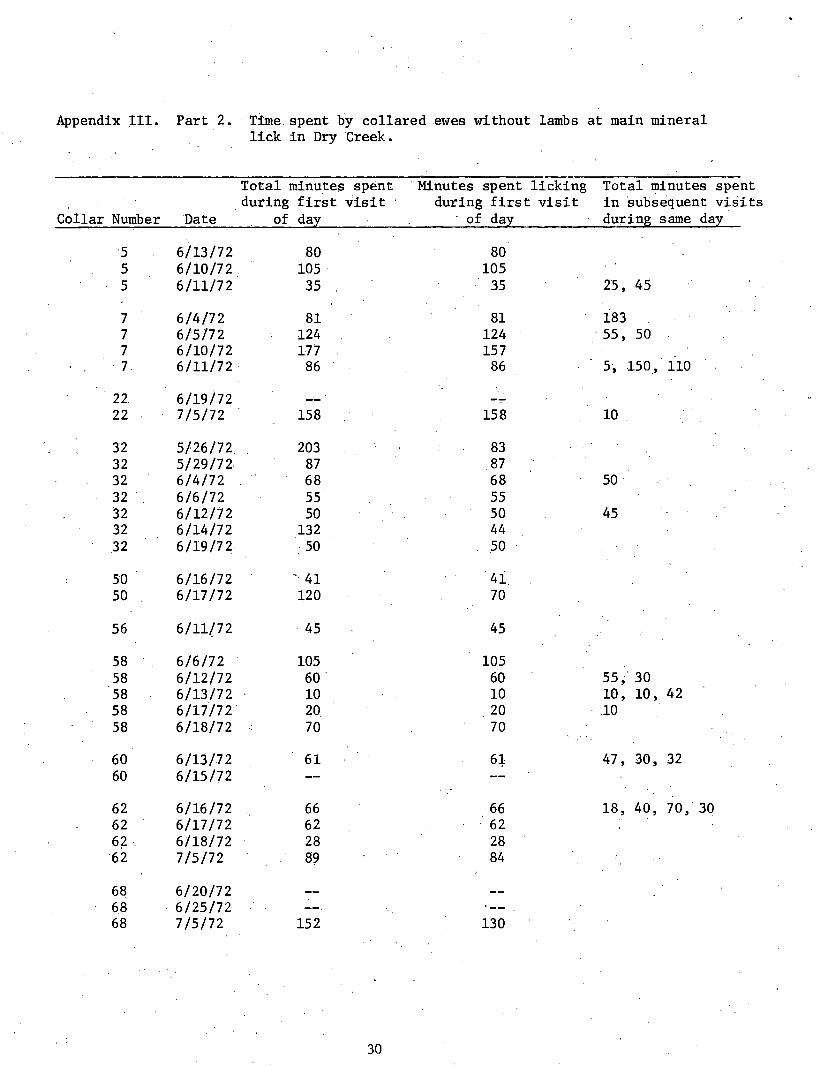
Appendix III. Part 2. · Time. spent by collared ewes without lambs at main mineral lick in Dry Creek.
Total minutes sp~nt Minutes spent licking Total minutes spent .during first visit during first visit in subsequent visits
Collar Number Date of day of day during same day
5 6/13/72 80 80 5 6/10/72 105. 105 5 6/11/72 35 35 25' 45
7 6/4/72 81 81 183 7 6/5/72 124 . 124 . 55' 50 7 6/10/72 177 157
·7 6/11/72. 86 86 5; -150_, 110
22 6/19/72 22 7/5/72 158 158 10
32 5/26/72 203 .83 32 5/29/72 87 87 32 6/4/72 68 68 50 32 6/6/72 55 55 32 6/12/72 50 50 45 32 6/14/72 132 44 32 6/19/72 50 50
50 6/16/72 ~, 41 41 50 6/17/72 120 70
56 6/11/72 . 45 45
58 6/6/72 105 105 58 6/12/72 60. 60 55,· 30 58 6/13/72 10 10 10' 10' 42 58 6/17/72 20. 20 .. 10 58 6/18/72 70 70
60 6/13/72 61 61 47, 30, 32 60 6/15/72
62 6/16/72 66 66 18, 40, 70, 30 62 6/17/72 62 . 62 62- 6/18/72 28 28
"62 7/5/72 89 84
6~ 6/20/72 68 . 6/25/72 68 7/5/72 152 130
. ; 30

I·
Appendix III. Part 2. (Continued) •.
: Collar NunibEir·
72 7i
. 76 76
G-2· · G-2 c::z G-2. G-2
102
. 103-
i29 129 .129 129
Date
Total minutes· spent during. first visi_t ' · .. of· day·
6/19/72 . 6/20/72 '
6/3/72 6/13./72 ..
. 7/2/72
6/6/72
6/l/72 -6/2/72 6./3/72 6/5/72. 6/15/72
6/12/73
6/5/72
. 5i31i72 ·. 6/1~/72• . 6/14/72 6/17/72
99 40
10 27
· .. 75
70
150 '75 90 73
:· ''66·
83
95
88 77 30
230
132 6/12/72
133 133
141 141
. 148 148
166: 166 166. 166
6/12/72. 6/13/72
.6/11/72 6/12/72 .
6/13/72 6/14/72
6/13/72 .: 6/14/72 6/15/72 6/19/72
' ....
14 30
:25
130 ' -:1,.40 '
81 15
. 43 50
31
Minutes spent licking during first visit
of· day
;·_, '
\:
99 .· 40
10 . 27
75
70
'150 75.
. 90 73 66
83
95
88 77 30
210
74 20
. 25.
. 90 140
81 15. 43 50
Total minutes spent in subsequent visits' during same day
86
. 20' 4i' 10 '. 32· .
90
:'
45, 30, 20, 60, 14 35.
90, ·60 26
120
58, 40

Appendix III. Part 2. (Continued).
Total minutes spent Minutes spent licking Total minutes spent during first visit during first visit in subsequent visits
Collar Number Date of da~ of da~ during same da~
168 6/17/72 43 168 6/18/72 92 92 168 6/19/72 57 57
169 6/28/72 169 6/29/72• 30 30 90 169 . 6/30/7·2 169 7/1/72 169 7/2/72 12 169 7/5/72 18 18 26
178 6/11/72 55 55
185 . 6/1/72 . 66 66 185 6/2/72 131 131 . 50
190 6/12/72 54 54
194 6/4/7 2 129 129 194 6/11/72 109 109. 22' 53
202 6/22/72 202 7/5/72 48 : 48 16

Appendix III. Part 3. Time spent by collared ewes with lambs at main mineral lick on Dry Creek.
Total minutes spent Minutes spent licking Total minutes spent .during first visit during first visit .·in subsequent viSits
Collar Number Date of day of day during same da:Y
69 6/16/72 '50 50 62 69 6/17/72 90 90 13
78 6/12/72 98 98 15, 80, 85 78 6/13/72 68 '38 16 78 6/17/72 50 50 78 6/19/72 50 50
79 6/17/72 165 165 5, 60' 10, 15 . 79. 6/18/72 73 73 79 6/19/72 . 65 65 31
. 79 7/2/72 61 61 79 7/3/72 33 33 5 7.9. 7/4/72 78 78
90 . 6/19/72 90 6/20/72 40 40
97 6/17/72 55 55 135, 48, 20 97 6/18/72 70 70 33
G-4 6/17/72 ·125 125 43, 33 G-4 6/18/72 46 46 55
G-6 6/21/72 G-'6 6/22/72 G-6 7/3/7 2 103 103 G-6 7/4/72 50 50 G-6 7/5/72 50 50
106 6/17/72 90' 90 106 6/18/72 77 77 106 6/19/72 78 78
154 6/17/72 82 82 154 6/18/72 36 36 154' 6/19/72 55 55 154 7/5/72 217 217
175 7/3/72 71 71 175 7/4/72 31 31 175 7/5/72 . 108 108
182 6/11/72 102 102 120 182 6/12/72 140 140 40 182 6/13/72 63 63
33

Appendix IV. June 19, 1972, 2008 hrs. Mark Groves: Account of wolf in the lick at Dry Creek:
The wolf came sprinting down trail #2 and into the lick sc~ttering sheep in all directions, but mostly upward on trails 3, 8, 1, 2 and 7. I first caught sight·of the wolf in the grassy area on trail #2 as he was sprinting tbward zone "B". As the wolf "dove" into the lick the sheep that were in zone "B" on the wolf's left ran out via trails 8 and 1 and between them. The sheep on the wolf's right started out trail #7.
Sheep that were toward the right edge of zone "B" ran horizontally in the lick into zone "C" then turned up the lick at the foot of the bank at the right edge of "C" and ran out the top of "B" and also out trail #3. Some also ran around the side of the bank and out on trail #3 on the grass. (All this happened when the wolf entered at 2008 hrs.)
As the wolf entered zone "B" he slowed up a bit either to collect his footing or to decide which sheep to catch or both. The wolf selected a lamb which was running toward zone "D". The lamb crossed zone "D", ran around the top of the rock outcropping where the wheather station is situated, down along the right side as we face it, then into the rocks a short distance. The wolf was trailing approximately 25 yards behind. At the moment the lamb ducked into the rocks'the wolf would not have been able to see the lamb because the wolf was just reaching the top of the outcropping.
The wolf moved quickly on down around the right side of the outcropping and began hurriedly searching for the lamb in the area where the white talus meets the gray talus below the outcropping then rapidly extended his search through the little ravines of the creek bottom down to the edge of my view of the creek bottom. Upon not immediately finding the lamb the wolf began searching more slowly and throughly as he worked his way back up the creek bottom and along the side of the outcropping. He passed within 15 feet of where the lamb was hiding in the rocks and continued searching up, down and around then up over the top of the outcropping and back into zone "D".
These proceedings covered about 14 minutes. I was watching the wolf most of the time, but whenever I looked the lamb was holding a frozen "point" at the wolf.
The wolf continued across zone "D" (away from the lamb). By this time the wolf seemed to have given up seriously searching for the lamb and was merely sni·ffing about as he moved on up zone "C" and on out zone "B" which took about another seven minutes.
The wolf exited at the same place he entered and walked on out trail #2. He continued to sidehill below the ridge until he was about 200 yards up from the lick then walked up over the ridge out of sight. (The wolf was seen from the valley bottom at this time heading south about the area of the high trail which becomes #2 a~ it comes down the ridge to the lick.) Sheep were visible in the area.
34
At 2145, one hour and 35 minutes later, the lamb was still in the rocks though the tension had.eased. The lamb was lying down.
It is strange to me that I have only six sheep recorded in the 30 minute classification as being in the lick when the wolf entered because I remember it looked like more than six when they scattered. Several sheep had just gone over the ridge on trail t/2 from the lick before the wolf came and as the wolf came into the grassy area there seemed to be several sheep also in the grassy area. I believe the wolf was chasing a band back down into the lick. There were two lambs present in this band, one of which was singled out as th.e intended victim.
2310 - The wolf just showed up again in the creek bottom below the rocks where the lamb is still resting, sniffed and looked around for three or four minutes then departed down the creek or around the ridge down from the blind.
Both time·s the wolf has been here he has looked in the direction of the lamb several times without seeing it.
June 20, 1972 0130 - The lamb is ·still in the rocks, but is moving around on the outcropping quite a bit now.
0253 -Lamb finally leaves the rocks •
.. . ·. . 1 .•. ' ~ ,. ' .
~ \ ' • ~ • • r ../ ',
. ~- ~ ' ;
35