Embed Size (px)
Citation preview

Juneau Area Local Produce Demand Analysis
Prepared by:
Prepared for:
August 2017
Sustainable Southeast PartnershipSoutheast Alaska Watershed Coalition

Juneau Area Local Produce Demand Analysis
Prepared for:
Southeast Alaska Watershed Coalition
Sustainable Southeast Partnership
Prepared by:
August 2017
McDowell Group Anchorage Office 1400 W. Benson Blvd., Suite 510 Anchorage, Alaska 99503
McDowell Group Juneau Office 9360 Glacier Highway, Suite 201 Juneau, Alaska 99801
Website: www.mcdowellgroup.net

Table of Contents
Executive Summary ............................................................................................................................. 1 Local Vegetable Production ............................................................................................................... 4 Markets for Vegetables in Juneau ..................................................................................................... 6
Farmers Markets........................................................................................................................................................... 6 Restaurants .................................................................................................................................................................... 8 Institutional Facilities ................................................................................................................................................ 10 Retail Grocery Stores ................................................................................................................................................ 11
Estimated Market Size ...................................................................................................................... 13 Estimated Per Capita Produce Consumption .................................................................................................. 13 Juneau Market Size for Locally Grown Produce ............................................................................................. 14
Appendix 1: Farmer Interview Protocol .......................................................................................... 17 Appendix 2: Produce Buyer Interview Protocol ............................................................................. 20 Appendix 3: Average Grocery Store Vegetable Weights per Unit ............................................... 24
List of Tables
Table 1. Vegetable Crop Ratings and Measures of Return on Investment ...................................................... 5 Table 2. Juneau Area Retail and Farmer Vegetable Prices, Per Pound .............................................................. 8 Table 3. Wholesale Prices for Selected Vegetables ................................................................................................. 12 Table 4. Estimated Consumption of Selected Fresh Vegetables, Juneau, 2016 (pounds) ........................ 14 Table 5. Estimated Juneau Market for Fresh Organic/Specialty/Premium Vegetables (pounds) .......... 15

Juneau Area Local Produce Demand Analysis McDowell Group Page 1
Executive Summary
Sustainable Southeast Partnership and Southeast Alaska Watershed Coalition contracted with McDowell Group
to conduct a study of the market for locally grown produce in Juneau. The information in this report is intended
to be useful to current and potential growers, and others working to support their activities.
Currently at a small-scale, the local produce industry has the potential for significant rates of growth. Such
growth will depend in part on improvements to the efficiency and profitability of area farms. Market research
can support this development by helping farmers tailor their production to the demands of their target markets.
The following are key findings and recommendations from this study.
Demand Far Exceeds Supply
Currently, locally-grown commercial vegetable production represents a fraction of overall produce sales in
Juneau. Even during the peak of the growing season, local commercial production accounts for less than one
percent of total demand for most crops. If the comparison is limited to the organic/specialty/premium
vegetable market, local production represents at most 10-15 percent of demand during that time period,
depending on the vegetable.
While not insatiable, there is significant room for growth in local farm sales, with the possible exception of garlic,
where significant growth in sales would likely require spreading sales out into the fall.
Continued Focus on Direct-to-Consumer Market Warranted
The region’s growers have generally focused on selling directly to consumers through farm stands and farmers
markets. These markets pay the highest prices to farmers. In addition, farmers markets reduce the marketing
effort required and are a good fit with the highly seasonal nature of production in the region.
Most Promising Crops
Information collected from the six largest Juneau area growers indicates that garlic, kale, and carrots are the
most important crops overall. Combined, these crops represent over a third of total vegetable sales for the
farmers that provided data. While the garlic market may be somewhat saturated, increasing production and
marketing of kale and carrots is recommended. Other key crops have proven valuable and reliable to local
growers and should be considered for expanded production and marketing, including chard, salad mix, salad
turnips, peas, beets, cucumbers, squash, and potatoes.
Based on comparisons between prices charged by local farmers and comparable grocery store prices, the
following crops are produced at competitive prices and warrant additional local production and marketing:
basil, beets, lettuce, parsnips, rhubarb, green onions, peas, cabbage, and turnips.
Pricing and Marketing Considerations
Growers report difficulty pricing items. Factors contributing to this difficulty include a lack of tracking the cost
of inputs, a difficulty measuring the value of one’s own labor, and the wide variety of crops grown on most local

Juneau Area Local Produce Demand Analysis McDowell Group Page 2
farms. Indeed, an analysis of prices charged by local farmers indicates a wide variation in many crop prices.
This variation is masked to some degree by the fact that locally-grown produce is more likely to be sold by the
bunch/each and the absence of standard bunch sizes between local growers.
Some prices are below comparable rates at grocery stores. This is true for certain farmers growing kale,
cabbage, beets, peas, and rhubarb. Farmers should consider increasing prices for these items to more closely
align with grocery store prices. As the local produce industry grows, increased interaction with consumers and
other growers will help farmers better understand the value of their goods.
In general, farmers market customers appear willing to pay high markups for locally grown produce, presumably
because of increased quality and freshness as well as a desire to support the efforts of local farmers. It is not
uncommon to see markups at local markets of 100 percent or more over comparable alternatives.
Prices charged in more mature local produce markets, such as the Kenai Peninsula and Anchorage areas, tend
to vary substantially less and are much closer to those at grocery stores. Southeast Alaska farmers’ prices will
likely remain relatively high due to increased transportation, land, and other costs. However, as Juneau’s direct
sales markets mature and competition increases somewhat, more consistent pricing – as well as more consistent
sizing of bunches – should emerge. Such standardization will likely be appreciated by customers.
Restaurants and Grocery Stores Markets a Good Fit for Certain Items
Other produce buyers are very interested in locally grown produce but less willing to pay the premium prices
farmers can charge at farmers markets. Grocery stores pay particularly low prices for produce due to volume
discounts through wholesale distributors. In general, grocery store prices reflect a 100 percent markup over
wholesale prices, whereas farmers market prices typically reflect a 50 to 100 percent markup over grocery prices.
Restaurants order most of their food through distributors, but also supplement with purchases from Costco and
other grocery stores. Distributors serving restaurants generally charge slightly below grocery store prices, but
provide a service tailored to the challenges of running a restaurant (including delivery and ability to order
everything from vegetables to cleaning supplies).
Promising Opportunities Include Herbs, Lettuce, and Specialty Crops
Herbs, especially basil but also many other varieties, appear to be promising crops for sale into the restaurant
and grocery store markets. Buyers report an interest in and ability to market high quality herbs in their stores
and use them in their restaurants. From a grower’s perspective, herbs and salad mixes are more difficult to sell
exclusively through farmers markets, due to their perishability. In addition, if year-round or extended-season
growing techniques are used, the extra effort needed to develop a network of grocers and chefs can be offset
by consistent, relatively high-volume purchasing.
Chefs also report unmet demand for locally-grown specialty products that would be memorable to restaurant
costumers. Specific specialty products mentioned include arugula, spring mix, uniquely-colored vegetables,
baby turnips, garlic scapes, baby carrots, beets, fennel, fingerling potatoes, shallots, green onions, and other
varieties. If these products can be tied to a broader compelling story, chefs are even more interested. A notable
example that grows well in our climate is Tlingit and Haida fingerling potatoes.

Juneau Area Local Produce Demand Analysis McDowell Group Page 3
Marketing other local vegetables that have fewer points of differentiation – such as other potatoes, radishes,
and parsnips, for example – into these markets will require lower prices than currently offered by Juneau growers
or a particularly supportive chef or grocer (Rainbow Foods is one example).
Recommendations to Support Local Production
The immediate priority should be to increase production and sales of crop varieties that have been proven to
grow well in our climate and produce a high rate of return for local farmers. These crops include chard, kale,
carrots, garlic, salad mix, squash, peas, cucumbers, and other varieties.
Support Direct-to-Consumer Market
Initial reports from some farmers indicate that weekly sales opportunities through the Salt and Soil Marketplace
are addressing needs for additional sales opportunities. It will likely take a year or two for farmers to adjust
their crop selection and volume to adapt to the online marketplace. Continued support is warranted.
A more detailed understanding of the preferences of customers at in-person farmers markets as well as the Salt
and Soil Marketplace will provide useful information for farmers. A survey of these consumers would be
relatively inexpensive given the limited number of in-person farmers markets and the possibility of an online
survey for Salt and Soil Marketplace users.
Herbs Could Benefit from Additional Study
Herbs appear to be promising for the restaurant, grocery store, and direct-to-consumer markets. However,
herbs have not been prioritized by local growers, with the exception of basil. Additional research on herb
markets and production would help flesh this opportunity out and may encourage experimentation by local
growers. When included as part of larger produce studies, herbs are often lumped together and individual
varieties are not studied in detail, contributing to a lack of information.
Address Production Constraints and Support Farmer to Farmer Knowledge Transfer
In addition to market-related efforts, attention needs to be placed on addressing supply issues, which appear
to be the most significant factor limiting growth of the industry. Farmers themselves are likely the best ones to
experiment and find solutions to production and efficiency challenges. A role for supporting organizations can
be continued support for knowledge transfer, both between growers in Southeast Alaska and with growers in
similar climates outside of the region. The Southeast Alaska Farmers Summit is a successful example that should
be continued if possible. Knowledge transfer may also help identify promising new crop varieties. For instance,
salad turnips have been successfully grown and marketed by area growers despite being an unfamiliar vegetable
to many consumers.
Continue to Highlight the Exciting Future for Locally Grown Produce
There is considerable and growing consumer interest in local food, both in Southeast Alaska and nationally.
Strategic, realistic efforts to support the local industry are likely to see results and be appreciated by the
community. Highlighting successes will grow awareness and contribute to excitement about the future of the
region’s agricultural and related industries.

Juneau Area Local Produce Demand Analysis McDowell Group Page 4
Local Vegetable Production
Juneau area farmers produce a variety of vegetables for local markets. Interviews with a selection of the region’s
commercial growers provide useful information and feedback on each crop. An understanding of the crops
local growers find particularly feasible and remunerative is useful to current and potential growers, as well as
entities interested in supporting their activities and purchasing their products.
Six regional growers were identified by the project team for inclusion in this study. The decision was made to
limit the study to growers with substantial sales in 2016 and good record keeping. Four of these growers
participated in detailed interviews.1 The interview protocol used in included as Appendix 1. Two additional
growers provided some information, which was supplemented by pricing observations and other data sources,
including a 2016 study of the Haines market and information presented at the 2017 Southeast Alaska Farmer
Summit.2
Growers were asked a series of questions about their farm, approach to marketing, key challenges and
opportunities, and other topics. In addition, a variety of data was collected for each vegetable grown, including
amount sold, prices charged, square footage devoted to crop, a subjective ranking of the labor required to grow
the crop, and a similar ranking of the return on investment for each crop. Data collected was used to calculate
a revenue per square foot estimate for each crop, among other analyses. All data was based on 2016 activities.
Measures of Crop Feasibility and Return on Investment
As detailed in Table 1 on the following page, a total of 23 vegetables were grown in 2016 by at least two of the
six farmers interviewed or studied for this report. Vegetables grown by only one farmer were excluded from
this table. All growers interviewed used greenhouses or high tunnels as at least a part of their operation.
Vegetables grown by five or more of the farmers studied include beets, carrots, chard, cucumbers, garlic, kale,
peas, potatoes, salad mix, and squash (zucchini and/or summer squash).
Growers were asked to rate the overall return on investment from each crop on a subjective scale of 1 (lowest
return) to 5 (highest return). Crops with an average rating of 4 or higher include beets, broccoli, cabbage,
carrots, chard, cucumbers, garlic, herbs, kale, and tomato. Additional crops with an average rating of 3 or higher
include kohlrabi, peas, peppers, potatoes, salad mix, and squash (zucchini and/or summer squash).
Farmers were also asked for information on the gross sales as well as the total square footage devoted to
growing each crop. From this information, revenue per square foot estimates were generated.3 The crops with
1 Growers interviewed included Eli Wray (Panhandle Produce), Bo Varsano and Marja Smets (Farragut Farm), Jen Landry, and Joe Orsi (Orsi Organic Produce). 2 Takshanuk Watershed Council, 2016. Haines Alaska Food Hub Implementation Plan. Joe Orsi, 2017. Crop Values from Farmers Market Sales in Juneau. A presentation to the 2017 Southeast Alaska Farmers Summit. 3 It should be noted that these estimates are challenged by the ability of growers to accurately estimate the growing areas and sales for each crop. However, the project team believes these issues to be reduced to the extent practical. Due to limited comparability between growing operations relying on pots and those relying on soil in contact with the ground, the estimates presented are limited to those derived from growing in the ground (the method used by five of the six growers studied).

Juneau Area Local Produce Demand Analysis McDowell Group Page 5
the highest average revenue per square foot were chard, kale, rhubarb, squash, salad turnips, kohlrabi, lettuce,
garlic, and carrots. By gross sales, the top crops were garlic, carrots, kale, salad mix, and salad turnips.
Growers were also asked to rate each crop on a subjective ranking of amount of labor required – 1 (lowest labor
requirements) to 5 (highest). It is interesting to note that only two crops grown by two or more farmers were
rated a 4 or higher on this scale. As found in previous studies, affordable labor is a major limiting factor to
farming in Southeast Alaska.4 This subject, as well as other aspects of the inputs and costs of growing food,
deserve additional discussion but are beyond the scope of this study.
For each of the four measures of feasibility and return on investment detailed above, the top ten crops are
shown in bold in Table 1. Four crops – carrots, chard, garlic, and kale – were in the top ten for each of the four
measures. Other crops in the top ten of at least two of the feasibility measures include beets, peas, cucumbers,
squash, salad mix, potatoes, and salad turnips.
Table 1. Vegetable Crop Ratings and Measures of Return on Investment
Notes: Data obtained from six Juneau area growers, though not all farmers provided all types of data. ROI refers to Return on Investment.
4 McDowell Group, 2017. Current and Potential Impacts of Locally-Grown Produce in Southeast Alaska. Prepared for Spruce Root, Inc. and Sustainable Southeast Partnership.
Vegetable Number of
Farmers Growing Vegetable
Avg. Labor Required Rating 1 (low) - 5 (high)
Avg. ROI Rating 1 (low) - 5 (high)
% of Total Farm Vegetable Sales
Avg. Revenue per Square Foot
Garlic 5 2 4 17.8% $3.86
Carrots 5 3 4 10.0% $3.82
Kale 5 2.3 4.5 8.6% $7.25
Salad mix 4 3.75 3.8 8.1% $5.42
Salad turnips 2 2 3 6.0% $4.69
Peas 5 2.3 3.75 5.4% $3.36
Cucumbers 5 3.3 4 5.0% $3.55
Potatoes 5 2 3.25 4.6% $1.36
Chard 5 2.3 4.25 3.9% $8.71
Squash 5 2.5 3.7 3.4% $4.73
Beets 5 2 4 2.8% $3.09
Cabbage 4 1.7 4 2.8% $2.35
Lettuce 2 3 2 2.5% $3.94
Tomato 3 3 5 2.2% $2.47
Rhubarb 3 1 5 1.9% $6.62
Kohlrabi 2 2 3.5 1.4% $4.01
Herbs 2 1 4 0.9% $2.56
Radish 4 2 2.3 0.4% $1.13
Peppers 3 2 3 0.1% -
Dill 2 2 2 0.1% $3.00
Onions 2 5 1 0.1% $1.39
Broccoli 2 3 4.5 0.1% -
Cauliflower 2 4 2.5 0.1% -

Juneau Area Local Produce Demand Analysis McDowell Group Page 6
Markets for Vegetables in Juneau
This section provides a summary of interviews conducted with Juneau-based restaurants, institutional facilities,
retail grocers, and wholesale distributors. The protocol used for these interviews is included as Appendix 2. A
section on farmers markets is based on interviews with local growers, data and feedback from farmer’s market
representatives, and other sources. The information presented in this chapter is also informed by related studies
conducted by McDowell Group analyzing the Juneau, Southeast Alaska, and Alaska produce markets.5
Farmers Markets
The most important market mentioned by the growers interviewed was direct-to-consumer sales, such as
through farmers markets. Farmers indicated that such sales offer the best opportunity to maximize revenue
and charge the highest prices. In addition, for many growers, farmers markets require less marketing effort
compared to individually coordinating with various individual and commercial buyers.
In 2016, Juneau farmers market opportunities were largely limited to once or twice a month. These
opportunities included the Second Saturday Farmers and Crafters Market at the Airport Shopping Mall (monthly
year-round) and the Juneau Local Food Festival (single event in late August at the Juneau Arts and Culture
Center). One prominent Juneau-based grower sold all their produce at a total of six sales opportunities,
including four Second Saturday markets, the Local Foods Festival (the most important single sales event), and
only one major sale arranged outside of organized markets. Other growers had more developed informal
direct-to-consumer sales networks, though none of those interviewed used CSA or u-pick models. Three of the
growers operated their own regular farm stands, and one of these farmers also sold through an email newsletter.
One of the farm stands, Juneau-based Pandhandle Produce, was operated on a weekly basis and occasionally
sold produce grown by other area farmers.
At a round-table meeting with Juneau area farmers, several mentioned that having only one or two farmers
market opportunities each month was challenging from a production stand-point. Especially during peak
production times and for perishable crops, produce maturing between market opportunities can go to waste
waiting for a market.
In 2017, a weekly online market, Salt and Soil Marketplace, was added as an option for growers selling into the
Juneau and Haines communities. Salt and Soil Marketplace connects growers and buyers through an online
ordering platform and physical drop off/pick up site.
Initial reports from some farmers indicate that weekly sales opportunities through the Salt and Soil Marketplace
are addressing the need for additional sales opportunities. It will likely take a year or two for farmers to adjust
their crop selection and volume to adapt to the online marketplace. Ultimately, if successful the marketplace
should result in increased sales for Juneau area growers.
5 McDowell Group, 2017. Current and Potential Impacts of Locally-Grown Produce in Southeast Alaska. Prepared for Spruce Root, Inc. and Sustainable Southeast Partnership. Other prior studies reviewed were confidential and are not publicly available.

Juneau Area Local Produce Demand Analysis McDowell Group Page 7
Preferred Types of Locally Grown Produce
Farmers market customers were not interviewed as part of this study. Because local growers have generally
focused on this market, their experiences and opinions about various crops inform this discussion. The first
section of this report provides a variety of information on the crops local growers find particularly feasible and
remunerative.
A previous McDowell Group study found that the most popular items at Anchorage farmers markets were
potatoes, carrots, tomatoes, squash, and lettuce. Onions, snap/sugar peas, green onions, sweet corn, beets,
green beans, kale, mustard greens, and strawberries were also identified as popular. Unusual Asian greens, kale,
string beans, turnips, rutabagas, kohlrabi and squash (at times of peak abundance) were mentioned as more
difficult to sell at those markets.
Sales data from a seasonal, weekly online marketplace operating in the Kenai Peninsula provides additional
perspective. The vegetables accounting for more than 5% of total vegetable sales through the Kenai Peninsula
Food Hub in 2016 were carrots (11 percent of total vegetable sales), salad mix (8.5 percent), cabbage (8 percent),
tomato (7.75 percent), potatoes (6.5 percent), kale (6 percent), and onions (5.2 percent).6 Other vegetables
included, in declining order, beets, radishes, herbs, turnips, lettuce, spinach, cilantro, bok choy, cucumber,
arugula, chard, garlic, peas, peppers, parsnips, and others. By percentage of total sales, four of the top ten crops
for Kenai growers were also in the top ten for Juneau growers, including carrots, salad mix, potatoes, and kale.
Markups for Locally Grown Produce
The table on the following page compares the prices charged by Juneau grocery stores to the prices charged
by Juneau-area growers for direct-to-consumer sales. Grocery prices in Table 2 reflect organic and/or specialty
crop prices, which are generally 10 to 100 percent higher than the prices charged for comparable conventional
vegetables. In this report, organic and specialty vegetables are considered the closest comparison to locally
grown produce, though it is should be noted that not all local farmers grow organically.
Vegetable prices were converted to per pound prices, though sales by the bunch or by item are common for
certain crops and average weights per unit were not always available for farmer’s sales. For this reason, absence
of per pound prices for certain vegetables in Table 2 does not necessarily mean these crops aren’t grown locally.
Five vegetables are sold by local growers at lower average prices than those charged for comparable produce
at Juneau grocery stores – basil, beets, lettuce, parsnips, and rhubarb (shown in bold in Table 2).
In addition, another four vegetables – green onions, cabbage, peas, and purple top turnips – are sold by local
farmers at prices that average less than a twenty percent markup over retail prices. Other vegetables are sold
at higher markups.
For additional context, price data was also collected from two established growers in other parts of Alaska –
one based in Homer and one in the Mat-Su (see far right column in Table 2). Prices for these two growers were
6 McDowell Group analysis of data provided by the Kenai Peninsula Food Hub.

Juneau Area Local Produce Demand Analysis McDowell Group Page 8
relatively consistent and generally lower than those reported by Juneau area growers. Cheaper and more
available land and a higher level of market competition may be factors.
Table 2. Juneau Area Farmer and Organic/Specialty Retail Vegetable Prices, Per Pound
Restaurants
Interviews with chefs, restaurant owners, and kitchen managers representing nine Juneau restaurants indicate a
high level of interest in purchasing locally grown produce. Most of the restaurants interviewed were considered
fine dining or high-end casual dining operations. A few were mid-range eateries with less upscale menus.
Interviewees generally stated that they use local produce when they can, but supplies are limited. It should be
noted that interviews were targeted to the restaurants most likely to be interested in purchasing locally and
feedback from lower price point restaurants was not solicited.
Vegetable Range of Farmer Prices
Average Farmer Price
Average Retail Price
Other Alaska Farmers
Basil - $20.00 $27.96 $12.00-$20.00
Spinach - $16.00 $3.83 $5.00-$8.00
Garlic $12.00-$20.57 $15.64 $11.11 -
Salad mix $11.00-$19.20 $13.76 $5.49 $10.00
Green onions $10.00-$14.00 $12.00 $9.96 $3.89-$5.00
Chard $5.00-$20.00 $11.00 $4.21 $4.00
Kale $5.00-$20.00 $11.00 $5.21 $4.00-$5.00
Peas $5.50-$11.00 $9.06 $7.99 $5.99-$8.00
Shallots - $8.00 $3.99 -
Tomato $5.00-$10.00 $8.00 $4.22 $5.00
Lettuce - $5.00 $5.28 $5.00-$6.00
Cucumbers $3.00-$6.00 $4.75 $2.54 $4.00
Turnips, salad $2.89-$5.33 $4.11 - $2.49-$4.00
Radish $2.00-$6.00 $4.00 $2.30 $3.00
Carrots $2.50-$6.00 $3.88 $1.86 $1.69-$4.00
Squash $2.50-$5.00 $3.88 $2.76 $2.00-$2.69
Rhubarb $3.43-$4.00 $3.81 $4.99 -
Potatoes $2.00-$6.00 $3.30 $1.91 $2.99-$3.99
Parsnips - $2.85 $2.95 -
Turnips, purple top - $2.67 $2.47 $2.00-$2.19
Cabbage $1.66-$3.00 $2.29 $1.92 $1.69-$2.00
Beets $2.00-$2.50 $2.17 $2.64 $1.75-$3.00
Bok Choy - - $3.99 $2.49-$7.00
Broccoli - - $3.05 $2.89-$4.19
Cauliflower - - $3.03 $2.69-$4.00
Cilantro - - $6.89 $16.00
Herbs - - $59.52 $12.00-$16.00
Kohlrabi - - $2.66 $2.19-$2.89
Leeks - - $2.96 $3.49
Parsley - - $10.32 $8.00-$16.00
Juneau Area Local Produce Demand Analysis McDowell Group Page 9
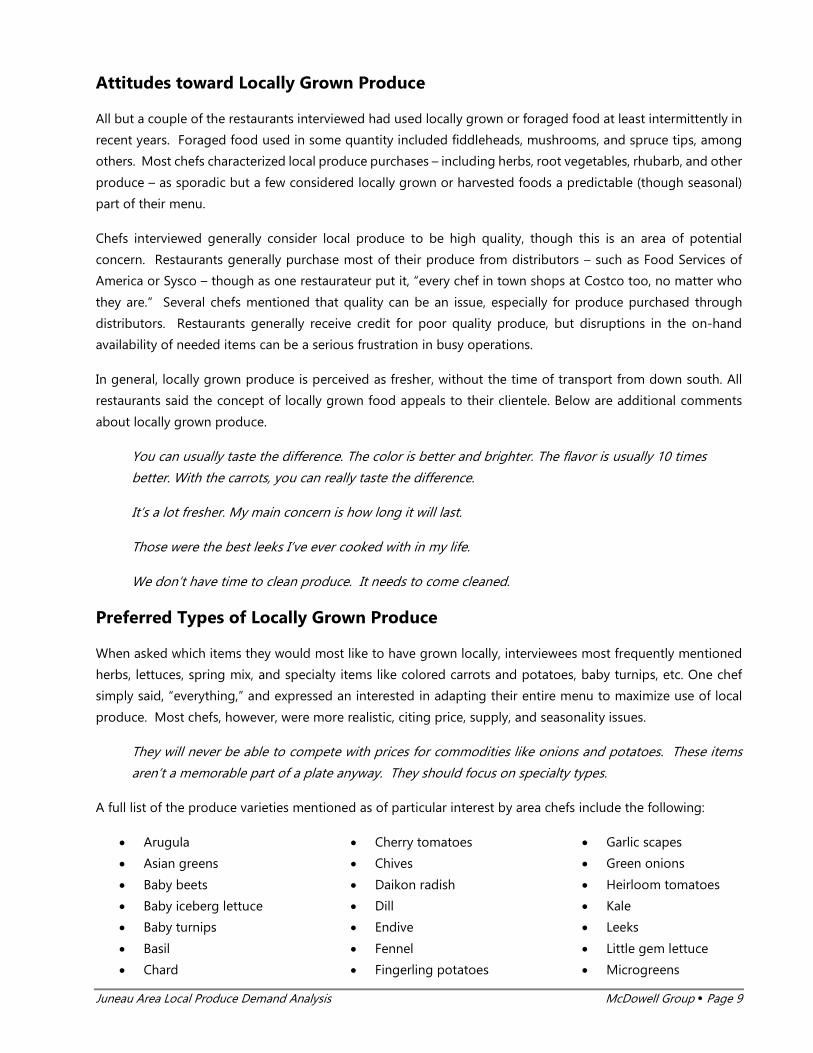
Attitudes toward Locally Grown Produce
All but a couple of the restaurants interviewed had used locally grown or foraged food at least intermittently in
recent years. Foraged food used in some quantity included fiddleheads, mushrooms, and spruce tips, among
others. Most chefs characterized local produce purchases – including herbs, root vegetables, rhubarb, and other
produce – as sporadic but a few considered locally grown or harvested foods a predictable (though seasonal)
part of their menu.
Chefs interviewed generally consider local produce to be high quality, though this is an area of potential
concern. Restaurants generally purchase most of their produce from distributors – such as Food Services of
America or Sysco – though as one restaurateur put it, “every chef in town shops at Costco too, no matter who
they are.” Several chefs mentioned that quality can be an issue, especially for produce purchased through
distributors. Restaurants generally receive credit for poor quality produce, but disruptions in the on-hand
availability of needed items can be a serious frustration in busy operations.
In general, locally grown produce is perceived as fresher, without the time of transport from down south. All
restaurants said the concept of locally grown food appeals to their clientele. Below are additional comments
about locally grown produce.
You can usually taste the difference. The color is better and brighter. The flavor is usually 10 times
better. With the carrots, you can really taste the difference.
It’s a lot fresher. My main concern is how long it will last.
Those were the best leeks I’ve ever cooked with in my life.
We don’t have time to clean produce. It needs to come cleaned.
Preferred Types of Locally Grown Produce
When asked which items they would most like to have grown locally, interviewees most frequently mentioned
herbs, lettuces, spring mix, and specialty items like colored carrots and potatoes, baby turnips, etc. One chef
simply said, “everything,” and expressed an interested in adapting their entire menu to maximize use of local
produce. Most chefs, however, were more realistic, citing price, supply, and seasonality issues.
They will never be able to compete with prices for commodities like onions and potatoes. These items
aren’t a memorable part of a plate anyway. They should focus on specialty types.
A full list of the produce varieties mentioned as of particular interest by area chefs include the following:
• Arugula
• Asian greens
• Baby beets
• Baby iceberg lettuce
• Baby turnips
• Basil
• Chard
• Cherry tomatoes
• Chives
• Daikon radish
• Dill
• Endive
• Fennel
• Fingerling potatoes
• Garlic scapes
• Green onions
• Heirloom tomatoes
• Kale
• Leeks
• Little gem lettuce
• Microgreens

Juneau Area Local Produce Demand Analysis McDowell Group Page 10
• Napa cabbage
• Rhubarb
• Rosemary
• Salad mix
• Shallots
• Snow/snap peas
• Sorrel
• Specialty carrots
• Thyme
• Zucchini and summer
squash
Markups for Locally Grown Produce
All of the high-end restaurants interviewed said they were interested in buying local produce. Many said that
they are willing to pay somewhat more if the produce was high-quality, especially if it was an item that would
be memorable to the restaurant customer. Below are some of the comments people made when addressing
the importance of price:
It is a factor. But we make a lot of choices that cost us more money if we feel there's a value there.
You need things that are going to finish a plate. We'll pay more to get something premium, but it
has to make a mark on the plate to a guest.
Interviewees were asked whether they would pay an additional 10, 15, or 25 percent more for locally grown
produce. The majority of those interviewed said they would be willing to pay up to 25 to 30 percent more for
certain produce varieties, assuming high quality. One said they would pay 10 percent more, though higher
markups would still be considered. Some pointed out that keeping costs under control is a constant effort, and
it would likely take time to figure out what they could afford, including what additional costs their customers
would be willing to pay. “In general, food costs have to be maintained. So, we could do it for exceptions, but
not necessarily always,” one chef said.
Other Feedback for Growers
Chefs and restaurant managers generally order produce 3 to 7 days ahead of time, and emphasized that
dependability it key.
Make sure when you say you've got those things, you're really going to be able to produce it.
Some of the chefs and kitchen managers interviewed mentioned the importance of good communication,
especially considering the many difficulties of running a restaurant. If a farmer was particularly easy to work
with, it could entice them to purchase locally more regularly. Examples of good communication mentioned
included regular check-ins to see how the produce worked out, a predictable and dependable ordering process
initiated by the grower, and a billing process/paper trail that allows for tracking and analysis of the affordability
of past purchases.
Institutional Facilities
Repeated attempts were made to interview a variety of Juneau area institutional facilities. Only one participated
in a detailed interview and provided useful data and feedback. This section is also informed by previous
McDowell Group studies on produce markets, including interviews with seven additional institutional facilities.

Juneau Area Local Produce Demand Analysis McDowell Group Page 11
There is considerable variation in the constraints and priorities facing food buyers at institutional facilities. Some
strive to purchase produce at the lowest possible cost, while others are primarily concerned about quality
control. All institutions interviewed were supportive of purchasing Alaska-grown produce; however, some
expressed the opinion that their systems made it difficult to support this objective. One issue mentioned was
that many institutions have stringent quality requirements. For instance, the Alaska Department of Corrections
requires that produce comply with USDA requirements. Interviewees mentioned that individual farmers may
have difficulties meeting these requirements on their own.
Current (May 2017) prices paid by a Juneau facility that provided detailed information included broccoli at $1.87
per pound (12 pounds purchased weekly), carrots at $0.57 per pound (25 pounds weekly), zucchini at $1.48 per
pound (20 pounds weekly), and spinach at $1.76 per pound (2.5 pounds weekly). These prices are roughly half
the average prices charged by local growers. While institutional facilities do not appear to be a particularly
promising market, there are important considerations unique to each institution. Each facility has a different
mission and those particularly interested in local produce may be worth approaching, especially if a stable, long
term buyer is a priority for a particular grower and crop.
Retail Grocery Stores
The study team conducted interviews with produce managers and staff representing four Juneau-area retail
grocery stores, including Foodland, Super Bear, Rainbow Foods, and Safeway. Information provided by each
retailer varied. While retail operators were forthcoming about what products they carry and other information,
the interviewees provided few specific details on other topics, such as volumes sold.
Preference for Locally Grown Produce
Produce managers interviewed indicated a high level of interest in supporting the development of local
agriculture in the Juneau region. “I’m a farmer at heart,” one said, “tell them to contact me and we’ll work with
them.” However, at least two of the managers interviewed had over a decade of experience in Juneau and their
excitement was tempered by a realism brought on by repeated exposure to aspirational or beginning farmers
that engage them but never deliver or deliver very sporadically. As one produce manager put it, “the farms
won’t last . . . sad but true.”
Preferences for Types of Locally Grown Produce
Retailers were asked to list the fresh produce items they would most like to see grown locally. The items varied
by retailer with one firm feeling strongly that herbs (especially basil, thyme, rosemary, and mint but also parsley,
dill, and other herbs) were in demand and the most promising crop type for local growers. Another retailer was
most interested in local potatoes, carrots, lettuce, salad mix, kale, garlic, and baby turnips. Requested products
also included tomatoes, zucchini/summer squash, spinach, and cut flowers.

Juneau Area Local Produce Demand Analysis McDowell Group Page 12
Markups for Locally Grown Produce
Produce managers – due to high volumes and other factors – are
able to purchase produce at much lower prices than other buyers.
Table 3 at right provides a sample of prices paid by local grocers for
produce purchased from wholesale distributors.
In general, retail grocery store prices reflect a 100 percent markup
over wholesale vegetable prices, according to produce managers
interviewed. Of course, this is not a hard rule and actual markups
will depend on supply, demand, promotions, and other factors. For
one grocery store interviewed, average markup across all vegetable
types (non-local produce only) was roughly 115 percent, though
markups for specific produce items ranged from 25 percent to 200
percent or more.
For locally-grown produce, the majority of managers interviewed
indicated a willingness to reduce their markup from roughly 100
percent to something more like 33 to 50 percent for the right, high-
quality locally grown produce types. For example, an item that a
grocer typically purchases at a wholesale rate of $2 a bunch – and
sells for $4 a bunch retail – could be purchased from local sources
for $2.66 to $3 a bunch. Of course, actual markups acceptable to
produce managers will depend on supply, quality, desirability of the
produce type, and relationship between grower and produce
manager.
One produce manager summed up the discussion on prices and
markups, as follows: “Farmers should look for other markets where
they can fetch higher prices. After that, they can bring what’s left
here and we’ll work with them.”
Organic/Premium Vegetable
Wholesale price (per pound)
Dill $14.44
Rosemary $13.15
Mint $12.50
Oregano $12.50
Basil $8.94
Garlic $3.92
Brussel sprouts $3.81
Cilantro $3.41
Parsley $3.30
Tomato $3.24
Shallot $2.90
Green onions $2.20
Chard $1.97
Kale $1.91
Lettuce $1.51
Broccoli $1.35
Leeks $1.34
Zucchini $1.31
Beets $1.29
Turnip $1.25
Carrots $1.21
Celery $1.09
Cucumber $0.86
Cabbage $0.85
Potato $0.73
Table 3. Wholesale Prices for Selected Vegetables

Juneau Area Local Produce Demand Analysis McDowell Group Page 13
Estimated Market Size
Currently, local farmers, produce buyers, and other stakeholders indicate that demand for locally grown produce
far exceeds supply. Supply issues are outside of the scope of this study, but include affordable land and labor.
This section estimates the market for locally-grown produce based on current sales of organic, premium, and
specialty produce in Juneau. Estimates are based on data provided by wholesalers and retailers and interviews
with other knowledgeable sources. USDA per capita consumption data is also discussed.
Estimated Per Capita Produce Consumption
USDA Per Capita Consumption Estimates
USDA’s Economic Research Service (ERS) produces annual estimates of total food availability for selected food
commodities. These estimates reflect the best available data on how much of each type of food is used per
capita each year. As described by the agency,
ERS calculates the residual of a commodity's total annual available supply after subtracting measurable uses, such as farm inputs (feed and seed), exports, ending stocks, and industrial uses. The annual data series includes per capita food availability estimates, which are useful for studying food consumption trends because they are a proxy for actual food intake.7
The ERS also estimates how much of each food commodity ends up as waste in various steps from the field to
consumption. Data presented below account for only those wastes occurring before the retail level. Estimates
are only available for selected, widely consumed vegetables.
Consumption estimates for the Juneau market are derived from per capita USDA estimates and Juneau’s 2016
population (32,739).8 The consumption of produce in the region increases dramatically in the summer months
because of the influx of non-resident workers and the significant volume of visitors. Grocers and wholesalers
interviewed estimated produce volume in the fall, winter, and spring at about half of summer volume. The USDA
model was adjusted to account for three summer months with consumption double that of the rest of the year.
7 The most recent available estimates are for 2014. For more information on this data source, see https://www.ers.usda.gov/data-products/food-availability-per-capita-data-system/food-availability-documentation/. 8 Population estimate from Alaska Department of Labor and Workforce Development. http://live.laborstats.alaska.gov/pop/index.cfm

Juneau Area Local Produce Demand Analysis McDowell Group Page 14
Table 4. Estimated Consumption of Selected Fresh Vegetables, Juneau, 2016 (pounds)
Fresh Vegetable Per Capita Consumption
Est. Juneau Weekly Consumption
(winter)
Est. Juneau Weekly Consumption
(summer)
Estimated Total Consumption
Potatoes 32.2 20,269 40,537 1,297,192
Tomatoes 17.4 10,973 21,945 702,240
Head lettuce 13.5 8,469 16,938 542,011
Romaine 10.0 6,312 12,623 403,937
Peppers 9.8 6,190 12,381 396,186
Carrots 8.2 5,172 10,344 330,998
Cucumbers 6.8 4,285 8,570 274,239
Cabbage 6.2 3,910 7,820 250,246
Broccoli 6.1 3,845 7,690 246,077
Celery 5.1 3,237 6,475 207,187
Squash 4.1 2,600 5,200 166,395
Garlic 1.6 986 1,971 63,083
Spinach 1.5 925 1,849 59,170
Cauliflower 1.2 747 1,494 47,806
Radishes 0.5 293 586 18,764
Kale 0.5 285 570 18,248
Mustard greens 0.3 217 434 13,894
All Fresh Vegetables 171 107,661 215,322 6,890,300
Source: USDA ERS Food Availability data.
Juneau Market Size for Locally Grown Produce
The USDA data presented above includes convention, organic, and other produce types. However, the most
relevant data for estimating the potential market for locally grown food is that related to the
organic/premium/specialty produce markets. According to the Organic Trade Association, 13.6 percent of fruits
and vegetables purchased by U.S. consumers are organic.9
The market size estimates presented below are based on sales of organic, premium, and specialty produce only.
Market size estimates are presented in ranges to reflect considerable uncertainty because local retailers and
others generally did not share proprietary sales volume data. Estimates are only developed for selected
vegetables where sufficient information from produce buyers and other sources was available.
9 https://ota.com/sites/default/files/indexed_files/Infographic%20and%20Citations.pdf

Juneau Area Local Produce Demand Analysis McDowell Group Page 15
Table 5. Estimated Juneau Market for Selected Fresh Organic/Specialty/Premium Vegetables (pounds)
Fresh Vegetable Estimated Annual Sales
Potatoes 50,000-60,000
Carrots 35,000-50,000
Lettuce 30,000-35,000
Tomatoes 25,000-35,000
Broccoli 20,000-24,000
Squash 20,000-25,000
Cabbage 18,000-20,000
Kale 14,000-18,000
Celery 12,000-15,000
Beets 12,000-14,000
Cucumber 12,000-16,000
Chard 5,000-8,000
Basil 5,000-7,000
Brussels 4,000-6,000
Garlic 4,000-6,000
Shallot 4,000-6,000
Green onions 4,000-6,000
Leeks 3,000-5,000
Cilantro 3,000-5,000
Turnip 3,000-5,000
Parsley 3,000-5,000
Rosemary 300-500
Mint 400-600
Dill 200-300
Oregano 150-300
Source: McDowell Group estimates.
A few points of reference are useful for evaluating the above estimates. Compared against the vegetables for
which USDA consumption data is available (see Table 4), volumes for organic/specialty/premium varieties
represent between 5 and 15 percent of total overall volumes, depending on the vegetable. An outlier is kale,
where estimates for the Juneau organic market are about equal to the estimated kale consumption based on
the USDA data. Obviously not all kale consumed in Juneau is organically grown. A reasonable explanation is a
combination of a higher than average per capita kale consumption and a higher preference by kale consumers
for organic kale.
It is also useful to compare the organic/specialty/premium market with local production volumes. This study
did not attempt to calculate total locally-grown commercial production entering the Juneau market, but a
previous study of commercial production in Southeast Alaska contains relevant data.10 The following reference
points are based on assuming that a third of commercial production in Southeast Alaska enters the Juneau
10 Such estimates are only available for ten crops. Source: McDowell Group, 2017. Current and Potential Impacts of Locally-Grown Produce in Southeast Alaska. Prepared for Spruce Root, Inc. and Sustainable Southeast Partnership.

Juneau Area Local Produce Demand Analysis McDowell Group Page 16
market and all produce sales occur over a two-month window.11 Given these assumptions, the following are
upper estimates of the proportion of the late summer organic/premium market represented by locally-
produced vegetables: potatoes, 7 percent; carrots, 10 percent; garlic, 60 percent; squash, 7 percent; cabbage,
10 percent; and kale, 15 percent.
There are two main take away points from the discussion above. First, local garlic is an outlier, with a much
higher market share than other vegetables sold in Juneau. This finding is corroborated by interviews with local
growers who indicate concerns about potential market saturation for locally-grown garlic in Juneau.12 It should
be noted that if garlic was stored and sold over a 4-month period extending into fall, local garlic would make
up an estimated 35 percent of the Juneau organic/premium garlic market.
Most importantly for local growers, there appears to be ample market for local farmers to expand, assuming
costs can be controlled while addressing the issues currently constraining production in the Juneau area.
Summary analysis and recommendations related to this assessment of market characteristics and market size
for locally-grown produce are provided in the Executive Summary of this report.
11 While Juneau represents 44 percent of the region’s population, two of the largest farms in Southeast Alaska primarily sell into the Petersburg and Haines markets. In addition, it should be noted that certain crops, such as kale and cabbage, are grown in much higher quantities by farm outside of the Juneau area. 12 In addition to coming up in interviews with local growers, this topic was discussed at a November 2016 roundtable discussion with Juneau area growers convened by the project team.

Juneau Area Local Produce Demand Analysis McDowell Group Page 17
Appendix 1: Farmer Interview Protocol
Farmer Name_________________________________________ Contact info _________________________________________
Community______________________________
Hi, I’m _______ with the McDowell Group. We are conducting a study for the Southeast Alaska Watershed
Coalition and the Sustainable Southeast Partnership. Supported by a USDA Specialty Crop grant, they are
interested in expanding local food production and consumption in Southeast Alaska. They would like to help
current and potential commercial growers understand which locally-grown vegetables and herbs have the
greatest demand and profit potential. We are interviewing chefs, grocery store produce managers, institutional
buyers, farmers market representatives, and commercial growers. I would like to setup a time to ask you about
the crops that you grow and sell, and other aspects of your farm.
If you would like, I can send you a list of the types of questions ahead of time.
General Questions
How many years have you been growing food in Southeast? ___________
How many years have you been selling food grown in Southeast? ___________
Do you have a greenhouse or high tunnel?
Can you estimate the size in sq. feet of the growing area of your farm? _____________
Production (not counting value-added products)
Focus is on major crops (not niche or experimental crops) and comparability with produce buyer/retail data.
See table on following page, where data will be recorded by crop.
• What types of produce did you grow and sell in 2016?
• About how many #’s/units of ___________ did you sell in 2016?
• Where did you primarily sell______________?
• What prices did you sell ____________for? AND/OR What was your total revenue from ________?
• Are there items you have not sold but are interested in growing if there is demand? (circle below)

Juneau Area Local Produce Demand Analysis McDowell Group Page 18
Crop Gr ow #’s/units sold Price Range Primary
Market Square Footage
or Row-Feet Percent
Under Cover Labor Rank
(1 to 5) ROI Rank (1 to
5) Notes
Rhubarb
Potatoes
Carrots
Tomatoes
Lettuce (heads)
Salad mix
Snap/Snow Peas
Zucchini/summer squash
Kale
Onions
Garlic
Beets
Cabbage
Peppers
Chard
Radish
Cucumbers
Broccoli
Arugula
Turnips/Rutabagas
Leeks
Parsnips
Shallots
Brussel sprouts
Kohlrabi
Asian greens
Parsley
Cilantro
Herbs (mint, basil, . . .)
Other Major Crops Sold

Juneau Area Local Produce Demand Analysis McDowell Group Page 19
Markets and Pricing
How do you decide on your prices?
Do your past price ranges reflect the minimum you are willing to sell for?
How do you decide where to sell your crops? What are the differences between markets in your experience?
Roughly, what % of your crops are grown organically? ___________% Do your customers ask for organic?
Return on Investment
Considering all factors, (inputs, labor, markets, transportation, handling, etc.), which types of produce do you
think provides you with the highest return on your investment?
Challenges and Opportunities
Are there items you used to grow for sale but don’t anymore?
Are there any products that you could sell significantly more of if you grew more?
What market or markets do you think are most promising for you to increase your sales? Do these markets differ
by produce type?
What opportunities do you see to increase your farm’s sales?

Juneau Area Local Produce Demand Analysis McDowell Group Page 20
Appendix 2: Produce Buyer Interview Protocol
Hi, my name is ______ with the McDowell Group, an Alaska research firm. We are conducting a study for a group
of Juneau area farmers and local food advocates that would like to understand the market for locally produced
vegetables in Juneau. Can I ask you a few questions?
More info, if desired: The Southeast Alaska Watershed Coalition and the Sustainable Southeast Partnership
are interested in expanding local food production and consumption in Southeast Alaska. Supported by a USDA
Specialty Crop grant, they would like to help current and potential commercial growers understand and identify
promising markets for locally-grown vegetables in the Juneau area. We are interviewing chefs, grocery store
produce managers, institutional buyers, farmers market representatives, and commercial growers. Your input
is greatly appreciated!
Business Name_________________________________________ Contact info _________________________________________
Check if known or ask:
� Grocery, Independent � Grocery, Chain � K-12 School � Hospital � Government Agency � Residential Care
� University � Café � Casual Dining � Fine Dining � Food Truck � Other ____________________________________
How many months per year does your establishment operate? _________
Local Produce
Do you currently buy locally grown produce, or have you in recent years?
If yes, What types of produce? How often? Who from?
Would you buy more, if available? What, if anything, has prevented you from buying (more) locally grown
produce?
If available, would you interested be buying locally?
If no, why not? What are your concerns about purchasing locally-grown produce? [Skip to Other Questions]
Now, I’m going to read a list of vegetables that have been grown commercially in Southeast Alaska. For each,
please tell me whether you’d consider buying local.
For the vegetables you’d consider purchasing locally, we’d like to know more about how much you purchase
now, preferred form, and other details

Juneau Area Local Produce Demand Analysis McDowell Group Page 21
Vegetables Would consider Current Price Range Unit
Weight per case if known
Quantity Purchased Per Week
Product Form Notes
Check if yes
Approximate price per unit you currently pay
Case, count, volume Bunches, organic,
chopped, etc.
Rhubarb
Potatoes
Carrots
Tomatoes
Lettuce (heads)
Salad mix
Snap/Snow Peas
Zucchini/summer squash
Kale
Onions
Garlic
Beets
Cabbage
Peppers
Chard
Radish
Cucumbers
Broccoli
Arugula
Turnips/Rutabagas
Leeks
Parsnips
Shallots
Brussel sprouts
Kohlrabi
Asian greens
Basil
Chives

Juneau Area Local Produce Demand Analysis McDowell Group Page 22
Parsley
Cilantro
Mint
Other Crops Interested in Buying Local:

Juneau Area Local Produce Demand Analysis McDowell Group Page 23
Which of the vegetables I just listed are you most interested in buying from local producers?
How important is organic certification to selling locally grown produce? Do local producers need to get certified
as organic?
Are you willing to pay 10% more for local produce? 15% more? 25 percent more? What is the maximum
markup you’d be willing to pay? Does this vary by produce type?
What are the key reasons you would consider buying locally-grown produce?
What are your biggest challenges to buying local produce?
Other Questions
What is your produce purchasing process (how often, who do you purchase from, how does it arrive, are
products consistently available)?
Would you expect comparable amounts of waste for locally-grown produce? If less, would that factor into how
much you are willing to pay?
If a local producer is interesting in selling to your business, how would you recommend they get in touch and
what information would be the most helpful to you?
Any other feedback for local food farmers and proponents?

Juneau Area Local Produce Demand Analysis McDowell Group Page 24
Appendix 3: Average Grocery Store Vegetable Product Weights per Unit
Vegetable Average Pounds per Bunch/Each
Basil (living plant) 0.25
Garlic (head) 0.19
Green onions 0.25
Broccolini 0.38
Cilantro 0.25
Lettuce 0.50
Kale 0.60
Mustard greens 0.50
Spinach 0.50
Fennel 1.00
Romaine 1.00
Chard 0.75
Carrots, with tops 1.00
Radish 0.75
Cucumber 0.56
Beets 1.20