Embed Size (px)
Citation preview

Founded in 1852 by Sidney Davy Miller
MICHIGAN: Ann Arbor Detroit Grand Rapids
Howell Kalamazoo Lansing Monroe
Saginaw Troy
New York, NY Pensacola, FL
Washington, DC
CANADA: Windsor, ONSHERRI A. WELLMAN TEL: (517) 483-4954 FAX: (517) 374-6304 E-MAIL: [email protected]
One Michigan Avenue, Suite 900 Lansing, Michigan 48933
TEL: (517) 487-2070 FAX: (517) 374-6304
www.millercanfield.com
POLAND: GdyniaWarsaw Wrocław
June 7, 2013
Ms. Mary Jo Kunkle Executive Secretary Michigan Public Service Commission 6545 Mercantile Way, Suite 7 Lansing, MI 48911 Re: Michigan Gas Utilities Corporation 2014 Rate Case
MPSC Case No. U-17273 Dear Ms. Kunkle: Attached for filing are an Application, draft Notice of Hearing, and supporting Direct Testimony, Exhibits, and Workpapers of Katherine A. De Cramer, Matthew M. Dirksen, Christine M. Phillips, Noreen E. Cleary, Chuck F. Hauska, Brian E. Kage, Michael E. Gerth, Tracy L. Kupsh, Lisa J. Gast, Paul R. Moul, Joylyn C. Hoffman Malueg, David J. Tyler, and John R. Wilde. Also attached is documentation which complies with the Rate Case Filing Requirements established by the Commission’s Orders dated December 23, 2008 and February 20, 2009 issued in Case No. U-15895. Very truly yours, SAW/djk Sherri A. Wellman Enclosures cc with enc: David J. Kyto, PE, CMA

STATE OF MICHIGAN
BEFORE THE MICHIGAN PUBLIC SERVICE COMMISSION
* * * * * In the matter of the application of ) MICHIGAN GAS UTILITIES CORPORATION ) for authority to increase retail natural gas rates. ) Case No. U-17273 )
APPLICATION
MICHIGAN GAS UTILITIES CORPORATION (“MGUC”), requests authority from the
Michigan Public Service Commission (“Commission”) to increase its rates for the sale and
transportation of natural gas, and other relief, and in support thereof respectfully represents
as follows:
INTRODUCTION
1. MGUC is a public utility engaged in the purchase, storage, transportation,
distribution and sale of natural gas to approximately 166,000 customers in 147 communities
in the Southern and Western portions of Michigan’s Lower Peninsula.
2. MGUC is a corporation organized under the laws of the state of Delaware,
with its principal office located at 899 S. Telegraph Road, Monroe, Michigan 48161, and is
authorized to transact business in the state of Michigan. MGUC is a subsidiary of Integrys
Energy Group, Inc. (“Integrys”), which prior to February 21, 2007, was known as WPS
Resources Corporation (“WPSR”). MGUC is a sister utility company to Upper Peninsula
Power Company and Wisconsin Public Service Corporation, both of which are also
regulated by this Commission. MGUC is also a sister utility company to, among others,
Minnesota Energy Resources Corporation, The Peoples Gas Light and Coke Company, and
North Shore Gas Company, none of which is regulated by this Commission. MGUC was
acquired by WPSR from Aquila, Inc. on April 1, 2006 as authorized by the Commission’s

- 2 -
order in Case No. U-14657. Prior to its acquisition by WPSR, MGUC conducted business
as “Aquila Networks – MGU”.
3. MGUC’s retail natural gas sales and transportation business is subject to the
jurisdiction of the Commission pursuant to 1909 PA 300, as amended, MCL 462.2 et seq.;
1919 PA 419, as amended, MCL 460.51 et seq.; 1939 PA 3, as amended, MCL 460.1 et
seq.; 1982 PA 304, as amended, MCL 460.6h et seq.; 1969 PA 306, as amended, MCL
24.201 et seq.; and the Commission’s Rules of Practice and Procedure, as amended, 1999
AC, R 460.17101 et seq.
4. In its last general rate case for retail natural gas service, Case No. U-15990,
MGUC used a 2010 test year. A settlement was reached and approved by the Commission
in its Order Approving Partial Settlement Agreement dated December 16, 2009. This order
granted rate relief of $3.5 million annually, based on a 10.75% return on common equity,
effective January 1, 2010.
5. MGUC’s rates established in Case No. U-15990 do not reflect the current
costs of providing retail gas service, and MGUC requires further rate relief.
REQUESTED RELIEF
6. For purposes of this case, MGUC has undertaken a complete examination of
its investments, expenses and revenues based on a 2014 test year. Using a 2014 test year,
and a return on common equity of 10.75%, MGUC calculates a rate revenue deficiency of
$8,036,820, or 6.01%. The key factors contributing to the revenue deficiency results
include:
a. The 2012 historic test year indicates that MGUC suffered a revenue deficiency of $6,301,860, which corresponds to a 6.14% return on common equity. This value is well below MGUC’s authorized return on common equity of 10.75% authorized in MGUC’s most recent general rate case proceeding in Case No. U-15990.
b. The cost of upgrades to the MGUC gas transmission and distribution systems,
c. A decrease in margin revenues,

- 3 -
d. A higher cost of capital;
e. Increased costs associated with filling employee vacancies,
f. Increased costs associated with building maintenance,
g. The cost of engineering analysis on vintage natural gas transmission and
distribution mains,
h. Increased costs of customer service functions, and
i. General inflation.
7. MGUC represents that in order to establish rates for natural gas service
which are just and reasonable, it is essential that the Commission order an increase in
natural gas base rates that will produce additional revenues on an annual basis of
approximately $8,036,820, or 6.01%.
8. MGUC represents that its present return on investment is and will be below
that required by sound regulation; that MGUC’s present natural gas rates and charges, if not
increased, will produce increasingly inadequate natural gas revenues to MGUC and, thus,
are unjust and unreasonable; that rate relief is required to permit MGUC to continue to
achieve its goal of rendering adequate natural gas service to the public; and that rate relief,
effective in the near future, is necessary to protect the rights of MGUC and to prevent it from
being deprived of its property contrary to the Fourteenth Amendment of the Constitution of
the United States of America and contrary to the provisions of the Constitution of 1963 of the
State of Michigan.
RATE DESIGN, TARIFF AND OTHER PROPOSALS
9. MGUC’s proposed rate increases by rate schedule are shown on Schedules
F3.1 and F3.2 of Exhibit A-6 (DJT-1). These rates are designed to recover the revenue
deficiency. Furthermore, MGUC also requests authority from the Commission to continue its
currently authorized revenue decoupling mechanism, as initially authorized in Case No. U-

- 4 -
15990. This plan helps stabilize MGUC’s revenues from the impacts of the economy,
energy efficiency, and other factors.
10. MGUC also requests the authority from the Commission to continue its
Uncollectible Expense True-Up Mechanism (“UETM”), as ordered in Case No. U-15990.
The UETM helps to stabilize MGUC’s uncollectibles expense. Given the state of the
Michigan economy and the MPSC rules regarding shut-off, continuation of the UETM is
reasonable and necessary.
11. In addition, MGUC proposes revisions to its tariffs to reflect the change in
rates.
IMPLEMENTATION OF RATES
12. In accordance with MCL 460.6a(1), if the Commission has not acted on the
Company’s application within 180 days of the filing, MGUC intends to implement interim
rates for service rendered on and after January 1, 2014, up to the amount of the proposed
annual rate request, through equal percentage increases applied to all rates.
TESTIMONY AND EXHIBITS
13. MGUC is filing herewith written testimonies, exhibits and work papers in
support of the requested rate increase and related approvals requested herein.
14. MGUC represents that the proposals contained in this Application,
testimonies, exhibits and work papers are just, reasonable and in the public interest.
WHEREFORE, Michigan Gas Utilities Corporation requests that this Commission:
A. Set an early hearing date on this Application for rate relief;
B. Find and determine that MGUC’s existing rates and charges are
unreasonably low, inadequate and should be increased;

- 5 -
C. Authorize MGUC to file and make effective, at the earliest possible date, its
proposed final rates and charges for the sale and transportation of natural gas;
D. Authorize MGUC to continue its revenue decoupling mechanism;
E. Authorize MGUC to continue its Uncollectible Expense True-Up Mechanism;
and
F. Grant MGUC such other and further relief and authorizations as may be
lawful and proper.
Respectfully submitted,
MICHIGAN GAS UTILITIES CORPORATION
Dated: June 7, 2013 By: _______________________________
One of Its Attorneys Sherri A. Wellman (P38989) Paul M. Collins (P69719) MILLER, CANFIELD, PADDOCK and STONE, PLC One Michigan Avenue, Suite 900 Lansing, MI 48933 (517) 487-2070 Attorneys for Michigan Gas Utilities Corporation

- 6 -
MICHIGAN PUBLIC SERVICE COMMISSION
CASE NO. U-17273 Date: June 7, 2013
GENERAL APPLICATION FOR CHANGE IN GAS UTILITY RATES BEFORE MICHIGAN PUBLIC SERVICE COMMISSION CLASS A & B UTILITIES COMPANY NAME: Michigan Gas Utilities Corporation ADDRESS: 899 S. Telegraph Road, Monroe, Michigan 48161 TELEPHONE: AREA CODE (920) NUMBER 433-1502 COMPANY OFFICIAL TO BE CONTACTED PERTAINING TO RATE CASE MATTERS: David J. Kyto, PE, CMA FILING DATE: June 7, 2013 TITLE OF AUTHORIZED OFFICER: Director - Rate Case Process
* * * COMMISSION ONLY * * *
DATE RECEIVED BY COMMISSION: DOCKET NUMBER ASSIGNED: RECEIVED BY: DATE ACCEPTED: ACCEPTED BY: NOTIFICATION DATE(S): SCHEDULED PRE-HEARING DATE:

- 7 -
STATE OF MICHIGAN
BEFORE THE MICHIGAN PUBLIC SERVICE COMMISSION
* * * * * In the matter of the application of ) MICHIGAN GAS UTILITIES CORPORATION ) for authority to increase retail natural gas rates. ) Case No. U-17273 )
CERTIFICATION OF DAVID J. KYTO, PE, CMA
David J. Kyto, PE, CMA, Director - Rate Case Process of Integrys Business Support, LLC, states that he has provided the data required pursuant to Rate Case Filing Requirements established by the Commission’s Orders dated December 23, 2008 and February 20, 2009 issued in Case No. U-15895, and pursuant to these requirements, certifies the data so provided.
Dated: June 7, 2013 David J. Kyto, PE, CMA

STATE OF MICHIGAN BEFORE THE MICHIGAN PUBLIC SERVICE COMMISSION
* * * * *
NOTICE OF HEARING
FOR THE CUSTOMERS OF MICHIGAN GAS UTILITIES CORPORATION
CASE NO. U-17273
• Michigan Gas Utilities Corporation may increase its retail natural gas rates by $8,036,820 annually, or 6.01%, if the Michigan Public Service Commission approves its request.
• A TYPICAL RESIDENTIAL CUSTOMER WHO USES 88 MCF (THOUSAND CUBIC
FEET) OF NATURAL GAS PER YEAR MAY SEE AN ANNUAL INCREASE OF $28.09, OR ABOUT 4.0%, IF THE REQUESTED RATE RELIEF IS GRANTED.
• The information below describes how a person may participate in this case.
• You may call or write Michigan Gas Utilities Corporation, 899 S. Telegraph Road,
Monroe, Michigan 48161, (734) 457-6133 for a free copy of its application. Any person may review the application on Michigan Gas Utilities Corporation’s website at michigangasutilities.com, or at its offices in Monroe, Coldwater, Benton Harbor and Grand Haven.
• The first public hearing in this matter will be held:
DATE: July XX, 2013
This hearing will be a prehearing conference to set future hearing dates and decide other procedural matters.
TIME: 9:00 a.m.
PRESIDING OFFICER: Administrative Law Judge XXXXXXX
LOCATION: Constitution Hall
525 West Allegan Lansing, Michigan
PARTICIPATION: Any interested person may attend and participate. The hearing site is accessible, including handicapped parking. Persons needing any accommodation to participate should contact the Commission’s Executive Secretary at (517) 241-6160 a week in advance to request mobility, visual,
hearing or other assistance. The Michigan Public Service Commission (Commission) will hold a public hearing to consider the June 7, 2013 application of Michigan Gas Utilities Corporation (MGUC), which seeks the Commission’s approval to increase revenues for the sale, transportation and distribution of natural gas. MGUC states that it has a jurisdictional revenue deficiency of $8,036,820, or 6.01%.

Page 2 U-17273
All documents filed in this case shall be submitted electronically through the Commission’s E-Dockets Website at: michigan.gov/mpscedockets. Requirements and instructions for filing can be found in the User Manual on the E-Dockets help page. Documents may also be submitted, in Word or PDF format, as an attachment to an email sent to [email protected]. If you require assistance prior to e-filing, contact Commission staff at (517) 241-6180 or by e-mail at [email protected]. Any person wishing to intervene and become a party to the case shall file a Petition to Intervene with this Commission by July XX, 2013. (Residential customers may file petitions to intervene using the traditional paper format.) The proof of service shall indicate service upon Michigan Gas Utilities Corporation’s attorney, Sherri A. Wellman, Miller, Canfield, Paddock, and Stone, P.L.C., One Michigan Avenue, Suite 900, Lansing, Michigan 48933. Any person wishing to make a statement of position without becoming a party to the case may participate by filing an appearance. To file an appearance, the individual must attend the hearing and advise the presiding administrative law judge of his or her wish to make a statement of position. All information submitted to the Commission in this matter will become public information, available on the Michigan Public Service Commission's Web site, and subject to disclosure.
Requests for adjournment must be made pursuant to the Commission’s Rules of Practice and Procedure R 460.17315 and R 460.17335. Requests for further information on adjournment should be directed to (517) 241-6060.
A copy of Michigan Gas Utilities Corporation’s request may be reviewed on the
Commission’s Web site at michigan.gov/mpscedockets, or at the office of the Commission’s Executive Secretary, 6545 Mercantile Way, Suite 7, Lansing, MI, and at the office of Michigan Gas Utilities Corporation, 899 S. Telegraph Road, Monroe, Michigan 48161. For more information on how to participate in a case, you may contact the Commission at the above address or by telephone at (517) 241-6180.
Jurisdiction is pursuant to 1909 PA 300, as amended, MCL 462.2 et seq.; 1919 PA 419, as amended, MCL 460.51 et seq.; 1939 PA 3, as amended, MCL 460.1 et seq.; 1982 PA 304, as amended, MCL 460.6h et seq.; 1969 PA 306, as amended, MCL 24.201 et seq.; and the Commission’s Rules of Practice and Procedure, as amended, 1999 AC, R 460.17101 et seq. July XX, 2013 Lansing, Michigan

Exhibit Schedule Title Witness
A-1 (KAD-1) A1 Revenue Deficiency (Excess) Katherine A. De Cramer, CPAA-1 (KAD-1) A2 Bridge Between 2012 Historical Test Year and 2014 Projected Test Year Katherine A. De Cramer, CPA
A-2 (KAD-2) B1 Proposed Rate Base Katherine A. De Cramer, CPAA-2 (KAD-2) B2 Proposed Utility Plant Katherine A. De Cramer, CPAA-2 (KAD-2) B3 Proposed Accumulated Provision for Depreciation Katherine A. De Cramer, CPAA-2 (KAD-2) B4 Proposed Working Capital Katherine A. De Cramer, CPAA-2 (CFH-1) B5 Capital Expenditures of Projects > $500,000 Charles F. HauskaA-2 (KAD-2) B6 Rate Base Trending Katherine A. De Cramer, CPA
A-3 (KAD-3) C1 Proposed Net Operating Income Katherine A. De Cramer, CPAA-3 (KAD-3) C2 Revenue Conversion Factor Katherine A. De Cramer, CPAA-3 (KAD-3) C3 Proposed Sales Revenue Katherine A. De Cramer, CPAA-3 (KAD-3) C4 Proposed Cost of Gas Sold Katherine A. De Cramer, CPAA-3 (KAD-3) C5 Proposed Operation and Maintenance Expense Katherine A. De Cramer, CPAA-3 (KAD-3) C6 Proposed Depreciation and Amortization Expense Katherine A. De Cramer, CPAA-3 (KAD-3) C7 Proposed General Taxes Katherine A. De Cramer, CPAA-3 (KAD-3) C8 Proposed Federal Income Taxes Katherine A. De Cramer, CPAA-3 (KAD-3) C9 Proposed State Income Taxes Katherine A. De Cramer, CPAA-3 (KAD-3) C10 Proposed Local Taxes Katherine A. De Cramer, CPAA-3 (KAD-3) C11 Proposed Allowance for Funds Used During Construction Katherine A. De Cramer, CPAA-3 (KAD-3) C12 Income Tax Effect of Interest Calculation Katherine A. De Cramer, CPAA-3 (KAD-3) C13 Operation and Maintenance Expenses including Cost of Gas Katherine A. De Cramer, CPAA-3 (KAD-3) C14 Calculation of K&M Adjustment for Increase in MGP Amortization Katherine A. De Cramer, CPAA-3 (KAD-3) C15 Calculation of K&M Adjustment for Increase in Pay-at-Risk at Target Katherine A. De Cramer, CPAA-3 (CFH-2) C16 Calculation of K&M Adjustment for Increase in Storage Field Costs Charles F. HauskaA-3 (CFH-2) C17 Calculation of K&M Adjustment for Increase in Well Logs Costs Charles F. HauskaA-3 (CFH-2) C18 Calculation of K&M Adjustment for Increase in Building Expenses Charles F. HauskaA-3 (CFH-2) C19 Calculation of K&M Adjustment for Increase due to filling Non-Union Staff Vacancies Charles F. HauskaA-3 (CFH-2) C20 Calculation of K&M Adjustment for Increase for High Risk Mains Charles F. HauskaA-3 (CFH-2) C21 Calculation of K&M Adjustment for Increase due to filling Union Staff Vacancies Charles F. HauskaA-3 (KAD-3) C22 Calculation of K&M Adjustment for Increase of Customer Relations and ICE O&M Costs Katherine A. De Cramer, CPAA-3 (KAD-3) C23 Calculation of K&M Adjustment for Uncollectible Accounts Katherine A. De Cramer, CPAA-3 (KAD-3) C24 Bad Debt Expense Calculation Katherine A. De Cramer, CPAA-3 (KAD-3) C25 Calculation of K&M Adjustment for Increase due to filling IBS Vacancies Katherine A. De Cramer, CPAA-3 (KAD-3) C26 Calculation of K&M Adjustment for Increase due to IBS Regulatory Affairs Labor Katherine A. De Cramer, CPAA-3 (KAD-3) C27 Calculation of K&M Adjustment for Increase due to A&G Loader Adjustments Katherine A. De Cramer, CPAA-3 (KAD-3) C28 Calculation of K&M Adjustment for Increase due to IBS Regulatory Affairs Non-Labor Katherine A. De Cramer, CPAA-3 (KAD-3) C29 Calculation of K&M Adjustment for Injuries and Damages Katherine A. De Cramer, CPAA-3 (KAD-3) C30 Calculation of K&M Adjustment for Benefit Costs Katherine A. De Cramer, CPAA-3 (KAD-3) C31 Calculation of K&M Adjustment for Increase in IBS Depreciation Gas Management System & ICE Hardware Katherine A. De Cramer, CPAA-3 (TLK-1) C32 Master Regulated Affiliated Interest Agreement Tracy L. KupshA-3 (TLK-1) C33 Asset Ownership by Integrys Business Support Tracy L. KupshA-3 (CMP-1) C34 Summary of Benefit Costs for MGUC Employees Christine M. Phillips, CPAA-3 (CMP-1) C35 Summary of Benefit Costs for IBS Employees Christine M. Phillips, CPAA-3 (BEK-1) C36 Inputs into Summary of Calculations of Net Present Value of Revenue Requirement Brian E. KageA-3 (MEG-1) C37 Summary of Calculations of Net Present Value of Revenue Requirement ("NPVRR") Michael E. Gerth
A-4 (LJG-1) D1 Rate of Return Summary Lisa J. Gast, CPAA-4 (LJG-1) D2 Cost of Long Term Debt Lisa J. Gast, CPAA-4 (LJG-1) D3 Cost of Short Term Debt Lisa J. Gast, CPAA-4 (LJG-1) D4 Cost of Preferred Stock Lisa J. Gast, CPAA-4 (LJG-1) D5 Cost of Common Equity Lisa J. Gast, CPAA-4 (PRM-1) D6 Summary Cost of Equity Paul R. MoulA-4 (PRM-1) D7 MGUC Historical Capitalization and Financial Statistics Paul R. MoulA-4 (PRM-1) D8 Delivery Group Historical Capitalization and Financial Statistics Paul R. MoulA-4 (PRM-1) D9 Standard & Poor's Public Utilities Historical Capitalization and Financial Statistics Paul R. MoulA-4 (PRM-1) D10 Dividend Yields Paul R. MoulA-4 (PRM-1) D11 Historical Growth Rates Paul R. MoulA-4 (PRM-1) D12 Projected Growth Rates Paul R. MoulA-4 (PRM-1) D13 Financial Risk Adjustment Paul R. MoulA-4 (PRM-1) D14 Interest Rates for Investment Grade Public Utility Bonds Paul R. MoulA-4 (PRM-1) D15 Common Equity Risk Premiums Paul R. MoulA-4 (PRM-1) D16 Component Inputs for the Capital Asset Pricing Model Paul R. MoulA-4 (PRM-1) D17 Comparable Earnings Approach Paul R. Moul
Projected Test Year Ending December 31, 2014
MICHIGAN PUBLIC SERVICE COMMISSION
Michigan Gas Utilities CorporationCase No. U-17273
Index to Standard Schedules and Associated Workpapers Filed with Application for General Rate Relief
- Gas Investor Owned -

Exhibit Schedule Title Witness
Projected Test Year Ending December 31, 2014
MICHIGAN PUBLIC SERVICE COMMISSION
Michigan Gas Utilities CorporationCase No. U-17273
Index to Standard Schedules and Associated Workpapers Filed with Application for General Rate Relief
- Gas Investor Owned -
A-5 (MMD-1) E1 Proposed Sales Data 2013-2017 Matthew M. DirksenA-5 (MMD-1) E1.1 Proposed Sales Data Rate Class Matthew M. DirksenA-5 (MMD-1) E2 Proposed Fixed Charge Count Data Matthew M. DirksenA-5 (MMD-1) E3 MGUC's Virtual Weather Station HDDs as Moving Averages Matthew M. DirksenA-5 (MMD-1) E4 Change in Sales Volumes from 30 to 15 Year Forecast Matthew M. DirksenA-5 (MMD-1) E5 Change in Revenues from 30 to 15 Year Forecast Matthew M. Dirksen
A-6 (JCHM-1) F1.1 MGUC 2014 Projected COSS - General Summary per MPSC Filing Requirements Joylyn C. Hoffman Malueg, CMAA-6 (JCHM-1) F1.2 MGUC 2014 Projected COSS - Detailed Summary Joylyn C. Hoffman Malueg, CMA
A-6 (JCHM-1) F1.3MGUC 2014 Projected COSS - Individual Rate Schedule Gas Revenue Requirements and Rate Base Components Joylyn C. Hoffman Malueg, CMA
A-6 (JCHM-1) F1.4 MGUC 2014 Projected COSS - Consumption Costs by Billing Unit Joylyn C. Hoffman Malueg, CMAA-6 (JCHM-1) F1.5 MGUC 2014 Projected COSS - Allocation Methodologies Joylyn C. Hoffman Malueg, CMAA-6 (JCHM-1) F1.6 MGUC Account 380 - Cost per Service Analysis Joylyn C. Hoffman Malueg, CMAA-6 (JCHM-1) F1.7 MGUC Account 381 - Cost per Service Analysis Joylyn C. Hoffman Malueg, CMAA-6 (JCHM-1) F1.8 MGUC 2014 Projected COSS - Classification and Functionalization of Costs/Investment Joylyn C. Hoffman Malueg, CMAA-6 (JCHM-1) F1.9 MGUC 2014 Projected COSS - Distribution O&M Account Translation for FERC Plant Account Joylyn C. Hoffman Malueg, CMAA-6 (JCHM-1) F1.10 MGUC Transmission System Zero-Intercept Regression Analysis Joylyn C. Hoffman Malueg, CMAA-6 (JCHM-1) F1.11 MGUC Distribution System Zero-Intercept Regression Analysis Joylyn C. Hoffman Malueg, CMAA-6 (DJT-1) F2.1 Summary of Proposed Revenues Including Cost of Gas David J. TylerA-6 (DJT-1) F2.2 Summary of Proposed Revenues Excluding Cost of Gas David J. TylerA-6 (DJT-1) F3.1 Detail of Proposed Revenues Including Cost of Gas David J. TylerA-6 (DJT-1) F3.2 Detail of Proposed Revenues Excluding Cost of Gas David J. TylerA-6 (DJT-1) F4 Comparison of Proposed Monthly Bills David J. TylerA-6 (DJT-1) F5 Proposed Tariff Sheets David J. TylerA-6 (DJT-1) F6 Calculation of Interim Rates David J. Tyler
A-7 (KAD-4) Calculation of Inflation Factors Katherine A. De Cramer, CPA
A-8 (KAD-5) Uncollectible Expense True-Up Mechanism Allocators Katherine A. De Cramer, CPA
A-9 (KAD-6) Integrys Energy Group, Inc. Awards & Recognition: 2006-2012 Katherine A. De Cramer, CPA
A-10 (NEC-1) Pay-at-Risk Plan Noreen E. Cleary

STATE OF MICHIGAN
BEFORE THE MICHIGAN PUBLIC SERVICE COMMISSION
* * * * * In the matter of the application of ) MICHIGAN GAS UTILITIES CORPORATION ) for authority to increase retail natural gas rates. ) Case No. U-17273 )
DIRECT TESTIMONY AND EXHIBITS OF
KATHERINE A. DE CRAMER, CPA
FOR
MICHIGAN GAS UTILITIES CORPORATION
June 7, 2013

- 1 -
STATE OF MICHIGAN
BEFORE THE MICHIGAN PUBLIC SERVICE COMMISSION
* * * * *
In the matter of the application of ) MICHIGAN GAS UTILITIES CORPORATION ) for authority to increase retail natural gas rates. ) Case No. U-17273 )
QUALIFICATIONS OF
KATHERINE A. DE CRAMER, CPA PART I
Q. Please state your name, business address and position. 1
A. My name is Katherine A. De Cramer, CPA. My business address is Integrys 2
Business Support, LLC (“IBS”), 700 North Adams Street, P.O. Box 19001, Green 3
Bay, WI 54307-9001. I am a Rate Case Consultant in the Regulatory Affairs 4
Department of Integrys Energy Group, Inc (“Integrys”). Both IBS and Michigan Gas 5
Utilities Corporation (“MGUC”) are wholly-owned subsidiaries of Integrys. Integrys 6
resulted from the February 21, 2007 merger between WPS Resources Corporation 7
(“WPSR”) and Peoples Energy Corporation. 8
9
Q. For whom are you providing testimony? 10
A. I am providing testimony on behalf of MGUC. 11
12
Q. Please describe briefly your educational, professional, and utility background. 13
A. I have a Bachelors Degree from Lakeland College, Sheboygan, Wisconsin in 14
Accounting. I have a Masters Degree in Business Administration from the University 15
of Wisconsin-Oshkosh, and a Master of Science Degree in Information Systems from 16
the University of Wisconsin-Oshkosh. I am licensed in the State of Wisconsin to 17
practice as a Certified Public Accountant. 18
- 2 -
1
In June of 2003, I was hired by Wisconsin Public Service Corporation (“WPS Corp”) 2
as a Revenue Requirements Forecaster in the Regulatory Affairs Department. While 3
working as a Revenue Requirements Forecaster, my primary responsibility was the 4
revenue requirements analysis for WPS Corp’s wholesale electric jurisdiction. Since 5
the acquisition of MGUC in 2006, my job responsibilities have expanded to include 6
the revenue requirements, decoupling, and Uncollectibles Expense Tracking 7
Mechanism analyses for MGUC, as well. In January of 2013, I became a Rate Case 8
Consultant within the Regulatory Affairs Department. 9
10
Q. Have you previously testified before any regulatory agency? 11
A. Yes, I have. I have submitted testimony before the Michigan Public Service 12
Commission (“Commission”) on behalf of MGUC in Case Nos. U-15990, U-16976, U-13
16977, U-17221 and U-17222. In addition, I have prepared various accounting and 14
filing exhibits for WPS Corp for presentation to the Public Service Commission of 15
Wisconsin (“PSCW”) and for MGUC for presentation to the Commission.16

- 3 -
KATHERINE A. DE CRAMER DIRECT TESTIMONY
PART II
Q. What is the purpose of your pre-filed direct testimony? 1
A. The purpose of my pre-filed direct testimony is to provide an explanation of the 2
methodology used to develop MGUC’s revenue deficiency for the 2014 projected test 3
year. 4
5
Q. Are you sponsoring any exhibits in this proceeding? 6
A. Yes, I am. I am sponsoring: 7 8
1. Exhibit A-1 (KAD-1), Schedules A1 and A2, 9 10
2. Exhibit A-2 (KAD-2), Schedules B1-B4, B6, 11 12
3. Exhibit A-3 (KAD-3), Schedules C1-C15, C22-C31, 13 14 4. Exhibit A-7 (KAD-4), 15 16 5. Exhibit A-8 (KAD-5), 17
18 6. Exhibit A-9 (KAD-6), 19
20 7. Exhibit A-11 (KAD-7), Schedule A1, 21
22 8. Exhibit A-12 (KAD-8), Schedules B1-B4, and 23
24 9. Exhibit A-13 (KAD-9), Schedules C1-C11. 25
26
Q. Were these exhibits prepared by you or under your direction and supervision? 27
A. Yes, they were. 28
29
Q. Please describe Schedule A1 of Exhibit A-1 (KAD-1). 30
A. Schedule A1 of Exhibit A-1 (KAD-1) calculates MGUC’s 2014 projected test year 31
revenue deficiency based on its rate base, adjusted net operating income, rate of 32
return, and revenue conversion factor. 33
34

- 4 -
Q. Please describe Schedule A2 of Exhibit A-1 (KAD-1). 1
A. Schedule A2 of Exhibit A-1 (KAD-1) provides the bridge between the 2012 historical 2
test year revenue deficiency and 2014 projected test year. 3
4
Q. Please describe Schedule B1 of Exhibit A-2 (KAD-2). 5
A. Schedule B1 of Exhibit A-2 (KAD-2) calculates MGUC’s 2014 projected test year rate 6
base. 7
8
Q. Please describe Schedule B2 of Exhibit A-2 (KAD-2). 9
A. Schedule B2 of Exhibit A-2 (KAD-2) calculates MGUC’s 2014 projected test year 10
utility plant. 11
12
Q. Please describe Schedule B3 of Exhibit A-2 (KAD-2). 13
A. Schedule B3 of Exhibit A-2 (KAD-2) depicts MGUC’s 2014 projected test year 14
accumulated provision for depreciation. 15
16
Q. Please describe Schedule B4 of Exhibit A-2 (KAD-2). 17
A. Schedule B4 of Exhibit A-2 (KAD-2) calculates MGUC’s 2014 projected test year 18
working capital. 19
20
Q. Please describe Schedule B5 of Exhibit A-2 (CFH-1). 21
A. Schedule B5 of Exhibit A-2 (CFH-1) will be discussed in the pre-filed direct testimony 22
of Mr. Charles F. Hauska. 23
24
Q. Please describe Schedule B6 of Exhibit A-2 (KAD-2). 25
A. Schedule B6 of Exhibit A-2 (KAD-2) is a trending analysis of MGUC’s rate base from 26
2007 through the 2014 projected test year. 27

- 5 -
1
Q. Please describe Schedule C1 of Exhibit A-3 (KAD-3). 2
A. Schedule C1 of Exhibit A-3 (KAD-3) calculates MGUC’s 2014 projected test year 3
adjusted net operating income. 4
5
Q. Please describe Schedule C2 of Exhibit A-3 (KAD-3). 6
A. Schedule C2 of Exhibit A-3 (KAD-3) calculates MGUC’s 2014 projected test year 7
gross revenue conversion factor. 8
9
Q. Please describe Schedule C3 of Exhibit A-3 (KAD-3). 10
A. Schedule C3 of Exhibit A-3 (KAD-3) depicts MGUC’s 2014 projected test year total 11
revenue. 12
13
Q. Please describe Schedule C4 of Exhibit A-3 (KAD-3). 14
A. Schedule C4 of Exhibit A-3 (KAD-3) depicts MGUC’s 2014 projected test year cost of 15
gas. 16
17
Q. Please describe Schedule C5 of Exhibit A-3 (KAD-3). 18
A. Schedule C5 of Exhibit A-3 (KAD-3) calculates MGUC’s 2014 projected test year 19
total operation and maintenance (“O&M”) expense, exclusive of the cost of gas. 20
21
Q. Please describe Schedule C6 of Exhibit A-3 (KAD-3). 22
A. Schedule C6 of Exhibit A-3 (KAD-3) depicts MGUC’s 2014 projected test year total 23
depreciation and amortization expense. 24
25
Q. Please describe Schedule C7 of Exhibit A-3 (KAD-3). 26
A. Schedule C7 of Exhibit A-3 (KAD-3) calculates MGUC’s 2014 projected test year 27

- 6 -
total for taxes other than income taxes. 1
2
Q. Please describe Schedule C8 of Exhibit A-3 (KAD-3). 3
A. Schedule C8 of Exhibit A-3 (KAD-3) depicts MGUC’s 2014 projected test year 4
federal income taxes. 5
6
Q. Please describe Schedule C9 of Exhibit A-3 (KAD-3). 7
A. Schedule C9 of Exhibit A-3 (KAD-3) depicts MGUC’s 2014 projected test year state 8
income taxes. 9
10
Q. Please describe Schedule C10 of Exhibit A-3 (KAD-3). 11
A. Schedule C10 of Exhibit A-3 (KAD-3) depicts MGUC’s 2014 projected test year local 12
taxes. 13
14
Q. Please describe Schedule C11 of Exhibit A-3 (KAD-3). 15
A. Schedule C11 of Exhibit A-3 (KAD-3) depicts MGUC’s 2014 projected test year 16
AFUDC. 17
18
Q. Please describe Schedule C12 of Exhibit A-3 (KAD-3). 19
A. Schedule C12 of Exhibit A-3 (KAD-3) calculates the Income Tax Effect of Interest for 20
MGUC’s 2014 projected test year. 21
22
Q. Please describe Schedule C13 of Exhibit A-3 (KAD-3). 23
A. Schedule C13 of Exhibit A-3 (KAD-3) develops the O&M costs for MGUC’s 2014 24
projected test year. 25
26
Q. Please describe Schedule C14 of Exhibit A-3 (KAD-3). 27

- 7 -
A. Schedule C14 of Exhibit A-3 (KAD-3) calculates the Known & Measurable (“K&M”) 1
adjustment associated with the amortization of Manufactured Gas Plant remediation 2
costs. 3
4
Q. Please describe Schedule C15 of Exhibit A-3 (KAD-3). 5
A. Schedule C15 of Exhibit A-3 (KAD-3) calculates the K&M adjustment for paying Pay-6
at-Risk at the “Target” level, rather than at the level paid in the 2012 historical period. 7
8
Q. Please describe Schedules C22 of Exhibit A-3 (KAD-3). 9
A. Schedule C22 of Exhibit A-3 (KAD-3) calculates the K&M adjustment related to the 10
customer relations and Integrys Customer Experience (“ICE”) 2016 project O&M 11
costs. 12
13
Q. Please describe Schedule C23 of Exhibit A-3 (KAD-3). 14
A. Schedule C23 of Exhibit A-3 (KAD-3) calculates the K&M adjustment associated with 15
uncollectibles expense. 16
17
Q. Please describe Schedule C24 of Exhibit A-3 (KAD-3). 18
A. Schedule C24 of Exhibit A-3 (KAD-3) calculates the 2014 uncollectibles expense of 19
$1,917,930, and supports Schedule C23 of Exhibit A-3 (KAD-3). 20
21
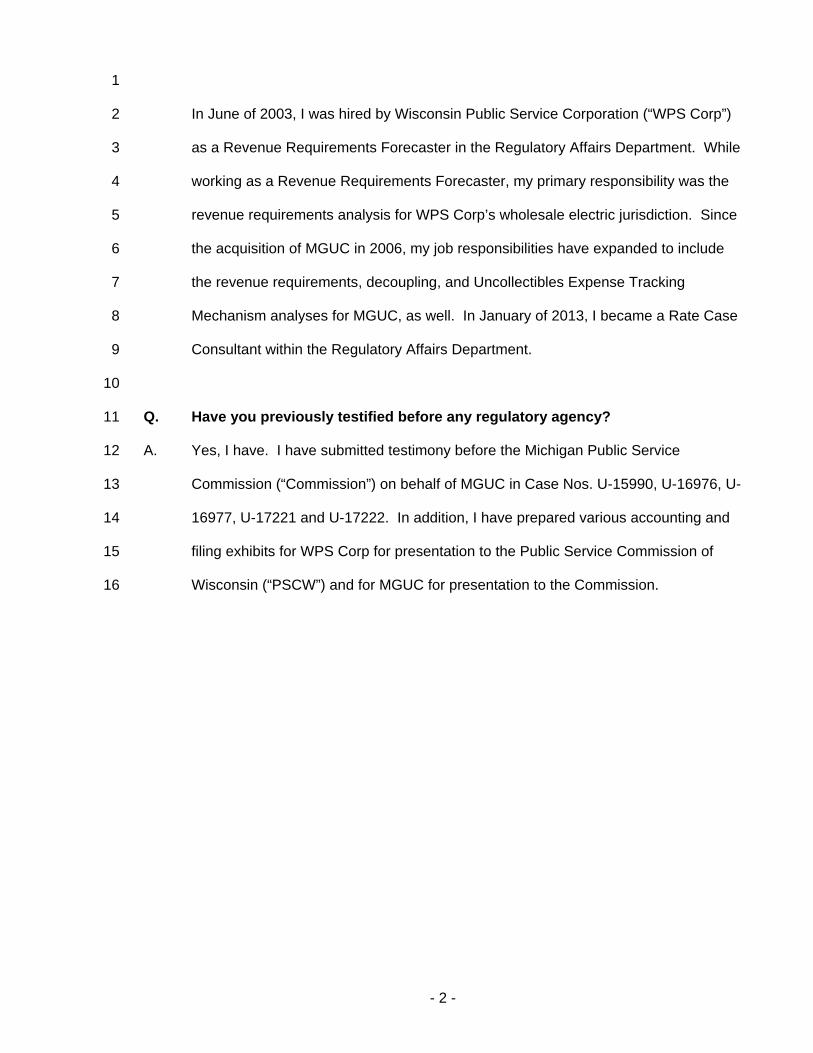
Q. Please describe Schedule C25 of Exhibit A-3 (KAD-3). 22
A. Schedule C25 of Exhibit A-3 (KAD-3) calculates the K&M adjustment associated with 23
filling IBS vacancies. 24
25
Q. Please describe Schedule C26 of Exhibit A-3 (KAD-3). 26
A. Schedule C26 of Exhibit A-3 (KAD-3) calculates the K&M adjustment associated with 27

- 8 -
an increase in IBS Regulatory Affairs labor. 1
2
Q. Please describe Schedule C27 of Exhibit A-3 (KAD-3). 3
A. Schedule C27 of Exhibit A-3 (KAD-3) calculates the K&M adjustment due to A&G 4
loader adjustments. 5
6
Q. Please describe Schedule C28 of Exhibit A-3 (KAD-3). 7
A. Schedule C28 of Exhibit A-3 (KAD-3) calculates the K&M adjustment associated with 8
an increase in IBS Regulatory Affairs non-labor. 9
10
Q. Please describe Schedule C29 of Exhibit A-3 (KAD-3). 11
A. Schedule C29 of Exhibit A-3 (KAD-3) calculates the K&M adjustment associated with 12
Injuries and Damages. 13
14
Q. Please describe Schedule C30 of Exhibit A-3 (KAD-3). 15
A. Schedule C30 of Exhibit A-3 (KAD-3) calculates the K&M adjustment associated with 16
MGUC benefit costs. 17
18
Q. Please describe Schedule C31 of Exhibit A-3 (KAD-3). 19
A. Schedule C31 of Exhibit A-3 (KAD-3) calculates the K&M adjustment for increases to 20
IBS Depreciation for the Gas Management System and ICE 2016 Hardware. 21
22
Q. Please describe Exhibit A-7 (KAD-4). 23
A. Exhibit A-7 (KAD-4) calculates the inflation factors for 2013 and 2014 that were 24
applied to the 2012 historic test year O&M expenses to determine 2014 projected 25
test year O&M expenses, exclusive of K&M items. 26
27

- 9 -
Q. Please describe Exhibit A-8 (KAD-5). 1
A. Exhibit A-8 (KAD-5) depicts the Uncollectibles Expense True-Up Mechanism 2
Allocators. 3
4
Q. Please describe Exhibit A-9 (KAD-6). 5
A. Exhibit A-9 (KAD-6) is a summary of Awards & Recognition earned by Integrys and 6
Integrys subsidiaries during 2006-2012. 7
8
Q. Please describe Schedule A1 of Exhibit A-11 (KAD-7). 9
A. Schedule A1 of Exhibit A-11 (KAD-7) calculates MGUC’s 2012 historic test year 10
revenue deficiency based on its rate base, adjusted net operating income, rate of 11
return, and revenue conversion factor. 12
13
Q. Please describe Schedule B1 of Exhibit A-12 (KAD-8). 14
A. Schedule B1 of Exhibit A-12 (KAD-8) calculates MGUC’s 2012 historic test year rate 15
base. 16
17
Q. Please describe Schedule B2 of Exhibit A-12 (KAD-8). 18
A. Schedule B2 of Exhibit A-12 (KAD-8) calculates MGUC’s 2012 historic test year 19
utility plant. 20
21
Q. Please describe Schedule B3 of Exhibit A-12 (KAD-8). 22
A. Schedule B3 of Exhibit A-12 (KAD-8) depicts MGUC’s 2012 historic test year 23
accumulated provision for depreciation. 24
25
Q. Please describe Schedule B4 of Exhibit A-12 (KAD-8). 26
A. Schedule B4 of Exhibit A-12 (KAD-8) calculates MGUC’s 2012 historic test year 27

- 10 -
working capital. 1
2
Q. Please describe Schedule C1 of Exhibit A-13 (KAD-9). 3
A. Schedule C1 of Exhibit A-13 (KAD-9) calculates MGUC’s 2012 historic test year 4
adjusted net operating income. 5
6
Q. Please describe Schedule C2 of Exhibit A-13 (KAD-9). 7
A. Schedule C2 of Exhibit A-13 (KAD-9) calculates MGUC’s 2012 historic test year 8
gross revenue conversion factor. 9
10
Q. Please describe Schedule C3 of Exhibit A-13 (KAD-9). 11
A. Schedule C3 of Exhibit A-13 (KAD-9) calculates MGUC’s 2012 historic test year total 12
revenue. 13
14
Q. Please describe Schedule C4 of Exhibit A-13 (KAD-9). 15
A. Schedule C4 of Exhibit A-13 (KAD-9) calculates MGUC’s 2012 historic test year total 16
cost of gas. 17
18
Q. Please describe Schedule C5 of Exhibit A-13 (KAD-9). 19
A. Schedule C5 of Exhibit A-13 (KAD-9) calculates MGUC’s 2012 historic test year total 20
O&M expense, exclusive of the cost of gas. 21
22
Q. Please describe Schedule C6 of Exhibit A-13 (KAD-9). 23
A. Schedule C6 of Exhibit A-13 (KAD-9) depicts MGUC’s 2012 historic test year total 24
depreciation and amortization expense. 25
26
27

- 11 -
Q. Please describe Schedule C7 of Exhibit A-13 (KAD-9). 1
A. Schedule C7 of Exhibit A-13 (KAD-9) calculates MGUC’s 2012 historic test year total 2
for taxes other than income taxes. 3
4
Q. Please describe Schedule C8 of Exhibit A-13 (KAD-9). 5
A. Schedule C8 of Exhibit A-13 (KAD-9) depicts MGUC’s 2012 historic test year federal 6
income taxes. 7
8
Q. Please describe Schedule C9 of Exhibit A-13 (KAD-9). 9
A. Schedule C9 of Exhibit A-13 (KAD-9) depicts MGUC’s 2012 historic test year state 10
income taxes. 11
12
Q. Please describe Schedule C10 of Exhibit A-13 (KAD-9). 13
A. Schedule C10 of Exhibit A-13 (KAD-9) depicts MGUC’s 2012 historic test year local 14
taxes. 15
16
Q. Please describe Schedule C11 of Exhibit A-13 (KAD-9). 17
A. Schedule C11 of Exhibit A-13 (KAD-9) depicts MGUC’s 2012 historic test year 18
Allowance of Funds Used During Construction (“AFUDC”). 19
20
Q. Please describe Schedule C12 of Exhibit A-13 (KAD-9). 21
A. Schedule C12 of Exhibit A-13 (KAD-9) depicts MGUC’s 2012 historic test year 22
Income Tax Effect of Interest. 23
24
Background 25 Q. Are you familiar with the application of MGUC for authority to increase retail 26
gas rates? 27
A. Yes, I am. 28

- 12 -
1
Q. Please provide a brief description of MGUC and the area it serves. 2
A. MGUC is a corporation organized under the laws of the state of Delaware, with its 3
principal office located at 899 S. Telegraph Road, Monroe, Michigan 48161, and is 4
authorized to transact business in the state of Michigan. MGUC is a subsidiary of 5
Integrys, which prior to February 21, 2007, was known as WPSR. MGUC is a sister 6
utility company to UPPCO and WPS Corp, both of which are also regulated by this 7
Commission. MGUC is also a sister utility company to, among others, Minnesota 8
Energy Resources Corporation, The Peoples Gas Light and Coke Company, and 9
North Shore Gas Company, none of which is regulated by this Commission. MGUC 10
was acquired by WPSR from Aquila, Inc. on April 1, 2006 as authorized by the 11
Commission’s order in Case No. U-14657. Prior to its acquisition by WPSR, MGUC 12
conducted business as “Aquila Networks – MGU”. 13
14
MGUC is a public utility engaged in the purchase, storage, transportation, distribution 15
and sale of natural gas to approximately 166,000 customers in 147 communities in 16
the Southern and Western portions of Michigan’s lower peninsula. 17
18
Integrys and its subsidiaries have been recognized as superior performers in the 19
utility industry, as summarized on Exhibit A-9 (KAD-6). 20
21
Q. Please describe the most recent rate relief obtained by MGUC. 22
A. In the most recent rate case, Case No. U-15990, MGUC used a 2010 test year. A 23
settlement was reached and approved by the Commission granting rate relief of $3.5 24
million, based on an overall rate of return of 7.16%, and a return on common equity 25
of 10.75%, effective January 1, 2010. 26
27

- 13 -
MGUC was also authorized to implement an Uncollectibles Expense Tracking 1
Mechanism (“UETM”) under which MGUC annually defers, and subsequently 2
surcharges or credits, 80% of the difference between MGUC’s future annual Net 3
Uncollectibles Expense and the $2,009,903 of Net Uncollectibles Expense included 4
in the revenue requirement in Case No. U-15990. 5
6
In addition, MGUC was authorized to implement a revenue decoupling mechanism 7
(“RDM”). The MGUC RDM is symmetrical, and reconciles volumetric distribution 8
margin revenue (exclusive of Gas Cost Recovery revenue) per customer for the 9
Residential, Multi-Family, and Small Commercial and Industrial rate schedules. 10
MGUC compares weather adjusted actual sales per customer during each 12-month 11
period, with the base sales per customer established in Case No. U-15990 for the 12
decoupled rate schedules. MGUC annually defers an amount for the difference, 13
which is subsequently reconciled with the Commission, and surcharged or credited 14
to customers. 15
16
MGUC’s rates for retail gas service established in Case No. U-15990 do not reflect 17
the current costs of providing retail gas service, and MGUC requires further rate 18
relief. 19
20
Q. Please explain, generally, why rate relief is sought at this time. 21
A. First, the 2012 historic test year indicates that MGUC suffered a revenue deficiency 22
of $6,301,860. This corresponds to a 6.14% return on common equity. This value is 23
well below MGUC’s authorized return on common equity of 10.75% authorized in 24
MGUC’s most recent general rate case proceeding in Case No. U-15990. MGUC 25
expects to suffer a significant revenue deficiency in 2013 and 2014 as well due to: 26
27

- 14 -
First, the cost of upgrades to the MGUC gas transmission and distribution systems, 1
2
Second, margin revenues have decreased since MGUC’s most recent general rate 3
case proceeding in Case No. U-15990 from $63.5 million to $62.3 million. 4
5
Third, MGUC is projecting a higher Cost of Capital in the 2014 projected test year. 6
7
Fourth, MGUC had a number of positions that were vacant during the 2012 Historical 8
Test period. MGUC expects to fill these positions throughout 2013 and 2014, as 9
discussed in the pre-filed direct testimony of Mr. Charles F. Hauska. 10
11
Fifth, MGUC’s building expenses will increase due to needed repairs and 12
maintenance during the 2014 projected test year. 13
14
Sixth, the cost of engineering analysis on vintage natural gas transmission and 15
distribution mains. 16
17
Seventh, customer relations costs and O&M costs will increase due to a project to 18
consolidate customer service functions such as billing, payments, and web access 19
for customers to more efficiently manage their accounts. 20
21
Lastly, general inflation is expected to increase costs at a rate of about 3.74% over 22
the 2012-2014 timeframe. MGUC’s estimate for inflation for 2013 and 2014 was 23
calculated using a methodology similar to that used by MPSC Staff witness, Kirk K. 24
Megginson, in Case No. U-14893, SEMCO Energy Gas Company’s 2007 general 25
rate case. 26
27

- 15 -
As shown above, the growth in revenues has not kept up with the growth in costs. 1
2
MGUC Witnesses 3 Q. Please identify the MGUC witnesses, and indicate the subjects they will 4
address in their testimony. 5
A. I provide testimony and evidence regarding: 6
1. The revenue deficiency, including 7 a. O&M Expenses, 8 b. K&M Items, 9 c. Common equity adjustments, 10 d. Capital structure adjustments, 11 e. Rate base, and 12 f. Operating Income 13
14 2. Depreciation rates, 15
16 3. Bonus Depreciation, 17
18 4. Continuation of an uncollectible expense true-up mechanism, 19
20 5. Continuation of a revenue decoupling mechanism, 21
22 6. Interim rates, and 23
24 7. Gas Costs and Revenues. 25
26
Mr. Matthew M. Dirksen provides testimony on the sales forecast and a 27
recommendation for a change in the period for weather normalization. 28
29
Ms. Christine M. Phillips, CPA, provides testimony regarding employee benefits. 30
31
Ms. Noreen E. Cleary provides testimony about the MGUC and Integrys Pay-at-Risk 32
plan. 33
34
Mr. Charles F. Hauska provides testimony regarding capital expenditures greater 35
than $500,000, as well as K&M adjustments relating to staff vacancies, high risk 36
mains, building expenses, storage field costs and well logs costs. 37

- 16 -
1
Mr. Brian E. Kage provides testimony to describe the ICE 2016 project, as well as 2
the Intangible Benefits of ICE 2016. 3
4
Mr. Michael E. Gerth provides testimony about the Net Present Values of the ICE 5
2016 project. 6
7
Ms. Tracy L. Kupsh provides testimony on IBS charges. 8
9
Ms. Lisa J. Gast, CPA, provides testimony on MGUC’s capital structure and 10
requested return on common equity. 11
12
Mr. Paul R. Moul provides testimony on the required return on common equity. 13
14
Ms. Joylyn C. Hoffman Malueg, CMA, provides testimony on the class cost of service 15
studies. 16
17
Mr. David J. Tyler provides testimony on rate design, including the proposed rate 18
design for interim rate relief. In addition, Mr. Tyler sponsors the proposed tariff 19
changes. 20
21
Mr. John R. Wilde provides testimony on certain tax issues. 22
23
The Revenue Deficiency 24 Q. What is the amount of rate relief MGUC is seeking in this proceeding? 25
A. MGUC’s analysis of the test year ending December 31, 2014 indicates a need for an 26
annual rate increase of $8,036,820, or 6.01%, for retail gas operations. This 27
increase is based on the rates authorized in the Commission’s December 16, 2009 28

- 17 -
Order Approving Partial Settlement Agreement in Case No. U-15990 and a proposed 1
return on common equity of 10.75%, which is supported by the pre-filed direct 2
testimony of Mr. Paul R. Moul. 3
4
The rates sponsored by Mr. David J. Tyler are designed to produce the requested 5
revenue requirement, and to move toward the MGUC goal of a rate design where 6
each rate schedule will return the overall allowed rate of return, consistent with 7
MGUC’s cost of service study, MGUC’s rate design general principles, and existing 8
law. 9
10
Q. What test period is MGUC’s proposed rate increase based on? 11
A. MGUC has used a projected test year ending December 31, 2014. 12
13
O&M Expenses 14 Q. Please describe how MGUC developed 2014 O&M expenses. 15
A. MGUC started with 2012 actual O&M expenses, and inflated them to 2014 using 16
inflation factors developed by a methodology similar to that used by MPSC Staff 17
witness, Kirk D. Megginson, in Case No. U-14893, SEMCO Energy Gas Company’s 18
2007 general rate case. The inflation factors used were 1.708% for 2013, and 19
1.993% for 2014, as developed on Exhibit A-7 (KAD-4). MGUC then adjusted this 20
2014 O&M expense value for the K&M items, as described later in this testimony, 21
and in the testimony of Charles F. Hauska and Christine M. Phillips. 22
23
K&M Items 24 Q. Please describe the K&M adjustments included in the 2014 projected test year 25
O&M expenses, as detailed on Schedules C14 – C15 and C22 – C31 of Exhibit 26
A-3 (KAD-3), Schedules C16 – C21 of Exhibit (CFH-2), and Schedule C34 of 27
Exhibit A-3 (CMP-1) compared to actual O&M expenses from the 2012 historic 28

- 18 -
test year. 1
A. There are eighteen K&M adjustments. Fifteen are K&M increases, and three are 2
K&M decreases. 3
4
MGUC has defined K&M items to be any O&M cost item that was increased (or 5
decreased) at a rate other than the rates of inflation calculated on Exhibit A-7 (KAD-6
4). 7
8
The fifteen K&M increases are associated with: 9
1. Manufactured Gas Plant Remediation costs, 10 11
2. The increased costs of the Integrys Pay-at-Risk plan, 12 13
3. Storage Field Costs, 14 15
4. Well Logs Costs, 16 17
5. Building Expenses, 18 19
6. Non-Union Staff costs, 20 21
7. High Risk Mains costs, 22 23
8. Union Staff costs, 24 25
9. Customer Relations and ICE 2016 O&M costs, 26 27
10. Uncollectible Accounts, 28 29
11. IBS Staff costs, 30 31
12. IBS Regulatory Affairs Labor costs, 32 33
13. A&G Loader Adjustment, 34 35
14. IBS Regulatory Affairs Non-Labor costs, and 36 37
15. IBS Depreciation Gas Management System & ICE Hardware costs. 38 39 40
The three K&M decreases are associated with: 41
1. Injuries and Damages, 42 43

- 19 -
2. Benefits Amortizations Expense, and 1 2 3. Benefits Expense (less transitions costs and amortizations). 3
4
Each of these K&M adjustments is discussed in further detail later in this testimony, 5
or in the pre-filed direct testimony of Mr. Charles F. Hauska or Ms. Christine M. 6
Phillips. 7
8
Q. Please explain Schedule A1 of Exhibit A-1 (KAD-1). 9
A. Schedule A1 of Exhibit A-1 (KAD-1) calculates MGUC’s 2014 projected test year 10
revenue deficiency based on its rate base, adjusted net operating income, rate of 11
return, and revenue conversion factor. This schedule indicates that the 2014 Total 12
Company revenue deficiency is $8,036,820, or 6.01%, based on the rates authorized 13
in the Commission’s December 19, 2009 Order Approving Partial Settlement 14
Agreement in Case No. U-15990, and a proposed 10.75% return on equity. The 15
component parts of this schedule are taken from the various sources indexed to the 16
left of each value. 17
18
Common Equity Adjustments 19 Q. What adjustments were made to the equity portion of MGUC’s capital 20
structure? 21
A. MGUC has removed certain accounts both from the 2012 historic test year and the 22
2014 projected test year. For both the 2012 historic test year and the 2014 projected 23
test year, Goodwill, Trade Name, and the associated deferred income taxes, were 24
removed from MGUC’s Equity balance. In addition, two Deferred Compensation 25
accounts were removed. This resulted in a reduction of equity of $62,231,636 in 26
2012, and $57,013,414 in 2014, which tends to reduce the revenue requirement. 27
28
29

- 20 -
Capital Adjustments 1 Q. What adjustments were made to MGUC’s overall capital structure? 2
A. For both the 2012 historic test year and the 2014 projected test year, interest bearing 3
accounts in working capital were removed from the capital structure to prevent 4
MGUC from earning a return on these items. This adjustment included items related 5
to: 6
1. GCR Over/Under Collections, 7
2. Customer Advances and Deposits, 8
3. UETM accounts, 9
4. RDM accounts, and 10
5. MI Energy Optimization. 11
This resulted in a reduction in the capital structure of $4,391,294 in 2012, and 12
$5,003,188 in 2014, which tends to reduce the revenue requirement. 13
14
Q. Please explain Schedule A2 of Exhibit A-1 (KAD-1). 15
A. Schedule A2 of Exhibit A-1 (KAD-1) provides the bridge between the 2012 historical 16
test year revenue deficiency and 2014 projected test year revenue deficiency. 17
18
Rate Base 19 Q. Please explain Schedule B1 of Exhibit A-2 (KAD-2). 20
A. Schedule B1 of Exhibit A-2 (KAD-2) calculates MGUC’s 2014 projected test year rate 21
base. The 2014 Total Company rate base is $210,493,148, as shown on Line 21. 22
The component parts of this schedule are taken from the various sources indexed to 23
the left of these amounts. Also, all values shown are 13-month averages. 24
25
Q. Please explain Schedule B2 of Exhibit A-2 (KAD-2). 26
A. Schedule B2 of Exhibit A-2 (KAD-2) depicts MGUC’s 2014 projected test year utility 27
plant. To arrive at the 2014 projected test year utility plant, the June 30, 2012 actual 28

- 21 -
balance of utility plant was projected forward using MGUC’s 2012, 2013, and 2014 1
construction budgets. The 2014 Total Company utility plant is $353,437,557, as 2
shown on Line 13. Also, all values shown are 13-month averages. 3
4
Q. Please explain Schedule B3 of Exhibit A-2 (KAD-2). 5
A. Schedule B3 of Exhibit A-2 (KAD-2) depicts MGUC’s 2014 projected test year 6
accumulated provision for depreciation. To arrive at the 2014 projected test year 7
accumulated provision for depreciation, the June 30, 2012 actual balance of 8
accumulated provision for depreciation was projected forward using MGUC’s 2012, 9
2013, and 2014 construction budgets. The 2014 Total Company accumulated 10
provision for depreciation is $189,078,201, as shown on Line 2. Also, all values 11
shown are 13-month averages. 12
13
Q. Please explain Schedule B4 of Exhibit A-2 (KAD-2). 14
A. Schedule B4 of Exhibit A-2 (KAD-2) calculates MGUC’s 2014 projected test year 15
working capital. The 2014 Total Company working capital is $46,133,792, as shown 16
on Line 41. Also, all values shown are 13-month averages. 17
18
Q. Please explain Schedule B6 of Exhibit A-2 (KAD-2). 19
A. Schedule B6 of Exhibit A-2 (KAD-2) presents a projected 2014 rate base developed 20
by trending analysis. The results from this trending show that MGUC’s 2014 trended 21
rate base based upon actual historical data from January 1, 2007 through December 22
31, 2012 is $11 million lower than MGUC’s 2014 projected test year rate base in the 23
instant general rate case proceeding, as shown on Line 35. 24
25
The major reasons for the difference between the 2014 trended rate base and the 26
2014 forecasted rate base include an increase in Net Plant of $25M due to 27

- 22 -
forecasted capital spending being higher than the trended amount of capital 1
spending. MGUC has recently committed to an increased capital expenditures plan 2
to improve its transmission and distribution systems. In the past few years, MGUC 3
had spent between $7.0 and $11.7 million on capital per year. In the 2012 Historical 4
Test Year, capital expenditures were $16.3 million. In the next few years, MGUC 5
plans to spend between $16.2 and $19.7 million per year on capital projects. 6
7
In addition to the Net Plant increase, other rate base variances include a decrease in 8
CWIP of $4M having closed all projects to Plant as of December 31, 2014; a 9
decrease in Working Capital, including a decrease in Temporary Cash of $4M, a 10
decrease in customer Accounts Receivable of $4M, and an increase in Accrued 11
Utility Revenue of $1.7M; and a decrease in Storage Gas of $1.6M due to a lower 12
cost of gas commodity. 13
14
Operating Income 15 Q. Please explain Schedule C1 of Exhibit A-3 (KAD-3). 16
A. Schedule C1 of Exhibit A-3 (KAD-3) calculates MGUC’s 2014 projected test year 17
adjusted net operating income. The 2014 Total Company adjusted net operating 18
income is $8,565,375, as shown on Line 22. 19
20
Q. Please explain Schedule C2 of Exhibit A-3 (KAD-3). 21
A. Schedule C2 of Exhibit A-3 (KAD-3) calculates MGUC’s 2014 projected test year 22
gross revenue conversion factor. The 2014 gross revenue conversion factor is 23
1.637, as shown on Line 14. 24
25
26
Q. Please explain Schedule C3 of Exhibit A-3 (KAD-3). 27
A. Schedule C3 of Exhibit A-3 (KAD-3) calculates MGUC’s 2014 projected test year 28

- 23 -
total revenue. The 2014 Total Company total revenue is $134,862,467, as shown on 1
Line 6. 2
3
Q. Please explain Schedule C4 of Exhibit A-3 (KAD-3). 4
A. Schedule C4 of Exhibit A-3 (KAD-3) calculates MGUC’s 2014 projected test year 5
cost of gas. The 2014 Total Company cost of gas is $71,684,716, as shown on Line 6
7. 7
8
Q. Please explain Schedule C5 of Exhibit A-3 (KAD-3). 9
A. Schedule C5 of Exhibit A-3 (KAD-3) calculates MGUC’s 2014 projected test year 10
total O&M expense, exclusive of the cost of gas. The 2014 Total Company total 11
O&M expense, exclusive of the cost of gas, is $37,518,049, as shown on Line 19. 12
13
Q. Please explain Schedule C6 of Exhibit A-3 (KAD-3). 14
A. Schedule C6 of Exhibit A-3 (KAD-3) depicts MGUC’s 2014 projected test year total 15
depreciation and amortization expense. The 2014 Total Company total depreciation 16
and amortization expense is $9,779,652, as shown on Line 6. 17
18
Q. Please explain Schedule C7 of Exhibit A-3 (KAD-3). 19
A. Schedule C7 of Exhibit A-3 (KAD-3) calculates MGUC’s 2014 projected test year 20
total for taxes other than income taxes. The 2014 Total Company total for taxes 21
other than income taxes is $4,504,777, as shown on Line 32. 22
23
Q. Please explain Schedule C8 of Exhibit A-3 (KAD-3). 24
A. Schedule C8 of Exhibit A-3 (KAD-3) depicts MGUC’s 2014 projected test year 25
federal income taxes. The 2014 Total Company federal income taxes are 26
$2,509,208, as shown on Line 2. 27

- 24 -
1
Q. Please explain Schedule C9 of Exhibit A-3 (KAD-3). 2
A. Schedule C9 of Exhibit A-3 (KAD-3) depicts MGUC’s 2014 projected test year state 3
income taxes. The 2014 Total Company state income taxes are $295,743, as shown 4
on Line 2. 5
6
Q. Please explain Schedule C10 of Exhibit A-3 (KAD-3). 7
A. Schedule C10 of Exhibit A-3 (KAD-3) depicts MGUC’s 2014 projected test year local 8
taxes. The 2014 Total Company local taxes are $0, as shown on Line 2. 9
10
Q. Please explain Schedule C11 of Exhibit A-3 (KAD-3). 11
A. Schedule C11 of Exhibit A-3 (KAD-3) depicts MGUC’s 2014 projected test year 12
AFUDC. The 2014 Total Company AFUDC is $0, as shown on Line 5. 13
14
Q. Please explain Schedule C12 of Exhibit A-3 (KAD-3). 15
A. Schedule C12 of Exhibit A-3 (KAD-3) calculates the Income Tax Effect of Additional 16
Interest Allowed for MGUC’s 2014 projected test year. The tax effect of additional 17
interest allowed multiplied by the current income tax rate of 41% is $4,947, as shown 18
on line 20. 19
20
Q. Please explain Schedule C13 of Exhibit A-3 (KAD-3). 21
A. Schedule C13 of Exhibit A-3 (KAD-3) develops the O&M costs for MGUC’s 2014 22
projected test year. This series of workpapers starts with 2012 actual O&M 23
amounts. The 2012 expenses were first inflated at the estimated inflation factors of 24
1.708% for 2013 and 1.993% for 2014, as calculated on Exhibit A-7 (KAD-4). Next, 25
the Cost of Gas accounts were trued up to the 2014 forecasted costs. Lastly, O&M 26
was adjusted for K&M items. 27

- 25 -
1
Q. Please explain Schedule C14 of Exhibit A-3 (KAD-3). 2
A. Schedule C14 of Exhibit A-3 (KAD-3) calculates the K&M increase regarding costs to 3
remediate former manufactured gas plant sites. In its March 30, 1994 order in Case 4
No. U-10503, and its November 10, 2005 order in Case No. U-14657, the 5
Commission authorized MGUC to employ deferred accounting treatment for costs 6
associated with the remediation of former manufactured gas plant sites. Since 2002, 7
MGUC has conducted remediation activities at former manufactured gas plant sites 8
located in: 9
1. Benton Harbor (Remedial investigations, source removal, groundwater 10 monitoring, and property acquisition) 11
12 2. Cadillac (Remedial investigations, groundwater monitoring, source 13
removal, and property acquisition) 14 15
3. Coldwater Race Street (Remedial investigations, source removal, 16 groundwater monitoring, and closure documentation) 17
18 4. Grand Haven (Remedial investigations, source removal, and groundwater 19
monitoring) 20 21
5. Hillsdale (Remedial investigations, source removal, and groundwater 22 monitoring) 23
24 6. Otsego (Remedial investigations, source removal, groundwater 25
monitoring, and property acquisition) 26 27
7. South Haven (Remedial investigations, source removal, and property 28 acquisition) 29
30 8. Sturgis (Groundwater monitoring and closure documentation) 31
32 9. Traverse City (Groundwater monitoring) 33
34 10. Coldwater Chicago Street (Remedial investigations). 35
36
MGUC calculated the 2014 projected test year amortization expense in accordance 37
with the Commission’s current practice of amortizing deferred manufactured gas 38
plant remediation costs on a vintage basis over ten years. Therefore, for the 2014 39
projected test year, MGUC has calculated a K&M increase of $127,247 in Account 40

- 26 -
735, as shown on Line 8. 1
2
Q. Are environmental response activities performed and costs incurred under the 3
direction of the Michigan Department of Environmental Quality (MDEQ), as 4
required under Part 201, Environmental Remediation of the Natural Resources 5
and Environmental Protection Act (NREPA), 1994 PA 451, as amended (Act 6
451)? 7
A. Yes, they are. 8
9
Q. For what time period has Commission Staff already audited MGUC’s 10
Manufactured Gas Plant expenses? 11
A. As documented in Case No. U-15990, Data Request 01-JEL-10, provided on 12
September 24, 2009, Commission Staff has audited Manufactured Gas Plant 13
expenses through August 21, 2009 business. 14
15
Q. Please explain Schedule C15 of Exhibit A-3 (KAD-3). 16
A. Schedule C15 of Exhibit A-3 (KAD-3) calculates the $68,127 K&M adjustment 17
associated with Pay-at-Risk. Page 1 of 3 of Schedule C30, Exhibit A-3 (KAD-3) 18
calculates the K&M increase; page 2 of 3 identifies the removal of the 2012 inflated 19
Pay-at-Risk expenses; and page 3 of 3 calculates the inclusion of the forecasted 20
2014 Pay-at-Risk expenses. This adjustment was made so that all Pay-at-Risk 21
expenses that are included in the 2014 forecasted test year were included at the 22
“target” level. 23
24
Q. Please explain Schedule C22 of Exhibit A-3 (KAD-3). 25
A. Schedule C22 of Exhibit A-3 (KAD-3) calculates the K&M adjustment related to the 26
customer relations and ICE 2016 O&M costs related to the ICE 2016 project. The 27

- 27 -
ICE 2016 project is further explained in the pre-filed direct testimony of Mr. Brian E. 1
Kage and Mr. Michael E. Gerth. 2
3
The O&M costs related to customer relations and the ICE 2016 project are recorded 4
in FERC Accounts 901, 903, 905, 907, and 908. These costs can be summarized 5
into three categories: Customers Relations Labor, Customer Relations Non-Labor, 6
and ICE 2016 O&M. 7
8
The Customer Relations Labor and Customer Relations Non-Labor costs include the 9
impact of the ICE Project on IBS Customer Relations operational O&M costs 10
allocated to MGUC. These summaries exclude ICE 2016 Project Implementation 11
Costs except for the portion of IBS Customer Relations operating labor resources 12
that are forecasted to be capitalized during 2014 and 2015; these are recognized as 13
a partial return of that labor to O&M in 2015 and full return in 2016. 14
15
The ICE 2016 O&M costs that are depicted are the costs incurred during the 16
implementation phases of the ICE 2016 Project. These costs include project O&M 17
expense contingency for internal Integrys labor, contracted labor, Accenture partner 18
labor and expenses, software O&M, and miscellaneous O&M. The project O&M 19
expense for internal labor has been subtracted out of the project total O&M to avoid 20
double counting the O&M expense for internal labor between the Project O&M, IBS 21
Customer Relations O&M, and ITS operational O&M. 22
23
Schedule C22 of Exhibit A-3 (KAD-3), Page 2 of 2, presents the expenses in FERC 24
accounts 901, 903, 905, 907, and 908 for the 2012 Historical Test Year, summarized 25
by the three categories discussed above. Line 1 contains Customer Relations Labor 26
costs of $577,313; Line 2 contains Customer Relations Non-Labor costs of 27

- 28 -
$4,905,754; Line 3 contains ICE 2016 O&M costs of $79,074; and Line 4 displays 1
the balance contained in the five accounts of $1,104,356; for a total in these 2
accounts of $6,666,497. The 2012 costs are inflated based on the inflation factors 3
presented in Exhibit A-7 (KAD-4). The inflated 2014 forecasted costs in accounts 4
901, 903, 905, 907, and 908 are further adjusted for K&M costs of $372,785 related 5
to the customer relations and ICE 2016 project O&M costs for 2014, resulting in a 6
total 2014 forecasted amount of $7,288,282, as shown on page 1 of 2 of Schedule 7
C22, Exhibit A-3 (KAD-3). 8
9
Q. Please explain Schedule C23 of Exhibit A-3 (KAD-3). 10
A. Schedule C23 of Exhibit A-3 (KAD-3) calculates the K&M adjustment associated with 11
uncollectibles expense. MGUC has forecasted its 2014 projected test year 12
uncollectibles expense to equal a 3-year historical average of 2010 - 2012, which is 13
$1,917,930. This results in a total K&M increase of $422,307 in Account 904, as 14
shown on Line 8. 15
16
Q. Please explain Schedule C24 of Exhibit A-3 (KAD-3). 17
A. Schedule C24 of Exhibit A-3 (KAD-3) calculates the 2014 projected test year 18
uncollectibles expense of $1,917,930 referenced in Schedule C23 of Exhibit A-3 19
(KAD-3). As shown on this exhibit, for the 3-year period 2010-2012, MGUC’s 20
average net uncollectibles have equaled 1.43389% of MGUC’s tariff revenues. This 21
value was multiplied by MGUC’s 2014 projected test year retail revenues of 22
$133,757,462 to arrive at a 2014 projected test year uncollectibles expense of 23
$1,917,930, as shown on Line 11. MGUC proposes that its UETM be updated with 24
this new value for uncollectibles expense. 25
26
27
- 29 -
Q. Please explain Schedule C25 of Exhibit A-3 (KAD-3). 1
A. Schedule C25 of Exhibit A-3 (KAD-3) calculates the $213,581 K&M adjustment for 2
vacant positions IBS experienced in 2012. As shown on Schedule C25, Page 2 of 2, 3
this adjustment was calculated by dividing the average base and overtime of IBS 4
internal O&M by the average FTE’s in 2012. This average O&M per FTE was then 5
multiplied by the 72 vacant FTE’s IBS experienced in 2012. MGUC is allocated 3.6% 6
of these IBS costs; the remaining costs are allocated to the other Integrys 7
subsidiaries. The result was then multiplied by the inflation factor from Exhibit A-7 8
(KAD-4) to calculate the K&M adjustment. 9
10
Q. Please explain Schedule C26 of Exhibit A-3 (KAD-3). 11
A. Schedule C26 of Exhibit A-3 (KAD-3) calculates the $78,433 K&M adjustment related 12
to an increase in regulatory labor expenses associated with a rate case. There was 13
no rate case in 2012; therefore, there were no costs associated with a rate case in 14
the 2012 Historical Test Year O&M expenses. 15
16
Q. Please explain Schedule C27 of Exhibit A-3 (KAD-3). 17
A. Schedule C27 of Exhibit A-3 (KAD-3) calculates the $146,069 K&M adjustment 18
related to the elimination of the A&G Loader that was previously added to all MGUC 19
capital projects. This practice is not followed at the other Integrys utilities and in the 20
interest of standardizing accounting practices, the A&G Loader is being eliminated. 21
The value was calculated as the five-year historical average of the A&G loader, as 22
shown on line 15. 23
24
Q. Please explain Schedule C28 of Exhibit A-3 (KAD-3). 25
A. Schedule C28 of Exhibit A-3 (KAD-3) calculates the $6,395 K&M adjustment related 26
to an increase in regulatory non-labor expenses associated with a rate case. There 27

- 30 -
was no rate case in 2012; therefore, there were no costs associated with a rate case 1
in the 2012 Historical Test Year O&M expenses. 2
3
Q. Please explain Schedule C29 of Exhibit A-3 (KAD-3). 4
A. Schedule C29 of Exhibit A-3 (KAD-3) calculates the decrease of $22,007 K&M 5
adjustment associated with injuries and damages. MGUC has forecasted its 2014 6
projected test year injuries and damages expense to be equal to its 3-year historical 7
average, which is $446,851 as shown on line 12. 8
9
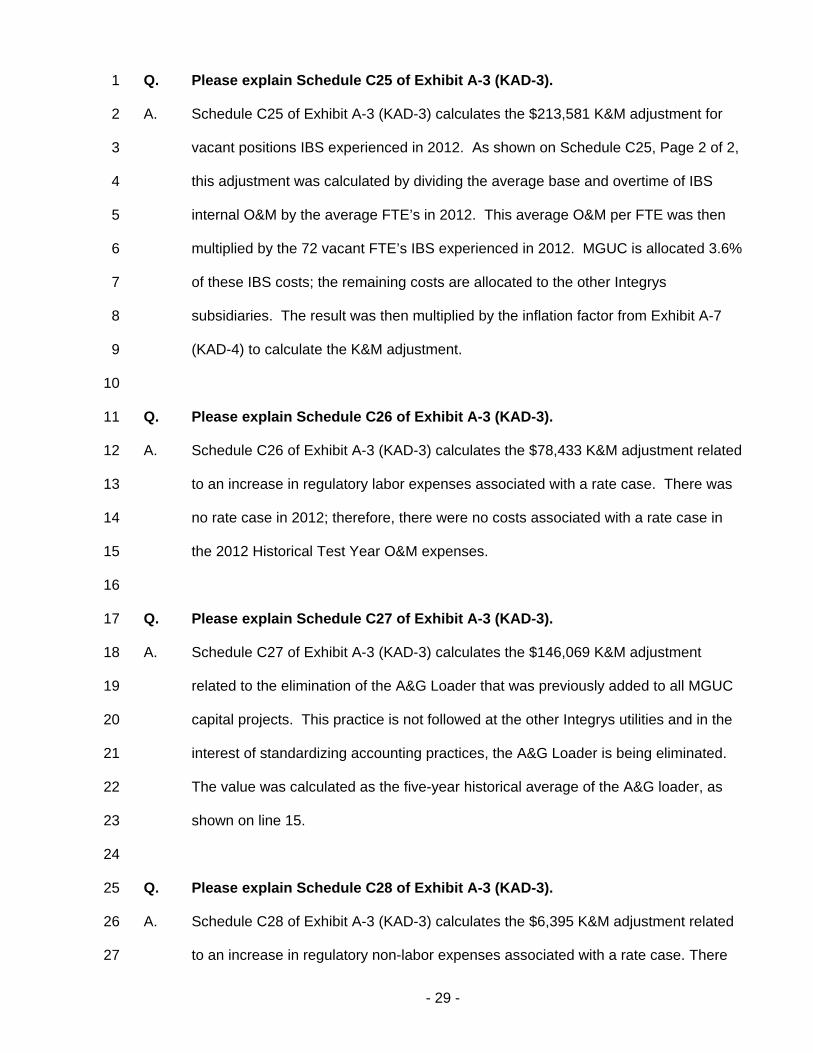
Q. Please explain Schedule C30 of Exhibit A-3 (KAD-3). 10
A. Schedule C30 of Exhibit A-3 (KAD-3) calculates the Benefits K&M decrease for 11
MGUC. 12
13
First, in the Commission’s January 9, 2007 Order in Case No. U-15138, the 14
Commission authorized the deferral and amortization of MGUC’s pension and OPEB 15
obligations recorded on its opening balance sheet as a result of the purchase of 16
MGUC from Aquila. As a result of this order, MGUC annually amortized $1,594,678 17
of expense, which was decreased to $1,594,610 for 2012, due to an amortization 18
that ended. Due to the combination of the lower amortization amount, and because 19
this amortization is not impacted by inflation, a K&M decrease of $90,559 in Account 20
926 was calculated, as shown on Line 8 of page 1. 21
22
Second, excluding the Account 926 impact of the K&M adjustment in Schedule C15 23
of Exhibit A-3 (KAD-3), and the amortization discussed above, MGUC is forecasting 24
a K&M decrease for MGUC employees of $451,492 in Account 926, as shown on 25
Line 8 of page 2. Further information regarding this calculation can be found on 26
page 2 of Schedule C30 of Exhibit A-3 (KAD-3), and in the pre-filed direct testimony 27

- 31 -
of Christine M. Phillips. 1
2
Taken together, these two adjustments result in a net K&M decrease of $542,051 in 3
Account 926. 4
5
Q. Please explain Schedule C31 of Exhibit A-3 (KAD-3). 6
A. Schedule C31 of Exhibit A-3 (KAD-3) calculates the $119,810 K&M adjustment 7
related to IBS depreciation of a Gas Management System (“GMS”) and ICE 2016 8
hardware. The annual IBS depreciation is allocated to each business unit based on 9
gas throughput; therefore, MGUC will be allocated $98,863. The annual IBS 10
depreciation for MGUC for the ICE 2016 hardware is $20,947. Taken together, 11
these values sum to $119,810. 12
13
Q. Please explain Exhibit A-7 (KAD-4). 14
A. Exhibit A-7 (KAD-4) calculates the inflation factors for 2013 and 2014 that were 15
subsequently applied to 2012 historic year O&M expenses to calculate 2014 16
projected test year O&M expenses. The schedule calculates the simple average of 17
five independent inflation forecasts, and results in an inflation factor if 1.708% for 18
2013, and 1.993% for 2014. 19
20
This methodology is similar to that used by MPSC Staff witness, Kirk K. Megginson, 21
in Case No. U-14893, SEMCO Energy Gas Company’s 2007 general rate case. 22
23
Q. Please explain Exhibit A-8 (KAD-5). 24
A. Exhibit A-8 (KAD-5) is a schedule of the Uncollectibles Expense Tracking 25
Mechanism (“UETM”) allocation factors for MGUC. As previously stated, MGUC 26
requests to extend its currently authorized UETM until its next general rate case. 27

- 32 -
Therefore, MGUC here provides updated allocators for the UETM, which are based 1
on actual Uncollectibles Expense from 2013. 2
3
Q. Please describe Exhibit A-9 (KAD-6). 4
A. Exhibit A-9 (KAD-6) is a summary of Awards & Recognition earned by Integrys and 5
Integrys subsidiaries during 2006-2012. 6
7
Q. Please explain Schedule A1 of Exhibit A-11 (KAD-7). 8
A. Schedule A1 of Exhibit A-11 (KAD-7) calculates MGUC’s 2012 historic test year 9
revenue deficiency based on its rate base, adjusted net operating income, rate of 10
return, and revenue conversion factor. This schedule develops the 2012 Total 11
Company revenue deficiency of $6,301,860, as shown on Line 16, using a 10.75% 12
return on equity. The component parts of this schedule are taken from the various 13
sources indexed to the left of these amounts. 14
15
Q. Please explain Schedule B1 of Exhibit A-12 (KAD-8). 16
A. Schedule B1 of Exhibit A-12 (KAD-8) calculates MGUC’s 2012 historic test year rate 17
base. The 2012 Total Company rate base is $194,076,269, as shown on Line 21. 18
The component parts of this schedule are taken from the various sources indexed to 19
the left of these amounts. 20
21
Q. Please explain Schedule B2 of Exhibit A-12 (KAD-8). 22
A. Schedule B2 of Exhibit A-12 (KAD-8) calculates MGUC’s 2012 historic test year 23
utility plant. The 2012 Total Company utility plant is $314,401,740, as shown on Line 24
13. 25
26
27

- 33 -
Q. Please explain Schedule B3 of Exhibit A-12 (KAD-8). 1
A. Schedule B3 of Exhibit A-12 (KAD-8) depicts MGUC’s 2012 historic test year 2
accumulated provision for depreciation. The 2012 Total Company accumulated 3
provision for depreciation is $171,640,370, as shown on Line 2. 4
5
Q. Please explain Schedule B4 of Exhibit A-12 (KAD-8). 6
A. Schedule B4 of Exhibit A-12 (KAD-8) calculates MGUC’s 2012 historic test year 7
working capital. The 2012 Total Company working capital is $51,314,899, as shown 8
on Line 41. 9
10
Q. Please explain Schedule C1 of Exhibit A-13 (KAD-9). 11
A. Schedule C1 of Exhibit A-13 (KAD-9) calculates MGUC’s 2012 historic test year 12
adjusted net operating income. The 2012 Total Company adjusted net operating 13
income is $9,943,804, as shown on Line 22. 14
15
Q. Please explain Schedule C2 of Exhibit A-13 (KAD-9). 16
A. Schedule C2 of Exhibit A-13 (KAD-9) calculates MGUC’s 2012 historic test year 17
gross revenue conversion factor. The 2012 gross revenue conversion factor is 18
1.637, as shown on Line 14. 19
20
Q. Please explain Schedule C3 of Exhibit A-13 (KAD-9). 21
A. Schedule C3 of Exhibit A-13 (KAD-9) calculates MGUC’s 2012 historic test year total 22
revenue. The 2012 Total Company total revenue is $122,621,203, as shown on Line 23
6. 24
25
Q. Please explain Schedule C4 of Exhibit A-13 (KAD-9). 26
A. Schedule C4 of Exhibit A-13 (KAD-9) calculates MGUC’s 2012 historic test year cost 27

- 34 -
of gas. The 2012 Total Company cost of gas is $63,534,006, as shown on Line 7. 1
2
Q. Please explain Schedule C5 of Exhibit A-13 (KAD-9). 3
A. Schedule C5 of Exhibit A-13 (KAD-9) calculates MGUC’s 2012 historic test year total 4
O&M expense, exclusive of the cost of gas. The 2012 Total Company total O&M 5
expense, exclusive of the cost of gas, was $33,647,791, as shown on Line 19. 6
7
Q. Please explain Schedule C6 of Exhibit A-13 (KAD-9). 8
A. Schedule C6 of Exhibit A-13 (KAD-9) depicts MGUC’s 2012 historic test year total 9
depreciation and amortization expense. The 2012 Total Company total depreciation 10
and amortization expense is $8,115,375, as shown on Line 6. 11
12
Q. Please explain Schedule C7 of Exhibit A-13 (KAD-9). 13
A. Schedule C7 of Exhibit A-13 (KAD-9) calculates MGUC’s 2012 historic test year total 14
for taxes other than income taxes. The 2012 Total Company total for taxes other 15
than income taxes is $4,264,075, as shown on Line 31. 16
17
Q. Please explain Schedule C8 of Exhibit A-13 (KAD-9). 18
A. Schedule C8 of Exhibit A-13 (KAD-9) depicts MGUC’s 2012 historic test year federal 19
income taxes. The 2012 Total Company federal income taxes are $2,868,188, as 20
shown on Line 2. 21
22
Q. Please explain Schedule C9 of Exhibit A-13 (KAD-9). 23
A. Schedule C9 of Exhibit A-13 (KAD-9) depicts MGUC’s 2012 historic test year state 24
income taxes. The 2012 Total Company state income taxes are $200,010, as shown 25
on Line 2. 26
27

- 35 -
Q. Please explain Schedule C10 of Exhibit A-13 (KAD-9). 1
A. Schedule C10 of Exhibit A-13 (KAD-9) depicts MGUC’s 2012 historic test year local 2
taxes. The 2012 Total Company local taxes are $0, as shown on Line 2. 3
4
Q. Please explain Schedule C11 of Exhibit A-13 (KAD-9). 5
A. Schedule C11 of Exhibit A-13 (KAD-9) depicts MGUC’s 2012 historic test year 6
AFUDC. The 2012 Total Company AFUDC is $0, as shown on Line 5. 7
8
Q. Please explain Schedule C12 of Exhibit A-13 (KAD-9). 9
A. Schedule C12 of Exhibit A-13 (KAD-9) calculates the Income Tax Effect of Additional 10
Interest Allowed for MGUC’s 2012 historical test year. The tax effect of additional 11
interest allowed multiplied by the current income tax rate of 41% is $47,954, as 12
shown on line 20. 13
14
Depreciation Rates 15 Q. What depreciation rates were used in this rate case? 16
A. As required by the Commission’s December 23, 2008 and February 20, 2009 Orders 17
in Case No. U-15895, MGUC used its currently approved depreciation rates and 18
practices approved in Case No. U-15963 to determine its 2014 revenue requirement 19
in the instant general rate case. 20
21
Also, in accordance with the Commission’s October 14, 2010 Order in Case No. U-22
15963, MGUC had filed a depreciation study on October 12, 2012. 23
24
Bonus Depreciation 25 Q. How was “bonus depreciation” calculated in the 2012 historic test year, and 26
the 2014 projected test year? 27
A. In February 2009, the American Recovery and Reinvestment Act of 2009 (“ARRA”) 28

- 36 -
was signed into law. Included in ARRA is a provision that provides MGUC with 1
additional opportunities to claim tax deductions for “bonus depreciation” for certain 2
assets placed in service during 2009. For 2012, bonus depreciation remained, but 3
was reduced to 50 percent. The American Taxpayer Relief Act of 2012 was signed 4
into law on January 2, 2013. This extends 50 percent bonus depreciation through 5
2013 (through 2014 in the case of certain period production property and 6
transportation property). This bonus depreciation was included when the revenue 7
requirement for the 2014 projected test year was calculated. 8
9
Uncollectible Expense True-Up Mechanism 10 Q. Please explain the 2014 uncollectible expense forecasted for the 2014 11
projected test year. 12
A. Schedule C23 of Exhibit A-3 (KAD-3) calculates the K&M adjustment associated with 13
uncollectibles expense. To be consistent with past practice, MGUC has forecasted 14
its 2014 projected test year uncollectibles expense equal to its 3-year historic 15
average, which is $1,917,930. This results in a total K&M increase of $422,307 in 16
Account 904. 17
18
Schedule C24 of Exhibit A-3 (KAD-3) calculates the 2014 projected test year 19
uncollectibles expense of $1,917,930 referenced in Schedule C23 of Exhibit A-3 20
(KAD-3). As shown on this exhibit, for the 3-year period 2010-2012, MGUC’s 21
average net uncollectibles have equaled 1.43389% of MGUC’s tariff revenues. This 22
value was multiplied by MGUC’s 2014 projected test year revenues of $133,757,462 23
to arrive at a 2014 projected test year uncollectibles expense of $1,917,930. 24
25
Q. Please explain the UETM that MGUC was authorized in U-15990. 26
A. MGUC was authorized to implement a UETM under which MGUC annually defers, 27
and subsequently surcharges or credits, 80% of the difference between MGUC’s 28

- 37 -
future annual Net Uncollectibles Expense and the $2,009,903 of Net Uncollectibles 1
Expense included in the revenue requirement in Case No. U-15990. 2
3
Q. Should the Commission allow MGUC’s UETM to continue? 4
A. Yes, it should. MGUC proposes that the UETM be continued in its current format; 5
however, updated with the 2014 uncollectibles allowance of $1,917,930 as 6
calculated on Exhibit A-3 (KAD-3) Schedule C23, and with updated allocators as 7
shown on Exhibit A-8 (KAD-5). 8
9
Decoupling Mechanism 10 Q. Is MGUC currently authorized the use of a revenue decoupling mechanism? 11
A. Yes, MGUC is. 12
13
Q. Please describe the revenue decoupling mechanism. 14
A. MGUC was authorized to implement a revenue decoupling mechanism in Case No. 15
U-15990. The MGUC RDM is symmetrical, and reconciles volumetric distribution 16
margin revenue (exclusive of Gas Cost Recovery revenue) per customer for the 17
Residential, Multi-Family, and Small Commercial and Industrial rate schedules. 18
MGUC will compare weather adjusted actual sales per customer during each 12-19
month period, with the base sales per customer established in Case No. U-15990 for 20
the decoupled rate schedules. MGUC annually defers an amount for the difference, 21
which is subsequently reconciled with the Commission, and surcharged or credited 22
to customers. 23
24
Q. Should the Commission allow MGUC’s RDM to continue? 25
A. Yes, it should. MGUC proposes that the RDM be continued in its current format; 26
however, it should be updated with the 2014 base sales per customer. 27
28

- 38 -
Interim Rates 1 Q. Does MGUC intend to self-implement interim rates in this general rate 2
proceeding? 3
A. Yes, MGUC does. In accordance with MCL 460.6a(1), MGUC intends to self-4
implement interim rates for service rendered on and after January 1, 2014. The 5
interim rate design is discussed in the pre-filed direct testimony of Mr. David J. Tyler. 6
7
Matching of Gas Costs and Gas Cost Revenues 8 Q. Has MGUC matched gas costs and gas cost revenues in the calculation of the 9
revenue deficiency in this general rate case proceeding? 10
A. Yes, we have. The gas cost recovery factors used to calculate Revenues on Present 11
Rates in this general rate case proceeding were calculated, such that gas costs 12
equaled gas cost revenues, resulting in one-for-one recovery of gas costs. 13
14
Q. Does this conclude your pre-filed direct testimony? 15
A. Yes, it does. 16

Michigan Public Service Commission Case No.: U-17273Michigan Gas Utilities Corporation Exhibit No.: A-1 (KAD-1)Revenue Deficiency (Sufficiency) Schedule: A1For the 12 Month Period Ended, December 31, 2014 Page: 1 of 1
Witness: Katherine A. De Cramer, CPA
(a) (b) (c)
LineNo. Description Source Total12 Rate Base Exh. A-2, Sch. B1 210,493,148$ 34 Operating Income Exh. A-3, Sch. C1 8,565,37556 Overall Rate of Return Line 4 ÷ Line 2 4.0692%78 Rate of Return Exh. A-4, Sch. D1 6.4020%910 Income Requirements Line 2 x Line 8 13,475,7551112 Income Deficiency (Sufficiency) Line 10 - Line 4 4,910,3801314 Revenue Conversion Factor Exh. A-3, Sch. C2 1.63671516 Revenue Deficiency (Sufficiency) Line 12 x Line 14 8,036,820$
Schedule A1

Michigan Public Service Commission Case No.: U-17273Michigan Gas Utilities Corporation Exhibit No.: A-1 (KAD-1)Projected Revenue Deficiency (Sufficiency) Schedule: A2Bridge Between 2012 Historical Test Year and 2014 Projected Test Year Page: 1 of 1Projected 12 Month Period Ending, December 31, 2014 Witness: Katherine A. De Cramer, CPA
(a) (b) (c)
LineNo. Description
1 2012 Revenue Deficiency/(Sufficiency) 6,301,86023 2014 Gas Margin -4,090,5554 Other Adjustment 056 Non-Fuel O&M7 Inflation 1,249,3278 Manufactured Gas Plant Remediation Amortization 127,2479 Company Use 268,248
10 Incentives Adjustments 68,12711 Storage Field Costs 70,50212 Well Log Costs 80,00013 Building Expenses 250,00014 Non-Union Vacancies Filled 407,00015 High Risk Mains 250,00016 Union Staff Vacancies Filled 505,00017 Customer Relations and ICE2016 O&M Costs 372,78518 Uncollectible Accounts 422,30719 IBS Vacancies Filled 213,58120 IBS Regulatory Affairs Increase -- Labor 78,43321 A&G Loader Adjustment 146,06922 IBS Regulatory Affairs -- Non-Labor 6,39523 Injuries & Damages -22,00724 Benefits Expense (Amortizations Only) -90,55925 Benefits Expense (Less Transition Costs and Amortizations) -451,49226 IBS Depreciation Gas Management System & ICE Hardware 119,8102728 Total Non-Fuel O&M Adjustments 4,070,77329
Schedule A2
293031 Property Taxes 160,83132 Payroll Taxes 77,43433 Other Taxes 2,4373435 240,7023637 Capital Projects Depreciation38 Production 51,47339 Transmission 139,97640 Distribution 1,434,22741 Storage 38,6024243 Total Depreciation 1,664,278444546 Rate Base Return -189,6264748 Rate of Return (ROE - 10.75%) 049 Other 39,3885051 2014 Revenue Deficiency 8,036,8205253 2014 Tariff Revenues 133,757,46754
Rate Increase Percentage 6.01%

Michigan Public Service Commission Case No.: U-17273Michigan Gas Utilities Corporation Exhibit No.: A-2 (KAD-2)Rate Base Schedule: B1For the 12 Month Period Ended, December 31, 2014 Page: 1 of 1
Witness: Katherine A. De Cramer, CPA
(b) (c)
LineNo. Source Rate Base12 Plant in Service Exh A-2, Sch B2 353,437,557$ 3 Plant Held for Future Use Exh A-2, Sch B2 04 Construction Work in Progress Exh A-2, Sch B2 05 Total Utility Plant 353,437,557$ 67 Less: Depreciation Reserve Exh A-2, Sch B3 189,078,20189 Net Utility Plant 164,359,356$ 1011 Net Capital Lease Property 01213 Total Utility Property and Plant 164,359,356$ 1415 Less: Capital Lease Obligations 01617 Net Plant 164,359,356$ 1819 Allowance for Working Capital Exh A-2, Sch B4 46,133,7922021 Total Rate Base 210,493,148$
(a)
Description
Schedule B1

Michigan Public Service Commission Case No.: U-17273Michigan Gas Utilities Corporation Exhibit No.: A-2 (KAD-2)Utility Plant Schedule: B2For the 12 Month Period Ended, December 31, 2014 Page: 1 of 1
Witness: Katherine A. De Cramer, CPA
(a) (b) (c)
MPSCLine AccountNo. Description No. Utility Plant12 Plant in service 101 345,069,392$ 3 Plant purchased or sold 102 - 4 Plant leased to others 104 - 5 Completed construction not classified 106 4,766,404 6 Gas Stored Base Gas 117 3,601,761 7 Plant in Service 353,437,557$ 89 Plant held for future use 1051011 Construction work in progress 107 - 1213 Total Utility Plant 353,437,557$
Schedule B2

Michigan Public Service Commission Case No.: U-17273Michigan Gas Utilities Corporation Exhibit No.: A-2 (KAD-2)Accumulated Provision for Depreciation Schedule: B3For the 12 Month Period Ended, December 31, 2014 Page: 1 of 1
Witness: Katherine A. De Cramer, CPA
(a) (b)
Line Accum. Prov.No. Description Source for Depr.12 Workpapers 2014 Page 10 189,078,201$
Schedule B3
Total Accumulated Provision for Depreciation

Michigan Public Service Commission Case No.: U-17273Michigan Gas Utilities Corporation Exhibit No.: A-2 (KAD-2)Working Capital Schedule: B4For the 12 Month Period Ended, December 31, 2014 Page: 1 of 1
Witness: Katherine A. De Cramer, CPA
(a) (b)
Line WorkingNo. Description Source Capital12 Assets3 Utility Plant-ARO Workpapers 2014 Page 77 1,387,148$ 4 Accumulated Depreciation-ARO Workpapers 2014 Page 77 (402,942) 5 Cash/Bank Balance Workpapers 2014 Page 16 189,780 6 Temporary Cash Workpapers 2014 Page 82 - 7 Notes Receivable Workpapers 2014 Page 82 2,687 8 Customer A/R Workpapers 2014 Page 85 8,428,449 9 Other A/R Workpapers 2014 Page 85 712,997 10 Accumulated Provision Uncollectible Accounts Workpapers 2014 Page 85 (1,567,877) 11 Accounts Receivable from Associated Companies Workpapers 2014 Page 85 64,805 12 Taxes Receivable Other Companies Workpapers 2014 Page 85 - 13 Prepayments Workpapers 2014 Page 15 527,688 14 Accrued Utility Revenues Workpapers 2014 Page 85 8,446,355 15 Fuel Stock/Gas Storage Workpapers 2014 Page 10 14,976,515 16 Other Materials & Supplies Workpapers 2014 Page 10 512,219 17 Miscellaneous and Accrued Workpapers 2014 Page 85 2,710,638 18 Derivative Assets Workpapers 2014 Page 85 172,882 19 Int & Div Receivable Workpapers 2014 Page 85 57 20 Other Deferred Debits not in Ratebase Workpapers 2014 Page 89 62,561,444 2122 Total Assets 98,722,845$ 2324 Liabilities25 Def Cr-Sup Ret Sel SERP Workpapers 2014 Page 95 8,931,907$ 26 Accum Provision for Injuries & Damages Workpapers 2014 Page 96 5,468 27 Asset Retirement Obligation Workpapers 2014 Page 103 1,851,532 28 Accounts Payable Workpapers 2014 Page 104 14,605,226 29 Accounts Payable Other Workpapers 2014 Page 106 3,058,694 30 Accrued Taxes Workpapers 2014 Page 17 2,663,523 31 Accrued Interest Workpapers 2014 Page 108 13,932 32 Tax Collections Payable Workpapers 2014 Page 110 6,676 33 Miscellaneous Current/Accrued Workpapers 2014 Page 111 1,812,708 34 Derivative Liab Workpapers 2014 Page 112 11,660 35 Other Deferred Credits Workpapers 2014 Page 113 19,273,903 36 Other Regulatory Liabilities Workpapers 2014 Page 115 353,824 37 Accumulated Deferred Taxes N/A - 3839 Total Liabilities 52,589,053$ 4041 Total Working Capital 46,133,792$
Schedule B4

Case No.: U-17273 Exhibit No.: A-2 (KAD-2)
Schedule No.: B6Page: 1 of 1
Witness: Katherine A. De Cramer, CPA
Michigan Gas Utilities CorporationSummary of Corporate Gas Rate Base Trending AnalysisFor the Period 2007 - 2012
Historical Historical Historical Historical Historical Historical Projected DifferenceLine 13-mo-avg 13-mo-avg 13-mo-avg 13-mo-avg 13-mo-avg 13-mo-avg Trended Trended Test Year of ForecastedNo. Accounts 2007 2008 2009 2010 2011 2012 2013 2014 2014 vs. Trended12 Gross Plant 101, 106 274,664,066 280,532,632 288,960,941 294,398,728 300,347,751 310,262,590 310,873,145 311,484,902 353,437,556 41,952,6553 Utility Plt Acq Adj 114 0 0 0 0 0 0 0 0 0 04 Accum Depreciation - S/L 108, 111, 254185 (138,179,631) (143,583,513) (150,386,255) (157,648,734) (165,321,946) (171,640,370) (171,978,135) (172,316,565) (189,078,201) (16,761,636)5 Acc Prov Amor Plt Acq Adj 115 0 0 0 0 0 0 0 0 0 06 Net Nuclear Fuel 120% 0 0 0 0 0 0 0 0 0 07 Net Plant 136,484,435 136,949,120 138,574,686 136,749,994 135,025,805 138,622,220 138,895,010 139,168,337 164,359,355 25,191,01889 CWIP 107 299,777 789,434 547,404 938,076 2,308,951 4,139,150 4,147,295 4,155,457 (0) (4,155,457)
10 Future Use Plant 105 0 0 0 0 0 0 0 0 0 011 Plant Total 136,784,212 137,738,554 139,122,089 137,688,070 137,334,756 142,761,370 143,042,305 143,323,793 164,359,355 21,035,5621213 Working Capital (BCR) Multiple Accts 28,478,440 30,062,777 33,718,563 27,162,741 36,759,224 34,923,284 34,992,008 35,060,868 32,591,114 (2,469,753)14 Cash & Bank 131, 134, 135 1,597,540 2,802,567 545,196 533,215 736,674 664,732 666,040 667,351 189,780 (477,570)15 Gas Storage 151, 152, 164 36,035,101 43,247,633 33,372,939 29,213,824 22,174,713 16,547,698 16,580,262 16,612,889 14,976,515 (1,636,374)16 Other M&S 154, 163 697,243 593,168 427,014 317,655 457,667 488,152 489,113 490,075 512,219 22,14417 Investments Multiple Accts 0 0 0 0 0 0 0 0 0 018 Investments - Deferred Txs Multiple Accts 0 0 0 0 0 0 0 0 0 019 Prepayments 165 267,825 181,829 766,988 1,804,705 371,064 471,257 472,184 473,113 527,688 54,57520 Amort of Appropriated RE 215100 0 0 0 0 0 021 Sub-Total 67,076,149 76,887,974 68,830,700 59,032,141 60,499,342 53,095,122 53,199,606 53,304,296 48,797,317 (4,506,979)2223 Taxes 236 (2,481,168) (1,292,655) (1,129,470) (921,245) (2,473,079) (1,780,223) (1,783,727) (1,787,237) (2,663,523) (876,286)24 Customer Advances 252 0 0 0 0 0 0 0 0 0 025 Cust Adv. Def. Taxes 190120, 190220 0 0 0 0 0 0 0 0 0 026 M&S Deferred Taxes 283110, 283210 0 0 0 0 0 0 0 0 0 027 Sub-Total (2,481,168) (1,292,655) (1,129,470) (921,245) (2,473,079) (1,780,223) (1,783,727) (1,787,237) (2,663,523) (876,286)2829 201,379,192 213,333,873 206,823,320 195,798,966 195,361,019 194,076,269 194,458,185 194,840,852 210,493,149 15,652,2973031 Trended Increase N/A N/A N/A N/A N/A N/A 0.20% 0.20% N/A3233 Adjustments Multiple Accts 10,262,984 10,557,768 10,470,062 7,917,874 267,531 1,072,189 1,074,299 1,076,413 5,382,266 4,305,8533435 RATE BASE as ADJUSTED 191,116,209 202,776,105 196,353,257 187,881,092 195,093,488 193,004,080 193,383,886 193,764,439 205,110,883 11,346,4443637 Trended Increase: 0.20%
RATE BASE
*** 13 month average represents a 24-point average

Michigan Public Service Commission Case No.: U-17273Michigan Gas Utilities Corporation Exhibit No.: A-3 (KAD-3)Net Operating Income Schedule: C1For the 12 Month Period Ended, December 31, 2014 Page: 1 of 1
Witness: Katherine A. De Cramer, CPA
(a) (b)
NetLine OperatingNo. Description Source Income12 Operating Revenues Exh. A-3, Sch. C3 134,862,467$ 34 Operating Expenses5 Cost of Gas Exh. A-3, Sch. C4 71,684,7166 Operations and Maintenance Expenses Exh. A-3, Sch. C5 37,518,0497 Depreciation and Amortization Exh. A-3, Sch. C6 9,779,6528 General Taxes Exh. A-3, Sch. C7 4,504,7779 Income Taxes Exh. A-3, Sch. C8, C9 & C10 2,804,95110 Total Operating Expenses 126,292,145$ 1112 Operating Income 8,570,322$ 1314 Operating Income Adjustments15 Allowance For Funds Used During Construction - 016 Loss on Reacquired Securities - 017 Interest - 018 Income Tax Effect of Interest Exh. A-13, Sch. C12 4,94719 Interest Synchronization Adjustment 020 Total Operating Income Adjustments 4,947$ 2122 Adjusted Net Operating Income 8,565,375$
Schedule C1

Michigan Public Service Commission Case No.: U-17273
Michigan Gas Utilities Corporation Exhibit No.: A-3 (KAD-3)
Revenue Conversion Factor Schedule No.: C2
Page: 1 of 1
Witness: Katherine A. De Cramer, CPA
(a) (b) (c) (d)
Line Calc.
No. Description Logic 2014
1
2 Income Before Income Taxes 100.000%
3
4 Michigan Corporate Income Tax Rate 6.0000%
5
6 Federal Income Tax Base Ln 2 - Ln 7 94.000%78 Times Federal Income Tax Rate 35.000%910 Federal Income Tax Ln 8 x Ln 10 32.900%
1112 Income After Taxes Ln 8 - Ln 12 61.100%
1314 Gross Revenue Conversion Factor Ln 2 / Ln 14 1.6367
Schedule C2

Michigan Public Service Commission Case No.: U-17273Michigan Gas Utilities Corporation Exhibit No.: A-3 (KAD-3)Sales Revenue Schedule No.: C3For the 12 Month Period Ended, December 31, 2014 Page: 1 of 1
Witness: Katherine A. De Cramer, CPA
(a) (b) (c)
Line SalesNo. Description Source Revenue12 Present Revenues Workpapers 2014 Page 53 133,757,467$ 34 Other Adjustments Workpapers 2014 Page 53 1,105,000 56 Total Revenue 134,862,467$
Schedule C3

Michigan Public Service Commission Case No.: U-17273Michigan Gas Utilities Corporation Exhibit No.: A-3 (KAD-3)Cost of Gas Sold Schedule No.: C4For the 12 Month Period Ended, December 31, 2014 Page: 1 of 1
Witness: Katherine A. De Cramer, CPA
(a) (b) (c)
LineNo. Description Source Cost of Gas12 Cost of Gas:3 Energy Workpapers 2014 Page 19 71,684,716$ 4 Dem-Peak Day (D-1) - 5 Other COG - 67 Total Cost of Gas 71,684,716$
Schedule C4

Michigan Public Service Commission Case No.: U-17273Michigan Gas Utilities Corporation Exhibit No.: A-3 (KAD-3)Operation and Maintenance Expenses Schedule No.: C5For the 12 Month Period Ended, December 31, 2014 Page: 1 of 1
Witness: Katherine A. De Cramer, CPA
(a) (b) (c)
Line Operation andNo. Description Source Maint. Expenses12 Production - Other:3 Energy Workpapers 2014 Page 19 777,743$ 4 Dem-Peak Day (D-1) Workpapers 2014 Page 19 518,186$ 5 Other COG 726,852$ 67 Total Production-Other 2,022,781$ 89 Operation and Maintenance Expenses:10 Transmission Workpapers 2014 Page 19 503,162$ 11 Distribution Workpapers 2014 Page 19 17,969,986 12 Storage Workpapers 2014 Page 19 930,395 13 Customer Accounts Workpapers 2014 Page 19 14,996,806 14 Customer Service Workpapers 2014 Page 19 1,094,919 15 Sales Workpapers 2014 Page 19 - 1617 Total Operation and Maintenance Expenses 35,495,268$ 1819 Total Production-Other and Operation & Maintenance Expenses 37,518,049$
Schedule C5

Michigan Public Service Commission Case No.: U-17273Michigan Gas Utilities Corporation Exhibit No.: A-3 (KAD-3)Depreciation and Amortization Expense Schedule No.: C6For the 12 Month Period Ended, December 31, 2014 Page: 1 of 1
Witness: Katherine A. De Cramer, CPA
(a) (b) (c)
Line Depreciation &No. Description Source Amort. Expense12 Depreciation and Amortization Expense3 Depreciation Expense Workpapers 2014 Page 34 9,779,652$ 4 Amortization Expense - 56 Total Depreciation and Amortization Expense 9,779,652$
Schedule C6

Michigan Public Service Commission Case No.: U-17273Michigan Gas Utilities Corporation Exhibit No.: A-3 (KAD-3)Taxes Other Than Income Taxes Schedule No.: C7For the 12 Month Period Ended, December 31, 2014 Page: 1 of 1
Witness: Katherine A. De Cramer, CPA
(a) (b) (c)
Line GeneralNo. Description Source Taxes12 Taxes Other Than Income Taxes34 FEDERAL5 Retirement Benefits Workpapers 2014 Page 51 668,268$ 6 Unemployment Comp Workpapers 2014 Page 51 11,802 7 PR Taxes Credited Workpapers 2014 Page 51 - 8 Super Fund Tax9 Highway Use Tax
10 Federal Excise Tax Workpapers 2014 Page 51 610 1112 STATE13 Gross Receipts Tax -$ 14 Unemployment Comp Workpapers 2014 Page 51 44,156 15 Remain. Assessment16 Use Tax 1,512 17 Unauthor Ins Tax Workpapers 2014 Page 51 14,470 18 Wis Recycling Fee19 Single Business Tax - 20 Property Workpapers 2014 Page 51 3,366,214 2122 LOCAL23 Real Est & Property2425 IBS26 IBS Payroll Tax Workpapers 2014 Page 51 397,745$ 2728 OTHER29 Franchise Tax Fees Workpapers 2014 Page 51 -$ 30 State Unitary Fees Workpapers 2014 Page 51 - 3132 Total Taxes Other Than Income Taxes 4,504,777$
Schedule C7

Michigan Public Service Commission Case No.: U-17273Michigan Gas Utilities Corporation Exhibit No.: A-3 (KAD-3)Federal Income Taxes Schedule No.: C8For the 12 Month Period Ended, December 31, 2014 Page: 1 of 1
Witness: Katherine A. De Cramer, CPA
(a) (b) (c)
Line Federal IncomeNo. Description Source Taxes12 Federal Income Taxes Workpapers 2014 Page 35 2,509,208$
Schedule C8

Michigan Public Service Commission Case No.: U-17273Michigan Gas Utilities Corporation Exhibit No.: A-3 (KAD-3)State Income Taxes Schedule No.: C9For the 12 Month Period Ended, December 31, 2014 Page: 1 of 1
Witness: Katherine A. De Cramer, CPA
(a) (b) (c)
Line State IncomeNo. Description Source Taxes12 State Income Taxes Workpapers 2014 Page 35 295,743$
Schedule C9

Michigan Public Service Commission Case No.: U-17273Michigan Gas Utilities Corporation Exhibit No.: A-3 (KAD-3)Other (or Local) Taxes Schedule No.: C10For the 12 Month Period Ended, December 31, 2014 Page: 1 of 1
Witness: Katherine A. De Cramer, CPA
(a) (b) (c)
Line Other (or Local)No. Description Source Taxes12 None
Schedule C10

Michigan Public Service Commission Case No.: U-17273Michigan Gas Utilities Corporation Exhibit No.: A-3 (KAD-3)Allowance for Funds Used During Construction Schedule No.: C11For the 12 Month Period Ended, December 31, 2014 Page: 1 of 1
Witness: Katherine A. De Cramer, CPA
(a) (b) (c)
LineNo. Description Source AFUDC12 AFUDC Debt Workpapers 2014 Page 49 -$ 3 AFUDC Equity Workpapers 2014 Page 49 -$ 45 Total AFUDC -$
Schedule C11

Michigan Public Service Commission Case No.: U-17273Michigan Gas Utilities Corporation Exhibit No.: A-3 (KAD-3)Adjusted Net Operating Income -- Income Tax Savings Schedule No.: C12For the 12 Month Period Ended, December 31, 2014 Page: 1 of 1
Witness: Katherine A. De Cramer, CPA
(a) (b) (c)
LineNo. Description Source TOTAL12 Rate Base Ex A-2 Sch B-1 210,493,148$ 34 Debt Portion of Capital Structure Ex A-4 Sch D-1 42.02%56 Portion of Rate Base Funded by Debt Ln 1 x Ln 2 88,451,326$ 78 Cost of Debt (1) Ex A-4 Sch D-1 4.8750%910 Interest Allowed Ln 3 x Ln 4 4,311,999$ 1112 LESS INTEREST DEDUCTION13 INCLUDED IN RECORDED14 INCOME TAX ACCRUALS:15 Gas/Jurisdictional Company Books & Records 4,299,933$ 1617 Additional Interest Allowed Ln 10 - Ln 15 12,066$ 1819 Income Tax Effect20 Current Income Tax Rate of 41.0000% 4,947$
21222324252627282930
Schedule C12
May not cross-check due to rounding
* The Cost of Debt represents the weightingof respective Short Term and Long Term
Debt amounts against total debt multipliedby their respective costs.
Source: (1) Use Capital Structure Percentagesexcluding DITC from the Total.

Case No. U-17273Exhibit A-3 (KAD-3)
Schedule C13Page 1 of 6
Witness: Katherine A. De Cramer, CPA
2012 2014 Forecasted 2014 ForecastedHistorical 2013 2014 Total O&M Total O&M
Total O&M Not Including Cost of Gas Including K&MCPI CPI K&M Adjustments K&M K&M Reason
(1) PRODUCTION EXPENSES A. Gas Steam ProductionOperation:(700) Operation Supervision & Engineering - 1.708% 1.993% - - - - (701) Operation Labor - 1.708% 1.993% - - - - (702) Boiler Fuel - 1.708% 1.993% - - - - (703) Miscellaneous Steam Expenses - 1.708% 1.993% - - - - (704) Transferred-Credit - 1.708% 1.993% - - - -
TOTAL Operation - - - - -
Maintenance:(705) Maintenance Supervision & Engineering - 1.708% 1.993% - - - - (706) Maintenance of Structures & Improvements - 1.708% 1.993% - - - - (707) Maintenance of Boiler Plant Equipment - 1.708% 1.993% - - - - (708) Maint of Oth Stm ProdPlt - 1.708% 1.993% - - - -
TOTAL Maintenance - - - - - TOTAL Production Expenses-Gas Steam - - - - -
B. Liquified Gas ProductionOperation:(710) Operation Supervision & Engineering - 1.708% 1.993% - - - - (711) Steam Expenses - 1.708% 1.993% - - - - (712) Other Power Expenses - 1.708% 1.993% - - - - (717) Petroleum Gas Expenses - 1.708% 1.993% - - - - (728) Petroleum Gas - 1.708% 1.993% - - - - (732) Purification Expenses - 1.708% 1.993% - - - - (735) Miscellaneous Production Expenses 376,862 1.708% 1.993% 390,939 - 127,247 518,186 MGP Amortization (736) Rents - 1.708% 1.993% - - - -
TOTAL Operation 376,862 390,939 - 127,247 518,186
Maintenance:(740) Maintenance Supervision & Engineering - 1.708% 1.993% - - - - (741) Maintenance of Structures & Improvements - 1.708% 1.993% - - - - (742) Maintenance of Production Equipment - 1.708% 1.993% - - - -
TOTAL Maintenance - - - - - TOTAL Production Expenses-Liquified Gas 376,862 390,939 - 127,247 518,186
Michigan Gas Utilities CorporationOperation and Maintenance Expenses - Gas Utility
Historical and Forecasted
May not cross-check due to rounding.

Case No. U-17273Exhibit A-3 (KAD-3)
Schedule C13Page 2 of 6
Witness: Katherine A. De Cramer, CPA
2012 2014 Forecasted 2014 ForecastedHistorical 2013 2014 Total O&M Total O&M
Total O&M Not Including Cost of Gas Including K&MCPI CPI K&M Adjustments K&M K&M Reason
Michigan Gas Utilities CorporationOperation and Maintenance Expenses - Gas Utility
Historical and Forecasted
C. Natural Gas ProductionOperation:(754) Field Compressor Station - 1.708% 1.993% - - - - (756) Field Measuring & Regulating Station - 1.708% 1.993% - - 268,248 268,248 Company Use
TOTAL Operation - - - 268,248 268,248
Maintenance: - - - - - 1.708% 1.993% - - - -
TOTAL Maintenance - - - - - TOTAL Production Expenses-Natural Gas - - - 268,248 268,248
D. Other Gas Supply ExpensesOperation:(800) Natural Gas Well Head Purchases 1,214,808 1.708% 1.993% 1,260,182 (1,260,182) - - (804) Natural Gas City Gas Purchases 56,419,239 1.708% 1.993% 58,526,521 15,887,147 (17,542) 74,396,126 Pay-at-Risk (805) Other Gas Purchases - 1.708% 1.993% - - - - (808.1) Gas Withdrawn From Storage-Debit 21,753,370 1.708% 1.993% 22,565,869 (5,138,048) - 17,427,821 (808.2) Gas Delivered to Storage-Credit (15,124,409) 1.708% 1.993% (15,689,312) (3,658,234) - (19,347,546) (810) Gas Used for Compress Station Fuel - 1.708% 1.993% - - - - (812) Gas Used for Other Operations-Credit (186,511) 1.708% 1.993% (193,478) (74,770) - (268,248) (813) Other Gas Supply Expenses 179,523 1.708% 1.993% 186,230 (186,230) (13,942) (13,942) Pay-at-Risk
TOTAL Operation 64,256,020 66,656,012 5,569,683 (31,484) 72,194,211
Maintenance:- 1.708% 1.993% - - - -
TOTAL Maintenance - - - - - TOTAL Production Expenses-Other Gas Supply 64,256,020 66,656,012 5,569,683 (31,484) 72,194,211
TOTAL PRODUCTION EXPENSES 64,632,882 67,046,951 5,569,683 364,011 72,980,645
May not cross-check due to rounding.

Case No. U-17273Exhibit A-3 (KAD-3)
Schedule C13Page 3 of 6
Witness: Katherine A. De Cramer, CPA
2012 2014 Forecasted 2014 ForecastedHistorical 2013 2014 Total O&M Total O&M
Total O&M Not Including Cost of Gas Including K&MCPI CPI K&M Adjustments K&M K&M Reason
Michigan Gas Utilities CorporationOperation and Maintenance Expenses - Gas Utility
Historical and Forecasted
(2) NATURAL GAS STORAGEOperation:(814) Operation Supervision & Engineering 81,078 1.708% 1.993% 84,107 - (2,798) 81,309 Pay-at-Risk (815) Maps & Records 90 1.708% 1.993% 94 - 0 94 Pay-at-Risk (816) Wells 28,161 1.708% 1.993% 29,213 - (365) 28,848 Pay-at-Risk (817) Lines Expense 21,124 1.708% 1.993% 21,914 - (139) 21,775 Pay-at-Risk
(818) Compressor Station 15,909 1.708% 1.993% 16,504 - (131) 16,373 Pay-at-Risk
(819) Compress Station F&Pwr 83,457 1.708% 1.993% 86,575 - 70,502 157,077 Storage fields filled (820) Measuring & Regulating Station 7,133 1.708% 1.993% 7,400 - (2) 7,398 Pay-at-Risk (821) Purification Expenses 9,495 1.708% 1.993% 9,851 - (107) 9,744 Pay-at-Risk (824) Other Expenses 94,048 1.708% 1.993% 97,562 - (816) 96,746 Pay-at-Risk
TOTAL Operation 340,495 353,220 - 66,143 419,363
Maintenance:(830) Maintenance Supervision & Engineering 6,909 1.708% 1.993% 7,169 - (98) 7,071 Pay-at-Risk (832) Maintenance Reservoirs & Wells 54,804 1.708% 1.993% 56,852 - 79,958 136,810 Well Logs/ Pay-at-Risk (833) Maintenance of Lines 19,513 1.708% 1.993% 20,243 - (165) 20,078 Pay-at-Risk (834) Maintenance Compressor Station Equipment 44,118 1.708% 1.993% 45,767 - (120) 45,647 Pay-at-Risk (835) Maintenance Measuring & Regulating Equipment 5,119 1.708% 1.993% 5,311 - (85) 5,226 Pay-at-Risk (836) Maintenance Purification Equipment 3,534 1.708% 1.993% 3,667 - (46) 3,621 Pay-at-Risk (837) Maintenance Other Equipment 16,708 1.708% 1.993% 17,333 - (59) 17,274 Pay-at-Risk (842) Other Storage-Fuel 9,401 1.708% 1.993% 9,753 - - 9,753
TOTAL Maintenance 160,106 166,095 - 79,386 245,481 TOTAL Natural Gas Storage Expenses 500,601 519,315 - 145,529 664,844
(3) TRANSMISSION EXPENSESOperation:(850) Operation Supervision & Engineering 9,769 1.708% 1.993% 10,135 - - 10,135 (851) Sys Cont & Load Disp - 1.708% 1.993% - - - - (856) Mains Exp 41,602 1.708% 1.993% 43,157 - (76) 43,081 Pay-at-Risk (857) Measuring & Regulating Station 118,840 1.708% 1.993% 123,279 - (4) 123,275 Pay-at-Risk (859) Other Expenses 4,854 1.708% 1.993% 5,036 - - 5,036
TOTAL Operation 175,065 181,607 - (80) 181,527
Maintenance:(863) Maintenance of Mains 14,255 1.708% 1.993% 14,788 - (23) 14,765 Pay-at-Risk (865) Maintenance Measuring & Regulating Equipment 139,167 1.708% 1.993% 144,365 - (67) 144,298 Pay-at-Risk (867) Maintenance Other Equipment 5,382 1.708% 1.993% 5,584 - - 5,584
TOTAL Maintenance 158,804 164,737 - (90) 164,647 TOTAL Transmission Expenses 333,869 346,344 - (170) 346,174
May not cross-check due to rounding.

Case No. U-17273Exhibit A-3 (KAD-3)
Schedule C13Page 4 of 6
Witness: Katherine A. De Cramer, CPA
2012 2014 Forecasted 2014 ForecastedHistorical 2013 2014 Total O&M Total O&M
Total O&M Not Including Cost of Gas Including K&MCPI CPI K&M Adjustments K&M K&M Reason
Michigan Gas Utilities CorporationOperation and Maintenance Expenses - Gas Utility
Historical and Forecasted
(4) DISTRIBUTION EXPENSES Operation:(870) Operation Supervision & Engineering 1,070,518 1.708% 1.993% 1,110,503 - (55,925) 1,054,578 Pay-at-Risk (871) Distribution Load Dispatching 373,630 1.708% 1.993% 387,586 - (1,553) 386,033 Pay-at-Risk (874) Mains and Services Expenses 1,206,821 1.708% 1.993% 1,251,897 - 356 1,252,253 Pay-at-Risk (875) Measuring & Regulating Station Equipment 19,177 1.708% 1.993% 19,894 - - 19,894 (877) Measuring & Regulating Station Equipment-City Gate Check Station 67,932 1.708% 1.993% 70,471 - (1,819) 68,652 Pay-at-Risk (878) Meter & House Regulator Expense 1,103,777 1.708% 1.993% 1,145,005 - (203) 1,144,802 Pay-at-Risk (879) Customer Installations Expense 580,962 1.708% 1.993% 602,662 - (83) 602,579 Pay-at-Risk
(880) Other Expenses 2,480,376 1.708% 1.993% 2,573,020 - 238,761 2,811,781 Building Expenses/ Pay-at-
Risk (881) Rents 15,891 1.708% 1.993% 16,486 - - 16,486
TOTAL Operation 6,919,084 7,177,524 - 179,533 7,357,057
Maintenance:
(885) Maintenance Supervision & Engineering 41,664 1.708% 1.993% 43,221 - 448,460 491,681 Non-Union Staff Vacancies/
Pay-at-Risk
(887) Maintenance of Mains 652,822 1.708% 1.993% 677,206 - 248,660 925,866 High Risk Mains/ Pay-at-
Risk (889) Maintenance of Measuring & Regulating Station 52,541 1.708% 1.993% 54,505 - (65) 54,440 Pay-at-Risk (891) Maintenance of Measuring & Regulating Gate Station Equipment 61,594 1.708% 1.993% 63,896 - (360) 63,536 Pay-at-Risk (892) Maintenance of Services 331,323 1.708% 1.993% 343,699 - 8 343,707 Pay-at-Risk (893) Maintenance of Meters & House Regulators 286,425 1.708% 1.993% 297,124 - (42) 297,082 Pay-at-Risk (894) Maintenance of Other Equipment 180,081 1.708% 1.993% 186,808 - (22) 186,786 Pay-at-Risk
TOTAL Maintenance 1,606,450 1,666,459 - 696,639 2,363,098 TOTAL Distribution Expenses 8,525,534 8,843,983 - 876,172 9,720,155
May not cross-check due to rounding.

Case No. U-17273Exhibit A-3 (KAD-3)
Schedule C13Page 5 of 6
Witness: Katherine A. De Cramer, CPA
2012 2014 Forecasted 2014 ForecastedHistorical 2013 2014 Total O&M Total O&M
Total O&M Not Including Cost of Gas Including K&MCPI CPI K&M Adjustments K&M K&M Reason
Michigan Gas Utilities CorporationOperation and Maintenance Expenses - Gas Utility
Historical and Forecasted
(5) CUSTOMER ACCOUNTS EXPENSESOperation:(901) Supervision 395,834 1.708% 1.993% 410,619 - (50,839) 359,780 Pay-at-Risk
(902) Meter Reading Expenses 1,837,447 1.708% 1.993% 1,906,077 - 494,949 2,401,026 Union Staff Vacancies/ Pay-
at-Risk
(903) Customer Records and Collection Expenses 5,717,980 1.708% 1.993% 5,931,550 - 363,959 6,295,509 Customer Relations/
ICE2016 Costs/ Pay-at-Risk (904) Uncollectible Accounts 1,440,571 1.708% 1.993% 1,494,377 - 422,307 1,916,684 Uncollectible Accounts (905) Miscellaneous Customer Accounts Expenses 50,011 1.708% 1.993% 51,880 - (701) 51,179 Pay-at-Risk TOTAL Customer Accounts Expenses 9,441,843 9,794,503 - 1,229,675 11,024,178
(6) CUSTOMER SERVICE AND INFORMATIONAL EXPENSESOperation:(907) Supervision 593 1.708% 1.993% 617 - (68) 549 Pay-at-Risk (908) Customer Assistance Expenses 502,078 1.708% 1.993% 520,832 - (13,953) 506,879 Pay-at-Risk (909) Informational and Instructional Expenses 184,592 1.708% 1.993% 191,487 - (629) 190,858 Pay-at-Risk (910) Miscellaneous Customer Service and Informational Expenses 3,514 1.708% 1.993% 3,647 - - 3,647 TOTAL Cust. Service and Informational Expenses 690,777 716,583 - (14,650) 701,933
(7) SALES EXPENSESOperation:(911) Supervision - 1.708% 1.993% - - - - (912) Demonstrating and Selling Expenses - 1.708% 1.993% - - - - (913) Advertising Expenses - 1.708% 1.993% - - - - (916) Miscellaneous Sales Expenses - 1.708% 1.993% - - - - TOTAL Sales Expenses - - - - -
May not cross-check due to rounding.

Case No. U-17273Exhibit A-3 (KAD-3)
Schedule C13Page 6 of 6
Witness: Katherine A. De Cramer, CPA
2012 2014 Forecasted 2014 ForecastedHistorical 2013 2014 Total O&M Total O&M
Total O&M Not Including Cost of Gas Including K&MCPI CPI K&M Adjustments K&M K&M Reason
Michigan Gas Utilities CorporationOperation and Maintenance Expenses - Gas Utility
Historical and Forecasted
(8) ADMINISTRATIVE AND GENERAL EXPENSESOperation:
(920) Administrative and General Salaries 4,082,801 1.708% 1.993% 4,235,297 - 442,069 4,677,366 IBS Vacancy Adjustment/ Reg Affairs/ Pay-at-Risk
(921) Office Supplies and Expenses 957,283 1.708% 1.993% 993,039 - 152,463 1,145,502 Reg Affairs/ Pay-at-Risk/
A&G Loader Adj (922) Administrative Expenses Transferred-Credit - 1.708% 1.993% - - - - (923) Outside Services Employed 705,718 1.708% 1.993% 732,078 - - 732,078 (924) Property Insurance 36,242 1.708% 1.993% 37,597 - - 37,597 (925) Injuries and Damages 451,976 1.708% 1.993% 468,858 - (22,007) 446,851 Injuries & Damages
(926) Employee Pensions and Benefits 4,778,671 1.708% 1.993% 4,957,157 - (471,453) 4,485,704 Pension & Benefits/ Pay-at-
Risk (927) Franchise Requirements - 1.708% 1.993% - - - - (928) Regulatory Commission Expenses 335,955 1.708% 1.993% 348,504 - - 348,504 (929) Duplicate Charges-Cr. - 1.708% 1.993% - - - - (930) Advertising Expenses - 1.708% 1.993% - - - - (930.1) General Advertising Expenses 1,521 1.708% 1.993% 1,578 - - 1,578
(930.2) Miscellaneous General Expenses 1,232,427 1.708% 1.993% 1,278,459 - 119,810 1,398,269 Gas Management Sytem/ ICE2016 IBS Depreciation
(931) Rents 473,695 1.708% 1.993% 491,388 - - 491,388 TOTAL Operation 13,056,289 13,543,955 - 220,882 13,764,837
Maintenance:(935) Maintenance of General Plant - 1.708% 1.993% - - - - TOTAL Maintenance - - - - - TOTAL Administrative and General Expenses 13,056,289 13,543,955 - 220,882 13,764,837
TOTAL Operation and Maintenance Expenses 97,181,795 100,811,634 5,569,683 2,821,448 109,202,764
May not cross-check due to rounding.

Case No.: U-17273Exhibit No.: A-3 (KAD-3)
Schedule: C14Page: 1 of 2
Witness: Katherine A. De Cramer, CPA
Line
1 $ 518,185
2 $ 376,862
3 1.708%
4 1.993%
5 3.74%
6 $ 14,076
7 $ 390,938
8 Known and Measurable Increase (Decrease) in 2014 $ 127,247
Account 735
2014 Manufactured Gas Plant Remediation Amortization
2012 Manufactured Gas Plant Remediation Amortization
Michigan Gas Utilities CorporationCalculation of Manufactured Gas Plant Remediation Amortization
Known and Measurable Adjustment
2013 Inflation
2014 Inflation
Composite Inflation
2012 Manufactured Gas Plant Remediation Amortization Inflated to 2014
Inflation on 2012 Manufactured Gas Plant Remediation

Case No.: U-17273Exhibit No.: A-3 (KAD-3)
Schedule: C14Page: 2 of 2
Witness: Katherine A. De Cramer, CPA
Year Expenditure Incurred 1996 1997 1998 1999 2000 2001 2002 2003 2004 2005 2006 2007 2008 2009 2010 2011 2012 2013
1 Vintage Year Costs 181,561 86,246 245,430 406,419 370,612 50,000 14,466 43,095 38,636 48,170 - 1,099,284 629,238 411,235 394,683 1,089,811 425,792 1,045,000
2 Amortization of Costs - Year 1997 1998 1999 2000 2001 2002 2003 2004 2005 2006 2007 2008 2009 2010 2011 2012 2013 2014
3 January - - - - - - - - - - 10,859 19,301 22,499 22,539 22,740 31,405 34,833 43,182 4 February - - - - - - - - - - 10,859 19,301 22,499 22,539 22,740 31,405 34,833 43,182 5 March - - - - - - - - - - 10,859 19,301 22,499 22,539 22,740 31,405 34,833 43,182 6 April - - - - - - - - - 12,372 10,859 19,301 22,499 22,539 22,740 31,405 34,833 43,182 7 May - - - - - - - - - 12,372 10,859 19,301 22,499 22,539 22,740 31,405 34,833 43,182 8 June - - - - - - - - - 12,372 10,859 19,301 22,499 22,539 22,740 31,405 34,833 43,182 9 July - - - - - - - - - 12,372 10,859 19,301 22,499 22,539 22,740 31,405 34,833 43,182 10 August - - - - - - - - - 12,372 10,859 19,301 22,499 22,539 22,740 31,405 34,833 43,182 11 September - - - - - - - - - 12,372 10,859 19,301 22,499 22,539 22,740 31,405 34,833 43,182 12 October - - - - - - - - - 12,372 10,859 19,301 22,499 22,539 22,740 31,405 34,833 43,182 13 November - - - - - - - - - 12,372 10,859 19,301 22,499 22,539 22,740 31,405 34,833 43,182 14 December - - - - - - - - - 12,372 10,859 19,301 22,499 22,539 22,740 31,405 34,833 43,182
15 Annual Amortization - - - - - - - - - 111,348 130,307 231,611 269,992 270,474 272,881 376,862 417,994 518,185
16 Net Unamortized Balance - - - - - - - - - 26,790,989 27,768,965 26,352,593 25,959,836 25,039,045 23,227,975 23,276,906 22,858,911 22,340,726
17 Total Amortization for the Twelve Months Ending, December 31, 2014 518,185
18 Historical Period Amount - Twelve Months Ended, December 31, 2012 376,862
19 Increase / (Decrease) to Other O&M Expense 141,323
For the Period Ended December 31, 2012Calculation of Manufactured Gas Plant Costs
Michigan Gas Utilities Corporation

Case No.: U-17273Exhibit No.: A-3 (KAD-3)
Schedule: C15Page: 1 of 3
Witness: Katherine A. De Cramer, CPA
Line
1 $ 904,206
2 $ 805,975
3 1.708%
4 1.993%
5 3.74%
6 $ 30,104
7 $ 836,079
8 Known and Measurable Increase (Decrease) in 2014 $ 68,127
Various
2014 Inflation
Composite Inflation
Inflation on 2012 Pay-at-Risk Paid Out
2012 Pay-at-Risk Paid Out Inflated to 2014
2013 Inflation
Michigan Gas Utilities CorporationCalculation of Pay-at-Risk at TargetKnown and Measurable Adjustment
2014 Pay-at-Risk at Target
2012 Pay-at-Risk Paid Out

Case No.: U-17273Exhibit No.: A-3 (KAD-3)
Schedule: C15Page: 2 of 3
Witness: Katherine A. De Cramer, CPA
556-Annual Pay-at-Risk
Plan
575-Annual Pay-at-Risk Plan Affiliate Charges In
712 - Annual Pay-at-Risk
Plan True Up
IBS Amounts Allocated to
MGUC
RTs 670 & 671 -Non Union
Wage & Hourly and Exempt
RTs 672 & 673 - Non
Union Wage & Hourly and
Exempt
726 - Annual Pay-at-Risk
Plan True Up
IBS Amounts Allocated to
MGUC 2012 Actuals 2013 CPI 2014 CPI 2012 InflatedAccount
804111 -$ -$ -$ -$ -$ -$ -$ 54,195$ 54,195.19$ 1.708% 1.993% 56,219.40$ 804130 -$ -$ -$ -$ -$ -$ -$ 1,585$ 1,584.98$ 1.708% 1.993% 1,644.18$ 813000 -$ -$ -$ -$ -$ -$ -$ 13,440$ 13,440.30$ 1.708% 1.993% 13,942.30$ 814000 -$ -$ -$ -$ -$ 9,549$ -$ 717$ 10,265.94$ 1.708% 1.993% 10,649.38$ 815000 -$ -$ -$ -$ -$ 3$ -$ -$ 2.67$ 1.708% 1.993% 2.77$ 816000 -$ -$ -$ -$ -$ 1,265$ -$ -$ 1,264.75$ 1.708% 1.993% 1,311.99$ 817000 -$ -$ -$ -$ -$ 628$ -$ -$ 628.48$ 1.708% 1.993% 651.95$ 818000 -$ -$ -$ -$ -$ 576$ -$ -$ 575.83$ 1.708% 1.993% 597.34$ 820000 -$ -$ -$ -$ -$ 19$ -$ -$ 18.83$ 1.708% 1.993% 19.53$ 821000 -$ -$ -$ -$ -$ 266$ -$ -$ 266.42$ 1.708% 1.993% 276.37$ 824000 -$ -$ -$ -$ -$ 2,962$ -$ 7$ 2,968.49$ 1.708% 1.993% 3,079.36$ 830000 -$ -$ -$ -$ -$ 713$ -$ -$ 712.97$ 1.708% 1.993% 739.60$ 832000 -$ -$ -$ -$ -$ 139$ -$ -$ 138.91$ 1.708% 1.993% 144.10$ 833000 -$ -$ -$ -$ -$ 742$ -$ -$ 741.62$ 1.708% 1.993% 769.32$ 834000 -$ -$ -$ -$ -$ 428$ -$ -$ 427.54$ 1.708% 1.993% 443.51$ 835000 -$ -$ -$ -$ -$ 253$ -$ -$ 252.86$ 1.708% 1.993% 262.30$ 836000 -$ -$ -$ -$ -$ 112$ -$ -$ 111.56$ 1.708% 1.993% 115.73$ 837000 -$ -$ -$ -$ -$ 306$ -$ -$ 306.21$ 1.708% 1.993% 317.65$ 856000 -$ -$ -$ -$ -$ 287$ -$ -$ 287.29$ 1.708% 1.993% 298.02$ 857000 -$ -$ -$ -$ -$ 8$ -$ -$ 7.86$ 1.708% 1.993% 8.15$ 863000 -$ -$ -$ -$ -$ 433$ -$ -$ 433.04$ 1.708% 1.993% 449.21$ 865000 -$ -$ -$ -$ -$ 570$ -$ -$ 569.69$ 1.708% 1.993% 590.97$ 870000 -$ -$ -$ -$ -$ 110,199$ -$ 30,802$ 141,000.87$ 1.708% 1.993% 146,267.31$ 871000 -$ -$ -$ -$ -$ 2,392$ -$ 10,230$ 12,621.65$ 1.708% 1.993% 13,093.07$ 874000 -$ -$ -$ -$ -$ 3,600$ -$ -$ 3,600.00$ 1.708% 1.993% 3,734.46$ 877000 -$ -$ -$ -$ -$ 4,516$ -$ -$ 4,516.26$ 1.708% 1.993% 4,684.94$ 878000 -$ -$ -$ -$ -$ 533$ -$ -$ 533.13$ 1.708% 1.993% 553.04$ 879000 -$ -$ -$ -$ -$ 222$ -$ -$ 222.12$ 1.708% 1.993% 230.42$ 880000 -$ -$ -$ -$ -$ 22,764$ -$ 6,940$ 29,704.16$ 1.708% 1.993% 30,813.62$ 885000 -$ -$ -$ -$ -$ 199$ -$ -$ 198.82$ 1.708% 1.993% 206.25$ 887000 -$ -$ -$ -$ -$ 5,885$ -$ -$ 5,884.73$ 1.708% 1.993% 6,104.53$ 889000 -$ -$ -$ -$ -$ 184$ -$ -$ 184.28$ 1.708% 1.993% 191.16$ 891000 -$ -$ -$ -$ -$ 691$ -$ -$ 691.11$ 1.708% 1.993% 716.92$ 892000 -$ -$ -$ -$ -$ 107$ -$ -$ 107.43$ 1.708% 1.993% 111.44$ 893000 -$ -$ -$ -$ -$ 128$ -$ -$ 128.11$ 1.708% 1.993% 132.89$ 894000 -$ -$ -$ -$ -$ 72$ -$ -$ 72.48$ 1.708% 1.993% 75.19$ 901000 -$ -$ -$ -$ -$ -$ -$ 49,009$ 49,008.88$ 1.708% 1.993% 50,839.38$ 902000 -$ -$ -$ -$ -$ 2,394$ -$ 8,990$ 11,383.75$ 1.708% 1.993% 11,808.94$ 903000 -$ -$ -$ -$ -$ 33,728$ -$ 29$ 33,756.78$ 1.708% 1.993% 35,017.61$ 905000 -$ -$ -$ -$ -$ 4$ -$ 856$ 859.29$ 1.708% 1.993% 891.38$ 907000 -$ -$ -$ -$ -$ -$ -$ 66$ 65.96$ 1.708% 1.993% 68.42$ 908000 -$ -$ -$ -$ -$ 52,431$ -$ 46$ 52,476.97$ 1.708% 1.993% 54,437.01$ 909000 -$ -$ -$ -$ -$ -$ -$ 2,832$ 2,832.12$ 1.708% 1.993% 2,937.90$ 920000 -$ 9,907$ -$ 27,042$ -$ 121,121$ -$ 276,909$ 434,979.60$ 1.708% 1.993% 451,226.26$ 921000 -$ -$ -$ -$ -$ -$ -$ 2$ 1.59$ 1.708% 1.993% 1.65$ 926190 -$ -$ -$ -$ 403,175$ (471,515)$ -$ 284$ (68,056.24)$ 1.708% 1.993% (70,598.17)$
Total -$ 9,907$ -$ 27,042$ 403,175$ (91,087)$ -$ 456,938$ 805,975.28$ 836,078.78$
Accrual entries for the non-executive annual incentive plan are recorded monthly using Resource Types 670 and 671. The expense is posted using a highlevel Responsibility Center. Resource Types 672 and 673 are then used to push this gross expense out to the various accounts, following the labor loaders.Sometimes the expense going into account 926190 is not loaded out on a 1 for 1 basis, particularly when the books get opened and re-opened in mid Januaryand there's not enough time to run the loaders. The residual remains in the account and no true up is done.
Michigan Gas Utilities Corporation2012 Annual Pay-at-Risk Plan Information
Executive and Non Executive Plans Paid Out
Executives' Annual Pay-at-Risk Plan Non Executives' Annual Pay-at-Risk Plan

Case No.: U-17273Exhibit No.: A-3 (KAD-3)
Schedule: C15Page: 3 of 3
Witness: Katherine A. De Cramer, CPA
2012 Wage & Hour 2014 Inflated Non-Union 2014 Inflated 2012 2014 Inflated Exempt 2014 Inflated 2014 Inflated Non-Union Non-Union K&M Labor Total Base Pay-at-Risk Non-Union Exempt Exempt K&M Labor Total Base Pay-at-Risk Exempt Executive Total
Account Base Labor Base Labor Adjustments Labor Target % Pay-at-Risk Base Labor Base Labor Adjustments Labor Target % Pay-at-Risk Pay-at-Risk Pay-at-Risk-$ -$ -$ 5.00% -$ -$ -$ -$ 11.92% -$ -$
804111 98,890$ 102,584$ 102,584$ 5.00% 5,129$ 284,612$ 295,242$ 295,242$ 11.92% 35,193$ 40,322$ 804130 -$ -$ -$ 5.00% -$ -$ -$ -$ 11.92% -$ -$ 813000 -$ -$ -$ 5.00% -$ -$ -$ -$ 11.92% -$ -$ 814000 13$ 14$ 14$ 5.00% 1$ 63,489$ 65,860$ 65,860$ 11.92% 7,851$ 7,851$ 815000 67$ 70$ 70$ 5.00% 3$ -$ -$ -$ 11.92% -$ 3$ 816000 18,267$ 18,950$ 18,950$ 5.00% 947$ -$ -$ -$ 11.92% -$ 947$ 817000 9,886$ 10,255$ 10,255$ 5.00% 513$ -$ -$ -$ 11.92% -$ 513$ 818000 8,984$ 9,319$ 9,319$ 5.00% 466$ -$ -$ -$ 11.92% -$ 466$ 820000 348$ 361$ 361$ 5.00% 18$ -$ -$ -$ 11.92% -$ 18$ 821000 3,254$ 3,376$ 3,376$ 5.00% 169$ -$ -$ -$ 11.92% -$ 169$ 824000 15,401$ 15,976$ 15,976$ 5.00% 799$ 11,839$ 12,281$ 12,281$ 11.92% 1,464$ 2,263$ 830000 -$ -$ -$ 5.00% -$ 5,190$ 5,384$ 5,384$ 11.92% 642$ 642$ 832000 1,303$ 1,351$ 1,351$ 5.00% 68$ 276$ 286$ 286$ 11.92% 34$ 102$ 833000 11,651$ 12,086$ 12,086$ 5.00% 604$ -$ -$ -$ 11.92% -$ 604$ 834000 6,245$ 6,478$ 6,478$ 5.00% 324$ -$ -$ -$ 11.92% -$ 324$ 835000 3,416$ 3,543$ 3,543$ 5.00% 177$ -$ -$ -$ 11.92% -$ 177$ 836000 1,335$ 1,385$ 1,385$ 5.00% 69$ -$ -$ -$ 11.92% -$ 69$ 837000 4,989$ 5,175$ 5,175$ 5.00% 259$ -$ -$ -$ 11.92% -$ 259$ 850000 -$ -$ -$ 5.00% -$ -$ -$ -$ 11.92% -$ -$ 856000 4,288$ 4,448$ 4,448$ 5.00% 222$ -$ -$ -$ 11.92% -$ 222$ 857000 79$ 81$ 81$ 5.00% 4$ -$ -$ -$ 11.92% -$ 4$ 859000 -$ -$ -$ 5.00% -$ -$ -$ -$ 11.92% -$ -$ 863000 7,671$ 7,957$ 7,957$ 5.00% 398$ 225$ 233$ 233$ 11.92% 28$ 426$ 865000 1,138$ 1,180$ 1,180$ 5.00% 59$ 3,759$ 3,899$ 3,899$ 11.92% 465$ 524$ 867000 -$ -$ -$ 5.00% -$ -$ -$ -$ 11.92% -$ -$ 870000 5,325$ 5,524$ 5,524$ 5.00% 276$ 728,378$ 755,583$ 755,583$ 11.92% 90,065$ 90,342$ 871000 139,708$ 144,926$ 144,926$ 5.00% 7,246$ 34,728$ 36,025$ 36,025$ 11.92% 4,294$ 11,540$ 874000 4,118$ 4,272$ 4,272$ 5.00% 214$ 31,346$ 32,516$ 32,516$ 11.92% 3,876$ 4,090$ 875000 -$ -$ -$ 5.00% -$ -$ -$ -$ 11.92% -$ -$ 877000 34,729$ 36,026$ 36,026$ 5.00% 1,801$ 8,607$ 8,929$ 8,929$ 11.92% 1,064$ 2,866$ 878000 839$ 871$ 871$ 5.00% 44$ 2,481$ 2,574$ 2,574$ 11.92% 307$ 350$ 879000 2,829$ 2,934$ 2,934$ 5.00% 147$ -$ -$ -$ 11.92% -$ 147$ 880000 242,612$ 251,674$ 251,674$ 5.00% 12,584$ 56,540$ 58,652$ 58,652$ 11.92% 6,991$ 19,575$ 881000 -$ -$ -$ 5.00% -$ -$ -$ -$ 11.92% -$ -$ 885000 -$ -$ 101,750$ 101,750$ 5.00% 5,088$ 1,557$ 1,615$ 305,250$ 306,865$ 11.92% 36,578$ 41,666$ 887000 87,132$ 90,387$ 90,387$ 5.00% 4,519$ 1,984$ 2,058$ 2,058$ 11.92% 245$ 4,765$ 889000 2,428$ 2,519$ 2,519$ 5.00% 126$ -$ -$ -$ 11.92% -$ 126$ 891000 6,887$ 7,144$ 7,144$ 5.00% 357$ -$ -$ -$ 11.92% -$ 357$ 892000 1,190$ 1,234$ 1,234$ 5.00% 62$ 465$ 483$ 483$ 11.92% 58$ 119$ 893000 59$ 62$ 62$ 5.00% 3$ 712$ 738$ 738$ 11.92% 88$ 91$ 894000 -$ -$ -$ 5.00% -$ 426$ 442$ 442$ 11.92% 53$ 53$ 901000 -$ -$ -$ 5.00% -$ -$ -$ -$ 11.92% -$ -$ 902000 16,131$ 16,733$ 16,733$ 5.00% 837$ 7,453$ 7,732$ 7,732$ 11.92% 922$ 1,758$ 903000 226,000$ 234,441$ 234,441$ 5.00% 11,722$ 117,023$ 121,394$ 121,394$ 11.92% 14,470$ 26,192$ 905000 52$ 54$ 54$ 5.00% 3$ 1,511$ 1,568$ 1,568$ 11.92% 187$ 190$ 907000 -$ -$ -$ 5.00% -$ -$ -$ -$ 11.92% -$ -$ 908000 91,515$ 94,933$ 94,933$ 5.00% 4,747$ 289,017$ 299,812$ 299,812$ 11.92% 35,738$ 40,484$ 909000 -$ -$ -$ 5.00% -$ 18,671$ 19,368$ 19,368$ 11.92% 2,309$ 2,309$ 912000 -$ -$ -$ 5.00% -$ -$ -$ -$ 11.92% -$ -$ 920000 659,521$ 684,154$ 684,154$ 5.00% 34,208$ 3,114,972$ 3,231,318$ 292,014$ 3,523,332$ 11.92% 419,981$ 147,093$ 601,281$ 920020 -$ -$ -$ 5.00% -$ -$ -$ -$ 11.92% -$ -$ 921000 -$ -$ -$ 5.00% -$ -$ -$ -$ 11.92% -$ -$ 925000 -$ -$ -$ 5.00% -$ -$ -$ -$ 11.92% -$ -$ 926190 -$ -$ -$ 5.00% -$ -$ -$ -$ 11.92% -$ -$ 926191 -$ -$ -$ 5.00% -$ -$ -$ -$ 11.92% -$ -$ 930100 -$ -$ -$ 5.00% -$ -$ -$ -$ 11.92% -$ -$ 931000 -$ -$ -$ 5.00% -$ -$ -$ -$ 11.92% -$ -$ 935000 -$ -$ -$ 5.00% -$ -$ -$ -$ 11.92% -$ -$ Total 1,718,300$ 1,782,480$ 101,750$ 1,884,230$ 94,211$ 4,785,260$ 4,963,991$ 597,264$ 5,561,255$ 662,902$ 147,093$ 904,206$
Michigan Gas Utilities Corporation2014 Annual Pay-at-Risk Plan Information
Executive and Non Executive Plans at Target

Case No.: U-17273Exhibit No.: A-3 (KAD-3)
Schedule: C22Page: 1 of 2
Witness: Katherine A. De Cramer, CPA
Line
1 $ 7,288,278
2 2012 Customer Relations and ICE 2016 O&M Costs $ 6,666,497
3 1.708%
4 1.993%
5 3.74%
6 Inflation on 2012 A&G Costs $ 248,996
7 2012 Customer Relations and ICE2016 O&M Costs Inflated to 2014 $ 6,915,493
8 Known and Measurable Increase (Decrease) in 2014 $ 372,785
Account 903
2013 Inflation
2014 Inflation
Composite Inflation
Michigan Gas Utilities CorporationCalculation of Customer Relations and ICE2016 O&M Costs
Known and Measurable Adjustment
2014 Customer Relations and ICE2016 O&M Costs

Case No.: U-17273Exhibit No.: A-3 (KAD-3)
Schedule: C22Page: 2 of 2
Witness: Katherine A. De Cramer, CPA
Historical Total O&M Total O&MTotal O&M 2013 2014 Not Including Including
Ln Description 2012 CPI CPI K&M K&M K&M
1 Customer Relations Loaded Labor 577,313 1.708% 1.993% 598,877 (209,719) 389,158 2 Customer Relations Non-Labor 4,905,754 1.708% 1.993% 5,088,987 356,152 5,445,139 3 ICE 2016 O&M 79,074 1.708% 1.993% 82,028 225,391 307,419 4 Balance in accounts 901 903 905 907 908 1,104,356 1.708% 1.993% 1,145,605 961 1,146,566 56 Total 6,666,497 6,915,497 372,785 7,288,282
Michigan Gas Utilities Corporation
Related to Customer Relations and ICE 2016 O&M CostsCalculation of K&M Adjustment affecting Accounts 901 903 905 907 908

Case No.: U-17273Exhibit No.: A-3 (KAD-3)
Schedule: C23Page: 1 of 1
Witness: Katherine A. De Cramer, CPA
Line
1 $ 1,917,930
2 $ 1,440,571
3 1.726%
4 2.060%
5 3.82%
6 $ 55,052
7 $ 1,495,623
8 $ 422,307
Account 904
2013 Inflation
2014 Inflation
Composite Inflation
Inflation on 2012 Uncollectible Accounts
2012 Uncollectible Accounts Inflated to 2014
Known and Measurable Increase (Decrease) in 2014
2012 Uncollectible Accounts
Michigan Gas Utilities CorporationCalculation of Uncollectible AccountsKnown and Measurable Adjustment
2014 Uncollectible Accounts

Case No.: U-17273Exhibit No.: A-3 (KAD-3)
Schedule: C24Page: 1 of 1
Witness: Katherine A. De Cramer, CPA
Total Net UncollectiblesNet Gas Service as a Percent of
Line Year Write-Offs Collections Uncollectibles Revenues Revenue[P-522, Page 300]
1 2010 $2,572,225 $0 $2,572,225 $163,823,005 1.5701%2 2011 $1,707,618 $0 $1,707,618 $142,515,824 1.1982%3 2012 $1,427,896 $0 $1,427,896 (1) $93,123,234 1.5333%4 Average 1.4339%
567 Allowance for Uncollectible Expense for 201489 2014 Forecasted Revenue without rate increase $133,757,46210 3-Year Average Net Uncollectibles as a Percent of Revenue 1.43389%11 Net Uncollectibles Allowance for 2014 $1,917,93012
(1) Matches U-17222 UETM application
[P-522, Page 228A]
Michigan Gas Utilities CorporationAllowance for Uncollectibles Expense for 2014

Case No.: U-17273Exhibit No.: A-3 (KAD-3)
Schedule: C25Page: 1 of 2
Witness: Katherine A. De Cramer, CPA
Line
1 $ 213,581
2 $ -
3 1.708%
4 1.993%
5 3.74%
6 $ -
7 2012 Costs Inflated to 2014 $ -
8 $ 213,581
Account 920
2012 Costs
Inflation on 2012 Costs
Known and Measurable Increase (Decrease) in 2014
2013 Inflation
2014 Inflation
Composite Inflation
2014 Costs
Michigan Gas Utilities CorporationCalculation of IBS Vacancies
Known and Measurable Adjustment

Case No.: U-17273Exhibit No.: A-3 (KAD-3)
Schedule: C25Page: 2 of 2
Witness: Katherine A. De Cramer, CPA
Line
1 $100,085,836
2 2012 Average FTE's 1,260
3 Line 8 / Line 9 $79,433
4 1,332
5 Line 11 - Line 9 72
6 Line 10 x Line 12 $5,719,191
7 3.6%
8 Line 13 x Line 14 $205,891
9 Line 15 inflated by Lines 3 & 4 $213,581Line 14 inflated
Budgeted Average FTE's
2012 Vacancies
2012 Vacancy O&M
2012 Percentage Allocated to MGUC
2012 Vacancy O&M Allocated to MGUC
2012 Base and Overtime IBS Internal O&M
Average Base and Overtime O&M per FTE
Michigan Gas Utilities Corporation
IBS Vacancies Calculation

Case No.: U-17273Exhibit No.: A-3 (KAD-3)
Schedule: C26Page: 1 of 1
Witness: Katherine A. De Cramer, CPA
Line
1 $ 141,362
2 $ 60,663
3 1.708%
4 1.993%
5 3.74%
6 $ 2,266
7 2012 Costs Inflated to 2014 $ 62,928
8 $ 78,433
Account 920
2012 Costs
Inflation on 2012 Costs
Known and Measurable Increase (Decrease) in 2014
2013 Inflation
2014 Inflation
Composite Inflation
2014 Costs
Michigan Gas Utilities CorporationCalculation of IBS Regulatory Affairs Increase -- Labor
Known and Measurable Adjustment

Case No.: U-17273Exhibit No.: A-3 (KAD-3)
Schedule: C27Page: 1 of 1
Witness: Katherine A. De Cramer, CPA
Line
1 $ 146,069
2 $ -
3 1.708%
4 1.993%
5 3.74%
6 $ -
7 2012 Costs Inflated to 2014 $ -
8 $ 146,069
9 Account 921
Year Actual10 2012 $189,977 11 2011 $149,121 12 2010 $126,047 13 2009 $121,191 14 2008 $144,011 15 Average $146,069
2014 Costs
Michigan Gas Utilities CorporationCalculation of A&G Loader Adjustment
Known and Measurable Adjustment
2012 Costs
Inflation on 2012 Costs
Known and Measurable Increase (Decrease) in 2014
2013 Inflation
2014 Inflation
Composite Inflation

Case No.: U-17273Exhibit No.: A-3 (KAD-3)
Schedule: C28Page: 1 of 1
Witness: Katherine A. De Cramer, CPA
Line
1 $ 8,056
2 $ 1,601
3 1.708%
4 1.993%
5 3.74%
6 $ 60
7 2012 Costs Inflated to 2014 $ 1,661
8 $ 6,395
Account 920
2014 Costs
Michigan Gas Utilities CorporationCalculation of IBS Regulatory Affairs -- Non-Labor
Known and Measurable Adjustment
2012 Costs
Inflation on 2012 Costs
Known and Measurable Increase (Decrease) in 2014
2013 Inflation
2014 Inflation
Composite Inflation

Case No.: U-17273Exhibit No.: A-3 (KAD-3)
Schedule: C29Page: 1 of 1
Witness: Katherine A. De Cramer, CPA
Line
1 $ 446,851
2 $ 451,976
3 1.708%
4 1.993%
5 3.74%
6 $ 16,881
7 2012 Costs Inflated to 2014 $ 468,858
8 $ (22,007)
Account 925
Year Actual9 2010 $444,81610 2011 $443,76011 2012 $451,976
12 Average $446,851
Michigan Gas Utilities CorporationCalculation of Injuries and DamagesKnown and Measurable Adjustment
2014 Injuries & Damages
2012 Injuries & Damages
Inflation on 2012 Costs
Known and Measurable Increase (Decrease) in 2014
2013 Inflation
2014 Inflation
Composite Inflation

Case No.: U-17273Exhibit No.: A-3 (KAD-3)
Schedule: C30Page: 1 of 2
Witness: Katherine A. De Cramer, CPA
Line
1 $ 1,563,610
2 $ 1,594,610
3 1.708%
4 1.993%
5 3.74%
6 $ 59,559
7 2012 Pension and Benefit Costs Inflated to 2014 $ 1,654,169
8 Known and Measurable Increase (Decrease) in 2014 $ (90,559)
Account 926
Michigan Gas Utilities CorporationBenefits Expense (Amortizations only)
Known and Measurable Adjustment
2014 Pension and Benefit Costs
2012 Pension and Benefit Costs
2013 Inflation
2014 Inflation
Composite Inflation
Inflation on 2012 Pension and Benefit Costs
Case No.: U-17273Exhibit No.: A-3 (KAD-3)
Schedule: C30Page: 2 of 2
Witness: Katherine A. De Cramer, CPA
Line
1 $ 2,851,496
2 $ 3,184,062
3 1.708%
4 1.993%
5 3.74%
6 $ 118,926
7 2012 Pension and Benefits Costs Inflated to 2014 $ 3,302,988
8 Known and Measurable Increase (Decrease) in 2014 $ (451,492)
Account 926
2013 Inflation
2014 Inflation
Composite Inflation
Inflation on 2012 Pension and Benefit Costs
Michigan Gas Utilities CorporationBenefits Expense (Less Amortizations)
Known and Measurable Adjustment
2014 Pension and Benefit Costs
2012 Pension and Benefit Costs

Case No.: U-17273Exhibit No.: A-3 (KAD-3)
Schedule: C31Page: 1 of 1
Witness: Katherine A. De Cramer, CPA
Line
1 $ 119,810
2 $ -
3 1.708%
4 1.993%
5 3.74%
6 $ -
7 2012 Costs Inflated to 2014 $ -
8 $ 119,810
Account 930.2
2012 Costs
Inflation on 2012 Costs
Known and Measurable Increase (Decrease) in 2014
2013 Inflation
2014 Inflation
Composite Inflation
2014 Costs
Michigan Gas Utilities CorporationCalculation of IBS Depreciation Gas Management System & ICE Hardware
Known and Measurable Adjustment

Case No.: U-17273Exhibit No.: A-7 (KAD-4)
Page: 1 of 1Witness: Katherine A. De Cramer, CPA
Line Source Date 2013 2014
1 Value Line February 22, 2013 1.300% 1.900%2 Global Insight February, 2013 1.400% 1.700%3 Moore Inflation Predictor December 15, 2012 1.700% N/A4 EIA February, 2013 2.340% 2.380%5 International Monetary Fund October, 2012 1.800% N/A
6 MGUC Estimate (Simple Average) 1.708% 1.993%
Estimate of Inflation for 2013 and 2014Michigan Gas Utilities Corporation

Case No.: U-17273Exhibit No.: A-8 (KAD-5)
Page: 1 of 1Witness: Katherine A. De Cramer, CPA
Allocation Line Rate Schedule Factor (1)
1 Residential 54.6885%
2 Residential Multi-Family -- Class I 0.0807%
3 Residential Multi-Family -- Class II 0.3972%
4 Residential Multi-Family -- Class III 0.0818%
5 Residential Multi-Family -- Class IV 0.2173%
6 General Service Small 10.7453%
7 General Service Large 0.6192%
8 TR-1 3.8806%
9 TR-2 4.2115%
10 TR-3 2.7115%
11 Customer Choice - Residential 11.9579%
12 Customer Choice - Small General Service 7.1386%
13 Aggregated Transport - Residential 0.0230%
14 Aggregated Transport - Small General Service 2.9793%
15 Aggregated Transport - Large General Service 0.0683%
16 TOTAL MGUC 99.8007%
Note (1): Allocation factors do not sum to 100% because Special Contracts are not subject to the UETM.
Michigan Gas Utilities CorporationUETM Allocation Factors

Case No.: U-17273 Exhibit No.: A-9 (KAD-6)
Page: 1 of 2 Witness: Katherine A. De Cramer
Integrys Energy Group, Inc. Awards & Recognition: 2006-2012 2006
Integrys Energy Group: Forbes, utility industry’s “Best Managed Energy Company in America”
Integrys Energy Group: Fortune magazine, Most Admired Energy Company among “America’s Most Admired Companies”
Integrys Energy Services: MastioGale, 2nd in customer value among regional energy marketers
Upper Peninsula Power Company: National Arbor Day Foundation, Tree Line USA Utility Wisconsin Public Service: National Arbor Day Foundation, Tree Line USA Utility Wisconsin Public Service: JD Power & Associates, an “All Time Best Residential Electric
Performer”
2007 Integrys Energy Group: Fortune magazine, 2nd among Most Admired Energy Companies
in “America’s Most Admired Companies” Integrys Energy Group: Platts, finalist for Platts 250 Global Energy Companies of the Year Integrys Energy Group: Forbes 400 Best Big Companies Integrys Energy Services: KEMA, Inc., ranked 3rd for megawatt-hours under contract
among U.S. power retailers Upper Peninsula Power Company: National Arbor Day Foundation, Tree Line USA Utility Wisconsin Public Service: National Arbor Day Foundation, Tree Line USA Utility Wisconsin Public Service: E-source, wisconsinpublicservice.com ranked 3rd out of more
than 100 utility Web sites 2008
Integrys Energy Group: Platts, a Top 250 Global Energy Company Upper Peninsula Power Company: National Arbor Day Foundation, Tree Line USA Utility Wisconsin Public Service: National Arbor Day Foundation, Tree Line USA Utility Wisconsin Public Service: POWER magazine, 2008 Plant of the Year Wisconsin Public Service: Power Engineering magazine, Best Coal-Fired Project for 2008 Wisconsin Public Service: WasteCap Wisconsin, 2008 Big Diverter Award Wisconsin Public Service: Platts, finalist for Platts ENR Energy Construction Project of
the Year 2009
Integrys Energy Group: Fortune magazine, Most Admired Energy Company among “The World’s Most Admired Companies”; 8th most admired in Use of Corporate Assets; 9th most admired in Innovation; and 10th most admired in Long-Term Investment
Integrys Energy Group: Newsweek, 5th in Green Rankings of Fortune 500 Utilities. Integrys Energy Group: Platts, Top 250 Global Energy Company Integrys Energy Group: HR Executive magazine’s Most Admired Energy Company in HR Upper Peninsula Power Company: National Arbor Day Foundation, Tree Line USA Utility

Case No.: U-17273 Exhibit No.: A-9 (KAD-6)
Page: 2 of 2 Witness: Katherine A. De Cramer
Wisconsin Public Service/Upper Peninsula Power Company: ESource, IVR ranked 7th of
95 nationally, and 1st of 25 in the Midwest region. Wisconsin Public Service: National Arbor Day Foundation, Tree Line USA Utility Wisconsin Public Service: ESource, website ranked 4th of 100 nationally, and 1st of 25 in
the Midwest region.
2010
Integrys Energy Group: Fortune magazine, 4th Most Admired Energy Company among “The World’s Most Admired Companies”; 3rd most admired in Social Responsibility; 4th most admired in Use of Corporate Assets; and 4th most admired in Long-Term Investment
Integrys Energy Group: Governance Metrics International overall global rating of 10. Integrys Energy Group: Forbes 20 Most Responsible Companies Integrys Energy Group: 12th in Newsweek magazine’s Green Rankings for Utilities Integrys Energy Group: Worksite Wellness Award from Wisconsin Gov. Jim Doyle Upper Peninsula Power Company: Safety Leadership award, for support of the Upper
Peninsula Safety Conference Upper Peninsula Power Company: National Arbor Day Foundation, Tree Line USA Utility Wisconsin Public Service: National Arbor Day Foundation, Tree Line USA Utility Wisconsin Public Service: Central Wisconsin Society for Human Resource Management
local and state Workplace Diversity Award Wisconsin Public Service: Sheboygan Young Professionals’ Advocate of the Year Award Wisconsin Public Service: Wausau Chamber of Commerce Athena Award for a Divers
Workplace Wisconsin Public Service: ESource IVR & Web benchmarking results
2011
Integrys Energy Group: Governance Metrics International overall global rating of 10 Upper Peninsula Power Company: SESC Project of the Year Award from the Michigan
Conservation Districts for McClure Wisconsin Public Service: Finalist for the Ethics in Business Award presented by the
American Foundation of Counseling Services. 2012
Wisconsin Public Service: The SolarWise for Schools program was honored with the national Center for Resources Solutions’ (CRS) 2012 Best Green Power Education Outreach Program Award.
Wisconsin Public Service: “Best Facility Award” from International Society of Automation (ISA) Power Industry Division for Weston Unit 4
Wisconsin Public Service: Finalist for the Ethics in Business Award presented by the American Foundation of Counseling Services.

Michigan Public Service Commission Case No.: U-17273Michigan Gas Utilities Corporation Exhibit No.: A-11 (KAD-7)Revenue Deficiency (Sufficiency) Schedule: A1For the 12 Month Period Ended, December 31, 2012 Page: 1 of 1
Witness: Katherine A. De Cramer, CPA
(a) (b) (c)
LineNo. Description Source Total12 Rate Base Exh. A-2, Sch. B1 194,076,269$ 34 Operating Income Exh. A-3, Sch. C1 9,943,80456 Overall Rate of Return Line 4 ÷ Line 2 5.1237%78 Rate of Return Exh. A-4, Sch. D1 7.1076%910 Income Requirements Line 2 x Line 8 13,794,1491112 Income Deficiency (Sufficiency) Line 10 - Line 4 3,850,3451314 Revenue Conversion Factor Exh. A-3, Sch. C2 1.63671516 Revenue Deficiency (Sufficiency) Line 12 x Line 14 6,301,860$
Schedule A1

Michigan Public Service Commission Case No.: U-17273Michigan Gas Utilities Corporation Exhibit No.: A-12 (KAD-8)Rate Base Schedule: B1For the 12 Month Period Ended, December 31, 2012 Page: 1 of 1
Witness: Katherine A. De Cramer, CPA
(b) (c)
LineNo. Source Rate Base12 Plant in Service Exh A-2, Sch B2 310,262,590$ 3 Plant Held for Future Use Exh A-2, Sch B2 04 Construction Work in Progress Exh A-2, Sch B2 4,139,1505 Total Utility Plant 314,401,740$ 67 Less: Depreciation Reserve Exh A-2, Sch B3 171,640,37089 Net Utility Plant 142,761,370$ 1011 Net Capital Lease Property 01213 Total Utility Property and Plant 142,761,370$ 1415 Less: Capital Lease Obligations 01617 Net Plant 142,761,370$ 1819 Allowance for Working Capital Exh A-2, Sch B4 51,314,8992021 Total Rate Base 194,076,269$
(a)
Description
Schedule B1

Michigan Public Service Commission Case No.: U-17273Michigan Gas Utilities Corporation Exhibit No.: A-12 (KAD-8)Utility Plant Schedule: B2For the 12 Month Period Ended, December 31, 2012 Page: 1 of 1
Witness: Katherine A. De Cramer, CPA
(a) (b) (c)
MPSCLine AccountNo. Description No. Utility Plant12 Plant in service 101 300,416,451$ 3 Plant purchased or sold 102 - 4 Plant leased to others 104 - 5 Completed construction not classified 106 6,244,378 6 Gas Stored Base Gas 117 3,601,761 7 Plant in Service 310,262,590$ 89 Plant held for future use 1051011 Construction work in progress 107 4,139,150 1213 Total Utility Plant 314,401,740$
Schedule B2

Michigan Public Service Commission Case No.: U-17273Michigan Gas Utilities Corporation Exhibit No.: A-12 (KAD-8)Accumulated Provision for Depreciation Schedule: B3For the 12 Month Period Ended, December 31, 2012 Page: 1 of 1
Witness: Katherine A. De Cramer, CPA
(a) (b)
Line Accum. Prov.No. Description Source for Depr.12 Workpapers 2012 Page 10 171,640,370$
Schedule B3
Total Accumulated Provision for Depreciation

Michigan Public Service Commission Case No.: U-17273Michigan Gas Utilities Corporation Exhibit No.: A-12 (KAD-8)Working Capital Schedule: B4For the 12 Month Period Ended, December 31, 2012 Page: 1 of 1
Witness: Katherine A. De Cramer, CPA
(a) (b)
Line WorkingNo. Description Source Capital12 Assets3 Utility Plant-ARO Workpapers 2012 Page 77 1,381,582$ 4 Accumulated Depreciation-ARO Workpapers 2012 Page 77 (271,047) 5 Cash/Bank Balance Workpapers 2012 Page 16 664,732 6 Temporary Cash Workpapers 2012 Page 82 3,937,471 7 Notes Receivable Workpapers 2012 Page 82 (662) 8 Customer A/R Workpapers 2012 Page 85 12,828,862 9 Other A/R Workpapers 2012 Page 85 471,928 10 Accumulated Provision Uncollectible Accounts Workpapers 2012 Page 85 (1,601,710) 11 Accounts Receivable from Associated Companies Workpapers 2012 Page 85 33,621 12 Taxes Receivable Other Companies Workpapers 2012 Page 85 - 13 Prepayments Workpapers 2012 Page 15 471,257 14 Accrued Utility Revenues Workpapers 2012 Page 85 6,697,946 15 Fuel Stock/Gas Storage Workpapers 2012 Page 11 16,547,698 16 Other Materials & Supplies Workpapers 2012 Page 11 488,152 17 Miscellaneous and Accrued Workpapers 2012 Page 85 2,225,382 18 Derivative Assets Workpapers 2012 Page 85 515,834 19 Int & Div Receivable Workpapers 2012 Page 85 16 20 Other Deferred Debits not in Ratebase Workpapers 2012 Page 89 67,826,186 2122 Total Assets 112,217,248$ 2324 Liabilities25 Accum Prov for Injuries & Damages Workpapers 2012 Page 96 13,496$ 26 Def Cr-Sup Ret Sel SERP Workpapers 2012 Page 95 17,027,797 27 Asset Retirement Obligation Workpapers 2012 Page 103 1,648,019 28 Accounts Payable Workpapers 2012 Page 104 14,611,043 29 Accounts Payable Other Workpapers 2012 Page 106 2,872,384 30 Accrued Taxes Workpapers 2012 Page 17 1,780,223 31 Accrued Interest Workpapers 2012 Page 108 14,006 32 Tax Collections Payable Workpapers 2012 Page 110 (143,735) 33 Miscellaneous Current/Accrued Workpapers 2012 Page 111 1,927,215 34 Derivative Liab Workpapers 2012 Page 112 75,034 35 Other Deferred Credits Workpapers 2012 Page 113 20,367,691 36 Other Regulatory Liabilities Workpapers 2012 Page 115 709,176 37 Accumulated Deferred Taxes N/A - 3839 Total Liabilities 60,902,349$ 4041 Total Working Capital 51,314,899$
Schedule B4

Michigan Public Service Commission Case No.: U-17273Michigan Gas Utilities Corporation Exhibit No.: A-13 (KAD-9)Net Operating Income Schedule: C1For the 12 Month Period Ended, December 31, 2012 Page: 1 of 1
Witness: Katherine A. De Cramer, CPA
(a) (b)
NetLine OperatingNo. Description Source Income12 Operating Revenues Exh. A-3, Sch. C3 122,621,203$ 34 Operating Expenses5 Cost of Gas Exh. A-3, Sch. C4 63,534,0066 Operations and Maintenance Expenses Exh. A-3, Sch. C5 33,647,7917 Depreciation and Amortization Exh. A-3, Sch. C6 8,115,3758 General Taxes Exh. A-3, Sch. C7 4,264,0759 Income Taxes Exh. A-3, Sch. C8, C9 & C10 3,068,19810 Total Operating Expenses 112,629,445$ 1112 Operating Income 9,991,758$ 1314 Operating Income Adjustments15 Allowance For Funds Used During Construction - 016 Loss on Reacquired Securities - 017 Interest - 018 Income Tax Effect of Interest Exh. A-13, Sch. C12 47,95419 Interest Synchronization Adjustment 020 Total Operating Income Adjustments 47,954$ 2122 Adjusted Net Operating Income 9,943,804$
Schedule C1

Michigan Public Service Commission Case No.: U-17273Michigan Gas Utilities Corporation Exhibit No.: A-13 (KAD-9)Revenue Conversion Factor Schedule No.: C2
Page: 1 of 1Witness: Katherine A. De Cramer, CPA
(a) (b) (c) (d)
Line Calc.
No. Description Logic 2012
12 Income Before Income Taxes 100.000%34 Michigan Corporate Income Tax Rate 6.0000%56 Federal Income Tax Base Ln 2 - Ln 4 94.000%78 Times Federal Income Tax Rate 35.000%910 Federal Income Tax Ln 6 x Ln 8 32.900%1112 Income After Taxes Ln 6 - Ln 10 61.100%1314 Gross Revenue Conversion Factor Ln 2 / Ln 12 1.6367
Schedule C2

Michigan Public Service Commission Case No.: U-17273Michigan Gas Utilities Corporation Exhibit No.: A-13 (KAD-9)Sales Revenue Schedule No.: C3For the 12 Month Period Ended, December 31, 2012 Page: 1 of 1
Witness: Katherine A. De Cramer, CPA
(a) (b) (c)
Line SalesNo. Description Source Revenue12 Present Revenues Workpapers 2012 Page 53 115,653,998$ 34 Other Adjustments Workpapers 2012 Page 53 6,967,205 56 Total Revenue 122,621,203$
Schedule C3
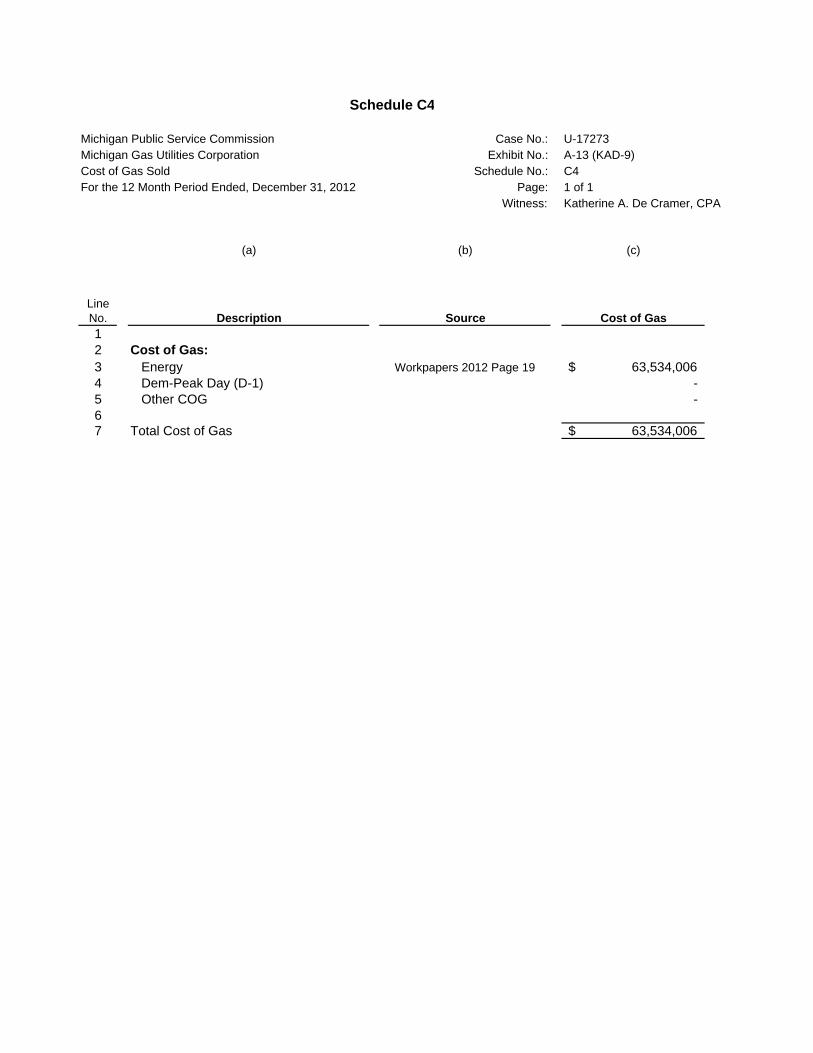
Michigan Public Service Commission Case No.: U-17273Michigan Gas Utilities Corporation Exhibit No.: A-13 (KAD-9)Cost of Gas Sold Schedule No.: C4For the 12 Month Period Ended, December 31, 2012 Page: 1 of 1
Witness: Katherine A. De Cramer, CPA
(a) (b) (c)
LineNo. Description Source Cost of Gas12 Cost of Gas:3 Energy Workpapers 2012 Page 19 63,534,006$ 4 Dem-Peak Day (D-1) - 5 Other COG - 67 Total Cost of Gas 63,534,006$
Schedule C4

Michigan Public Service Commission Case No.: U-17273Michigan Gas Utilities Corporation Exhibit No.: A-13 (KAD-9)Operation and Maintenance Expenses Schedule No.: C5For the 12 Month Period Ended, December 31, 2012 Page: 1 of 1
Witness: Katherine A. De Cramer, CPA
(a) (b) (c)
Line Operation andNo. Description Source Maint. Expenses12 Production - Other:3 Energy Workpapers 2012 Page 19 722,015$ 4 Dem-Peak Day (D-1) Workpapers 2012 Page 19 376,862$ 5 Other COG 858,934$ 67 Total Production-Other 1,957,811$ 89 Operation and Maintenance Expenses:10 Transmission Workpapers 2012 Page 19 535,236$ 11 Distribution Workpapers 2012 Page 19 16,344,594 12 Storage Workpapers 2012 Page 19 755,799 13 Customer Accounts Workpapers 2012 Page 19 12,718,175 14 Customer Service Workpapers 2012 Page 19 1,336,176 15 Sales Workpapers 2012 Page 19 - 1617 Total Operation and Maintenance Expenses 31,689,980$ 1819 Total Production-Other and Operation & Maintenance Expenses 33,647,791$
Schedule C5

Michigan Public Service Commission Case No.: U-17273Michigan Gas Utilities Corporation Exhibit No.: A-13 (KAD-9)Depreciation and Amortization Expense Schedule No.: C6For the 12 Month Period Ended, December 31, 2012 Page: 1 of 1
Witness: Katherine A. De Cramer, CPA
(a) (b) (c)
Line Depreciation &No. Description Source Amort. Expense12 Depreciation and Amortization Expense3 Depreciation Expense Workpapers 2012 Page 34 8,115,375$ 4 Amortization Expense - 56 Total Depreciation and Amortization Expense 8,115,375$
Schedule C6

Michigan Public Service Commission Case No.: U-17273
Michigan Gas Utilities Corporation Exhibit No.: A-13 (KAD-9)
Taxes Other Than Income Taxes Schedule No.: C7
For the 12 Month Period Ended, December 31, 2012 Page: 1 of 1
Witness: Katherine A. De Cramer, CPA
(a) (b) (c)
Line GeneralNo. Description Source Taxes
12 Taxes Other Than Income Taxes34 FEDERAL5 Retirement Benefits Workpapers 2012 Page 51 637,759$ 6 Unemployment Comp Workpapers 2012 Page 51 11,263 7 PR Taxes Credited Workpapers 2012 Page 51 (97) 8 Super Fund Tax9 Highway Use Tax10 Federal Excise Tax Workpapers 2012 Page 51 709 1112 STATE13 Gross Receipts Tax14 Unemployment Comp Workpapers 2012 Page 51 42,140 15 Remain. Assessment16 Use Tax Workpapers 2012 Page 51 45 17 Unauthor Ins Tax Workpapers 2012 Page 51 13,270 18 Wis Recycling Fee19 Single Business Tax - 20 Property Workpapers 2012 Page 51 3,205,383 2122 LOCAL23 Real Est & Property2425 IBS26 IBS Payroll Tax Workpapers 2012 Page 51 353,472$ 2728 OTHER28 Franchise Tax Fees Workpapers 2012 Page 51 125$ 29 State Unitary Fees Workpapers 2012 Page 51 6 3031 Total Taxes Other Than Income Taxes 4,264,075$
Schedule C7

Michigan Public Service Commission Case No.: U-17273Michigan Gas Utilities Corporation Exhibit No.: A-13 (KAD-9)Federal Income Taxes Schedule No.: C8For the 12 Month Period Ended, December 31, 2012 Page: 1 of 1
Witness: Katherine A. De Cramer, CPA
(a) (b) (c)
Line Federal IncomeNo. Description Source Taxes12 Federal Income Taxes Workpapers 2012 Page 35 2,868,188$
Schedule C8

Michigan Public Service Commission Case No.: U-17273Michigan Gas Utilities Corporation Exhibit No.: A-13 (KAD-9)State Income Taxes Schedule No.: C9For the 12 Month Period Ended, December 31, 2012 Page: 1 of 1
Witness: Katherine A. De Cramer, CPA
(a) (b) (c)
Line State IncomeNo. Description Source Taxes12 State Income Taxes Workpapers 2012 Page 35 200,010$
Schedule C9

Michigan Public Service Commission Case No.: U-17273Michigan Gas Utilities Corporation Exhibit No.: A-13 (KAD-9)Other (or Local) Taxes Schedule No.: C10For the 12 Month Period Ended, December 31, 2012 Page: 1 of 1
Witness: Katherine A. De Cramer, CPA
(a) (b) (c)
Line Other (or Local)No. Description Source Taxes12 None
Schedule C10

Michigan Public Service Commission Case No.: U-17273Michigan Gas Utilities Corporation Exhibit No.: A-13 (KAD-9)Allowance for Funds Used During Construction Schedule No.: C11For the 12 Month Period Ended, December 31, 2012 Page: 1 of 1
Witness: Katherine A. De Cramer, CPA
(a) (b) (c)
LineNo. Description Source AFUDC12 AFUDC Debt Workpapers 2012 Page 49 -$ 3 AFUDC Equity Workpapers 2012 Page 49 -$ 45 Total AFUDC -$
Schedule C11

Michigan Public Service Commission Case No.: U-17273Michigan Gas Utilities Corporation Exhibit No.: A-13 (KAD-9)Adjusted Net Operating Income -- Income Tax Savings Schedule No.: C12For the 12 Month Period Ended, December 31, 2012 Page: 1 of 1
Witness: Katherine A. De Cramer, CPA
(a) (b) (c)
LineNo. Description Source TOTAL12 Rate Base Ex A-2 Sch B-1 194,076,269$ 34 Debt Portion of Capital Structure Ex A-4 Sch D-1 43.52%56 Portion of Rate Base Funded by Debt Ln 1 x Ln 2 84,455,394$ 78 Cost of Debt (1) Ex A-4 Sch D-1 6.1432%910 Interest Allowed Ln 3 x Ln 4 5,188,227$ 1112 LESS INTEREST DEDUCTION13 INCLUDED IN RECORDED14 INCOME TAX ACCRUALS:15 Gas/Jurisdictional Company Books & Records 5,071,266$ 1617 Additional Interest Allowed Ln 10 - Ln 15 116,961$ 1819 Income Tax Effect20 Current Income Tax Rate of 41.0000% 47,954$
21222324252627282930
Schedule C12
May not cross-check due to rounding
* The Cost of Debt represents the weightingof respective Short Term and Long TermDebt amounts against total debt multiplied
by their respective costs.
Source: (1) Use Capital Structure Percentagesexcluding DITC from the Total.

STATE OF MICHIGAN
BEFORE THE MICHIGAN PUBLIC SERVICE COMMISSION
* * * * * In the matter of the application of ) MICHIGAN GAS UTILITIES CORPORATION ) for authority to increase retail natural gas rates. ) Case No. U-17273 )
DIRECT TESTIMONY AND EXHIBITS
MATTHEW M. DIRKSEN
FOR
MICHIGAN GAS UTILITIES CORPORATION
June 7, 2013

1
STATE OF MICHIGAN
BEFORE THE MICHIGAN PUBLIC SERVICE COMMISSION
* * * * *
In the matter of the application of ) MICHIGAN GAS UTILITIES CORPORATION ) for authority to increase retail natural gas rates. ) Case No. U-17273 )
QUALIFICATIONS
OF MATTHEW M. DIRKSEN
PART I
Q. Please state your name, position and business address. 1
A. My name is Matthew M. Dirksen. My business address is Integrys Energy Group, 2
Inc. (“Integrys”), 700 North Adams Street, P.O. Box 19001, Green Bay, WI 54307-3
9001. I am employed by Integrys Business Support, LLC (“IBS”) as a Senior Sales 4
and Revenue Forecaster in the Budget Planning and Analysis Department of 5
Integrys. I am testifying on behalf of Michigan Gas Utilities Corporation (“MGUC”), 6
which is a wholly-owned subsidiary of Integrys. Integrys resulted from the February 7
21, 2007 merger between WPS Resources Corporation and Peoples Energy 8
Corporation. 9
10
Q. Please describe briefly your educational, professional, and utility background. 11
A. I hold a Bachelors Degree from the University of Wisconsin La Crosse in Accounting 12
and Psychology. I graduated May 2001. I completed my Executive MBA from UW –13
Madison in 2010. Before coming to Integrys, I worked for Kohl’s Corporate Office 14
where 3 of my 7 years were in sales forecasting. My employment started with 15
Integrys in November 2011. 16
17
18

2
Q. Have you previously testified before any regulatory agency? 1
A. Yes, I have submitted testimony before the Michigan Public Service Commission 2
(“MPSC”) in Gas Cost Recovery (“GCR”) proceedings in Case Nos. U-16920 and U-3
17130, regarding load forecasting. 4

3
MATTHEW M. DIRKSEN DIRECT TESTIMONY
PART II
Q. What is the purpose of your pre-filed direct testimony? 1
A. The purpose of my pre-filed direct testimony is to provide an explanation of the 2
methodology used to develop MGUC’s weather normalization procedure, sales 3
forecast, and fixed charge count forecast for the 2014 projected test year. In 4
addition, I provide testimony to support a revised weather normalization period 5
moving from 30 years to 15 years. 6
7
Q. Are you sponsoring any exhibits in this proceeding? 8
A. Yes, I am. I am sponsoring: 9
1. Exhibit A-5 (MMD-1), Schedule E1 10
2. Exhibit A-5 (MMD-1), Schedule E1.1 11
3. Exhibit A-5 (MMD-1), Schedule E2 12
4. Exhibit A-5 (MMD-1), Schedule E3 13
5. Exhibit A-5 (MMD-1), Schedule E4 14
6. Exhibit A-5 (MMD-1), Schedule E5 15
7. Exhibit A-15 (MMD-2), Schedule E1.1 16
8. Exhibit A-15 (MMD-2), Schedule E2 17
18
Q. Were these exhibits prepared by you or under your direction and supervision? 19
A. Yes, they were. 20
21
Q. Please describe Exhibit A-5 (MMD-1), Schedule E1. 22
A. Exhibit A-5 (MMD-1), Schedule E1 is MGUC’s sales forecast for the years 2013 – 23
2017, and is included here to comply with the filing requirements of the 24
Commission’s Orders dated December 23, 2008 and February 20, 2009 issued in 25

4
Case No. U-15895. 1
2
Q. Please describe Exhibit A-5 (MMD-1), Schedules E1.1. 3
A. Exhibit A-5 (MMD-1), Schedule E1.1 is MGUC’s 2014 projected test year sales 4
forecast using a 30 year weather normalization period. 5
6
Q. Please describe Exhibit A-5 (MMD-1), Schedules E2. 7
A. Exhibit A-5 (MMD-1), Schedule E2 is MGUC’s 2014 projected test year fixed charge 8
count forecast. 9
10
Q. Please describe Exhibit A-5 (MMD-1), Schedules E3. 11
A. Exhibit A-5 (MMD-1), Schedule E3 is MGUC’s Weather Normalization study which 12
compares six alternative moving average weather normalized Heating Degree Days 13
(“HDD”) to actual degree days, and determines that a 15 year weather normalization 14
period is most accurate. 15
16
Q. Please describe Exhibit A-5 (MMD-1), Schedules E4. 17
A. Exhibit A-5 (MMD-1), Schedule E4, page 1 is MGUC’s 2014 projected test year sales 18
forecast using a 15 year weather normalization period. Exhibit A-5 (MMD-1), 19
Schedule E4, page 2 depicts the difference in sales using a 15 year weather 20
normalization period compared to a 30 year weather normalization period. 21
22
Q. Please describe Exhibit A-5 (MMD-1), Schedules E5. 23
A. Exhibit A-5 (MMD-1), Schedule E5 depicts the difference in revenues at present 24
rates using a 15 year weather normalization period compared to a 30 year weather 25
normalization period. 26
27

5
Q. Please describe Exhibit A-15 (MMD-2), Schedule E1.1. 1
A. Exhibit A-15 (MMD-2), Schedule E1.1 is MGUC’s 2012 historic test year sales. 2
3
Q. Please describe Exhibit A-15 (MMD-2), Schedule E2. 4
A. Exhibit A-15 (MMD-2), Schedule E2 is MGUC’s 2012 historic test year fixed charge 5
counts. 6
7
Q. Please explain how the MGUC’s 2014 projected test year sales forecast was 8
developed. 9
A. MGUC’s 2014 projected test year sales forecast was developed in MetrixND, and is 10
included here as Exhibit A-5 (MMD-1), Schedule E1.1. MetrixND is a statistical 11
software package developed by Itron, a utility consulting firm. 12
13
The forecast models in general use the regression analysis of the Ordinary Least 14
Squares method (“OLS”), with Seasonal Moving Average (“SMA”), Seasonal 15
Autoregressive (“SAR”), and Moving Average (“MA”), when necessary. These 16
models are well suited for data with seasonal and cyclical components, like utility 17
sales. 18
19
Monthly historical data were available from January 2007 through October 2012. 20
The explanatory variables employed in this forecast are: 21
1. HDD variables, 22 23
2. Trend variables, 24 25
3. Economic variables purchased from Moody’s Analytics in November 26 2012, and 27
28 4. Demographic variables. 29
30
31

6
Q. Please explain how normal weather was defined. 1
A. Normal weather was defined as the average over the 30 year period 1982-2011. 2
This resulted in 6,354 Normal HDDs, using a base temperature of 65°F. 3
4
Q. Please explain the development of the weather data. 5
Development of the 30 year normal weather data for four Michigan weather stations 6
(Benton Harbor, Coldwater, Grand Rapids, and Monroe) was derived from the hourly 7
temperatures purchased from Telvent DTN. These weather stations are all official 8
National Oceanic and Atmospheric Administration (“NOAA”) or National Weather 9
Service (”NWS”) weather stations. 10
11
The data from the individual weather stations were weighted to create variables for a 12
“virtual weather station” representative of the overall weather for the MGUC service 13
territory. 14
15
The weights were developed by first taking a snapshot of the number of customers 16
by zip code as of October 2012. The customers included were Residential, Multiple 17
Family, Small and Large Commercial/Industrial firm customers, Transport and Gas 18
Light. Based on zip code, customers were tallied by city and then each city was 19
assigned to a weather station based on the proximity to a particular weather station. 20
The weights were then calculated by taking the number-of-customers assigned to 21
each weather station divided by the total number-of-customers. The resulting 22
weights were: 23
Benton Harbor: 37% 24
Coldwater: 17% 25
Grand Rapids: 17% 26
Monroe: 29% 27

7
Actual Degree Days were calculated based on the hourly temperature data for each 1
weather station, summing up to a daily actual temperature, calculating the Degree 2
Day (“DD”) per day, applying the weight per weather station to create the “virtual 3
weather station” and summing to a total day and monthly actual HDD temperature. 4
The HDD equals the maximum of {0 or (65°F – 24-hour average temperature)}. 5
6
The calculation of normal DDs uses the actual “virtual weather station” DD and 7
averages for the years selected in creating the Normal Weather period. 8
9
Q. Please explain the procedure used to develop the weather normalized 10
adjustment to sales. 11
A. The weather normalized sales is based on a mathematical model that uses the daily 12
average of the actual sales of July and August of the previous year, then multiplies 13
those daily average sales by the number of days in a given month to arrive at the 14
Total Base Load. The Total Base Load is then subtracted from actual monthly sales 15
to give the Weather Sensitive Sales. The Weather Sensitive Sales are then divided 16
by actual number of HDD to give the Weather Sensitive use per DD. The final total 17
Weather Normalized Sales are the Weather Sensitive use per DD multiplied by the 18
normal number of HDD for that month. The final Weather Sensitive Sales will equal 19
actual sales if the Weather Adjustment is zero. 20
21
Q. Please explain how the forecast was developed. 22
A. For rate classes that have Customer Choice and General Service customers 23
(Residential, Multiple Family, and Small General Service), the models were run for 24
the entire service territory by the rate class. 25
26
27
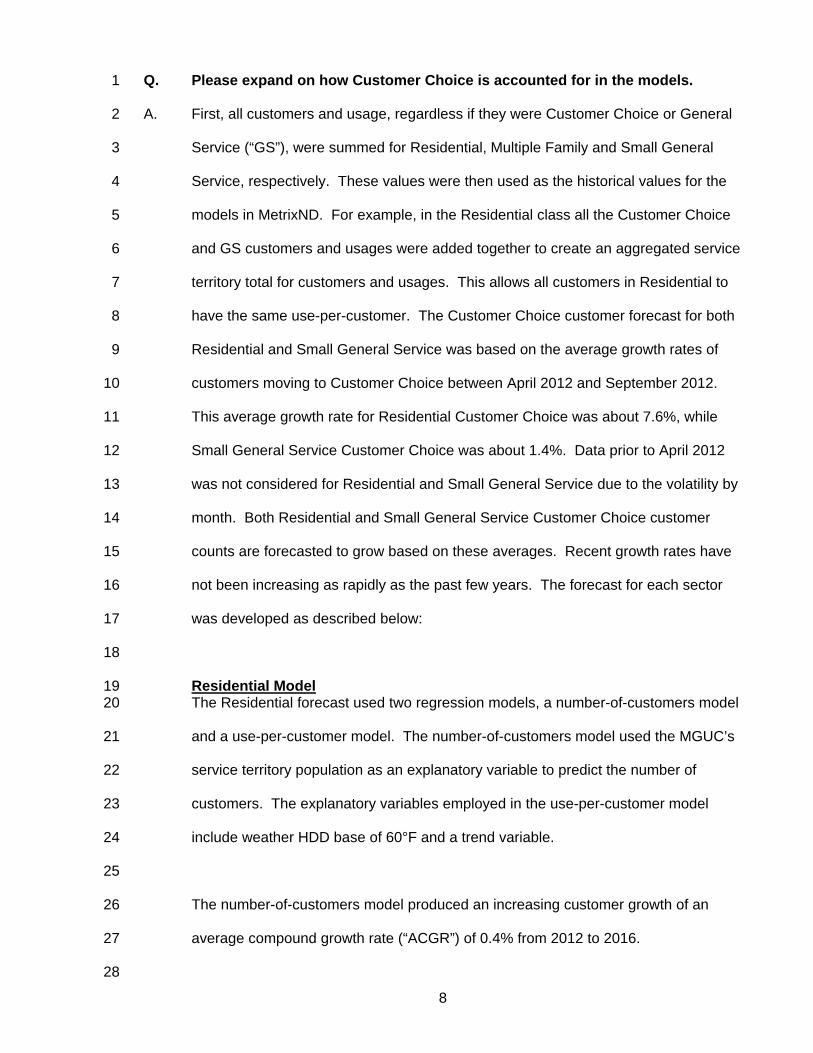
8
Q. Please expand on how Customer Choice is accounted for in the models. 1
A. First, all customers and usage, regardless if they were Customer Choice or General 2
Service (“GS”), were summed for Residential, Multiple Family and Small General 3
Service, respectively. These values were then used as the historical values for the 4
models in MetrixND. For example, in the Residential class all the Customer Choice 5
and GS customers and usages were added together to create an aggregated service 6
territory total for customers and usages. This allows all customers in Residential to 7
have the same use-per-customer. The Customer Choice customer forecast for both 8
Residential and Small General Service was based on the average growth rates of 9
customers moving to Customer Choice between April 2012 and September 2012. 10
This average growth rate for Residential Customer Choice was about 7.6%, while 11
Small General Service Customer Choice was about 1.4%. Data prior to April 2012 12
was not considered for Residential and Small General Service due to the volatility by 13
month. Both Residential and Small General Service Customer Choice customer 14
counts are forecasted to grow based on these averages. Recent growth rates have 15
not been increasing as rapidly as the past few years. The forecast for each sector 16
was developed as described below: 17
18
Residential Model 19 The Residential forecast used two regression models, a number-of-customers model 20
and a use-per-customer model. The number-of-customers model used the MGUC’s 21
service territory population as an explanatory variable to predict the number of 22
customers. The explanatory variables employed in the use-per-customer model 23
include weather HDD base of 60°F and a trend variable. 24
25
The number-of-customers model produced an increasing customer growth of an 26
average compound growth rate (“ACGR”) of 0.4% from 2012 to 2016. 27
28

9
The use-per-customer model produced an increasing use-per-customer growth rate 1
of 0.1% ACGR from 2012 to 2016. The growth rate from 2012 to 2016 is increasing 2
or flat due to 2012 being the starting point in this calculation. The MGUC service 3
territory had a very warm winter in 2012, which kept the use per customer low. 4
5
Multi-Family Model 6 The Multi-Family forecast used two regression models, a number-of-customers 7
model and a use-per-customer model. Both are monthly models. The number-of-8
customers model used the MGUC’s service territory population as an explanatory 9
variable to predict the number of customers. The explanatory variables employed in 10
the use-per-customer model include price, household size, household income, 11
weather HDD base of 60°F. 12
13
The number-of-customers model produced a decreasing customer growth rate of 14
-0.3% from 2012 to 2016. 15
16
The use-per-customer model produced an increasing growth rate of 0.6% ACGR 17
from 2012 to 2016. The growth rate is increasing due to 2012 being the starting 18
point in this calculation. The MGUC service territory had a very warm winter in 2012, 19
which kept the use per customer low. 20
21
Small General Service Model 22 The Small General Service forecast used two regression models, a number-of-23
customers model and a use-per-customer model. Both are monthly models. The 24
number-of-customers model used the MGUC’s service territory employment as an 25
explanatory variable to predict the number-of-customers. The explanatory variables 26
employed in the use-per-customer model include weather HDD base of 60°F, MGUC 27
gross county product, price, and efficiency trends. 28

10
1
The number-of-customers model produced a decreasing customer growth rate of 2
-0.5% ACGR from 2012 to 2016. 3
4
The use-per-customer model produced an increasing growth rate of 0.7% ACGR 5
from 2012 to 2016. The growth rate is increasing due to 2012 being the starting 6
point in this calculation. The MGUC service territory had a very warm winter in 2012, 7
which kept the use per customer low. 8
9
Large General Service Model 10 The Large General Service forecast was based on a total-sales model only. The 11
explanatory variables employed in the total-sales model include MGUC’s service 12
territory employment and HDD base of 60°F. The model produced a decrease in 13
both customer counts and total sales. The customer counts will decrease 6 14
customers from 2012 to 2016, while total sales will decrease by 22,795 Mcf’s, or 15
-1.8% ACGR. 16
17
Transportation Forecast 18 The Transportation Forecast for 2013-2015 was conducted by MGUC’s Field 19
Representatives on a customer-by-customer basis with input from the customers. 20
They compiled and reviewed all Transportation customers’ data. They identified 21
which customers would be changing rate classes due to new rate structures. 22
Additionally, they identified known changes of load additions/reductions based on 23
any recent conversations with customers. After taking into account what was 24
performed previously, the representatives then reviewed the account and compared 25
the previous forecasts with actual results. 26
27

11
For 2013 the forecasted sales are increasing when compared to the actual data from 1
2012 due to increased production at some plants and new customers expected to 2
come onto the system throughout the forecast horizon. 3
4
Reasons for Overall Increase in Sales 5 Q. Please summarize why MGUC’s 2014 projected test year sales are forecasted 6
to increase when compared to the 2012 historic test year. 7
A. There are several reasons. The economy in Michigan is improving since the 8
recession ended. The unemployment rate is decreasing while the population in 9
MGUC’s territory is expected to increase. Also, the 2012 weather was abnormally 10
warm, and the forecast is projecting that the weather will return to normal trends. 11
Since MGUC implemented its most recent rate structure in January 2010, there has 12
been significant movement between rate classes. Customers have continued to 13
move from GCR Sales to the Gas Customer Choice over the last year. Although this 14
does not explain the increase in total sales, it helps to explain the rapid decline in 15
GCR volumes and the rapid increase in Gas Customer Choice volumes. 16
17
Fixed Charge Forecast 18 Q. Please explain the procedures used to develop fixed charge counts for the 19
2014 projected test year. 20
A. January – December 2012 actual fixed charge counts were used as the basis for the 21
2014 projected test year fixed charge counts. This year was selected because it had 22
the most current mix of GCR Sales and Gas Customer Choice customers. 23
24
The forecasted customer counts are allocated to the tariff level using ratios. At the 25
completion of the allocation process, immaterial differences between the fixed 26
charge counts and the forecasted fixed charge counts exist due to rounding. 27
28

12
The 2014 projected test year fixed charge count is shown on Exhibit A-5 (MMD-1), 1
Schedule E2. 2
3
Q. Please explain how revenues were developed. 4
A. Revenues were developed by multiplying the current approved tariff rate factors by 5
the forecasted sales and fixed charge counts. 6
7
Adjust Weather Normalization Period from 30 Years to 15 Years 8 Q. What time period for weather normalization does MGUC propose? 9
A. MGUC is proposing that the weather normalization period be modified from a 30 year 10
period to a 15 year period for all ratemaking and GCR purposes. The Commission 11
has previously approved a change for the gas businesses of Consumers Energy 12
Company in Case No. U-15986, SEMCO Energy Gas Company in Case No. U-13
16169, and Michigan Consolidated Gas Company in Case No. U-15701. MGUC has 14
filed its 2013-2014 GCR filing using a 15 year weather normalization period in Case 15
No. U-17130. 16
17
Q. Why is the period used for normal weather significant? 18
A. Temperature greatly impacts the amount of natural gas a customer uses in a given 19
period. Historical test year actual data must be adjusted for weather to eliminate the 20
impact of abnormal weather. This puts the actual data and the forecast data on the 21
same weather basis. Finally, normal weather is used to predict weather during the 22
forecasted period. The more accurately MGUC can predict HDD’s, the more 23
accurately it can forecast demand, which leads to optimal planning and reduces 24
costs to be recovered from customers. 25
26
Q. What historical period has MGUC traditionally used to calculate normal 27
weather? 28

13
A. MGUC has historically used a 30 year weather normalization period, and a 30 year 1
weather normalization period was used to calculate the revenue deficiency in the 2
instant general rate case. 3
4
Q. Please explain why a 15 year weather normalization period is being proposed? 5
A. The purpose of forecasting is to accurately predict future sales and revenues for 6
MGUC. Upon analysis of weather data, MGUC is proposing a 15 year weather 7
normalization period instead of the traditional 30 year weather normalization period. 8
9
Q. What analysis was performed to determine that a 15 year normal is 10
appropriate? 11
A. The common forecasting technique of using the average of historical outcomes to 12
predict future outcomes was employed. In this case, the average of historical annual 13
HDD was used to predict weather for the test year. For this analysis, six alternative 14
weather normalization periods were evaluated all which used data through 2012: 30 15
years, 25 years, 20 years, 15 years, 10 years, and 5 years. Next, the six yearly 16
average HDDs were compared to the actual HDDs by year to determine what the 17
average absolute difference back to 1993. Then, the standard deviation was 18
calculated for the absolute difference. Finally, a statistical comparison of predictive 19
capability of these time horizons was used to determine which time period was more 20
accurate, by calculating and comparing the root mean squared error (“RMSE”). 21
22
Q. Please describe how HDD data was analyzed. 23
A. The yearly historical HDD actual data was gathered for the “virtual weather station” 24
of MGUC’s service territory from 1963 to 2012. Historical data was purchased from 25
Telvent DTN. A series of moving averages for the six alternatives being studied 26
were calculated and compared with the actual HDDs observed one year later. For 27

14
example, the 15 year HDD and 30 year HDD averages for 1996 was compared with 1
the actual HDD for 1997. This process was repeated for each year from 1993 to 2
2012, the most recent year for which actual data is available. The averages and 3
standard deviations of each data set were analyzed; in both cases, the lowest value 4
reflects the most accurate HDD forecast or “normal”. The detailed analysis is 5
included in Exhibit A-5 (MMD-1), Schedule E3, Page 1 of 2. 6
7
Q. How did the 30, 25, 20, 15, 10, and 5 year HDD averages compare to actual 8
data? 9
A. Exhibit A-5 (MMD-1), Schedule E3, Page 1 of 2 summarizes MGUC’s “virtual 10
weather station” HDDs as moving averages. Column 2 depicts the actual number of 11
HDDs by year. Column 3, 5, 7, 9, 11, and 13 are the moving averages of the 12
depicted years in each column. The absolute difference columns compare the 13
moving average HDDs to the actual HDDs of that given year and is represented in 14
columns 4, 6, 8, 10, 12, and 14. 15
16
Q. What conclusions were drawn from this analysis? 17
A. This data revealed that using the average of the absolute difference, the 15 year 18
average HDDs is the most accurate and stable predictor of the next year’s actual 19
weather, see Exhibit A-5 (MMD-1), Schedule E3, Page 1 of 2, Lines 22 and Line 24. 20
The 15 year average HDDs was first in absolute difference and RSME. The 20 year 21
average HDDs was the next closest time period based on absolute difference, while 22
30 year average HDDs and 5 year average HDDs were the least accurate using the 23
same tests. 24
25
Q. How else were the predictive capabilities of the averages compared? 26
A. A statistical analysis was conducted to compare the predictive capabilities of the 27

15
average year HDDs. The first employed was the standard statistic RMSE, which is 1
widely used to measure the accuracy of forecasts. It represents the degree to which 2
the forecasted value differs from the actual data and is a measure of variance. The 3
smaller the RMSE, the smaller the overall differences between the actual and the 4
forecasted HDDs. The formula for RMSE is: 5
( )∑=
−=n
i
Eii HDDHDD
nRMSE
1
21 6
The i denotes the year of the observation, n denotes the total number of years (i.e. 7
15), HDDi refers to actual values, and EiHDD is the forecasted HDD or ‘normal’. 8
( )Eii HDDHDD − , therefore, measures the difference between actual and forecasted 9
value. 10
11
Q. Please describe your results. 12
A. Based on the MGUC virtual weather station’s historical data, a 15 year HDD average 13
outperforms a 30 year HDD average in predicting weather one year into the future. 14
As a forecasting instrument, the 15 year HDD average tends to produce a more 15
accurate forecast than the 30 year HDD average. Based on the RMSE test, as seen 16
in Table 1 below, the errors of the 30 year HDD average are significantly greater 17
than that of the 15 year HDD average. This calculation can be found on Exhibit A-5 18
(MMD-1), Schedule E3, Page 2 of 2. 19
Table 1 20
Historical Weather Analysis of HDD Average 21
HDD Average RMSE Order 22
30 Year 463.62 5 23 25 Year 449.18 4 24 20 Year 436.26 2 25 15 Year 421.02 1 26 10 Year 445.45 3 27 5 Year 476.88 6 28 29

16
Q. Please summarize why a 15 year weather normalization period was selected 1
over the other tested periods. 2
A. A 15 year weather normalization period was selected because 15 year normal HDDs 3
best predicted weather one year into the future in two of the three statistical tests, 4
average of absolute difference and RSME, while being third in standard deviation. 5
6
Weather Normal Effects on Forecast 7 Q. Has MGUC developed a sales forecast using a 15 year weather normalization 8
period? 9
A. Yes. Exhibit A-5 (MMD-1), Schedule E4, Page 1 depicts the monthly sales volumes 10
for the 2014 projected test year using a 15 year weather normalization period. 11
Further, Exhibit A-5 (MMD-1), Schedule E4, Page 2 depicts the decrease in monthly 12
sales 2014 projected test year using a 15 year weather normalization period as 13
compared to a 30 year weather normalization period. In total, sales decrease by 14
493,099 Mcf. 15
16
Q. What is the impact of using a 15 year weather normalization period on fixed 17
charge counts? 18
A. There is no change in the fixed charge counts forecast. Weather is not used as a 19
variable in forecasting this type of count. 20
21
Q. Has MGUC determined the impact on Revenues on Present Rates when using 22
a 15 year weather normalization period as compared to a 30 year weather 23
normalization period? 24
A. Yes, they have. Exhibit A-5 (MMD-1), Schedule E5, depicts the monthly volumetric 25
revenues using a 30 year weather normalization period, a 15 weather normalization 26
period, and the difference between 30 years and 15 years. In total, revenues 27
decrease by $722,363, or 2.59%, when using a 15 year weather normalization 28

17
period. 1
2
Q. Does this complete your pre-filed direct testimony? 3
A. Yes, it does. 4

Case No.: U-17273Exhibit No.: A-5 (MMD-1)
Schedule: E1Page: 1 of 2
Witness: Matthew M. Dirksen
Michigan Public Service CommissionMichigan Gas Utilities CorporationAnnual Service Area Sales by Major Customer Classes and System Output5-Year Projected
Mcf-Calendar Sales
(a) (b) (c) (d) (e) (f) (g) (h) (i) (j)
Losses Losses SystemLine % of OutputNo. Year Residential Commercial Industrial Transportation Company Use Total Mcf Output Unit of Measure12 2013 11,268,139 3,183,268 312,001 15,111,311 53,180 29,927,899 38,408 0.1286% Mcf3 2014 11,208,158 3,116,742 306,249 15,374,163 53,414 30,058,726 38,575 0.1286% Mcf4 2015 10,971,687 3,057,077 303,293 15,621,700 53,321 30,007,078 38,509 0.1286% Mcf5 2016 10,736,001 3,012,726 302,907 15,857,011 53,241 29,961,886 38,451 0.1286% Mcf6 2017 10,490,949 2,971,850 300,993 15,907,706 52,818 29,724,315 38,146 0.1286% Mcf
Note 1: Residential = Residential General and Heating, all Lighting, and all Multiple FamilyNote 2: Commercial = Small C&I General and Heating.Note 3: Industrial = Large C&I General and Heating, and Special Contract.Note 4: Transportation = TR-1, TR-2 and TR-3; all Aggregated Customers, and all Choice Customers
Annual Sales
Schedule E1

Case No.: U-17273Exhibit No.: A-5 (MMD-1)
Schedule: E1Page: 2 of 2
Witness: Matthew M. Dirksen
Michigan Public Service CommissionMichigan Gas Utilities CorporationAnnual Service Area Sales by Major Customer Classes and System Output5-Year Projected
Mcf-Calendar Sales
(k) (l) (m) (n)
LineNo. Year Residential GCC Commercial GCC Total12 2013 2,257,318 2,037,923 4,295,2423 2014 2,447,436 2,056,577 4,504,0134 2015 2,613,621 2,083,578 4,697,2005 2016 2,810,115 2,122,396 4,932,5116 2017 2,863,604 2,119,601 4,983,206
Note 5: Residential GCC = Residential Customer Choice and Multiple Family ChoiceNote 6: Commericial GCC = Small General Customer ChoiceNote 7: These Choice Sales are included in the Transportation Sales on Page 1 of 2
Schedule E1

Case No.: U-17273Exhibit No.: A-5 (MMD-1)
Schedule: E1.1Page: 1 of 1
Witness: Matthew M. DirksenMichigan Gas Utilities Corporation
Projected Test Year Calendar Sales in MCFCalendar Sales in MCF For the 12 Months Ending, December 31, 2014
Ln Rate Class Jan Feb Mar Apr May Jun Jul Aug Sep Oct Nov Dec Total
Residential Rate1 Residential General 40,821 35,206 29,144 16,905 7,878 3,941 3,479 3,517 5,318 13,350 23,374 35,775 218,7072 Residential Heating 2,011,755 1,735,047 1,436,272 833,139 388,266 194,215 171,441 173,303 262,089 657,916 1,151,919 1,763,094 10,778,4563 Residential Lighting 30 30 42 25 25 30 30 36 39 50 36 31 4044 Total Residential 2,052,606 1,770,283 1,465,457 850,069 396,169 198,186 174,950 176,856 267,446 671,316 1,175,329 1,798,900 10,997,567
Multiple Family Rate5 Meter Class I 3,507 3,330 2,893 1,891 971 711 693 698 790 1,142 1,864 2,685 21,1756 Meter Class II 18,195 15,203 14,124 8,701 4,871 3,686 3,574 3,610 4,427 7,543 11,236 15,883 111,0537 Meter Class III 4,819 4,919 3,333 2,330 1,567 967 971 1,097 1,225 2,029 3,328 4,796 31,3808 Meter Class IV 7,974 6,667 5,351 3,459 2,175 1,179 1,009 874 1,167 3,099 5,034 7,701 45,6879 Total Multi-Family 34,495 30,119 25,700 16,381 9,584 6,543 6,246 6,278 7,609 13,813 21,462 31,065 209,295
C&I General Service Rate10 Small General Service 580,510 500,579 414,373 241,166 113,807 58,271 51,712 52,197 77,471 190,241 330,983 505,432 3,116,74211 Large General Service 55,125 46,244 41,038 26,031 14,088 8,881 8,575 7,962 10,719 18,681 26,654 41,927 305,92312 Commercial Lighting 97 97 135 79 79 97 97 114 126 162 115 98 1,297
13 Special Contracts 0 0 0 0 0 0 0 0 0 0 296 30 32614 Total C&I General Service 635,732 546,920 455,545 267,276 127,974 67,249 60,384 60,274 88,315 209,084 358,048 547,487 3,424,288
Transportation Service Rate15 Transportation Rate TR-1 251,753 225,446 177,321 152,399 106,954 89,303 82,705 92,350 99,027 152,847 175,161 215,898 1,821,16516 Additional Meters TR-1 0 0 0 0 0 0 0 0 0 0 0 0 0
17 Transportation Rate TR-2 432,392 384,748 360,291 306,020 283,668 288,933 311,289 273,261 254,221 291,233 324,765 372,559 3,883,38118 Additional Meters TR-2 0 0 0 0 0 0 0 0 0 0 0 0 0
19 Transportation Rate TR-3 351,444 342,256 304,259 342,500 301,703 267,523 259,462 308,075 296,815 309,638 323,300 333,632 3,740,60720 Additional Meters TR-3 0 0 0 0 0 0 0 0 0 0 0 0 0
21 Remote Meter Reading Charge 0 0 0 0 0 0 0 0 0 0 0 0 022 Administrative Charge 0 0 0 0 0 0 0 0 0 0 0 0 0
23 Transport Aggregated-Residential 1,251 1,086 636 563 241 96 74 69 156 362 657 915 6,10624 Transport Aggregated-Small C&I 175,373 169,440 136,229 97,784 74,606 45,845 43,213 51,076 45,057 63,043 345,987 143,474 1,391,12725 Transport Aggregated-Large C&I 3,754 6,486 5,500 2,464 1,632 136 57 32 117 737 2,328 4,522 27,764
26 Customer Choice-Residential 430,196 373,753 311,670 182,120 85,498 43,083 38,312 39,015 59,440 150,321 265,150 408,856 2,387,41427 Customer Choice-Small C&I 378,343 327,070 271,424 158,370 74,925 38,464 34,225 34,638 51,552 126,947 221,476 339,143 2,056,57728 Customer Choice-Large C&I 0 0 0 0 0 0 0 0 0 0 0 0 0
29 Customer Choice-Multi-Fam 01 474 425 274 185 86 82 67 54 143 257 344 593 2,98430 Customer Choice-Multi-Fam 02 1,408 1,336 1,127 709 500 384 296 298 479 925 983 1,949 10,39331 Customer Choice-Multi-Fam 03 0 0 0 0 0 0 0 0 0 0 0 0 032 Customer Choice-Multi-Fam 04 8,025 6,887 5,976 3,807 2,164 1,411 1,426 1,447 1,559 2,775 4,818 6,351 46,64533 Total Transportation 2,034,413 1,838,933 1,574,708 1,246,921 931,977 775,260 771,128 800,316 808,564 1,099,084 1,664,969 1,827,890 15,374,163
34 Total Calendar Sales 4,757,246 4,186,255 3,521,410 2,380,647 1,465,703 1,047,238 1,012,708 1,043,723 1,171,935 1,993,297 3,219,808 4,205,341 30,005,312
35 Total Transportation @ Customer Meter 2,034,413 1,838,933 1,574,708 1,246,921 931,977 775,260 771,128 800,316 808,564 1,099,084 1,664,969 1,827,890 15,374,163
36 Total GCR Sales @ Customer Meter 2,722,833 2,347,322 1,946,703 1,133,726 533,727 271,978 241,580 243,407 363,371 894,213 1,554,839 2,377,451 14,631,149

Case No.: U-17273Exhibit No.: A-5 (MMD-1)
Schedule: E2Page: 1 of 1
Witness: Matthew M. Dirksen
Michigan Gas Utilities CorporationProjected Test Year Fixed Charge Count
For the 12 Months Ending, December 31, 2014
Ln Rate Class Jan Feb Mar Apr May Jun Jul Aug Sep Oct Nov Dec Total
Residential Rate1 Residential General 3,189 3,180 3,116 3,172 3,236 3,168 3,130 3,126 3,095 3,095 3,090 3,105 37,7022 Residential Heating 122,600 122,483 122,420 122,238 122,046 121,986 121,893 121,766 121,663 121,528 121,397 121,246 1,463,2663 Residential Lighting 0 0 0 0 0 0 0 0 0 0 0 0 04 Total Residential 125,789 125,663 125,536 125,410 125,282 125,154 125,023 124,892 124,758 124,623 124,487 124,351 1,500,968
Multiple Family Rate5 Meter Class I 125 125 125 125 126 126 125 122 122 123 125 126 1,4956 Meter Class II 206 206 206 206 206 206 207 211 211 210 208 206 2,4897 Meter Class III 17 17 17 17 17 17 17 17 17 17 16 17 2038 Meter Class IV 11 11 11 11 11 11 11 10 10 10 11 11 1299 Total Multi-Family 359 359 359 359 360 360 360 360 360 360 360 360 4,316
C&I General Service Rate10 Small General Service 7,657 7,648 7,637 7,626 7,616 7,604 7,592 7,580 7,569 7,556 7,543 7,532 91,16011 Large General Service 17 17 17 17 17 17 17 16 16 16 16 16 19912 Commercial Lighting 0 0 0 0 0 0 0 0 0 0 0 0 0
13 Special Contracts 1 1 1 1 1 1 1 1 1 1 1 1 1214 Total C&I General Service 7,675 7,666 7,655 7,644 7,634 7,622 7,610 7,597 7,586 7,573 7,560 7,549 91,371
Transportation Service Rate15 Transportation Rate TR-1 112 112 112 112 112 112 112 112 112 112 112 112 1,34416 Additional Meters TR-1 0 0 0 0 0 0 0 0 0 0 0 0 0
17 Transportation Rate TR-2 39 39 39 39 39 39 39 39 39 39 39 39 46818 Additional Meters TR-2 0 0 0 0 0 0 0 0 0 0 0 0 0
19 Transportation Rate TR-3 7 7 7 7 7 7 7 7 7 7 7 7 8420 Additional Meters TR-3 0 0 0 0 0 0 0 0 0 0 0 0 0
21 Remote Meter Reading Charge 0 0 0 0 0 0 0 0 0 0 0 0 022 Administrative Charge 0 0 0 0 0 0 0 0 0 0 0 0 0
23 Transport Aggregated-Residential 34 34 34 34 34 34 34 34 34 34 34 34 40824 Transport Aggregated-Small C&I 498 498 498 498 498 498 498 498 498 498 498 498 5,97625 Transport Aggregated-Large C&I 3 3 3 3 3 3 3 3 3 3 3 3 36
26 Customer Choice-Residential 26,377 26,544 26,713 26,883 27,052 27,224 27,398 27,572 27,747 27,921 28,099 28,275 327,80527 Customer Choice-Small C&I 4,990 4,994 5,002 5,009 5,013 5,020 5,025 5,032 5,036 5,041 5,048 5,054 60,26428 Customer Choice-Large C&I 0 0 0 0 0 0 0 0 0 0 0 0 0
29 Customer Choice-Multi-Fam 01 39 39 39 39 39 39 39 39 39 39 39 39 46830 Customer Choice-Multi-Fam 02 53 53 53 53 53 53 53 53 53 53 53 53 63631 Customer Choice-Multi-Fam 03 0 0 0 0 0 0 0 0 0 0 0 0 032 Customer Choice-Multi-Fam 04 11 11 11 11 11 11 11 11 11 11 11 11 13233 Total Transportation 32,163 32,334 32,511 32,688 32,861 33,040 33,219 33,400 33,579 33,758 33,943 34,125 397,621
34 Total Fixed Charge Count 165,986 166,022 166,061 166,101 166,137 166,176 166,212 166,249 166,283 166,314 166,350 166,385 1,994,276
35 Total Transportation 32,163 32,334 32,511 32,688 32,861 33,040 33,219 33,400 33,579 33,758 33,943 34,125 397,621
36 Total GCR Sales 133,823 133,688 133,550 133,413 133,276 133,136 132,993 132,849 132,704 132,556 132,407 132,260 1,596,655

Case No.: U-17273Exhibit No.: A-5 (MMD-1)
Schedule: E3Page: 1 of 2
Witness: Matthew M. Dirksen
Michigan Public Service CommissionMichigan Gas Utilities CorporationWeather Normalized StudyVirtual Weather Station Degree DaysComparison of moving average to actuals, calculating the average absolute different, and calculating the standard deviation
30 Year ABS 25 Year ABS 20 Year ABS 15 Year ABS 10 Year ABS 5 Year ABSLine Year Actual Normal Difference Normal Difference Normal Difference Normal Difference Normal Difference Normal Difference
(Col. 1) (Col. 2) (Col. 3) (Col. 4) (Col. 5) (Col. 6) (Col. 7) (Col. 8) (Col. 9) (Col. 10) (Col. 11) (Col. 12) (Col. 13) (Col. 14)1 1993 6,695 6,543 152 6,521 174 6,484 211 6,482 213 6,352 343 6,357 338 2 1994 6,458 6,540 82 6,530 72 6,522 64 6,462 4 6,374 84 6,366 92 3 1995 6,649 6,539 110 6,519 130 6,511 138 6,435 214 6,368 281 6,285 364 4 1996 7,039 6,542 497 6,517 522 6,526 513 6,422 617 6,392 647 6,452 587 5 1997 6,821 6,552 269 6,541 280 6,534 287 6,457 364 6,481 340 6,661 160 6 1998 5,558 6,556 998 6,533 975 6,545 987 6,479 921 6,545 987 6,732 1,174 7 1999 6,007 6,526 519 6,519 512 6,473 466 6,418 411 6,436 429 6,505 498 8 2000 6,284 6,502 218 6,492 208 6,430 146 6,384 100 6,350 66 6,415 131 9 2001 5,773 6,488 715 6,489 716 6,402 629 6,375 602 6,397 624 6,342 569
10 2002 6,317 6,466 149 6,445 128 6,365 48 6,350 33 6,375 58 6,089 228 11 2003 6,654 6,443 211 6,433 221 6,356 298 6,359 295 6,360 294 5,988 666 12 2004 6,156 6,467 311 6,419 263 6,365 209 6,359 203 6,356 200 6,207 51 13 2005 6,243 6,449 206 6,392 149 6,347 104 6,312 69 6,326 83 6,237 6 14 2006 5,691 6,446 755 6,367 676 6,339 648 6,341 650 6,285 594 6,229 538 15 2007 6,062 6,406 344 6,334 272 6,315 253 6,321 259 6,150 88 6,212 150 16 2008 6,553 6,388 165 6,317 236 6,310 243 6,294 259 6,075 478 6,161 392 17 2009 6,415 6,373 42 6,320 95 6,305 110 6,284 131 6,174 241 6,141 274 18 2010 5,910 6,358 448 6,316 406 6,282 372 6,281 371 6,215 305 6,193 283 19 2011 6,185 6,323 413 6,295 385 6,295 385 6,177 267 6,222 312 6,236 326 20 2012 5,370 6,355 170 6,337 152 6,336 151 6,210 25 6,265 80 6,283 98
21 Average of Absolute Difference 339 329 313 300 327 34622 Order (lower # the better) 5 4 2 1 3 6
23 Standard Deviation 253 241 237 241 245 27424 Order (lower # the better) 5 2 1 3 4 6
Notes:The normals for each year have a one year lag. For instance, 2012 normals will run through 2011.

Case No.: U-17273Exhibit No.: A-5 (MMD-1)
Schedule: E3Page: 2 of 2
Witness: Matthew M. Dirksen
Michigan Public Service CommissionMichigan Gas Utilities CorporationWeather Normalized StudyVirtual Weather Station Degree DaysCalculating the square error, mean square error and root mean square error
30 Year Square 25 Year Square 20 Year Square 15 Year Square 10 Year Square 5 Year SquareLine Year Actual Normal Error Normal Error Normal Error Normal Error Normal Error Normal Error
(Col. 1) (Col. 2) (Col. 3) (Col. 4) (Col. 5) (Col. 6) (Col. 7) (Col. 8) (Col. 9) (Col. 10) (Col. 11) (Col. 12) (Col. 13) (Col. 14)1 1993 6,695 6,543 23,104 6,521 30,276 6,484 44,521 6,482 45,369 6,352 117,649 6,357 114,244 2 1994 6,458 6,540 6,724 6,530 5,184 6,522 4,096 6,462 16 6,374 7,056 6,366 8,464 3 1995 6,649 6,539 12,100 6,519 16,900 6,511 19,044 6,435 45,796 6,368 78,961 6,285 132,496 4 1996 7,039 6,542 247,009 6,517 272,484 6,526 263,169 6,422 380,689 6,392 418,609 6,452 344,569 5 1997 6,821 6,552 72,361 6,541 78,400 6,534 82,369 6,457 132,496 6,481 115,600 6,661 25,600 6 1998 5,558 6,556 996,004 6,533 950,625 6,545 974,169 6,479 848,241 6,545 974,169 6,732 1,378,276 7 1999 6,007 6,526 269,361 6,519 262,144 6,473 217,156 6,418 168,921 6,436 184,041 6,505 248,004 8 2000 6,284 6,502 47,524 6,492 43,264 6,430 21,316 6,384 10,000 6,350 4,356 6,415 17,161 9 2001 5,773 6,488 511,225 6,489 512,656 6,402 395,641 6,375 362,404 6,397 389,376 6,342 323,761
10 2002 6,317 6,466 22,201 6,445 16,384 6,365 2,304 6,350 1,089 6,375 3,364 6,089 51,984 11 2003 6,654 6,443 44,521 6,433 48,841 6,356 88,804 6,359 87,025 6,360 86,436 5,988 443,556 12 2004 6,156 6,467 96,721 6,419 69,169 6,365 43,681 6,359 41,209 6,356 40,000 6,207 2,601 13 2005 6,243 6,449 42,436 6,392 22,201 6,347 10,816 6,312 4,761 6,326 6,889 6,237 36 14 2006 5,691 6,446 570,025 6,367 456,976 6,339 419,904 6,341 422,500 6,285 352,836 6,229 289,444 15 2007 6,062 6,406 118,336 6,334 73,984 6,315 64,009 6,321 67,081 6,150 7,744 6,212 22,500 16 2008 6,553 6,388 27,225 6,317 55,696 6,310 59,049 6,294 67,081 6,075 228,484 6,161 153,664 17 2009 6,415 6,373 1,764 6,320 9,025 6,305 12,100 6,284 17,161 6,174 58,081 6,141 75,076 18 2010 5,910 6,358 200,704 6,316 164,836 6,282 138,384 6,281 137,641 6,215 93,025 6,193 80,089 19 2011 6,185 6,323 19,044 6,295 12,056 6,295 11,990 6,177 64 6,222 1,369 6,236 2,601 20 2012 5,370 6,355 970,409 6,337 934,192 6,336 933,890 6,210 705,600 6,265 800,500 6,283 834,121
21 Mean Square Error 214,940 201,765 190,321 177,257 198,427 227,412 22 Root Mean Square Error 463.62 449.18 436.26 421.02 445.45 476.88 23 Order (lower # the better) 5 4 2 1 3 6
Notes:The normals for each year have a one year lag. For instance, 2012 normals will run through 2011.

Case No. U-17273Exhibit No. A-5 (MMD-1)
Schedule: E4Page 1 of 2
Witness: Matthew M. Dirksen
Michigan Gas Utilities CorporationProjected Year Calendar Sales (15 year) in MCFFor the 12 Months Ending, December 31, 2014
Ln Rate Class Jan Feb Mar Apr May Jun Jul Aug Sep Oct Nov Dec Total12 Residential Rate3 Residential General 40,158 33,932 28,707 16,177 8,136 3,990 3,477 3,503 5,021 13,187 22,000 34,930 213,2174 Residential Heating 1,979,093 1,672,275 1,414,738 797,265 400,950 196,642 171,333 172,633 247,450 649,908 1,084,198 1,721,439 10,507,9235 Residential Lighting 33 33 41 25 25 25 25 25 25 25 24 35 3426 Total Residential 2,019,284 1,706,240 1,443,486 813,467 409,111 200,657 174,834 176,161 252,496 663,120 1,106,221 1,756,404 10,721,482789 Multi-Family Rate
10 Meter Class I 3,276 3,126 2,725 1,791 984 754 715 719 797 1,103 1,718 2,499 20,20711 Meter Class II 16,998 14,270 13,303 8,242 4,941 3,907 3,686 3,717 4,468 7,292 10,354 14,777 105,95512 Meter Class III 4,502 4,617 3,139 2,207 1,590 1,025 1,001 1,129 1,237 1,961 3,067 4,462 29,93613 Meter Class IV 7,449 6,258 5,040 3,276 2,206 1,249 1,041 900 1,178 2,996 4,639 7,165 43,39514 Total Multi-Family 32,225 28,271 24,207 15,516 9,721 6,935 6,443 6,465 7,679 13,352 19,777 28,903 199,49415161718 C&I General Service Rate19 Small General Service 567,637 479,831 406,102 230,292 117,739 59,743 52,517 52,836 73,950 187,677 310,375 490,684 3,029,38320 Large General Service 55,125 46,244 41,038 26,031 14,088 8,881 8,575 7,963 10,719 18,681 26,654 41,927 305,92421 Commercial Lighting 105 105 130 81 81 82 82 82 81 81 77 111 1,0962223 Special Contracts 0 0 0 0 0 0 0 0 0 0 296 30 32624 Total C&I General Service 622,867 526,180 447,270 256,404 131,907 68,706 61,174 60,880 84,749 206,439 337,402 532,752 3,336,72925272829 Transportation Rate TR-1 251,753 225,446 177,321 152,399 106,954 89,303 82,705 92,350 99,027 152,847 175,161 215,898 1,821,16530 Additional Meters TR-1 03132 Transportation Rate TR-2 432,164 384,466 355,930 305,998 280,314 259,068 262,659 263,798 251,880 291,190 324,706 372,370 3,883,38133 Additional Meters TR-2 03435 Transportation Rate TR-3 351,444 342,256 304,259 342,500 301,703 267,523 259,462 308,075 296,815 309,638 323,300 333,632 3,740,60736 Additional Meters TR-3 03738 Remote Meter Reading Charge 0 0 0 0 0 0 0 0 0 0 0 0 039 Administrative Charge 0 0 0 0 0 0 0 0 0 0 0 0 04041 Transport Aggregated-Residential 1,251 1,086 636 563 241 96 74 69 156 362 657 915 6,10642 Transport Aggregated-Small C&I 175,373 169,440 136,229 97,784 74,606 45,845 43,213 51,076 45,057 63,043 345,987 143,474 1,391,12743 Transport Aggregated-Large C&I 3,754 6,486 5,500 2,464 1,632 136 57 32 117 737 2,328 4,522 27,764444546 Customer Choice-Residential 423,419 360,408 307,148 174,364 88,335 43,643 38,307 38,883 56,148 148,565 249,686 399,395 2,328,30147 Customer Choice-Multifamily 1 442 399 258 176 88 87 70 56 144 249 317 551 2,83648 Customer Choice-Multifamily II 1,315 1,254 1,061 672 507 407 306 307 483 894 906 1,813 9,92449 Customer Choice-Multifamily IV 7,498 6,465 5,628 3,605 2,194 1,496 1,472 1,490 1,573 2,682 4,440 5,909 44,45050 Customer Choice-Small C&I 369,954 313,513 266,006 151,228 77,515 39,436 34,757 35,062 49,210 125,236 207,686 329,247 1,998,85051 Customer Choice-Large C&I 0 0 0 0 0 0 0 0 0 0 0 0 052 Total Transportation 2,018,368 1,811,218 1,559,977 1,231,752 934,089 747,039 723,081 791,198 800,609 1,095,441 1,635,172 1,807,725 15,254,5095354 Total Calendar Sales 4,692,744 4,071,909 3,474,939 2,317,139 1,484,829 1,023,337 965,532 1,034,705 1,145,534 1,978,352 3,098,572 4,125,783 29,512,2145556 Total Transportation @ Customer Meter 2,018,368 1,811,218 1,559,977 1,231,752 934,089 747,039 723,081 791,198 800,609 1,095,441 1,635,172 1,807,725 15,254,5095758 Total GCR Sales @ Customer Meter 2,674,376 2,260,691 1,914,963 1,085,387 550,739 276,298 242,451 243,506 344,925 882,911 1,463,400 2,318,058 14,257,704

Case No. U-17273Exhibit No. A-5 (MMD-1)
Schedule: E4Page 2 of 2
Witness: Matthew M. Dirksen
Michigan Gas Utilities CorporationProjected Year Calendar Sales Difference between the 15 year and the 30 year Forecasts
For the 12 Months Ending, December 31, 2014Ln Rate Class Jan Feb Mar Apr May Jun Jul Aug Sep Oct Nov Dec Total12 Residential Rate3 Residential General (663) (1,274) (437) (728) 257 49 (2) (14) (297) (163) (1,374) (845) (5,490)4 Residential Heating (32,662) (62,772) (21,533) (35,874) 12,685 2,427 (109) (670) (14,639) (8,008) (67,722) (41,655) (270,533)5 Residential Lighting 3 3 (1) 1 1 (5) (5) (10) (14) (25) (12) 4 (62)6 Total Residential (33,322) (64,043) (21,971) (36,602) 12,943 2,471 (116) (694) (14,950) (8,196) (69,108) (42,496) (276,085)789 Multi-Family Rate
10 Meter Class I (231) (204) (168) (100) 14 43 22 21 7 (38) (146) (187) (968)11 Meter Class II (1,197) (933) (821) (460) 70 221 113 108 41 (252) (882) (1,105) (5,098)12 Meter Class III (317) (302) (194) (123) 22 58 31 33 11 (68) (261) (334) (1,444)13 Meter Class IV (525) (409) (311) (183) 31 71 32 26 11 (103) (395) (536) (2,292)14 Total Multi-Family (2,270) (1,848) (1,493) (865) 137 392 197 187 70 (461) (1,685) (2,162) (9,801)15161718 C&I General Service Rate19 Small General Service (12,873) (20,748) (8,271) (10,874) 3,932 1,472 805 639 (3,521) (2,564) (20,608) (14,748) (87,359)20 Large General Service (0) 0 0 0 (0) (0) 0 0 0 0 0 0 021 Commercial Lighting 8 8 (5) 1 1 (15) (15) (33) (45) (81) (38) 12 (201)2223 Special Contracts 0 0 0 0 0 0 0 0 0 0 0 0 024 Total C&I General Service (12,865) (20,740) (8,276) (10,872) 3,933 1,457 790 606 (3,566) (2,645) (20,646) (14,736) (87,560)2526 Transportation Service Rate27 Transportation Rate TR-1 0 0 0 0 0 0 0 0 0 0 0 0 028 Additional Meters TR-1 02930 Transportation Rate TR-2 0 0 0 0 0 0 0 0 0 0 0 0 031 Additional Meters TR-23233 Transportation Rate TR-3 0 0 0 0 0 0 0 0 0 0 0 0 034 Additional Meters TR-33536 Remote Meter Reading Charge 0 0 0 0 0 0 0 0 0 0 0 0 037 Administrative Charge 0 0 0 0 0 0 0 0 0 0 0 0 03839 Transport Aggregated-Residential 0 0 0 0 0 0 0 0 0 0 0 0 040 Transport Aggregated-Small C&I 0 0 0 0 0 0 0 0 0 0 0 0 041 Transport Aggregated-Large C&I 0 0 0 0 0 0 0 0 0 0 0 0 0424344 Customer Choice-Residential (6,777) (13,345) (4,522) (7,756) 2,837 560 (5) (132) (3,292) (1,756) (15,464) (9,461) (59,114)45 Customer Choice-Multifamily 1 (31) (26) (16) (10) 1 5 2 2 1 (9) (27) (41) (149)46 Customer Choice-Multifamily II (93) (82) (66) (38) 7 23 9 9 4 (31) (77) (136) (469)47 Customer Choice-Multifamily IV (527) (423) (348) (202) 31 84 45 44 14 (93) (379) (442) (2,195)48 Customer Choice-Small C&I (8,389) (13,557) (5,418) (7,142) 2,590 972 532 424 (2,342) (1,711) (13,790) (9,896) (57,727)49 Customer Choice-Large C&I 0 0 0 0 0 0 0 0 0 0 0 0 050 Total Transportation (15,817) (27,433) (10,369) (15,147) 5,466 1,644 584 346 (5,614) (3,600) (29,737) (19,976) (119,653)5152 Total Calendar Sales (64,274) (114,064) (42,109) (63,486) 22,479 5,964 1,455 445 (24,060) (14,902) (121,176) (79,370) (493,099)5354 Total Transportation @ Customer Meter (15,817) (27,433) (10,369) (15,147) 5,466 1,644 584 346 (5,614) (3,600) (29,737) (19,976) (119,653)5556 Total GCR Sales @ Customer Meter (48,457) (86,631) (31,740) (48,339) 17,013 4,320 871 99 (18,446) (11,302) (91,439) (59,394) (373,446)

Case No.: U-17273Exhibit No.: A-5 (MMD-1)
Schedule E5Page: 1 of 1
Witness: Matthew M. Dirksen
Michigan Public Service CommissionMichigan Gas Utilities CorporationChange in Revenues from 30 to 15 year forecastCompare MGUC Distribution Volumetric RatesIn dollars
30 Year Average Weather Forecasted Distribution Volumetric ChargesLine Rate Class Tariff Rate per MCF Jan-14 Feb-14 Mar-14 Apr-14 May-14 Jun-14 Jul-14 Aug-14 Sep-14 Oct-14 Nov-14 Dec-14 Yearly Total
1 Residential GCR $1.5987 $3,281,453 $2,830,103 $2,342,759 $1,358,965 $633,315 $316,792 $279,645 $282,682 $427,504 $1,073,153 $1,878,941 $2,875,852 $17,581,1642 Multiple Family GCR I II $1.1929 $25,889 $22,108 $20,299 $12,635 $6,969 $5,246 $5,090 $5,138 $6,223 $10,360 $15,627 $22,150 $157,7353 Multiple Family GCR III IV $1.0629 $13,597 $12,314 $9,229 $6,153 $3,978 $2,280 $2,104 $2,094 $2,542 $5,451 $8,888 $13,283 $81,9144 Small General Services GCR $1.1876 $689,414 $594,488 $492,109 $286,409 $135,157 $69,203 $61,413 $61,989 $92,005 $225,930 $393,075 $600,251 $3,701,4435 Residential GCC $1.5987 $687,755 $597,519 $498,267 $291,155 $136,686 $68,877 $61,249 $62,373 $95,027 $240,318 $423,895 $653,638 $3,816,7596 Small General Services GCC $1.1876 $449,320 $388,428 $322,343 $188,080 $88,981 $45,680 $40,646 $41,136 $61,223 $150,762 $263,025 $402,766 $2,442,3917 Multiple Family GCC I II $1.1929 $2,244 $2,100 $1,671 $1,067 $700 $556 $434 $420 $741 $1,410 $1,583 $3,031 $15,9578 Multiple Family GCC III IV $1.0629 $8,530 $7,321 $6,352 $4,046 $2,300 $1,500 $1,516 $1,538 $1,657 $2,949 $5,121 $6,750 $49,579
9Total 30 Year Average Weather Forecasted Distribution Volumetric Charges $5,158,201 $4,454,380 $3,693,029 $2,148,510 $1,008,085 $510,133 $452,097 $457,370 $686,921 $1,710,334 $2,990,155 $4,577,722 $27,846,942
10 15 Year Average Weather Forecasted Distribution Volumetric Charges11 Rate Class Tariff Rate per MCF Jan-14 Feb-14 Mar-14 Apr-14 May-14 Jun-14 Jul-14 Aug-14 Sep-14 Oct-14 Nov-14 Dec-14 Yearly Total12 Residential GCR $1.5987 $3,228,177 $2,727,713 $2,307,636 $1,300,450 $654,006 $320,750 $279,467 $281,589 $403,625 $1,060,090 $1,768,477 $2,807,907 $17,139,88713 Multiple Family GCR I II $1.1929 $24,185 $20,752 $19,120 $11,968 $7,068 $5,560 $5,251 $5,292 $6,280 $10,014 $14,400 $20,608 $150,49914 Multiple Family GCR III IV $1.0629 $12,702 $11,559 $8,693 $5,828 $4,035 $2,417 $2,170 $2,157 $2,566 $5,269 $8,190 $12,358 $77,94415 Small General Services GCR $1.1876 $674,126 $569,847 $482,287 $273,495 $139,827 $70,951 $62,369 $62,748 $87,823 $222,885 $368,601 $582,736 $3,597,69516 Residential GCC $1.5987 $676,920 $576,184 $491,038 $278,756 $141,221 $69,772 $61,242 $62,162 $89,763 $237,511 $399,173 $638,513 $3,722,25417 Small General Services GCC $1.1876 $439,357 $372,328 $315,909 $179,598 $92,057 $46,834 $41,277 $41,640 $58,442 $148,730 $246,648 $391,014 $2,373,83418 Multiple Family GCC I II $1.1929 $2,096 $1,971 $1,574 $1,011 $710 $589 $448 $433 $748 $1,363 $1,458 $2,820 $15,22019 Multiple Family GCC III IV $1.0629 $7,969 $6,871 $5,982 $3,832 $2,332 $1,590 $1,564 $1,584 $1,672 $2,850 $4,719 $6,280 $47,246
20Total 15 Year Average Weather Forecasted Distribution Volumetric Charges $5,065,532 $4,287,226 $3,632,239 $2,054,937 $1,041,256 $518,462 $453,788 $457,605 $650,919 $1,688,712 $2,811,666 $4,462,237 $27,124,579
21 Difference in Charges (15 Year Forecasted Distribution Volumetric Charges - 30 Year Forecasted Distribution Volumetric Charges)22 Rate Class Jan-14 Feb-14 Mar-14 Apr-14 May-14 Jun-14 Jul-14 Aug-14 Sep-14 Oct-14 Nov-14 Dec-14 Yearly Total23 Residential GCR ($53,276) ($102,390) ($35,123) ($58,515) $20,691 $3,958 ($178) ($1,093) ($23,879) ($13,063) ($110,464) ($67,945) ($441,277)24 Multiple Family GCR I II ($1,704) ($1,356) ($1,179) ($667) $99 $314 $161 $154 $57 ($346) ($1,227) ($1,542) ($7,236)25 Multiple Family GCR III IV ($895) ($755) ($536) ($325) $57 $137 $66 $63 $24 ($182) ($698) ($925) ($3,970)26 Small General Services GCR ($15,288) ($24,640) ($9,823) ($12,914) $4,670 $1,748 $956 $759 ($4,182) ($3,045) ($24,474) ($17,515) ($103,748)27 Residential GCC ($10,835) ($21,335) ($7,229) ($12,399) $4,535 $895 ($7) ($211) ($5,264) ($2,807) ($24,722) ($15,125) ($94,505)28 Small General Services GCC ($9,963) ($16,100) ($6,434) ($8,482) $3,076 $1,154 $631 $504 ($2,781) ($2,032) ($16,377) ($11,752) ($68,557)29 Multiple Family GCC I II ($148) ($129) ($97) ($56) $10 $33 $14 $13 $7 ($47) ($124) ($211) ($737)30 Multiple Family GCC III IV ($561) ($450) ($369) ($214) $33 $90 $48 $46 $15 ($99) ($403) ($470) ($2,333)
31Total Difference in Charges 15 Year vs. 30 Year Forecasted Distribution Volumetric Charges ($92,669) ($167,155) ($60,790) ($93,573) $33,170 $8,329 $1,691 $235 ($36,003) ($21,622) ($178,489) ($115,485) ($722,363)
32 Percent Difference33 Rate Class Jan-14 Feb-14 Mar-14 Apr-14 May-14 Jun-14 Jul-14 Aug-14 Sep-14 Oct-14 Nov-14 Dec-14 Yearly Total34 Residential GCR -1.62% -3.62% -1.50% -4.31% 3.27% 1.25% -0.06% -0.39% -5.59% -1.22% -5.88% -2.36% -2.51%35 Multiple Family GCR I II -6.58% -6.13% -5.81% -5.28% 1.42% 5.99% 3.16% 3.00% 0.92% -3.34% -7.85% -6.96% -4.59%36 Multiple Family GCR III IV -6.58% -6.13% -5.81% -5.28% 1.43% 6.01% 3.14% 3.01% 0.94% -3.34% -7.85% -6.96% -4.85%37 Small General Services GCR -2.22% -4.14% -2.00% -4.51% 3.45% 2.53% 1.56% 1.22% -4.54% -1.35% -6.23% -2.92% -2.80%38 Residential GCC -1.58% -3.57% -1.45% -4.26% 3.32% 1.30% -0.01% -0.34% -5.54% -1.17% -5.83% -2.31% -2.48%39 Small General Services GCC -2.22% -4.14% -2.00% -4.51% 3.46% 2.53% 1.55% 1.23% -4.54% -1.35% -6.23% -2.92% -2.81%40 Multiple Family GCC I II -6.58% -6.14% -5.81% -5.29% 1.43% 5.97% 3.19% 2.98% 0.92% -3.37% -7.86% -6.96% -4.62%41 Multiple Family GCC III IV -6.57% -6.14% -5.82% -5.30% 1.42% 5.97% 3.18% 3.01% 0.92% -3.36% -7.86% -6.96% -4.71%42 Total Percent Difference -1.80% -3.75% -1.65% -4.36% 3.29% 1.63% 0.37% 0.05% -5.24% -1.26% -5.97% -2.52% -2.59%

Case No.: U-17273Exhibit No.: A-15 (MMD-2)
Schedule: E1.1Page: 1 of 1
Witness: Matthew M. DirksenMichigan Gas Utilities Corporation
Historical Year Calendar Sales in MCFCalendar Sales in MCF For the 12 Months Ended, December 31, 2012
Ln Rate Class Jan Feb Mar Apr May Jun Jul Aug Sep Oct Nov Dec Total
Residential Rate1 Residential General 38,250 31,464 15,386 14,095 7,829 4,053 4,213 4,455 4,314 12,223 21,875 30,201 188,3582 Residential Heating 1,868,538 1,500,535 807,550 698,230 373,495 191,419 174,978 184,132 210,868 641,308 1,166,820 1,403,154 9,221,0253 Residential Lighting 24 27 19 37 23 32 34 32 31 42 29 19 3444 Total Residential 1,906,812 1,532,025 822,954 712,362 381,347 195,504 179,225 188,618 215,213 653,573 1,188,723 1,433,373 9,409,728
Multiple Family Rate5 Meter Class I 2,567 2,087 1,150 1,342 805 555 469 490 551 1,354 1,813 1,885 15,0676 Meter Class II 14,379 11,597 6,511 8,121 4,482 3,107 2,389 2,358 3,094 8,724 10,442 10,887 86,0907 Meter Class III 4,168 3,141 1,377 1,423 894 553 381 495 477 2,211 2,479 2,907 20,5068 Meter Class IV 6,706 4,993 2,889 3,139 1,931 881 538 634 766 3,830 4,952 5,560 36,8199 Total Multi-Family 27,820 21,818 11,926 14,024 8,111 5,096 3,777 3,977 4,889 16,119 19,686 21,239 158,482
C&I General Service Rate10 Small General Service 440,466 380,430 180,498 163,861 74,996 51,072 49,209 51,482 57,749 152,807 283,155 335,325 2,221,05011 Large General Service 44,923 123,409 7,450 36,566 1,172 9,234 2,405 4,015 5,115 13,716 19,189 29,052 296,24512 Commercial Lighting 74 85 59 116 72 103 107 102 99 133 93 59 1,098
13 Special Contracts 0 0 0 0 0 0 0 0 0 0 255 0 25514 Total C&I General Service 485,463 503,923 188,007 200,543 76,239 60,409 51,721 55,599 62,962 166,655 302,692 364,435 2,518,647
Transportation Service Rate15 Transportation Rate TR-1 232,632 224,370 193,777 159,868 134,461 101,402 93,062 80,137 98,172 126,759 165,476 179,215 1,789,33116 Additional Meters TR-1 0 0 0 0 0 0 0 0 0 0 0 0 0
17 Transportation Rate TR-2 381,809 369,358 299,069 306,553 290,215 283,544 309,657 319,076 288,107 328,329 340,210 358,860 3,874,78718 Additional Meters TR-2 0 0 0 0 0 0 0 0 0 0 0 0 0
19 Transportation Rate TR-3 353,279 323,088 285,704 283,854 298,920 263,725 264,144 249,095 289,122 340,832 308,970 275,696 3,536,42920 Additional Meters TR-3 0 0 0 0 0 0 0 0 0 0 0 0 0
21 Remote Meter Reading Charge 0 0 0 0 0 0 0 0 0 0 0 0 022 Administrative Charge 0 0 0 0 0 0 0 0 0 0 0 0 0
23 Transport Aggregated-Residential 939 1,296 643 528 395 123 36 69 102 242 772 1,092 6,23724 Transport Aggregated-Small C&I 128,563 133,984 89,876 128,084 26,157 50,784 19,323 21,305 27,996 41,173 70,094 132,271 869,61025 Transport Aggregated-Large C&I 5,714 2,885 6,007 6,588 123 1,511 -571 12 -12 180 667 3,064 26,168
26 Customer Choice-Residential 370,123 304,291 159,713 149,728 82,753 39,597 36,043 40,188 45,672 148,776 260,583 340,353 1,977,82127 Customer Choice-Small C&I 402,274 357,774 192,073 167,681 88,800 68,442 57,408 69,765 68,322 200,536 309,058 310,232 2,292,36628 Customer Choice-Large C&I 0 0 0 0 0 0 0 0 0 0 0 0 0
29 Customer Choice-Multi-Fam 01 337 231 141 204 85 -159 17 21 16 73 179 347 1,49130 Customer Choice-Multi-Fam 02 864 839 428 650 278 -323 104 137 71 262 344 566 4,22031 Customer Choice-Multi-Fam 03 0 0 568 965 475 0 0 0 0 0 0 0 2,00732 Customer Choice-Multi-Fam 04 3,099 1,984 691 1,276 455 -28 8 8 8 29 22 58 7,60933 Total Transportation 1,879,633 1,720,099 1,228,690 1,205,979 923,116 808,619 779,232 779,813 817,576 1,187,191 1,456,375 1,601,755 14,388,076
34 Total Calendar Sales 4,299,728 3,777,866 2,251,577 2,132,908 1,388,814 1,069,627 1,013,954 1,028,006 1,100,639 2,023,538 2,967,476 3,420,803 26,474,933
35 Total Transportation @ Customer Meter 1,879,633 1,720,099 1,228,690 1,205,979 923,116 808,619 779,232 779,813 817,576 1,187,191 1,456,375 1,601,755 14,388,078
36 Total GCR Sales @ Customer Meter 2,420,094 2,057,767 1,022,887 926,929 465,697 261,008 234,722 248,194 283,064 836,347 1,511,101 1,819,048 12,086,857

Case No.: U-17273Exhibit No.: A-15 (MMD-2)
Schedule: E2Page: 1 of 1
Witness: Matthew M. Dirksen
Michigan Gas Utilities CorporationHistorical Year Fixed Charge Count
For the 12 Months Ended, December 31, 2012
Ln Rate Class Jan Feb Mar Apr May Jun Jul Aug Sep Oct Nov Dec Total
Residential Rate1 Residential General 3,238 3,200 3,212 3,184 3,175 3,194 3,196 3,074 3,105 3,142 3,162 3,085 37,9672 Residential Heating 127,875 125,711 126,289 125,704 125,062 125,592 125,170 122,939 123,503 124,083 124,509 124,130 1,500,5673 Residential Lighting 0 0 0 0 0 0 0 0 0 0 0 0 04 Total Residential 131,113 128,911 129,501 128,888 128,237 128,786 128,366 126,013 126,608 127,225 127,671 127,215 1,538,534
Multiple Family Rate5 Meter Class I 122 121 121 120 123 121 121 117 119 120 119 117 1,4416 Meter Class II 206 203 204 198 199 199 199 198 199 197 195 196 2,3937 Meter Class III 17 17 13 13 13 13 13 13 13 15 15 15 1708 Meter Class IV 12 11 11 11 11 11 11 11 11 11 11 11 1339 Total Multi-Family 357 352 349 342 346 344 344 339 342 343 340 339 4,137
C&I General Service Rate10 Small General Service 8,396 8,248 8,254 8,102 7,969 7,942 7,861 7,644 7,674 7,733 8,000 8,132 95,95511 Large General Service 25 26 67 52 30 21 20 19 19 20 18 20 33712 Commercial Lighting 0 0 0 0 0 0 0 0 0 0 0 0 0
13 Special Contracts 1 1 1 1 1 1 1 1 1 1 1 1 1214 Total C&I General Service 8,422 8,275 8,322 8,155 8,000 7,964 7,882 7,664 7,694 7,754 8,019 8,153 96,304
Transportation Service Rate15 Transportation Rate TR-1 108 109 111 111 112 113 113 112 112 113 113 111 1,33816 Additional Meters TR-1 0 0 0 0 0 0 0 0 0 0 0 0 0
17 Transportation Rate TR-2 38 38 37 37 38 38 39 40 40 40 40 35 46018 Additional Meters TR-2 0 0 0 0 0 0 0 0 0 0 0 0 0
19 Transportation Rate TR-3 6 6 6 6 6 6 6 6 6 6 6 6 7220 Additional Meters TR-3 0 0 0 0 0 0 0 0 0 0 0 0 0
21 Remote Meter Reading Charge 0 0 0 0 0 0 0 0 0 0 0 0 022 Administrative Charge 0 0 0 0 0 0 0 0 0 0 0 0 0
23 Transport Aggregated-Residential 35 40 35 35 35 34 34 34 34 34 34 34 41824 Transport Aggregated-Small C&I 456 460 467 468 469 495 489 495 497 496 497 497 5,78625 Transport Aggregated-Large C&I 3 2 3 3 3 3 3 3 3 3 3 3 35
26 Customer Choice-Residential 22,672 22,673 22,991 23,373 23,399 23,566 23,602 23,386 23,890 23,919 23,948 25,942 283,36127 Customer Choice-Small C&I 4,846 4,831 4,866 4,894 4,940 4,957 4,939 4,881 4,909 4,918 4,923 4,878 58,78228 Customer Choice-Large C&I 0 0 0 0 0 0 0 0 0 0 0 0 0
29 Customer Choice-Multi-Fam 01 11 11 11 13 13 12 7 7 7 7 14 24 13730 Customer Choice-Multi-Fam 02 15 15 16 17 16 11 9 9 9 9 9 11 14631 Customer Choice-Multi-Fam 03 0 0 4 4 4 0 0 0 0 0 0 0 1232 Customer Choice-Multi-Fam 04 3 3 2 2 2 0 0 0 0 0 487 -487 1233 Total Transportation 28,193 28,188 28,549 28,963 29,037 29,235 29,241 28,973 29,507 29,545 30,074 31,054 350,559
34 Total Fixed Charge Count 168,085 165,726 166,721 166,348 165,620 166,329 165,833 162,989 164,151 164,867 166,104 166,761 1,989,534
35 Total Transportation 28,193 28,188 28,549 28,963 29,037 29,235 29,241 28,973 29,507 29,545 30,074 31,054 350,559
36 Total GCR Sales 139,892 137,538 138,172 137,385 136,583 137,094 136,592 134,016 134,644 135,322 136,030 135,707 1,638,975

STATE OF MICHIGAN
BEFORE THE MICHIGAN PUBLIC SERVICE COMMISSION
* * * * * In the matter of the application of ) MICHIGAN GAS UTILITIES CORPORATION ) for authority to increase retail natural gas rates. ) Case No. U-17273 )
DIRECT TESTIMONY AND EXHIBIT OF
CHRISTINE M. PHILLIPS, CPA
FOR
MICHIGAN GAS UTILITIES CORPORATION
June 7, 2013

- 1 -
STATE OF MICHIGAN
BEFORE THE MICHIGAN PUBLIC SERVICE COMMISSION
* * * * *
In the matter of the application of ) MICHIGAN GAS UTILITIES CORPORATION ) for authority to increase retail natural gas rates. ) Case No. U-17273 )
QUALIFICATIONS OF
CHRISTINE M. PHILLIPS, CPA PART I
Q. Please state your name, position and business address. 1
A. My name is Christine M. Phillips. My business address is Integrys Business Support 2
(“IBS”), 130 East Randolph Drive, Chicago, Illinois 60601. I am Manager - Benefits 3
Accounting in the Benefits Accounting Department of Integrys Energy Group, Inc. 4
(“Integrys”). Both IBS and Michigan Gas Utilities Corporation (“MGUC”) are wholly-5
owned subsidiaries of Integrys. 6
7
Q. For whom are you providing testimony? 8
A. I am providing testimony on behalf of MGUC. 9
10
Q. Please describe briefly your educational, professional, and utility background. 11
A. I have a Bachelor of Science Degree from Illinois Wesleyan University with a major 12
in Accounting. I am registered in the State of Illinois as a Certified Public Accountant 13
(“CPA”) and have been employed by IBS or its predecessors since May of 1990. In 14
my current position in the Benefits Accounting Department, my primary duties 15
include the accounting for the costs of the employee benefit plans, coordinating the 16
forecasting done by the actuaries, and ensuring accounting and legal compliance of 17
the employee benefit plans and trusts for Integrys and its subsidiaries, including 18

- 2 -
MGUC. 1
2
Q. Have you previously testified before any regulatory agency? 3
A. Yes, I have. I have testified before the Illinois Commerce Commission on behalf of 4
The Peoples Gas Light and Coke Company, and North Shore Gas Company in 5
Docket Nos. 09-0240/0241, 11-0280/0281 and 12-0511/0512. I have submitted 6
testimony before the Michigan Public Service Commission on behalf of MGUC in 7
Case U-15990, and on behalf of Upper Peninsula Power Company in Case Nos. U-8
15988, U-16166 and U-16167. I have also submitted testimony before the Public 9
Service Commission of Wisconsin in Docket Nos. 6690-UR-119, 6690-UR-120 and 10
6690-UR-121.11

- 3 -
CHRISTINE M. PHILLIPS, CPA DIRECT TESTIMONY
PART II
Q. What is the purpose of your pre-filed direct testimony? 1
A. The purpose of my pre-filed direct testimony is to explain the methodologies used to 2
determine MGUC’s forecast of 2014 employee benefit costs. 3
4
Q. Are you sponsoring any exhibits in this proceeding? 5
A. Yes, I am. I am sponsoring Exhibit A-3 (CMP-1), Schedules C34 and C35. 6
7
Q. Were Schedules C34 and C35 of Exhibit A-3 (CMP-1) prepared by you or under 8
your direction and supervision? 9
A. Yes, they were. 10
11
Q. Please describe Exhibit A-3 (CMP-1), Schedule C34. 12
A. Exhibit A-3 (CMP-1), Schedule C34 is a summary, by sub-account, of employee 13
benefit costs for MGUC employees for the 2012 historic year, and the 2014 projected 14
year, inclusive of MGUC’s allocation of employee benefit costs from IBS. 15
16
Q. Please describe Exhibit A-3 (CMP-1), Schedule C35. 17
A. Exhibit A-3 (CMP-1), Schedule C35 is a summary, by sub-account, of IBS employee 18
benefit costs for the 2012 historic year, and the 2014 projected year. This exhibit 19
also calculates MGUC’s allocation of employee benefit costs from IBS. 20
21
Q. What is the current forecast of employee benefit costs for MGUC for 2014? 22
A. The current forecast of employee benefit costs for MGUC, on a corporate basis, for 23
the 2014 projected year is $4,415,106 inclusive of MGUC’s allocation of employee 24

- 4 -
benefit costs from IBS. This compares to $4,778,672 for the 2012 historic year, on a 1
corporate basis. This is a decrease of $363,566 over a two-year period, or 7.6%. 2
This 7.6% decrease over two years corresponds to a decrease of 3.73% per year. 3
4
Forecasting Methodologies 5 Q. How was the forecast of employee benefit costs for MGUC for 2014 6
developed? 7
A. As shown on Exhibit A-3 (CMP-1), Schedule C34, MGUC divided the forecast of 8
employee benefit costs into three categories. These categories were: 9
1. Forecasted 2014 costs that were determined by MGUC estimates, 10 11 2. Forecasted 2014 costs that were determined by inflating 2012 actual 12
costs, and 13 14 3. Forecasted 2014 costs that were determined through actuarial analysis. 15
16
Employee Benefit Costs that were Estimated by MGUC 17 Q. Please describe the process used to determine the forecasted 2014 employee 18
benefit costs that were determined by MGUC estimates. 19
A. There are six. The total impact of these three items is a net increase of $543,943 20
from 2012 to 2014. 21
22
First, as shown on Exhibit A-3 (CMP-1), Schedule C34, line 1, regarding the costs 23
recorded in Account 926080 A&G Dental Benefits, MGUC estimates the 2014 costs 24
to be $117,955. The overall increase in 2014 costs as compared to 2012 costs is 25
$13,313. Projected dental costs were calculated by using a 5% annual inflation rate 26
for 2013 and a 4% annual inflation rate for 2014 based on preliminary renewal 27
results and trend information received from MGUC’s independent actuary, Towers 28
Watson (“Towers”). 29
30

- 5 -
Second, as shown on Exhibit A-3 (CMP-1), Schedule C34, line 2, regarding the costs 1
recorded in Account 926090 A&G Medical Benefits, MGUC estimates the 2014 costs 2
to be $1,420,500. The overall increase in 2014 costs as compared to 2012 costs is 3
$229,708. Projected medical costs for 2014 were calculated by using a 7.5% annual 4
inflation rate based on preliminary renewal results and trend information received 5
from MGUC’s actuary, Towers. 6
7
Third, as shown on Exhibit A-3 (CMP-1), Schedule C34, line 3, regarding the costs 8
recorded in Account 926190 Goal Sharing, MGUC estimates the 2014 costs to be 9
$0. 10
11
Fourth, as shown on Exhibit A-3 (CMP-1), Schedule C34, line 4, regarding the costs 12
recorded in Account 926255 Defined Contribution Plan Expense, MGUC estimates 13
the 2014 costs to be $290,086. The overall increase in 2014 as compared to 2012 14
costs is $272,803. The increase is a result of changes to the pension plan benefit 15
design for administrative employees made in 2007 and effective January 1, 2008. 16
Administrative employees hired after January 1, 2008 are not eligible for pension 17
benefits. Instead, they receive an annual contribution to the defined contribution 18
plan. Effective January 1, 2013, all administrative employees will receive this annual 19
contribution as the freeze for service credits on the defined benefit pension plan 20
commences. The projected costs for administrative employees were based on the 21
amount of the benefit if all administrative employees would have received this benefit 22
in 2011 and inflated with a general wage increase to 2014. Union employees of 23
Local 12295 of the United Steelworkers Union hired on or after January 16, 2010 and 24
union employees of Local 417 Utility Workers Union of America hired on or after 25
February 16, 2012 are not eligible for pension benefits. Instead, these union 26
employees receive an annual contribution to the defined contribution plan. The 27

- 6 -
projected costs for union employees were based on 12% of the 2014 union payroll 1
with a 5% contribution. 2
3
Fifth, as shown on Exhibit A-3 (CMP-1), Schedule C34, line 5, regarding the costs 4
recorded in Account 926510 Legacy Aquila Defined Contribution Expense, MGUC 5
estimates the 2014 costs to be $0. The overall decrease in 2014 costs as compared 6
to 2012 costs is $40,584. As of December 31, 2012, this legacy Aquila defined 7
contribution benefit ended for all of MGUC employees. 8
9
Lastly, as shown on Exhibit A-3 (CMP-1), Schedule C34, line 6, regarding the costs 10
recorded in Account 926300 IBS Billed Benefits, MGUC estimates the 2014 costs to 11
be $1,046,464. The overall increase in 2014 costs as compared to 2012 costs is 12
$440. The primary driver behind holding costs about the same for the 2014 test year 13
and 2012 is a result of changes to the pension plan benefit design for administrative 14
employees made in 2007 and effective January 1, 2008. Administrative employees 15
hired after January 1, 2008 are not eligible for pension benefits. Instead, they 16
receive an annual contribution to the defined contribution plan. Effective January 1, 17
2013, all administrative employees will receive this annual contribution as the freeze 18
for service credits on the defined benefit pension plan commences. 19
20
Q. How were IBS employee benefit cost projections calculated? 21
A. IBS employee benefits cost projections relied on the same assumptions, actuarial 22
analyses, and methodologies used for MGUC employee benefit costs, as described 23
in this testimony. 24
25
Detail regarding the IBS employee benefits costs is shown on Exhibit A-3 (CMP-1), 26
Schedule C35, line 34. 27

- 7 -
Employee Benefit Costs that were Determined by Inflating 2012 Actual Costs 1 Q. Please describe the process used to determine the forecasted 2014 employee 2
benefit costs that were determined by inflation. 3
A. As shown on Exhibit A-3 (CMP-1), Schedule C34, for the sub-accounts shown on 4
lines 10 through 24, MGUC inflated 2012 actual costs by the inflation factors 5
developed by MGUC witness Ms. Katherine A. De Cramer, CPA in her Exhibit A-7 6
(KAD-4). The overall decrease in costs forecasted by inflating 2012 costs to 2014 7
was $30,624, or 3.7%. This 3.7% decrease over two years corresponds to 1.83% 8
per year. 9
10
Employee Benefit Costs that were Determined by Actuarial Analysis 11 Q. Please describe the process used to determine the forecasted 2014 employee 12
benefit costs that were determined by actuarial analysis. 13
A. As shown on Exhibit A-3 (CMP-1), Schedule C34, for five sub-accounts, MGUC 14
relied on an actuarial analysis to determine forecasted 2014 employee benefit costs. 15
The specific methods and assumptions employed are described below. The overall 16
decrease in costs from 2012 to 2014 forecasted by actuarial analysis is $876,885, or 17
a decrease of 26.8%. This 26.8% decrease over two years corresponds to 14.44% 18
per year. 19
20
The 2014 employee benefit costs that were determined by actuarial analysis are 21
related to: 22
1. Pension, 23
2. Post Retirement Medical, 24
3. Pension Restoration, 25
4. Supplemental Pension, and 26
5. Post Retirement Life. 27
28

- 8 -
Employee Pension Expense 1 Q. Please describe the development of the pension expense shown on line 27 of 2
Exhibit A-3 (CMP-1), Schedule C34. 3
A. Pension expense is determined using actuarial analysis, which is performed in 4
accordance with Financial Accounting Standards Board (“FASB”) Accounting 5
Standards Codification (“ASC”) 715-30, Defined Benefit Plans – Pension (“ASC 715-6
30”, formerly Statement of Financial Accounting Standards (“SFAS”) No. 87). 7
MGUC follows Generally Accepted Accounting Principles (“GAAP”) for its financial 8
statements. Under the provisions of GAAP, ASC 715-30 describes the 9
methodologies and assumptions used to calculate and account for pension expense. 10
ASC 715-30 requires an annual determination of the pension expense for the year. 11
This expense is determined by the actuary each year based upon: 12
1. Employee census data, 13
2. Current plan provisions, 14
3. Plan asset performance, and 15
4. Certain other actuarial assumptions. 16
17
For the ASC 715-30 pension expense, MGUC’s actuary, Towers, performs the 18
calculations required by this accounting standard annually to determine MGUC’s 19
pension expense. MGUC’s external auditors, Deloitte & Touche (“D&T”), review the 20
actuarial assumptions used to ensure consistency with GAAP. 21
22
There are four components of the ASC 715-30 pension expense. They are: 23
1. Service cost, 24 25 2. Interest cost, 26
27 3. Expected earnings on plan assets, and 28
29 4. Amortization of gains and losses, prior service costs, and any transitional 30
amounts. 31

- 9 -
1
Service cost represents one-year’s pro-rata share of the expected benefits earned 2
during the year by current active employees. 3
4
Interest cost represents interest on the plan’s benefit obligation (its liabilities) due to 5
the passage of time. 6
7
There is also an assumption regarding the expected return on assets for the year, 8
which is measured against the actual returns for the period. This rate of return 9
assumption is intended to be a long-term assumption of the return on plan assets. 10
11
The final component represents the amortization of various plan experiences that 12
were not anticipated by actuarial assumptions. 13
14
In order to calculate the plan’s total benefit obligation and annual ASC 715-30 15
expense, the actuary uses a number of assumptions including: 16
1. Mortality tables, 17
2. Retirement rates from MGUC, 18
3. Anticipated salary increases, 19
4. Expected return on plan assets, 20
5. Interest crediting rate, and 21
6. Discount rate. 22
23
Integrys management, as well as MGUC’s external auditor, D&T, reviews these 24
assumptions for reasonableness. A rate of return on assets of 8.00%, and a 25
discount rate of 4.10%, were used to forecast the 2014 pension expense. 26
27

- 10 -
The actuary then calculates the annual ASC 715-30 pension expense for MGUC. 1
This amount was $1,207,783 in 2012, and is projected to be $596,016 for 2014. This 2
is a decrease of $611,767. 3
4
Also included in this expense for both 2012 and 2014 is $821,606 of amortization 5
expense authorized by the Commission’s January 9, 2007 Order in Case No. U-6
15138. 7
8
Q. What actions has MGUC taken to help control pension costs? 9
A. During 2007, MGUC made changes to the retirement benefits provided to nonunion 10
employees. The most significant change was a shift from the traditional “defined 11
benefit” pension plan to a “defined contribution” model integrated with the existing 12
401K plan. 13
14
Effective January 1, 2008, the defined benefit pension plan was closed to 15
administrative (non-union) new hires. Those administrative employees participating 16
in the defined benefit pension plan as of January 1, 2008 continued to accrue 17
pension benefits through December 31, 2012, and the pay rate used in the 18
calculation of pension benefits will be frozen after December 31, 2017. On and after 19
January 1, 2013, pension benefits will no longer accrue under the defined benefit 20
pension plan, and all administrative employees will only have an annual contribution 21
made to their 401K account. Employees hired on and after January 1, 2008 do not 22
participate in the defined benefit pension plan, and will only have an annual 23
contribution made to their 401K account. 24
25
Effective January 16, 2010 for union employees of Local 12295 of the United 26
Steelworkers Union and February 16, 2012 for union employees of Local 12295 of 27

- 11 -
the United Steelworkers Union, the defined benefit pension plan was closed to union 1
new hires. Instead, these union employees receive an annual contribution to the 2
defined contribution plan 3
4
In addition, MGUC has made contributions to fund the pension plan. MGUC funded 5
$7.1 million in 2012 and $3.6 million in 2013. MGUC expects to contribute an 6
additional $4.7 million to the pension plan in 2014. As a result of these contributions 7
to MGUC’s pension plan, there are higher plan assets. The higher plan assets result 8
in higher expected earnings, thus decreasing pension expense. 9
10
Q. Are other U.S. utilities funding their pension and Other Post Employment 11
Benefits (“OPEB”) plans similarly to MGUC? 12
A. Yes, they are. In fact, on May 19, 2009, Standards & Poor issued a report entitled 13
“Funding Shortfall of U.S. Utility Pension and Postretirement Benefits Adds to 14
Industry’s Cost Pressure Woes.” 15
16
Based on this report, it is clear that many U.S. utilities are funding their pension and 17
OPEB plans similarly to MGUC. Also, the report highlights the fact that most state 18
regulators authorize rate recovery of the associated costs. 19
20
Due to copyright restrictions, a copy of this report cannot be electronically filed with 21
this case. However, MGUC will provide a hardcopy of this report to Commission 22
Staff and to the parties in this proceeding upon request. 23
24
Post Retirement Medical 25 Q. Please describe the development of the post retirement medical expense 26
shown on line 28 of Exhibit A-3 (CMP-1), Schedule C34. 27

- 12 -
A. The expense for retirees is determined using actuarial analysis, which is performed 1
in accordance with ASC 715-60, Defined Benefit Plans - Other Postretirement (“ASC 2
715-60”, formerly “SFAS 106”). As stated above, MGUC follows GAAP for its 3
financial statements. Under the provisions of GAAP, ASC 715-60 describes the 4
methodologies and assumptions used to calculate and account for retiree health care 5
expense. 6
7
The actuary performs the calculations required by this accounting standard annually 8
to determine MGUC’s ASC 715-60 expense. D&T reviews the actuarial assumptions 9
used to ensure consistency with GAAP. 10
11
ASC 715-60 requires an annual determination of the retiree health care expense for 12
the year, also referred to as OPEB expense or Post Employment Benefits other than 13
Pension (“PBOP”). This expense is determined by the actuary each year based 14
upon: 15
1. Employee census data, 16
2. Current plan provisions, 17
3. Plan asset performance, and 18
4. Certain other actuarial assumptions. 19
20
There are four components of SFAS No. 106 expense: 21
1. Service cost, 22 23 2. Interest cost, 24 25 3. Expected earnings on plan assets, and 26 27 4. Amortization of gains and losses, prior service costs, and any transitional 28
amounts. 29 30
These are the same four components that are used in the calculation of pension 31

- 13 -
expense, although different assumptions are used for health care. 1
2
In order to calculate the plan’s total benefit obligation and annual ASC 715-60 3
expense, the actuary uses a number of assumptions including: 4
1. Health care inflation trend rates, 5
2. Mortality tables, 6
3. Retirement rates from MGUC, 7
4. Actual retiree health care claims experience specific to MGUC, 8
5. Expected return on plan assets, and 9
6. A discount rate. 10
11
Integrys management, as well as MGUC’s external auditor, D&T, reviews these 12
assumptions. A rate of return on assets of 8.00% and a discount rate of 3.60% was 13
used to forecast the 2014 administrative post retirement medical expense. A rate of 14
return on assets of 8.00% and a discount rate of 4.05% was used to forecast the 15
2014 non-administrative or union post retirement medical expense. 16
17
The actuary then calculates the annual ASC 715-60 expense component for each 18
year, which was $417,227 for the 2012 historic test year, and is projected to be 19
$184,744 for the 2014 projected test year. This is a decrease of $232,483. 20
21
Also included in this expense for both 2012 and 2014 is $729,658 of amortization 22
expense authorized by the Commission’s January 9, 2007 Order in Case No. U-23
15138. 24
25
Furthermore, included in this expense for 2012 is $31,000 of amortization expense 26
authorized by the Commission’s December 8, 1992 Order in Case No. U-10040. 27

- 14 -
This was fully amortized as of December 31, 2012. The projected 2014 test year 1
cost is $0. This is a decrease of $31,000. 2
3
Pension Restoration 4 Q. Please describe the development of the pension restoration plan expense 5
shown on line 29 of Exhibit A-3 (CMP-1), Schedule C34. 6
A. The pension restoration plan expense is calculated in accordance with ASC 715-30 7
accounting rules, identical in nature to the pension expense described above. A 8
discount rate of 3.20% was used to forecast the 2014 pension restoration plan 9
expense. This amount was $10,429 in 2012, and is projected to be $9,068 for the 10
2014 test year, which is a decrease of $1,361. 11
12
Also included is plan expense of the Deferred Income Plan. The Deferred Income 13
Plan expense was determined by using the Moody’s Corporate Bond Yield Average 14
A of 4.96% for 2012 and 4.42% was used to forecast the 2014 Deferred Income Plan 15
expense for the test year. This amount was $8,010 in 2012, and is projected to be 16
$6,745 for the 2014 test year, which is a decrease of $1,265. 17
18
Supplemental Pension 19 Q. Please describe the development of the supplemental pension plan expense 20
shown on line 30 of Exhibit A-3 (CMP-1), Schedule C34. 21
A. The supplemental pension plan expense is calculated in accordance with ASC 715-22
30 accounting rules, identical in nature to the pension expense described above. A 23
discount rate of 3.45% was used to forecast the 2014 supplemental pension plan 24
expense. This amount was $27,709 in 2012, and is projected to be $20,837 for the 25
2014 test year, which is a decrease of $6,872. 26
27
Also included in this expense for both 2012 and 2014 is $12,346 of amortization 28

- 15 -
expense authorized by the Commission’s January 9, 2007 Order in Case No. U-1
15138 2
3
Post Retirement Life 4 Q. Please describe the development of the post retirement life benefit plan 5
expense shown on line 31 of Exhibit A-3 (CMP-1), Schedule C34. 6
A. The post retirement life insurance expense is calculated in accordance with the 7
requirements of ASC 715-60, consistent with the post retirement medical expense 8
described above. A rate of return on assets of 8.00%, and a discount rate of 4.00%, 9
were used to forecast the 2014 post retirement life insurance expense. This amount 10
was $1,729 in 2012, and is projected to be $9,592 in 2014. This is an increase of 11
$7,863. 12
13
Q. Will MGUC provide updated actuarial analyses when available? 14
A. Yes, it will. Upon request, MGUC will provide an updated actuarial analysis to 15
Commission Staff and to the parties in this proceeding if one is completed during the 16
pendency of this proceeding. 17
18
Q. Does this complete your pre-filed direct testimony? 19
A. Yes, it does. 20

Case No.: U-17273Exhibit No.: A-3 (CMP-1)
Schedule: C34Page: 1 of 1
Witness: Christine M. Phillips, CPAMICHIGAN GAS UTILITY COMPANY
Summary of Employee Benefits Costs
Test Year Ended December 31, 2014
2012 2014Actual Forecast Increase Increase Forecast
Line No. Sub-Account Description $ $ $ % Method1 926080 A&G Dental Benefits 104,642$ 117,955$ 13,313$ 12.7% MGUC Estimate2 926090 A&G Medical Benefits 1,190,792$ 1,420,500$ 229,708$ 19.3% MGUC Estimate3 926190 Goal Sharing (68,263)$ -$ 68,263$ -100.0% MGUC Estimate4 926255 Defined Contribution Plan Exp 17,283$ 290,086$ 272,803$ 1578.4% MGUC Estimate5 926510 Legacy Aquila Defined Contribution Expense 40,584$ -$ (40,584)$ -100.0% MGUC Estimate6 926300 IBS Billed Benefits 1,046,024$ 1,046,464$ 440$ 0.0% Exhibit A-3 (CMP-1), Schedule C357 Subtotal - MGUC Estimate 2,331,062$ 2,875,005$ 543,943$ 23.3%89
10 926000 A&G-Employee Pension and Benefits 11$ 11$ -$ 0.0% Inflationary11 926007 Company Match 401K 266,543$ 276,498$ 9,955$ 3.7% Inflationary12 926020 Time Away From Work Residual Balance 1,459,836$ 1,514,361$ 54,525$ 3.7% Inflationary13 926025 Time Away From Work - Clearing (1,531,061)$ (1,588,247)$ (57,186)$ 3.7% Inflationary14 926026 IBS Billed Non Productilve Time - Residual Balance (12,322)$ (12,782)$ (460)$ 3.7% Inflationary15 926050 Human Resources Dept General 39,346$ 40,816$ 1,470$ 3.7% Inflationary16 926070 Christmas Gift Check Expense - Retirees 4,625$ 4,798$ 173$ 3.7% Inflationary17 926120 Joint Plant A&G & Non-Utility Loading (12,779)$ (13,256)$ (477)$ 3.7% Inflationary18 926135 Fully-Insured Long Term Disability Premium Exp 24,496$ 25,411$ 915$ 3.7% Inflationary19 926140 A&G ESOP Contribution Expense 199,697$ 207,156$ 7,459$ 3.7% Inflationary20 926170 A&G Capitalized Pensions and Benefits (1,275,033)$ (1,322,656)$ (47,623)$ 3.7% Inflationary21 926191 IBS Billed Incentive Residual (25,335)$ (26,281)$ (946)$ 3.7% Inflationary22 926200 Employee Benefits Tuition Reimbursement 2,019$ 2,094$ 75$ 3.7% Inflationary23 926250 Company Provided Life Insurance 24,051$ 24,949$ 898$ 3.7% Inflationary24 926330 Benefits-Wellness 16,019$ 16,617$ 598$ 3.7% Inflationary25 Subtotal - Inflationary Items (819,887)$ (850,511)$ (30,624)$ 3.7%2627 926060 A&G Pension Expense 2,029,389$ 1,417,622$ (611,767)$ -30.1% Actuarial Analysis28 926180 A&G Post Retirement Medical 1,177,885$ 914,402$ (263,483)$ -22.4% Actuarial Analysis29 926210 Pension Restoration 18,439$ 15,813$ (2,626)$ -14.2% Actuarial Analysis30 926220 Supp Pension Plan Exp 40,055$ 33,183$ (6,872)$ -17.2% Actuarial Analysis31 926305 Post Retirement Life 1,729$ 9,592$ 7,863$ 454.8% Actuarial Analysis32 Subtotal - Actuarial Analysis 3,267,497$ 2,390,612$ (876,885)$ -26.8%3334 TOTAL EMPLOYEE BENEFIT COSTS 4,778,672$ 4,415,106$ (363,566)$ -7.6%
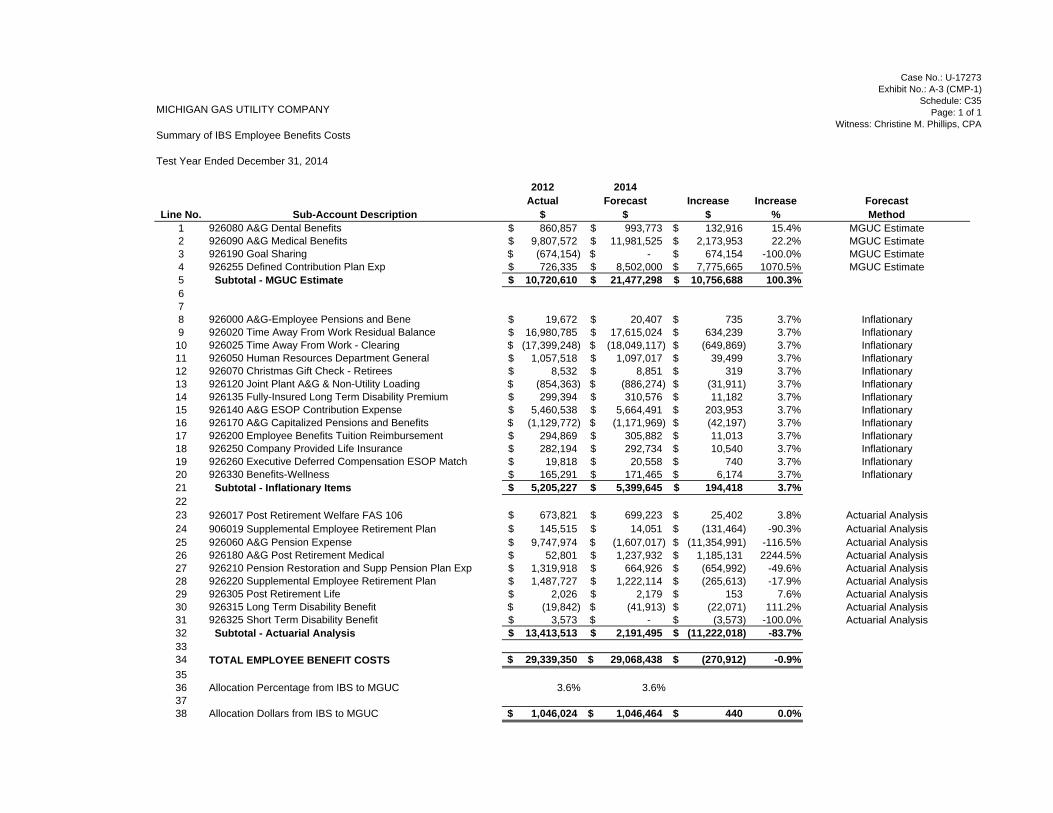
Case No.: U-17273Exhibit No.: A-3 (CMP-1)
Schedule: C35Page: 1 of 1
Witness: Christine M. Phillips, CPAMICHIGAN GAS UTILITY COMPANY
Summary of IBS Employee Benefits Costs
Test Year Ended December 31, 2014
2012 2014Actual Forecast Increase Increase Forecast
Line No. Sub-Account Description $ $ $ % Method1 926080 A&G Dental Benefits 860,857$ 993,773$ 132,916$ 15.4% MGUC Estimate2 926090 A&G Medical Benefits 9,807,572$ 11,981,525$ 2,173,953$ 22.2% MGUC Estimate3 926190 Goal Sharing (674,154)$ -$ 674,154$ -100.0% MGUC Estimate4 926255 Defined Contribution Plan Exp 726,335$ 8,502,000$ 7,775,665$ 1070.5% MGUC Estimate5 Subtotal - MGUC Estimate 10,720,610$ 21,477,298$ 10,756,688$ 100.3%678 926000 A&G-Employee Pensions and Bene 19,672$ 20,407$ 735$ 3.7% Inflationary9 926020 Time Away From Work Residual Balance 16,980,785$ 17,615,024$ 634,239$ 3.7% Inflationary10 926025 Time Away From Work - Clearing (17,399,248)$ (18,049,117)$ (649,869)$ 3.7% Inflationary11 926050 Human Resources Department General 1,057,518$ 1,097,017$ 39,499$ 3.7% Inflationary12 926070 Christmas Gift Check - Retirees 8,532$ 8,851$ 319$ 3.7% Inflationary13 926120 Joint Plant A&G & Non-Utility Loading (854,363)$ (886,274)$ (31,911)$ 3.7% Inflationary14 926135 Fully-Insured Long Term Disability Premium 299,394$ 310,576$ 11,182$ 3.7% Inflationary15 926140 A&G ESOP Contribution Expense 5,460,538$ 5,664,491$ 203,953$ 3.7% Inflationary16 926170 A&G Capitalized Pensions and Benefits (1,129,772)$ (1,171,969)$ (42,197)$ 3.7% Inflationary17 926200 Employee Benefits Tuition Reimbursement 294,869$ 305,882$ 11,013$ 3.7% Inflationary18 926250 Company Provided Life Insurance 282,194$ 292,734$ 10,540$ 3.7% Inflationary19 926260 Executive Deferred Compensation ESOP Match 19,818$ 20,558$ 740$ 3.7% Inflationary20 926330 Benefits-Wellness 165,291$ 171,465$ 6,174$ 3.7% Inflationary21 Subtotal - Inflationary Items 5,205,227$ 5,399,645$ 194,418$ 3.7%2223 926017 Post Retirement Welfare FAS 106 673,821$ 699,223$ 25,402$ 3.8% Actuarial Analysis24 906019 Supplemental Employee Retirement Plan 145,515$ 14,051$ (131,464)$ -90.3% Actuarial Analysis25 926060 A&G Pension Expense 9,747,974$ (1,607,017)$ (11,354,991)$ -116.5% Actuarial Analysis26 926180 A&G Post Retirement Medical 52,801$ 1,237,932$ 1,185,131$ 2244.5% Actuarial Analysis27 926210 Pension Restoration and Supp Pension Plan Exp 1,319,918$ 664,926$ (654,992)$ -49.6% Actuarial Analysis28 926220 Supplemental Employee Retirement Plan 1,487,727$ 1,222,114$ (265,613)$ -17.9% Actuarial Analysis29 926305 Post Retirement Life 2,026$ 2,179$ 153$ 7.6% Actuarial Analysis30 926315 Long Term Disability Benefit (19,842)$ (41,913)$ (22,071)$ 111.2% Actuarial Analysis31 926325 Short Term Disability Benefit 3,573$ -$ (3,573)$ -100.0% Actuarial Analysis32 Subtotal - Actuarial Analysis 13,413,513$ 2,191,495$ (11,222,018)$ -83.7%3334 TOTAL EMPLOYEE BENEFIT COSTS 29,339,350$ 29,068,438$ (270,912)$ -0.9%3536 Allocation Percentage from IBS to MGUC 3.6% 3.6%3738 Allocation Dollars from IBS to MGUC 1,046,024$ 1,046,464$ 440$ 0.0%

STATE OF MICHIGAN
BEFORE THE MICHIGAN PUBLIC SERVICE COMMISSION
* * * * * In the matter of the application of ) MICHIGAN GAS UTILITIES CORPORATION ) for authority to increase retail natural gas rates. ) Case No. U-17273 )
DIRECT TESTIMONY AND EXHIBIT OF
NOREEN E. CLEARY
FOR
MICHIGAN GAS UTILITIES CORPORATION
June 7, 2013

- 2 -
STATE OF MICHIGAN
BEFORE THE MICHIGAN PUBLIC SERVICE COMMISSION
* * * * *
In the matter of the application of ) MICHIGAN GAS UTILITIES CORPORATION ) for authority to increase retail natural gas rates. ) Case No. U-17273 )
QUALIFICATIONS OF
NOREEN E. CLEARY PART I
Q. Please state your name, address and position. 1
A. My name is Noreen E. Cleary. My business address is Integrys Business Support, 2
130 E. Randolph St, Chicago, IL 60601. I am the Assistant Vice President, Total 3
Compensation for Integrys Energy Group, Inc. (“Integrys”). Integrys is the parent 4
corporation of Michigan Gas Utilities Corporation (“MGUC”). 5
6
Q. Please describe your educational and business experience. 7
A. I received a bachelor’s of science degree in Medical Technology from Fitchburg 8
State College, now Fitchburg State University, in 1981. My professional experience 9
in Human Resources (“HR”) covers a period of more than 25 years with various 10
companies. My primary expertise and concentration in the HR area has been in 11
compensation and benefits design and administration. I hold designations as a 12
Compensation Management Specialist (C.M.S.) and a Certified Employee Benefit 13
Specialist (C.E.B.S.) from the International Foundation of Employee Benefits 14
Programs (I.F.E.B.P.) in partnership with The Wharton School of the University of 15
Pennsylvania. 16
17
Q. For whom are you providing testimony? 18
A. I am providing testimony on behalf of MGUC. 19

- 3 -
NOREEN E. CLEARY DIRECT TESTIMONY
PART II
Q. What is the purpose of your pre-filed direct testimony? 1
A. My pre-filed direct testimony will describe the Integrys 2013 Non-Executive Incentive 2
Plan as it applies directly to MGUC and indirectly to MGUC through Integrys 3
Business Support, LLC (“IBS”) (“MGU Non-Executive Incentive Plan”). Non-4
executive employees of MGUC, as well as those of IBS, participate in the MGUC 5
Non-Executive Incentive Plan utilizing specific measures and targets designed for 6
MGUC. IBS is a separate subsidiary of Integrys that provides services to MGUC in 7
the areas of Gas Supply, Engineering, Customer Relations, shared services and 8
corporate support. This plan remains the same as the 2012 plan and uses metrics 9
specifically focused on providing benefits to customers in the form of reduced cost of 10
service, greater efficiencies in operations, increased customer satisfaction and 11
improved reliability 12
13
Q. Are you sponsoring any exhibits in this proceeding? 14
A. Yes, I am. I am sponsoring Exhibit A-9 (NEC-1), which is the Integrys 2013 IBS & 15
Regulated Non-Executive Incentive Plan. 16
17
Q. Was this exhibit prepared by you or under your direction and supervision? 18
A. Yes, it was. 19
20
Q. Please describe MGUC’s compensation philosophy. 21
A. Like most customer-focused businesses, including public utilities, MGUC maintains 22
compensation programs that are market-based so it can attract and retain a qualified 23
and motivated work force. We compete for quality employees in a market that 24
includes regulated and non-regulated energy companies as well as non-energy 25

- 4 -
firms. Virtually all firms with which MGUC competes for quality employees offer Pay-1
at-Risk as a portion of total compensation. This Pay-at-Risk is an expected 2
component of a total compensation package in today’s talent market place. Potential 3
employees are anticipating the opportunity to participate in the Company’s success 4
through such Pay-at-Risk programs as MGUC’s Annual Incentive Plan. 5
6
MGUC’s goal is to pay our employees a total cash compensation package (base pay 7
plus target Pay-at-Risk) that is anchored to market median levels, as compared to 8
other energy industry companies and general industry companies, based on data as 9
provided by Towers Watson, an internationally recognized firm that specializes in 10
both compensation and benefits consulting services. Stated another way, the 11
combination of the base pay target plus annual Pay-at-Risk target brings the 12
employee to the 50th percentile median of comparable energy industry and general 13
industry companies. Our compensation programs are reviewed at least annually 14
against competitive data. This review includes both market data and business 15
objectives to ensure our compensation programs will attract and retain a quality 16
workforce to serve our customers. 17
18
Q. If the Commission does not allow recovery of Pay-at-Risk costs, why couldn’t 19
MGUC simply pay its employees exclusively through base pay? 20
A. There are two reasons why MGUC needs to use a compensation package that 21
includes Pay-at-Risk rather than pay employees exclusively through base pay. First, 22
offering only base pay plans without a Pay-at-Risk component would make it more 23
difficult for MGUC to attract the quality employees required to provide a level of 24
service that our customers demand. Quality employees demand this type of Pay-at-25
Risk compensation to recognize superior performance. Indeed, surveys performed 26
by Towers Watson have concluded that the majority of companies extend their Pay-27

- 5 -
at-Risk programs deep into their organizations (i.e., at least to entry level 1
professionals). Second, including annual Pay-at-Risk plans in its compensation 2
program enables MGUC to offer competitive compensation packages that incent 3
employees to improve service levels and reduce costs that impact the rates paid by 4
customers. The 2013 Pay-at-Risk plan design will focus employees on key goals 5
and objectives that benefit our customers, as its design measure criteria will 6
concentrate on cost containment and operational goals that are aligned with the 7
interests of customers rather than financial measures that might be more aligned 8
with the interests of shareholders. 9
10
Q. Does a utility’s ability to attract and retain sufficient, qualified and motivated 11
work force benefit customers? 12
A. Absolutely. Attracting and retaining a sufficient, qualified and motivated work force 13
directly benefits customers, because it ensures there are enough highly proficient 14
employees to perform needed customer work. In addition, customers benefit by 15
MGUC maintaining and improving the productivity and quality of work performed, 16
which reduces overall costs to customers. By retaining trained and experienced 17
employees through a market-competitive compensation program, MGUC is able to 18
avoid incurring the costs of hiring and training employees to replace workers who 19
otherwise would choose to leave the company if such a market-competitive program 20
were not in place. Experienced employees who are familiar with MGUC’s systems 21
and equipment are more efficient in their performance, further reducing the 22
company’s operating and maintenance expenses and capital expenditures. 23
24
Q. Please review the current make up of the MGUC Non-Executive Incentive Plan. 25
A. The MGUC Non-Executive Incentive Plan rewards non-union employees on an 26
annual basis for meeting pre-determined goals in a number of areas which we 27

- 6 -
believe are in our customers’ best interests. It uses four specific 2013 performance 1
measures to determine Pay-at-Risk payouts for MGUC employees. The four 2
performance measures are all focused on operational aspects of the business, 3
including cost management. There is no financial performance measure in the plan. 4
MGUC’s measures assess cost control via a non-fuel Operations and Maintenance 5
(“O&M”) expense-adjusted metric which is weighted at 50% of the total. In addition, 6
employee safety measurements, customer service and system reliability are 7
weighted at a combined 50% of the total. The following is a high-level review of the 8
plan design: 9
10
Operational Performance Measures
1) Cost Management Non-fuel O&M Expense-
Adjusted
2) Employee Safety-OSHA-Recordable
Incident Rates 3) Customer Satisfaction 4) Reliability
50% 15% 15% 20%
11
Q. What is the focus of these operational measures? 12
A. Our operational measures are focused on improving services delivered to customers 13
including cost control of expenses that impact their rates. They are designed to 14
motivate employees to maintain customer support at a high quality level and at 15
competitive rates. 16
17
Q. Can you provide more details as to the operational performance measures in 18
the MGUC Non-Executive Incentive Plan? 19
A. Yes. The following chart provides details on the four operational measures. 20
21

- 7 -
Operational Performance Measure Description Weighting
1. Cost Management
Non-fuel O&M Expense Adjusted
Assess cost management via non-fuel O&M expense-adjusted, to help maintain or reduce expenses that may be charged to customers in future rate cases. All employees in the Plan are tied to this measure.
50%
2. Employee Safety
– OSHA-Recordable Incident Rates
Based on reducing OSHA recordable injuries and illnesses. A comparison to targets measuring recordable injuries and illnesses. All employees are tied to this measure.
15%
3. Customer
Satisfaction
Based on improving customer satisfaction, a residential customer survey measures overall customer satisfaction in categories such as reliability, communications, corporate citizenship, price and value, billing and payment, customer and field service. Customer satisfaction surveys are conducted by an independent third party and compared against the satisfaction survey results of other regional benchmark energy suppliers. All employees are tied to this measure.
15%
4. Reliability
This metric is based on improving performance of defective meter shut-off valve corrections. The objective is to reduce the number of outstanding broken, buried, and built over meter shut-off valves. This measure applies to all MGUC employee Incentive Plan participants.
20%
1
Q. Who participates in the MGUC Non-Executive Incentive Plan? 2
A. Participants in the MGUC Non-Executive Incentive Plan include MGUC non-union 3
non-executive employees, as well as employees of IBS. Employees of IBS affect the 4
MGUC Non-Executive Incentive Plan based on the proportion that IBS costs are 5
allocated to MGUC, as discussed in the pre-filed direct testimony of Tracy L. Kupsh. 6

- 8 -
1
Q. How does the Cost Management Non-fuel O&M Expense-adjusted metric 2
benefit customers? 3
A. The Cost Management Non-fuel O&M Expense-adjusted metric benefits customers 4
by reducing the costs of service that must be recovered from customers in future rate 5
cases. This metric encourages employees to maintain or reduce operational costs in 6
order to keep O&M costs at or below the target level set for MGUC. The more O&M 7
costs are reduced, the higher the payout for which employees may be eligible. This 8
metric benefits customers, because all else being equal, lowering O&M expenses will 9
reduce the amount of costs to be recovered in future rate cases. 10
11
To the extent any operations and maintenance savings are permanent, the result will 12
be lower rates for MGUC customers for years to come. 13
14
Q. How does the Employee Safety metric benefit customers? 15
A. The Employee Safety metric benefits customers by reducing costs and inefficiencies 16
associated with on-the-job accidents. The focus on employee safety is part of a 17
larger effort to create a “Safety Culture” in which all aspects of safety, public safety, 18
customer safety, as well as employee safety, become a daily part of what we do. 19
The Pay-at-Risk compensation metric is designed to encourage the reduction in the 20
number of OSHA-recordable incidents by MGUC employees. OSHA-recordable 21
incidents or indeed, accidents of any kind, cause higher operating expenses, which 22
ultimately result in higher rates for customers. Moreover, safer employees are more 23
motivated and efficient than those who operate in a less safe environment. Thus, by 24
encouraging increased safety for employees, this metric leads to more efficiency and 25
lower costs, which are a direct benefit to customers. 26
27

- 9 -
Q. How does the Customer Satisfaction metric benefit customers? 1
A. The Customer Satisfaction metric benefits customers by encouraging MGUC 2
employees to improve the Company’s performance with respect to customer 3
communications, customer service, and field service. This metric is designed to 4
ensure that MGUC customers receive an ever-improving level of high-quality service 5
in all aspects of MGUC’s delivery of natural gas to their homes and businesses. 6
Customers of MGUC benefit from this metric because it ensures that they continue to 7
receive high-quality service from MGUC employees and encourages further 8
improvements in that service quality. 9
10
Q. How does the Reliability metric benefit customers? 11
A. The Reliability metric benefits customers by reducing the number of defective meter 12
valve shut-offs, thereby enabling quick and efficient response time to the need for 13
shut-offs, both emergency and non-emergency. Quick and efficient shut-off 14
response benefits customers of MGUC by increasing their level of safety. 15
16
Q. What changes have been made to the 2013 MGU Non-Executive Incentive Plan 17
as compared to the historic test year? 18
A. The MGUC Non-Executive Incentive Plan from the historic test year utilized a 19
reliability measure that focused on Pipeline Locates Improvements. In an effort to 20
further incent MGUC employees to improve efficiency and processes, the 2013 21
reliability measure focuses on Meter Valve Remediation. The other three measures 22
in the Plan for the historic test year have remained the same, although targets have 23
been adjusted annually. 24
25
Q. Do you anticipate any additional changes to the Plan for the projected test 26
year? 27

- 10 -
A. No. For the 2014 projected test year our focus will likely continue to be on the four 1
measures described above, although targets will be adjusted annually. 2
3
Q. Do you propose that MGUC recover in rates the costs of the MGUC Non-4
Executive Incentive Plan in their entirety? 5
A. Yes. 6
7
Q. On what basis do you propose that MGUC recover in rates the costs of the 8
MGUC Non-Executive Incentive Plan in their entirety? 9
A. As described above, the MGUC Non-Executive Incentive Plan contains measures 10
designed exclusively to provide benefits to customers by encouraging the 11
achievement of operational goals focused on maintaining or reducing costs and 12
improving reliability and service. The MGUC Non-Executive Incentive Plan aligns 13
non-executive employee performance with customer interests. 14
15
Q. Have other MGUC utility affiliates been granted recovery of Pay-at-Risk costs? 16
A. Yes, they have. In Docket Number G-007,011/GR-10-977, MGUC affiliate 17
Minnesota Energy Resources Corporation was granted 100% recovery of Non-18
Executive Pay-at-Risk costs, and 30% recovery of Executive Pay-at-Risk costs. 19
20
Q. Do you have any further comments on the recovery of the Pay-at-Risk 21
component of total cash compensation? 22
A. Yes, I do. MGUC’s total cash compensation costs are targeted to the energy 23
industry and the general industry market median rates. These are prudent 24
expenditures that allow MGUC to continue customer-expected service levels and to 25
maintain competitive rates. If MGUC went to a more fixed-expense basis for 26
compensation in the form of increased base salaries, it would put the Company at a 27

- 11 -
disadvantage in a market where Pay-at-Risk programs are prevalent, and negatively 1
impact our ability to attract and retain the quality workforce needed to deliver high 2
levels of customer service without any benefit to the customer. 3
4
Q. Does this conclude your pre-filed direct testimony? 5
A. Yes, it does. 6

1/1/13
INTEGRYS
2013 IBS & Regulated Non-Executive Incentive Plan
Update 12/3/12
Case No. U-17273 Witness: Noreen E. Cleary
Exhibit A-10 (NEC-1) Page 1 of 11

EFFECTIVE DATE The 2013 IBS & Regulated Non-Executive Incentive Plan (the “Plan”), shall become effective on January 1, 2013. The Plan shall operate on the basis of a plan year that will begin on January 1, 2013 and will end on December 31, 2013 (the “Plan Year”). Payouts will be based on Plan Year performance results, except as otherwise provided herein. PURPOSE The Plan provides eligible employees with an opportunity to receive cash short term incentive compensation based upon the achievement of short-term goals that support Integrys Energy Group, Inc. (the “Company”), and those direct and indirect subsidiaries of the Company that have been designated by the Company for participation in this Plan. The purpose of the Plan is to focus eligible employees on reducing the costs of operations, improving reliability to customers, and supporting an emphasis on safety in all we do. Payouts for Plan participants will be determined based on the Plan provisions and the results of performance measurements from Participating Subsidiaries (as defined below). ELIGIBILITY Eligibility is limited to employees who are classified by the Company or a Participating Subsidiary as active regular administrative full-time or part-time employees of the Company or a Participating Subsidiary for the period of time during the Plan Year that they are employed in an eligible classification. Employees of the Company’s non-regulated direct and indirect subsidiaries, including Integrys Energy Services, Inc., are not eligible to participate in the Plan. Further, employees who participate in another short-term Company or Participating Subsidiary incentive plan (other than a plan that compensates the employee on a commission basis) are not eligible to participate in this Plan with respect to the portion of the Plan Year that is also covered under such other plan. Performance measures, weightings and threshold, target and superior payout levels by pay grade are listed in the Plan Appendix. Employees who are covered by a collective bargaining agreement, assigned by the Company to a limited term or temporary status (e.g. limited-term employees) and persons who provide services to the Company or a Participating Subsidiary but who are classified as non-employee service providers (e.g. contractors and consultants) are not eligible for the Plan. Any employee who first becomes eligible and is added to the Plan after the start of the Plan Year will be eligible to participate with respect to that Plan Year, but any payout under the Plan will be based solely on the employee’s Pay during the portion of the Payroll Year (as defined below) for which the employee was employed in an eligible classification. If an employee transfers during the Plan Year from employment covered by a collective bargaining agreement to employment in a regular position eligible for participation in the Plan, or vice versa, the employee will be eligible to participate with respect to that Plan Year, but any payout under the Plan will be based on the employee’s Pay during the portion of the Payroll Year for which the employee was employed in an eligible classification.
Case No. U-17273 Witness: Noreen E. Cleary
Exhibit A-10 (NEC-1) Page 2 of 11

Except as provided in the Employment Termination section below, employees must be actively employed through December 31 of the Plan Year to be eligible for a payout under the Plan with respect to that Plan Year. Those who are not actively employed through December 31 of the Plan Year for reasons other than retirement, disability, approved leave of absence or death, will not be eligible to receive a payout from the Plan. An employee does not earn a right to a Plan payment (whether on a pro rata basis or otherwise) based upon length of service or mere completion of service during the Plan Year. Rather, a payout is earned based upon the achievement by the applicable Participating Subsidiary (or other business unit) of pre-determined performance goals measured over the course of the entire Plan Year as a result of the efforts of eligible employees who contribute toward the achievement of such goals. An employee’s participation in the Plan, and the opportunity to earn a payout in accordance with the terms and conditions of the Plan, does not represent an unequivocal promise on the part of the Company to pay incentive compensation other than to the extent that applicable performance goals have been satisfied and the employee satisfies the eligibility conditions specified herein. Eligible Plan participants who during the Plan Year change employment status from one eligible status to another eligible status but qualify to participate in the current Integrys Pay Protection policy will be eligible to participate (a) at the annual incentive percentage target level payout that has been assigned to their prior, higher pay grade with respect to eligible employment during the portion of the Plan Year that is prior to the Change in Status Date and (b) at the annual incentive percentage target level payout that has been assigned to their new, lower pay grade with respect to eligible employment during the portion of the Plan Year that is on or after the Change in Status Date. PARTICIPATING SUBSIDIARIES The participating subsidiaries (each, a “Participating Subsidiary”, and collectively, the “Participating Subsidiaries”) are: Integrys Business Support LLC (IBS), Minnesota Energy Resources Corporation (MER), Michigan Gas Utilities, Inc. (MGU), North Shore Gas Company (NSG), the Peoples Gas Light & Coke Company (PGL), Upper Peninsula Power Company (UPPCO), Wisconsin Public Service Corporation (WPS) and any other corporation or entity designated by the Chief Executive Officer of the Company (the “CEO”) for participation in the Plan. When evaluating performance during the Plan Year, the performance of all such Participating Subsidiaries shall be included. In the event that any such Participating Subsidiary is sold or otherwise divested during the Plan Year, the target metric and actual performance for such Participating Subsidiary will include the full period prior to such sale or divestiture and thereafter performance of such Participating Subsidiary will be excluded. Unless the CEO determines otherwise, in the event of an acquisition of a new subsidiary or other corporate transaction involving the merger with or acquisition of a business by TEG, performance related to such acquired business shall not be considered when evaluating performance for the Plan Year. As such, when evaluating IBS performance during the year, the respective weighting percentages assigned to each Participating Subsidiary shall be adjusted as necessary, consistent with the language above.
Case No. U-17273 Witness: Noreen E. Cleary
Exhibit A-10 (NEC-1) Page 3 of 11

PAYROLL YEAR The Payroll Year that is associated with the Plan Year, that will be used to determine eligible Pay for payout calculations, is from December 23, 2012 through December 21, 2013. EMPLOYMENT TERMINATION Termination of employment at any time during the Plan Year (other than termination on account of retirement, death, or because the employee left the company in good standing at the end of a “Regular with an end date” assignment) will disqualify the participant from receiving a payout from the Plan.
Absence from active employment during the Plan Year on account of disability or approved unpaid leave of absence will not disqualify the participant from receiving a payout of any award that has otherwise been earned, but the amount payable to or on behalf of the participant will be based upon the participant’s Pay that is recognized for purposes of the Plan. Similarly, if termination of employment occurs during the Plan Year due to retirement, or death, or because the employee left the company in good standing at the end of a “Regular with an end date” assignment, the participant will receive a payout of any award that has otherwise been earned, but the amount payable to or on behalf of the participant will be based upon the participant’s Pay during the participant’s period of active service during the year.
“Retirement” means termination of a Participant’s service with the Company and its Affiliates, if one or more of the following conditions is satisfied:
(a) the termination occurs on or after the Participant's attainment of age sixty-two (62), (b) the termination occurs on or after attainment the Participant's attainment of age fifty-five (55) and completion of at least ten (10) years of vesting service (as defined in the 401(k) plan that is applicable to the participant), or
(c) in the case of a Participant who is covered under a defined benefit pension plan maintained by the Company or an Affiliate, the termination qualifies the Participant’s for retirement (as opposed to vested termination) benefits under such defined benefit pension plan.
The word “disability” means that the participant’s active service has been interrupted as a result of the participant being totally disabled (as defined in the Company’s or Participating Subsidiary’s long-term disability plan applicable to the employee). In all cases, eligibility for any earned payout is based upon the employee’s Pay during the portion of the Payroll Year for which the employee was employed in an eligible classification. Any earned Plan payout to or on behalf of a participant who terminated employment during the Plan Year on account of retirement, death, or because the employee left the company in good
Case No. U-17273 Witness: Noreen E. Cleary
Exhibit A-10 (NEC-1) Page 4 of 11
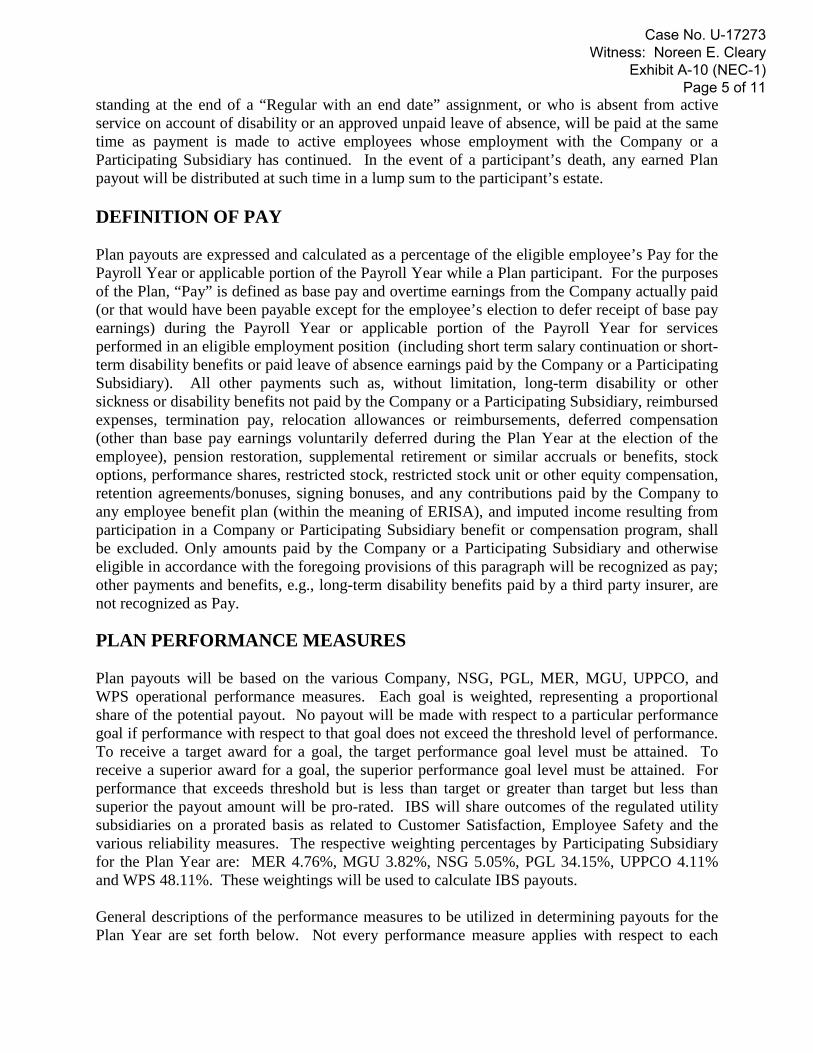
standing at the end of a “Regular with an end date” assignment, or who is absent from active service on account of disability or an approved unpaid leave of absence, will be paid at the same time as payment is made to active employees whose employment with the Company or a Participating Subsidiary has continued. In the event of a participant’s death, any earned Plan payout will be distributed at such time in a lump sum to the participant’s estate. DEFINITION OF PAY Plan payouts are expressed and calculated as a percentage of the eligible employee’s Pay for the Payroll Year or applicable portion of the Payroll Year while a Plan participant. For the purposes of the Plan, “Pay” is defined as base pay and overtime earnings from the Company actually paid (or that would have been payable except for the employee’s election to defer receipt of base pay earnings) during the Payroll Year or applicable portion of the Payroll Year for services performed in an eligible employment position (including short term salary continuation or short-term disability benefits or paid leave of absence earnings paid by the Company or a Participating Subsidiary). All other payments such as, without limitation, long-term disability or other sickness or disability benefits not paid by the Company or a Participating Subsidiary, reimbursed expenses, termination pay, relocation allowances or reimbursements, deferred compensation (other than base pay earnings voluntarily deferred during the Plan Year at the election of the employee), pension restoration, supplemental retirement or similar accruals or benefits, stock options, performance shares, restricted stock, restricted stock unit or other equity compensation, retention agreements/bonuses, signing bonuses, and any contributions paid by the Company to any employee benefit plan (within the meaning of ERISA), and imputed income resulting from participation in a Company or Participating Subsidiary benefit or compensation program, shall be excluded. Only amounts paid by the Company or a Participating Subsidiary and otherwise eligible in accordance with the foregoing provisions of this paragraph will be recognized as pay; other payments and benefits, e.g., long-term disability benefits paid by a third party insurer, are not recognized as Pay. PLAN PERFORMANCE MEASURES Plan payouts will be based on the various Company, NSG, PGL, MER, MGU, UPPCO, and WPS operational performance measures. Each goal is weighted, representing a proportional share of the potential payout. No payout will be made with respect to a particular performance goal if performance with respect to that goal does not exceed the threshold level of performance. To receive a target award for a goal, the target performance goal level must be attained. To receive a superior award for a goal, the superior performance goal level must be attained. For performance that exceeds threshold but is less than target or greater than target but less than superior the payout amount will be pro-rated. IBS will share outcomes of the regulated utility subsidiaries on a prorated basis as related to Customer Satisfaction, Employee Safety and the various reliability measures. The respective weighting percentages by Participating Subsidiary for the Plan Year are: MER 4.76%, MGU 3.82%, NSG 5.05%, PGL 34.15%, UPPCO 4.11% and WPS 48.11%. These weightings will be used to calculate IBS payouts. General descriptions of the performance measures to be utilized in determining payouts for the Plan Year are set forth below. Not every performance measure applies with respect to each
Case No. U-17273 Witness: Noreen E. Cleary
Exhibit A-10 (NEC-1) Page 5 of 11

Participating Subsidiary or each eligible employee of a Participating Subsidiary, nor will the weightings applied with respect to a performance measure necessarily be the same between Participating Subsidiaries or between employee groups who are employed at a particular Participating Subsidiary. In addition, the performance measures can be specific to a group, and may include measures as approved by the CEO. OPERATIONAL MEASURES Integrys Energy Group-Utility and IBS FERC-based non-fuel Operation and Maintenance expense – Adjusted Before Annual Incentives The annual forecasted Combined Utility and IBS FERC-based non-fuel Operation and Maintenance (O&M) expense – Adjusted Before Annual Incentives is determined based upon the combined Utility and IBS FERC-based non-fuel O&M included in the budget accepted by the Integrys Board of Directors on December 12, 2012 adjusted for:
(1) Budgeted annual incentive plan compensation expense, expected to be accrued at
target-level performance related to the executive and non-executive annual incentive compensation plans for employees of IBS and the Regulated Utilities,
(2) Amounts recorded for (a) costs recovered directly through regulatory trackers
such as bad debt, demand side management, energy efficiency programs, and manufactured gas plant clean up, (b) electric transmission (wheeling) costs, and (c) bad debt expense not recovered through trackers.
(3) The performance levels required to achieve threshold, target, and maximum
payout levels for performance on Combined Utility and IBS FERC-based non-fuel Operations and Maintenance (O&M) expense-Adjusted Before Annual Incentives are attached in Appendix A hereto.
The Calculated Combined Utility and IBS FERC-based non-fuel Operation and Maintenance expense – Adjusted Before Annual Incentives used to determine if desired performance has been achieved will be calculated based upon the combined Utility and IBS FERC-based non-fuel O&M included in the final 2013 audited financial results for Integrys Energy Group, Inc. adjusted for:
(1) Incentive plan compensation expense included in the actual results related to the executive and non-executive annual incentive compensation plan for employees of IBS and the Regulated Utilities,
(2) Where applicable to O&M, the pre-tax impact of adjustments reflected in Integrys
Energy Group’s 2013 EPS-Adjusted as reported in the Company’s earnings release for fiscal year 2013, and
Case No. U-17273 Witness: Noreen E. Cleary
Exhibit A-10 (NEC-1) Page 6 of 11

(3) Amounts recorded for (a) costs recovered directly through regulatory trackers such as bad debt, demand side management, energy efficiency programs, and manufactured gas plant clean up, (b) electric transmission (wheeling) costs, and (c) bad debt expense not recovered through trackers, and
(4) Budget to actual variances for costs related to various long term equity-based
incentive compensation arrangements for plan participants who are employees of IBS and the Regulated Utilities (in order to avoid incentive arrangements that would reward employees under the annual incentive plan for a declining stock price, etc.).
Customer Satisfaction Measure The continued success of the Company will ultimately be determined by our customers, requiring customer satisfaction to be the focal point of our efforts. Customer satisfaction will be measured for residential customers of MERC, MGU, NSG, PGL, UPPCO and WPS and compared against the satisfaction survey results of other regional benchmark energy suppliers. Surveys will be conducted by J.D. Power and Associates. The surveys measure overall customer satisfaction in categories such as power quality and reliability, communications, corporate citizenship, price, billing and payment, customer service and field service. Survey category results are combined into an overall score for each utility. The incentive measure compares each of our electric and gas utilities’ score against the Midwest regional average utility score. IBS employees’ incentive measure will be a weighted combination of all of our utilities’ scores – the score weighting based on the ratio of customer counts for each utility. Employee Safety Employee safety will be measured with a rate calculated by multiplying the number of recordable cases over a given period of time by 200,000. That total is subsequently divided by the number of total hours worked by the identified business unit to obtain the final rate. An injury or illness is considered recordable if it meets standard criteria set by Occupational Safety and Health Administration (OSHA) regulations. For purposes of determining results for 2013, the rate is measured over a calendar year basis. The recordable incident rates are further analyzed against viable industry benchmarks, and final targets are reviewed and approved by business unit management to promote consistency and improvement. Regulated utility subsidiaries – measure will rely on the individual metrics of MER, MGU, NSG, PGL, UPPCO and WPS. IBS employees will use each utility’s score as a portion of their score, weighted to reflect the ratio of IBS costs allocated to the utility. This incentive is designed to promote safety awareness and safe work practices and will not be the cause of underreporting of injuries and illnesses. VARIABLE OPERATIONS RELIABILITY MEASURES (see below) IBS employees will use each utility’s score as a portion of their score, weighted to reflect the ratio of IBS costs allocated to the utility.
Case No. U-17273 Witness: Noreen E. Cleary
Exhibit A-10 (NEC-1) Page 7 of 11

UPPCO, WPS - System Reliability The System Reliability measure includes two components, electric system and gas system reliability which measure our ability to deliver quality services to our customers by reducing the frequency and duration of planned and unplanned service interruptions. The electric system component will apply to UPPCO and WPS. The gas system component will apply to WPS. They are defined as follows: The electric system measurement is the annual System Average Interruption Duration Index (SAIDI), excluding major event days as defined by the IEEE (Institute of Electrical and Electronics Engineers) Standard 1366-2003. The SAIDI is the cumulative customer minutes of outage, on average, per customer served per year. It excludes the customer minutes of outage due to major event days such as large storms, and includes the customer minutes of outage due to events originating on the transmission, substation, and distribution systems. The 2013 incentive levels of threshold, target and superior are determined by the historical average annual SAIDI values. The gas system component measure is based on the percentage of customer and public odor complaints with employee response times less than or equal to 60 minutes. PGL - Reduction in Class 2 System Leaks A Class 2 leak is a gas leak that is recognized as being non-hazardous at the time of detection, but justifies more frequent monitoring and scheduled repair based on probable future hazard. Proper management of Class 2 gas leaks will reduce exposure to risk. There would also be some cost savings through the reduction in frequency of future required leak rechecks. The metric for this measure will be based on the percentage of Class 2 gas leaks pending repair as a ratio to the total number of Class 2 and Class 3 pending repair. A Class 3 leak is one that is nonhazardous at the time of detection and can be reasonably expected to remain non-hazardous. NSG – Reduction in Total Leaks Leaks not requiring immediate action are recognized as being non-hazardous at the time of detection. However these non hazardous leaks require frequent monitoring and scheduled repair based on probable future hazard. Reducing the total number of non-hazardous leaks pending reduces the risk of leak migration between rechecks and improves overall system safety. There is also cost savings when expediently repairing leaks through the reduction in the number of rechecks required to be performed. The metric for this measure would be the total number of leaks pending. The results would be measured as an average of the total leaks pending repair on the last day of each month. NSG, PGL - Reduction in 2nd and 3rd Party Damages Damage prevention is an operational measure with a significant safety component and will be critical for development of a strong distribution integrity management program. Elimination of third party damages is a major initiative across the natural gas industry. Reducing damages by others to company gas facilities improves safety for our own employees as well as for the general
Case No. U-17273 Witness: Noreen E. Cleary
Exhibit A-10 (NEC-1) Page 8 of 11

public and avoids outages to our customers. The metric for this measure will be based on the total number of excavation damages caused by second parties (company contractors) and third parties (other excavators) to company-owned facilities per 1,000 locates performed by the company. NSG, PGL – Reduction in Damages caused by Company Crews Installing and maintaining natural gas facilities requires company crews to work in close proximity to other utilities. Performing this work safely is essential to ensure employee and customer safety. This can be achieved by proper jobsite preparedness and safe excavation practices. Cost savings can also be achieved through reduced claim expenses. The metric for this measure will be the number of damages caused by company crews to other utilities, below and above ground, as well as to company facilities. MER - Meter Set Remediation This multi-year metric is based on meter set remediation as identified in MERC’s meter set surveys. For 2013 the measure will focus on risers in hard surface; in 2012 the measure focused on stop valve readily accessible; in 2011 the measure focused on active atmospheric corrosion. The remediation targets are number of meter sets remediated based on budget and resources. MGU - Meter Valve Remediation This metric is based on improving performance of defective meter shut-off valve corrections. The objective is to reduce the number of outstanding broken, buried, and built over meter shut-off valves. Completion goal is the percent corrections of all identified defective shut-offs found in 2012 and prior – 35% for threshold, 50% for target, and 75% for superior performance. WPS - Market Effectiveness Measure The WPS Market Effectiveness measure is specific to WPS Energy Supply Operations participants, and selected participants in Energy Supply & Control. It is based on the energy price weighted availability of all WPS’s generation facilities, the comparison of what WPS electric generation earns in 2013 versus what it could have earned if all units had been available 100% as needed. PAYMENT OF INCENTIVE AWARD EARNED The President of the Company or of a Participating Subsidiary (or, if there is no President of a Participating Subsidiary, the highest ranking officer of the Participating Subsidiary) shall have discretion to determine that an eligible employee of the Company or applicable Participating Subsidiary is ineligible in total or in part for a Plan payout if the employee has earned less than a “fully successful” performance evaluation rating for the Plan Year or is otherwise being counseled concerning documented insufficient performance. This is the only circumstance in which an amount that would otherwise be payable as a result of the achievement of performance objectives might not be paid assuming employment continues through the end of the Plan Year.
Case No. U-17273 Witness: Noreen E. Cleary
Exhibit A-10 (NEC-1) Page 9 of 11

PLAN PAYOUTS Following the close of the Plan Year and after the audited financial results are available, the CEO will certify the extent to which the performance measures have been satisfied and will authorize Plan payouts. Payouts, less tax withholdings, will be paid no later than March 15th of the year following the Plan Year. No payout will be made with respect to a particular performance measure if performance with respect to that measure does not exceed the threshold level of performance. To receive a target payout for a measure, the target performance level must be attained. To receive a superior payout for a measure, the superior performance level must be attained. An employee who during the Plan Year changes employment status from one regular eligible status or position to another regular eligible status or position, other than a change that the Company or applicable Participating Subsidiary determines to be short-term or temporary assignment that does not represent a long-term change in the employee’s regular role, will be subject, with respect to employment on or after the date the change in employment status is reflected in the PeopleSoft System (the “Change in Status Date”), to the Plan payout target and/or incentive measures applicable to the employment status into which the employee has transferred. Any payout applicable to eligible employment during the Plan Year prior to the Change in Status Date will be based upon the employee’s payout targets and/or incentive measures applicable to the employee prior to the Change in Status Date and the employee’s pay prior to the Change in Status Date. Any payment applicable to eligible employment during the Plan Year but on or after the Change in Status Date will be based upon the employee’s payout target and/or incentive measures applicable to the employee on or after the Change in Status Date and the employee’s Pay on or after the Change in Status Date. In the case of a regular employee who during the Plan Year changes employment status from a regular eligible status and position to a Developmental position, the foregoing rules will apply, except that with respect to employment on or after the Change in Status Date, the employee will retain the Plan payout target applicable to the employee’s original regular eligible status and position but any incentive payout to the employee will be determined under the Plan incentive measures of the Developmental position organization. Legacy short-term or other temporary assignments (as determined by the Company or applicable Participating Subsidiary) will not change the incentive plan or level that an employee is assigned to. The employee will remain in his or her regular role for payout calculation purposes. RELATIONSHIP TO OTHER COMPANY PLANS Employees who participate in another short term incentive plan (for example, an incentive plan at Integrys Energy Services, Inc.) are not eligible to participate in this Plan until the time their participation in the other short term incentive plan terminates.
Case No. U-17273 Witness: Noreen E. Cleary
Exhibit A-10 (NEC-1) Page 10 of 11

RIGHTS OF PARTICIPANTS & FORFEITURE Nothing in this Plan shall:
(1) Confer upon any employee any right with respect to continuation of employment with the Company;
(2) Interfere in any way with the right of the Company or the Participating Subsidiaries or any other affiliate to terminate his/her employment at any time; or
(3) Confer upon any employee or any other person any claim or right to any distribution under the Plan except to the extent that a payment has been earned based upon the achievement of the measures applicable to the employee and the employee otherwise satisfies the eligibility requirements of the Plan.
No right or interest of any employee in the Plan shall, prior to actual payment or distribution to the employee, be assignable or transferable in whole or in part, either voluntarily or by operation of law or otherwise, or be subject to payment of debts of any employee by execution, levy, garnishment, attachment, pledge, bankruptcy, or in any other manner.
ADMINISTRATION
The Compensation Committee of the Board of Directors has delegated to the CEO its authority and responsibility with respect to the Plan. Accordingly, the CEO is authorized to 1) interpret and apply the Plan’s terms and conditions, 2) determine who will participate in the Plan and the level of participation, and 3) approve, within the first 90 days of the Plan Year, the performance measures that are applicable to a covered employee’s participation. The CEO’s authority does not include the authority to 1) modify the performance measures once initially established and approved within the first 90 days of the Plan Year, or 2) to adjust payout amounts that have been earned under the Plan provisions.
Case No. U-17273 Witness: Noreen E. Cleary
Exhibit A-10 (NEC-1) Page 11 of 11

STATE OF MICHIGAN
BEFORE THE MICHIGAN PUBLIC SERVICE COMMISSION
* * * * * In the matter of the application of ) MICHIGAN GAS UTILITIES CORPORATION ) for authority to increase retail natural gas rates. ) Case No. U-17273 )
DIRECT TESTIMONY & EXHIBITS OF
CHARLES F. HAUSKA
FOR
MICHIGAN GAS UTILITIES CORPORATION
June 7, 2013

- 2 -
STATE OF MICHIGAN
BEFORE THE MICHIGAN PUBLIC SERVICE COMMISSION
* * * * *
In the matter of the application of ) MICHIGAN GAS UTILITIES CORPORATION ) for authority to increase retail natural gas rates. ) Case No. U-17273 )
QUALIFICATIONS OF
CHARLES F. HAUSKA PART I
Q. Please state your name, business address and position. 1
A. My name is Charles F. Hauska. My business address is 899 S. Telegraph, Monroe, 2
Michigan 48161. I am Operating Vice President for Michigan Gas Utilities 3
Corporation (“MGUC”). MGUC is a wholly-owned subsidiary of Integrys Energy 4
Group, Inc. (“Integrys”). 5
6
Q. For whom are you providing testimony? 7
A. I am providing testimony on behalf of MGUC. 8
9
Q. Briefly describe your educational, professional, and utility background. 10
A. I received a Bachelor of Science degree in mechanical engineering from Tri-State 11
University in Angola, Indiana, in 1981 and became a licensed professional engineer 12
in the state of Michigan in 1989. I also attended the Public Utility Executive Program 13
at the University of Michigan in 1987. I have been employed by MGUC, or its 14
predecessor company, since 1973. I have held various supervisory and managerial 15
positions in operations, engineering and network management. 16
17
18

- 3 -
Q. Have you previously testified before any regulatory agency? 1
A. Yes. I have testified before the West Virginia Public Service Commission, the 2
Minnesota Public Utilities Commission and the Michigan Public Service Commission 3
(“Commission”). 4

- 4 -
CHARLES F. HAUSKA DIRECT TESTIMONY
PART II
Q. What is the purpose of your testimony? 1
A. The purpose of my testimony is to discuss capital investments over $500,000, as 2
well as explain Known & Measurable (“K&M”) expenses associated with certain 3
Operating and Maintenance (“O&M”) accounts. 4
5
Q. Are you sponsoring any exhibits in this proceeding? 6
A. Yes, I am. I am sponsoring the following exhibits: 7
1. Exhibit A-2 (CFH-1), Schedule B5, 8
2. Exhibit A-3 (CFH-2), Schedules C16 – C21, 9
10
Q. Did you cause these exhibits to be prepared? 11
A. Yes, I did. 12
13
Capital Investments Over $500,000 14 Q. Please describe Schedule B5 of Exhibit A-2 (CFH-1). 15
A. Schedule B5 of Exhibit A-2 (CFH-1) identifies the capital projects with expenditures 16
greater than $500,000 forecasted from July 2012 through December 2014. These 17
expenditures were forecasted in our 2013 budget process which was prepared in the 18
fall of 2012. 19
20
Q. Please continue. 21
A. In 2012, MGUC had only one project that exceeded $500,000. This project was a 3 22
mile, 10” steel transmission line in the Coldwater area. Its total cost was 23
approximately $2.3 million. 24
25

- 5 -
Q. What was the purpose of this project? 1
A. The purpose of this project was to address reliability and safety concerns regarding a 2
segment of existing 10” steel transmission line installed in 1950 that traversed 3
through the City of Coldwater at a Maximum Allowable Operating Pressure (“MAOP”) 4
of 720 pounds per square inch (“psi”). This segment was identified for replacement 5
for several reasons. First, it passed through residential areas, as well as several 6
High Consequence Areas (“HCA”) containing a school, churches, and a prison. (An 7
HCA is an area flagged pursuant to U.S. Department of Transportation Pipeline & 8
Hazardous Materials Safety Administration (“PHMSA”) regulations as being of 9
special concern due to high population density or the presence of occupied 10
structures that would be difficult to evacuate.) Additionally, during “dig-ups” required 11
by PHMSA pipeline integrity management rules, MGUC discovered areas of 12
damaged and dis-bonded coating indicating degraded material integrity. Finally, 13
MGUC has also experienced leakage on welds along this segment. 14
15
Q. How did the new pipeline address these situations? 16
A. The existing pipeline segment was replaced by constructing a new transmission line 17
segment around the outskirts of Coldwater. The new segment allowed MGUC to 18
maintain the pressures and volumes required to serve the Coldwater area while 19
reducing the pressure on the existing segment to approximately 300 psi. The new 20
transmission line segment also was routed to avoid the HCAs, which provided for a 21
safer and more reliable distribution system for the City of Coldwater. The new 22
pipeline segment was placed in service by December 31, 2012. 23
24
Q. What is the next capital item you will be addressing? 25
A. The next item is a transmission project currently under construction in the Monroe 26
area. It has a total project cost of $4,000,000. 27

- 6 -
1
Q. Please continue. 2
A. Similar to the Coldwater project, the Monroe project involves a segment of 12” 3
transmission line that was installed in 1950 and which operates at approximately 450 4
psi. The existing Monroe transmission line traverses through an industrial park 5
containing HCAs, as well as a commercial and residential area. It also includes 6
casings at street and railroad crossings that are required to be replaced by federal 7
PHMSA regulations. MGUC conducted pipeline integrity management investigations 8
of this segment of the Monroe transmission line and discovered numerous safety 9
concerns, including pipe coating faults, shallow depths of less than 12”, and dents 10
and other damages to the pipe (caused by third parties over the years). 11
12
Q. How will the new pipeline address reliability and safety concerns? 13
A. The new pipeline will be re-routed along the perimeter of the industrial area to avoid 14
HCAs to the greatest extent practicable, and it will be constructed to today’s material 15
and construction standards, which will allow it to operate as a high pressure 16
distribution line. The existing main will be retired. Construction of this project is 17
scheduled to begin in June 2013 and be completed by year end. 18
19
Known & Measurable Items 20 Q. Please describe Schedule C16 of Exhibit A-3 (CFH-2). 21
A. Schedule C16 of Exhibit A-3 (CFH-2) displays the increase of $70,502 in FERC 22
Account 819, Compressor Station Fuel associated with underground Storage. 23
During the 2012 Historic Test Year, MGUC only filled a portion of its company owned 24
storage reservoirs. This was due to not depleting working volumes during the 25
withdrawal season because of significantly warmer than normal weather, as well as 26
not filling a reservoir that was shut-in for an18-month engineering test. The revised 27
amount anticipates compressor fuel required to fill storage to a level consistent with 28

- 7 -
GCR customer requirements during normal winter weather conditions. 1
2
Q. Please describe Schedule C17 of Exhibit A-3 (CFH-2). 3
A. Schedule C17 of Exhibit A-3 (CFH-2) displays an increase of $80,000 in FERC 4
Account 832, Maintenance of Reservoirs and Wells. MGUC has established a 5
program for periodically performing logs on the Company’s injection and withdrawal 6
wells associated with its underground storage reservoirs. These logs examine the 7
integrity of the well casings with respect to defects caused by corrosion as well as 8
ensuring bonding of cement to the casing to eliminate potential migration of gas 9
along the casing if a leak occurred. In 2012, MGUC performed capital work 10
associated with rebuilding some of these injection/withdrawal wells. The typical 11
logging program was unnecessary for the rebuilt wells, which decreased the amount 12
of O&M in 2012 from that which was historically spent. In 2013 and beyond, MGUC 13
will return to the regular program performing logs on the injection and withdrawal 14
well, which will require O&M funding beyond the inflated 2012 amount spent. 15
16
Q. Please describe Schedule C18 of Exhibit A-3 (CFH-2). 17
A. Schedule C18 of Exhibit A-3 (CFH-2) displays the increase of $250,000 in FERC 18
Account 880, Other Expenses. The primary reason for these additional costs are 19
O&M expenses associated with MGUC owned office buildings. 20
21
Q. Please explain the reasons for these additional O&M expenses. 22
A. MGUC owns five district office facilities located in Grand Haven, Benton Harbor, 23
Otsego, Coldwater and Monroe. It also has office and plant facilities located at the 24
underground storage operations in Partello. The Coldwater, Benton Harbor and 25
Grand Haven facilities were built approximately 20 years ago. Up to this point, there 26
have been very few renovations and limited maintenance performed on the buildings 27

- 8 -
because the facilities were relatively new. However, there are numerous issues 1
beginning to rise that need to be addressed to keep the buildings in proper repair. 2
This includes interior and exterior painting, cracks in mortar joints, parking lot repairs, 3
minor HVAC repairs, and electrical updates. MGUC’s Monroe facilities were built in 4
1978 and 1981. These two buildings and associated grounds are also in need of 5
repairs and maintenance beyond what has been spent in recent years. Without the 6
increase in spending on maintenance, all of these buildings will fall into a level of 7
disrepair that will require major capital expenditures to replace components. MGUC 8
has begun a program in 2013 to address these issues that were not included in the 9
2012 historic test year. Specifically, at the Coldwater facility, we have done interior 10
wall repairs, painting, and floor maintenance and are in the process of evaluating 11
lighting upgrades for energy conservation. We are evaluating necessary exterior 12
repairs as well. These types of projects are also planned for the Benton Harbor and 13
Grand Haven facilities, given the similar age and construction of the buildings. The 14
Company is budgeting to spend $250,000 per year for the next several years to keep 15
these facilities in a proper state of repair. 16
17
Q. Please describe Schedule C19 of Exhibit A-3 (CFH-2) and Schedule C21 of 18
Exhibit A-3 (CFH-2). 19
A. Schedule C19 of Exhibit A-3 (CFH-2) displays the increase of $407,000 in FERC 20
Account 885, Operations Supervision and Engineering Expenses and Schedule C21 21
of Exhibit A-3 (CFH-2) displays an increase of $505,000 in FERC Account 902, 22
Meter Reading Expenses. 23
24
Q. Please explain the reasons for the increase in Account 885. 25
A. In the past, MGUC has experienced an employee attrition rate of approximately 2% 26
per year. During the 2012 historic test year, MGUC experienced an unprecedented 27

- 9 -
employee turn-over of approximately 13%. This included Network Operations 1
Supervisor positions in Benton Harbor and Coldwater, a Customer Operations 2
Supervisor in Coldwater and a Cathodic Protection Technician in Benton Harbor. 3
Due to the time lag associated with recruiting and hiring, these positions were vacant 4
for several months at a time. Therefore, the O&M costs associated with these 5
vacancies are significantly understated in the 2012 historic test year expenses. 6
Additionally, two engineering staff positions were approved late in the year, deemed 7
necessary because of the experience and expertise that is being lost with the 8
numerous retirements occurring and pending. One of the positions was filled early in 9
2013 and the Company is currently in the process of hiring the second, so the 10
associated costs of these two engineering positions are not included in the 2012 test 11
year expenses. A Construction Coordinator position was also added in Benton 12
Harbor to address increased work load being experienced in that area. This position 13
was filled in December 2012; so again, the vast majority of the costs associated with 14
the new Construction Coordinator position are not included in the 2012 historic test 15
year. The total cost of these vacancies and added positions not included in the test 16
year expenses equates to $407,000 in account 885. 17
18
Q. Please explain the reasons for the increase in Account 902. 19
A. During 2012, MGUC experienced similar attrition in its “front line” union workforce 20
due to retirements, as well as union employees applying for non-union vacancies. 21
This caused an exorbitant amount of vacancies in the union workforce, which 22
required posting for backfilling, training, and recruiting and hiring. Most of the 23
vacancies being filled are entry-level, meter reader positions. In 2012, because of 24
these vacancies and the time required to fill and train them, MGUC experienced its 25
lowest percentage of meters being read in many years. Schedule C21, Exhibit A-3 26
(CFH-2), shows that $505,000 of additional O&M costs in FERC Account 902, Meter 27

- 10 -
Reading Expenses, and are necessary to return MGUC’s meter reading capability to 1
a level that will comply with the Commission billing rules and MGUC’s tariff. 2
3
Q. Please describe Schedule C20 of Exhibit A-3 (CFH-2). 4
A. Schedule C20 of Exhibit A-3 (CFH-2) displays the increase of $250,000, in Account 5
887, Maintenance of Mains. As part of MGUC’s Distribution Integrity Management 6
Program (“DIMP”), there are two areas that will be addressed that were not included 7
in 2012: (i) integrity of portions of its High Pressure Distribution system that contains 8
1950 vintage ERW steel pipe and (ii) early vintage (pre 1973) Aldyl A polyethylene 9
pipe. 10
11
Q. Why is MGUC focusing on these 2 areas? 12
A. Although MGUC has not yet experienced significant issues with the integrity of its 13
ERW steel pipe and its vintage plastic pipe, the industry as a whole has reported 14
multiple failures due to degradation of 1950 vintage ERW steel pipe and vintage 15
Aldyl A polyethylene pipe. MGUC believes in being proactive in maintaining a safe 16
and reliable system. MGUC plans to evaluate the portions of its system containing 17
these two types of main to determine if the pipe should be replaced. However, there 18
is no current funding in MGUC’s budgets for this evaluation. 19
20
Q. How does MGUC plan to evaluate the 1950 vintage ERW steel pipe? 21
A. MGUC intends to perform engineering analysis on the system in the Coldwater – 22
Sturgis area, which was installed in 1950. This system contains ERW pipe that has 23
experienced significant leakage, caused by construction defects on welds. MGUC 24
will examine the condition of the welds on sections of pipe that have been removed, 25
as well as the integrity of the seams. MGUC will also explore the potential of running 26
intelligent pigs through certain segments. 27

- 11 -
1
Q. What are MGUC’s intentions regarding its vintage Aldyl A polyethylene pipe? 2
A. MGUC has vintage Aldyl A polyethylene pipe that dates back to the late 1960’s when 3
DuPont first introduced it to the market. MGUC will retrieve samples of this older pipe 4
from various installation years and geographic locations and have lab analyses 5
performed to determine brittleness. If the analyses indicate potential failure, the 6
Company will develop a program for the replacement of this type of pipe. 7
8
Q. What are the anticipated costs of the programs you have described? 9
A. MGUC anticipates an initial cost of $250,000 per year to begin funding these 10
programs. It would potentially grow, based on the outcomes of the initial findings. 11
12
Q. Does this conclude your pre-filed direct testimony? 13
A. Yes, it does. 14

Case No.: U-17273Exhibit No.: A-2 (CFH-1)
Schedule: B5Page: 1 of 1
Witness: Charles F. Hauska
7/1 - 12/31Line Project Number Project Description 2012 2013 2014 Total
12 GAS PROJECTS3 140010003 COLDWATER, 3 MILE, 10" STEEL TRANSMISSION LINE $2,300,000 $2,300,0004 140000021 MONROE 12" TRANSMISSION LINE RELOCATION $4,000,000 $4,000,00045 TOTAL - GAS PROJECTS $2,300,000 $4,000,000 $0 $6,300,000
Michigan Gas Utilities Corporation Capital Projects with Expenditures over $500,000
Note: All values are Expenditures, not 13-month averages.

Case No.: U-17273Exhibit No.: A-3 (CFH-2)
Schedule: C16Page: 1 of 1
Witness: Charles F. Hauska
Line
1 $ 70,502
2 $ -
3 1.708%
4 1.993%
5 3.74%
6 $ -
7 2012 Costs Inflated to 2014 $ -
8 $ 70,502
Account 819
2014 Costs
Michigan Gas Utilities CorporationCalculation of Storage Field Costs
Known and Measurable Adjustment
2012 Costs
Inflation on 2012 Costs
Known and Measurable Increase (Decrease) in 2014
2013 Inflation
2014 Inflation
Composite Inflation

Case No.: U-17273Exhibit No.: A-3 (CFH-2)
Schedule: C17Page: 1 of 1
Witness: Charles F. Hauska
Line
1 $ 80,000
2 $ -
3 1.708%
4 1.993%
5 3.74%
6 $ -
7 2012 Costs Inflated to 2014 $ -
8 $ 80,000
Account 832
2014 Costs
Michigan Gas Utilities CorporationCalculation of Well Logs Costs
Known and Measurable Adjustment
2012 Costs
Inflation on 2012 Costs
Known and Measurable Increase (Decrease) in 2014
2013 Inflation
2014 Inflation
Composite Inflation

Case No.: U-17273Exhibit No.: A-3 (CFH-2)
Schedule: C18Page: 1 of 1
Witness: Charles F. Hauska
Line
1 $ 250,000
2 $ -
3 1.708%
4 1.993%
5 3.74%
6 $ -
7 2012 Costs Inflated to 2014 $ -
8 $ 250,000
Account 880
2014 Costs
Michigan Gas Utilities CorporationCalculation of Building Expenses
Known and Measurable Adjustment
2012 Costs
Inflation on 2012 Costs
Known and Measurable Increase (Decrease) in 2014
2013 Inflation
2014 Inflation
Composite Inflation

Case No.: U-17273Exhibit No.: A-3 (CFH-2)
Schedule: C19Page: 1 of 1
Witness: Charles F. Hauska
Line
1 $ 407,000
2 $ -
3 1.708%
4 1.993%
5 3.74%
6 $ -
7 2012 Costs Inflated to 2014 $ -
8 $ 407,000
Account 885
2014 Costs
Michigan Gas Utilities CorporationCalculation of Non-Union Staff Vacancies
Known and Measurable Adjustment
2012 Costs
Inflation on 2012 Costs
Known and Measurable Increase (Decrease) in 2014
2013 Inflation
2014 Inflation
Composite Inflation

Case No.: U-17273Exhibit No.: A-3 (CFH-2)
Schedule: C20Page: 1 of 1
Witness: Charles F. Hauska
Line
1 $ 250,000
2 $ -
3 1.708%
4 1.993%
5 3.74%
6 $ -
7 2012 Costs Inflated to 2014 $ -
8 $ 250,000
Account 887
2014 Costs
Michigan Gas Utilities CorporationCalculation of High Risk Mains
Known and Measurable Adjustment
2012 Costs
Inflation on 2012 Costs
Known and Measurable Increase (Decrease) in 2014
2013 Inflation
2014 Inflation
Composite Inflation

Case No.: U-17273Exhibit No.: A-3 (CFH-2)
Schedule: C21Page: 1 of 1
Witness: Charles F. Hauska
Line
1 $ 505,000
2 $ -
3 1.708%
4 1.993%
5 3.74%
6 $ -
7 2012 Costs Inflated to 2014 $ -
8 $ 505,000
Account 902
2014 Costs
Michigan Gas Utilities CorporationCalculation of Union Staff VacanciesKnown and Measurable Adjustment
2012 Costs
Inflation on 2012 Costs
Known and Measurable Increase (Decrease) in 2014
2013 Inflation
2014 Inflation
Composite Inflation

STATE OF MICHIGAN
BEFORE THE MICHIGAN PUBLIC SERVICE COMMISSION
* * * * * In the matter of the application of ) MICHIGAN GAS UTILITIES CORPORATION ) for authority to increase retail electric rates. ) Case No. U-17273 )
DIRECT TESTIMONY AND EXHIBIT OF
BRIAN E. KAGE
FOR
MICHIGAN GAS UTILITIES CORPORATION
June 7, 2013

- 2 -
STATE OF MICHIGAN
BEFORE THE MICHIGAN PUBLIC SERVICE COMMISSION
* * * * *
In the matter of the application of ) MICHIGAN GAS UTILITIES CORPORATION ) for authority to increase retail electric rates. ) Case No. U-17273 )
QUALIFICATIONS OF
BRIAN E. KAGE PART I
Q. Please state your name, business address and position. 1
A. My name is Brian E. Kage. My business address is Integrys Business Support, LLC 2
(“IBS”), 700 North Adams Street, P.O. Box 19001, Green Bay, WI 54307-9001. I am 3
the General Manager of Strategy and Business Performance of Integrys Energy 4
Group, Inc. (“Integrys”). Both IBS and Michigan Gas Utilities Corporation (“MGUC”) 5
are wholly-owned subsidiaries of Integrys. 6
7
Q. For whom are you providing testimony? 8
A. I am providing testimony on behalf of MGUC. 9
10
Q. Please describe briefly your educational, professional, and utility background. 11
A. I graduated from Texas Christian University with a Bachelor of Business 12
Administration in Finance. I began my career with Integrys in January 2007 as Value 13
Manager in the Corporate Development area. In April 2008, I assumed my current 14
position as General Manager of Strategy and Business Performance in the Customer 15
Relations department. Prior to working for Integrys, I worked for Accenture and 16
Black & Veatch where I provided services for North American and International 17
utilities in the areas of Customer Operations & Application Strategy, Merger & 18

- 3 -
Acquisitions Value Capture, and CIS implementations. 1
2
Q. Have you previously testified before any regulatory agency? 3
A. No, I have not. 4

- 4 -
BRIAN E. KAGE DIRECT TESTIMONY
PART II
Q. What is the purpose of your pre-filed direct testimony? 1
A. The purpose of my pre-filed direct testimony is to describe the Integrys Customer 2
Experience ICE 2016 (“ICE 2016”) project, as well as the Intangible Benefits of the 3
ICE 2016 project to MGUC and the other five Integrys regulated utilities. 4
5
Q. Are you sponsoring any exhibits in this proceeding? 6
A. Yes, I am. I am sponsoring Exhibit A-3 (BEK-1), Schedule C36, consisting of 3 7
pages. 8
9
Q. Was this exhibit prepared by you or under your direction and supervision? 10
A. Yes, it was. 11
12
Q. Please describe Exhibit A-3 (BEK-1), Schedule C36 13
A. Exhibit A-3 (BEK-1), Schedule C36 summarizes the various cost and savings inputs 14
to the economic analysis used to evaluate the various options considered for the ICE 15
2016 project. These values were used in the economic analysis described in the 16
pre-filed direct testimony of Michael E. Gerth. 17
18
Q. What is the ICE 2016 project? 19
A. The Integrys family of six regulated utilities currently operate with three distinct billing 20
systems: 21
1. The “Open-C” system for WPS Corp and UPPCO, 22 23 2. The “Vertex” system for MGUC and Minnesota Energy Resources 24
Corporation (“MERC”), and 25 26 3. The “C-First” system for The Peoples Gas Light and Coke Company 27
(“PGL”) and North Shore Gas Company (“NSG”). 28

- 5 -
1
The ICE 2016 project will result in a single billing system for all six Integrys regulated 2
utilities. 3
4
Q. Other than providing a single billing system for all six Integrys regulated 5
utilities, what other features and benefits result from the ICE 2016 project? 6
A. The intangible benefits that the ICE 2016 project will provide to MGUC and the other 7
Integrys regulated utilities are improved efficiency and productivity as a result of 8
converting from the current MGUC Customer Information System (“CIS”) technology 9
platform (Vertex) onto the Open-C technology platform. 10
11
One of the most important benefits of ICE 2016 is that it will provide overall 12
standardization of internal delivery processes and system technology platforms 13
which will improve customer satisfaction, increase productivity, and increase 14
efficiency by lowering overall operating costs. 15
16
Next, ICE 2016 will improve and enhance the features of our Billing, Collections, Call 17
Center, and Self-Service related offerings by ensuring that these functions are 18
staffed appropriately to continue to leverage the opportunities of a large corporation, 19
while maintaining the high level of service of a local utility. 20
21
Further, ICE 2016 will provide a standardized process architecture and technology 22
platform that will enable the Integrys regulated utilities to achieve and sustain first 23
quartile performance in cost management (cost per customer), customer satisfaction, 24
and service quality for the Billing, Collections, Call Center, and Self Service 25
functions. Specifically, the benefits of this project include improved customer 26
experience through implementation of several improvements to our Interactive Voice 27

- 6 -
Response (“IVR”) and web self-service channels that will increase our customer’s 1
use of these channels, and reduce the number of inbound calls to our call centers. 2
These improvements include: 3
• The automation of customer turn-offs. 4 5
• The ability to schedule service appointments. 6 7
• Improved use of bill analyzer tools. 8 9
• Providing customers with web access to their bill image. 10 11
• Several usability type improvements. 12 13
• Consolidating all utilities onto a single web, telephone and IVR 14 platform. 15
16
Several improvements that will increase our first call resolution and customer 17
satisfaction include: 18
• An improved call center agent on-line encyclopedia. 19 20
• Deployment of a First Call Resolution analytical tool. 21 22
• Improved call center Q&A and agent monitoring. 23 24
• An improved complaint identification and resolution process. 25 26
Other functions that ICE 2016 will provide include: 27
• Deployment of a Credit Model which improves collections 28 performance through implementation of a customer behavioral/risk 29 score that will help to improve the efficiency and effectiveness of 30 our collection actions. 31 32
• Improved collection schedules that will work in conjunction with 33 the customer behavioral/risk score to further ensure increased 34 effectiveness of our collection actions. 35
36 • Improved enrollment processes for new customers that will secure 37
deposits for high risk customers, and implement additional steps 38 to verify customer identity, thereby reducing the number of 39 fraudulent applications. 40
41 • The reporting of customer payment behavior, both positive and 42
negative, to the Credit Bureaus. 43 44

- 7 -
• Improved processes for locating and contacting customers who 1 have finalized their account. 2
3
Finally, ICE 2016 will provide improved Billing and Payment related performance by 4
continuing to implement our strategy for: 5
• Increased e-Bill adoption. 6 7
• Making improvements in the Bill Estimation routine. 8 9
• Improving our bill printing, document imaging, and document 10 storage capabilities. 11
12 • Providing real-time electronic payment information to our Call 13
Center and Self Service channels to improve the customer 14 reconnection for nonpayment process. 15
16 • Automating the Non-Sufficient Funds check process with our 17
banks. 18 19
Q. What options were considered for the ICE 2016 project? 20
A. Option 1 assumed Integrys would consolidate from the current three CIS platforms 21
and associated business operating models to one enhanced Open-C platform that 22
will support standardized business processes for all six regulated utilities by 2016. 23
Open-C is the CIS currently used by Integrys affiliates WPS Corp and UPPCO. This 24
is known as the “3 to 1 option”. 25
26
Option 2 assumed Integrys would consolidate from three to two CIS platforms: Open-27
C for all Integrys utilities except PGL and NSG, which would remain on their currently 28
existing CIS known as C-First. Option 2 was assumed to be completed by 2015. 29
This is known as the “3 to 2 option”. 30
31
Option 3 assumed Integrys would first consolidate from three to two CIS platforms 32
(same as Option 2) by 2015, and then move to one CIS platform (Open-C) by 2018. 33
This is known as the “3 to 2 to 1 option”. 34

- 8 -
1
Q. How were the various costs used in the economic analysis derived? 2
A. For the 3 to 1 option, the various costs were developed during a Business 3
Requirements Design phase which designed all Customer Operations related 4
processes and the requirements necessary to implement those processes. Those 5
requirements were then analyzed to determine the technology changes necessary to 6
implement those processes across all six utilities. In addition, the necessary change 7
management impacts were analyzed and estimated. 8
9
For the 3 to 2 option, the various costs were developed by limiting the scope to 10
converting MGUC and MERC to the same platform as WPS Corp and UPPCO (i.e., 11
Open-C), while PGL and NSG would remain on their existing platform (i.e., C-First). 12
Limited changes to the processes in Open-C would be made to accommodate MGU 13
and MERC. 14
15
For the 3 to 2 to 1 option, the costs for the 3 to 1 option were analyzed to determine 16
the impact of an elongated schedule and two distinct implementations. 17
18
Q. How were the cost savings for the economic analysis derived? 19
A. The technology and operational costs for our current state customer operations were 20
modeled over a 15 year period from 2012 – 2026. For each of the three different 21
options analyzed, the reductions in O&M and Capital expenditures was determined 22
and applied in the appropriate year. For on-going savings, they were inflated by 23
2.7% from the year identified to 2026. 24
25
The various costs and savings for each option are summarized on Exhibit A-3 (BEK-26
1), Schedule C36. 27

- 9 -
1
MGUC’s O&M costs associated with the 2014 projected test year are included in 2
Exhibit A-3 (KAD-3), Schedules C22 and C31, which are sponsored by Ms. 3
Katherine De Cramer. 4
5
Q. Does this conclude your pre-filed direct testimony? 6
A. Yes, it does. 7

Case No. U‐17273
Witness: Brian E. Kage
Exhibit A‐3 (BEK‐1)
Schedule C36
Page 1 of 3Integrys Energy Group, Inc.ICE 2016 ProjectInputs Into Summary of Calculations of Net Present Value of Revenue Requirement ("NPVRR")
Option 1‐ Conversion from 3 Customer Information Systems to 1 by 2016
Cost To Achieve ‐ Capital
Hardware 3,201,000$
Software 5,285,000
Miscellaneous Inv. & Exp 5,208,000
Internal Labor 16,405,000
External Labor 34,237,000
Total 64,336,000$
Cost To Achieve ‐ O&M
Hardware ‐$
Software 883,000
Miscellaneous Inv. & Exp 870,000
Internal Labor 4,255,000
External Labor 6,392,000
Total 12,400,000$
Undiscounted Estimated Savings ‐ Capital
Hardware (16,709,000)$
Software (255,000)
Miscellaneous Inv. & Exp (227,000)
Internal Labor (3,064,000)
External Labor (4,595,000)
Total (24,850,000)$
Undiscounted Estimated Savings ‐ O&M
Hardware ‐$
Software (9,459,000)
Miscellaneous Inv. & Exp (124,045,000)
Internal Labor (60,238,000)
External Labor (1,149,000)
Cost of Capital Reduction (5,675,000)
Reduction in Bad Debt Expense (3,784,000)
Total (204,350,000)$

Case No. U‐17273
Witness: Brian E. Kage
Exhibit A‐3 (BEK‐1)
Schedule C36
Page 2 of 3Integrys Energy Group, Inc.ICE 2016 ProjectInputs Into Summary of Calculations of Net Present Value of Revenue Requirement ("NPVRR")
Option 2‐ Conversion from 3 Customer Information Systems to 2 by 2015
Cost To Achieve ‐ Capital
Hardware 841,000$
Software 1,388,000
Miscellaneous Inv. & Exp 1,368,000
Internal Labor 4,246,000
External Labor 8,964,000
Total 16,807,000$
Cost To Achieve ‐ O&M
Hardware ‐$
Software 232,000
Miscellaneous Inv. & Exp 229,000
Internal Labor 1,072,000
External Labor 1,660,000
Total 3,193,000$
Undiscounted Estimated Savings ‐ Capital
Hardware ‐$
Software ‐
Miscellaneous Inv. & Exp ‐
Internal Labor ‐
External Labor ‐
Total ‐$
Undiscounted Estimated Savings ‐ O&M
Hardware ‐$
Software ‐
Miscellaneous Inv. & Exp (36,309,000)
Internal Labor ‐
External Labor ‐
Cost of Capital Reduction ‐
Reduction in Bad Debt Expense ‐
Total (36,309,000)$

Case No. U‐17273
Witness: Brian E. Kage
Exhibit A‐3 (BEK‐1)
Schedule C36
Page 3 of 3Integrys Energy Group, Inc.ICE 2016 ProjectInputs Into Summary of Calculations of Net Present Value of Revenue Requirement ("NPVRR")
Option 3‐ Conversion from 3 Customer Information Systems to 2 by 2015 and to 1 by 2018
Cost To Achieve ‐ Capital
Hardware 3,613,000$
Software 5,966,000
Miscellaneous Inv. & Exp 5,880,000
Internal Labor 18,465,000
External Labor 38,625,000
Total 72,549,000$
Cost To Achieve ‐ O&M
Hardware ‐$
Software 997,000
Miscellaneous Inv. & Exp 983,000
Internal Labor 4,769,000
External Labor 7,202,000
Total 13,951,000$
Undiscounted Estimated Savings ‐ Capital
Hardware (16,709,000)$
Software (255,000)
Miscellaneous Inv. & Exp (227,000)
Internal Labor (3,064,000)
External Labor (4,595,000)
Total (24,850,000)$
Undiscounted Estimated Savings ‐ O&M
Hardware ‐$
Software (7,527,000)
Miscellaneous Inv. & Exp (108,899,000)
Internal Labor (48,090,000)
External Labor (1,149,000)
Cost of Capital Reduction (4,516,000)
Reduction in Bad Debt Expense (3,011,000)
Total (173,192,000)$

STATE OF MICHIGAN
BEFORE THE MICHIGAN PUBLIC SERVICE COMMISSION
* * * * * In the matter of the application of ) MICHIGAN GAS UTILITIES CORPORATION ) for authority to increase retail natural gas rates. ) Case No. U-17273 )
DIRECT TESTIMONY AND EXHIBIT OF
MICHAEL E. GERTH
FOR
MICHIGAN GAS UTILITIES CORPORATION
June 7, 2013

1
STATE OF MICHIGAN
BEFORE THE MICHIGAN PUBLIC SERVICE COMMISSION
* * * * * In the matter of the application of ) MICHIGAN GAS UTILITIES CORPORATION ) for authority to increase retail natural gas rates. ) Case No. U-17273 )
QUALIFICATIONS OF
MICHAEL E. GERTH PART I
Q. Please state your name, position and business address. 1
A. My name is Michael E. Gerth. My business address is Integrys Business Support 2
LLC (“IBS”), 130 East Randolph Drive, 18th Floor, Chicago, Illinois 60101. My 3
position with Integrys is Director of Finance – Gas Utility Group. Both IBS and 4
Michigan Gas Utilities Corporation (“MGUC”) are wholly-owned subsidiaries of 5
Integrys Energy Group, Inc (“Integrys”). 6
7
Q. For whom are you providing testimony? 8
A. I am providing testimony on behalf of MGUC. 9
10
Q. Please describe briefly your educational, professional, and utility background. 11
A. I graduated from the University of Cincinnati with a Bachelor of Business 12
Administration degree in Accounting and Finance. I began my career with Peoples 13
Energy Corporation in 2004 as Manager – Financial Reporting & Compliance. After 14
the merger with Integrys in 2007, I assumed my current role as Director of Finance- 15
Gas Utility Group. 16

2
MICHAEL E. GERTH DIRECT TESTIMONY
PART II
Q. What is the purpose of your pre-filed direct testimony? 1
A. The purpose of my pre-filed direct testimony is to present the results of the economic 2
analysis used to evaluate the Integrys Customer Information System (“CIS”) initiative 3
known as ICE 2016 Project (“ICE”). ICE is an acronym for “Integrys Customer 4
Experience” and the project is more fully described in the pre-filed direct testimony of 5
Mr. Brian E. Kage. 6
7
Q. Are you sponsoring any exhibits in this proceeding? 8
A. Yes, I am. I am sponsoring Exhibit A-3 (MEG-1), Schedule C37, consisting of 1 9
page. 10
11
Q. Was this exhibit prepared by you or under your direction and supervision? 12
A. Yes, it was. 13
14
Q. Please describe Schedule C37 of Exhibit A-3 (MEG-1). 15
A. Exhibit A-3 (MEG-1), Schedule C37 is a summary of the financial assumptions, 16
inputs and results for various options considered for the ICE project. 17
18
Q. What economic analysis method was used to evaluate the ICE project? 19
A. A net present value of revenue requirements (“PVRR”) analysis for all of Integrys’ 20
regulated utility customers, discounted to 2012, was developed taking into account 21
the applicable projected costs, projected savings, accounting treatment, and 22
recovery period. Three options were examined. 23
24

3
Option 1 assumed Integrys would consolidate from the current three CIS platforms 1
and associated business operating models to one enhanced Open-C platform that 2
will support standardized business processes for all six regulated utilities by 2016. 3
Open-C is the CIS currently used by Integrys affiliates Wisconsin Public Service 4
Corporation (“WPSC”) and Upper Peninsula Power Company (“UPPCO”). 5
6
Option 2 assumed Integrys would consolidate from three to two CIS platforms: Open-7
C for all Integrys utilities except The Peoples Gas Light &Coke Company (“PGL”) 8
and North Shore Gas Company (“NSG”), which would remain on their currently 9
existing CIS known as C-First. Option 2 was assumed to be completed by 2015. 10
11
Option 3 assumed Integrys would first consolidate from three to two CIS platforms 12
(same as Option 2) by 2015, and then move to one CIS platform (Open-C) by 2018. 13
14
The impact of ICE under all three options was considered through the year 2026, 15
representing a 15-year horizon starting in 2012. 16
17
Q. Why was a PVRR analysis selected? 18
A. A PVRR analysis was selected because a PVRR analysis best models the cost and 19
savings impacts to Integrys’ regulated utility customers over the 15-year period. 20
21
Q. What was the basis for the cost estimates used in the economic analysis for 22
ICE? 23
A. The undiscounted cost and savings estimates for the three options under ICE were 24
provided to me by Mr. Brian E. Kage. The development of those undiscounted cost 25
and savings estimates is described in his pre-filed direct testimony. 26
27

4
Q. What were the results of your economic analysis? 1
A. The results are shown on Exhibit A-3 (MEG-1) Schedule C37. In short, the 2
economic analysis resulted in a PVRR net savings of $37.2 million for Option 1, a 3
PVRR net cost of $1.4 million for Option 2, and a PVRR net savings of $19.7 million 4
for Option 3. 5
6
Q. Why are there no capital expenditure savings under Option 2? 7
A. Integrys is not expecting any significant avoided capital expenditures because Option 8
2 is not a significant change from the current environment. That is, Integrys affiliates 9
MGUC and Minnesota Energy Resources Corporation (“MERC”) would be converted 10
to the same platform as WPSC and UPPCO (i.e., Open-C), while PGL and NSG 11
would remain on their currently existing platform (i.e., C-First). 12
13
Q. What were your conclusions? 14
A. Execution of Option 1 will produce the greatest net savings to Integrys’ regulated 15
utility customers over the 15 year period from 2012 through 2026. MGUC’s 16
Operations and Maintenance costs associated with the 2014 projected test year are 17
included in Exhibit A-3 (KAD-3), Schedules C22 and C31, which are sponsored by 18
Ms. Katherine De Cramer. 19
20
Q. Does this complete your pre-filed direct testimony?21
A. Yes, it does. 22

Case No. U‐17372
Witness: Michael E. Gerth
Exhibit A‐3 (MEG‐1)
Schedule C37
Page 1 of 1
Integrys Energy Group, Inc.ICE 2016 ProjectSummary of Calculations of Net Present Value of Revenue Requirement ("NPVRR")
Option 1‐ Conversion from 3 Customer Information Systems to 1 by 2016
NPVRR:
Capital Expenditures 58,779,000$
Operating & Maintenance Expense 10,179,000
Capital Expenditure Savings (15,548,000)
Operating & Maintenance Expense Savings (90,565,000)
NPVRR (Savings) Cost (37,155,000)$
Undiscounted Estimated Costs and Savings:
Capital Expenditures 64,336,000$
Operating & Maintenance Expense 12,400,000
Capital Expenditure Savings (24,850,000)
Operating & Maintenance Expense Savings (204,350,000)
Total Undiscounted (Savings) Costs (152,464,000)$
Option 2‐ Conversion from 3 Customer Information Systems to 2 by 2015
NPVRR:
Capital Expenditures 15,382,000$
Operating & Maintenance Expense 2,684,000
Capital Expenditure Savings ‐
Operating & Maintenance Expense Savings (16,713,000)
NPVRR (Savings) Cost 1,353,000$
Undiscounted Estimated Costs and Savings:
Capital Expenditures 16,807,000$
Operating & Maintenance Expense 3,193,000
Capital Expenditure Savings ‐
Operating & Maintenance Expense Savings (36,309,000)
Total Undiscounted (Savings) Costs (16,309,000)$
Option 3‐ Conversion from 3 Customer Information Systems to 2 by 2015 and to 1 by 2018
NPVRR:
Capital Expenditures 58,179,000$
Operating & Maintenance Expense 10,109,000
Capital Expenditure Savings (15,547,000)
Operating & Maintenance Expense Savings (72,457,000)
NPVRR (Savings) Cost (19,716,000)$
Undiscounted Estimated Costs and Savings:
Capital Expenditures 72,549,000$
Operating & Maintenance Expense 13,951,000
Capital Expenditure Savings (24,850,000)
Operating & Maintenance Expense Savings (173,192,000)
Total Undiscounted (Savings) Costs (111,542,000)$

STATE OF MICHIGAN
BEFORE THE MICHIGAN PUBLIC SERVICE COMMISSION
* * * * * In the matter of the application of ) MICHIGAN GAS UTILITIES CORPORATION ) for authority to increase retail natural gas rates. ) Case No. U-17273 )
DIRECT TESTIMONY AND EXHIBIT OF
TRACY L. KUPSH
FOR
MICHIGAN GAS UTILITIES CORPORATION
June 7, 2013

1
STATE OF MICHIGAN
BEFORE THE MICHIGAN PUBLIC SERVICE COMMISSION
* * * * *
In the matter of the application of ) MICHIGAN GAS UTILITIES CORPORATION ) for authority to increase retail natural gas rates. ) Case No. U-17273 )
QUALIFICATIONS OF
TRACY L. KUPSH PART I
Q. Please state your name, business address and position. 1
A. My name is Tracy L. Kupsh. My business address is Integrys Energy Group, Inc. 2
(“Integrys”), 700 North Adams Street, P.O. Box 19001, Green Bay, WI 54307-9001. I 3
am the Director – Operations Accounting for Integrys Business Support, LLC (“IBS”). 4
I am testifying on behalf of Michigan Gas Utilities Corporation (“MGUC”) in support of 5
MGUC’s application in this proceeding for authority to adjust its natural gas rates. 6
7
Q. Please describe your educational, professional, and utility background. 8
A. I graduated from Lakeland College of Sheboygan, Wisconsin in 1996 earning a 9
Bachelor of Arts degree with a major in Accounting and a minor in Economics. After 10
spending 19 years working for Unilever, a world wide consumer goods company, in 11
various cost accounting positions, I accepted my current position with IBS on 12
December 1, 2008. 13
14
My duties and experience as Director - Operations Accounting for IBS include the 15
review and approval of the IBS monthly financial statements, overseeing the proper 16
allocation of the IBS costs to the affiliates, the coordination and/or participation in the 17

2
preparation of the IBS Operation & Maintenance (“O&M”) and Capital budgets, and 1
the analysis of variances between forecasted and actual financial results of IBS. 2

3
TRACY L. KUPSH DIRECT TESTIMONY
PART II
Q. What is the purpose of your pre-filed direct testimony? 1
A. The purpose of my pre-filed direct testimony is to describe the services provided by 2
IBS under the Master Regulated Affiliated Interest Agreement (“Regulated AIA”) 3
between IBS and its regulated utility affiliates. In this testimony I will: 4
1. Provide an overview of the basic philosophy and goals of IBS’s business 5 operations, 6
7 2. Describe the corporate structure of IBS and the services IBS provides to its 8
affiliates, and 9 10
3. Describe the various cost allocation methodologies and formulas that 11 determine the costs paid by Integrys affiliates for the services provided by 12 IBS. 13
14
Q. Are you sponsoring any exhibits with your direct testimony? 15
A. Yes, I am. I am sponsoring Exhibit A-3 (TLK-1), Schedule C32, which is the 16
Regulated AIA. I am also sponsoring Exhibit A-3 (TLK-1), Schedule C33, which 17
describes the various assets owned by IBS, and the allocation methods used to 18
allocate the costs associated with these assets. 19
20
Q. Were these exhibits prepared by you or under your direction and supervision? 21
A. Yes, they were. 22
23
Q. Has the Regulated AIA between IBS and its regulated utility affiliates been the 24
subject of a proceeding before the MPSC previously? 25
A. Yes, it has. The Regulated AIA between IBS and its regulated utility affiliates was 26
submitted to the Michigan Public Service Commission (“MPSC” or the “Commission”) 27
in connection with MGUC, Wisconsin Public Service Corporation (“WPS Corp”) and 28

4
Upper Peninsula Power Company (“UPPCO”) seeking waivers from the 1
Commission’s Code of Conduct and Affiliate Transaction Guidelines in Case No. U-2
15325. The Regulated AIA was also included in MGUC’s last general rate case - 3
MPSC Case No. U-15990. 4
5
Q. Have there been any changes to the Regulated AIA since MGUC’s last general 6
rate case proceeding? 7
A. Yes, there has. The only changes are on Exhibits “B” and “C” of the Regulated AIA. 8
These changes were previously filed with the MPSC in the electronic docket for Case 9
No. U-15325. 10
11
Q. Does MGUC seek to recover the forecasted 2014 test year costs allocated to it 12
under the Regulated AIA? 13
A. Yes, it does. The MGUC 2014 revenue requirement includes the amounts incurred 14
in 2012 inflated to 2014, and adjusted for Known and Measurable changes. This 15
resulting amount was included in the 2014 test year for the services to be provided to 16
MGUC by IBS, including the costs that are directly assigned, costs that are assigned 17
using cost-causal allocators, and costs that are assigned using the 18
General/Corporate allocator. The 2014 revenue requirement is explained by Ms. 19
Katherine A. De Cramer in her pre-filed direct testimony. 20
21
Q. Please describe the philosophy and goals underlying the operation of IBS. 22
A. IBS strives to be a leading service company provider of innovative and cost-effective 23
support services and solutions to its affiliates. IBS focuses on the following four 24
areas: 25
1. Customer Focus: Maintaining and demonstrating an in-depth understanding 26 of Integrys’ businesses, developing and delivering innovative, high-value 27

5
services that address business issues and assisting the businesses in 1 achieving their goals; 2
3 2. Service Delivery: Delivering high-quality and cost-effective services in a 4
timely manner; proactively developing, in partnership with its business 5 partners, new and innovative services and solutions that address business 6 needs, leveraging technology and process excellence across its various 7 service categories; 8
9 3. Cost Management and Value Creation: Continually seeking ways to improve 10
processes and reduce costs, opportunities to invest in people, processes and 11 technology that result in meaningful value creation for our business partners 12 and stakeholders; and 13
14 4. Employee Engagement: Maintaining a high-performance culture and staff 15
that exhibit strong technical skills, an in-depth knowledge of the business, 16 and a business mindset. 17
18
Integrys operates six regulated utilities across four states, and has a number of non-19
regulated subsidiaries. As a centralized service company, IBS strives to achieve 20
economies of scale by leveraging employees and management across many 21
affiliates and businesses. Such leveraging reduces the holding company’s system-22
wide costs, and allows those costs to be shared among a larger number of affiliates. 23
24
Q. Please briefly describe the various services provided by IBS. 25
A. The services IBS provides pursuant to the Regulated AIA are described in Exhibit A-26
3 (TLK-1), Schedule C32, pages 18 to 21. Below I show the various IBS functions 27
along with examples of the Administrative & General (“A&G”) services offered by 28
each departmental unit: 29
• Administrative -- Facility services, security services, work space 30 management services and printing services. 31
32 • Environmental -- Environmental planning, permitting, licensing, 33
compliance services, waste management and emergency response. 34 35 • CFO Services -- Accounting, treasury, tax, internal audit and related 36
financial services. 37 38 • Human Resources -- Payroll processing, benefit administration, 39
employee training and development, employee communications, labor 40

6
relations, and recruiting and staffing. 1 2 • Information Technology – Computer operations, software 3
development and maintenance, network support, end-user support, 4 database administration, information systems security, desktop, 5 website, project, infrastructure and telephony services. 6
7 • Project Services -- Project management and support, business case 8
development, competitive excellence concept development, portfolio 9 management and dam safety program management 10
11 • Legal Services -- General legal services, insurance, claims, 12
corporate records, and compliance services. 13 14 • Supply Chain -- Sourcing, fleet and materials management services. 15 16 • Utility Services -- Engineering services, planning and operation of 17
gas distribution systems, performing operational reviews of completed 18 construction, maintenance work of gas distribution lines and operating 19 meter shops, gas competitive excellences stewardship support and 20 project management for gas distribution projects, gas supply (A&G 21 and ministerial) services, and utility customer relations services such 22 as meter reading, billing, credit, collections, call center operations, 23 customer relations, revenue assurance, account management, market 24 research, and customer strategy. 25
26 • External Affairs -- Government and public relations, analysis and 27
formulation of company-wide policies and objectives, rate case 28 management, preparation and dissemination of information for 29 employees, customers, government officials, media and the public. 30
31 • Corporate Functions -- Executive management and oversight, 32
corporate secretary services, corporate-level human resources 33 services, corporate-level business development services. 34
35
Q. Please describe the Regulated AIA, under which IBS provides “shared” or 36
“inter-company” services to the utility operating companies within the Integrys 37
holding company system. 38
A. Under the Regulated AIA, Exhibit A-3 (TLK-1), Schedule C32, IBS provides the 39
services listed above to Integrys’ state-regulated utilities. Generally these services 40
comprise common A&G business activities that each affiliate would need to provide 41
internally or procure in order to operate its business. IBS may also provide additional 42
services that the regulated affiliate may request, provided that the services can be 43

7
provided in a cost-effective manner consistent with applicable law. 1
2
IBS recovers all of its costs of providing these services by direct billing the regulated 3
affiliate whenever practicable. Where direct billing is not practicable, IBS bills 4
affiliates pursuant to the cost allocation factors set forth in Exhibit A-3 (TLK-1), 5
Schedule C32, pages 22 to 27. Services are provided at cost, including direct and 6
indirect labor, overheads, and other cost loaders. The cost of maintaining assets, 7
the associated depreciation, and a return on the net assets are based on the factors 8
identified in Exhibit A-3 (TLK-1), Schedule C33. The Allocation Factors described in 9
pages 22 to 27 of Exhibit A-3 (TLK-1), Schedule C32, are designed to match the 10
costs of the services performed with the entity or entities for which the services are 11
performed. The basic premise underlying the allocation methodology and factors is 12
to regularly zero-out the allocated IBS costs of each “home center” (a departmental 13
or operational unit of IBS). 14
15
Q. Does IBS provide services to its non-regulated affiliates? 16
A. Yes, it does, pursuant to a separate, Non-Regulated AIA that is substantially similar 17
to the Regulated AIA. As explained below, the Gas Supply group within IBS 18
provides services only to the regulated operating companies. The Gas Supply 19
Group’s operations, as required by law, are kept separated from the non-regulated 20
business of Integrys Energy Services, Inc. (“Integrys Energy”) and its subsidiaries. 21
22
Q. Are the parties to the Non-Regulated AIA charged “at cost” for services 23
rendered, as are the parties to the Regulated AIA? 24
A. Yes, they are. The Allocation Factors relevant to the provision of services by IBS are 25
the same under both AIAs. IBS provides all of its services “at cost” -- which is 26

8
required under Federal Energy Regulatory Commission (“FERC”) rules of all 1
centralized service companies, and which IBS must regularly demonstrate as part of 2
its annual cost study or study-update work. Therefore, IBS’s billings to non-regulated 3
affiliates are based on either direct or allocated cost, just like its billings to regulated 4
affiliates. The Allocation Factors are the same under both AIAs. The regulated 5
affiliates of Integrys cannot subsidize their non-regulated affiliates. IBS developed 6
the Allocation Factors to ensure that all costs incurred by IBS are recovered from the 7
entity or entities who originated such costs, and in proportion to their share of the 8
whole. 9
10
Q. The services IBS provides pursuant to the Regulated AIA appear to be typical 11
A&G functions, except for some that are described above as “Utility Services.” 12
Why are these Utility Services provided by IBS? 13
A. The IBS Utility Services unit provides the administrative oversight of the utility 14
engineering, gas supply and certain customer relations functions to Integrys’ 15
regulated utilities. These services are not provided to Integrys’ non-regulated 16
subsidiaries. Thus, for example, the non-regulated subsidiaries have no access to 17
utility customer information through IBS’ provision of customer relations services. 18
The IBS Gas Supply area does not own any gas storage assets or gas supply or 19
pipeline transportation contracts -- these contracts and assets continue to be owned 20
separately by the utility that contracted for those services or that owns the storage 21
assets. Each operating company selects and maintains its own separate portfolio. 22
Each operating company has an IBS-employed manager or director over its gas 23
supply portfolio. IBS does, however, manage these various commodity and capacity 24
contracts. Combining these functions into a single entity provides for more cost 25
effective and consistent processes across the companies. 26

9
1
Q. Please describe the process IBS follows when it directly bills its costs to an 2
affiliate. 3
A. Direct billing involves a full, 100% assignment of the costs associated with a specific 4
service to the customer receiving the service. These costs include overhead 5
charges to reflect the complete cost of providing the service. An example of this 6
would be direct labor charges for an IBS engineer who is assigned to a specific 7
project for one of the affiliates. The costs associated with the engineer’s service 8
would be directly charged and billed to that affiliate for each month that the service 9
was being provided. 10
11
Q. Please describe the process IBS follows when it cannot directly bill its costs to 12
an affiliate. 13
A. In cases where direct charging is not appropriate or practical, costs are allocated 14
using cost-causation principles linked to the relationship of that type of service. This 15
allocation methodology reflects operational aspects of the charge and applies costs 16
in a meaningful and impartial way that allocates costs to the entities for which a given 17
service is provided. The remaining allocations are broad based, using the 18
General/Corporate Allocation Factor that I describe later in my testimony. The 19
primary focus of IBS’s cost allocation methodology is to direct charge as many costs 20
as reasonably possible. 21
22
Q. Can you give examples of each type of allocation? 23
A. Yes, and I will do so by describing three typical services that IBS provides. The first 24
service is provided by the Property Accounting home center. Much of the activity in 25
this home center is project-specific and is allocated through direct billing. However, 26

10
certain activities, such as processing the automated depreciation calculation each 1
month, benefit all companies. Therefore time spent on that activity is recorded in a 2
general departmental activity “cost pool” that is allocated based on each company’s 3
Property Plant & Equipment (“PP&E”) balances. 4
5
Most of the costs for services provided by the Accounts Payable home center are 6
allocated through a cost-causal factor: the number of invoices processed. Although 7
invoice processors could track their time based on the owner of each invoice, that 8
approach is not practical because the costs of doing so would be disproportionate to 9
the billing precision that would be obtained. Instead, the time spent on invoice 10
processing generally is recorded in the general departmental activity “cost pool” and 11
allocated based on each affiliate’s number of invoices. If an employee of Accounts 12
Payable works on a significant separate project for one or more affiliates, that time is 13
tracked and billed directly to the project, and those costs are direct billed and 14
excluded from the total bucket of costs allocated through the cost-causal factor. 15
16
Finally, the cost of Investor Relations activity is allocated via the General/Corporate 17
Allocator. The activities performed by this home center benefit all companies. 18
19
Q. Are additional costs loaded into the labor allocations? 20
A. Yes. With all services, the labor billed to affiliates, whether direct or allocated, 21
includes a labor loading. There are three labor-related loaders. The first is a 22
benefits loader and includes costs for pension, health coverage, life insurance, 23
vacation, disability, payroll taxes and other similar or related costs. The second 24
loader is designed to capture the cost of providing work space for the employees 25
performing the service. These costs include lease costs or operating costs if the 26

11
space is owned, depreciation and return on the building or leasehold improvements, 1
depreciation and return on furniture, PCs, common printers/copiers, etc. If another 2
entity is sharing this space with IBS, then an adjustment for billing to that entity would 3
take place prior to calculating a work space overhead. The third is a Pay-at-Risk 4
loader which captures the costs of the Pay-at-Risk compensation for the IBS non-5
union employees. This Pay-at-Risk compensation allows regular employees 6
performing services to maintain pay and benefits that are competitive at the median 7
of the market, as further described in the pre-filed direct testimony of Noreen E. 8
Cleary. 9
10
Q. How are labor costs and related loaders tracked? 11
A. When the affiliates are billed, labor costs are “loaded” to calculate the average cost 12
per hour actually worked by any given employee. All personnel who “bill” any time to 13
affiliates as a provider of services on behalf of IBS accurately report that time in 14
order to reflect actual hours worked on each service provided by or on behalf of IBS 15
separately from all other, non-IBS projects for their primary employer. 16
17
Our ultimate goal, which is a FERC requirement for centralized service companies, is 18
to be as transparent as possible in accurately reflecting all costs reasonably incurred 19
by or on behalf of IBS in its provision of services to its customers. This is particularly 20
true with respect to labor costs, which comprise a significant portion of IBS’s monthly 21
expenses. 22
23
Q. What other costs are allocated to affiliates? 24
A. In addition to labor and contract labor costs, each home center incurs general costs 25
related to running a department. This includes office supplies, administrative time 26

12
and training, among other costs. These costs are allocated to the affiliates in the 1
same proportion as the direct and cost-causal labor charged to them – that is, the 2
costs are accumulated at the higher-level functional categories, and then allocated 3
based on the percentage of labor billings to each of the affiliates at each of the high 4
levels. By doing this, these “general costs” are charged to the affiliates in a cost-5
causal manner. 6
7
In addition to general use office space and equipment, other assets including 8
systems and special use assets (e.g., print shop assets) are owned and used by IBS 9
to provide services to its affiliates. Depreciation and a return on assets, along with 10
the cost to maintain these assets, are allocated based on appropriate factors as 11
indicated on Exhibit A-3 (TLK-1), Schedule C33. 12
13
Each operational level home center also needs to perform services for other home 14
centers within IBS. The cost of that activity is charged to an IBS entity level home 15
center. The total cost charged to this home center is then allocated each month to 16
each affiliate based on the ratio of all other labor charges to each affiliate as 17
compared to the whole of such labor charges. This allocation happens after the 18
other home centers have billed but before the final billing is calculated, as described 19
below. In this manner, IBS’s own internal “cost of doing business” is allocated and 20
charged to the affiliates in a cost-causal manner – in proportion to all other labor 21
billings by IBS to each of its affiliates in a given billing period. 22
23
In addition to the above costs, a return on working capital is allocated to all affiliates 24
based on the asset category as indicated on Exhibit A-3 (TLK-1) Schedule C33, with 25
a pre-tax weighted cost of capital from the most recent rate order for each utility 26

13
applied to that allocation. 1
2
Differences between actual overhead costs incurred and overhead costs billed, are 3
allocated to affiliates each month based on the ratio of all other charges to each 4
affiliate as compared to the whole of such charges. 5
6
Home centers within IBS may also procure products and services for the benefit of 7
individual affiliates, and in such cases the associated costs are billed directly to the 8
affiliates. Contracted labor and professional services procured to assist a home 9
center in providing services are billed based on work performed, similar to internal 10
labor allocations but excluding labor overhead. 11
12
Q. Please describe the General/Corporate Allocator. 13
A. The General/Corporate Allocator is used for the allocation of costs across the 14
Integrys holding company system in cases where a service provides system-wide 15
benefits, or in any event where the cost is driven by the holding company system as 16
a whole rather than any particular entity. 17
18
Q. What cost factors go into the calculation of the General/Corporate Allocator? 19
A. There are two factors that are calculated for each entity within the Integrys holding 20
company system (including IBS): 21
1. Total assets, and 22 23 2. Total non-fuel operations and maintenance (“O&M”) costs. 24
25
For each factor a percentage is calculated to determine the individual company’s 26
portion of the total dollars in that factor. The average of these two percentages for 27
an entity is that entity’s allocation percentage, or factor, for the General/Corporate 28

14
Allocation Factor. 1
2
For both the Cost Causal Allocation Factors and the General/Corporate Allocator, a 3
“percentage of the whole” determination is used, such that the percentage charged 4
to an entity is based on that entity’s units in the numerator, and the denominator is 5
the sum total of such units for all entities within the holding company system who 6
take the particular service for which the Allocation Factor is being utilized. 7
8
Q. In calculating the total assets, how do you account for derivative assets, 9
goodwill and other “non-ordinary” assets? 10
A. These types of assets are excluded from the total asset amounts for the purpose of 11
calculating the General/Corporate Allocator. In the case of derivative assets, 12
accounting rules require the valuation of these contracts for each reporting period 13
prior to actual settlement of the contract. As commodity prices change, the value of 14
these assets will also change with no real change in the relative value of each 15
affiliate to the other affiliates. In the same way, certain companies may have booked 16
goodwill due to the fact that they were acquired by Integrys. Other companies may 17
have a similar but unrecorded intrinsic value, therefore such items are excluded in 18
order to result in a more appropriate cost allocation. 19
20
Q. Please describe the costs that are included in the Non-Fuel O&M calculation. 21
A. All O&M costs (whether regulated or non-regulated) are included in this category. 22
Examples of such costs include O&M labor, materials, and outsides services. As 23
noted earlier, fuel, cost of goods sold, purchased power and similar costs are not 24
included in these allocation calculations. Additionally, marked-to-market gains or 25
losses recorded in O&M, if any, are excluded. 26
15
1
Q. Why does Integrys believe this methodology is appropriate for the 2
General/Corporate Allocation Factor? 3
A. There is no “right answer” that works for every holding company system. Instead, 4
the appropriate general allocator depends on the unique facts and circumstances of 5
each holding company system. This is confirmed by FERC’s Uniform System of 6
Accounts (“USOA”) (18 CFR § 367.28) for centralized service companies, which 7
requires IBS to create a cost accumulation system and identify methods of allocation, 8
but does not prescribe any specific allocation methodology. 9
10
The two allocation factors that IBS chose, total assets and O&M costs, are 11
considered proxies for the relative size of each affiliate as well as the activities that 12
support each affiliate. While the corporate oversight and compliance required for any 13
individual entity has both fixed and variable aspects, a large asset base can add 14
specific risk and oversight needs as well as access to capital markets. Likewise, the 15
overall costs to run a business (O&M) requires differing degrees of oversight (e.g., 16
larger and more complex contracts, more employees, etc.). Integrys believes that 17
total assets and O&M costs provide a fair allocation of costs when using the 18
General/Corporate Allocator. 19
20
Q. How regularly are the various allocation inputs and factors re-calculated? 21
A. The allocation inputs and factors that will be used in any calendar year are calculated 22
during the preparation of the annual budget for that year. Most of these inputs and 23
factors are based on the most recent month-end balance or last twelve full months of 24
activity, as appropriate. Labor overhead rates, however, are based on projections of 25
labor and overhead costs in the budgeted calendar year. 26

16
1
The factors and inputs are modified during the calendar year only if significant 2
changes in actual or anticipated activity were to occur. 3
4
Q. How does IBS allocate costs for services that it performs for Integrys itself 5
(e.g., services related to the fact that it is a publicly-traded entity)? 6
A. For the sake of efficiency these costs are allocated by IBS to the affiliates (including 7
Integrys itself) because the functions benefit all affiliates. Another option would be to 8
first charge such costs to Integrys and then have Integrys bill its various subsidiaries, 9
but this would not be consistent with our centralized service company approach, nor 10
with the fact that we have structured our shared services organization such that 11
Integrys officers and personnel are IBS employees. Also, if we did this, Integrys 12
would use the same allocation factors and methodologies used by IBS to recover all 13
allocable costs from its subsidiaries, so the result would be to add a series of 14
unnecessary and duplicative steps to the process with no difference in the ultimate 15
results. 16
17
Integrys is allocated a portion of all other relevant and applicable costs that are 18
allocated via the appropriate Allocation Factor (including the General/Corporate 19
Allocator for many services), and such allocated costs are also charged to and 20
remain at the holding company level. Any costs that are not allocable by Integrys to 21
its subsidiaries (for example, most business development costs) are charged to and 22
remain at the holding company level. 23
24
Q. You indicated that IBS is allocated certain costs as part of the 25
General/Corporate Allocator. Are those costs then re-allocated by IBS to the 26

17
affiliates, so that it can “zero-out” all of its costs? 1
A. Yes, IBS recovers, from its affiliates, the costs allocated to it under any Allocation 2
Formula. This occurs as part of the final calculation of the various percentages 3
(adding up to 100% in every case) that I described earlier. 4
5
This is appropriate because IBS was formed to provide, at cost, cost-effective inter-6
company services. IBS allows Integrys customers to optimize the level of net 7
savings and benefits that result from a centralized service company. Therefore, it is 8
appropriate for IBS to recover its reasonably incurred costs from the affiliates. 9
10
Q. Please describe the federal regulation of IBS. 11
A. IBS is a “centralized service company” subject to FERC regulation and regulatory 12
requirements, including the Uniform Systems of Accounts (“USOA”) promulgated by 13
FERC for such entities. This exhaustive USOA, modeled after that used by utilities, 14
is found in 18 CFR Part 367. IBS must also follow the detailed record retention 15
requirements promulgated by FERC at 18 CFR Part 368. Finally, IBS must file a 16
detailed annual report with FERC, the FERC Form No. 60 (18 CFR Part 369), the 17
annual report required of all centralized service companies containing financial 18
reporting tied to USOA accounts as well as reporting various other matters and 19
transactions. FERC also has broadly defined access to the books and records of 20
holding companies and subsidiaries under 18 CFR Part 366. 21
22
Q. Is the cost of service rendered by IBS equal to or less than if MGUC performed 23
the same services on a stand-alone basis? 24
A. Yes, it is. The services provided by IBS represent activity that any company would 25
need to perform to function as a separate company. IBS generates savings for 26

18
MGUC and its customers because of the efficiencies and synergies it brings in 1
providing services to Integrys which are passed along to MGUC on a pro rata basis. 2
With IBS providing the same services to the complete Integrys family, the costs of 3
these activities can be shared among all of the companies. Although some costs are 4
variable to the size of the company, many of these costs are fixed and therefore a 5
smaller company would pay a higher amount in proportion to their relative size if the 6
service was provided by an outside party or fully staffed at the company to perform 7
the functions. MGUC could not self-provide the same overall package of services 8
provided by IBS at a lower cost. 9
10
Q. Is the arrangement between IBS and MGUC a benefit to MGUC and its 11
customers? 12
A. Yes, it is. In addition to the economies of scale described above, MGUC also 13
receives the benefit of access to in-house experts who can be retained only in larger 14
companies. For example, many of the same requirements that one utility may face 15
from an environmental compliance perspective will impact other companies within 16
the Integrys family. Having one group provide the support and research needed not 17
only lowers the costs, but helps to ensure strong compliance programs with broad 18
institutional knowledge. 19
20
Q. Based on the IBS cost allocation procedures described in your testimony and 21
documented in the Regulated AIA, are the IBS costs reasonably and equitably 22
allocated among the IBS affiliated companies? 23
A. Yes, they are. The Regulated AIA to which MGUC is a party with IBS accurately and 24
transparently assigns and allocates IBS costs to MGUC and among the other IBS 25
affiliated companies, and provides reasonable assurance to the Commission that 26

19
costs related to MGUC operations are fairly and accurately determined. 1
2
Q. Does this complete your pre-filed direct testimony? 3
A. Yes, it does. 4

MASTER REGULATED AFFILIATED INTEREST AGREEMENT
THIS MASTER REGULATED AFFILIATED INTEREST AGREEMENT
(“Agreement”) is entered into this ____ day of ____________, 2007, by and among Integrys
Business Support, LLC, a Delaware limited liability company (“Integrys Support”) and all of the
regulated subsidiaries of Integrys Energy Group, Inc. (“Integrys”) as listed and defined on
Exhibit A. All of the parties to this Agreement shall be collectively referred to as “Parties,” and
all of the Parties other than Integrys Support shall be collectively referred to as the “Client
Companies.”
RECITALS
A. Each of the Client Companies is a state-regulated utility operating company, a
wholly-owned subsidiary of Integrys, and an affiliated interest of the other Parties pursuant to
the applicable public utility law of Wisconsin, Michigan, Minnesota, and Illinois.
B. In order to maximize efficiencies and economies of scale, the Parties desire to
plan and operate their regulated utility businesses with the integration of certain activities by
receiving services, employees, properties, information systems, property, services and/or
anything else of commercial value from a single centralized service company provider.
C. Integrys Support and the Client Companies desire to enter into this Agreement
whereby Integrys Support agrees to provide, and the Client Companies agree to accept and pay
for, various services as described herein, with such payments by the Client Companies being at
the fairly and equitably allocated costs as also provided herein.
D. From time to time Integrys Support will perform various services for or on behalf
of the Client Companies, and further Integrys Support will make its property, employees and
other things of value available to or for use by the Client Companies, all of which transactions
are affiliated interest arrangements subject to the regulatory jurisdiction of the Public Service
Commission of Wisconsin (“PSCW”), Michigan Public Service Commission (“MPSC”),
Minnesota Public Utilities Commission (“MPUC”), and Illinois Commerce Commission (“ICC”)
Case No. U-17273 Witness: Tracy L. Kupsh
Exhibit A-3 (TLK-1) Schedule C32
Page 1 of 27

(collectively the “Commissions”) pursuant to applicable Wisconsin, Michigan, Minnesota, and
Illinois law.
NOW, THEREFORE, the Parties agree as follows:
AGREEMENT
Integrys Support and the Client Companies, in consideration of the mutual promises
made in this Agreement, agree as follows:
1.0 Provision of Services by Integrys Support
1.1 The term “services” as used in this Agreement shall include management,
supervisory, construction, engineering, accounting, legal, financial, human
resources, information services, customer service, accounting, billing, operations
and other administrative and general services, including without limitation the
provision of any service or any other arrangement which among affiliates may
require approvals, waivers or other authorizations under the applicable utility law
of the states of Wisconsin, Michigan, Minnesota and/or Illinois.
1.2 Except as otherwise provided herein or required under applicable law, Integrys
Support shall furnish to each Client Company services in those categories listed
and described in Exhibit B. Integrys Support shall also furnish to each Client
Company services in addition to those listed and described in Exhibit B, as may
be requested by each such Client Company from time to time, provided that
Integrys Support is reasonably able and willing to perform or provide such
services, and further provided that if an additional category of services is
requested by one or more Client Companies and is provided by Integrys Support
hereunder, the Parties shall comply with the requirements of Section 7.3. In
connection with its provision of services hereunder, Integrys Support may also
from time to time provide or furnish property, assets, rights, interests, or other
items of commercial value.
Case No. U-17273 Witness: Tracy L. Kupsh
Exhibit A-3 (TLK-1) Schedule C32
Page 2 of 27

1.3 Integrys Support shall furnish to the Client Companies the services described in
Section 1.2 in such manner as the Client Companies reasonably require from
time to time, unless Integrys Support is not reasonably able to perform or provide
such services or is unable to do so in a manner consistent with applicable law.
1.4 Notwithstanding any other provision of this Agreement, a Client Company shall,
upon at least one hundred twenty (120) days prior written notice, have the right to
purchase the services described in Section 1.2 from a service provider other than
Integrys Support if: (i) such third party service provider offers comparable
services, (ii) the Client Company presents comparable internal and external
costing and service data to demonstrate to Integrys Support that the third party
services would be provided at a lower all-in price than the all-in price charged by
Integrys Support for such services, and (iii) the Client Company presents
comparable internal and external costing and service data to demonstrate to
Integrys Support that provision of the services by a third party service provider
will be of overall benefit to the Integrys holding company system. With respect to
any such showing by a Client Company, all relevant information that is provided
by any Client Company to Integrys Support shall be copied to all of the other
Client Companies.
1.5 In the event that any Client Company appropriately refuses to take or accept any
services from Integrys Support pursuant to Section 1.4, such refusal shall not
otherwise affect any other right, duty or obligation of any Party hereunder.
1.6 The services described herein shall be directly assigned or allocated by activity,
project, program, work order or other appropriate manner on a case-by-case
basis. Each Client Company may establish and document with Integrys Support
its expectations and requirements with respect to any particular service to be
rendered hereunder, including the establishment of targeted service and
Case No. U-17273 Witness: Tracy L. Kupsh
Exhibit A-3 (TLK-1) Schedule C32
Page 3 of 27

performance levels and measures to determine whether such service level
indicators are being achieved. A Client Company shall have the right from time
to time to modify any activity, project, program or work order provided that (i) any
such modification that results in a material change in the scope of the services to
be performed or equipment to be provided is acceptable to Integrys Support, (ii)
the cost for the services covered by the activity, project, program or work order
shall include any expense incurred by Integrys Support as a direct result of such
modification of the activity, project, program or work order, and (iii) no
modification of an activity, project, program or work order shall release a Client
Company from liability for payment of all direct or allocable costs already incurred
by or contracted for by Integrys Support pursuant to the activity, project, program
or work order, regardless of whether the services associated with such costs
have been completed prior to such modification taking effect.
2.0 Determination of Costs for Services.
2.1 All services provided by Integrys Support shall be at cost, as hereinafter defined.
It is the intent of the Parties that the payment for services rendered by Integrys
Support to the Client Companies hereunder shall cover all of Integrys Support’s
costs of doing business (less the cost of services provided to affiliates not a party
to this Agreement and to non-affiliated companies, and credits for miscellaneous
income items), including, but not limited to, salaries and wages, office supplies
and expenses, outside services employed, property insurance, injuries and
damages, employee pensions and benefits, miscellaneous general expenses,
rents, maintenance of structures and equipment, depreciation and amortization,
payroll and other taxes, and compensation for use of capital (with a return on
Integrys Support’s net assets charged to each Client Company at a rate equal to
the prevailing pre-tax weighted cost of capital (economic cost of capital)
Case No. U-17273 Witness: Tracy L. Kupsh
Exhibit A-3 (TLK-1) Schedule C32
Page 4 of 27

authorized by the Commission having jurisdiction over the rates of that Client
Company).
2.2 As compensation to Integrys Support for the services rendered hereunder, each
Client Company shall pay to Integrys Support all costs which are reasonably
related to the services performed by Integrys Support for or on behalf of such
Client Company. Integrys Support shall maintain a detailed cost accumulation
and classification system, and shall allocate costs to each Client Company
pursuant to the following methodology: (i) to the extent possible and prior to
allocating costs pursuant to subsections (ii) and (iii) of this Section 2.2, costs
associated with a service that is specifically performed for a single Client
Company will be directly assigned and billed to that Client Company; all costs
directly assigned and billed to any entity taking service from Integrys Support
shall be deducted from the amount being allocated in subsections (ii) and (iii) of
this Section 2.2; (ii) where more than one Client Company receives benefits from
a service, such amounts shall be allocated among such Client Companies (and
any other affiliates within the Integrys holding company system to whom the
service is rendered by Integrys Support) pursuant to the applicable cost
Allocation Factor(s) set forth in Exhibit C; and (iii) where a service provided by
Integrys Support is of a general nature applicable to all Client Companies, costs
incurred by Integrys Support with respect to such service shall be allocated
among the Client Companies (and any other affiliates within the Integrys holding
company system to whom applicable services are rendered by Integrys Support)
pursuant to the applicable cost Allocation Factor set forth in Exhibit C.
2.3 The Allocation Factors set forth in Exhibit C shall be subject to periodic review by
Integrys Support in connection with the studies required by Section 4.3, and may
be reviewed more frequently if deemed appropriate by Integrys Support.
Case No. U-17273 Witness: Tracy L. Kupsh
Exhibit A-3 (TLK-1) Schedule C32
Page 5 of 27

2.4 The method of assignment or allocation of costs contemplated herein and in
Exhibit C and/or the Allocation Factor or Factors assigned to any category of
service in Exhibit B, may be modified or changed by Integrys Support, without
amendment of this Agreement other than insertion of appropriate replacement
Exhibits, provided that (i) all services rendered hereunder shall be at actual cost
thereof, (ii) such costs are fairly and equitably assigned or allocated in a manner
consistent with Section 2.2, and (iii) the Parties comply with the requirements of
Section 7.3.
2.5 With respect to any charges imposed by Integrys Support for services provided
under this Agreement that are subject to the jurisdiction of the FERC, no Party
shall elect, or cause any affiliate to elect on their behalf, to have the FERC review
pursuant to Section 1275 of the Energy Policy Act of 2005, 42 U.S.C. § 16462,
the allocation of costs for goods and services provided by Integrys Support until
the Commissions with jurisdiction to do so have reviewed and taken required
actions regarding the affiliated interest transactions and agreements, or
amendments thereto, associated with Integrys Support. If the Commissions have
not completed review and approval or taken other appropriate action within a
reasonable time, then any Party or its affiliate may seek such FERC review after
giving the Commissions who have not so acted at least 60 days’ prior written
notice.
3.0 Billing; Payment; Related Provisions.
3.1 Integrys Support shall render a monthly bill to each Client Company reflecting the
charges for services and property provided in the preceding month. Each bill
shall include sufficient information and in sufficient detail to permit each Client
Company to identify and classify the charge in terms of the system of accounts
prescribed by the regulatory authorities to which it is subject.
Case No. U-17273 Witness: Tracy L. Kupsh
Exhibit A-3 (TLK-1) Schedule C32
Page 6 of 27

3.2 Upon receipt of a monthly bill for services rendered by Integrys Support
hereunder, each Client Company shall promptly pay any undisputed portion of
the bill within ten (10) business days.
3.3 If a Client Company disputes the calculation of any portion of a monthly bill it
shall, when it pays the undisputed portion as contemplated by Section 3.2 or in
any event no later than sixty (60) days after receiving the bill, inform Integrys
Support in writing as to its reasons for its dispute. Integrys Support and the
Client Company shall then meet to resolve in good faith the dispute, and shall
involve the other Client Companies in the resolution of the dispute to the extent
necessary and appropriate.
4.0 Accounting and Recordkeeping; Annual FERC Reports; Cost Studies; Annual Client and
Integrys Support Company Reports; Internal Audit.
4.1 All accounts and records of Integrys Support shall be kept in accordance with the
relevant requirements promulgated by the FERC from time to time, including
without limitation Parts 367 and 368 of the FERC’s regulations. Without limiting
the foregoing, Integrys Support shall maintain adequate books and records with
respect to all of its transactions hereunder, and shall record the costs to be
allocated to the Client Companies in appropriate accounts in its general ledger
system. Integrys Support shall be responsible for maintaining internal controls to
ensure the costs associated with all transactions hereunder are properly and
consistently allocated and billed in accordance with the terms and provisions of
this Agreement.
4.2 Integrys Support shall provide the Commissions and the Client Companies a
copy of its FERC Form No. 60, or such other annual report required by the FERC
of centralized service companies from time to time, contemporaneous with its
annual filing of such report with the FERC. Integrys Support shall also file with
Case No. U-17273 Witness: Tracy L. Kupsh
Exhibit A-3 (TLK-1) Schedule C32
Page 7 of 27

the Commissions, contemporaneous with its annual filing of such report with the
FERC, the following schedules. These schedules shall list all costs incurred by
Integrys Support and all costs allocated to all entities to whom Integrys Support
provides or provided services. In Illinois, these schedules shall be filed as
supplemental schedules to Form 21.
a) A schedule summarizing the direct and indirect charges for each functional area in Exhibit B. The report shall present the dollar amounts and percentages charged to each party to this Agreement as listed in Exhibit A, as well as to all other entities that receive direct or indirect charges from Integrys Support for such functional areas.
b) A schedule providing a breakdown by subaccount of Account 923, Outside Services Employed. The schedule shall aggregate amounts paid to any one payee in each subaccount. If one subaccount is less than $100,000, only the aggregate number and amount of all such payments included within the subaccount shall be shown. The schedule shall include subtotals for each type of service.
c) A schedule providing a listing of each pension and benefit program provided by Integrys Support. Such listing shall be limited to amounts over $100,000.
d) A schedule providing a listing of the amount included in Account 930.1, General Advertising Expenses, classifying the items according to the nature of the advertising and as defined in the account definition. If a particular class includes an amount in excess of $100,000 applicable to a single payee, show separately the name of the payee and the aggregate amount applicable thereto.
e) A schedule providing a listing of the amount included in Account 931, Rents, classifying such expenses by major groupings of property, as defined in the account definition of the Uniform System of Accounts in Part 367 of the FERC’s regulations.
f) A schedule providing an analysis of Account 408, Taxes Other Than Income. The report shall separate the analysis into two groups (1) other than U.S. Government taxes and (2) U.S. Government taxes. The report shall specify each of the various kinds of taxes and show the accounts thereof. A subtotal shall be provided for each class of tax.
g) A schedule providing a listing of the amount included in Account 426.1, Donations, classifying such expense by its purpose. The aggregate number and amount of all items of less than $100,000 may be shown in lieu of details.
h) A schedule providing a listing of the amount included in Account 426.5, Other Deductions, classifying such expenses according to their nature.
Case No. U-17273 Witness: Tracy L. Kupsh
Exhibit A-3 (TLK-1) Schedule C32
Page 8 of 27

4.3 At least once every three years, Integrys Support shall conduct a new study of
the cost of services provided hereunder, for the purpose of testing compliance
with the Agreement and to analyze the market price of services provided. The
study shall be updated at least annually. Integrys Support shall provide each
Client Company with a copy of each new study or update, as the case may be,
no later than May 1 of the year following the end of the most recently completed
fiscal year covered by the new study or update. The first such new study shall
pertain to the period ending December 31, 2008, and shall be due on or before
May 1, 2009.
4.4 Each year there shall be an internal audit of Integrys Support’s transactions
involving each of the Client Companies for the purpose of testing compliance
with the Agreement. In addition, the audit will include a review of transactions
involving other entities to whom Integrys Support provides service as well as the
verification that all direct billings to regulated and non-regulated affiliates as well
as unaffiliated parties, if applicable, were properly deducted prior to the
allocations being calculated. The Client Companies shall submit a copy of the
audit report to the person or department designated by the Commissions or the
Commissions’ staffs no later than July 1 of each year. In Illinois, the report shall
be submitted to the ICC’s Manager of the Accounting Department or any
successor. The first such audit report shall pertain to the period ending
December 31, 2008, and shall be due on or before July 1, 2009.
4.5 Each year by May 1, the Client Companies shall file with their respective
Commissions, and submit a copy to the person or department designated by the
Commissions or the Commissions’ staffs, billing reports showing monthly
charges by Integrys Support to each of the Client Companies. These reports
shall show all costs incurred by Integrys Support and all costs allocated to all
Case No. U-17273 Witness: Tracy L. Kupsh
Exhibit A-3 (TLK-1) Schedule C32
Page 9 of 27

entities to whom Integrys Support provides services. In Illinois, the report shall
be submitted to the ICC’s Manager of the Accounting Department or any
successor.
5.0 Representations and Warranties of the Parties.
5.1 Each Party has the right, power, and authority to enter into and perform its
obligations under this Agreement.
5.2 Each Party has taken all requisite corporate action to approve execution,
delivery, and performance of this Agreement, and this Agreement constitutes a
legal, valid and binding obligation of each Party enforceable in accordance with
its terms.
5.3 The fulfillment of obligations hereunder will not constitute a material violation of
any existing applicable law, rule, regulation, or order of any governmental
authority. The Parties acknowledge that all or portions of this Agreement may be
challenged before regulatory agencies or a court of competent jurisdiction by
other persons or entities not Parties hereto. In such event, the Parties agree that
each will use its best efforts before such agencies and courts to support the
pursuit and accomplishment of the Parties’ mutual endeavors hereunder.
6.0 Additional Representations, Warranties and Covenants of Integrys Support.
6.1 In its performance of services hereunder, Integrys Support: (i) shall follow
applicable federal and state regulations, including codes and standards of
conduct, with respect to the sharing of confidential information it receives from
any Client Company with another; (ii) shall not give one or more Client
Companies, or any other affiliate within the Integrys holding company system, a
competitive advantage in relevant markets; and (iii) shall not subsidize any Client
Company and shall not cause any Client Company to subsidize any of its
affiliates.
Case No. U-17273 Witness: Tracy L. Kupsh
Exhibit A-3 (TLK-1) Schedule C32 Page 10 of 27

6.2 Integrys Support shall make readily available to each Commission, FERC and/or
any other governmental or regulatory agency with jurisdiction under applicable
law, reasonable access to its books and records (including without limitation the
basis for its computation of cost allocations) as may be necessary for each
Commission or other agency to review Integrys Support’s transactions with each
Client Company within such Commission’s or agency’s jurisdiction. Without
limiting the foregoing, each Commission shall have full access to the books and
records of Integrys Support as contemplated under applicable law, which access
shall be made readily available to each Commission in their respective states.
7.0 Additional Provisions.
7.1 This Agreement shall become effective upon the issuance of approvals or
waivers as might be required by law, from each and all of the Commissions, and
upon execution of the Agreement by all of the Parties. Once effective, this
Agreement shall continue in full force and effect until and unless modified or
terminated as provided herein.
7.2 This Agreement may be amended or modified at any time by mutual agreement
of the Parties in writing. This Agreement, and any rights hereunder, may not be
assigned without the written consent of all Parties hereto. Except as otherwise
provided herein or under applicable law, any such modification, amendment or
assignment shall not become effective until receipt of approvals or waivers by the
Commissions as might be required by law. The addition of a Party to this
Agreement, or the termination of this Agreement as to a Party, shall not require
the prior approval of the Commissions, but in either case Integrys Support shall
provide the Commissions at least sixty (60) days prior written notice of such
event.
Case No. U-17273 Witness: Tracy L. Kupsh
Exhibit A-3 (TLK-1) Schedule C32 Page 11 of 27

7.3 At least sixty (60) days prior to any change to (i) Exhibit A reflecting the current
Parties to this Agreement, (ii) Exhibit B reflecting the services and categories of
service provided by Integrys Support hereunder, and/or (iii) Exhibit C reflecting all
Allocation Factors in use hereunder, Integrys Support shall provide to the Client
Companies, and the Client Companies shall file with the Commissions and, if
appropriate, the FERC, a revised version of such Exhibit(s) to be changed along
with an indication of what change(s) will be made.
7.4 At least sixty (60) days prior to leaving the Integrys holding company system, a
Client Company shall provide written notice to Integrys Support, and Integrys
Support will then copy the other Parties and the Commissions as soon as
practicable upon receipt of any such notice. Any such Client Company may
continue to receive services from Integrys Support for a reasonable transitional
period of time following such departure from the Integrys holding company
system.
7.5 In providing all services, Integrys Support may arrange, where it deems
appropriate, for the services of such third party experts, consultants, attorneys,
advisers, or other contractors or agents with necessary qualifications as may be
required for or pertinent to the performance of services for the Client Companies
hereunder.
7.6 Each Party shall treat in confidence all information that it may obtain from or
regarding the other Parties and their respective businesses during the term of
this Agreement. Each Party agrees to protect the other Parties’ information using
the same degree of care with which they use to protect their own confidential
information, and in no event less than reasonable care. Except to the extent
disclosure of such information is required by a governmental authority having
jurisdiction, such information shall not be communicated to any person other than
Case No. U-17273 Witness: Tracy L. Kupsh
Exhibit A-3 (TLK-1) Schedule C32 Page 12 of 27

the Parties, and shall be shared among the Parties only to the extent certain
persons need to know such information in order for the Parties to perform under
this Agreement. If a Party is required to disclose confidential information to a
governmental authority, such Party shall take reasonable steps to make such
disclosure confidential under the rules of such governmental authority.
Information provided hereunder shall remain the sole property of the Party
providing such information. The requirements of this Section 7.6 shall not apply
with respect to information that (i) is or becomes available to such Party from a
source other than the Party providing such information, unless such other source
has imposed confidentiality restrictions, or (ii) is or becomes available to the
public other than as a result of disclosure by such Party or its agents.
7.7 The Parties agree and acknowledge that any legal advice or legal services
provided, or arranged to be provided, by or on behalf of Integrys Support to one
or more of the Client Companies will be for the direct or indirect benefit or
common interest of all of the Client Companies, and it is therefore the intention of
all Parties hereto to maintain all privileges that may apply to any communications
related to the provision or receipt of such legal advice or services.
7.8 The Client Companies hereby appoint Integrys Support as agent to represent
them in performing services for or on behalf of the Client Companies. The Client
Companies also authorize Integrys Support to purchase (i.e., take title to) various
commodities, goods and assets in connection with its performance of services
hereunder, and to resell (i.e., convey title to) such commodities, goods and
assets to the Client Companies if necessary in the course of performing services
hereunder. Any resale of such commodities, goods and assets by Integrys
Support to the Client Companies, and/or any use of such commodities, goods
and assets by Integrys Support in its provision of services hereunder, shall be at
Case No. U-17273 Witness: Tracy L. Kupsh
Exhibit A-3 (TLK-1) Schedule C32 Page 13 of 27

the costs incurred by Integrys Support, allocated among the Client Companies
pursuant to the methodologies prescribed herein. Integrys Support shall be
accountable for all funds advanced or collected on behalf of a Client Company in
connection with any transaction in respect of which Integrys Support provides
services. The provision of services by Integrys Support hereunder shall in all
cases and notwithstanding anything herein to the contrary be subject to any
limitations contained in authorizations, rules or regulations of those governmental
agencies having jurisdiction over Integrys Support or its provision of services
hereunder.
7.9 In the event that any amendment to this Agreement does not receive any
approval or waiver of approval by all Commissions that may be required from
time to time, then the Parties shall promptly negotiate in good faith new
provisions to restore such amendment, as nearly as possible, to its original intent
and effect, and thereafter file for approval or waiver of approval of the
Commissions.
7.10 If any governmental or regulatory agency or court of competent jurisdiction holds
that any provision of this Agreement is invalid, or otherwise takes action resulting
in the impossibility or impracticability of performance of all or a portion of this
Agreement, the remainder of this Agreement shall not be affected thereby and
shall continue in full force and effect. In the event any provision of this
Agreement is so held invalid, the Parties hereto shall promptly renegotiate in
good faith new provisions to restore this Agreement as nearly as possible to its
original intent and effect.
7.11 No course of dealing or course of performance between the Parties shall be
construed to alter the terms hereof.
Case No. U-17273 Witness: Tracy L. Kupsh
Exhibit A-3 (TLK-1) Schedule C32 Page 14 of 27

7.12 The Parties agree that there is no third party beneficiary of this Agreement and
that the provisions of this Agreement do not impart enforceable rights to anyone
who is not a Party.
7.13 This Agreement shall be governed by and construed in accordance with the laws
of the State of Wisconsin, without regard to principles of conflicts of law;
provided, however, that no Client Company shall be required to comply with this
Agreement to the extent such compliance would be a violation of the public utility
laws of any state in which such Client Company conducts its regulated utility
operations.
7.14 This Agreement may be executed in any number of counterparts, each of which
when executed and delivered shall be deemed to be an original and all of which
counterparts taken together shall constitute but one and the same instrument.
Case No. U-17273 Witness: Tracy L. Kupsh
Exhibit A-3 (TLK-1) Schedule C32 Page 15 of 27

IN WITNESS WHEREOF, each of the Parties hereto has caused this Agreement to be
executed on its behalf by its officers thereunto duly authorized as of the day and year first above
written.
INTEGRYS BUSINESS SUPPORT, LLC WISCONSIN PUBLIC SERVICE CORPORATION
By By
Name Name
Title Title
UPPER PENINSULA POWER COMPANY MICHIGAN GAS UTILITIES CORPORATION
By By
Name Name
Title Title
MINNESOTA ENERGY RESOURCES THE PEOPLES GAS LIGHT AND COKE CORPORATION COMPANY
By By
Name Name
Title Title
NORTH SHORE GAS COMPANY By
Name
Title
Case No. U-17273 Witness: Tracy L. Kupsh
Exhibit A-3 (TLK-1) Schedule C32 Page 16 of 27

Exhibit A
Client Company Parties to the
Master Regulated Affiliated Interest Agreement Michigan Gas Utilities Corporation
a Delaware-incorporated Michigan public utility headquartered in Green Bay, Wisconsin, engaged in the business of providing natural gas service
Minnesota Energy Resources Corporation
a Delaware-incorporated Minnesota public utility headquartered in Green Bay, Wisconsin, engaged in the business of providing natural gas service
North Shore Gas Company
an Illinois public utility corporation headquartered in Chicago, Illinois, engaged in the business of providing natural gas service
The Peoples Gas Light and Coke Company
an Illinois public utility corporation headquartered in Chicago, Illinois, engaged in the business of providing natural gas service
Upper Peninsula Power Company
a Michigan public utility corporation headquartered in Houghton, Michigan, engaged in the business of providing regulated electric service
Wisconsin Public Service Corporation
a Wisconsin public utility corporation headquartered in Green Bay, Wisconsin, engaged in the business of providing regulated electric and natural gas service
Case No. U-17273 Witness: Tracy L. Kupsh
Exhibit A-3 (TLK-1) Schedule C32 Page 17 of 27

Exhibit B – Reg AIA
1. Administrative services
Administrative services represent facility management services for owned and leased facilities, excluding power plants. This includes operations and maintenance of structures, capital improvements, interior space planning, printing services, security and janitorial, acquisition and management of real estate and land rights including easements and right-of-ways.
Allocation Factors – (1) Square Footage; (2) Number of Office Moves; (3) FTE Work Estimate; (4) Number of Employees; (5) Dollars Associated with Number of Imprints; (6) Composite Allocator; (7) Number of Customers.
2. Corporate development
Corporate development refers to strategic planning, merger and acquisition analysis and support, market intelligence, project management, business and quality improvement processes, business development, asset analysis and divestiture, and resource allocation. It also consists of work performed to determine, implement and track corporate performance goals, initiatives and measures.
Allocation Factors – (1) General/Corporate.
3. Corporate secretary
Corporate secretary refers to those services required of a publicly held corporation, including shareholder, board of director and related committee meetings and minutes.
Allocation Factors – (1) General/Corporate.
4. Environmental
Environmental refers to the performance of assessments, investigations, remediation and other activities as required to ensure compliance with applicable environmental statutes and regulations, permitting, licensing, due diligence, waste management and emergency response.
Allocation Factors – (1) FTE Work Estimate.
5. Executive management
Executive management services refers to the executive management and oversight activities performed by officers of the company and other senior executives. Such activities involve the formulation of general business plans and policies, selection of key management personnel, and allocation of financial resources.
Case No. U-17273 Witness: Tracy L. Kupsh
Exhibit A-3 (TLK-1) Schedule C32 Page 18 of 27

Allocation Factors – (1) General/Corporate.
6. External affairs
External affairs refers to the preparation and dissemination of information to employees, customers, government officials, the public and the media. It also involves administering the company’s activities in the areas of governmental relations, community support and economic development, as well as the analysis and formulation of regulatory policy, rate case preparation and rate administration.
Allocation Factors – (1) Total Property, Plant and Equipment; (2) Number of Employees; (3) General/Corporate; (4) Number of Customers.
7. Financial services
Financial services refers to accounting, finance, treasury, tax, internal audit and relating financial services. Examples of activities performed within these various financial disciplines includes the following: maintain corporate books and records, prepare financial and statistical reports, process payments to vendors, ensure compliance with tax laws and regulations, manage debt and maintain banking relationships, invest pension assets, establish and monitor internal controls, perform financial and risk analysis, prepare budgets and forecasts, maintain shareholder records, and communicate with the investment community. Allocation Factors – (1) Number of Invoices Processed; (2) Number of Transactions; (3) Total Property, Plant and Equipment; (4) Number of Employees; (5) FTE Work Estimate; (6) General/Corporate.
8. Human resources
Human resources refers to the establishment and administration of policies and assuring compliance with legal requirements in the areas of employment, compensation, benefits and employee health and safety. It also involves providing payroll and employee benefit administration, employee training and development, recruiting and staffing services, employee communications and labor relations management. Allocation Factors – (1) Number of Employees.
9. Information technology
Information technology refers to telecommunications and electronic data processing services such as computer operations, software development and maintenance, network support, end-user support, database administration and information systems security. Allocation Factors – (1) Number of Personal Computers; (2) Number of Clicks; (3) Number of Phone Lines; (4) Number of Employees; (5) Application Allocator; (6) Mainframe CPU and Disk Storage; (7) Number of Devices; (8) Number of Meters; (9)
Case No. U-17273 Witness: Tracy L. Kupsh
Exhibit A-3 (TLK-1) Schedule C32 Page 19 of 27

Call Volume; (10) Square Footage; (11) Number of Radios; (12) Number of Mobile Data Devices; (13) Number of Customers; (14) Composite Allocator.
10. Legal services
Legal services refers to the provision of all types of legal advice and related services involving legal services related to corporate, commercial and contracts, litigation, regulatory, securities, real estate, legislative, employment and benefits, tax, intellectual property matters. In addition, services will also be provided to insurance (procurement, management and general advice), claims management, corporate records (policies, procedures and management) and compliance (compliance with laws, ethics and code of conduct). Allocation Factors – (1) General/Corporate.
11. Supply chain
Supply chain refers to the acquisition and provision of goods and services other than fuel, energy commodities or energy transmission. Specific activities include material inventory management, contract administration services, warehousing and logistics services and the establishment of standards. The category also encompasses the purchase and oversight for, and maintenance of, vehicles and related equipment. Allocation Factors – (1) Total Spend; (2) Number of Fleet Assets; (3) Dollars Associated with Number of Inventory Issues; (4) Composite Allocator.
12. Gas engineering
Gas engineering refers to engineering support to gas distribution operations. Such support includes designing and monitoring the construction and maintenance of gas distribution lines and ensuring that construction activity is consistent with plans. It also involves coordinating the planning and operation of gas distribution systems, performing operational reviews of completed construction, maintenance work of gas distribution lines and operating meter shops. Gas Engineering will also provide competitive excellence stewardship support and project management for gas distribution projects. Allocation Factors – (1) Feet of Installed/Replaced Pipeline; (2) Number of Meters Repaired; (3) FTE Work Estimate; (4) Number of Union Employees.
13. Gas supply
Gas supply refers to administrative functions related to purchasing, marketing and selling natural gas (including hedging and other risk management tools); scheduling, interrupting and curtailing natural gas deliveries; acquiring, selling, releasing and managing pipeline transportation capacity or storage capacity; gas control operations; and operating utility-owned underground gas storage fields. This function excludes all functions that are not ministerial in nature and excludes contract ownership, as each Client Company will continue to hold gas supply and
Case No. U-17273 Witness: Tracy L. Kupsh
Exhibit A-3 (TLK-1) Schedule C32 Page 20 of 27

capacity contracts in its own name. Allocation Factors – (1) Gas Throughput; (2) Peak Day Capacity; (3) FTE Work Estimate.
14. Customer relations
Customer relations refers to the provision of services and systems dedicated to customer service, including meter reading and billing, credit, collections, customer relations, call center operations, revenue assurance, account management, market research and customer strategy. Allocation Factors – (1) Number of Customers; (2) Number of Transportation Customers.
15. Project Services
Project services refers to provide project management functions throughout the project life cycle from problem definition and concept development to project execution and performance validation. Offerings to affiliates include participation in business planning, Project Support Office services, problem solving and concept development, business case development, competitive excellence process improvement services, portfolio management, project management, and Dam safety program management. Allocation Factors – (1) Hydro MW Distribution; (2) FTE work estimate; (3) Specific Project Assignment.
Case No. U-17273 Witness: Tracy L. Kupsh
Exhibit A-3 (TLK-1) Schedule C32 Page 21 of 27

Exhibit C – Reg AIA
Costs will be allocated through a tiered approach. This allocation methodology reflects operational aspects of the charge and applies costs in a meaningful and impartial method. First and foremost, costs will be directly charged whenever appropriate and practicable. Direct charging is essentially a “100% allocation” of costs related to a particular service to the one entity receiving that service. Second, where direct charging is not appropriate, costs will be allocated using cost causation principles that link costs related to a specific type of service to the customers receiving such service. All other cost allocations will be broad based with a generalized cost basis proxy. Specific Allocation Factors: Number of Customers – Based on the average number of customers (electric and/or gas) at the end of the most recent 12 months at the time the budget is prepared. The numerator of which is for a Client Company and the denominator of which is for all Client Companies (or specific Client Companies receiving the service allocated per this factor, if not all Companies are receiving the service.) This ratio will be determined annually and/or at such time as may be required due to a significant change in circumstances. Number of Employees - Based on the average number of employees included in the budget that is being prepared. The numerator of which is for a Client Company and the denominator of which is for all Client Companies (or specific Client Companies receiving the service allocated per this factor, if not all Companies are receiving the service.) This ratio will be determined annually and/or at such time as may be required due to a significant change in circumstances. Number of Union Employees - Based on the average number of union employees at the end of the most recent 12 months at the time the budget is prepared. The numerator of which is for a Client Company and the denominator of which is for all Client Companies (or specific Client Companies receiving the service allocated per this factor, if not all Companies are receiving the service.) This ratio will be determined annually and/or at such time as may be required due to a significant change in circumstances. Number of Meters – Based on the average number of meters (electric and/or gas) at the end of the most recent 12 months at the time the budget is prepared. The numerator of which is for a Client Company and the denominator of which is for all Client Companies (or specific Client Companies receiving the service allocated per this factor, if not all Companies are receiving the service.) This ratio will be determined annually and/or at such time as may be required due to a significant change in circumstances.
Case No. U-17273 Witness: Tracy L. Kupsh
Exhibit A-3 (TLK-1) Schedule C32 Page 22 of 27

Number of Invoices Processed – Based on the average number of invoices processed at the end of the most recent 12 months at the time the budget is prepared. The numerator of which is for a Client Company and the denominator of which is for all Client Companies (or specific Client Companies receiving the service allocated per this factor, if not all Companies are receiving the service.) This ratio will be determined annually and/or at such time as may be required due to a significant change in circumstances. Number of Transactions – Based on the average number of transactions processed in the system at the end of the most recent 12 months at the time the budget is prepared. The numerator of which is for a Client Company and the denominator of which is for all Client Companies (or specific Client Companies receiving the service allocated per this factor, if not all Companies are receiving the service.) This ratio will be determined annually and/or at such time as may be required due to a significant change in circumstances. Number of Personal Computers – Based on the average number of personal computers at the end of the most recent 12 months at the time the budget is prepared. The numerator of which is for a Client Company and the denominator of which is for all Client Companies (or specific Client Companies receiving the service allocated per this factor, if not all Companies are receiving the service.) This ratio will be determined annually and/or at such time as may be required due to a significant change in circumstances. Number of Phone Lines – Based on the average number of phone lines at the end of the most recent 12 months at the time the budget is prepared. The numerator of which is for a Client Company and the denominator of which is for all Client Companies (or specific Client Companies receiving the service allocated per this factor, if not all Companies are receiving the service.) This ratio will be determined annually and/or at such time as may be required due to a significant change in circumstances. Mainframe CPU and Disk Storage – Based on the number of CPU cycles used by the application divided by the total number of used CPU cycles and the total bytes of data storage used by the application divided by the total bytes used for mainframe storage for the most recent 12 months at the time the budget is prepared. The numerator of which is for a Client Company and the denominator of which is for all Client Companies (or specific Client Companies receiving the service allocated per this factor, if not all Companies are receiving the service.) This ratio will be determined annually and/or at such time as may be required due to a significant change in circumstances. Number of Clicks – Based on the average number of clicks on the website page at the end of the most recent 12 months at the time the budget is prepared. The numerator of which is for a Client Company and the denominator of which is for all Client Companies (or specific Client Companies receiving the service allocated per this factor, if not all Companies are receiving the service.) This ratio will be determined annually and/or at such time as may be required due to a significant change in circumstances.
Case No. U-17273 Witness: Tracy L. Kupsh
Exhibit A-3 (TLK-1) Schedule C32 Page 23 of 27

Number of Devices – Based on the number of devices at the time the budget is prepared. The numerator of which is for a Client Company and the denominator of which is for all Client Companies (or specific Client Companies receiving the service allocated per this factor, if not all Companies are receiving the service.) This ratio will be determined annually and/or at such time as may be required due to a significant change in circumstances. Number of Mobile Data Devices – Based on the average number of mobile data devices at the end of the most recent 12 months at the time the budget is prepared. The numerator of which is for a Client Company and the denominator of which is for all Client Companies (or specific Client Companies receiving the service allocated per this factor, if not all Companies are receiving the service.) This ratio will be determined annually and/or at such time as may be required due to a significant change in circumstances. Number of Radios – Based on the number of radios for the most recent 12 months at the time the budget is prepared. The numerator of which is for a Client Company and the denominator of which is for all Client Companies (or specific Client Companies receiving the service allocated per this factor, if not all Companies are receiving the service.) This ratio will be determined annually and/or at such time as may be required due to a significant change in circumstances. Dollars Associated with Number of Imprints – Based on the dollars associated with the number of imprints for the most recent 12 months at the time the budget is prepared. The numerator of which is for a Client Company and the denominator of which is for all Client Companies (or specific Client Companies receiving the service allocated per this factor, if not all Companies are receiving the service.) This ratio will be determined annually and/or at such time as may be required due to a significant change in circumstances. Number of Office Moves – Based on the average number of office moves for the most recent 12 months at the time the budget is prepared. The numerator of which is for a Client Company and the denominator of which is for all Client Companies (or specific Client Companies receiving the service allocated per this factor, if not all Companies are receiving the service.) This ratio will be determined annually and/or at such time as may be required due to a significant change in circumstances. Total Spend – Based on the average total spend at the end of the most recent 12 months at the time the budget is prepared. The numerator of which is for a Client Company and the denominator of which is for all Client Companies (or specific Client Companies receiving the service allocated per this factor, if not all Companies are receiving the service.) This ratio will be determined annually and/or at such time as may be required due to a significant change in circumstances. Total Property, Plant and Equipment – Based on average property, plant and equipment at the end of the most recent 12 months at the time the budget is prepared. The numerator of which is for a Client Company and the denominator of which is for all Client Companies (or specific Client Companies receiving the service allocated per this
Case No. U-17273 Witness: Tracy L. Kupsh
Exhibit A-3 (TLK-1) Schedule C32 Page 24 of 27

factor, if not all Companies are receiving the service.) This ratio will be determined annually and/or at such time as may be required due to a significant change in circumstances. Square Footage – Based on average square footage occupied for the most recent 12 months at the time the budget is prepared. The numerator of which is for a Client Company and the denominator of which is for all Client Companies (or specific Client Companies receiving the service allocated per this factor, if not all Companies are receiving the service.) This ratio will be determined annually and/or at such time as may be required due to a significant change in circumstances. Call Volume – Based on average call volume of the most recent calendar year at the time the budget is prepared. The numerator of which is for a Client Company and the denominator of which is for all Client Companies (or specific Client Companies receiving the service allocated per this factor, if not all Companies are receiving the service.) This ratio will be determined annually and/or at such time as may be required due to a significant change in circumstances. Application Allocator – Based on the allocation of the specific application being worked on. The numerator of which is for a Client Company and the denominator of which is for all Client Companies (or specific Client Companies receiving the service allocated per this factor, if not all Companies are receiving the service.) This ratio will be determined annually and/or at such time as may be required due to a significant change in circumstances. Specific Project Assignment - This indicates that Project Services is allowed to use any one of the existing allocation factors in this Exhibit C, such that costs associated with Project Services are allocated based on the nature of the project they are supporting. Full Time Equivalent (FTE) Work Estimate – Based on a recurring, predictable level of service. The numerator of which is for a Client Company and the denominator of which is for all Client Companies (or specific Client Companies receiving the service allocated per this factor, if not all Companies are receiving the service.) This ratio will be determined annually and/or at such time as may be required due to a significant change in circumstances. Composite Allocator Based on Total Historical Billings for an IBS functional service as defined in Exhibit B - Based on the total O&M billings for the most recent 12 months at the time the budget is prepared or total O&M billings for the previous calendar year. The numerator of which is for a Client Company and the denominator of which is for all Client Companies (or specific Client Companies receiving the service allocated per this factor, if not all Companies are receiving the service). This ratio will be determined annually and/or such time as may be required due to significant change in circumstance. General/Corporate – Based on an equal weighting of a 13-month average of assets (excluding hedge assets, goodwill, and non-ordinary assets) for the most recent 13 months at the time the budget is prepared and average annual O&M costs (excluding
Case No. U-17273 Witness: Tracy L. Kupsh
Exhibit A-3 (TLK-1) Schedule C32 Page 25 of 27

fuel costs) for the most recent 12 months at the time the budget is prepared. The numerator of which is for a Client Company and the denominator of which is for all Client Companies (or specific Client Companies receiving the service allocated per this factor, if not all Companies are receiving the service.) This ratio will be determined annually and/or at such time as may be required due to a significant change in circumstances. Gas Throughput – Based on gas throughput in dekatherms (sales and transportation) for the most recent 12 months at the time the budget is prepared. The numerator of which is for a Client Company and the denominator of which is for all Client Companies (or specific Client Companies receiving the service allocated per this factor, if not all Companies are receiving the service.) This ratio will be determined annually and/or at such time as may be required due to a significant change in circumstances. Feet of Installed/Replaced Pipeline – Based on average number of feet installed/replaced for the most recent 12 months at the time the budget is prepared. The numerator of which is for a Client Company and the denominator of which is for all Client Companies (or specific Client Companies receiving the service allocated per this factor, if not all Companies are receiving the service.) This ratio will be determined annually and/or at such time as may be required due to a significant change in circumstances. Dollars Associated with Number of Inventory Issues – Based on the dollars associated with the number of inventory issues for the most recent 12 months at the time the budget is prepared. The numerator of which is for a Client Company and the denominator of which is for all Client Companies (or specific Client Companies receiving the service allocated per this factor, if not all Companies are receiving the service.) This ratio will be determined annually and/or at such time as may be required due to a significant change in circumstances. Number of Fleet Assets – Based on the average number of fleet assets at the end of the most recent 12 months at the time the budget is prepared. The numerator of which is for a Client Company and the denominator of which is for all Client Companies (or specific Client Companies receiving the service allocated per this factor, if not all Companies are receiving the service.) This ratio will be determined annually and/or at such time as may be required due to a significant change in circumstances. Hydro MW Distribution – Based on the percentage per hydro region of rated generation in megawatts (MW), the numerator of which is for an individual hydro region and the denominator of which is for all hydro regions. This ratio will be revised annually at budget time if there are additions or deletions of hydro units, or changes in ownership percentages of existing hydro units, within the hydro regions. Number of Meters Repaired – Based on the average number of meters repaired at the end of the most recent 12 months at the time the budget is prepared. The numerator of which is for a Client Company and the denominator of which is for all Client Companies (or specific Client Companies receiving the service allocated per this factor, if not all Companies are receiving the service.) This ratio will be determined annually and/or at
Case No. U-17273 Witness: Tracy L. Kupsh
Exhibit A-3 (TLK-1) Schedule C32 Page 26 of 27

such time as may be required due to a significant change in circumstances. Peak Day Capacity (gas) – Based on the highest daily send out in therms (excluding transportation) for the most recent 12 months at the time the budget is prepared. The numerator of which is for a Client Company and the denominator of which is for all Client Companies (or specific Client Companies receiving the service allocated per this factor, if not all Companies are receiving the service.) This ratio will be determined annually and/or at such time as may be required due to a significant change in circumstances. Number of Transportation Customers – Based on the average number of transportation customers at the end of the most recent 12 months at the time the budget is prepared. The numerator of which is for a Client Company and the denominator of which is for all Client Companies (or specific Client Companies receiving the service allocated per this factor, if not all Companies are receiving the service.) This ratio will be determined annually and/or at such time as may be required due to a significant change in circumstances.
Case No. U-17273 Witness: Tracy L. Kupsh
Exhibit A-3 (TLK-1) Schedule C32 Page 27 of 27

Asset Ownership by Integrys Business Support
Type of Asset Allocation Method
PP&E Used in Operations N/A
Leases All leasehold costs included in space allocation pool. Allocation between IBS and other tenants based on square footage of usable space. IBS portion of cost included in space cost labor overhead. Special purpose space usage billed separately based on specific use.
Leasehold Improvements Includes depreciation, return, and non-capitalized costs in space allocation cost pool. Allocation between IBS and other tenants based on square footage of usable space. IBS portion of cost included in space cost labor overhead. Special purpose space usage billed separately based on specific use.
Buildings Includes depreciation, return, and non-capitalized costs in space allocation cost pool. Allocation between IBS and other tenants based on square footage of usable space. IBS portion of cost included in space cost labor overhead. Special purpose space usage billed separately based on specific use.
Furniture, Equipment and PCs Includes depreciation, return, and non-capitalized costs in space allocation cost pool.
Telecommunications, Excluding Equipment Specifically Used for Gas or Energy Supply Control
Includes depreciation, return, and non-capitalized costs. Allocated by number of phone lines.
Large Equipment in Print/Copy Shop and Inserters Charge based on service provided. Total number of imprints.
Mainframe/ Servers Includes depreciation, return and non-capitalized costs. Allocated by number of personal computers.
Software Includes depreciation, return and non-capitalized costs in Software pool. Allocate to each company based on specific application allocators, as appropriate.
Miscellaneous IT Equipment (e.g. tape drives, special storage units, UPS equipment, etc)
Includes depreciation, return and non-capitalized costs. Allocation based on corporate cost allocator.
Environmental Equipment and Vehicles, including Water Quality Equipment, Lab Equipment, Boat, ATV, and Dataloggers
Includes depreciation, return and non-capitalized costs in Environmental equipment cost pool. Allocation based on allocation of services from Environmental area. Total Environmental labor billings.
Case No. U-17273 Witness: Tracy L. Kupsh
Exhibit A-3 (TLK-1) Schedule C33
Page 1 of 1

STATE OF MICHIGAN
BEFORE THE MICHIGAN PUBLIC SERVICE COMMISSION
* * * * * In the matter of the application of ) MICHIGAN GAS UTILITIES CORPORATION ) for authority to increase retail natural gas rates. ) Case No. U-17273 )
DIRECT TESTIMONY AND EXHIBITS OF
LISA J. GAST, CPA
FOR
MICHIGAN GAS UTILITIES CORPORATION
June 7, 2013

1
STATE OF MICHIGAN
BEFORE THE MICHIGAN PUBLIC SERVICE COMMISSION
* * * * *
In the matter of the application of ) MICHIGAN GAS UTILITIES CORPORATION ) for authority to increase retail natural gas rates. ) Case No. U-17273 )
QUALIFICATIONS OF
LISA J. GAST, CPA PART I
Q. Please state your name, business address and position. 1
A. My name is Lisa J. Gast. My business address is Integrys Business Support, LLC 2
(“IBS”), 700 North Adams Street, P.O. Box 19001, Green Bay, WI 54307-9001. I am 3
Manager, Financial Planning and Analysis in the Treasury Department of Integrys 4
Energy Group, Inc (“Integrys”). Both IBS and Michigan Gas Utilities Corporation 5
(“MGUC”) are wholly-owned subsidiaries of Integrys. Integrys resulted from the 6
February 21, 2007 merger between WPS Resources Corporation and Peoples 7
Energy Corporation. 8
9
Q. For whom are you providing testimony? 10
A. I am providing testimony on behalf of MGUC. 11
12
Q. Please describe briefly your educational, professional, and utility background. 13
A. I graduated from the University of Wisconsin – Green Bay in 1984 with a Bachelor’s 14
Degree in Accounting. I received a Masters Degree in Business Administration 15
(“MBA”) from the University of Wisconsin - Oshkosh in 1995. My professional 16
designations are Certified Public Accountant (“CPA”) and Certified Treasury 17
Professional (“CTP”). I joined the Treasury Department at Wisconsin Public Service 18

2
Corporation (“WPS Corp”) in April of 2001. In my current position, I am responsible 1
for the capital structure forecasts for each of our regulated utilities. 2
3
Q. Have you previously testified in any regulatory proceedings? 4
A. Yes, I have. I have filed testimony before the Michigan Public Service Commission 5
(“MPSC”) on behalf of Michigan Gas Utilities Corporation (“MGUC”) in Case Nos. U-6
15549 and U-15990 and on behalf of Upper Peninsula Power Company (“UPPCO”) 7
in Case Nos. U-15988, U-16166 and U-16417. I have also testified regarding capital 8
structure and cost of capital before utility commissions in Illinois, Minnesota and 9
Wisconsin. 10

3
LISA J. GAST, CPA DIRECT TESTIMONY
PART II
Q. What is the purpose of your pre-filed direct testimony? 1
A. The purpose of my pre-filed direct testimony is to: 2 3
1. Present MGUC’s capital structure and cost of capital for the 2012 historic 4 test year, 5
6 2. Present MGUC’s capital structure and cost of capital for the 2014 7
projected test year, 8 9 3. Explain the differences in adjusted common equity between the 2012 10
historic test year and the 2014 projected test year, 11 12 4. Describe the required Common Equity Ratio for the 2014 projected test 13
year, and 14 15 5. Describe the required Return on Common Equity (“ROE”) for the 2014 16
projected test year. 17 18
Q. Are you sponsoring any exhibits in this proceeding? 19
A. Yes, I am. I am sponsoring Schedules D1 through D5 of Exhibit A-4 (LJG-1) for the 20
2014 projected test year, and Schedules D1 through D8 of Exhibit A-14 (LJG-2) for 21
the 2012 historic test year. 22
23
Q. Were these exhibits prepared by you or under your direction and supervision? 24
A. Yes, they were. 25
26
Q. Please explain Schedules D1 through D5 of Exhibit A-4 (LJG-1). 27
A. In general, Schedules D1 through D5 of Exhibit A-4 (LJG-1) support and calculate 28
MGUC’s capital structure, cost of capital, and required rate of return for the 2014 29
projected test year. 30
31

4
Schedule D1 develops MGUC’s 2014 projected test year overall rate of return of 1
6.4020%, as shown on Line 24, based on MGUC’s 13-month average capital 2
structure, and a 10.75% ROE. 3
4
Schedule D2 develops MGUC’s 2014 projected test year embedded cost of long 5
term debt of 5.3105%, based on a 13-month average, as shown on Line 24. There 6
is one new debt issue forecasted for the test year, a $10,000,000 offering issued on 7
April 1, 2014 with an interest rate of 4.35%. 8
9
Schedule D3 develops MGUC’s 2014 projected test year cost of short-term debt of 10
1.5150%, based on a 13-month average, as shown on Line 28. 11
12
Schedule D4 indicates that MGUC has no preferred equity outstanding, as shown on 13
Line 2. 14
15
Schedule D5 develops MGUC’s 13-month average balance of Adjusted Common 16
Equity of $88,627,509 for the 2014 projected test year, as shown on Line 16. MGUC 17
requests a 10.75% ROE for the 2014 projected test year in this general rate case 18
proceeding, as supported by Mr. Paul R. Moul’s testimony and analysis. 19
20
Q. Please explain Schedules D1 through D8 of Exhibit A-14 (LJG-2). 21
A. In general, Schedules D1 through D8 of Exhibit A-14 (LJG-2) support and calculate 22
MGUC’s capital structure, cost of capital, and required rate of return for the 2012 23
historic test year. 24
25

5
Schedule D1 develops MGUC’s 2012 historic test year overall rate of return of 1
7.1076%, as shown on Line 22, based on MGUC’s 13-month average capital 2
structure, and a 10.75% ROE. 3
4
Schedule D2 develops MGUC’s 2012 historic test year embedded cost of long term 5
debt of 5.9089%, based on a 13-month average, as shown on Line 24. 6
7
Schedule D3 develops MGUC’s 2012 historic test year cost of short-term debt of 8
101.5424%, based on a 13-month average, as shown on Line 28. The interest rate 9
on short-term debt before the amortization of credit facility upfront fees is 0.15%. 10
11
Schedule D4 indicates that MGUC has no preferred equity outstanding, as shown on 12
Line 2. 13
14
Schedule D5 develops MGUC’s 13-month average balance of Adjusted Common 15
Equity of $83,247,890, for the 2012 historic test year, as shown on Line 16. 16
17
Schedule D6 provides the current and historic credit ratings along with the 18
associated outlooks for senior unsecured debt, junior subordinated debt, and 19
commercial paper for MGUC’s parent, Integrys, as published by Standard and Poor’s 20
(“S&P”), and Moody’s Investors Service (“Moody’s”). Integrys is not rated by Fitch 21
Ratings, and has no senior secured debt. MGUC is not rated by any service. 22
23
Schedule D7 presents information on utility corporate bond issuances for January 24
2013 through June 2013. MGUC last issued $15 million of 3.00% 10 year debt on 25
April 1, 2013 as partial replacement of their $28 million 7 year 5.72% debt that 26

6
matured 4/1/2013. Integrys was the lender. This debt issue was included in the 1
forecast at 3.25%. 2
3
Schedule D8 calculates financial metrics on both a financial and ratemaking basis for 4
historic years 2008 – 2012, and the 2014 projected test year, with and without rate 5
relief. 6
7
Q. Does MGUC present any other evidence on cost of capital? 8
A. Yes, it does. Mr. Paul R. Moul of P. Moul & Associates provides evidence on 9
MGUC’s cost of equity. He presents analytical studies employing various industry 10
models. 11
12
Q. Is MGUC publicly traded? 13
A. No, it is not. Integrys holds 100% of the common stock of MGUC. Integrys is traded 14
on the New York Stock Exchange under the symbol “TEG”. 15
16
Q. How were interest rates on short-term debt forecasted? 17
A. Short-term debt interest rates were derived based on the sum of the 2014 forecasted 18
1 month non-financial commercial paper rates and the 2012 average spread 19
between A2/P2 and AA commercial paper. The short-term interest rates also reflect 20
MGUC’s allocation of the costs of credit facilities held by Integrys. 21
22
Q. How was the forecasted rate for the 2014 intercompany long-term debt from 23
Integrys calculated? 24
A. The forecasted rate was estimated using the 10 Year Treasury rate forecasted for 25
the quarter of issuance, rounded to the nearest 5 basis points plus a credit spread of 26

7
110 basis points and issuance spread of 10 basis points. (3.15 + 1.10 + 0.10 = 4.35 1
forecasted rate) 2
3
Changes to MGUC’s Adjusted Common Equity from 2012 to 2014 4 Q. Please explain why MGUC’s year end adjusted common equity increased from 5
$83,003,919 for the 2012 historic test year to $94,444,154 for the 2014 projected 6
test year without rate relief, and to $94,356,197 for the 2014 projected test year 7
with rate relief. 8
A. The change in MGUC’s year end adjusted common equity is due to equity returns to 9
Integrys, retained earnings, increases in compensation related accounts and 10
reductions in utility equity adjustments. A summary of these changes with and 11
without rate relief is included in the following table. 12
* Includes Equity Adjustments for Goodwill, Tradename, and associated 13 Deferred Taxes. 14
15 ** Reduced Utility Equity Adjustment results from Deferred Tax cash 16 flows related to Goodwill and Tradename. 17
18
Q. What is the basis for the Adjusted Common Equity reflected on Schedules D1 19
of Exhibit A-14 (LJG-2) and Exhibit A-4 (LJG-1)? 20
A. These amounts reflect the average balances in common equity after adjustments for 21
non-utility investments, see Workpapers - 2012, pages 119 and 120 and Workpapers 22
– 2014, pages 119 and 120. These investments are primarily goodwill and 23
tradename related to the acquisition of MGUC by Integrys in 2006. Goodwill and 24
Common Equity Without Rate Relief With Rate Relief Actual 12/31/12* $83,003,919 $83,003,919 Equity Returns (7,000,000) (12,000,000)
Retained Earnings 9,095,475 14,007,518 Compensation Related Accounts 169,178 169,178
Reduced Utility Equity Adjustment** 9,175,582 9,175,582 Projected TY 12/31/14 $94,444,154 $94,356,197

8
tradename are being excluded from the common equity balances because they are 1
assumed to be funded with common equity capital (i.e., all MGUC debt is assumed 2
to support utility operations). Additionally, the deferred income taxes related to the 3
non-utility investments were adjusted as well to arrive at the deferred income taxes 4
supporting utility operations. 5
6
Q. What amount of equity in the capital structure do you feel is appropriate for 7
MGUC? 8
A. A common equity ratio of 50% to 55% (after considering adjustments related to non-9
utility investments) is required to provide MGUC the financial health and flexibility it 10
requires to respond to the changes and challenges of the utility industry. 11
12
MGUC is currently targeting a common equity ratio of 50.12% for the 2014 projected 13
test year. During the 2012 historic test year, MGUC maintained a 49.71% common 14
equity ratio. 15
16
Business risk is greater today than in earlier decades and this increased business 17
risk is reflected in the more stringent benchmarks now being used by the various 18
credit rating agencies. Business risk can be offset somewhat with decreased 19
financial risk by maintaining a lower debt ratio which, in turn, increases interest 20
coverage. 21
22
Q. What benefits does a capital structure with a higher equity ratio provide? 23
A. An adequate equity ratio provides the ability to resist negative financial pressures 24
and creates a buffer to protect against unexpected adverse developments so that 25
distortions can be quickly remedied without impairing either the orderly conduct of 26
the business, or the credit quality of present or future securities issues. This will help 27
9
ensure that MGUC has access to capital at reasonable rates when MGUC needs it, 1
thereby benefiting its customers. 2
3
The Required ROE 4 Q. What is MGUC’s recommendation for the cost of equity capital for MGUC? 5
A. MGUC is requesting a 10.75% ROE for the 2014 projected test year as described in 6
the pre-filed direct testimony of Mr. Paul R. Moul. 7
8
Q. Is the market responsive to alternative investment opportunities? 9
A. Yes, it is. Investors have a full field of investment choices. Investors can choose the 10
stock market or other markets such as bonds, treasury securities, money funds, real 11
estate, etc. If investors choose the stock market, they may elect a utility stock or a 12
stock from one of the many other industries available. If investors prefer utilities, 13
they have many to select from within the utility industry. Therefore, it is imperative to 14
provide a competitive return to the shareholder. The return on a utility's stock must 15
be competitive to other investment alternatives with similar risk profiles. 16
17
An adequate ROE is of major importance and benefit to customers. Adequate 18
returns on MGUC's common equity would help to ensure continued reliable utility 19
services, and would assure these services are provided at the lowest overall rates 20
through the lowest overall cost of capital. This can only be maintained with an 21
adequate ROE. 22
23
Q. What effect would a fair return on common equity have on the other securities 24
of MGUC? 25
A. An adequate ROE would permit MGUC to raise capital when needed, at reasonable 26
rates, especially during periods of “tight” credit markets. 27
28

10
Q. In summary, what is your recommendation regarding the required common 1
equity ratio and the required ROE for the 2014 projected test year? 2
A. MGUC recommends that the average common equity ratio be set at 50.00% with a 3
ROE of 10.75%. These values are recommended because: 4
1. They provide a fair return to investors commensurate with competitive 5 investment vehicles available, 6
7 2. They reflect the business risk associated with the utility industry, and 8 9 3. They recognize that MGUC has delivered, and will continue to deliver, 10
reliable service at a reasonable cost to its customers. Therefore, the 11 shareholder should be properly compensated for delivering on its 12 commitment to those customers. 13
14
Q. Does this complete your pre-filed direct testimony? 15
A. Yes, it does. 16

Michigan Public Service Commission Case No.: U-17273Michigan Gas Utilities Corporation Exhibit No.: A-4 (LJG-1)Rate of Return Summary Schedule: D1For the 12 Month Period Ended, December 31, 2014 Page: 1 of 1
Witness: Lisa Gast, CPA
(a) (b) (c) (d) (e) (f) (g) (h) (i) (j) (k)
Percent Percent Percent WeightedLine Permanent of Total Cost Permanent Total Conversion Pre-Tax Capital CostNo. Description Amount (1) Capital (2) Capital Rate % Capital (2) Cost % Factor Return Incl ST Incl ST12 Long-Term Debt 78,083,333$ 46.84% 37.20% 5.3105% (3) 2.49% 1.9755% 1.9755% 44.16% 2.3449%34 Preferred Stock -$ 0.00% 0.00% 0.0000% (4) 0.00% 0.0000% 0.0000% 0.00% 0.0000%56 Common Shareholders' Equity 88,627,509$ 53.16% 42.22% 10.7500% (5) 5.71% 4.5387% 1.637 7.4285% 50.12% 5.3879%78 Total Permanent Capital 166,710,842$ 100.00% 8.20%9
10 Short-Term Debt 10,120,489$ 4.82% 1.5150% (6) 0.0730% 0.0730% 5.72% 0.0867%1112 Job Development - ITC - Debt13 Job Development - ITC Equity14 Total Job Development - ITC -$ 0.00% 8.2023%1516 Deferred Income Taxes (Net) - MBT -$ 0.00%1718 Deferred Income Taxes (Net) - Federal 38,072,890$ 18.14% 0.0000% 0.0000% 0.0000%1920 Deferred Tax Proration 23,958$ 0.01% 7.8195% 0.0009% 0.0009%2122 Capital Structure Adjustments (5,003,188)$ -2.38% 7.8195% (7) -0.1861% -0.1861%2324 Total 209,924,991$ 100.01% 6.4020% 9.2918% 100.00% 7.8195%
Memo Only:DITC 568,158$ Liabilities & Equity 210,493,149$
(1) See Exh. A-2, Sch. B1(2) Excludes Short-Term Debt, Deferred Job Development Investment Tax Credit, Deferred Investment
Tax Credit and Deferred Income Taxes to calculate the rate of return for Job DevelopmentInvestment Tax Credit purposes in accordance with Internal Revenue Service Income TaxRegulation Section 1.46-6
(3) See Exh. A-4, Sch. D2(4) See Exh. A-4, Sch. D4(5) See Exh. A-4, Sch. D5(6) See Exh. A-4, Sch. D3(7) See row 22, column k
Schedule D1
Capital StructureWeighted Cost

Michigan Public Service Commission Case No.: U-17273Michigan Gas Utilities Corporation Exhibit No.: A-4 (LJG-1)Cost of Long-Term Debt Schedule: D2For the 12 Month Period Ended, December 31, 2014 Page: 1 of 1
Witness: Lisa Gast, CPA
(a) (b) (c) (d) (e) (f) (g) (h) (i) (j) (k)
Net CostUnderwriting Proceeds Based
Original Stated Interest Amount Price to & Financing to the on Net AmountLine Issue Maturity Rate of Public Expenses Company Proceeds Out- AnnualNo. Description Date Date (%) Offering (%) (%) (%) (%) standing Cost12 Mortgage Bonds3 -$ 4 - 5 - 6 - 7 - 8 Total Mortgage Bonds -$ 910 Other Long-Term Debt11 4/1/2006 4/1/2016 5.76% 28,000,000 28,000,000 - 28,000,000 5.84% 28,000,000 1,635,200 12 4/1/2006 4/1/2021 5.98% 28,000,000 28,000,000 - 28,000,000 6.06% 28,000,000 1,696,800 13 4/1/2013 4/1/2023 3.25% 15,000,000 15,000,000 - 15,000,000 3.25% 15,000,000 487,500 14 4/1/2014 4/1/2024 4.35% 10,000,000 10,000,000 - 10,000,000 4.35% 7,083,333 308,125 15 Total Other Long-Term Debt 78,083,333$ 4,127,625$ 1617 Total Long-Term Debt 78,083,333$ 181920 Adjust to interest booked - 18,9812122 Total Long-Term Debt Balance 78,083,333$ 4,146,606$ 2324 Cost of Long-Term Debt 5.3105%
Schedule D2

Michigan Public Service Commission Case No.: U-17273Michigan Gas Utilities Corporation Exhibit No.: A-4 (LJG-1)Cost of Short-Term Debt Schedule: D3For the 12 Month Period Ended, December 31, 2014 Page: 1 of 1
Witness: Lisa Gast, CPA
(a) (b) (c)
Line Balance TotalNo. Month Outstanding Cost12 Inter-Company Loans3 Dec 17,931,344$ 4 Jan 22,606,827 5 Feb 20,947,476 6 Mar 17,232,539 7 Apr 4,050,122 8 May 2,044,004 9 Jun 1,100,430 10 Jul 2,073,037 11 Aug 3,569,199 12 Sep 7,747,061 13 Oct 12,435,738 14 Nov 12,845,104 15 Dec 11,657,320 16 13 month Average 10,120,489$ 62,935 1718 Commercial Paper - - 1920 Letter of Credit - - 2122 Other - - 2324 Amortization of Upfront Fees 90,392 2526 Total 10,120,489$ 153,327$ 2728 Average Cost of Short-Term Debt 1.5150%
Schedule D3

Michigan Public Service Commission Case No.: U-17273Michigan Gas Utilities Corporation Exhibit No.: A-4 (LJG-1)Cost of Preferred Stock Schedule: D4For the 12 Month Period Ended, December 31, 2014 Page: 1 of 1
Witness: Lisa Gast, CPA
(a) (b) (c) (d) (e) (f) (g) (h) (i) (j)
Total ValueAnnual Discount Net Number of Cost Annual
Line Dividend Par or Finance Proceeds of Shares Outstanding Rate DollarNo. Description Required Value Premium Expenses Received Outstanding Proceeds (%) Amount12 None
Schedule D4

Michigan Public Service Commission Case No.: U-17273Michigan Gas Utilities Corporation Exhibit No.: A-4 (LJG-1)Cost of Common Shareholders' Equity Schedule: D5For the 12 Month Period Ended, December 31, 2014 Page: 1 of 1
Witness: Lisa Gast, CPA
AdjustedLine CommonNo. Stock12 Dec 90,437,4623 Jan 93,658,5924 Feb 92,542,5315 Mar 88,647,8216 Apr 84,822,6727 May 85,295,9868 Jun 85,270,6429 Jul 85,298,605
10 Aug 85,535,42311 Sep 88,606,72412 Oct 89,609,32513 Nov 91,800,97414 Dec 94,444,1541516 Average $88,627,509 10.7500%
Schedule D5

Michigan Public Service Commission Case No.: U-17273Michigan Gas Utilities Corporation Exhibit No.: A-14 (LJG-2)Rate of Return Summary Schedule: D1For the 12 Month Period Ended, December 31, 2012 Page: 1 of 1
Witness: Lisa Gast, CPA
(a) (b) (c) (d) (e) (f) (g) (h) (i) (j) (k)
Percent Percent Percent WeightedLine Permanent of Total Cost Permanent Total Conversion Pre-Tax Capital CostNo. Description Amount (1) Capital (2) Capital Rate % Capital (2) Cost % Factor Return Incl ST Incl ST12 Long-Term Debt 84,000,000$ 50.22% 43.41% 5.9089% (3) 2.97% 2.5651% 2.5651% 50.16% 2.9641%34 Preferred Stock -$ 0.00% 0.00% 0.0000% (4) 0.00% 0.0000% 0.0000% 0.00% 0.0000%56 Common Shareholders' Equity 83,247,890$ 49.78% 43.03% 10.7500% (5) 5.35% 4.6257% 1.637 7.5709% 49.71% 5.3442%78 Total Permanent Capital 167,247,890$ 100.00% 8.32%9
10 Short-Term Debt 206,250$ 0.11% 101.5424% (6) 0.1082% 0.1082% 0.12% 0.1251%1112 Job Development - ITC - Debt13 Job Development - ITC Equity14 Total Job Development - ITC -$ 0.00% 8.3186%1516 Deferred Income Taxes (Net) - MBT -$ 0.00%1718 Deferred Income Taxes (Net) - Federal 30,422,678$ 15.72% 0.0000% 0.0000% 0.0000%1920 Capital Structure Adjustments (4,391,294)$ -2.27% 8.4334% (7) -0.1914% -0.1914%2122 Total 193,485,524$ 100.00% 7.1076% 10.0528% 100.00% 8.4334%
Memo Only:DITC 590,744$ Liabilities & Equity 194,076,268$
(1) See Exh. A-2, Sch. B1(2) Excludes Short-Term Debt, Deferred Job Development Investment Tax Credit, Deferred Investment
Tax Credit and Deferred Income Taxes to calculate the rate of return for Job DevelopmentInvestment Tax Credit purposes in accordance with Internal Revenue Service Income TaxRegulation Section 1.46-6
(3) See Exh. A-4, Sch. D2(4) See Exh. A-4, Sch. D4(5) See Exh. A-4, Sch. D5(6) See Exh. A-4, Sch. D3(7) See row 22, column k
Schedule D1
Capital StructureWeighted Cost

Michigan Public Service Commission Case No.: U-17273Michigan Gas Utilities Corporation Exhibit No.: A-14 (LJG-2)Cost of Long-Term Debt Schedule: D2For the 12 Month Period Ended, December 31, 2012 Page: 1 of 1
Witness: Lisa Gast, CPA
(a) (b) (c) (d) (e) (f) (g) (h) (i) (j) (k)
Net CostUnderwriting Proceeds Based
Original Stated Interest Amount Price to & Financing to the on Net AmountLine Issue Maturity Rate of Public Expenses Company Proceeds Out- AnnualNo. Description Date Date (%) Offering (%) (%) (%) (%) standing Cost12 Mortgage Bonds3 -$ 4 - 5 - 6 - 7 - 8 Total Mortgage Bonds -$ 910 Other Long-Term Debt11 4/1/2006 4/1/2013 5.72% 28,000,000 28,000,000 - 28,000,000 5.82% 28,000,000 1,628,293 12 4/1/2006 4/1/2016 5.76% 28,000,000 28,000,000 - 28,000,000 5.86% 28,000,000 1,639,680 13 4/1/2006 4/1/2021 5.98% 28,000,000 28,000,000 - 28,000,000 6.08% 28,000,000 1,702,307 1415 Total Other Long-Term Debt 84,000,000$ 4,970,280$ 1617 Total Long-Term Debt 84,000,000$ 181920 Adjustment to booked interest - -6,7902122 Total Long-Term Debt Balance 84,000,000$ 4,963,490$ 2324 Cost of Long-Term Debt 5.9089%
Schedule D2

Michigan Public Service Commission Case No.: U-17273Michigan Gas Utilities Corporation Exhibit No.: A-14 (LJG-2)Cost of Short-Term Debt Schedule: D3For the 12 Month Period Ended, December 31, 2012 Page: 1 of 1
Witness: Lisa Gast, CPA
(a) (b) (c)
Line Balance TotalNo. Month Outstanding Cost12 Inter-Company Loans3 Dec -$ 4 Jan 2,300,000 5 Feb - 6 Mar - 7 Apr - 8 May - 9 Jun - 10 Jul - 11 Aug - 12 Sep - 13 Oct - 14 Nov 175,000 15 Dec - 16 13 month Average 206,250$ 313 1718 Commercial Paper - - 1920 Letter of Credit - - 2122 Other - - 2324 Amortization of Upfront Fees 209,118 2526 Total 206,250$ 209,431$ 2728 Average Cost of Short-Term Debt 101.5424%
Schedule D3

Michigan Public Service Commission Case No.: U-17273Michigan Gas Utilities Corporation Exhibit No.: A-14 (LJG-2)Cost of Preferred Stock Schedule: D4For the 12 Month Period Ended, December 31, 2012 Page: 1 of 1
Witness: Lisa Gast, CPA
(a) (b) (c) (d) (e) (f) (g) (h) (i) (j)
Total ValueAnnual Discount Net Number of Cost Annual
Line Dividend Par or Finance Proceeds of Shares Outstanding Rate DollarNo. Description Required Value Premium Expenses Received Outstanding Proceeds (%) Amount12 None
Schedule D4

Michigan Public Service Commission Case No.: U-17273Michigan Gas Utilities Corporation Exhibit No.: A-14 (LJG-2)Cost of Common Shareholders' Equity Schedule: D5For the 12 Month Period Ended, December 31, 2012 Page: 1 of 1
Witness: Lisa Gast, CPA
AdjustedLine CommonNo. Stock12 Dec 82,093,6353 Jan 84,593,4004 Feb 86,988,0975 Mar 82,335,4516 Apr 83,590,8327 May 83,404,7218 Jun 82,866,0349 Jul 82,845,736
10 Aug 82,831,78611 Sep 81,631,17112 Oct 81,924,39413 Nov 83,414,28014 Dec 83,003,9191516 Average $83,247,890 10.7500%
Schedule D5

Case No. U-17273Witness: Lisa J. Gast
Exhibit A-14 (LJG-2)Schedule D6
Page 1 of 1
S&P Credit Ratings
Senior Unsecured Junior
Subordinated Commercial Paper Outlook24-Jan-2012 BBB+ BBB A-2 Stable21-Jan-2011 BBB BBB- A-2 Positive26-Jan-2010 BBB BBB- A-2 Stable5-Mar-2009 BBB BBB- A-2 Negative
25-Nov-2008 BBB+ BBB A-2 Negative
Moody's Credit Ratings
Senior UnsecuredJunior
Subordinated Commercial Paper Outlook27-May-2010 Baa1 Baa2 P-2 Stable9-Jun-2009 Baa1 Baa2 P-2 Negative9-Mar-2009 A3 Baa1 - Watch Negative9-Mar-2009 - - P-2 Stable
(a) Integrys' Corporate Credit Rating was rated A- by S&P as of January 24, 2012.(b) Integrys' Corporate Credit Rating was rated BBB+ by S&P as of June 1, 2009. (c) MGUC is not rated by any agency.(d) Integrys is not rated by Fitch.(e) Integrys has no Senior Secured.
Michigan Gas Utilities Corporation
Credit Rating Data for Parent, Integrys Energy Group, Inc.

Case No. U-17273Witness: Lisa J. Gast
Exhibit A-14 (LJG-2)Schedule D7
Page 1 of 1
Issue Date Issuing Company Offering Type
Offering Amount
(Millions)Coupon
RateMaturity
DateOffering
StructureMoody's Rating S&P Rating Spread
1/3/2013 Virginia Electric and Power Company Unsecured $250 1.200% 1/15/2018 NC4 A3 A- 0.450%1/3/2013 Virginia Electric and Power Company Unsecured $500 4.000% 1/15/2043 NC30 A3 A- 0.930%1/7/2013 Public Service Electric and Gas Company Secured $400 3.800% 1/1/2043 NC30 A1 A 0.736%1/8/2013 Duke Energy Corporation Unsecured $17 3.100% 3/15/2025 NCL Baa2 BBB 1.210%1/8/2013 South Carolina Electric & Gas Co. Secured $15 3.625% 2/1/2033 NCL 0.000%1/8/2013 South Carolina Electric & Gas Co. Secured $39 4.000% 2/1/2028 NCL 0.000%1/8/2013 Connecticut Light and Power Company Secured $400 2.500% 1/15/2023 NC10 A 0.700%1/9/2013 Entergy Arkansas, Inc. Secured $55 1.550% 10/1/2017 NCL A3 0.000%1/9/2013 Entergy Arkansas, Inc. Secured $45 2.375% 1/1/2021 NCL A3 0.000%1/9/2013 Duke Energy Corporation Unsecured $500 5.125% 1/15/2073 NC5 Baa3 BBB- 2.065%
1/15/2013 NextEra Energy Capital Holdings, Inc Unsecured $425 5.000% 1/15/2073 NC5 Baa2 BBB 1.980%1/31/2013 Central Maine Power Company Secured $225 4.450% 1/15/2043 NCL 0.000%2/8/2013 PPL Energy Supply, LLC Unsecured $212 4.600% 12/15/2021 NC10 Baa2 BBB 0.000%
2/12/2013 Exelon Generation Company, LLC Unsecured $523 4.250% 6/15/2022 NC10 Baa2 BBB 0.000%2/12/2013 Exelon Generation Company, LLC Unsecured $788 5.600% 6/15/2042 NC30 Baa2 BBB 0.000%2/25/2013 Consolidated Edison Company of New York, Inc. Unsecured $700 3.950% 3/1/2043 NC30 A- 0.880%2/28/2013 AEP Texas North Company Unsecured $125 3.090% 2/28/2023 NCL 0.000%2/28/2013 AEP Texas North Company Unsecured $75 4.480% 2/27/2043 NCL 0.000%2/28/2013 FirstEnergy Corp. Unsecured $650 2.750% 3/15/2018 NC5 BB+ 2.000%2/28/2013 FirstEnergy Corp. Unsecured $850 4.250% 3/15/2023 NC10 BB+ 2.375%3/4/2013 Southern California Edison Co. Secured $400 3.900% 3/15/2043 NC30 A1 A 0.830%3/6/2013 Hawaiian Electric Industries, Inc. Unsecured $50 3.990% 3/6/2023 Callable 0.000%3/6/2013 Tucson Electric Power Company Unsecured $91 4.000% 9/1/2029 NC10 Baa3 1.130%3/7/2013 Carolina Power & Light Company Secured $500 4.100% 3/15/2043 NC30 A1 A 0.930%
3/11/2013 Duke Energy Corporation Unsecured $4 3.150% 3/15/2027 NCL BBB 1.080%3/11/2013 Kansas City Power & Light Company Unsecured $300 3.150% 3/15/2023 NC10 Baa2 BBB 1.100%3/11/2013 Potomac Electric Power Company Secured $250 4.150% 3/15/2043 NC30 A3 A 0.900%3/11/2013 Virginia Electric and Power Company Unsecured $500 2.750% 3/15/2023 NC10 A3 A- 0.720%3/12/2013 Georgia Power Company Unsecured $400 4.300% 3/15/2043 Callable A3 A 1.100%3/12/2013 Metropolitan Edison Company Unsecured $300 3.500% 3/15/2023 Callable Baa2 BBB- 1.500%3/12/2013 PPL Capital Funding, Inc. Secured $400 5.900% 4/30/2073 NC5 Ba1 BB+ 2.680%3/13/2013 Indiana Michigan Power Company Unsecured $250 3.200% 3/15/2023 NC10 Baa2 BBB 1.200%3/18/2013 AEP Transmission Company, LLC Secured $25 4.830% 3/18/2043 NCL 0.000%3/18/2013 Duke Energy Corporation Unsecured $5 3.350% 3/15/2027 NCL Baa2 BBB 1.390%3/19/2013 Arizona Public Service Company Unsecured $100 4.500% 4/1/2042 NC28 Baa1 BBB+ 1.050%3/19/2013 CMS Energy Corporation Unsecured $250 4.700% 3/31/2043 NC30 Baa3 BBB- 1.600%3/19/2013 DTE Electric Company Secured $375 4.000% 4/1/2043 NC30 A1 A 0.875%3/19/2013 Public Service Company of Colorado Secured $250 2.500% 3/15/2023 NC10 A2 A 0.650%3/19/2013 Public Service Company of Colorado Secured $250 3.950% 3/15/2043 NC30 A 0.850%3/21/2013 Westar Energy, Inc. Secured $250 4.100% 4/1/2043 NC30 A3 A- 0.950%3/25/2013 Duke Energy Corporation Unsecured $3 3.250% 3/15/2027 NCL Baa2 BBB 1.320%3/26/2013 Kansas City Power & Light Company Secured $31 1.250% 7/1/2017 NCL A3 0.000%3/26/2013 Kansas City Power & Light Company Secured $40 2.950% 12/1/2023 NC10 A3 0.000%3/26/2013 Kansas City Power & Light Company Secured $39 2.950% 12/1/2023 NC10 A3 0.000%4/1/2013 Duke Energy Corporation Unsecured $3 3.250% 6/15/2027 NCL Baa2 BBB 1.390%4/2/2013 ALLETE, Inc. Secured $50 1.830% 4/15/2018 Callable 0.000%4/2/2013 ALLETE, Inc. Secured $40 3.300% 10/15/2028 NC15 0.000%4/2/2013 ALLETE, Inc. Secured $60 4.210% 10/15/2043 NC30 0.000%4/2/2013 Texas-New Mexico Power Company Secured $93 6.950% 4/1/2043 Callable A3 A- 0.000%4/3/2013 Idaho Power Co. Secured $75 2.500% 4/1/2023 NC10 A2 A- 0.727%4/3/2013 Idaho Power Co. Secured $75 4.000% 4/1/2043 NC30 A2 A- 0.965%4/4/2013 ITC Midwest LLC Secured $100 4.090% 4/30/2043 NC30 0.000%4/9/2013 NiSource Finance Corporation Unsecured $750 4.800% 2/15/2044 NC30 Baa3 BBB- 1.875%
4/16/2013 Duke Energy Corporation Unsecured $17 3.000% 6/15/2025 NCL Baa2 BBB 1.250%4/25/2013 AES Corporation Unsecured $500 4.875% 5/15/2023 NC5 Ba3 BB- 3.160%
Note: Date Parameters: Jan 01, 2013-May 06, 2013
Source: SNL Financial
Utility Bond Issuances
Michigan Gas Utilities Corporation
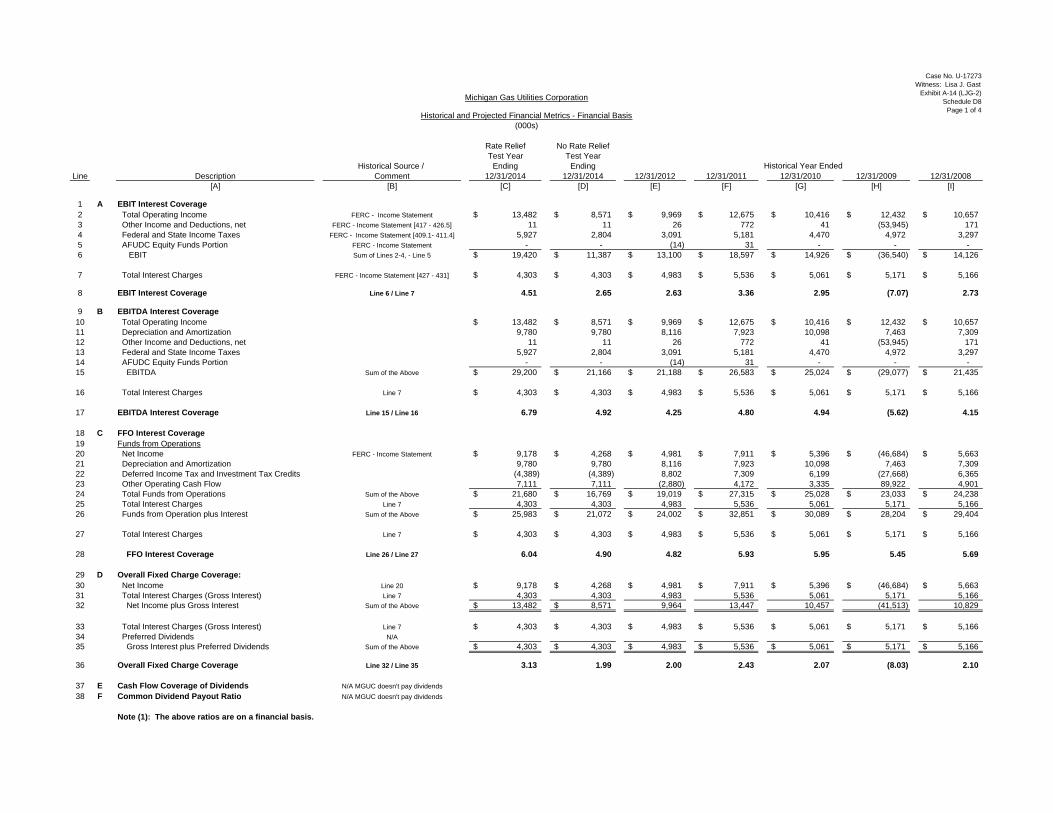
Case No. U-17273Witness: Lisa J. Gast
Exhibit A-14 (LJG-2)Schedule D8
Page 1 of 4
Rate Relief No Rate ReliefTest Year Test Year
Historical Source / Ending EndingLine Description Comment 12/31/2014 12/31/2014 12/31/2012 12/31/2011 12/31/2010 12/31/2009 12/31/2008
[A] [B] [C] [D] [E] [F] [G] [H] [I]
1 A EBIT Interest Coverage2 Total Operating Income FERC - Income Statement 13,482$ 8,571$ 9,969$ 12,675$ 10,416$ 12,432$ 10,657$ 3 Other Income and Deductions, net FERC - Income Statement [417 - 426.5] 11 11 26 772 41 (53,945) 171 4 Federal and State Income Taxes FERC - Income Statement [409.1- 411.4] 5,927 2,804 3,091 5,181 4,470 4,972 3,297 5 AFUDC Equity Funds Portion FERC - Income Statement - - (14) 31 - - - 6 EBIT Sum of Lines 2-4, - Line 5 19,420$ 11,387$ 13,100$ 18,597$ 14,926$ (36,540)$ 14,126$
7 Total Interest Charges FERC - Income Statement [427 - 431] 4,303$ 4,303$ 4,983$ 5,536$ 5,061$ 5,171$ 5,166$
8 EBIT Interest Coverage Line 6 / Line 7 4.51 2.65 2.63 3.36 2.95 (7.07) 2.73
9 B EBITDA Interest Coverage10 Total Operating Income 13,482$ 8,571$ 9,969$ 12,675$ 10,416$ 12,432$ 10,657$ 11 Depreciation and Amortization 9,780 9,780 8,116 7,923 10,098 7,463 7,30912 Other Income and Deductions, net 11 11 26 772 41 (53,945) 17113 Federal and State Income Taxes 5,927 2,804 3,091 5,181 4,470 4,972 3,29714 AFUDC Equity Funds Portion - - (14) 31 - - - 15 EBITDA Sum of the Above 29,200$ 21,166$ 21,188$ 26,583$ 25,024$ (29,077)$ 21,435$
16 Total Interest Charges Line 7 4,303$ 4,303$ 4,983$ 5,536$ 5,061$ 5,171$ 5,166$
17 EBITDA Interest Coverage Line 15 / Line 16 6.79 4.92 4.25 4.80 4.94 (5.62) 4.15
18 C FFO Interest Coverage19 Funds from Operations20 Net Income FERC - Income Statement 9,178$ 4,268$ 4,981$ 7,911$ 5,396$ (46,684)$ 5,663$ 21 Depreciation and Amortization 9,780 9,780 8,116 7,923 10,098 7,463 7,309 22 Deferred Income Tax and Investment Tax Credits (4,389) (4,389) 8,802 7,309 6,199 (27,668) 6,365 23 Other Operating Cash Flow 7,111 7,111 (2,880) 4,172 3,335 89,922 4,901 24 Total Funds from Operations Sum of the Above 21,680$ 16,769$ 19,019$ 27,315$ 25,028$ 23,033$ 24,238$ 25 Total Interest Charges Line 7 4,303 4,303 4,983 5,536 5,061 5,171 5,166 26 Funds from Operation plus Interest Sum of the Above 25,983$ 21,072$ 24,002$ 32,851$ 30,089$ 28,204$ 29,404$
27 Total Interest Charges Line 7 4,303$ 4,303$ 4,983$ 5,536$ 5,061$ 5,171$ 5,166$
28 FFO Interest Coverage Line 26 / Line 27 6.04 4.90 4.82 5.93 5.95 5.45 5.69
29 D Overall Fixed Charge Coverage:30 Net Income Line 20 9,178$ 4,268$ 4,981$ 7,911$ 5,396$ (46,684)$ 5,663$ 31 Total Interest Charges (Gross Interest) Line 7 4,303 4,303 4,983 5,536 5,061 5,171 5,166 32 Net Income plus Gross Interest Sum of the Above 13,482$ 8,571$ 9,964 13,447 10,457 (41,513) 10,829
33 Total Interest Charges (Gross Interest) Line 7 4,303$ 4,303$ 4,983$ 5,536$ 5,061$ 5,171$ 5,166$ 34 Preferred Dividends N/A35 Gross Interest plus Preferred Dividends Sum of the Above 4,303$ 4,303$ 4,983$ 5,536$ 5,061$ 5,171$ 5,166$
36 Overall Fixed Charge Coverage Line 32 / Line 35 3.13 1.99 2.00 2.43 2.07 (8.03) 2.10
37 E Cash Flow Coverage of Dividends N/A MGUC doesn't pay dividends38 F Common Dividend Payout Ratio N/A MGUC doesn't pay dividends
Note (1): The above ratios are on a financial basis.
Michigan Gas Utilities Corporation
Historical and Projected Financial Metrics - Financial Basis(000s)
Historical Year Ended

Case No. U-17273Witness: Lisa J. Gast
Exhibit A-14 (LJG-2)Schedule D8
Page 2 of 4
Rate ReliefTest Year Test Year
Ending EndedLine Description Historical Source 12/31/2014 12/31/2014 12/31/2012 12/31/2011 12/31/2010 12/31/2009 12/31/2008
[A] [B] [C] [D] [E] [F] [G] [H] [I]
1 G Permanent Capitalization Balances & Percentages2 Capital Structure3 Long-term Debt GLN5117M 78,083 78,083 84,000 84,000 84,000 84,000 84,000 4 Preferred Stock N/A5 Unadjusted Common Equity GLN5117M 145,544$ 145,641$ 145,480$ 150,860$ 158,588$ 168,163$ 234,093$
6 Unadjusted Total Capital Sum of Lines 3 - 5 223,627$ 223,724$ 229,480$ 234,860$ 242,588$ 252,163$ 318,093$
7 Capital Structure Ratios - Financial8 Long-term Debt Ratio Line 3 / Line 6 34.92% 34.90% 36.60% 35.77% 34.63% 33.31% 26.41%9 Preferred Stock Ratio Line 4 / Line 6 - - - - - - - 10 Common Equity Ratio Line 5 / Line 6 65.08% 65.10% 63.40% 64.23% 65.37% 66.69% 73.59%
11 H Return on Equity (ROE)12 Financial ROE Line 20 from Page 1 / Line 5 6.31% 2.93% 3.42% 5.24% 3.40% -27.76% 2.42%13 Authorized ROE 10.75% 10.75% 10.75% 10.75% 10.45% 10.45%
14 I Total Capitalization Balances & Percentages15 Short-term Debt GLN5117M 10,217 10,120 206 1,288 3,891 8,864 19,611 16 Long-term Debt Line 3 Above 78,083 78,083 84,000 84,000 84,000 84,000 84,000 17 Preferred Stock Line 4 Above - - - - - - - 18 Unadjusted Common Equity Line 5 Above 145,544 145,641 145,480 150,860 158,588 168,163 234,093
19 Unadjusted Total Capital Sum of Lines 15 - 18 233,845$ 233,845$ 229,686$ 236,148$ 246,479$ 261,026$ 337,704$
20 Capital Structure Ratios - Financial21 Short-term Debt Ratio Line 15 / Line 19 4.37% 4.33% 0.09% 0.55% 1.58% 3.40% 5.81%22 Long-term Debt Ratio Line 16 / Line 19 33.39% 33.39% 36.57% 35.57% 34.08% 32.18% 24.87%23 Preferred Stock Ratio Line 17 / Line 19 - - - - - - - 24 Common Equity Ratio Line 18 / Line 19 62.24% 62.28% 63.34% 63.88% 64.34% 64.42% 69.32%
Note (1): The above ratios are on a financial basis.Note (2): Data is on a 13 month average basis
Historical Year Ended
Michigan Gas Utilities Corporation
Historical and Projected Financial Metrics - Financial Basis(000s)

Case No. U-17273Witness: Lisa J. Gast
Exhibit A-14 (LJG-2)Schedule D8
Page 3 of 4
Rate Relief No Rate ReliefTest Year Test Year
Historical Source / Ending EndingLine Description Comment 12/31/2014 12/31/2014 12/31/2012 12/31/2011 12/31/2010 12/31/2009 12/31/2008
[A] [B] [C] [D] [E] [F] [F] [F] [F]
1 A EBIT Interest Coverage2 Total Operating Income Jurisdictional Models 13,482$ 8,570$ 9,992$ 12,450$ 10,436$ 12,275$ 10,654$ 3 Other Income and Deductions, net - - - - - - - 4 Federal and State Income Taxes Jurisdictional Models 5,927$ 2,805$ 3,068$ 5,405$ 4,449$ 5,130$ 3,294$ 5 AFUDC Equity Funds Portion N/A - - - - - - - 6 EBIT Sum of Lines 2-4, - Line 5 19,409$ 11,375$ 13,060$ 17,856$ 14,885$ 17,405$ 13,948$
7 Total Interest Charges Jurisdictional Models 4,300$ 4,300$ 5,173$ 5,252$ 5,061$ 5,171$ 5,745$
8 EBIT Interest Coverage Line 6 / Line 7 4.51 2.65 2.52 3.40 2.94 3.37 2.43
9 B EBITDA Interest Coverage10 Total Operating Income Line 2 13,482$ 8,570$ 9,992$ 12,450$ 10,436$ 12,275$ 10,654$ 11 Depreciation and Amortization Line 21 9,780 9,780 8,116 7,923 10,098 7,463 7,30912 Other Income and Deductions, net - - - - - - - 13 Federal and State Income Taxes Line 4 5,927 2,805 3,068 5,405 4,449 5,130 3,29414 AFUDC Equity Funds Portion - - - - - - - 15 EBITDA Sum of the Above 29,189$ 21,155$ 21,176$ 25,779$ 24,983$ 24,868$ 21,257$
16 Total Interest Charges Line 7 4,300$ 4,300$ 5,173$ 5,252$ 5,061$ 5,171$ 5,745$
17 EBITDA Interest Coverage Line 15 / Line 16 6.79 4.92 4.09 4.91 4.94 4.81 3.70
18 C FFO Interest Coverage19 Funds from Operations20 Net Income Jurisdictional Models 9,181$ 4,270$ 4,819$ 7,199$ 5,375$ 7,104$ 4,909$ 21 Depreciation and Amortization GLN5250M 9,780 9,780 8,116 7,923 10,098 7,463 7,309 22 Deferred Income Tax and Investment Tax Credits GLN5250M 7,250 7,250 4,987 3,744 1,865 2,332 2,027 23 Other Operating Cash Flow 7,111 7,111 (2,880) 4,172 3,335 1,734 4,901 24 Total Funds from Operations Sum of the Above 33,322$ 28,411$ 15,042$ 23,037$ 20,673$ 18,633$ 19,146$ 25 Total Interest Charges Line 7 4,300 4,300 5,173 5,252 5,061 5,171 5,745 26 Funds from Operation plus Interest Sum of the Above 37,623$ 32,711$ 20,215$ 28,289$ 25,734$ 23,804$ 24,891$
27 Total Interest Charges Line 7 4,300$ 4,300$ 5,173$ 5,252$ 5,061$ 5,171$ 5,745$
28 FFO Interest Coverage Line 26 / Line 27 8.75 7.61 3.91 5.39 5.09 4.60 4.33
29 D Overall Fixed Charge Coverage:30 Net Income Line 20 9,181$ 4,270$ 4,819$ 7,199$ 5,375$ 7,104$ 4,909$ 31 Total Interest Charges (Gross Interest) Line 7 4,300 4,300 5,173 5,252 5,061 5,171 5,745 32 Net Income plus Gross Interest Sum of the Above 13,482$ 8,570$ 9,992 12,450 10,436 12,275 10,654
33 Total Interest Charges (Gross Interest) Line 7 4,300$ 4,300$ 5,173$ 5,252$ 5,061$ 5,171$ 5,745$ 34 Preferred Dividends N/A35 Gross Interest plus Preferred Dividends Sum of the Above 4,300$ 4,300$ 5,173$ 5,252$ 5,061$ 5,171$ 5,745$
36 Overall Fixed Charge Coverage Line 32 / Line 35 3.13 1.99 1.93 2.37 2.06 2.37 1.85
37 E Cash Flow Coverage of Dividends N/A MGUC doesn't pay dividends38 F Common Dividend Payout Ratio N/A MGUC doesn't pay dividends
Note (1): The above ratios are on a ratemaking basis.
Michigan Gas Utilities Corporation
Historical and Projected Financial Metrics - Ratemaking Basis(000s)
Historical Year Ended

Case No. U-17273Witness: Lisa J. Gast
Exhibit A-14 (LJG-2)Schedule D8
Page 4 of 4
Rate ReliefTest Year Test Year
Ending EndedLine Description Historical Source 12/31/2014 12/31/2014 12/31/2012 12/31/2011 12/31/2010 12/31/2009 12/31/2008
[A] [B] [C] [D] [E] [F] [F] [F] [F]
1 G Permanent Capitalization Balances & Percentages2 Capital Structure3 Long-term Debt Jurisdictional Models 78,083 78,083 84,000 84,000 84,000 84,000 84,000 4 Preferred Stock N/A5 Common Equity - Ratemaking Jurisdictional Models 88,531 88,628 83,248 84,734 88,544 96,582 102,036
6 Ratemaking Total Capital Sum of Lines 3 - 6 166,614$ 166,711$ 167,248$ 168,734$ 172,544$ 180,582$ 186,036$
7 Capital Structure Ratios - Ratemaking8 Long-term Debt Ratio Line 3 / Line 6 46.86% 46.84% 50.22% 49.78% 48.68% 46.52% 45.15%9 Preferred Stock Ratio Line 4 / Line 6 - - - - - - - 10 Common Equity Ratio Line 5/ Line 6 53.14% 53.16% 49.78% 50.22% 51.32% 53.48% 54.85%
11 H Return on Equity (ROE)12 Ratemaking Net Income Line 20 9,181$ 4,270$ 4,819$ 7,199$ 5,375$ 7,104$ 4,909$
13 Ratemaking ROE Jurisdictional Models 10.37% 5.23% 6.14% 8.45% 8.45% 8.45% 5.92%14 Authorized ROE 10.75% 10.75% 10.75% 10.75% 10.45% 10.45%
15 I Total Capitalization Balances & Percentages16 Short-term Debt Jurisdictional Models 10,217 10,120 206 1,288 3,891 8,864 19,611 17 Long-term Debt Line 3 78,083 78,083 84,000 84,000 84,000 84,000 84,000 18 Preferred Stock Line 4 - - - - - - - 19 Common Equity - Ratemaking Line 6 88,531 88,628 83,248 84,734 88,544 96,582 102,036 20 Total Capital Sum of Lines 16 - 19 176,831 176,831 167,454 170,022 176,435 189,446 205,647
21 Job Development - ITC - Debt - - - - - - - 22 Job Development - ITC - Equity (16,263,951) - - - - - - - 23 Total Job Development - ITC - - - - - - -
24 Deferred Investment Tax Credit Jurisdictional Models - - - - - 11 -
25 Deferred Income Taxes (Net) - Federal Jurisdictional Models 38,097 38,097 30,423 23,825 22,106 20,077 18,715
26 Capital Structure Adjustment Jurisdictional Models (5,003) (5,003) (4,391) (1,257) (3,981) (3,046) (11,252)
27 Ratemaking Total Capital Sum of Lines 20 - 26 209,925$ 209,925$ 193,486$ 192,589$ 194,560$ 206,488$ 213,109$
28 Percent Capital29 Short-term Debt Ratio Line 16 / Line 20 5.78% 5.72% 0.12% 0.76% 2.21% 4.68% 9.54%30 Long-term Debt Ratio Line 17 / Line 20 44.16% 44.16% 50.16% 49.41% 47.61% 44.34% 40.85%31 Preferred Stock Ratio Line 18 / Line 20 0.00% 0.00% 0.00% 0.00% 0.00% 0.00% 0.00%32 Common Equity Ratio Line 19 / Line 20 50.07% 50.12% 49.71% 49.84% 50.18% 50.98% 49.62%
Percent of Total Capital29 Short-term Debt Ratio Line 16 / Line 27 4.87% 4.82% 0.11% 0.67% 2.00% 4.29% 9.20%30 Long-term Debt Ratio Line 17 / Line 27 37.20% 37.20% 43.41% 43.62% 43.17% 40.68% 39.42%31 Preferred Stock Ratio Line 18 / Line 27 0.00% 0.00% 0.00% 0.00% 0.00% 0.00% 0.00%32 Common Equity Ratio Line 19 / Line 27 42.17% 42.22% 43.03% 44.00% 45.51% 46.77% 47.88%33 Job Development - ITC Ratio Line 23 / Line 27 0.00% 0.00% 0.00% 0.00% 0.00% 0.00% 0.00%34 Deferred Investment Tax Credit Ratio Line 24 / Line 27 0.00% 0.00% 0.00% 0.00% 0.00% 0.01% 0.00%35 Deferred Income Taxes (Net) - Federal - Ratio Line 25 / Line 27 18.15% 18.15% 15.72% 12.37% 11.36% 9.72% 8.78%36 Capital Structure Adjustment Line 26 / Line 27 -2.38% -2.38% -2.27% -0.65% -2.05% -1.47% -5.28%
Note (1): The above ratios are on a ratemaking basis.Note (2): Data is presented on a 13-month average basis.
Historical Year Ended
Historical and Projected Financial Metrics - Ratemaking Basis(000s)
Michigan Gas Utilities Corporation

S T A T E O F M I C H I G A N
BEFORE THE MICHIGAN PUBLIC SERVICE COMMISSION
* * * * *
In the matter of the application of ) MICHIGAN GAS UTILITIES CORPORATION ) for authority to increase retail natural gas rates. ) Case No. U-17273 )
DIRECT TESTIMONY AND EXHIBIT OF
PAUL R. MOUL
FOR
MICHIGAN GAS UTILITIES CORPORATION
June 7, 2013

GLOSSARY OF ACRONYMS AND DEFINED TERMS
ACRONYM DEFINED TERM
AFUDC Allowance for Funds Used During Construction
β Beta
b Represents the retention rate that consists of the fraction of earnings that are not paid out as dividends
b x r Represents internal growth
CAPM Capital Asset Pricing Model
CCR Corporate Credit Rating
CE Comparable Earnings
CPFF Commercial Paper Funding Facility
DCF Discounted Cash Flow
FFO Funds from Operations
FOMC Federal Open Market Committee
g Growth rate
GSE Government-sponsored enterprises
IGF Internally Generated Funds
LDC Local Distribution Companies
Lev Leverage modification
LT Long Term
MGUC Michigan Gas Utilities Corporation
MPSC Michigan Public Service Commission
MLPs Master Limited Partnerships
P-E Price-earnings
PUC Public Utility Commission
r Represents the expected rate of return on common equity
Rf Risk-free rate of return
Rm Market risk premium
RP Risk Premium

GLOSSARY OF ACRONYMS AND DEFINED TERMS
ACRONYM DEFINED TERM
s Represents the new common shares expected to be issued by a firm
s x v Represents external growth
S&P Standard & Poor’s
v Represents the value that accrues to existing shareholders from selling stock at a price different from book value

-1-
S T A T E O F M I C H I G A N
BEFORE THE MICHIGAN PUBLIC SERVICE COMMISSION
* * * * * In the matter of the application of ) MICHIGAN GAS UTILITIES CORPORATION ) for authority to increase retail natural gas rates. ) Case No. U-17273 )
QUALIFICATIONS OF
PAUL R. MOUL PART I
INTRODUCTION AND SUMMARY OF RECOMMENDATIONS 1
Q. Please state your name, occupation and business address. 2
A. My name is Paul Ronald Moul. My business address is 251 Hopkins Road, 3
Haddonfield, New Jersey 08033-3062. I am Managing Consultant at the firm P. Moul 4
& Associates, an independent financial and regulatory consulting firm. My 5
educational background, business experience and qualifications are provided in 6
Appendix A, which follows my direct testimony. 7

-2-
PAUL R. MOUL DIRECT TESTIMONY
PART II Q. What is the purpose of your pre-filed direct testimony? 1
A. My direct testimony presents evidence, analysis, and a recommendation concerning 2
the appropriate cost of equity that the Michigan Public Service Commission (“MPSC”) 3
should recognize in the determination of the revenues that Michigan Gas Utilities 4
Corporation (“MGUC” or “the Company”) should realize as a result of this proceeding. 5
My analysis and recommendation are supported by the detailed financial data 6
contained in Exhibit A-4 (PRM-1), which is divided into twelve (12) schedules. 7
8
Q. Are you the witness sponsoring Exhibit A-4 (PRM-1)? 9
A. Yes, I am. 10
11
Q. Was Exhibit A-4 (PRM-1) prepared by you or under your supervision? 12
A. Yes, it was. 13
14
Q. Based upon your analysis, what is your conclusion concerning the appropriate 15
cost of equity for the Company in this case? 16
A. My conclusion is that the Company’s cost of equity is 10.75% and that the 17
Commission should adopt this cost rate as part of its determination of the Company’s 18
rates. My cost of equity determination is part of the Company’s weighted average 19
cost of capital, which is the product of weighting the individual capital costs by the 20
proportion of each respective type of capital; should, if adopted by the Commission, 21
establish a compensatory level of return for the use of such capital; and should 22
provide the Company with the ability to attract capital on reasonable terms. The 23

-3-
details supporting my cost of equity determination are presented on Schedule D6. 1
2
Q. What background information have you considered in reaching a conclusion 3
concerning the Company’s cost of equity? 4
A. The Company is a wholly-owned subsidiary of Integrys Energy Group, Inc. 5
("Integrys"). MGUC was acquired by Integrys on April 1, 2006 from Aquila, Inc. d/b/a 6
Aquila Networks – MGU. Integrys was formerly named WPS Resources Corporation 7
prior to its merger with Peoples Energy Corporation. The merger with Peoples 8
Energy Corporation was completed on February 21, 2007. Integrys is a holding 9
company and owns, in addition to MGUC, The Peoples Gas Light and Coke 10
Company, North Shore Gas Company, Minnesota Energy Resources Corporation, 11
Upper Peninsula Power Company, Wisconsin Public Service Corporation, and other 12
energy investments. 13
14
MGUC distributes natural gas to approximately 166,000 customers in 147 15
communities in southern and western portions of Michigan, including Grand Haven, 16
Otsego, Benton Harbor, Coldwater, and Monroe. Throughput to its customers in 2012 17
was represented by approximately 36% to residential customers, 10% to commercial 18
and small industrial customers, and 54% to transportation customers, based on 2012 19
Calendar Sales displayed on Exhibit A-15 (MMD-2), Schedule E1.1. Approximately 20
98% of MGUC’s residential customers use natural gas for space heating purposes. 21
This means that MGUC’s throughput is sensitive to temperature conditions over which 22
MGUC has absolutely no control. The Company’s throughput is also significantly 23
influenced by transportation customers, which represent 54% of total throughput, but 24
comprise just 0.1% of total customers, based on 2012 year end customers from 25

-4-
Exhibit A-15 (MMD-2), Schedule E2. As such, the energy needs of a few customers 1
can have a significant impact on MGUC’s operations. 2
3
Q. How have you determined the cost of common equity in this case? 4
A. The cost of common equity is established using capital market and financial data 5
relied upon by investors to assess the relative risk, and hence the cost of equity, for a 6
gas distribution utility, such as the Company. In this regard, I have considered three 7
(3) well-recognized measures of the cost of equity: the Discounted Cash Flow 8
(“DCF”) model, the Risk Premium (“RP”) analysis, and the Capital Asset Pricing Model 9
(“CAPM”). I also considered as a check on the results of these models the 10
Comparable Earnings (“CE”) approach. 11
12
Q. In your opinion, what factors should the Commission consider when 13
determining the Company’s rate of return in this proceeding? 14
A. The Commission’s rate of return allowance must be set to cover the Company’s 15
interest and dividend payments, provide a reasonable level of earnings retention, 16
produce an adequate level of internally generated funds to meet capital requirements, 17
be commensurate with the risk to which the Company’s capital is exposed, assure 18
confidence in the financial integrity of the Company, support reasonable credit quality, 19
and allow the Company to raise capital on reasonable terms. The return that I 20
propose fulfills these established standards of a fair rate of return set forth by the 21
landmark Bluefield and Hope cases.1 That is to say, my proposed rate of return is 22
commensurate with returns available on investments having corresponding risks. 23
24 1Bluefield Water Works & Improvement Co. v. P.S.C. of West Virginia, 262 U.S. 679 (1923) and F.P.C. v. Hope Natural Gas Co., 320 U.S. 591 (1944).

-5-
Q. How have you measured the cost of equity in this case? 1
A. It is necessary to use a proxy group of companies to measure the Company’s cost of 2
equity because its stock is not traded. As noted above, the Company’s stock is 3
completely owned by Integrys. The use of a proxy group to measure the Company’s 4
current cost of equity is a common practice of analysts performing these types of 5
studies. 6
7
Q. Please explain the selection process used to assemble the proxy group? 8
A. I began with the universe of gas utilities contained in the basic service of The Value 9
Line Investment Survey, which consists of eleven companies. Value Line is an 10
investment advisory service that is a widely used source in public utility rate cases. 11
Value Line is a database that is familiar to the Commission, and is widely available to 12
investors. Value Line is frequently used by utility witnesses and witnesses for the 13
Staff in public utility rate cases. I eliminated two companies from the Value Line 14
group when I assembled my proxy group. The eliminations were NiSource, Inc. due 15
to its natural gas pipeline and storage operations, and UGI Corporation because of its 16
highly diversified businesses. The remaining nine companies are included in my 17
proxy group. To this group, I added four combination gas and electric utilities that are 18
primarily delivery companies (i.e., they have no significant generation assets). The 19
complete group is comprised of the following companies: AGL Resources, Inc., 20
Atmos Energy Corp., Consolidated Edison, Inc., Laclede Group, Inc., New Jersey 21
Resources Corp., Northeast Utilities, Northwest Natural Gas, PEPCO Holdings, Inc., 22
Piedmont Natural Gas Co., South Jersey Industries, Inc., Southwest Gas Corporation, 23
UIL Holding Corporation, and WGL Holdings, Inc. I will refer to these companies as 24
the “Delivery Group” throughout my testimony. The models that I used to measure 25

-6-
the cost of common equity for the Company were applied with market and financial 1
data developed from this group. 2
3
Q. Why have you performed your cost of equity analysis utilizing the group 4
average market data? 5
A. I have applied the models/methods for estimating the cost of equity using the average 6
data for the Delivery Group. I have not measured separately the cost of equity for the 7
individual companies within the Delivery Group, because the determination of the cost 8
of equity for an individual company can be problematic. The use of group average 9
data will reduce the effect of potentially anomalous results for an individual company if 10
a company-by-company approach were utilized. This is to say, by employing group 11
average data, rather than individual company analysis, I have minimized the effect of 12
extraneous influences on the market data for an individual company. 13
14
Q. Please summarize your cost of equity analysis. 15
A. My cost of equity determination was derived from the results of the methods/models 16
identified above. In general, the use of more than one method provides a superior 17
foundation to arrive at the cost of equity. At any point in time, any single method can 18
provide an incomplete measure of the cost of equity. The following table, derived 19
from the model results presented on Schedule D6, provides a summary of the 20
indicated costs of equity using each of these approaches. 21

-7-
DCF 9.63%
RP 12.00%
CAPM 11.01%
Measures of Central Tendency:Average 10.88%Median 11.01%Mid-point 10.82%
Comparable Earnings 12.85%
From these results, a reasonable return on equity for the Company would be 10.75%. 1
Indeed, the midpoint of the DCF and Risk Premium results is 10.82% (9.63% + 2
12.00% = 21.63% ÷ 2) and the midpoint of the DCF and CAPM results is 10.32% 3
(9.63% + 11.01% = 20.64% ÷ 2). The 10.75% cost of equity that I propose fits well 4
within this range. As I indicated previously, the results of the Comparable Earnings 5
approach, which provides a 12.85% return, confirms the reasonableness of my cost of 6
equity determination. My recommended rate of return on common equity of 10.75% 7
makes no provision for the prospect that the rate of return may not be achieved due to 8
unforeseen events, such as unexpected spikes in the cost of purchased products and 9
other expenses. To obtain new capital and retain existing capital, the rate of return on 10
common equity must be high enough to satisfy investors’ requirements. Indeed, in a 11
study prepared for the American Gas Foundation, it was noted that allowed equity 12
returns below the level required by investors may lessen a utility’s ability to maintain 13
and develop systems that are necessary to provide natural gas service efficiently. 14
Furthermore, the report specifically found that returns below 10% would trigger broad 15
disenchantment with LDC investment. 16
17

-8-
NATURAL GAS RISK FACTORS 1 Q. What factors currently affect the business risk of natural gas utilities? 2
A. Gas utilities face risks arising from competition, economic regulation, the business 3
cycle, and customer usage patterns. Today, they operate in a more complex 4
environment with time frames for decision-making considerably shortened. Their 5
business profile is influenced by market-oriented pricing for the commodity distributed 6
to customers and open access for the transportation of natural gas for large volume 7
customers. 8
9
Natural gas utilities have focused increased attention on safety and reliability issues. 10
In order to address these issues and to comply with new and pending pipeline safety 11
regulations, natural gas companies are now allocating more of their resources to 12
addressing aging infrastructure issues. 13
14
Q. How does the Company’s throughput to large volume customers affect its risk 15
profile? 16
A. Success in this aspect of the Company’s market is subject to the business cycle, the 17
price of alternative energy sources, and pressures from competitors. Moreover, 18
external factors can also influence the Company’s throughput to these customers, 19
which face competitive pressure on their operations from facilities located outside the 20
Company’s service territory. The Company’s risk profile is strongly influenced by 21
natural gas sold/delivered to customers engaged in manufacturing. Large volume 22
users that have traditionally used transportation service also have the ability to bypass 23
the Company’s facilities. To date, MGUC has been proactive to the threat of bypass 24
by working with its customers that are in close proximity to interstate pipelines. 25
Success in this aspect of MGUC’s market is subject to the business cycle, the price of 26

-9-
alternative energy sources, and pressures from competitors. Moreover, external 1
factors can also influence MGUC’s throughput to these customers because cost 2
factors can impact their operations relative to alternative facilities located outside 3
MGUC’s service territory. 4
5
Q. Please indicate how its construction program affects the Company’s risk 6
profile. 7
A. The Company is required to undertake investments to maintain and upgrade existing 8
facilities in its service territories. To maintain safe and reliable service to existing 9
customers, MGUC must invest to upgrade its infrastructure. The Company projects 10
its construction expenditures will be $89 million during the period 2013-2017. Over 11
this period, these capital expenditures will represent approximately 61% ($89 million ÷ 12
$145 million) of its net utility plant at December 31, 2012. As previously noted, a fair 13
rate of return represents a key to a financial profile that will provide the Company with 14
the ability to raise the capital necessary to meet its needs on reasonable terms. 15
16
Q. Does your cost of equity analysis and recommendation take into account the 17
revenue decoupling mechanism (“RDM”) that is presently in effect for the 18
Company? 19
A. Yes. The Company’s RDM, which was approved in Case No. U-15990, is intended to 20
separate revenues from variations in sales related to usage caused by variations in 21
year-to-year weather conditions from the “normal” weather assumed in establishing 22
rates in a test year context. My cost of equity analysis that provides a 10.75% rate of 23
return on common equity takes into account the Company’s RDM. 24
25

-10-
Q. How have you reflected the effect of the RDM in your analysis? 1
A. Most of the companies included in my Delivery Group already have tariffed weather 2
normalization mechanisms similar to the RDM and other tariff features designed to 3
stabilize revenues. Therefore my analysis already reflects the impacts of the RDM 4
and other revenue stabilization mechanisms on investor expectations through the use 5
of market-determined models. All but one of the companies in my Delivery Group 6
already has some form of revenue stabilization mechanism. The sole exception is 7
Laclede, which has a weather mitigated rate design that recovers its fixed costs more 8
evenly during the heating season. Therefore, the market prices of these companies’ 9
common equity reflect the expectations of investors related to a regulatory 10
mechanism that adjust revenues for abnormal weather and other occurrences. 11
12
In addition, the companies in my Delivery Group have other mechanisms that are 13
intended to stabilize revenue and assure recovery of the fixed costs. Many of these 14
mechanisms are intended to address the same issues as the Company’s proposed 15
rate design in this case. As such, the market prices of these companies’ common 16
stocks reflect the expectations of investors related to a regulatory mechanism that 17
adjust revenues for abnormal weather, changes in customer usage patterns, and 18
other items such as infrastructure investment. The trend in the industry is to stabilize 19
the recovery of fixed costs, which are unaffected by usage. Indeed, there has been a 20
proliferation of tracking mechanisms in the LDC business. 21
22
Q. How should the Commission respond to the issues facing the natural gas 23
utilities and, in particular, the Company? 24
A. The Commission should recognize and take into account the competitive environment 25

-11-
and the risk it poses in the natural gas business in determining the cost of capital for 1
the Company, and provide a reasonable opportunity for the Company to actually 2
achieve its cost of capital. 3
4
FUNDAMENTAL RISK ANALYSIS 5 Q. Is it necessary to conduct a fundamental risk analysis to provide a framework 6
for a determination of a utility’s cost of equity? 7
A. Yes, it is. It is necessary to establish a company’s relative risk position within its 8
industry through a fundamental analysis of various quantitative and qualitative factors 9
that bear upon investors’ assessment of overall risk. The qualitative factors that bear 10
upon Company risk have already been discussed. The quantitative risk analysis 11
follows. For this purpose, I compared the Company to the S&P Public Utilities, an 12
industry-wide proxy consisting of various regulated businesses, and to the Delivery 13
Group. 14
15
Q. What are the components of the S&P Public Utilities? 16
A. The S&P Public Utilities is a widely recognized index that is comprised of electric 17
power and natural gas companies. These companies are identified on page 3 of 18
Schedule D9. 19
20
Q. Is knowledge of a utility's bond rating an important factor in assessing its risk 21
and cost of capital? 22
A. Yes. Knowledge of a company’s credit quality rating is important because the cost of 23
each type of capital is directly related to the associated risk of the firm. So while a 24
company’s credit quality risk is shown directly by the rating and yield on its bonds, 25
these relative risk assessments also bear upon the cost of equity. This is because a 26

-12-
firm's cost of equity is represented by its borrowing cost plus compensation to 1
recognize the higher risk of an equity investment compared to debt. 2
3
Q. How do the bond ratings compare for the Company, the Delivery Group, and the 4
S&P Public Utilities? 5
A. Presently, the corporate credit rating (“CCR”) for Integrys is A- from Standard and 6
Poor’s Corporation (“S&P”), and the Long Term (“LT”) issuer rating is Baa1 from 7
Moody’s Investors Services (“Moody’s”). The credit quality ratings of Integrys are 8
cited here because MGUC does not have a credit rating and it obtains its long-term 9
debt from Integrys. The LT issuer rating by Moody’s and the CCR designation by 10
S&P focus upon the credit quality of the issuer of the debt, rather than upon the debt 11
obligation itself. For the Delivery Group, the average LT issuer rating is A3 by 12
Moody’s and the average CCR is A- by S&P, as displayed on page 2 of Schedule D8. 13
For the S&P Public Utilities, the average composite rating is Baa1 by Moody’s and 14
BBB+ by S&P, as displayed on page 3 of Schedule D9. Many of the financial 15
indicators that I will subsequently discuss are considered during the rating process. 16
17
Q. How do the financial data compare for the Company, the Delivery Group, and 18
the S&P Public Utilities? 19
A. The broad categories of financial data that I will discuss are shown on Schedules D7, 20
D8, and D9. The important categories of relative risk may be summarized as follows: 21
22
Size. In terms of capitalization, the Company is much smaller than the average size 23
of the Delivery Group, and very much smaller than the average size of the S&P Public 24
Utilities. All other things being equal, a smaller company is riskier than a larger 25

-13-
company because a given change in revenue and expense has a proportionately 1
greater impact on a small firm. As I will demonstrate later, the size of a firm can 2
impact its cost of equity. This is the case for MGUC and the Delivery Group. 3
4
Market Ratios. Market-based financial ratios, such as earnings/price ratios and 5
dividend yields, provide a partial measure of the investor-required cost of equity. If all 6
other factors are equal, investors will require a higher rate of return for companies that 7
exhibit greater risk, in order to compensate for that risk. That is to say, a firm that 8
investors perceive to have higher risks will experience a lower price per share in 9
relation to expected earnings.2 10
11
There are no market ratios available for the Company because Integrys owns its 12
stock. The five-year average price-earnings multiple for the Delivery Group was 13
slightly higher than that of the S&P Public Utilities. The five-year average dividend 14
yields were somewhat lower for the Delivery Group as compared to the S&P Public 15
Utilities. The average market-to-book ratios were somewhat higher for the Delivery 16
Group as compared to the S&P Public Utilities. 17
18
Common Equity Ratio. The level of financial risk is measured by the proportion of 19
long-term debt and other senior capital that is contained in a company’s capitalization. 20
Financial risk is also analyzed by comparing common equity ratios (the complement 21
of the ratio of debt and other senior capital). That is to say, a firm with a high common 22
equity ratio has lower financial risk, while a firm with a low common equity ratio has 23
2For example, two otherwise similarly situated firms each reporting $1.00 in earnings per share would have different market prices at varying levels of risk (i.e., the firm with a higher level of risk will have a lower share value, while the firm with a lower risk profile will have a higher share value).

-14-
higher financial risk. The five-year average common equity ratios, based on total 1
capital were 56.3% for MGUC, 47.6% for the Delivery Group, and 43.3% for the S&P 2
Public Utilities. 3
4
Return on Book Equity. Greater variability (i.e., uncertainty) of a firm’s earned returns 5
signifies relatively greater levels of risk, as shown by the coefficient of variation 6
(standard deviation ÷ mean) of the rate of return on book common equity. The higher 7
the coefficients of variation, the greater degree of variability. For the five-year period, 8
the coefficients of variation were 0.132 (0.7% ÷ 5.3%) for the Company, 0.050 (0.5% ÷ 9
10.1%) for the Delivery Group, and 0.104 (1.1% ÷ 10.6%) for the S&P Public Utilities. 10
The Company’s rates of return on equity were more variable than the Delivery Group 11
and the S&P Public Utilities. 12
13
Operating Ratios. I have also compared operating ratios (the percentage of revenues 14
consumed by operating expense, depreciation, and taxes other than income).3 The 15
five-year average operating ratios were 91.0% for the Company, 87.5% for the 16
Delivery Group, and 82.3% for the S&P Public Utilities. The Company had higher 17
operating ratios than the Delivery Group and S&P Public Utilities. 18
19
Coverage. The level of fixed charge coverage (i.e., the multiple by which available 20
earnings cover fixed charges, such as interest expense) provides an indication of the 21
earnings protection for creditors. Higher levels of coverage, and hence earnings 22
protection for fixed charges, are usually associated with superior grades of 23
creditworthiness. The five-year average interest coverage (excluding Allowance for 24 3The complement of the operating ratio is the operating margin which provides a measure of profitability. The higher the operating ratio, the lower the operating margin.

-15-
Funds Used During Construction (“AFUDC”)) was 2.98 times for the Company, 3.99 1
times for the Delivery Group, and 3.12 times for the S&P Public Utilities. 2
3
Quality of Earnings. Measures of earnings quality usually are revealed by the 4
percentage of AFUDC related to income available for common equity, the effective 5
income tax rate, and other cost deferrals. These measures of earnings quality usually 6
influence a firm’s internally generated funds because poor quality of earnings would 7
not generate high levels of cash flow. Quality of earnings has not been a significant 8
concern for the Company, the Delivery Group and the S&P Public Utilities. 9
10
Internally Generated Funds. Internally generated funds (“IGF”) provide an important 11
source of new investment capital for a utility and represent a key measure of credit 12
strength. Historically, the five-year average percentage of IGF to capital expenditures 13
was 96.7% for MGUC, 94.1% for the Delivery Group, and 91.1% for the S&P Public 14
Utilities. 15
16
Betas. The financial data that I have been discussing relate primarily to company-17
specific risks. Market risk for firms with publicly-traded stock is measured by beta 18
coefficients. Beta coefficients attempt to identify systematic risk, i.e., the risk 19
associated with changes in the overall market for common equities.4 Value Line 20
publishes such a statistical measure of a stock’s relative historical volatility to the rest 21 4 Beta is a relative measure of the historical sensitivity of the stock’s price to overall fluctuations in the New York Stock Exchange Composite Index. The ‘‘Beta coefficient’’ is derived from a regression analysis of the relationship between weekly percentage changes in the price of a stock and weekly percentage changes in the NYSE Index over a period of five years. The betas are adjusted for their long-term tendency to converge toward 1.00. A common stock that has a beta less than 1.0 is considered to have less systematic risk than the market as a whole and would be expected to rise and fall more slowly than the rest of the market. A stock with a beta above 1.0 would have more systematic risk.

-16-
of the market. A comparison of market risk is shown by the Value Line beta of 0.67 1
as the average for the Delivery Group (see page 2 of Schedule D8) and 0.75 as the 2
average for the S&P Public Utilities (see page 3 of Schedule D9). 3
4
Q. Please summarize your risk evaluation. 5
A. The risk of MGUC parallels that of the Delivery Group in certain respects. On some 6
counts MGUC’s risk is higher, such as its smaller size, its much higher earnings 7
variability, its higher operating ratio, and its lower interest coverage. On the other 8
hand, MGUC’s financial risk is lower as indicated by its higher common equity ratio. 9
Other measures are approximately equal, i.e., its IGF to construction and quality of 10
earnings. On balance, the Delivery Group provides a reasonable basis for measuring 11
MGUC’s cost of equity for this case, albeit a conservative measure due to MGUC’s 12
more numerous high risk factors. 13
14
DISCOUNTED CASH FLOW 15 Q. Please describe your use of the Discounted Cash Flow approach to determine 16
the cost of equity. 17
A. The DCF model seeks to explain the value of an asset as the present value of future 18
expected cash flows discounted at the appropriate risk-adjusted rate of return. In its 19
simplest form, the DCF return on common stock consists of a current cash (dividend) 20
yield and future price appreciation (growth) of the investment. The dividend discount 21
equation is the familiar DCF valuation model and assumes future dividends are 22
systematically related to one another by a constant growth rate. The DCF formula is 23
derived from the standard valuation model: P = D/(k-g), where P = price, D = 24
dividend, k = the cost of equity, and g = growth in cash flows. By rearranging the 25
terms, we obtain the familiar DCF equation: k= D/P + g. All of the terms in the DCF 26

-17-
equation represent investors’ assessment of expected future cash flows that they will 1
receive in relation to the value that they set for a share of stock (P). The DCF 2
equation is sometimes referred to as the "Gordon" model.5 My DCF results are 3
provided on Schedule D6 for the Delivery Group. The DCF return is 9.63%. 4
5
Among other limitations of the model, there is a certain element of circularity in the 6
DCF method when applied in rate cases. This is because investors’ expectations for 7
the future depend upon regulatory decisions. In turn, when regulators depend upon 8
the DCF model to set the cost of equity, they rely upon investor expectations that 9
include an assessment of how regulators will decide rate cases. Due to this 10
circularity, the DCF model may not fully reflect the true risk of a utility. 11
12
Q. Please explain the dividend yield component of a DCF analysis. 13
A. The DCF methodology requires the use of an expected dividend yield to establish the 14
investor-required cost of equity. The monthly dividend yields for the twelve months 15
ended December 2012 are shown on Schedule D10 and capture an adjustment to the 16
month-end prices to reflect the buildup of the dividend in the price that has occurred 17
since the last ex-dividend date (i.e., the date by which a shareholder must own the 18
shares to be entitled to the dividend payment – usually about two to three weeks prior 19
to the actual payment). 20
21
For the twelve months ended December 2012, the average dividend yield was 4.02% 22
for the Delivery Group based upon a calculation using annualized dividend payments 23
5Although the popular application of the DCF model is often attributed to the work of Myron J. Gordon in the mid-1950’s, J. B. Williams exposited the DCF model in its present form nearly two decades earlier.

-18-
and adjusted month-end stock prices. The dividend yields for the more recent six- 1
and three-month periods were 4.02% and 4.09%, respectively. I have used, for the 2
purpose of the DCF model, the six-month average dividend yield of 4.02% for the 3
Delivery Group. The use of this dividend yield will reflect current capital costs, while 4
avoiding spot yields. For the purpose of a DCF calculation, the average dividend yield 5
must be adjusted to reflect the prospective nature of the dividend payments, i.e., the 6
higher expected dividends for the future. Recall that the DCF is an expectational 7
model that must reflect investor anticipated cash flows for the Delivery Group. I have 8
adjusted the six-month average dividend yield in three different, but generally 9
accepted, manners and used the average of the three adjusted values as calculated 10
in the lower panel of data presented on Schedule D10. That adjusted dividend yield is 11
4.13% for the Delivery Group. 12
13
Q. Please explain the underlying factors that influence investor’s growth 14
expectations. 15
A. As noted previously, investors are interested principally in the future growth of their 16
investment (i.e., the price per share of the stock). Future earnings per share growth 17
represent the DCF model’s primary focus because under the constant price-earnings 18
multiple assumption of the model, the price per share of stock will grow at the same 19
rate as earnings per share. In conducting a growth rate analysis, a wide variety of 20
variables can be considered when reaching a consensus of prospective growth, 21
including: earnings, dividends, book value, and cash flow stated on a per share basis. 22
Historical values for these variables can be considered, as well as analysts’ forecasts 23
that are widely available to investors. A fundamental growth rate analysis is 24
sometimes represented by the internal growth (“b x r”), where “r” represents the 25

-19-
expected rate of return on common equity and “b” is the retention rate that consists of 1
the fraction of earnings that are not paid out as dividends. To be complete, the 2
internal growth rate should be modified to account for sales of new common stock -- 3
this is called external growth (“s x v”), where “s” represents the new common shares 4
expected to be issued by a firm and “v” represents the value that accrues to existing 5
shareholders from selling stock at a price different from book value. Fundamental 6
growth, which combines internal and external growth, provides an explanation of the 7
factors that cause book value per share to grow over time. 8
9
Growth also can be expressed in multiple stages. This expression of growth consists 10
of an initial “growth” stage where a firm enjoys rapidly expanding markets, high profit 11
margins, and abnormally high growth in earnings per share. Thereafter, a firm enters 12
a “transition” stage where fewer technological advances and increased product 13
saturation begin to reduce the growth rate and profit margins come under pressure. 14
During the “transition” phase, investment opportunities begin to mature, capital 15
requirements decline, and a firm begins to pay out a larger percentage of earnings to 16
shareholders. Finally, the mature or “steady-state” stage is reached when a firm’s 17
earnings growth, payout ratio, and return on equity stabilizes at levels where they 18
remain for the life of a firm. The three stages of growth assume a step-down of high 19
initial growth to lower sustainable growth. Even if these three stages of growth can be 20
envisioned for a firm, the third “steady-state” growth stage, which is assumed to 21
remain fixed in perpetuity, represents an unrealistic expectation because the three 22
stages of growth can be repeated. That is to say, the stages can be repeated where 23
growth for a firm ramps-up and ramps-down in cycles over time. 24
25

-20-
Q. What investor-expected growth rate is appropriate in a DCF calculation? 1
A. Investors consider both company-specific variables and overall market sentiment (i.e., 2
level of inflation rates, interest rates, economic conditions, etc.) when balancing their 3
capital gains expectations with their dividend yield requirements. I follow an approach 4
that is not rigidly formatted because investors are not influenced by a single set of 5
company-specific variables weighted in a formulaic manner. Therefore, in my opinion, 6
all relevant growth rate indicators using a variety of techniques must be evaluated 7
when formulating a judgment of investor-expected growth. 8
9
Q. What data for the proxy group have you considered in your growth rate 10
analysis? 11
A. I have considered the growth in the financial variables shown on Schedules D11 and 12
D12. The historical growth rates were taken from the Value Line publication that 13
provides these data. As shown on Schedule D11, the historical growth of earnings 14
per share was in the range of 4.33% to 5.35% for the Delivery Group. 15
16
Schedule D12 provides projected earnings per share growth rates taken from 17
analysts’ forecasts compiled by IBES/First Call, Zacks, Morningstar, and Value Line. 18
IBES/First Call, Zacks, and Morningstar represent reliable authorities of projected 19
growth upon which investors rely. The IBES/First Call and Zacks growth rates are 20
consensus forecasts taken from a survey of analysts that make projections of growth 21
for these companies. The IBES/First Call, Zacks, and Morningstar estimates are 22
obtained from the Internet and are widely available to investors. First Call probably is 23
quoted most frequently in the financial press when reporting on earnings forecasts. 24
The Value Line forecasts also are widely available to investors and can be obtained 25

-21-
by subscription or free-of-charge at most public and collegiate libraries. The 1
IBES/First Call, Zacks, and Morningstar forecasts are limited to earnings per share 2
growth, while Value Line makes projections of other financial variables. The Value 3
Line forecasts of dividends per share, book value per share, and cash flow per share 4
have also been included on Schedule D12 for the Delivery Group. 5
6
Q. What specific evidence have you considered in the DCF growth analysis? 7
A. As to the five-year forecast growth rates, Schedule D12 indicates that the projected 8
earnings per share growth rates for the Delivery Group are 4.69% by IBES/First Call, 9
4.65% by Zacks, 4.97% by Morningstar, and 5.19% by Value Line. The Value Line 10
projections indicate that earnings per share for the Delivery Group will grow 11
prospectively at a more rapid rate (i.e., 5.19%) than the dividends per share (i.e., 12
3.79%), which translates into a declining dividend payout ratio for the future. As noted 13
earlier, with the constant price-earnings multiple assumption of the DCF model, 14
growth for these companies will occur at the higher earnings per share growth rate, 15
thus producing the capital gains yield expected by investors. 16
17
Q. What conclusion have you drawn from these data regarding the applicable 18
growth rate to be used in the DCF model? 19
A. A variety of factors should be examined to reach a conclusion on the DCF growth 20
rate. However, certain growth rate variables should be emphasized when reaching a 21
conclusion on an appropriate growth rate. First, historical and projected earnings per 22
share, dividends per share, book value per share, cash flow per share, and retention 23
growth represent indicators that could be used to provide an assessment of investor 24
growth expectations for a firm. However, although history cannot be ignored, it 25

-22-
cannot receive primary emphasis. This is because an analyst, when developing a 1
forecast of future earnings growth, would first apprise himself/herself of the historical 2
performance of a company. Hence, there is no need to count historical growth rates 3
separately, because historical performance already is reflected in analysts’ forecasts. 4
Second, from the various alternative measures of growth identified above, earnings 5
per share should receive greatest emphasis. Earnings per share growth is the 6
primary determinant of investors’ expectations regarding their total returns in the stock 7
market. This is because the capital gains yield (i.e., price appreciation) will track 8
earnings growth with a constant price earnings multiple (a key assumption of the DCF 9
model). Moreover, earnings per share (derived from net income) are the source of 10
dividend payments, and are the primary driver of retention growth and its surrogate, 11
i.e., book value per share growth. As such, under these circumstances, greater 12
emphasis must be placed upon projected earnings per share growth. In this regard, it 13
is worthwhile to note that Professor Myron Gordon, the foremost proponent of the 14
DCF model in rate cases, concluded that the best measure of growth in the DCF 15
model is a forecast of earnings per share growth.6 Hence, to follow Professor 16
Gordon’s findings, projections of earnings per share growth, such as those published 17
by IBES/First Call, Zacks, Morningstar, and Value Line, represent a reasonable 18
assessment of investor expectations. 19
20
The forecasts of earnings per share growth, as shown on Schedule D12, provide a 21
range of average growth rates of 4.65% to 5.19%. Although the DCF growth rates 22
cannot be established solely with a mathematical formulation, it is my opinion that an 23
investor-expected growth rate of 5.00% is within the array of earnings per share 24 6Gordon, Gordon & Gould ,“Choice Among Methods of Estimating Share Yield,” The Journal of Portfolio Management (Spring 1989).

-23-
growth rates shown by the analysts’ forecasts. While the growth rate that I 1
determined for the DCF analysis is higher than the midpoint of the range noted above, 2
it is reflective of growth that is associated with improving business conditions. The 3
stellar performance of the stock market in 2013 points to an improving economy, as it 4
is one of the leading economic indicators compiled by The Conference Board.7 In 5
fact, the Leading Economic Index, whose financial components include the stock 6
market, has increased in five of the last six months. In addition, “the strengths among 7
the leading indicators have become more widespread in recent months,” said The 8
Conference Board. 9
10
Q. Are the dividend yield and growth components of the DCF adequate to explain 11
the rate of return on common equity when it is used in the calculation of the 12
weighted average cost of capital? 13
A. Only if the capital structure ratios are measured with the market value of debt and 14
equity. In the case of the Delivery Group, those average capital structure ratios are 15
39.03% long-term debt, 0.20% preferred stock, and 60.77% common equity, as 16
shown on Schedule D13. If book values are used to compute the capital structure 17
ratios, then an adjustment is required. 18
19
Q. Please explain why. 20
A. If regulators use the results of the DCF (which are based on the market price of the 21
stock of the companies analyzed) to compute the weighted average cost of capital 22
based on a book value capital structure used for ratesetting purposes, the utility will 23
7 The Conference Board U.S. Business Cycle Indicators -The Conference Board Leading Economic Index (LEI) for the U.S. and Related Composite Economic Indexes for February 2013 [Press Release]. Retrieved from http://www.conference-board.org/data/bci.cfm dated March 21, 2013

-24-
not, by definition, recover its risk-adjusted capital cost. This is because market 1
valuations of equity are based on market value capital structures, which in general 2
have more equity and less debt and therefore reflect less risk than book value capital 3
structures (see Schedule D13 for the comparison). The utility’s risk-adjusted cost of 4
equity will necessarily be lower with the less risky market value capital structure than 5
with the book value capital structure. The difference represents that portion of the 6
utility’s cost of equity that it will not recover unless either the market value cost of 7
equity is applied to the utility’s market value capital structure or it is adjusted to reflect 8
the higher risk associated with the book value capital structure. By the same token, if 9
the utility’s market value capital structure is less than its book value structure, then the 10
utility’s market cost of equity should be adjusted downward to reflect the lower risk 11
associated with the book value capital structure, or else the utility will over-recover its 12
total cost of equity. 13
14
This shortcoming of the DCF has persuaded the Pennsylvania Public Utility 15
Commission to adjust the DCF determined cost of equity upward to make the return 16
consistent with the book value capital structure. Specific adjustments to recognize 17
this risk difference were made in the following cases: 18
• January 10, 2002 for Pennsylvania-American Water Company in Docket No. R-19 00016339 -- 60 basis points adjustment. 20
21 • August 1, 2002 for Philadelphia Suburban Water Company in Docket No. R-22
00016750 -- 80 basis points adjustment. 23 24 • January 29, 2004 for Pennsylvania-American Water Company in Docket No. 25
R-00038304 (affirmed by the Commonwealth Court on November 8, 2004) -- 60 26 basis points adjustment. 27
28 • August 5, 2004 for Aqua Pennsylvania, Inc. in Docket No. R-00038805 -- 60 29
basis points adjustment. 30 31 • December 22, 2004 for PPL Electric Utilities Corporation in Docket No. R-32

-25-
00049255 -- 45 basis points adjustment. 1 2 • February 8, 2007 for PPL Gas Utilities Corporation in Docket No. R-00061398 -- 3
70 basis points adjustment. 4 5
In order to make the DCF results relevant to the capitalization measured at book 6
value (as is done for rate setting purposes), the market-derived cost rate cannot be 7
used without modification. 8
9
Q. Is your leverage adjustment dependent upon the market valuation or book 10
valuation from an investor’s perspective? 11
A. The only perspective that is important to investors is the return that they can realize 12
on the market value of their investment. As I have measured the DCF, the simple 13
yield (D/P) plus growth (g) provides a return applicable strictly to the price (P) that an 14
investor is willing to pay for a share of stock. The need for the leverage adjustment 15
arises when the results of the DCF model (k) are to be applied to a capital structure 16
that is different than indicated by the market price (P). From the market perspective, 17
the financial risk of the Delivery Group is accurately measured by the capital structure 18
ratios calculated from the market capitalization of a firm. If the ratesetting process 19
utilized the market capitalization ratios, then no additional analysis or adjustment 20
would be required, and the simple yield (D/P) plus growth (g) components of the DCF 21
would satisfy the financial risk associated with the market value of the equity 22
capitalization. Because the ratesetting process uses a different set of ratios 23
calculated from the book value capitalization, then further analysis is required to 24
synchronize the financial risk of the book capitalization with the required return on the 25
book value of the equity. This adjustment is developed through precise mathematical 26
calculations, using well recognized analytical procedures that are widely accepted in 27
the financial literature. To arrive at that return, the rate of return on common equity is 28

-26-
the unleveraged cost of capital (or equity return at 100% equity) plus one or more 1
terms reflecting the increase in financial risk resulting from the use of leverage in the 2
capital structure. The calculations presented in the lower panel of data shown on 3
Schedule D13, under the heading “M&M,” provides a return of 7.59% when applicable 4
to a capital structure with 100% common equity. 5
6
Q. How is the DCF-determined cost of equity adjusted for the financial risk 7
associated with the book value of the capitalization? 8
A. In pioneering work, Nobel laureates Modigliani and Miller developed several theories 9
about the role of leverage in a firm's capital structure. As part of that work, Modigliani 10
and Miller established that, as the borrowing of a firm increases, the expected return 11
on stockholders' equity also increases. This principle is incorporated into my leverage 12
adjustment, which recognizes that the expected return on equity increases to reflect 13
the increased risk associated with the higher financial leverage shown by the book 14
value capital structure, as compared to the market value capital structure that 15
contains lower financial risk. Modigliani and Miller proposed several approaches to 16
quantify the equity return associated with various degrees of debt leverage in a firm's 17
capital structure. These formulas point toward an increase in the equity return 18
associated with the higher financial risk of the book value capital structure. Simply 19
stated, the leverage adjustment contains no factor for a particular market-to-book 20
ratio. It merely expresses the cost of equity as the unleveraged return plus 21
compensation for the additional risk of introducing debt and/or preferred stock into the 22
capital structure. There can be no dispute that a firm’s financial risk varies with the 23
relative amount of leverage contained in its capital structure. 24
25

-27-
Q. Is the leverage adjustment that you propose designed to transform the market 1
return into one that is designed to produce a particular market-to-book ratio? 2
A. No, it is not. The adjustment that I label as a “leverage adjustment” is merely a 3
convenient way of showing the amount that must be added to (or subtracted from) the 4
result of the simple DCF model (i.e., D/P + g), in the context of a return that applies to 5
the capital structure used in ratemaking, which is computed with book value weights 6
rather than market value weights, in order to arrive at the utility’s total cost of equity. I 7
specify a separate factor, which I call the leverage adjustment, but there is no need to 8
do so other than providing identification for this factor. If I expressed my return solely 9
in the context of the book value weights that we use to calculate the weighted average 10
cost of capital, and ignore the familiar D/P + g expression entirely, then there would 11
be no separate element to reflect the financial leverage change from market value to 12
book value capitalization. As shown in the bottom panel of data on Schedule D13, the 13
equity return applicable to the book value common equity ratio is equal to 7.59%, 14
which is the return for the Delivery Group applicable to its equity with no debt in its 15
capital structure (i.e., the cost of capital is equal to the cost of equity with a 100% 16
equity ratio) plus 2.03% compensation for having a 46.60% debt ratio, plus 0.01% for 17
having a 0.29% preferred stock ratio. The sum of the parts is 9.63% (7.59% + 2.03% 18
+ 0.01%) and there is no need to even address the cost of equity in terms of D/P + g. 19
To express this same return in the context of the familiar DCF model, I summed the 20
4.13% dividend yield, the 5.00% growth rate, and the 0.50% for the leverage 21
adjustment in order to arrive at the same 9.63% (4.13% + 5.00% + 0.50%) return. I 22
know of no means to mathematically solve for the 0.50% leverage adjustment by 23
expressing it in the terms of any particular relationship of market price to book value. 24
The 0.50% adjustment is merely a convenient way to compare the 9.63% return 25

-28-
computed directly with the Modigliani & Miller formulas to the 9.13% return generated 1
by the DCF model based on a market value capital structure. My point is that when 2
we use a market-determined cost of equity developed from the DCF model, it reflects 3
a level of financial risk that is different (in this case, lower) from the capital structure 4
stated at book value. This process has nothing to do with targeting any particular 5
market-to-book ratio. Each of the calculations that I describe above apply to the 6
market returns associated with the holding companies from which the DCF is derived. 7
It is well understood that the leverage employed by the utility subsidiaries of those 8
holding companies is reflective of the risks associated with the utility business. 9
10
RISK PREMIUM ANALYSIS 11 Q. Please describe your use of the risk premium approach to determine the cost of 12
equity. 13
A. With the Risk Premium approach, the cost of equity capital is determined by corporate 14
bond yields plus a premium to account for the fact that common equity is exposed to 15
greater investment risk than debt capital. The result of my Risk Premium study is 16
shown on Schedule D6. That result is 12.00%. As with other models used to 17
determine the cost of equity, the Risk Premium approach has its limitations, including 18
potential imprecision in the assessment of the future cost of corporate debt and the 19
measurement of the risk-adjusted common equity premium. 20
21
Q. What long-term public utility debt cost rate did you use in your risk premium 22
analysis? 23
A. In my opinion, a 5.00% yield represents a reasonable estimate of the prospective 24
yield on long-term A-rated public utility bonds. 25
26

-29-
Q. What forecasts of interest rates have you considered in your analysis? 1
A. I have determined the prospective yield on A-rated public utility debt by using the Blue 2
Chip Financial Forecasts (“Blue Chip”) along with the spread in the yields that I 3
describe below. The Blue Chip is a reliable authority and contains consensus 4
forecasts of a variety of interest rates compiled from a panel of banking, brokerage, 5
and investment advisory services. In early 1999, Blue Chip stopped publishing 6
forecasts of yields on A-rated public utility bonds because the Federal Reserve 7
deleted these yields from its Statistical Release H.15. To independently project a 8
forecast of the yields on A-rated public utility bonds, I have combined the forecast 9
yields on long-term Treasury bonds published on January 1, 2013, and a yield spread 10
of 1.50%, derived from historical data. 11
12
Q. What historical data have you analyzed? 13
A. I have analyzed the historical yields on the Moody’s index of long-term public utility 14
debt as shown on page 1 of Schedule D14. For the twelve months ended December 15
2012, the average monthly yield on Moody’s index of A-rated public utility bonds was 16
4.13%. For the six and three-month periods ended December 2012, the yields were 17
3.95% and 3.92%, respectively. During the twelve-months ended December 2012, 18
the range of the yields on A-rated public utility bonds was 3.84% to 4.48%. Page 2 of 19
Schedule D14 shows the long-run spread in yields between A-rated public utility 20
bonds and long-term Treasury bonds. As shown on page 3 of Schedule D14, the 21
yields on A-rated public utility bonds have exceeded those on Treasury bonds by 22
1.59% on a twelve-month average basis, 1.54% on a six-month average basis, and 23
1.46% on a the three-month average basis. From these averages, 1.50% represents 24
a reasonable spread for the yield on A-rated public utility bonds over Treasury bonds. 25

-30-
1
Q. How have you used these data to project the yield on A-rated public utility 2
bonds for the purpose of your Risk Premium analyses? 3
A. Shown below is my calculation of the prospective yield on A-rated public utility bonds 4
using the building blocks discussed above, i.e., the Blue Chip forecast of Treasury 5
bond yields and the public utility bond yield spread. For comparative purposes, I also 6
have shown the Blue Chip forecasts of Aaa-rated and Baa-rated corporate bonds. 7
These forecasts are: 8
30-YearYear Quarter Aaa-rated Baa-rated Treasury Spread Yield2013 First 3.7% 4.8% 2.9% 1.50% 4.40%2013 Second 3.8% 4.9% 3.0% 1.50% 4.50%2013 Third 3.9% 4.9% 3.1% 1.50% 4.60%2013 Fourth 3.9% 5.0% 3.2% 1.50% 4.70%2014 First 4.0% 5.1% 3.3% 1.50% 4.80%2014 Second 4.1% 5.2% 3.4% 1.50% 4.90%
CorporateBlue Chip Financial Forecasts
A-rated Public Utility
Q. Are there additional forecasts of interest rates that extend beyond those shown 9
above? 10
A. Yes. Twice yearly, Blue Chip provides long-term forecasts of interest rates. In its 11
December 1, 2012 publication, Blue Chip published longer-term forecasts of interest 12
rates, which were reported to be: 13
30-YearAverages Treasury Aaa-rated Baa-rated2014-18 4.7% 5.4% 6.4%2019-23 5.5% 6.1% 7.1%
CorporateBlue Chip Financial Forecasts
Given these forecasted interest rates, a 5.00% yield on A-rated public utility bonds 14
represents a reasonable expectation. 15

-31-
1
Q. What equity risk premium have you determined for this case? 2
A. To develop an appropriate equity risk premium, I analyzed the results from the 2013 3
Classic Yearbook for Stocks, Bonds, Bills and Inflation (“SBBI”) published by Ibbotson 4
Associates that is part of Morningstar. My investigation reveals that the equity risk 5
premium varies according to the level of interest rates. That is to say, the equity risk 6
premium increases as interest rates decline and it declines as interest rates increase. 7
This inverse relationship is revealed by the summary data presented below and 8
shown on page 1 of Schedule D15. 9
Low Interest Rates 7.00%
Average Across All Interest Rates 5.41%
High Interest Rates 3.77%
Common Equity Risk Premiums
10
11
Based on my analysis of the historical data, the equity risk premium was 7.00% when 12
the marginal cost of long-term government bonds was low (i.e., 3.03%, which was the 13
average yield during periods of low rates). Conversely, when the yield on long-term 14
government bonds was high (i.e., 7.35% on average during periods of high interest 15
rates) the spread narrowed to 3.77%. Over the entire spectrum of interest rates, the 16
equity risk premium was 5.41% when the average government bond yield was 5.16%. 17
With the current low interest rates, an equity risk premium of 7.00% is indicated today. 18
19
CAPITAL ASSET PRICING MODEL 20 Q. What are the features of the CAPM as you have used it? 21
A. The CAPM uses the yield on a risk-free interest bearing obligation plus a rate of return 22

-32-
premium that is proportional to the systematic risk of an investment. The result of the 1
CAPM is 11.01% as shown on Schedule D6. To compute the cost of equity with the 2
CAPM, three components are necessary: a risk-free rate of return (“Rf”), the beta 3
measure of systematic risk (“β”), and the market risk premium (“Rm-Rf”) derived from 4
the total return on the market of equities reduced by the risk-free rate of return. The 5
CAPM specifically accounts for differences in systematic risk (i.e., market risk as 6
measured by the beta) between an individual firm or group of firms and the entire 7
market of equities. 8
9
Q. What betas have you considered in the CAPM? 10
A. For my CAPM analysis, I initially considered the Value Line betas. As shown on 11
Schedule D13, the average beta is 0.67 for the Delivery Group. 12
13
Q. What betas have you used in the CAPM determined cost of equity? 14
A. The betas must be reflective of the financial risk associated with the ratesetting capital 15
structure that is measured at book value. Therefore, Value Line betas cannot be used 16
directly in the CAPM, unless the cost rate developed using those betas is applied to a 17
capital structure measured with market values. To develop a CAPM cost rate 18
applicable to a book-value capital structure, the Value Line (market value) betas have 19
been unleveraged and releveraged for the book value common equity ratios using the 20
Hamada formula,8 as follows: 21
βl = βu [1 + (1 - t) D/E + P/E] 22
where ßl = the leveraged beta, ßu = the unleveraged beta, t = income tax rate, D = 23
8Robert S. Hamada, “The Effects of the Firm’s Capital Structure on the Systematic Risk of Common Stocks” The Journal of Finance Vol. 27, No. 2, Papers and Proceedings of the Thirtieth Annual Meeting of the American Finance Association, New Orleans, Louisiana, December 27-29, 1971. (May 1972), pp.435-452

-33-
debt ratio, P = preferred stock ratio, and E = common equity ratio. The betas 1
published by Value Line have been calculated with the market price of stock and, 2
therefore, are related to the market value capitalization. By using the formula shown 3
above and the capital structure ratios measured at market value, the beta would 4
become 0.47 for the Delivery Group if it employed no leverage and was 100% equity 5
financed. Those calculations are shown on Schedule D13 under the category 6
“Hamada” who is credited with developing those formulas. With the unleveraged beta 7
as a base, I calculated the leveraged beta of 0.73 for the book value capital structure 8
of the Delivery Group. The book value leveraged beta that I will employ in the CAPM 9
cost of equity is 0.73 for the Delivery Group. 10
11
Q. What risk-free rate have you used in the CAPM? 12
A. As shown on page 1 of Schedule D16, I provided the historical yields on Treasury 13
notes and bonds. For the twelve months ended December 2012, the average yield on 14
30-year Treasury bonds was 2.92%. For the six- and three-months ended December 15
2012, the yields on 30-year Treasury bonds were 2.80% and 2.86%, respectively. 16
During the twelve-months ended December 2012, the range of the yields on 30-year 17
Treasury bonds was 2.59% to 3.28%. The recent low yields on Treasury bonds can 18
be traced to events that have occurred during the past several years that included the 19
financial crisis and its aftermath. The resulting decline in the yields on Treasury 20
obligations can be attributed to a number of factors, including: the sovereign debt 21
crisis in the euro zone, concern over a possible double dip recession, the potential for 22
deflation, and the Federal Reserve’s large balance sheet that has been expanded 23
through the purchase of Treasury obligations and mortgage-backed securities (also 24
known as QEI, QEII, and QEIII), and the reinvestment of the proceeds from maturing 25

-34-
obligations and the lengthening of the maturity of the Fed’s bond portfolio through the 1
sale of short-term Treasuries and the purchase of long-term Treasury obligations 2
(also known as “operation twist”). Essentially, low interest rates are the product of the 3
policy of the FOMC in its attempt to deal with stagnant job growth, which is part of its 4
dual mandate. As shown on page 2 of Schedule D16, forecasts published by Blue 5
Chip on February 1, 2013 indicate that the yields on long-term Treasury bonds are 6
expected to be in the range of 2.9% to 3.4% during the next six quarters. The longer 7
term forecasts described previously show that the yields on 30-year Treasury bonds 8
will average 4.7% from 2014 through 2018 and 5.5% from 2019 to 2023. For the 9
reasons explained previously, forecasts of interest rates should be emphasized at this 10
time in selecting the risk-free rate of return in CAPM. Hence, I have used a 3.50% 11
risk-free rate of return for CAPM purposes, which considers not only the Blue Chip 12
forecasts, but also the recent trend in the yields on long-term Treasury bonds. 13
14
Q. What market premium have you used in the CAPM? 15
A. As shown in the lower panel of data presented on page 2 of Schedule D16, the 16
market premium is derived from historical data and the Value Line and S&P 500 17
returns. For the historically based market premium, I have used the arithmetic mean 18
obtained from the data presented on page 1 of Schedule D15. On that schedule, the 19
market return on large stocks during periods of low interest rates was 11.72%. During 20
that time, the yield on long-term government bonds was 3.03%. The resulting market 21
premium is 8.69% (11.72% - 3.03%) based on historical data. For the forecast 22
returns, I calculated a 12.87% total market return from the Value Line data and a DCF 23
return of 11.76% for the S&P 500. With the average forecast return of 12.32% 24
(12.87% + 11.76% = 24.63% ÷ 2), I calculated a market premium of 8.82% (12.32% - 25

-35-
3.50%) using forecast data. The market premium applicable to the CAPM derived 1
from these sources equals 8.76% (8.82% + 8.69% = 17.51% ÷ 2). 2
3
Q. Are there adjustments to the CAPM that are necessary to fully reflect the rate of 4
return on common equity? 5
A. Yes. The technical literature supports an adjustment relating to the size of the 6
company or portfolio for which the calculation is performed. As the size of a firm 7
decreases, its risk and, hence, its required return increases. Moreover, in his 8
discussion of the cost of capital, Professor Brigham has indicated that smaller firms 9
have higher capital costs than otherwise similar larger firms (see Fundamentals of 10
Financial Management, fifth edition, page 623). Also, the Fama/French study (see 11
"The Cross-Section of Expected Stock Returns"; The Journal of Finance, June 1992) 12
established that the size of a firm helps explain stock returns. In an October 15, 1995 13
article in Public Utility Fortnightly, entitled “Equity and the Small-Stock Effect,” it was 14
demonstrated that the CAPM could understate the cost of equity significantly 15
according to a company’s size. Indeed, it was demonstrated in the SBBI Yearbook 16
that the returns for stocks in lower deciles (i.e., smaller stocks) had returns in excess 17
of those shown by the simple CAPM. In this regard, the Delivery Group has a market-18
based average equity capitalization of $4,106 million, as shown on Schedule D13. 19
For my CAPM analysis, I have adopted the mid-cap adjustment of 1.12%, as revealed 20
on page 3 of Schedule D16. 21
22
COMPARABLE EARNINGS 23 Q. How have you applied the Comparable Earnings approach in this case? 24
A. The Comparable Earnings approach determines the equity return based upon results 25
from non-regulated companies. It is the oldest of all rate of return methods, having 26

-36-
been around for about one-century. Because regulation is a substitute for 1
competitively determined prices, the returns realized by non-regulated firms with 2
comparable risks to a public utility provide useful insight into a fair rate of return. In 3
order to identify the appropriate return, it is necessary to analyze returns earned (or 4
realized) by other firms within the context of the Comparable Earnings standard. The 5
firms selected for the Comparable Earnings approach should be companies whose 6
prices are not subject to cost-based price ceilings (i.e., non-regulated firms) so that 7
circularity is avoided. 8
9
There are two avenues available to implement the Comparable Earnings approach. 10
One method involves the selection of another industry (or industries) with comparable 11
risks to the public utility in question, and the results for all companies within that 12
industry serve as a benchmark. The second approach requires the selection of 13
parameters that represent similar risk traits for the public utility and the comparable 14
risk companies. Using this approach, the business lines of the comparable 15
companies become unimportant. The latter approach is preferable with the further 16
qualification that the comparable risk companies exclude regulated firms in order to 17
avoid the circular reasoning implicit in the use of the achieved earnings/book ratios of 18
other regulated firms. The United States Supreme Court has held that: 19
A public utility is entitled to such rates as will permit it to earn a 20 return on the value of the property which it employs for the 21 convenience of the public equal to that generally being made 22 at the same time and in the same general part of the country 23 on investments in other business undertakings which are 24 attended by corresponding risks and uncertainties…. The 25 return should be reasonably sufficient to assure confidence in 26 the financial soundness of the utility and should be adequate, 27 under efficient and economical management, to maintain and 28 support its credit and enable it to raise the money necessary 29 for the proper discharge of its public duties. Bluefield Water 30 Works vs. Public Service Commission, 262 U.S. 668 (1923). 31

-37-
1
Therefore, it is important to identify the returns earned by firms that compete for 2
capital with a public utility. This can be accomplished by analyzing the returns of non-3
regulated firms that are subject to the competitive forces of the marketplace. 4
5
Q. How have you implemented the Comparable Earnings approach? 6
A. In order to implement the Comparable Earnings approach, non-regulated companies 7
were selected from The Value Line Investment Survey for Windows that have six 8
categories of comparability designed to reflect the risk of the Delivery Group. These 9
screening criteria were based upon the range as defined by the rankings of the 10
companies in the Delivery Group. The items considered were: Timeliness Rank, 11
Safety Rank, Financial Strength, Price Stability, Value Line betas, and Technical 12
Rank. The identities of the companies comprising the Comparable Earnings group 13
and their associated rankings within the ranges are identified on page 1 of Schedule 14
D17. 15
16
Value Line data was relied upon because it provides a comprehensive basis for 17
evaluating the risks of the comparable firms. As to the returns calculated by Value 18
Line for these companies, there is some downward bias in the figures shown on page 19
2 of Schedule D17, because Value Line computes the returns on year-end rather than 20
average book value. If average book values had been employed, the rates of return 21
would have been slightly higher. Nevertheless, these are the returns considered by 22
investors when taking positions in these stocks. Because many of the comparability 23
factors, as well as the published returns, are used by investors in selecting stocks, 24
and the fact that investors rely on the Value Line service to gauge returns, it is, 25

-38-
therefore, an appropriate database for measuring comparable return opportunities. 1
2
Q. What data have you used in your Comparable Earnings analysis? 3
A. I have used both historical realized returns and forecasted returns for non-utility 4
companies. As noted previously, I have not used returns for utility companies in order 5
to avoid the circularity that arises from using regulatory-influenced returns to 6
determine a regulated return. It is appropriate to consider a relatively long 7
measurement period in the Comparable Earnings approach in order to cover 8
conditions over an entire business cycle. A ten-year period (five historical years and 9
five projected years) is sufficient to cover an average business cycle. Unlike the DCF 10
and CAPM, the results of the Comparable Earnings method can be applied directly to 11
the book value capitalization. In other words, the Comparable Earnings approach 12
does not contain the potential misspecification contained in market models when the 13
market capitalization and book value capitalization diverge significantly. The historical 14
rate of return on book common equity was 12.4% using only the returns that were less 15
than 20% as shown on page 2 of Schedule D17. The forecast rates of return as 16
published by Value Line are shown by the 13.3% also using values less than 20%, as 17
provided on page 2 of Schedule D17. Using these data my Comparable Earnings 18
result is 12.85%, as shown on Schedule D6. 19
20
CONCLUSION ON COST OF EQUITY 21 Q. What is your conclusion regarding the Company’s cost of common equity? 22
A. Based upon the application of a variety of methods and models described previously, 23
it is my opinion that a reasonable cost of common equity for the Company is 10.75%. 24
My cost of equity recommendation is obtained from a range of results and should be 25
considered in the context of the Company’s risk characteristics, as well as the general 26

-39-
condition of the capital markets. It is essential that the Commission employ a variety 1
of techniques to measure the Company’s cost of equity because of the 2
limitations/infirmities that are inherent in each method. 3
4
Q. Does this complete your pre-filed direct testimony? 5
A. Yes. However, I reserve the right to supplement my testimony, if necessary, and to 6
respond to witnesses presented by other parties. 7

APPENDIX A TO DIRECT TESTIMONY OF PAUL R. MOUL
A-1
EDUCATIONAL BACKGROUND, BUSINESS EXPERIENCE 1 AND QUALIFICATIONS 2 I was awarded a degree of Bachelor of Science in Business Administration by 3
Drexel University in 1971. While at Drexel, I participated in the Cooperative Education 4
Program which included employment, for one year, with American Water Works Service 5
Company, Inc., as an internal auditor, where I was involved in the audits of several 6
operating water companies of the American Water Works System and participated in the 7
preparation of annual reports to regulatory agencies and assisted in other general 8
accounting matters. 9
Upon graduation from Drexel University, I was employed by American Water Works 10
Service Company, Inc., in the Eastern Regional Treasury Department where my duties 11
included preparation of rate case exhibits for submission to regulatory agencies, as well as 12
responsibility for various treasury functions of the thirteen New England operating 13
subsidiaries. 14
In 1973, I joined the Municipal Financial Services Department of Betz Environmental 15
Engineers, a consulting engineering firm, where I specialized in financial studies for 16
municipal water and wastewater systems. 17
In 1974, I joined Associated Utility Services, Inc., now known as AUS Consultants. I 18
held various positions with the Utility Services Group of AUS Consultants, concluding my 19
employment there as a Senior Vice President. 20
In 1994, I formed P. Moul & Associates, an independent financial and regulatory 21
consulting firm. In my capacity as Managing Consultant and for the past twenty-nine years, 22
I have continuously studied the rate of return requirements for cost of service-regulated 23
firms. In this regard, I have supervised the preparation of rate of return studies, which were 24
employed, in connection with my testimony and in the past for other individuals. I have 25

APPENDIX A TO DIRECT TESTIMONY OF PAUL R. MOUL
A-2
presented direct testimony on the subject of fair rate of return, evaluated rate of return 1
testimony of other witnesses, and presented rebuttal testimony. 2
My studies and prepared direct testimony have been presented before thirty-seven 3
(37) federal, state and municipal regulatory commissions, consisting of: the Federal Energy 4
Regulatory Commission; state public utility commissions in Alabama, Alaska, California, 5
Colorado, Connecticut, Delaware, Florida, Georgia, Hawaii, Illinois, Indiana, Iowa, 6
Kentucky, Louisiana, Maine, Maryland, Massachusetts, Michigan, Minnesota, Missouri, 7
New Hampshire, New Jersey, New York, North Carolina, Ohio, Oklahoma, Pennsylvania, 8
Rhode Island, South Carolina, Tennessee, Texas, Virginia, West Virginia, Wisconsin, and 9
the Philadelphia Gas Commission, and the Texas Commission on Environmental Quality. 10
My testimony has been offered in over 200 rate cases involving electric power, natural gas 11
distribution and transmission, resource recovery, solid waste collection and disposal, 12
telephone, wastewater, and water service utility companies. While my testimony has 13
involved principally fair rate of return and financial matters, I have also testified on capital 14
allocations, capital recovery, cash working capital, income taxes, factoring of accounts 15
receivable, and take-or-pay expense recovery. My testimony has been offered on behalf of 16
municipal and investor-owned public utilities and for the staff of a regulatory commission. I 17
have also testified at an Executive Session of the State of New Jersey Commission of 18
Investigation concerning the BPU regulation of solid waste collection and disposal. 19
I was a co-author of a verified statement submitted to the Interstate Commerce 20
Commission concerning the 1983 Railroad Cost of Capital (Ex Parte No. 452). I was also 21
co-author of comments submitted to the Federal Energy Regulatory Commission regarding 22
the Generic Determination of Rate of Return on Common Equity for Public Utilities in 1985, 23
1986 and 1987 (Docket Nos. RM85-19-000, RM86-12-000, RM87-35-000 and RM88-25-24
000). Further, I have been the consultant to the New York Chapter of the National 25

APPENDIX A TO DIRECT TESTIMONY OF PAUL R. MOUL
A-3
Association of Water Companies, which represented the water utility group in the 1
Proceeding on Motion of the Commission to Consider Financial Regulatory Policies for New 2
York Utilities (Case 91-M-0509). I have also submitted comments to the Federal Energy 3
Regulatory Commission in its Notice of Proposed Rulemaking (Docket No. RM99-2-000) 4
concerning Regional Transmission Organizations and on behalf of the Edison Electric 5
Institute in its intervention in the case of Southern California Edison Company (Docket No. 6
ER97-2355-000). Also, I was a member of the panel of participants at the Technical 7
Conference in Docket No. PL07-2 on the Composition of Proxy Groups for Determining Gas 8
and Oil Pipeline Return on Equity. 9
In late 1978, I arranged for the private placement of bonds on behalf of an investor-10
owned public utility. I have assisted in the preparation of a report to the Delaware Public 11
Service Commission relative to the operations of the Lincoln and Ellendale Electric 12
Company. I was also engaged by the Delaware P.S.C. to review and report on the 13
proposed financing and disposition of certain assets of Sussex Shores Water Company 14
(P.S.C. Docket Nos. 24-79 and 47-79). I was a co-author of a Report on Proposed 15
Mandatory Solid Waste Collection Ordinance prepared for the Board of County 16
Commissioners of Collier County, Florida. 17
I have been a consultant to the Bucks County Water and Sewer Authority 18
concerning rates and charges for wholesale contract service with the City of Philadelphia. 19
My municipal consulting experience also included an assignment for Baltimore County, 20
Maryland, regarding the City/County Water Agreement for Metropolitan District customers 21
(Circuit Court for Baltimore County in Case 34/153/87-CSP-2636). 22

S T A T E O F M I C H I G A N
BEFORE THE MICHIGAN PUBLIC SERVICE COMMISSION
* * * * *
In the matter of the application of ) MICHIGAN GAS UTILITIES CORPORATION ) for authority to increase retail natural gas rates. ) Case No. U-17273 )
EXHIBIT TO ACCOMPANY THE
DIRECT TESTIMONY OF
PAUL R. MOUL
FOR
MICHIGAN GAS UTILITIES CORPORATION
June 7, 2013

Michigan Gas Utilities Corporation Index of Schedules Schedule Numbers Summary Cost of Equity D6 Michigan Gas Utilities Corporation Historical Capitalization and Financial Statistics D7 Delivery Group Historical Capitalization and Financial Statistics D8 Standard & Poor's Public Utilities Historical Capitalization and Financial Statistics D9 Dividend Yields D10 Historical Growth Rates D11 Projected Growth Rates D12 Financial Risk Adjustment D13 Interest Rates for Investment Grade Public Utility Bonds D14 Common Equity Risk Premiums D15 Component Inputs for the Capital Asset Pricing Model D16 Comparable Earnings Approach D17

Case No.: U-17273Witness: P.R. Moul
Exhibit: A-4 (PRM-1)Schedule: D6
Page 1 of 1
Market Models (DCF, RP & CAPM)
Discounted Cash Flow (DCF) D 1 /P 0 (1) + g (2) + lev. (3) = k
Delivery Group 4.13% + 5.00% + 0.50% = 9.63%
Risk Premium (RP) I (5) + RP (6) = kDelivery Group 5.00% + 7.00% = 12.00%
Capital Asset Pricing Model (CAPM) Rf (7) + ß (8) x ( Rm-Rf (9) ) + size (10) = kDelivery Group 3.50% + 0.73 x ( 8.76% ) + 1.12% = 11.01%
Book Value Method
Comparable Earnings (CE) Historical (11) Forecast (11) AverageComparable Earnings Group 12.4% 13.3% 12.85%
References (1) Attachment PRM-7 page 1(2) Attachment PRM-9 page 1(3) Attachment PRM-10 page 1(4) Attachment PRM-11 page 1(5)
(6) Attachment PRM-13 page 1(7) Attachment PRM-14 pages 1 & 2(8) Attachment PRM-10 page 1(9) Attachment PRM-14 page 2
(10) Attachment PRM-14 page 3(11) Attachment PRM-15 page 2
A-rated public utility bond yield comprised of a 3.50% risk-free rate of return (Attachment PRM-14 page 2) and a yield spread of 1.50% (Attachment PRM-12 page 3)
Michigan Gas Utilities CorporationCost of Equity
as of December 31, 2012

Case No.: U-17273Witness: P.R. Moul
Exhibit: A-4 (PRM-1)Schedule: D7
Page 1 of 2
2012 2011 2010 2009 2008
Amount of Capital EmployedPermanent Capital 192.9$ 195.6$ 208.7$ 216.9$ 203.4$ Short-Term Debt -$ -$ 8.8$ 8.8$ 27.1$ Total Capital 192.9$ 195.6$ 217.5$ 225.6$ 230.4$
Capital Structure Ratios AverageBased on Permanent Capital:
Long-Term Debt 43.6% 42.9% 40.2% 38.7% 41.3% 41.3%Common Equity (1) 56.4% 57.1% 59.8% 61.3% 58.7% 58.7%
100.0% 100.0% 100.0% 100.0% 100.0% 100.0%Based on Total Capital:
Total Debt incl. Short Term 43.6% 42.9% 42.7% 41.1% 48.2% 43.7%Common Equity (1) 56.4% 57.1% 57.3% 58.9% 51.8% 56.3%
100.0% 100.0% 100.0% 100.0% 100.0% 100.0%
Rate of Return on Book Common Equity (1) 4.7% 6.3% 4.8% 5.7% 5.1% 5.3%
Operating Ratio (2) 89.6% 89.4% 90.9% 90.9% 94.3% 91.0%
Coverage incl. AFUDC (3)
Pre-tax: All Interest Charges 2.59 x 3.06 x 3.17 x 3.34 x 2.75 x 2.98 xPost-tax: All Interest Charges 2.01 x 2.32 x 2.20 x 2.39 x 2.10 x 2.20 x
Coverage excl. AFUDC (3)
Pre-tax: All Interest Charges 2.59 x 3.05 x 3.17 x 3.34 x 2.75 x 2.98 xPost-tax: All Interest Charges 2.01 x 2.32 x 2.20 x 2.39 x 2.10 x 2.20 x
Quality of Earnings & Cash FlowAFC/Income Avail. for Common Equity 0.1% 0.5% 0.0% 0.0% 0.0% 0.1%Effective Income Tax Rate 36.4% 35.7% 44.7% 40.7% 37.4% 39.0%Internal Cash Generation/Construction (4) 51.7% 73.6% 109.0% 67.5% 181.8% 96.7%Gross Cash Flow/ Avg. Total Debt (5) 19.3% 32.1% 24.6% 32.2% 16.0% 24.8%Gross Cash Flow Interest Coverage (6) 3.19 x 5.07 x 4.47 x 6.33 x 3.51 x 4.51 x
See Page 2 for Notes.
(Millions of Dollars)
Michigan Gas Utilities CorporationCapitalization and Financial Statistics
2008-2012, Inclusive

Case No.: U-17273 Witness: P.R. Moul
Exhibit: A-4 (PRM-1) Schedule: D7
Page 2 of 2
Michigan Gas Utilities Corporation Capitalization and Financial Statistics 2005-2009, Inclusive Notes: (1) Excludes Accumulated Other Comprehensive Income (“OCI”). (2) Total operating expenses, maintenance, depreciation and taxes other than income taxes as a
percent of operating revenues. (3) Coverage calculations represent the number of times available earnings, both including
and excluding AFUDC (allowance for funds used during construction) as reported in its entirety, cover fixed charges.
(4) Internal cash generation/gross construction is the percentage of gross construction expenditures provided by internally-generated funds from operations after payment of all cash dividends divided by gross construction expenditures.
(5) Gross Cash Flow (sum of net income, depreciation, amortization, net deferred income taxes and investment tax credits, less total AFUDC) plus interest charges, divided by interest charges.
(6) Gross Cash Flow plus interest charges divided by interest charges.
Source of Information: Company provided data

Case No.: U-17273Witness: P.R. Moul
Exhibit: A-4 (PRM-1)Schedule: D8
Page 1 of 2
2012 2011 2010 2009 2008
Amount of Capital EmployedPermanent Capital 5,796.3$ 5,032.1$ 4,676.3$ 4,584.3$ 4,339.5$ Short-Term Debt 478.5$ 296.3$ 214.9$ 182.0$ 338.3$ Total Capital 6,274.8$ 5,328.4$ 4,891.2$ 4,766.3$ 4,677.8$
Market-Based Financial Ratios AveragePrice-Earnings Multiple 17 x 16 x 16 x 17 x 15 x 16 xMarket/Book Ratio 166.7% 168.3% 158.6% 145.8% 160.0% 159.9%Dividend Yield 4.0% 4.1% 4.4% 4.8% 4.2% 4.3%Dividend Payout Ratio 67.8% 67.0% 70.9% 75.0% 61.3% 68.4%
Capital Structure RatiosBased on Permanent Capital:
Long-Term Debt 46.0% 46.0% 46.9% 48.0% 48.6% 47.1%Preferred Stock 0.2% 0.3% 0.4% 0.4% 0.4% 0.3%Common Equity (2) 53.9% 53.7% 52.7% 51.6% 51.0% 52.6%
100.0% 100.0% 100.0% 100.0% 100.0% 100.0%Based on Total Capital:
Total Debt incl. Short Term 51.5% 50.5% 51.4% 52.0% 55.1% 52.1%Preferred Stock 0.2% 0.3% 0.3% 0.4% 0.4% 0.3%Common Equity (2) 48.4% 49.2% 48.3% 47.6% 44.6% 47.6%
100.0% 100.0% 100.0% 100.0% 100.0% 100.0%
Rate of Return on Book Common Equity (2) 9.7% 9.8% 10.2% 9.8% 11.0% 10.1%
Operating Ratio (3) 85.6% 86.7% 87.2% 88.5% 89.6% 87.5%
Coverage incl. AFUDC (4)
Pre-tax: All Interest Charges 4.21 x 4.14 x 4.24 x 3.72 x 3.95 x 4.05 xPost-tax: All Interest Charges 3.21 x 3.08 x 3.07 x 2.74 x 2.85 x 2.99 xOverall Coverage: All Int. & Pfd. Div. 3.20 x 3.06 x 3.06 x 2.72 x 2.84 x 2.98 x
Coverage excl. AFUDC (4)
Pre-tax: All Interest Charges 4.12 x 4.07 x 4.17 x 3.69 x 3.90 x 3.99 xPost-tax: All Interest Charges 3.12 x 3.01 x 3.01 x 2.70 x 2.80 x 2.93 xOverall Coverage: All Int. & Pfd. Div. 3.10 x 2.99 x 2.99 x 2.69 x 2.78 x 2.91 x
Quality of Earnings & Cash FlowAFC/Income Avail. for Common Equity 4.7% 4.5% 4.4% 2.6% 3.5% 3.9%Effective Income Tax Rate 32.6% 35.1% 34.3% 35.0% 37.0% 34.8%Internal Cash Generation/Construction (5) 72.8% 88.1% 108.9% 103.0% 97.9% 94.1%Gross Cash Flow/ Avg. Total Debt (6) 23.9% 24.4% 25.9% 21.4% 20.7% 23.3%Gross Cash Flow Interest Coverage (7) 6.19 x 5.84 x 6.22 x 5.29 x 4.89 x 5.69 xCommon Dividend Coverage (8) 4.01 x 4.05 x 4.57 x 4.11 x 4.18 x 4.18 x
See Page 2 for Notes.
(Millions of Dollars)
Delivery GroupCapitalization and Financial Statistics (1)
2008-2012, Inclusive

Case No.: U-17273 Witness: P.R. Moul
Exhibit: A-4 (PRM-1) Schedule: D8
Page 2 of 2
Delivery Group Capitalization and Financial Statistics 2008-2012, Inclusive
Notes: (1) All capitalization and financial statistics for the group are the arithmetic average of the achieved results
for each individual company in the group. (2) Excluding Accumulated Other Comprehensive Income (“OCI”) from the equity account. (3) Total operating expenses, maintenance, depreciation and taxes other than income taxes as a percent
of operating revenues. (4) Coverage calculations represent the number of times available earnings, both including and excluding
AFUDC (allowance for funds used during construction) as reported in its entirety, cover fixed charges. (5) Internal cash generation/gross construction is the percentage of gross construction expenditures
provided by internally-generated funds from operations after payment of all cash dividends divided by gross construction expenditures.
(6) Gross Cash Flow (sum of net income, depreciation, amortization, net deferred income taxes and investment tax credits, less total AFUDC) plus interest charges, divided by interest charges.
(7) Gross Cash Flow plus interest charges divided by interest charges. (8) Common dividend coverage is the relationship of internally-generated funds from operations after
payment of preferred stock dividends to common dividends paid. Basis of Selection: The Delivery Group includes companies that are contained in The Value Line Investment Survey within the industry group “Natural Gas Utility,” they are not currently the target of a publicly-announced merger or acquisition, and after eliminating NiSource due to its electric and natural gas pipeline/storage operations and UGI Corp. due to its highly diversified businesses. The Delivery Group also includes companies that are listed in the “Electric Utility (East)” section of Value Line, they are not currently the target of a publicly-announced merger or acquisition and they do not have a significant amount of electric generation.
Stock S&P Stock Value LineTicker Company Moody's S&P Traded Ranking Beta
AGL AGL Resources, Inc. A3 BBB+ NYSE A 0.75ATO Atmos Energy Corp. Baa1 BBB+ NYSE A- 0.70ED Consolidated Edison, Inc. A3 A- NYSE B+ 0.60LG Laclede Group Baa1 A NYSE B+ 0.55
NJR New Jersey Resources Corp. Aa3 A NYSE B+ 0.65NU Northeast Utilities Baa1 A- NYSE B+ 0.70
NWN Northwest Natural Gas A3 A+ NYSE A- 0.55POM PEPCO Holdings Baa2 BBB+ NYSE B 0.75PNY Piedmont Natural Gas Co. A3 A NYSE A 0.65SJI South Jersey Industries, Inc. Baa1 BBB+ NYSE A- 0.65
SWX Southwest Gas Corporation Baa2 BBB NYSE B+ 0.75UIL UIL Holdings Baa2 BBB NYSE B 0.70
WGL WGL Holdings, Inc. A2 A+ NYSE B+ 0.65
Average A3 A- B+ 0.67
Corporate Credit Ratings
Source of Information: Utility COMPUSTAT Moody’s Investors Service Standard & Poor’s Corporation

Case No.: U-17273Witness: P.R. Moul
Exhibit: A-4 (PRM-1)Schedule: D9
Page 1 of 3
2012 2011 2010 2009 2008
Amount of Capital EmployedPermanent Capital 21,620.0$ 18,840.8$ 17,587.3$ 16,618.6$ 15,620.1$ Short-Term Debt 648.9$ 531.4$ 435.4$ 415.0$ 803.5$ Total Capital 22,268.9$ 19,372.2$ 18,022.7$ 17,033.6$ 16,423.6$
Market-Based Financial Ratios AveragePrice-Earnings Multiple 18 x 15 x 15 x 14 x 14 x 15 xMarket/Book Ratio 164.0% 155.2% 142.8% 137.1% 174.9% 154.8%Dividend Yield 4.1% 4.4% 4.8% 5.2% 4.3% 4.6%Dividend Payout Ratio 70.3% 64.7% 72.0% 72.2% 61.9% 68.2%
Capital Structure RatiosBased on Permanent Captial:
Long-Term Debt 52.9% 52.9% 53.4% 54.2% 54.3% 53.5%Preferred Stock 1.6% 1.3% 1.3% 1.5% 1.7% 1.5%Common Equity (2) 45.5% 45.8% 45.3% 44.3% 44.0% 45.0%
100.0% 100.0% 100.0% 100.0% 100.0% 100.0%Based on Total Capital:
Total Debt incl. Short Term 54.5% 54.5% 54.7% 55.6% 57.1% 55.3%Preferred Stock 1.6% 1.3% 1.3% 1.4% 1.6% 1.4%Common Equity (2) 44.0% 44.3% 44.0% 43.0% 41.3% 43.3%
100.0% 100.0% 100.0% 100.0% 100.0% 100.0%
Rate of Return on Book Common Equity (2) 9.2% 10.5% 10.8% 10.1% 12.2% 10.6%
Operating Ratio (3) 81.3% 81.4% 81.6% 83.0% 84.1% 82.3%
Coverage incl. AFUDC (4)
Pre-tax: All Interest Charges 2.94 x 3.35 x 3.34 x 3.06 x 3.39 x 3.22 xPost-tax: All Interest Charges 2.35 x 2.59 x 2.52 x 2.36 x 2.57 x 2.48 xOverall Coverage: All Int. & Pfd. Div. 2.32 x 2.57 x 2.50 x 2.33 x 2.53 x 2.45 x
Coverage excl. AFUDC (4)
Pre-tax: All Interest Charges 2.85 x 3.25 x 3.25 x 2.96 x 3.28 x 3.12 xPost-tax: All Interest Charges 2.25 x 2.49 x 2.43 x 2.26 x 2.46 x 2.38 xOverall Coverage: All Int. & Pfd. Div. 2.22 x 2.47 x 2.41 x 2.22 x 2.42 x 2.35 x
Quality of Earnings & Cash FlowAFC/Income Avail. for Common Equity 7.1% 5.7% 6.6% 7.8% 7.7% 7.0%Effective Income Tax Rate 26.2% 36.8% 34.3% 31.8% 33.8% 32.6%Internal Cash Generation/Construction (5) 75.0% 89.4% 108.0% 100.0% 83.1% 91.1%Gross Cash Flow/ Avg. Total Debt (6) 21.9% 23.2% 23.9% 22.5% 22.6% 22.8%Gross Cash Flow Interest Coverage (7) 5.37 x 5.12 x 5.09 x 4.85 x 4.75 x 5.04 xCommon Dividend Coverage (8) 4.31 x 4.58 x 4.88 x 4.73 x 4.95 x 4.69 x
See Page 2 for Notes.
(Millions of Dollars)
Standard & Poor's Public UtilitiesCapitalization and Financial Statistics (1)
2008-2012, Inclusive

Case No.: U-17273 Witness: P.R. Moul
Exhibit: A-4 (PRM-1) Schedule: D9
Page 2 of 3
Standard & Poor's Public Utilities Capitalization and Financial Statistics
2008-2012, Inclusive Notes:
(1) All capitalization and financial statistics for the group are the arithmetic average of the
achieved results for each individual company in the group. (2) Excluding Accumulated Other Comprehensive Income (“OCI”) from the equity account (3) Total operating expenses, maintenance, depreciation and taxes other than income taxes as
a percent of operating revenues. (4) Coverage calculations represent the number of times available earnings, both including and
excluding AFUDC (allowance for funds used during construction) as reported in its entirety, cover fixed charges.
(5) Internal cash generation/gross construction is the percentage of gross construction expenditures provided by internally-generated funds from operations after payment of all cash dividends divided by gross construction expenditures.
(6) Gross Cash Flow (sum of net income, depreciation, amortization, net deferred income taxes and investment tax credits, less total AFUDC) as a percentage of average total debt.
(7) Gross Cash Flow (sum of net income, depreciation, amortization, net deferred income taxes and investment tax credits, less total AFUDC) plus interest charges, divided by interest charges.
(8) Common dividend coverage is the relationship of internally-generated funds from operations after payment of preferred stock dividends to common dividends paid.
Source of Information: Annual Reports to Shareholders Utility COMPUSTAT

Case No.: U-17273Witness: P.R. Moul
Exhibit: A-4 (PRM-1)Schedule: D9
Page 3 of 3
Common S&P ValueStock Stock Line
Ticker Moody's S&P Traded Ranking Beta
AGL Resources Inc. GAS A3 BBB+ NYSE A 0.75Ameren Corporation AEE Baa2 BBB NYSE B 0.80American Electric Power AEP Baa2 BBB NYSE B 0.70CMS Energy CMS Baa1 BBB NYSE B 0.75CenterPoint Energy CNP Baa2 BBB+ NYSE B 0.80Consolidated Edison ED A3 A- NYSE B+ 0.60DTE Energy Co. DTE A3 BBB+ NYSE B+ 0.75Dominion Resources D A3 A- NYSE B+ 0.65Duke Energy DUK A3 BBB+ NYSE B 0.60Edison Int'l EIX A3 BBB+ NYSE B 0.75Entergy Corp. ETR Baa2 BBB NYSE A+ 0.70EQT Corp. EQT Baa3 BBB NYSE B+ 1.15Exelon Corp. EXC A3 BBB NYSE B+ 0.80FirstEnergy Corp. FE Baa2 BBB- NYSE A- 0.80Integrys Energy Group TEG A2 A- NYSE B 0.90NextEra Energy Inc. NEE A2 A- NYSE A 0.75NiSource Inc. NI Baa2 BBB- NYSE B 0.85Northeast Utilities NU Baa2 A- NYSE B 0.70NRG Energy Inc. NRG Ba3 BB- NYSE NR 1.10ONEOK, Inc. OKE Baa2 BBB NYSE NR 0.95PEPCO Holdings, Inc. POM Baa2 BBB+ NYSE B 0.75PG&E Corp. PCG A3 BBB NYSE B 0.55PPL Corp. PPL Baa2 BBB NYSE B+ 0.65Pinnacle West Capital PNW Baa1 BBB+ NYSE B 0.70Public Serv. Enterprise Inc. PEG A3 BBB NYSE B+ 0.75SCANA Corp. SCG Baa2 BBB+ NYSE A- 0.65Sempra Energy SRE A2 A NYSE A- 0.80Southern Co. SO A3 A NYSE A- 0.55TECO Energy TE A3 BBB+ NYSE B 0.85Wisconsin Energy Corp. WEC A2 A- NYSE A 0.65Xcel Energy Inc XEL A3 A- NYSE B+ 0.65
Average for S&P Utilities Baa1 BBB+ A 0.75
Note: (1) Ratings are those of utility subsidiaries
Source of Information: Moody's Investors ServiceStandard & Poor's Corporation
Standard & Poor's Stock GuideValue Line Investment Survey for Windows
Company IdentitiesStandard & Poor's Public Utilities
Credit Rating (1)

Case No.: U-17273Witness: P.R. Moul
Exhibit: A-4 (PRM-1)Schedule: D10
Page 1 of 1
Delivery Group
12-Month 6-Month 3-MonthCompany Jan-12 Feb-12 Mar-12 Apr-12 May-12 Jun-12 Jul-12 Aug-12 Sep-12 Oct-12 Nov-12 Dec-12 Average Average Average
AGL RES INC (NYSE:GAS) 4.47% 4.62% 4.72% 4.71% 4.92% 4.78% 4.59% 4.65% 4.52% 4.55% 4.73% 4.63%ATMOS ENERGY CORP (NYSE:ATO) 4.29% 4.49% 4.41% 4.27% 4.17% 3.95% 3.88% 3.95% 3.87% 3.92% 4.00% 4.00%Consolidated Edison, Inc. (NYSE:ED) 4.14% 4.17% 4.16% 4.11% 4.02% 3.91% 3.78% 4.00% 4.06% 4.04% 4.35% 4.38%LACLEDE GROUP INC (NYSE:LG) 4.01% 4.08% 4.27% 4.24% 4.40% 4.18% 4.00% 3.97% 3.87% 4.11% 4.22% 4.42%NEW JERSEY RES (NYSE:NJR) 3.20% 3.28% 3.42% 3.53% 3.65% 3.49% 3.50% 3.60% 3.50% 3.61% 3.97% 4.05%Northeast Utilities (NYSE:NU) 3.39% 3.27% 3.17% 3.76% 3.81% 3.55% 3.46% 3.64% 3.60% 3.51% 3.54% 3.52%NORTHWEST NAT GAS CO (NYSE:NWN) 3.75% 3.90% 3.95% 3.90% 3.85% 3.76% 3.66% 3.63% 3.64% 3.91% 4.16% 4.15%PEPCO Holdings Inc. (NYSE:POM) 5.54% 5.63% 5.74% 5.76% 5.74% 5.54% 5.45% 5.67% 5.74% 5.48% 5.54% 5.53%PIEDMONT NAT GAS INC (NYSE:PNY) 3.66% 3.73% 3.87% 3.95% 3.99% 3.73% 3.79% 3.87% 3.70% 3.78% 3.92% 3.84%SOUTH JERSEY INDS INC (NYSE:SJI) 2.95% 3.12% 3.22% 3.28% 3.35% 3.17% 3.06% 3.20% 3.05% 3.52% 3.57% 3.53%SOUTHWEST GAS CORPORATION (SWX) 2.55% 2.49% 2.49% 2.82% 2.82% 2.71% 2.66% 2.76% 2.68% 2.73% 2.82% 2.79%UIL Holdings Corporation (NYSE:UIL) 5.03% 4.95% 4.99% 5.06% 5.17% 4.83% 4.69% 4.96% 4.83% 4.81% 4.87% 4.83%WGL HLDGS INC (NYSE:WGL) 3.64% 3.82% 3.84% 4.00% 4.13% 4.06% 3.97% 4.12% 4.01% 4.03% 4.12% 4.12%
Average 3.89% 3.97% 4.02% 4.11% 4.16% 3.97% 3.88% 4.00% 3.93% 4.00% 4.14% 4.14% 4.02% 4.02% 4.09%
Note:
Source of Information: http://finance.yahoo.com/http://www.nasdaq.com/symbol/gas/dividend-history
Forward-looking Dividend Yield 1/2 Growth D0/P0 (.5g) D1/P0
4.02% 1.025000 4.12%
Discrete D0/P0 Adj. D1/P0
4.02% 1.031059 4.14%
Quarterly D0/P0 Adj. D1/P0
1.0038% 1.012272 4.13%
Average 4.13%
Growth rate 5.00%
K 9.13%
Monthly Dividend Yields for
for the Twelve Months Ending December 2012
Monthly dividend yields are calculated by dividing the annualized quarterly dividend by the month-end closing stock price adjusted by the fraction of the ex-dividend.
P)g + (1 D + )g + (1 D + )g + (1 D + )g + (1 D
0
10
10
00
00
P)g + (1 D + )g + (1 D + )g + (1 D + )g + (1 D
0
1.000
.750
.500
.250
1- P
)g + (1 D + 10
.250
4

Case No.: U-17273Witness: P.R. Moul
Exhibit: A-4 (PRM-1)Schedule: D11
Page 1 of 1
Dividends per Share Book Value per Share Cash Flow per ShareValue Line Value Line Value Line Value Line
Delivery Group 5 Year 10 Year 5 Year 10 Year 5 Year 10 Year 5 Year 10 Year
AGL Resources, Inc. 4.50% 9.00% 7.50% 5.00% 5.50% 7.00% 6.00% 6.50%Atmos Energy Corp. 4.00% 7.00% 1.50% 1.50% 4.50% 6.50% 4.50% 4.50%Consolidated Edison 4.50% 1.00% 1.00% 1.00% 4.50% 4.00% 4.50% 1.00%Laclede Group, Inc. 6.00% 6.50% 2.50% 1.50% 6.50% 5.00% 7.00% 5.00%New Jersey Resources Corp. 7.00% 7.50% 8.00% 6.00% 7.50% 8.00% 4.50% 5.00%Northeast Utilities 18.00% - 8.50% 12.50% 3.50% 3.00% 2.00% -2.50%Northwest Natural Gas 4.50% 4.00% 4.50% 3.00% 4.00% 4.00% 3.50% 3.00%PEPCO Holdings -4.50% -4.50% 1.50% - 0.50% 0.50% -4.00% -4.50%Piedmont Natural Gas Co. 4.50% 5.00% 4.00% 4.50% 3.00% 5.00% 4.00% 5.50%South Jersey Industries, Inc. 7.00% 9.50% 9.50% 6.50% 7.00% 10.50% 8.00% 8.00%Southwest Gas Corporation 6.50% 6.00% 4.00% 2.00% 5.00% 4.50% 3.00% 3.50%UIL Holdings 4.50% -2.00% - - -0.50% - 1.50% -2.00%WGL Holdings, Inc. 3.00% 3.00% 2.50% 2.00% 5.00% 4.00% 1.50% 3.00%
Average 5.35% 4.33% 4.58% 4.14% 4.31% 5.17% 3.54% 2.77%
Source of Information: Value Line Investment Survey, December 7, 2012
Historical Growth RatesEarnings Per Share, Dividends Per Share,
Book Value Per Share, and Cash Flow Per Share
Earnings per Share

Case No.: U-17273Witness: P.R. Moul
Exhibit: A-4 (PRM-1)Schedule: D12
Page 1 of 1
Analysts' Five-Year Projected Growth RatesEarnings Per Share, Dividends Per Share,
Book Value Per Share, and Cash Flow Per Share
Value LineI/B/E/S Book Cash PercentFirst Earnings Dividends Value Flow Retained to
Delivery Group Call Zacks Morningstar Per Share Per Share Per Share Per Share Common Equity
AGL Resources, Inc. NMF 4.40% 4.60% 6.00% 1.50% 5.00% 9.00% 6.50%Atmos Energy Corp. 6.00% 6.00% 8.50% 4.00% 1.50% 6.00% 3.50% 3.50%Consolidated Edison 2.41% 3.00% 2.80% 4.00% 1.00% 4.00% 5.50% 4.00%Laclede Group, Inc. 5.30% 3.00% - 3.00% 2.50% 4.50% 2.50% 4.50%New Jersey Resources Corp. 2.70% 4.00% 4.30% 5.50% 4.00% 5.50% 5.00% 7.50%Northeast Utilities 5.90% 7.10% 8.10% 8.00% 8.50% 8.00% 4.00% 4.50%Northwest Natural Gas 4.50% 4.20% 3.00% 3.00% 2.50% 1.00% -0.50% 4.00%PEPCO Holdings 4.33% 4.80% 4.10% 7.00% 1.00% 2.00% 4.00% 2.50%Piedmont Natural Gas Co. 5.35% 3.70% 5.30% 2.50% 3.50% 1.50% 2.50% 3.50%South Jersey Industries, Inc. 6.00% 6.00% - 9.00% 9.00% 6.00% 7.00% 7.50%Southwest Gas Corporation 4.05% 5.00% - 9.00% 8.00% 6.00% 6.50% 6.00%UIL Holdings 4.10% 4.00% 4.00% 4.00% Nil 3.50% 3.50% 3.00%WGL Holdings, Inc. 5.60% 5.30% 5.00% 2.50% 2.50% 4.00% 1.50% 3.50%
Average 4.69% 4.65% 4.97% 5.19% 3.79% 4.38% 4.15% 4.65%
Source of Information : IBES/First Call, January 18, 2013Zacks, January 18, 2013Morningstar, January 18, 2013Value Line Investment Survey, December 7, 2012

Case No.: U-17273Witness: P.R. Moul
Exhibit: A-4 (PRM-1)Schedule: D13
Page 1 of 1AGL Resources
(NYSE:GAS) ATMOS Energy
(NYSE:ATO)
Consolidated Edison
(NYSE:ED)Laclede Group
(NYSE:LG)
New Jersey Resources
(NYSE:NJR)
Northeast Utilities
(NYSE:NU)
Northwest Natural Gas
(NYSE:NWN)
PEPCO Holdings
(NYSE:POM)
Piedmont Natural Gas (NYSE:PNY)
South Jersey Industries
(NYSE:SJI) Southwest Gas
(SWX)UIL Holdings (NYSE:UIL)
WGL Holdings (NYSE:WGL) Average
Fiscal Year 12/31/12 09/30/12 12/31/12 09/30/12 09/30/12 12/31/12 12/31/12 12/31/12 10/31/12 12/31/12 12/31/12 12/31/2011 09/30/12
Capitalization at Fair ValuesDebt(D) 4,057,000 2,426,434 12,935,000 452,768 583,140 8,640,700 834,664 5,004,000 1,163,227 682,300 1,482,095 1,900,000 758,900 3,147,710Preferred(P) 0 0 0 0 0 152,200 0 0 0 0 0 340 28,173 13,901Equity(E) 4,710,667 3,229,686 14,976,983 969,196 1,776,495 12,273,216 1,189,731 4,510,603 2,302,608 1,593,109 1,957,128 1,813,615 2,077,369 4,106,185Total 8,767,667 5,656,120 27,911,983 1,421,964 2,359,635 21,066,116 2,024,395 9,514,603 3,465,835 2,275,409 3,439,223 3,713,955 2,864,442 7,267,796
Capital Structure RatiosDebt(D) 46.27% 42.90% 46.34% 31.84% 24.71% 41.02% 41.23% 52.59% 33.56% 29.99% 43.09% 51.16% 26.49% 39.32%Preferred(P) 0.00% 0.00% 0.00% 0.00% 0.00% 0.72% 0.00% 0.00% 0.00% 0.00% 0.00% 0.01% 0.98% 0.13%Equity(E) 53.73% 57.10% 53.66% 68.16% 75.29% 58.26% 58.77% 47.41% 66.44% 70.01% 56.91% 48.83% 72.52% 60.55%Total 100.00% 100.00% 100.00% 100.00% 100.00% 100.00% 100.00% 100.00% 100.00% 100.00% 100.00% 100.00% 99.99% 100.00%
Common StockIssued 117,855.075 90,239.900 292,871.896 22,539.431 41,619.633 26,917.000 230,015.427 72,250.000 46,147.788 50,645.490 51,611.647Treasury 0.000 0.000 23,210.700 0.000 2,763.659 0.000 0.000 0.000 0.000 0.000 0.000Outstanding 117,855.075 90,239.900 269,661.196 22,539.431 38,855.974 314,053.634 26,917.000 230,015.427 72,250.000 31,653.262 46,147.788 50,645.490 51,611.647Market Price 39.97$ 35.79$ $55.54 43.00$ 45.72$ $39.08 44.20$ 19.61$ 31.87$ 50.33$ 42.41$ 35.81$ 40.25$
Capitalization at Carrying AmountsDebt(D) 3,553,000 1,960,131 10,768,000 364,416 532,929 7,963,500 691,700 4,177,000 975,000 626,400 1,318,510 1,610,550 589,200 2,702,334Preferred(P) 0 0 0 0 0 155,600 0 0 0 0 0 340 28,173 14,163Equity(E) 3,413,000 2,359,243 11,869,000 601,611 813,865 9,237,050 733,033 4,446,000 1,027,004 736,214 1,310,179 1,116,553 1,269,556 2,994,793Total 6,966,000 4,319,374 22,637,000 966,027 1,346,794 17,356,150 1,424,733 8,623,000 2,002,004 1,362,614 2,628,689 2,727,443 1,886,929 5,711,289
Capital Structure RatiosDebt(D) 51.00% 45.38% 47.57% 37.72% 39.57% 45.88% 48.55% 48.44% 48.70% 45.97% 50.16% 59.05% 31.23% 46.09%Preferred(P) 0.00% 0.00% 0.00% 0.00% 0.00% 0.90% 0.00% 0.00% 0.00% 0.00% 0.00% 0.01% 1.49% 0.18%Equity(E) 49.00% 54.62% 52.43% 62.28% 60.43% 53.22% 51.45% 51.56% 51.30% 54.03% 49.84% 40.94% 67.28% 53.72%Total 100.00% 100.00% 100.00% 100.00% 100.00% 100.00% 100.00% 100.00% 100.00% 100.00% 100.00% 100.00% 100.00% 100.00%
Betas Value Line 0.75 0.70 0.60 0.55 0.65 0.70 0.55 0.75 0.65 0.65 0.75 0.70 0.65 0.67
Hamada Bl = Bu [1+ (1 - t ) D/E + P/E ]0.67 = Bu [1+ (1-0.35) 0.6494 + 0.0021 ]0.67 = Bu [1+ 0.65 0.6494 + 0.0021 ]0.67 = Bu 1.42420.47 = Bu
Hamada Bl = 0.47 [1+ (1 - t) D/E + P/E ]Bl = 0.47 [1+ 0.65 0.8580 + 0.0034 ]Bl = 0.47 1.5611Bl = 0.73
M&M ku = ke - ((( ku - i ) 1-t ) D / E - (ku - d ) P / E7.59% = 9.13% - ((( 7.59% - 3.95% ) 0.65 ) 39.32% / 60.55% - 7.59% - 5.68% ) 0.13% / 60.55%7.59% = 9.13% - ((( 3.64% ) 0.65 ) 0.6494 - 1.91% ) 0.00217.59% = 9.13% - (( 2.37% ) 0.6494 - 1.91% ) 0.00217.59% = 9.13% - 1.54% - 0.00%
M&M ke = ku + ((( ku - i ) 1-t ) D / E + (ku - d ) P / E9.63% = 7.59% + ((( 7.59% - 3.95% ) 0.65 ) 46.09% / 53.72% + 7.59% - 5.68% ) 0.18% / 53.72%9.63% = 7.59% + ((( 3.64% ) 0.65 ) 0.8580 + 1.91% ) 0.00349.63% = 7.59% + (( 2.37% ) 0.858 + 1.91% ) 0.00349.63% = 7.59% + 2.03% + 0.01%
Delivery GroupFinancial Risk Adjustment

Case No.: U-17273Witness: P.R. Moul
Exhibit: A-4 (PRM-1)Schedule: D14
Page 1 of 3
Aa A BaaYears Rated Rated Rated Average
2008 6.18% 6.53% 7.24% 6.65%2009 5.75% 6.04% 7.06% 6.28%2010 5.24% 5.46% 5.96% 5.55%2011 4.78% 5.04% 5.57% 5.13%2012 3.83% 4.13% 4.86% 4.27%
Five-YearAverage 5.16% 5.44% 6.14% 5.58%
Months
Jan-12 4.03% 4.34% 5.06% 4.48%Feb-12 4.02% 4.36% 5.02% 4.47%Mar-12 4.16% 4.48% 5.13% 4.59%Apr-12 4.10% 4.40% 5.11% 4.53%
May-12 3.92% 4.20% 4.97% 4.36%Jun-12 3.79% 4.08% 4.91% 4.26%Jul-12 3.58% 3.93% 4.85% 4.12%
Aug-12 3.65% 4.00% 4.88% 4.18%Sep-12 3.69% 4.02% 4.81% 4.17%Oct-12 3.68% 3.91% 4.54% 4.04%Nov-12 3.60% 3.84% 4.42% 3.95%Dec-12 3.75% 4.00% 4.56% 4.10%
Twelve-MonthAverage 3.83% 4.13% 4.86% 4.27%
Six-MonthAverage 3.66% 3.95% 4.68% 4.09%
Three-MonthAverage 3.68% 3.92% 4.51% 4.03%
Interest Rates for Investment Grade Public Utility BondsYearly for 2008-2012
and the Twelve Months Ended December 2012
Source: Mergent Bond Record

Yields onA-rated Public Utility Bonds and Spreads over 20-Year Treasuries
0.00%
1.00%
2.00%
3.00%
4.00%
5.00%
6.00%
7.00%
8.00%
9.00%
A-rated Public Utility 8.31% 7.89% 7.75% 7.60% 7.04% 7.62% 8.24% 7.76% 7.37% 6.58% 6.16% 5.65% 6.07% 6.07% 6.53% 6.04% 5.46% 5.04% 4.13%
Spread vs. 20-year 0.82% 0.94% 0.92% 0.91% 1.32% 1.42% 2.01% 2.13% 1.94% 1.62% 1.12% 1.01% 1.08% 1.16% 2.17% 1.93% 1.43% 1.42% 1.59%
1994 1995 1996 1997 1998 1999 2000 2001 2002 2003 2004 2005 2006 2007 2008 2009 2010 2011 2012
Case N
o.: U-17273
Witness: P.R
. Moul
Exhibit: A-4 (PRM
-1) Schedule: D
14 Page 2 of 3

Case No.: U-17273Witness: P.R. Moul
Exhibit: A-4 (PRM-1)Schedule: D14
Page 3 of 3
A-rated A-rated A-ratedYear Public Utility Yield Spread Year Public Utility Yield Spread Year Public Utility Yield Spread
Dec-98 6.91% 5.36% 1.55%
Jan-99 6.97% 5.45% 1.52% Jan-04 6.15% 5.01% 1.14% Jan-09 6.39% 3.46% 2.93%Feb-99 7.09% 5.66% 1.43% Feb-04 6.15% 4.94% 1.21% Feb-09 6.30% 3.83% 2.47%Mar-99 7.26% 5.87% 1.39% Mar-04 5.97% 4.72% 1.25% Mar-09 6.42% 3.78% 2.64%Apr-99 7.22% 5.82% 1.40% Apr-04 6.35% 5.16% 1.19% Apr-09 6.48% 3.84% 2.64%May-99 7.47% 6.08% 1.39% May-04 6.62% 5.46% 1.16% May-09 6.49% 4.22% 2.27%Jun-99 7.74% 6.36% 1.38% Jun-04 6.46% 5.45% 1.01% Jun-09 6.20% 4.51% 1.69%Jul-99 7.71% 6.28% 1.43% Jul-04 6.27% 5.24% 1.03% Jul-09 5.97% 4.38% 1.59%Aug-99 7.91% 6.43% 1.48% Aug-04 6.14% 5.07% 1.07% Aug-09 5.71% 4.33% 1.38%Sep-99 7.93% 6.50% 1.43% Sep-04 5.98% 4.89% 1.09% Sep-09 5.53% 4.14% 1.39%Oct-99 8.06% 6.66% 1.40% Oct-04 5.94% 4.85% 1.09% Oct-09 5.55% 4.16% 1.39%Nov-99 7.94% 6.48% 1.46% Nov-04 5.97% 4.89% 1.08% Nov-09 5.64% 4.24% 1.40%Dec-99 8.14% 6.69% 1.45% Dec-04 5.92% 4.88% 1.04% Dec-09 5.79% 4.40% 1.39%
Jan-00 8.35% 6.86% 1.49% Jan-05 5.78% 4.77% 1.01% Jan-10 5.77% 4.50% 1.27%Feb-00 8.25% 6.54% 1.71% Feb-05 5.61% 4.61% 1.00% Feb-10 5.87% 4.48% 1.39%Mar-00 8.28% 6.38% 1.90% Mar-05 5.83% 4.89% 0.94% Mar-10 5.84% 4.49% 1.35%Apr-00 8.29% 6.18% 2.11% Apr-05 5.64% 4.75% 0.89% Apr-10 5.81% 4.53% 1.28%May-00 8.70% 6.55% 2.15% May-05 5.53% 4.56% 0.97% May-10 5.50% 4.11% 1.39%Jun-00 8.36% 6.28% 2.08% Jun-05 5.40% 4.35% 1.05% Jun-10 5.46% 3.95% 1.51%Jul-00 8.25% 6.20% 2.05% Jul-05 5.51% 4.48% 1.03% Jul-10 5.26% 3.80% 1.46%Aug-00 8.13% 6.02% 2.11% Aug-05 5.50% 4.53% 0.97% Aug-10 5.01% 3.52% 1.49%Sep-00 8.23% 6.09% 2.14% Sep-05 5.52% 4.51% 1.01% Sep-10 5.01% 3.47% 1.54%Oct-00 8.14% 6.04% 2.10% Oct-05 5.79% 4.74% 1.05% Oct-10 5.10% 3.52% 1.58%Nov-00 8.11% 5.98% 2.13% Nov-05 5.88% 4.83% 1.05% Nov-10 5.37% 3.82% 1.55%Dec-00 7.84% 5.64% 2.20% Dec-05 5.80% 4.73% 1.07% Dec-10 5.56% 4.17% 1.39%
Jan-01 7.80% 5.65% 2.15% Jan-06 5.75% 4.65% 1.10% Jan-11 5.57% 4.28% 1.29%Feb-01 7.74% 5.62% 2.12% Feb-06 5.82% 4.73% 1.09% Feb-11 5.68% 4.42% 1.26%Mar-01 7.68% 5.49% 2.19% Mar-06 5.98% 4.91% 1.07% Mar-11 5.56% 4.27% 1.29%Apr-01 7.94% 5.78% 2.16% Apr-06 6.29% 5.22% 1.07% Apr-11 5.55% 4.28% 1.27%May-01 7.99% 5.92% 2.07% May-06 6.42% 5.35% 1.07% May-11 5.32% 4.02% 1.30%Jun-01 7.85% 5.82% 2.03% Jun-06 6.40% 5.29% 1.11% Jun-11 5.26% 3.91% 1.35%Jul-01 7.78% 5.75% 2.03% Jul-06 6.37% 5.25% 1.12% Jul-11 5.27% 3.95% 1.32%Aug-01 7.59% 5.58% 2.01% Aug-06 6.20% 5.08% 1.12% Aug-11 4.69% 3.24% 1.45%Sep-01 7.75% 5.53% 2.22% Sep-06 6.00% 4.93% 1.07% Sep-11 4.48% 2.83% 1.65%Oct-01 7.63% 5.34% 2.29% Oct-06 5.98% 4.94% 1.04% Oct-11 4.52% 2.87% 1.65%Nov-01 7.57% 5.33% 2.24% Nov-06 5.80% 4.78% 1.02% Nov-11 4.25% 2.72% 1.53%Dec-01 7.83% 5.76% 2.07% Dec-06 5.81% 4.78% 1.03% Dec-11 4.33% 2.67% 1.66%
Jan-02 7.66% 5.69% 1.97% Jan-07 5.96% 4.95% 1.01% Jan-12 4.34% 2.70% 1.64%Feb-02 7.54% 5.61% 1.93% Feb-07 5.90% 4.93% 0.97% Feb-12 4.36% 2.75% 1.61%Mar-02 7.76% 5.93% 1.83% Mar-07 5.85% 4.81% 1.04% Mar-12 4.48% 2.94% 1.54%Apr-02 7.57% 5.85% 1.72% Apr-07 5.97% 4.95% 1.02% Apr-12 4.40% 2.82% 1.58%May-02 7.52% 5.81% 1.71% May-07 5.99% 4.98% 1.01% May-12 4.20% 2.53% 1.67%Jun-02 7.42% 5.65% 1.77% Jun-07 6.30% 5.29% 1.01% Jun-12 4.08% 2.31% 1.77%Jul-02 7.31% 5.51% 1.80% Jul-07 6.25% 5.19% 1.06% Jul-12 3.93% 2.22% 1.71%Aug-02 7.17% 5.19% 1.98% Aug-07 6.24% 5.00% 1.24% Aug-12 4.00% 2.40% 1.60%Sep-02 7.08% 4.87% 2.21% Sep-07 6.18% 4.84% 1.34% Sep-12 4.02% 2.49% 1.53%Oct-02 7.23% 5.00% 2.23% Oct-07 6.11% 4.83% 1.28% Oct-12 3.91% 2.51% 1.40%Nov-02 7.14% 5.04% 2.10% Nov-07 5.97% 4.56% 1.41% Nov-12 3.84% 2.39% 1.45%Dec-02 7.07% 5.01% 2.06% Dec-07 6.16% 4.57% 1.59% Dec-12 4.00% 2.47% 1.53%
Jan-03 7.07% 5.02% 2.05% Jan-08 6.02% 4.35% 1.67%Feb-03 6.93% 4.87% 2.06% Feb-08 6.21% 4.49% 1.72% Average:Mar-03 6.79% 4.82% 1.97% Mar-08 6.21% 4.36% 1.85% 12-months 1.59%Apr-03 6.64% 4.91% 1.73% Apr-08 6.29% 4.44% 1.85% 6-months 1.54%May-03 6.36% 4.52% 1.84% May-08 6.28% 4.60% 1.68% 3-months 1.46%Jun-03 6.21% 4.34% 1.87% Jun-08 6.38% 4.74% 1.64%Jul-03 6.57% 4.92% 1.65% Jul-08 6.40% 4.62% 1.78%Aug-03 6.78% 5.39% 1.39% Aug-08 6.37% 4.53% 1.84%Sep-03 6.56% 5.21% 1.35% Sep-08 6.49% 4.32% 2.17%Oct-03 6.43% 5.21% 1.22% Oct-08 7.56% 4.45% 3.11%Nov-03 6.37% 5.17% 1.20% Nov-08 7.60% 4.27% 3.33%Dec-03 6.27% 5.11% 1.16% Dec-08 6.52% 3.18% 3.34%
20-Year Treasuries 20-Year Treasuries
A rated Public Utility Bonds over 20-Year Treasuries
20-Year Treasuries

Case No.: U-17273Witness: P.R. Moul
Exhibit: A-4 (PRM-1)Schedule: D15
Page 1 of 2
Common Equity Risk PremiumsYears 1926-2012
Large Common Stocks
Long-Term Corp. Bonds
Equity Risk
PremiumLong-Term Govt.
Bonds Yields
Low Interest Rates 11.72% 4.72% 7.00% 3.03%
Average Across All Interest Rates 11.82% 6.41% 5.41% 5.16%
High Interest Rates 11.92% 8.15% 3.77% 7.35%
Source of Information: 2013 Stocks, Bonds, Bills, and Inflation (SBBI) Classis Yearbook

Case No.: U-17273Witness: P.R. Moul
Exhibit: A-4 (PRM-1)Schedule: D15
Page 2 of 2Basic Series
Annual Total Returns (except yields)
Year
Large Common Stocks
Long-Term Corp. Bonds
Stocks vs.
Corp. Bonds
Long-Term Govt.
Bonds Yields
1940 -9.78% 3.39% -13.17% 1.94%1945 36.44% 4.08% 32.36% 1.99%1941 -11.59% 2.73% -14.32% 2.04%1949 18.79% 3.31% 15.48% 2.09%1946 -8.07% 1.72% -9.79% 2.12%1950 31.71% 2.12% 29.59% 2.24%1939 -0.41% 3.97% -4.38% 2.26%1948 5.50% 4.14% 1.36% 2.37%2012 16.00% 10.68% 5.32% 2.41%1947 5.71% -2.34% 8.05% 2.43%1942 20.34% 2.60% 17.74% 2.46%1944 19.75% 4.73% 15.02% 2.46%1943 25.90% 2.83% 23.07% 2.48%2011 2.11% 17.95% -15.84% 2.48%1938 31.12% 6.13% 24.99% 2.52%1936 33.92% 6.74% 27.18% 2.55%1951 24.02% -2.69% 26.71% 2.69%1954 52.62% 5.39% 47.23% 2.72%1937 -35.03% 2.75% -37.78% 2.73%1953 -0.99% 3.41% -4.40% 2.74%1935 47.67% 9.61% 38.06% 2.76%1952 18.37% 3.52% 14.85% 2.79%1934 -1.44% 13.84% -15.28% 2.93%1955 31.56% 0.48% 31.08% 2.95%2008 -37.00% 8.78% -45.78% 3.03%1932 -8.19% 10.82% -19.01% 3.15%1927 37.49% 7.44% 30.05% 3.16%1957 -10.78% 8.71% -19.49% 3.23%1930 -24.90% 7.98% -32.88% 3.30%1933 53.99% 10.38% 43.61% 3.36%1928 43.61% 2.84% 40.77% 3.40%1929 -8.42% 3.27% -11.69% 3.40%1956 6.56% -6.81% 13.37% 3.45%1926 11.62% 7.37% 4.25% 3.54%1960 0.47% 9.07% -8.60% 3.80%1958 43.36% -2.22% 45.58% 3.82%1962 -8.73% 7.95% -16.68% 3.95%1931 -43.34% -1.85% -41.49% 4.07%2010 15.06% 12.44% 2.62% 4.14%1961 26.89% 4.82% 22.07% 4.15%1963 22.80% 2.19% 20.61% 4.17%1964 16.48% 4.77% 11.71% 4.23%1959 11.96% -0.97% 12.93% 4.47%1965 12.45% -0.46% 12.91% 4.50%
2007 5.49% 2.60% 2.89% 4.50%1966 -10.06% 0.20% -10.26% 4.55%2009 26.46% 3.02% 23.44% 4.58%2005 4.91% 5.87% -0.96% 4.61%2002 -22.10% 16.33% -38.43% 4.84%2004 10.88% 8.72% 2.16% 4.84%2006 15.79% 3.24% 12.55% 4.91%2003 28.68% 5.27% 23.41% 5.11%1998 28.58% 10.76% 17.82% 5.42%1967 23.98% -4.95% 28.93% 5.56%2000 -9.10% 12.87% -21.97% 5.58%2001 -11.89% 10.65% -22.54% 5.75%1971 14.30% 11.01% 3.29% 5.97%1968 11.06% 2.57% 8.49% 5.98%1972 18.99% 7.26% 11.73% 5.99%1997 33.36% 12.95% 20.41% 6.02%1995 37.58% 27.20% 10.38% 6.03%1970 3.86% 18.37% -14.51% 6.48%1993 10.08% 13.19% -3.11% 6.54%1996 22.96% 1.40% 21.56% 6.73%1999 21.04% -7.45% 28.49% 6.82%1969 -8.50% -8.09% -0.41% 6.87%1976 23.93% 18.65% 5.28% 7.21%1973 -14.69% 1.14% -15.83% 7.26%1992 7.62% 9.39% -1.77% 7.26%1991 30.47% 19.89% 10.58% 7.30%1974 -26.47% -3.06% -23.41% 7.60%1986 18.67% 19.85% -1.18% 7.89%1994 1.32% -5.76% 7.08% 7.99%1977 -7.16% 1.71% -8.87% 8.03%1975 37.23% 14.64% 22.59% 8.05%1989 31.69% 16.23% 15.46% 8.16%1990 -3.10% 6.78% -9.88% 8.44%1978 6.57% -0.07% 6.64% 8.98%1988 16.61% 10.70% 5.91% 9.18%1987 5.25% -0.27% 5.52% 9.20%1985 31.73% 30.09% 1.64% 9.56%1979 18.61% -4.18% 22.79% 10.12%1982 21.55% 42.56% -21.01% 10.95%1984 6.27% 16.86% -10.59% 11.70%1983 22.56% 6.26% 16.30% 11.97%1980 32.50% -2.76% 35.26% 11.99%1981 -4.92% -1.24% -3.68% 13.34%

Case No.: U-17273Witness: P.R. Moul
Exhibit: A-4 (PRM-1)Schedule: D16
Page 1 of 3
Years 1-Year 2-Year 3-Year 5-Year 7-Year 10-Year 20-Year 30-Year
2008 1.82% 2.00% 2.24% 2.80% 3.17% 3.67% 4.36% 4.28%2009 0.47% 0.96% 1.43% 2.19% 2.81% 3.26% 4.11% 4.08%2010 0.32% 0.70% 1.11% 1.93% 2.62% 3.21% 4.03% 4.25%2011 0.18% 0.45% 0.75% 1.52% 2.16% 2.79% 3.62% 3.91%2012 0.18% 0.28% 0.38% 0.76% 1.22% 1.80% 2.54% 2.92%
Five-YearAverage 0.59% 0.88% 1.18% 1.84% 2.40% 2.95% 3.73% 3.89%
Months
Jan-12 0.12% 0.24% 0.36% 0.84% 1.38% 1.97% 2.70% 3.03%Feb-12 0.16% 0.28% 0.38% 0.83% 1.37% 1.97% 2.75% 3.11%Mar-12 0.19% 0.34% 0.51% 1.02% 1.56% 2.17% 2.94% 3.28%Apr-12 0.18% 0.29% 0.43% 0.89% 1.43% 2.05% 2.82% 3.18%
May-12 0.19% 0.29% 0.39% 0.76% 1.21% 1.80% 2.53% 2.93%Jun-12 0.19% 0.29% 0.39% 0.71% 1.08% 1.62% 2.31% 2.70%Jul-12 0.19% 0.25% 0.33% 0.62% 0.98% 1.53% 2.22% 2.59%
Aug-12 0.18% 0.27% 0.37% 0.71% 1.14% 1.68% 2.40% 2.77%Sep-12 0.18% 0.26% 0.34% 0.67% 1.12% 1.72% 2.49% 2.88%Oct-12 0.18% 0.28% 0.37% 0.71% 1.15% 1.75% 2.51% 2.90%Nov-12 0.18% 0.27% 0.36% 0.67% 1.08% 1.65% 2.39% 2.80%Dec-12 0.16% 0.26% 0.35% 0.70% 1.13% 1.72% 2.47% 2.88%
Twelve-Month Average 0.18% 0.28% 0.38% 0.76% 1.22% 1.80% 2.54% 2.92%
Six-MonthAverage 0.18% 0.27% 0.35% 0.68% 1.10% 1.68% 2.41% 2.80%
Three-MonthAverage 0.17% 0.27% 0.36% 0.69% 1.12% 1.71% 2.46% 2.86%
Source: Federal Reserve statistical release H.15
Yields for Treasury Constant MaturitiesYearly for 2008-2012
and the Twelve Months Ended December 2012

Case No.: U-17273Witness: P.R. Moul
Exhibit: A-4 (PRM-1)Schedule: D16
Page 2 of 3
1-Year 2-Year 5-Year 10-Year 30-Year Aaa BaaYear Quarter Bill Note Note Note Bond Bond Bond
2013 First 0.2% 0.3% 0.8% 1.8% 2.9% 3.7% 4.8%2013 Second 0.2% 0.3% 0.9% 1.9% 3.0% 3.8% 4.9%2013 Third 0.2% 0.4% 0.9% 2.0% 3.1% 3.9% 4.9%2013 Fourth 0.3% 0.4% 1.1% 2.1% 3.2% 3.9% 5.0%2014 First 0.3% 0.5% 1.2% 2.2% 3.3% 4.0% 5.1%2014 Second 0.4% 0.6% 1.3% 2.3% 3.4% 4.1% 5.2%
Median Median Dividend Appreciation Total
As of: Yield Potential Return2.2% + 10.67% = 12.87%
D/P ( 1+.5g ) + g = k2.51% ( 1.0457 ) + 9.14% = 11.76%
where: Price (P) at = 1426.19Dividend (D) for = 8.94Dividend (D) = 35.76Growth (g) = 9.14%
Value Line 12.87%S&P 500 11.76%
Average 12.32%Risk-free Rate of Return 3.50%
Forecast Market Premium 8.82%
Historical Market Premium (Rm) (Rf)1926-2012 Arith. mean 11.72% 3.03% 8.69%
Average - Forecast/Historical 8.76%
Measures of the Risk-Free Rate & Corporate Bond YieldsThe forecast of Treasury and Corporate yields
per the consensus of nearly 50 economists reported in the Blue Chip Financial Forecasts dated January 1, 2013
CorporateTreasury
annualizedFirst Call EpS
Summary
Measures of the Market Premium
Value Line Return
DCF Result for the S&P 500 Composite
31-Dec-124th Qtr. '12
January 18, 2013

Case No.: U-17273 Witness: P.R. Moul Exhibit: A-4 (PRM-1) Schedule: D16 Page 3 of 3

Case No.: U-17273Witness: P.R. Moul
Exhibit: A-4 (PRM-1)Schedule: D17
Page 1 of 2
Timeliness Safety Financial Price TechnicalCompany Industry Rank Rank Strength Stability Beta Rank
Altria Group TOBACCO 2 2 B+ 100 0.55 3AmerisourceBergen MEDICNON 3 2 B++ 100 0.70 2Berkley (W.R.) INSPRPTY 2 2 B++ 95 0.70 2Campbell Soup FOODPROC 2 2 B++ 100 0.55 2Capitol Fed. Fin'l THRIFT 3 3 B+ 95 0.65 3Church & Dwight HOUSEPRD 2 1 A 100 0.60 3Clorox Co. HOUSEPRD 2 2 B++ 100 0.60 3DaVita Inc. MEDSERV 2 3 B+ 95 0.70 3Dollar General RETAIL 2 3 B++ 95 0.60 3Erie Indemnity Co. INSPRPTY 3 2 B++ 100 0.75 2Haemonetics Corp. MEDICNON 3 2 B++ 95 0.65 3Hershey Co. FOODPROC 2 2 B++ 100 0.65 2Hormel Foods FOODPROC 3 1 A 100 0.65 3Kellogg FOODPROC 3 1 A 100 0.55 3Kroger Co. GROCERY 3 2 B++ 95 0.60 3Laboratory Corp. MEDSERV 3 1 A 100 0.65 3Marsh & McLennan FINSERV 3 3 B 95 0.75 3People's United Fin'l THRIFT 3 3 B+ 95 0.70 3Philip Morris Int'l TOBACCO 3 2 B++ 95 0.75 3Quest Diagnostics MEDSERV 3 2 B++ 95 0.75 3Silgan Holdings PACKAGE 3 3 B+ 95 0.75 3Stericycle Inc. ENVIRONM 2 2 B++ 95 0.70 3Verisk Analytics INFOSER 2 2 B+ 100 0.60 3Waste Connections ENVIRONM 3 3 B+ 95 0.70 2Weis Markets GROCERY 3 1 A 95 0.65 3
Average 3 2 B++ 97 0.66 3
Delivery Group Average 3 2 B++ 99 0.67 3
Source of Information: Value Line Investment Survey for Windows, January 2013
Comparable Earnings ApproachUsing Non-Utility Companies with
Timeliness of 2 & 3; Safety Rank of 1, 2 & 3; Financial Strength of B, B+, B++ & A;Price Stability of 95 to 100; Betas of .55 to .75; and Technical Rank of 2 & 3

Case No.: U-17273Witness: P.R. Moul
Exhibit: A-4 (PRM-1)Schedule: D17
Page 2 of 2
ProjectedCompany 2007 2008 2009 2010 2011 Average 2015-17
Altria Group 49.4% 122.0% 89.5% NMF NMF 87.0% NMFAmerisourceBergen 15.9% 17.3% 18.8% 21.6% 24.6% 19.6% 27.5%Berkley (W.R.) 20.6% 16.5% 10.2% 11.4% 7.7% 13.3% 12.5%Campbell Soup 59.5% 60.5% 105.9% 91.1% 77.8% 79.0% 58.0%Capitol Fed. Fin'l 3.7% 5.8% 7.0% 7.1% 3.3% 5.4% 4.5%Church & Dwight 15.6% 15.1% 15.5% 15.3% 15.9% 15.5% 17.0%Clorox Co. NMF - - NMF NMF - NMFDaVita Inc. 19.7% 19.2% 19.8% 22.8% 22.5% 20.8% 19.0%Dollar General - 3.8% 10.0% 15.5% 16.4% 11.4% 19.0%Erie Indemnity Co. 20.6% 18.0% 12.0% 17.8% 21.4% 18.0% 24.5%Haemonetics Corp. 11.4% 11.9% 12.5% 12.2% 10.7% 11.7% 12.0%Hershey Co. 81.3% 135.3% 69.3% 65.1% 76.4% 85.5% 52.5%Hormel Foods 15.8% 14.2% 16.1% 17.0% 17.8% 16.2% 16.0%Kellogg 43.7% 79.3% 53.3% 57.8% 69.9% 60.8% 33.5%Kroger Co. 24.0% 24.1% 23.2% 21.1% 30.0% 24.5% 23.5%Laboratory Corp. 29.4% 30.4% 25.3% 23.7% 25.8% 26.9% 20.0%Marsh & McLennan 6.9% NMF 9.2% 8.6% 16.2% 10.2% 20.0%People's United Fin'l 3.4% 2.7% 2.0% 1.6% 3.8% 2.7% 6.0%Philip Morris Int'l 39.1% NMF NMF NMF NMF 39.1% NMFQuest Diagnostics 16.7% 17.8% 18.3% 17.9% 19.7% 18.1% 16.0%Silgan Holdings 24.6% 25.1% 23.2% 26.1% 29.4% 25.7% 20.0%Stericycle Inc. 18.0% 22.8% 21.1% 20.4% 20.2% 20.5% 15.0%Verisk Analytics - - - - - - 37.0%Waste Connections 12.8% 8.2% 8.7% 10.5% 12.1% 10.5% 13.5%Weis Markets 7.1% 7.1% 9.1% 9.4% 10.1% 8.6% 9.0%
Average 27.4% 21.6%
Average (excluding values >20%) 12.4% 13.3%
NMF = no meaningful figure
Comparable Earnings ApproachFive -Year Average Historical Earned Returns
for Years 2007-2011 andProjected 3-5 Year Returns

STATE OF MICHIGAN
BEFORE THE MICHIGAN PUBLIC SERVICE COMMISSION
* * * * * In the matter of the application of ) MICHIGAN GAS UTILITIES CORPORATION ) for authority to increase retail natural gas rates. ) Case No. U-17273 )
DIRECT TESTIMONY AND EXHIBITS OF
JOYLYN C. HOFFMAN MALUEG, CMA
FOR
MICHIGAN GAS UTILITIES CORPORATION
June 7, 2013

- 1 -
STATE OF MICHIGAN
BEFORE THE MICHIGAN PUBLIC SERVICE COMMISSION
* * * * *
In the matter of the application of ) MICHIGAN GAS UTILITIES CORPORATION ) for authority to increase retail natural gas rates. ) Case No. U-17273 )
QUALIFICATIONS OF
JOYLYN C. HOFFMAN MALUEG, CMA PART I
Q. Please state your name, position and business address. 1
A. My name is Joylyn C. Hoffman Malueg. My business address is Integrys Business 2
Support, LLC (“IBS”), 700 North Adams Street, P.O. Box 19001, Green Bay, WI 3
54307-9001. I am a Rate Case Consultant in the Regulatory Affairs Department of 4
Integrys Energy Group, Inc. (“Integrys”). Both IBS and Michigan Gas Utilities 5
Corporation (“MGUC”) are wholly-owned subsidiaries of Integrys. 6
7
Q. For whom are you providing testimony? 8
A. I am providing testimony on behalf of MGUC. 9
10
Q. Please describe briefly your educational, professional, and utility background. 11
A. I am a 1999 graduate of the University of Wisconsin – Green Bay where I received a 12
Bachelor of Science Degree in Mathematics with a Statistical emphasis. I received 13
my Master of Business Administration degree from Cardinal Stritch University, 14
Milwaukee, Wisconsin, in February 2006. I am also a Certified Management 15
Accountant (“CMA”) through the Institute of Management Accountants (“IMA”), 16
having received that professional designation in November 2009. 17
18

- 2 -
In March of 2001, I was hired by Wisconsin Public Service Corporation (“WPS Corp”) 1
as a Revenue Requirements Forecaster in the Rates and Economic Development 2
Department. In that position, I was primarily responsible for revenue requirements 3
and cost of service analyses pertaining to WPS Corp’s wholesale jurisdiction. In 4
October of 2003, my job title changed to Rate Analyst within the Regulatory Affairs 5
department. In that position, I worked primarily on revenue requirements analyses 6
for WPS Corp’s Michigan retail jurisdiction, as well as performing revenue 7
requirement analyses and cost of service studies for Upper Peninsula Power 8
Company (“UPPCO”). Since December of 2006, I have been a Rate Case 9
Consultant and my primary job duties include performing cost of service study 10
analyses for all regulated Integrys subsidiaries. I am also responsible for conducting 11
the revenue requirement analyses for WPS Corp’s Michigan retail electric and gas 12
jurisdictions. 13
14
Q. Have you previously testified before any regulatory agency? 15
A. Yes, I have. I have filed testimony on behalf of WPS Corp, UPPCO or MGUC before 16
the Michigan Public Service Commission (“the Commission”) in Case Nos. U-14410, 17
U-14745, U-15352, U-15549, U-15988, U-15990, U-16166, and U-16417. I have 18
filed testimony on behalf of WPS Corp before the Public Service Commission of 19
Wisconsin (“PSCW”) in rate case Docket Nos. 6690-UR-119, 6690-UR-120, 6690-20
UR-121, and 6690-UR-122, and before the Minnesota Public Utilities Commission 21
(“MPUC”) on behalf of Minnesota Energy Resources Corporation (“MERC”) in rate 22
case Docket Nos. G007,011/GR-08-835 and G007,11/GR-10-977. I have also filed 23
testimony before the Illinois Commerce Commission (“ICC”) on behalf of The 24
Peoples Gas Light and Coke Company (“PGL”) and North Shore Gas Company 25
(“NSG”) in rate case Docket Nos. 09-0166, 09-0167, 11-0280, 11-0281, 12-0512, 26
and 12-0511. In addition, I have participated in the preparation of various accounting 27

- 3 -
and filing exhibits for WPS Corp, UPPCO, MGUC, MERC, PGL and NSG for 1
presentation to the PSCW, MPSC, MPUC, Federal Energy Regulatory Commission 2
(“FERC”), and the ICC. 3

- 4 -
JOYLYN C. HOFFMAN MALUEG, CMA DIRECT TESTIMONY
PART II
Q. What is the purpose of your pre-filed direct testimony? 1
A. The purpose of my pre-filed direct testimony is to discuss and sponsor the class cost 2
of service studies (“COSS”) I completed for MGUC for the 2014 projected test year 3
and the 2012 historic test year. 4
5
Q. Are you sponsoring any exhibits in this proceeding? 6
A. Yes, I am. I am sponsoring: 7
1. Exhibit A-6 (JCHM-1), Schedules F1.1 through F1.11, and 8
2. Exhibit A-16 (JCHM-2), Schedules F1.1 through F1.7. 9
10
These exhibits are the COSS prepared for MGUC, along with associated allocation 11
methodologies, supplemental analyses, and data. The following testimony explains 12
these studies. 13
14
Q. Were these exhibits prepared by you or under your direction and supervision? 15
A. Yes, they were. 16
17
Q. Please describe Exhibit A-6 (JCHM-1), Schedules F1.1 through F1.11. 18
A. Schedule F1.1 contains the MGUC 2014 Projected COSS - General Summary as 19
required by the Commission’s Orders dated December 23, 2008 and February 20, 20
2009 issued in Case No. U-15895. 21
22
Schedule F1.2 contains the MGUC 2014 Projected COSS - Detailed Summary. 23
24

- 5 -
Schedule F1.3 contains the MGUC 2014 Projected COSS - Individual Rate Schedule 1
Revenue Requirement and Rate Base Components. 2
3
Schedule F1.4 contains the MGUC 2014 Projected COSS – Consumption Costs by 4
Billing Unit. 5
6
Schedule F1.5 contains the MGUC 2014 Projected COSS - Allocation Factors. 7
8
Schedule F1.6 contains the MGUC Account 380: Average Cost per Service Line 9
Foot Analysis, based upon 2012 historic test year data. 10
11
Schedule F1.7 contains the MGUC Account 381: Cost per Meter Analysis, based 12
upon 2012 historic test year data. 13
14
Schedule F1.8 contains the MGUC 2014 Projected COSS - Classification & 15
Functionalization of MGUC Costs and Investment. 16
17
Schedule F1.9 contains the MGUC 2014 Projected COSS – Translation of 18
Distribution O&M FERC Accounts to Plant Accounts. 19
20
Schedule F1.10 contains the MGUC Transmission Mains Zero-Intercept Regression 21
Analysis for FERC Account 367, based upon 2012 historic test year data. 22
23
Schedule F1.11 contains the MGUC Distribution Mains Zero-Intercept Regression 24
Analysis for FERC Account 376, based upon 2012 historic test year data. 25
26
27

- 6 -
Q. Please describe Exhibit A-16 (JCHM-2), Schedules F1.1 through F1.7. 1
A. Schedule F1.1 contains the MGUC 2012 Historical COSS - General Summary as 2
required by the Commission’s Orders dated December 23, 2008 and February 20, 3
2009 issued in Case No. U-15895. 4
5
Schedule F1.2 contains the MGUC 2012 Historical COSS - Detailed Summary. 6
7
Schedule F1.3 contains the MGUC 2012 Historical COSS - Individual Rate Schedule 8
Revenue Requirement and Rate Base Components. 9
10
Schedule F1.4 contains the MGUC 2012 Historical COSS – Consumption Costs by 11
Billing Unit. 12
13
Schedule F1.5 contains the MGUC 2012 Historical COSS - Allocation Factors. 14
15
Schedule F1.6 contains the MGUC 2012 Historical COSS - Classification & 16
Functionalization of MGUC Costs and Investment. 17
18
Schedule F1.7 contains the MGUC 2010 COSS – Translation of Distribution O&M 19
FERC Accounts to Plant Accounts. 20
21 General Information 22
Q. What is the purpose of a COSS? 23
A. The purpose of a COSS is to identify the revenues, costs and profitability for each 24
rate schedule. The results of the COSS provide the data necessary to design cost-25
based rates using an embedded cost methodology. 26
27
28

- 7 -
Q. How should a COSS be performed? 1
A. Cost causation is the fundamental principle applicable to all cost studies for purposes 2
of allocating costs to rate schedules. The most important theoretical principle 3
underlying a COSS is that cost incurrence should follow historical embedded cost 4
causation. The costs that customers become responsible to pay should be those 5
costs that the particular customers caused the utility to incur because of the 6
characteristics of the customers’ usage of utility service. By performing a COSS in 7
this manner, it can then be used in determining how costs should be recovered from 8
rate schedules through rate design. 9
10
Q. Please explain the procedures used to develop the COSS shown in the various 11
Schedules of Exs. A-6 (JCHM-1) and A-16 (JCHM-2). 12
A. In general, preparing a COSS involves three major steps: 13
a. Cost functionalization, 14
b. Cost classification; and 15
c. Cost allocation 16
of the utility’s system costs to the rate schedules. 17
18
The first step, cost functionalization, identifies and separates plant and expenses into 19
specific categories based on their purpose and various characteristics of utility 20
operation. Typically, these plant and expenses are functionalized by the FERC 21
Uniform System of Accounts (“USOA”). These accounts group plant and expenses 22
into their various functions, which for MGUC includes Production (which incorporates 23
Storage related items), Transmission, Distribution, and Customer. 24
25

- 8 -
Step two, cost classification, further separates the functionalized plant and expenses 1
into the categories based upon how they are incurred. These classifications consist 2
of: 3
1. Commodity related, which can be further broken down into the 4 subcategories of: 5
6 a. Purchased Gas Cost, and 7
8 b. Gas Supply Acquisition Cost, 9
10 2. Demand, or capacity related, which can be further broken down into the 11
subcategories of: 12 13
a. Production demand, 14 15
b. Storage demand, and 16 17
c. Distribution demand, and 18 19
3. Customer related, which can be further broken down into the 20 subcategories of: 21
22 a. Customer, and 23
24 b. Enhanced Services. 25
26
Commodity related costs are those costs that vary with the throughput sold to, or 27
transported for, customers. For example, included in the COSS are commodity 28
related costs such as other gas supplies expense. However, when, as is the case 29
with MGUC, a gas utility’s cost of gas is recovered through a one-for-one 30
mechanism, very little of its remaining delivery service cost structure is commodity 31
related. 32
33
Demand related costs are incurred to service the peak demand of the system. 34
Examples of costs classified as demand include manufactured gas clean-up costs, 35
structures and improvements, measuring and regulation equipment, and a portion of 36
transmission and distribution mains. 37
38

- 9 -
Customer related costs are incurred for a customer to be attached to the distribution 1
system, meter any gas usage, and maintain the customer’s account. Customer 2
related costs are found to vary with the number of customers, regardless of the 3
customers’ gas consumption. Examples of costs classified to the customer 4
classification include distribution services, meters, regulators, a portion of 5
transmission and distribution mains, and customer billing and accounting. 6
7
The final step of preparing a COSS is allocation of each functionalized and classified 8
cost element to the rate schedules. Costs that are classified to the commodity cost 9
element are typically allocated to rate schedules using an allocation factor based 10
upon the rate schedules’ gas usage, or throughput. Costs that are classified to the 11
demand cost element are typically allocated to rate schedules using an allocation 12
factor based upon the rate schedules’ demand imposed upon the system during 13
specific peak days. Costs that are classified to the customer cost element are 14
typically allocated to rate schedules using an allocation factor based upon customer 15
counts and, in some instances, customer counts that are weighted to reflect, for 16
example, differences in metering costs amongst rate schedules. 17
18
Q. Please explain the considerations relied upon in determining the cost 19
allocation methodologies that are used to perform a COSS. 20
A. As stated earlier, in order to allocate costs within any COSS, the factors that cause 21
the costs to be incurred must be identified and understood. Additionally, the cost 22
analyst needs to develop data in a form that is compatible with, and supportive of, 23
rate design proposals. The availability of data for use in developing alternative cost 24
allocation factors is also a consideration. In evaluating any cost allocation 25
methodology, appropriate consideration should be given to whether it provides a 26
sound rationale or theoretical basis, whether the results reflect cost causation and 27

- 10 -
are representative of the costs of serving different types of customers, as well as the 1
stability of the results over time. 2
3
Q. What is the source of the cost data analyzed in MGUC’s COSS? 4
A. All cost of service data have been extracted from MGUC’s revenue requirements and 5
rate base contained in the instant filing as shown in Ms. De Cramer’s Exs. A-1 (KAD-6
1), A-2 (KAD-2), A-3 (KAD-3), and associated workpapers for the 2014 projected test 7
year; and Ms. De Cramer’s Exs. A-11 (KAD-7), A-12 (KAD-8), A-13 (KAD-9) and 8
associated workpapers for the 2012 historic test year. Where more detailed 9
information was required to perform various supplementary analyses related to 10
certain plant and expense elements, the data was either taken directly from MGUC’s 11
various software systems, or derived from the historical books and records of MGUC. 12
13
Q. Does the COSS allocate costs to the rate schedules as defined in present 14
rates? 15
A. The COSS submitted for both the 2012 historic test year and the 2014 projected test 16
year in this proceeding are based upon rates that are currently in effect, or present 17
rates as they were referred to above. All values in the COSS are allocated to each 18
rate schedule utilizing the allocation method described in the column titled “Allocation 19
Factor”. Direct assignment of values to the appropriate rate schedules was 20
conducted whenever possible, as recommended by the American Gas Association 21
(“AGA”) in their Fourth Edition of Gas Rate Fundamentals (1987) (“AGA Gas Rate 22
Fundamentals”), page 140. 23
24
Q. Please describe how you defined the rate schedules in MGUC’s COSS. 25
A. The rate schedules that were utilized in the COSS follow the rate schedules under 26
which MGUC currently provides retail service in Michigan. 27

- 11 -
1
The rate schedules shown in the MGUC COSS consist of the following: 2
1. Residential, which includes residential heating, general, and lighting, 3 4
2. Multi-Family, which is split into separate cost of service for Meter Classes 5 I, II, III and IV, 6
7 3. Small General Service, which includes commercial lighting, 8
9 4. Large General Service, 10
11 5. Transportation – TR-1, 12
13 6. Transportation – TR-2, 14
15 7. Transportation – TR-3, 16
17 8. Customer Choice – Residential, 18
19 9. Customer Choice – Small General Service, 20
21 10. Customer Choice – Large General Service, 22
23 11. Customer Choice – Multi-Family, which is split into separate cost of 24
service for Meter Classes I, II, III and IV, 25 26
12. Aggregated Transportation – Residential, 27 28
13. Aggregated Transportation – Small General Service, 29 30
14. Aggregated Transportation – Large General Service, and 31 32
15. Special Contract, which consists of one customer who is currently served 33 by MGUC under the terms of a special contract. This customer’s rates 34 cannot be changed in a general rate case proceeding; therefore, I show 35 them in a separate column solely to segregate their revenues and 36 associated costs. 37
38
Q. Did you make any changes to the classes of service included in the COSS you 39
prepared for the instant general rate case compared to the cost study 40
submitted in MGUC’s last general rate case proceeding in Case No. U-15990? 41
A. Yes, I made one change. Since MGUC’s last rate case in Case No. U-15990, there 42
have been a number of customers who have moved from taking service under the 43
sales rate schedule Multi-Family to taking service under Customer Choice – Multi-44
Family. Therefore, the addition of this choice rate schedule, which is split into 45

- 12 -
separate cost of service for Meter Classes I, II, III and IV, has been made to the cost 1
study. 2
3
Q. Please describe MGUC’s approach in the development of its COSS. 4
A. As stated earlier, when describing the general procedures for preparing a COSS, 5
MGUC’s COSS attempts to associate costs with customers based on cost causation. 6
In some cases, there can be a direct association of costs to customers based on 7
causation. For example, some plant costs such as investment in meters and 8
services can be directly associated with the number of customers. In other cases, 9
causation can be based on a direct relationship between costs and some parameter 10
that can be related to customers. An example of this is gas supply acquisition costs, 11
which has a direct relationship to customers’ sales. Therefore, gas supply 12
acquisition costs are allocated to customers based on sales. Other costs may have 13
relationships to customer parameters that are not direct, but are significantly 14
influenced by those parameters. Distribution system costs fall into this category. 15
16
Q. How does MGUC allocate distribution costs to customers? 17
A. In the case of distribution costs, MGUC has identified two significant cost causation 18
relationships. Some distribution costs are incurred in order for customers to simply 19
be connected to the distribution system. Other distribution costs are incurred due to 20
the level of demand of customers. 21
22
Some gas distribution demand related costs are influenced by the sizing of facilities 23
based on the coincident consumption of gas on the distribution facilities. These 24
costs are allocated based on the weighted group peak demand. An example of 25
these costs would be Accounts 378 and 379, measuring and regulating station 26
equipment. 27

- 13 -
1
Other demand related costs of gas distribution facilities, such as Account 376, gas 2
mains, are influenced by both the coincident group demand and connection of the 3
customer to the distribution system. In the COSS, these costs were allocated to rate 4
schedules on both a weighted group peak demand, as well as customer count basis. 5
6
Q. Were there any special analyses conducted for purposes of allocating 7
distribution costs and plant investment? 8
A. Yes, there were. Regarding MGUC’s major plant accounts, customer weighting 9
factors were developed to allocate the following distribution plant accounts: 10
1. Account 380: Services, and 11
2. Account 381: Meters. 12
13
MGUC has also performed minimum distribution system studies comprised of the 14
zero-intercept method which identify the smallest distribution gas mains that would 15
be used to connect customers to the distribution system regardless of their gas 16
usage or demand. The costs needed to support the minimum distribution system 17
have a relationship to the number of customers and are allocated on that basis. The 18
costs in excess of the minimum system are related to the demand of customers and 19
are, therefore, allocated based on the customers’ demands. 20
21
Q. Please continue with how MGUC allocates distribution costs to customers. 22
A. Specifically, distribution costs are allocated within the COSS based on the following 23
methods: 24
1. Accounts 302 & 303 Intangible Plant, 374 Land and Land Rights, 375 25 Structures and Improvements, 378 Measuring & Regulation Equipment – 26 General, and Account 379 Measuring & Regulation Equipment – Gate Station 27 were allocated based on the weighted peak demand allocator. 28
29 2. Account 376 Gas Distribution Mains utilized a zero-intercept method based 30

- 14 -
on a regression of cost per foot versus pipe diameter squared. This analysis 1 is shown in Exhibit A-6 (JCHM-1), Schedule F1.11. The regression analysis 2 provided a split of system gas mains costs that are attributable to fixed costs 3 and demand related costs, showing 54% of the costs are attributable to 4 minimum system; the remaining 46% are attributable to customer demand. 5 Each of these categories was allocated based on customer counts and 6 weighted peak demand, respectively. 7
8 3. Account 380 Services was allocated on a customer basis, using a weighting 9
factor of Average Cost Per Foot for Services, which was derived from service 10 installations, by associated meter size, to be performed in the historic year 11 ending December 31, 2012. 12
13 4. Account 381 Meters was allocated on a customer basis, using a weighting 14
factor of Cost Per Meter, which was based on actual plant investment as of 15 December 31, 2012, by rate schedule, as adjusted to current cost using the 16 Handy-Whitman Index. 17
18 5. Account 383 House Regulators was allocated based on customer counts. 19
20 6. Account 385 Industrial Metering & Regulating Station Equipment was 21
allocated based on the weighted peak demand of industrial sized customers 22 only. 23
24
Q. How does the COSS allocate distribution related Operation and Maintenance 25
(“O&M”) expenses? 26
A. In general, these expenses should be allocated in the same manner as how the 27
distribution plant investment costs are allocated, as stated above. A gas utility’s 28
distribution related O&M expenses generally are thought to support the utility’s 29
corresponding plant-in-service accounts. In order to allocate distribution O&M costs 30
in a similar manner as the distribution plant investment, a translation was performed 31
to convert the FERC O&M Distribution Accounts 870 through 894 to FERC Plant 32
Distribution Accounts 302/303, and 374 through 386. The computations involved in 33
this translation can be found in Exhibit A-6 (JCHM-1), Schedule F1.9 and ExhibitA-16 34
(JCHM-2), Schedule F1.7 for the projected 2014 test year and historic 2012 test 35
year, respectively. A summary of the translation can be found in the table below: 36
37

- 15 -
1
O&M Distribution Account Translated to: Distribution Plant Account
Account 870: Supervisory & Engineering
Accounts 302/303, and 374-386 on the basis of Distribution Plant Investment in Accounts 302/303, and 374-386
Account 871: Load Dispatch Account 880: Other Account 881: Rents Account 885: Supervisory & Engineering
Account 874: Mains & Services Expense
Accounts 376 and 380, on the basis of Distribution Plant Investment in Accounts 376 and 380, which are Mains and Services
Account 877: Measuring & Regulating Expense-Gate Station
Account 379, Measuring & Regulation Equipment-Gate Station
Account 878: Meter & House Regulators Accounts 381.0, 381.2, 381.3, 383 and 385, on the basis of Distribution Plant Investment in Accounts 381.0, 381.2, 381.3, 383 and 385 which are all Metering and Regulator related
Account 879: Customer Installations Account 893: Meter & House Regulators Account 886: Structures & Improvements Account 375: Structures & Improvements Account 889: Measuring & Regulating Expense-General
Account 378: Measuring & Regulation Equipment - General
Account 892: Services Account 380: Services
2
Q. How does MGUC allocate production costs and investment to each rate 3
schedule? 4
A. MGUC first classifies production costs and investment within the appropriate 5
categories of Commodity or Demand. The Commodity classification is further 6
detailed into sub-categories of Purchased Gas Cost or Gas Supply Acquisition, and 7
Demand classified production costs and investment is further detailed into sub-8
categories of either Production Demand or Storage Demand. 9
10
The only production costs that are classified to Purchased Gas Cost are the costs of 11
gas sold which are recovered via MGUC’s Gas Cost Recovery (“GCR”) plan. These 12
Purchased Gas Costs are either direct assigned to the rate schedules, or allocated to 13
the rate schedules based upon gas usage, or sales. 14
15

- 16 -
The only production costs that are classified to Production Demand are O&M 1
expenses relating to Manufactured Gas Plant Clean-up in the FERC Account Series 2
710-742. This Production Demand classified item is allocated to the rate schedules 3
based upon Weighted Peak Demand. 4
5
The production costs and investment that are classified to Storage Demand are 6
costs relating to Underground Storage in the FERC Account Series 350-357 and 7
814-842. These Storage Demand classified items are allocated to the rate 8
schedules based upon the Storage allocation methodology. 9
10
Any remaining production costs are classified to either Gas Supply Acquisition or 11
Production Demand, and are costs relating to Natural Gas Production & Gathering, 12
Non-GCR related Gas Purchases, and Other Gas Supplies Expense. These items 13
are then allocated to the rate schedules based upon the respective allocation 14
method: either gas usage, or sales, for Gas Supply Acquisition classified costs, or 15
weighted peak demand for Production Demand classified costs. 16
17
Q. How does MGUC allocate transmission costs and investment to each rate 18
schedule? 19
A. The majority of the investment that is functionalized to Transmission for MGUC are 20
related to transmission mains in Account 367, while the O&M costs functionalized to 21
Transmission are mainly non-transmission main items such as Operational 22
Supervision and Engineering, and Measuring and Regulating Stations and 23
Equipment. Given this, Transmission costs and investment related to transmission 24
mains, which are Accounts 367,856, and 863, are first classified to the demand and 25
customer classifications based upon a zero intercept regression analysis of cost per 26
foot of transmission main versus pipe diameter squared. The regression analysis 27

- 17 -
provided a percentage of the system transmission mains that are attributable to fixed 1
costs, which is 58%, and the remaining percentage, 42%, is assumed to be 2
attributable to customer demand. The fixed costs and demand related costs are then 3
allocated to the rate schedules based on throughput and weighted peak demand, 4
respectively. Classifying and allocating transmission costs in this manner is reflected 5
in the AGA Gas Rate Fundamentals, as discussed at pages 197 – 201, and as 6
shown within the tables presented on pages 138 and 142. 7
8
The investment and costs functionalized to Transmission that are not main related 9
were classified to demand and allocated to the rate schedules on the basis of 10
weighted peak demand. 11
12
Q. How does MGUC allocate customer costs to each rate schedule? 13
A. In general, customer costs are allocated based on total customer counts by rate 14
schedule. 15
16
Costs that could be directly related to transportation customers were identified and 17
allocated directly to those customers based on a specific transport customer 18
allocator. The allocator for transportation costs is shown on Exhibit A-6 (JCHM-1), 19
Schedule F1.5 for the 2014 projected test year, and Exhibit A-16 (JCHM-2), 20
Schedule F1.5 for the 2012 historic test year. 21
22
With respect to customer costs in Account 904 Uncollectibles, as well as Customer 23
Services costs in Accounts 907-910, the costs are allocated based on margin 24
revenue by rate schedule. 25
26
27

- 18 -
Q. How does MGUC allocate Administrative and General (“A&G”) costs to each 1
rate schedule? 2
A. First, a piece of Administrative and General (“A&G”) costs are directly allocated to 3
transportation customers based upon a proportional split of transport direct assigned 4
O&M Customer Accounts Expense to Total Distribution & Customer related O&M 5
Expense (excluding any direct assigned costs). Once the transportation direct 6
assigned piece of A&G is calculated, the remaining A&G is functionalized to 7
Production, Distribution, Transmission, Storage and Customer functions according to 8
Salaries and Wages, which can be found in Exhibit A-6 (JCHM-1), Schedule F1.5 for 9
the 2014 projected test year, and Exhibit A-16 (JCHM-2), Schedule F1.5 for the 2012 10
historic test year. 11
12
Next, the functionalized costs are classified to Commodity, Demand or Customer. 13
The Production function was further sub-categorized between Gas Supply 14
Acquisition and Production Demand based upon the percentage of Production O&M 15
costs, as shown on line 14 of page 5 of Exhibit A-6 (JCHM-1), Schedule F1.8 for the 16
2014 projected test year, and Exhibit A-16 (JCHM-2), Schedule F1.6 for the historic 17
2012 test year. The Distribution function was further sub-categorized between 18
Distribution Demand and Customer based upon the percentage of Distribution O&M 19
costs, as shown on line 36 of page 5 of Exhibit A-6 (JCHM-1), Schedule F1.8 for the 20
2014 projected test year, and Exhibit A-16 (JCHM-2), Schedule F1.6 for the historic 21
2012 test year. The Transmission function was further sub-categorized between 22
Distribution Demand and Customer based upon the percentage of Transmission 23
O&M costs, as shown on line 20 of page 5 of Exhibit A-6 (JCHM-1), Schedule F1.8 24
for the 2014 projected test year, and Exhibit A-16 (JCHM-2), Schedule F1.6 for the 25
historic 2012 test year. 26
27

- 19 -
Once functionalized, the costs are then allocated to rate schedules based upon the 1
respective allocation methodology. Gas Supply Acquisition and Production Demand 2
related A&G were allocated to the rate schedules based upon the Sales and 3
Weighted Peak Demand allocation methods, respectively. Storage related A&G was 4
allocated to the rate schedules based upon the Storage allocation method. 5
Distribution Demand related A&G was allocated to the rate schedules based upon 6
the Distribution O&M Demand Related allocation method, which is created on pages 7
5 and 6 of Exhibit A-6 (JCHM-1), Schedule F1.2 for the 2014 projected test year, and 8
pages 5 and 6 of Exhibit A-16 (JCHM-2), Schedule F1.2 for the 2012 historic test 9
year. Customer related A&G was allocated to the rate schedules based upon the 10
Customer O&M allocation method, which is created on pages 5 and 6 of Exhibit A-6 11
(JCHM-1), Schedule F1.2 for the 2014 projected test year, and pages 5 and 6 of 12
Exhibit A-16 (JCHM-2), Schedule F1.2 for the 2012 historic test year. The direct-13
assigned portion of A&G that is attributable to transportation customers were 14
allocated based upon the Transportation Customers allocation methodology. 15
16
Q. Please describe the remaining components of the MGUC COSS that have 17
unique allocators and why these unique allocators are appropriate. 18
A. The remaining components of the cost of service which have unique allocators are 19
as follows: 20
1. Income Taxes, Taxes other than Income Taxes (“TOTIT”) associated with 21 Real Estate & Property, Franchise Tax Fees, State Unitary Fees, Use Tax, 22 Unauthorized Insurance Tax, and Federal Excise Tax, and Miscellaneous 23 Revenues in Account 493 and Illinois Tax Fees in Account 495 were 24 allocated to the rate schedules based upon a rate base allocator, which was 25 created on pages 1 and 2 of Exhibit A-6 (JCHM-1), Schedule F1.2 for the 26 2014 projected test year and pages 1 and 2 of Exhibit A-16 (JCHM-2), 27 Schedule F1.2 for the 2012 historic test year. The Rate Base allocator was 28 utilized because these items follow cost-causation theory from various Rate 29 Base investments. 30
31 2. TOTIT relating to Unemployment Compensation, IBS Payroll Tax, and 32
Retirement Benefits are allocated to the rate schedules based upon a 33 salaries and wages allocator, which can be found in Exhibit A-6 (JCHM-1), 34

- 20 -
Schedule F1.5 for 2014 projected test year, and Exhibit A-16 (JCHM-2), 1 Schedule F1.5 for the 2012 historic test year. The Salaries & Wages 2 allocator was utilized because these TOTIT items are payroll related and, 3 therefore, follow cost-causation theory. 4
5 3. Miscellaneous Revenues in Account 487 attributable to Late Payments is 6
allocated on the basis of Margin Revenue. The Margin Revenue allocator 7 was utilized because the amounts booked to this account are based upon a 8 percentage of customers’ total unpaid bill balances. 9
10 4. Miscellaneous Revenues in Account 495 attributable to the Uncollectible 11
Expense Tracking Mechanism is direct assigned to the rate schedules. 12 13
5. Miscellaneous Revenues in Account 495 attributable to Revenue Decoupling 14 is partially allocated on the basis of Throughput of three separate customer 15 categories: Residential, Small General Services and Small Multi-Family, and 16 Large Multi-Family. The respective allocation methodologies are: Thru-put – 17 Residential, Thru-put – Small GS & MF, and Thru-put – Large MF. The 18 respective Throughput allocation methodologies of these three separate 19 customer categorizes were utilized because Decoupling Revenues are 20 attributable to the Revenue Stability Mechanism, which is based upon a 21 function of gas use and the credit/surcharge of the Revenue Stability 22 Mechanism is recovered through rate design based upon usage. The 23 remaining portion of the Revenue Decoupling is direct assigned based upon 24 the reconciliation process. 25
26
Natural Gas COSS for the 2012 Projected Test Year 27 Q. Please describe Exhibit A-6 (JCHM-1), Schedule F1.1. 28
A. As required by the Commission’s Orders dated December 23, 2008 and February 29
20, 2009 issued in Case No. U-15895, Schedule F1.1 is a summary of the COSS 30
results for MGUC for the 2014 projected test year. Each page summarizes the 31
various components of the operating income and rate base to the rate schedules. 32
Additionally, each page provides the revenue deficiency and revenue requirement by 33
rate schedule. Schedule F1.1 consists of 4 pages. 34
35
Q. Please describe Exhibit A-6 (JCHM-1), Schedule F1.2. 36
A. Schedule F1.2 is a detailed summary of the COSS results for MGUC for the 2014 37
projected test year. Within Schedule F1.2, each rate schedule is presented in a side-38
by-side, columnar format with the details of each component of operating income 39
and rate base presented, and the allocation methodology that was used to allocate 40

- 21 -
the costs and plant investment are provided in Column [B] of each page. Schedule 1
F1.2 consists of 20 pages. 2
3
Pages 1 and 2 summarize the various components of the operating income and rate 4
base to the rate schedules served by MGUC for the 2014 projected test year. Line 5
40 of pages 1 and 2 shows the Rate of Return resulting from the projected results of 6
operation. Line 52 of pages 1 and 2 shows the revenue deficiency by rate schedule 7
based on a proposed rate of return of 10.75%, which is supported in the pre-filed 8
direct testimony of Mr. Paul R. Moul. Line 56 of pages 1 and 2 shows the revenue 9
deficiency by rate schedule excluding cost of gas. Pages 1 and 2 also include the 10
creation of the allocation methodology for Rate Base, which is used throughout other 11
pages of the COSS. 12
13
Pages 3 and 4 contain the Operating Revenues for MGUC based on the rates 14
authorized in MGUC’s last general rate case in Case No. U-15990. Pages 3 and 4 15
also include the creation of the allocation methodology for Margin Revenue, which is 16
used throughout other pages of the COSS. 17
18
Pages 5 and 6 contain the Allocation of O&M Expense, including A&G expense, for 19
MGUC. Pages 5 and 6 also include the creation of the Distribution O&M Demand 20
Related and Customer O&M allocation methodologies, which are used to allocate 21
certain A&G expenses to the rate schedules, as shown on the same pages. 22
23
Pages 7 and 8 contain the Allocation of Depreciation Expense, including 24
Amortization Expense, with General expenses apportioned, for MGUC. For the 2014 25
projected test year, there was no Amortization Expense. 26
27

- 22 -
Pages 9 and 10 contain the Allocation of Taxes Other Than Income Taxes for 1
MGUC. 2
3
Pages 11 and 12 contain the Allocation of Other Income and Adjustments, both 4
Before and After Income Taxes, for MGUC. For the 2014 projected test year, there 5
were no Other Income and Adjustments. 6
7
Pages 13 and 14 contain the Allocation of the rate base component Plant-in-Service, 8
with General investment apportioned, for MGUC. 9
10
Pages 15 and 16 contain the Allocation of the rate base component Accumulated 11
Depreciation – Straight Line, with General investment apportioned, for MGUC. 12
13
Pages 17 and 18 contain the Allocation of the rate base component Construction 14
Work in Progress (“CWIP”), with General investment apportioned, for MGUC. 15
16
Pages 19 and 20 contain the Allocation of Other Rate Base Components, such as 17
Gas Stored Underground, Materials & Supplies, Working Capital, Prepayments, 18
Cash & Bank Balances, and Accrued Taxes for MGUC. 19
20
Q. Please describe Exhibit A-6 (JCHM-1), Schedule F1.3. 21
A. Schedule F1.3 contains the functionalized and classified revenue requirements and 22
rate base for each of the rate schedules in MGUC’s service territory. There is one 23
page of information for each rate schedule or special contract customer. Schedule 24
F1.3 consists of 21 pages. 25
26
27

- 23 -
Q. Please describe Exhibit A-6 (JCHM-1), Schedule F1.4. 1
A. Schedule F1.4 consists of three pages and contains the cost of service for MGUC 2
rate schedules by consumption unit, or billing unit. 3
4
Page 1 of Schedule F1.4 is a summary of all the billing unit costs by rate schedule, 5
broken down into the billing units of Fixed Charge, Enhanced Administrative Charge, 6
Local Volumetric Rate, Storage Rate, and Gas Supply Acquisition Rate. The column 7
titled Total Monthly Fixed Charge is the summation of the Fixed Charge and 8
Enhanced Administrative Charge for each rate schedule. The column titled Total Mcf 9
Rate is the summation of the Local Volumetric Rate, the Storage Rate, and Gas 10
Supply Acquisition Rate for each rate schedule. 11
12
Page 2 of Schedule F1.4 shows the creation of the Local Volumetric Rate, the 13
Storage Rate, and Gas Supply Acquisition Rate for each of the rate schedules. The 14
Mcf Throughput and Sales values shown in Columns [B] and [G], respectively, were 15
taken from Exhibit A-6 (JCHM-1), Schedule F1.5, pages 1 and 2. The Demand 16
Costs, Storage Costs, and Gas Supply Acquisition Costs shown in Columns [C], [E], 17
and [H], respectively, were taken from the respective columns of Exhibit A-6 (JCHM-18
1), Schedule F1.3 on each of the pages for the rate schedules. 19
20
Page 3 of Schedule F1.4 shows the creation of the Fixed Charge and Enhanced 21
Administrative Charge for each of the rate schedules. Customer Counts were taken 22
from Exhibit A-6 (JCHM-1), Schedule F1.5, pages 3 and 4. The Customer Costs and 23
Enhanced Administrative Costs shown in Columns [C] and [E], respectively, were 24
taken from the respective columns of Exhibit A-6 (JCHM-1), Schedule F1.3 on each 25
of the pages for the rate schedules. 26
27

- 24 -
Q. Please describe Exhibit A-6 (JCHM-1), Schedule F1.5. 1
A. Schedule F1.5 contains a summary of the majority of the allocation methodologies 2
used within the COSS shown in my Exhibit A-6 (JCHM-1), Schedule F1.2. Schedule 3
F1.5 consists of 4 pages. 4
5
Pages 1 and 2 show the development of the following allocation factors: 6
1. The Group Demand allocation, which consists of the monthly peak of 7 each rate schedule (group), including transportation, to simulate 8 distribution system peaking (based on the highest one month of demand 9 for each group). 10
11 2. The Weighted Peak Demand allocation, which consists of the group 12
demand for each rate schedule, including transportation, and weighting 13 those demands based on annual Mcf throughput, 14
15 3. The Sales allocation, which is the sales of all customers, not including 16
transportation sales, 17 18
4. The Mcf Throughput allocation, which is the sales of all customers, 19 including transportation sales, 20
21 5. The Throughput – Residential allocation, which is the throughput of all 22
residential customers, including customer choice and aggregated 23 transportation, 24
25 6. The Throughput – Small General Service and Small Multi-Family 26
allocation, which is the throughput of all small general service and small 27 multi-family customers (i.e. classes I and II), including customer choice 28 and aggregated transportation, 29
30 7. The Throughput – Large Multi-Family allocation, which is the throughput 31
of all large multi-family customers (i.e. classes III and IV), including 32 customer choice, 33
34 8. The Storage allocation, which is based on a 50/50 weighting of group 35
peak demand and storage capacity. The storage capacity is equal to the 36 sum of the transportation customer’s Authorized Tolerance Limits 37 (“ATL’s”) and the amount that can be withdrawn for GCR customers, 38 including customer choice and aggregated transport. 39
40 9. The Customer allocation factor, which is based on total annual bill counts. 41
42 43 Pages 3 and 4 show the development of the following allocation factors: 44
1. The allocation factor for Account 380: Services, which is based on 45 average bill counts and utilizes an Average Cost Per Foot for Services 46 weighting factor, 47

- 25 -
1 2. The allocation factor for Account 381: Meters, which is based on average 2
customer counts and utilizes a Cost Per Customer for Meters weighting 3 factor, 4
5 3. Transport Customers allocation factor, which is based on the total yearly 6
customer counts for transportation customers, 7 8
4. The allocation factor for Account 385, which is based on the Weighted 9 Peak Demand allocator for Industrial size customers, 10
11 5. The Salaries and Wages functional allocation factor, and 12
13 6. The Salaries and Wages rate schedule allocation factor. 14
15 16 Q. Can you please explain the significance of Column [M] labeled “Source or 17
Allocation Factor” on each page of Schedule F1.5 of Exhibit A-6 (JCHM-1)? 18
A. Column [M], labeled “Source or Allocation Factor”, represents the name that was 19
given to each of the specific allocators created within Schedule F1.5. Each of these 20
names shown in the “Source or Allocation Factor” column is what is used throughout 21
the COSS in Exhibit A-6 (JCHM-1), Schedule F1.2 when referencing the allocation 22
methodology that was used to allocate costs to the rate schedules. 23
24
Q. Please describe Exhibit A-6 (JCHM-1), Schedule F1.6. 25
A. Schedule F1.6 consists of one page and contains the analysis behind the creation of 26
the Average Cost per Foot per Customer for Services weighting factor utilized in the 27
creation of the Services allocation factor. The data is based upon estimated service 28
project costs by meter class for the 2012 historical year. 29
30
Q. Please describe Exhibit A-6 (JCHM-1), Schedule F1.7. 31
A. Schedule F1.7 consists of one page and contains the analysis behind the creation of 32
the Cost per Customer for Meters weighting factor utilized in the creation of the 33
Meters allocation factor. The data is based upon actual plant investment by rate 34
schedule as of December 31, 2012 adjusted to current cost utilizing Handy Whitman 35

- 26 -
data. 1
2
Q. Please describe Exhibit A-6 (JCHM-1), Schedule F1.8. 3
A. Schedule F1.8 contains the classification and functionalization of MGUC data for the 4
2014 projected test year. Schedule F1.8 consists of five pages. 5
6
Page 1 contains a detailed breakdown of the classification and functionalization of 7
Plant-in-Service, with General investment apportioned. This page also portrays the 8
classification and functionalization of transmission and distribution mains to the 9
Customer and Demand functions based upon the results of the zero-intercept 10
regression analyses portrayed in Exhibit A-6 (JCHM-1), Schedule F1.10 and 11
Schedule F1.11, respectively. All of the classified and functionalized values shown 12
on this page are utilized and allocated to the rate schedules as shown in Exhibit A-6 13
(JCHM-1), Schedule F1.2, pages 13 and 14. Also shown on Page 1, line 45, is the 14
percentage breakdown of Transmission and Distribution Plant-in-Service classified to 15
Demand and Customer. These percentages are utilized to classify the Materials & 16
Supplies component of Rate Base, as shown on Exhibit A-6 (JCHM-1), Schedule 17
F1.2, pages 19 and 20. 18
19
Page 2 contains a detailed breakdown of the classification and functionalization of 20
Accumulated Depreciation – Straight Line, with General investment apportioned. 21
This page also portrays the classification and functionalization of transmission and 22
distribution mains to the Customer and Demand functions based upon the results of 23
the zero-intercept regression analyses portrayed in Exhibit A-6 (JCHM-1), Schedule 24
F1.10 and Schedule F1.11, respectively. All of the classified and functionalized 25
values shown on this page are utilized and allocated to the rate schedules as shown 26
in Exhibit A-6 (JCHM-1), Schedule F1.2, pages 15 and 16. 27

- 27 -
1
Page 3 contains a detailed breakdown of the classification and functionalization of 2
CWIP, with General investment apportioned. This page also portrays the 3
classification and functionalization of transmission and distribution mains to the 4
Customer and Demand functions based upon the results of the zero-intercept 5
regression analyses portrayed in Exhibit A-6 (JCHM-1), Schedule F1.10 and 6
Schedule F1.11, respectively. All of the classified and functionalized values shown 7
on this page are utilized and allocated to the rate schedules as shown in Exhibit A-6 8
(JCHM-1), Schedule F1.2, pages 17 and 18. 9
10
Page 4 contains a detailed breakdown of the classification and functionalization of 11
Depreciation Expense, with General expense apportioned. This page also portrays 12
the classification and functionalization of transmission and distribution mains to the 13
Customer and Demand functions based upon the results of the zero-intercept 14
regression analyses portrayed in Exhibit A-6 (JCHM-1), Schedule F1.10 and 15
Schedule F1.11, respectively. All of the classified and functionalized values shown 16
on this page are utilized and allocated to the rate schedules as shown in Exhibit A-6 17
(JCHM-1), Schedule F1.2, pages 7 and 8. 18
19
Page 5 contains a detailed breakdown of the classification and functionalization of 20
O&M Expense, including A&G expense. This page also portrays the classification 21
and functionalization of transmission and distribution mains to the Customer and 22
Demand functions based upon the results of the zero-intercept regression analyses 23
portrayed in Exhibit A-6 (JCHM-1), Schedule F1.10 and Schedule F1.11, 24
respectively. All of the classified and functionalized values shown on this page are 25
utilized and allocated to the rate schedules as shown in Exhibit A-6 (JCHM-1), 26
Schedule F1.2, pages 5 and 6. Additionally, the classification percentages of the 27

- 28 -
Production function to sub-category classifications of Gas Supply Acquisition and 1
Production Demand, and the Transmission, Distribution and Customer functions to 2
the Demand and Customer classifications are created on this page. These 3
percentages are utilized to classify A&G Expense on the same page, as shown on 4
line 49. 5
6
Q. Please describe Exhibit A-6 (JCHM-1), Schedule F1.9. 7
A. Schedule F1.9 consists of one page and contains the computations behind the 8
translation of O&M FERC Distribution Accounts 870 through 894 to FERC Plant 9
Distribution Accounts 302/303, and 374 through 386 for MGUC for the 2014 10
projected test year. 11
12
Q. Please describe Schedule F1.10 and Schedule F1.11 of Exhibit A-6 (JCHM-1). 13
A. Schedule F1.10 contains the detail of the Transmission Mains Zero-Intercept study 14
and consists of 8 pages. Schedule F1.11 contains the detail of the Distribution 15
Mains Zero-Intercept study and consists of 20 pages. When conducting the Zero-16
Intercept studies, any outliers that were found were removed from the analysis. 17
18
Natural Gas COSS for the 2012 Historic Test Year 19 Q. Please describe Exhibit A-16 (JCHM-2), Schedule F1.1. 20
A. As required by the Commission’s Orders dated December 23, 2010 and February 21
20, 2009 issued in Case No. U-15895, Schedule F1.1 is a summary of the COSS 22
results for MGUC for the 2012 historic test year. Each page summarizes the various 23
components of operating income and rate base to rate schedules. Additionally, the 24
pages present the revenue deficiency and revenue requirement by rate schedule. 25
Schedule F1.1 consists of 4 pages. 26
27
28

- 29 -
Q. Please describe Exhibit A-16 (JCHM-2), Schedule F1.2. 1
A. Schedule F1.2 is a detailed summary of the COSS results for MGUC for the 2012 2
historic test year. Within Schedule F1.2, each rate schedule is presented in a side-3
by-side, columnar format, the details of each component of operating income and 4
rate base are presented, and the allocation methodology that was used to allocate 5
the costs and plant investment are provided in Column [B] of each page. Schedule 6
F1.2 consists of 20 pages. 7
8
Q. Do the 20 pages of the 2012 historic test year COSS shown in Schedule F1.2 of 9
Exhibit A-16 (JCHM-2) for MGUC follow the same layout as presented in 10
Schedule F1.2 of Exhibit A-6 (JCHM-1) for the 2014 projected test year? 11
A. Yes, they do. The only differences would be on Page 1, Line 40, which shows the 12
Index of Return resulting from historical operations. Also, Line 52 of pages 1 and 2 13
shows the revenue deficiency by rate schedule based upon the required rate of 14
return of 10.75%, which was authorized in MGUC’s last general rate case in Case 15
No. U-15990. 16
17
Q. Please describe Exhibit A-16 (JCHM-2), Schedule F1.3. 18
A. Schedule F1.3 contains a functionalized revenue requirement and rate base 19
allocation for each of the rate schedules in MGUC’s service territory for the 2012 20
historic test year. There is one page of information for each rate schedule and 21
special contract customer. Schedule F1.3 consists of 21 pages. 22
23
Q. Do the 21 pages of functionalized revenue requirement and rate base 24
allocation for each of the rate schedules for the 2012 historic test year shown 25
in schedule F1.3 of Exhibit A-16 (JCHM-2) for MGUC follow the same layout as 26
presented in Schedule F1.3 of Exhibit A-6 (JCHM-1) for the 2014 projected test 27

- 30 -
year? 1
A. Yes, they do. 2
3
Q. Please describe Exhibit A-16 (JCHM-2), Schedule F1.4. 4
A. Schedule F1.4 contains the cost of service for MGUC rate schedules by consumption 5
unit or billing unit for the 2012 historic test year, and consists of three pages. 6
7
Q. Do the three pages of consumption units for the 2012 historic test year shown 8
in Schedule F1.4 of Exhibit A-16 (JCHM-2) for MGUC follow the same layout as 9
presented in Schedule F1.4 of Exhibit A-6 (JCHM-1) for the 2014 projected test 10
year? 11
A. Yes, they do. 12
13
Q. Please describe Exhibit A-16 (JCHM-2), Schedule F1.5. 14
A. Schedule F1.5 contains the creation of allocation factors utilized in MGUC’s COSS 15
for the 2012 historic test year, and consists of four pages. 16
17
Q. Do the four pages of allocation factors the 2012 historic test year COSS shown 18
in Schedule F1.5 of Exhibit A-16 (JCHM-2) for MGUC follow the same layout as 19
presented in Schedule F1.5 of Exhibit A-6 (JCHM-1) for the 2014 projected test 20
year? 21
A. Yes, they do. 22
23
Q. Please describe Exhibit A-16 (JCHM-2), Schedule F1.6. 24
A. Schedule F1.6 contains the classification and functionalization of MGUC data for the 25
2012 historic test year. Schedule F1.6 consists of five pages. 26
27

- 31 -
Q. Do the five pages of classified and functionalized 2012 historic test year data 1
shown in Schedule F1.6 of Exhibit A-16 (JCHM-2) for MGUC follow the same 2
layout as presented in Schedule F1.8 of Exhibit A-6 (JCHM-1) for the 2014 3
projected test year? 4
A. Yes, they do. 5
6
Q. Please describe Exhibit A-16 (JCHM-2), Schedule F1.7. 7
A. Schedule F1.7 consists of one page and contains the computations behind the 8
translation of O&M FERC Distribution Accounts 870 through 894 to FERC Plant 9
Distribution Accounts 302/303, and 374 through 386 for MGUC for the 2012 historic 10
test year. 11
12
Conclusion 13 Q. Please summarize the results of the COSS for MGUC for the 2014 projected 14
test year. 15
A. As stated by MGUC witness, Ms. Katherine A. De Cramer, in her pre-filed direct 16
testimony, MGUC, overall, is showing a revenue deficiency (cost recovery shortfall) 17
of $8,036,820, or 6.01%, in the 2014 projected test year, which includes the cost of 18
gas. Removing the cost of gas, the revenue deficiency is 12.95% for MGUC, overall. 19
The results of the COSS with respect to revenue deficiency at present rates by rate 20
schedule based on the requested revenue requirement for MGUC are summarized 21
below: 22

- 32 -
1
MGUC Rate Schedule
Revenue Deficiency / (Surplus) $
(including gas
costs)
% (including gas costs)
% (excluding gas costs)
Residential 8,751,504 9.96% 25.78%
Multi-Family - Class I 9,463 6.52% 22.84%
Multi-Family - Class II -37,215 -4.91% -17.46%
Multi-Family - Class III -11,001 -5.38% -21.66%
Multi-Family - Class IV -15,691 -5.41% -23.63%
Small General Service -510,449 -2.33% -7.65%
Large General Service -134,284 -7.13% -34.94%
Transport - TR-1 -974,447 -40.45% -40.45%
Transport - TR-2 -314,274 -12.02% -12.02%
Transport - TR-3 101,830 6.05% 6.05%
Customer Choice - Residential 1,655,240 22.30% 22.30%
Customer Choice - Small GS -461,068 -10.41% -10.41%
Customer Choice - Large GS n/a n/a n/a
Customer Choice - Multi-Family - Class I 3,462 39.75% 39.75%
Customer Choice - Multi-Family - Class II -8,094 -24.24% -24.24%
Customer Choice - Multi-Family - Class III n/a n/a n/a
Customer Choice - Multi-Family - Class IV -18,310 -26.75% -26.75%
Agg Transport - Residential 22,494 157.89% 157.89%
Agg Transport - Small GS 107,813 5.83% 5.83%
Agg Transport - Large GS -16,271 -38.35% -38.35%
Special Contract -113,882 -90.84% -92.01% 2
Q. In your opinion, does the MGUC COSS provide a reasonable basis for 3
establishing rates in this case? 4
A. Yes, it does. The COSS for MGUC is a reasonable estimate of revenue 5
requirements by rate schedule, given the total revenue requirement, and supports 6

- 33 -
the rates requested in this case, as explained further in the pre-filed direct testimony 1
of Mr. David J. Tyler. 2
3
Q. Does this conclude your pre-filed direct testimony? 4
A. Yes, it does. 5

Mic
higa
n P
ublic
Ser
vice
Com
mis
sion
Mic
higa
n G
as U
tiliti
es C
orpo
ratio
nP
roje
cted
Cos
t of S
ervi
ce A
lloca
tion
Stu
dyP
roje
cted
Tes
t Yea
r End
ing
Dec
embe
r 31,
201
4
(A)
(B)
(C)
(D)
(E)
(F)
(G)
(H)
TOTA
LTO
TAL
TOTA
LLI
NE
SU
MM
AR
Y O
F O
PE
RA
TIN
G IN
CO
ME
,C
OR
PO
RA
TER
ETA
ILTO
TAL
SM
ALL
LAR
GE
TOTA
LS
PE
CIA
LN
O.
RA
TE B
AS
E A
ND
RA
TE O
F R
ETU
RN
MG
UJU
RIS
.R
ES
IDE
NTI
AL
CO
MM
ER
CIA
LC
OM
ME
RC
IAL
TRA
NS
PO
RT
CO
NTR
AC
T1
Ope
ratin
g R
even
ues:
2
Tarif
fed
Rev
enue
s13
3,75
7,46
713
3,75
7,46
789
,225
,968
21,9
46,6
221,
883,
203
20,5
76,3
0912
5,36
53
O
ther
Rev
enue
s1,
105,
000
1,10
5,00
074
0,75
713
4,55
19,
797
218,
928
966
4To
tal O
pera
ting
Rev
enue
s:13
4,86
2,46
713
4,86
2,46
789
,966
,725
22,0
81,1
731,
893,
000
20,7
95,2
3712
6,33
15
00
6O
pera
ting
Exp
ense
:0
07
O
pera
tion
& M
aint
enan
ce: C
ost o
f Gas
71,6
84,7
1671
,684
,716
54,9
07,5
6015
,276
,696
1,49
8,86
20
1,59
78
O
pera
tion
& M
aint
enan
ce: N
on-C
ost o
f Gas
37,5
18,0
5137
,518
,051
24,2
91,2
003,
019,
255
106,
699
10,0
90,5
6310
,334
9
Dep
reci
atio
n E
xpen
se -
S/L
9,77
9,65
19,
779,
651
6,10
5,07
882
2,43
328
,864
2,82
3,18
590
10
Tax
es o
ther
than
Inco
me
Tax
4,50
4,77
74,
504,
777
2,48
7,46
645
9,39
023
,316
1,53
4,53
471
11
LE
SS
: Inc
ome
& O
ther
Adj
's B
efor
e In
com
e Ta
x0
00
00
00
12
Inc
ome
Tax
2,80
4,95
12,
804,
951
1,57
1,01
928
7,97
114
,591
931,
318
5213
I
TC C
redi
t0
00
00
00
14
LE
SS
: In
com
e &
Oth
er A
dj's
Afte
r Inc
ome
Tax
00
00
00
015
Tota
l Ope
ratin
g E
xpen
se12
6,29
2,14
612
6,29
2,14
689
,362
,325
19,8
65,7
461,
672,
331
15,3
79,6
0012
,143
160
017
NE
T O
PE
RA
TIN
G IN
CO
ME
(Ret
urn)
8,57
0,32
18,
570,
321
604,
400
2,21
5,42
722
0,66
95,
415,
637
114,
188
18
AFU
DC
Allo
wan
ce0
00
00
00
19
Inco
me
Tax
Affe
ct o
f Int
. Allo
w fo
r Rat
emak
ing
(4,9
47)
(4,9
47)
(2,7
71)
(508
)(2
6)(1
,643
)(0
)20
AD
JUS
TED
NE
T O
PE
RA
TIN
G IN
CO
ME
8,56
5,37
48,
565,
374
601,
629
2,21
4,91
922
0,64
35,
413,
994
114,
188
210
022
00
23R
ATE
BA
SE
:0
024
Util
ity P
lant
in S
ervi
ce35
3,43
7,55
835
3,43
7,55
821
0,31
5,31
133
,454
,764
1,25
3,38
110
8,41
0,42
33,
678
25A
ccum
ulat
ed D
epre
ciat
ion
- S/L
(189
,078
,199
)(1
89,0
78,1
99)
(112
,613
,737
)(1
7,42
5,02
4)(6
78,1
26)
(58,
359,
433)
(1,8
80)
26C
onst
ruct
ion
Wor
k in
Pro
gres
s0
00
00
00
27
Net
Pla
nt in
Ser
vice
164,
359,
359
164,
359,
359
97,7
01,5
7416
,029
,741
575,
255
50,0
50,9
901,
799
280
029
Gas
Sto
red
Und
ergr
ound
:14
,976
,515
14,9
76,5
156,
976,
004
1,94
0,74
018
7,61
95,
871,
591
561
30Fu
el S
tock
00
00
00
031
Wor
king
Cap
ital A
llow
ance
32,5
91,1
0232
,591
,102
13,7
08,4
703,
848,
267
345,
596
14,6
87,2
371,
533
32M
ater
ials
& S
uppl
ies:
512,
219
512,
219
335,
430
35,6
001,
154
140,
028
333
Oth
er -
Def
erre
d Ta
xes
(M&
S /
CW
IP)
00
00
00
034
Pre
paym
ents
527,
688
527,
688
223,
297
65,9
893,
921
234,
475
435
Cas
h &
Ban
k B
alan
ces
189,
780
189,
780
80,0
7223
,710
1,38
084
,618
136
Pro
perty
, Pay
roll
& In
com
e Ta
xes
Acc
rued
:(2
,663
,522
)(2
,663
,522
)(1
,130
,169
)(3
33,6
92)
(20,
002)
(1,1
79,6
36)
(24)
37TO
TAL
RA
TE B
AS
E21
0,49
3,14
121
0,49
3,14
111
7,89
4,67
721
,610
,355
1,09
4,92
469
,889
,303
3,87
738 39 40
PE
RC
EN
T R
ATE
OF
RE
TUR
N4.
0715
%4.
0715
%0.
5127
%10
.251
7%20
.153
8%7.
7489
%29
45.6
378%
41 42R
equi
red
Rat
e of
Ret
urn
6.40
20%
6.40
20%
6.40
20%
6.40
20%
6.40
20%
6.40
20%
6.40
20%
43 44R
equi
red
Ret
urn
13,4
75,7
5413
,475
,754
7,54
7,60
81,
383,
493
70,0
974,
474,
308
248
45
(R
equi
red
Ret
urn
% *
Rat
e B
ase)
46R
etur
n In
com
e D
efic
ienc
y4,
910,
380
4,91
0,38
0
6,94
5,97
8
(8
31,4
26)
(150
,546
)
(939
,687
)
(1
13,9
40)
47
(R
equi
red
Ret
- A
dj O
pera
ting
Inco
me)
48In
com
e Ta
x R
ate
0.63
67
0.
6367
0.63
67
0.63
67
0.63
67
0.
6367
0.
6367
49 50
Add
ition
al In
com
e Ta
x on
Ret
urn
Def
.3,
126,
439
3,12
6,43
9
1,75
1,08
132
0,97
716
,263
1,03
8,06
158
51
(In
com
e D
efic
ienc
y *
Tax
Fact
or)
52R
even
ue D
efic
ienc
y8,
036,
820
8,03
6,82
0
8,69
7,05
8
(5
10,4
49)
(134
,284
)
98,3
74
(113
,882
)
53 54
Rev
enue
Def
icie
ncy
%6.
01%
6.01
%9.
75%
-2.3
3%-7
.13%
0.48
%-9
0.84
%55
(Rev
enue
Def
/ Ta
riffe
d R
even
ues)
56R
even
ue D
efic
ienc
y %
(With
out C
ost o
f Gas
)12
.95%
12.9
5%25
.34%
-7.6
5%-3
4.94
%0.
48%
-92.
01%
57
(D
istri
butio
n M
argi
n O
nly)
May
not
cro
ss-c
heck
due
to R
ound
ing
Case No. U-17273 Witness: J.C. Hoffman Malueg
Exhibit A-6 (JCHM-1) Schedule F1.1
Page 1 of 4

Michigan Public Service CommissionMichigan Gas Utilities CorporationProjected Cost of Service Allocation StudyProjected Test Year Ending December 31, 2014
Individual Rate Schedule Detail
(A) (B) (C) (D) (E) (F) (G) (H) (I)
MF-I MF-II MF-III MF-IV GS-Small TOTALLINE SUMMARY OF OPERATING INCOME, Multi-Family Multi-Family Multi-Family Multi-Family TOTAL General Service SMALLNO. RATE BASE AND RATE OF RETURN Residential Class I Class II Class III Class IV RESIDENTIAL Small COMMERCIAL
1 Operating Revenues:2 Tariffed Revenues 87,828,772 145,170 757,241 204,544 290,241 89,225,968 21,946,622 21,946,6223 Other Revenues 732,584 1,016 4,489 1,120 1,548 740,757 134,551 134,5514 Total Operating Revenues: 88,561,356 146,186 761,730 205,664 291,789 89,966,725 22,081,173 22,081,17356 Operating Expense:7 Operation & Maintenance: Cost of Gas 53,882,128 103,746 544,109 153,745 223,832 54,907,560 15,276,696 15,276,6968 Operation & Maintenance: Non-Cost of Gas 24,137,298 27,379 86,380 18,055 22,089 24,291,200 3,019,255 3,019,2559 Depreciation Expense - S/L 6,062,371 7,191 23,591 5,276 6,649 6,105,078 822,433 822,43310 Taxes other than Income Tax 2,462,247 3,320 13,733 3,460 4,706 2,487,466 459,390 459,39011 LESS: Income & Other Adj's Before Income Tax 0 0 0 0 0 0 0 012 Income Tax 1,556,040 2,025 8,193 2,041 2,720 1,571,019 287,971 287,97113 ITC Credit 0 0 0 0 0 0 0 014 LESS: Income & Other Adj's After Income Tax 0 0 0 0 0 0 0 015 Total Operating Expense 88,100,085 143,660 676,006 182,578 259,996 89,362,325 19,865,746 19,865,7461617 NET OPERATING INCOME (Return) 461,271 2,525 85,724 23,086 31,793 604,400 2,215,427 2,215,42718 AFUDC Allowance 0 0 0 0 0 0 0 019 Income Tax Affect of Int. Allow for Ratemaking (2,744) (4) (14) (4) (5) (2,771) (508) (508)20 ADJUSTED NET OPERATING INCOME 458,526 2,522 85,710 23,083 31,788 601,629 2,214,919 2,214,919212223 RATE BASE:24 Utility Plant in Service 208,636,928 254,122 928,687 220,540 275,033 210,315,311 33,454,764 33,454,76425 Accumulated Depreciation - S/L (111,713,373) (137,277) (496,543) (117,470) (149,073) (112,613,737) (17,425,024) (17,425,024)26 Construction Work in Progress 0 0 0 0 0 0 0 027 Net Plant in Service 96,923,556 116,845 432,144 103,070 125,960 97,701,574 16,029,741 16,029,7412829 Gas Stored Underground: 6,852,380 12,517 65,352 18,129 27,626 6,976,004 1,940,740 1,940,74030 Fuel Stock 0 0 0 0 0 0 0 031 Working Capital Allowance 13,471,866 23,756 124,883 34,196 53,770 13,708,470 3,848,267 3,848,26732 Materials & Supplies: 333,374 391 1,131 229 305 335,430 35,600 35,60033 Other - Deferred Taxes (M&S / CWIP) 0 0 0 0 0 0 0 034 Prepayments 218,901 421 2,346 662 966 223,297 65,989 65,98935 Cash & Bank Balances 78,489 152 845 238 348 80,072 23,710 23,71036 Property, Payroll & Income Taxes Accrued: (1,107,959) (2,128) (11,853) (3,347) (4,883) (1,130,169) (333,692) (333,692)37 TOTAL RATE BASE 116,770,608 151,953 614,848 153,178 204,091 117,894,677 21,610,355 21,610,355383940 PERCENT RATE OF RETURN 0.3950% 1.6620% 13.9424% 15.0717% 15.5780% 0.3950% 10.2517% 10.2517%4142 Required Rate of Return 6.4020% 6.4020% 6.4020% 6.4020% 6.4020% 6.4020% 6.4020% 6.4020%4344 Required Return 7,475,645 9,728 39,362 9,806 13,066 7,547,608 1,383,493 1,383,49345 (Required Return % * Rate Base)46 Return Income Deficiency 7,017,119 7,206 (46,348) (13,276) (18,723) 6,945,978 (831,426) (831,426) 47 (Required Ret - Adj Operating Income)48 Income Tax Rate 0.6367 0.6367 0.6367 0.6367 0.6367 0.6367 0.6367 0.6367 4950 Additional Income Tax on Return Def. 1,734,385 2,257 9,132 2,275 3,031 1,751,081 320,977 320,977 51 (Income Deficiency * Tax Factor)52 Revenue Deficiency 8,751,504 9,463 (37,215) (11,001) (15,691) 8,697,059 (510,449) (510,449) 5354 Revenue Deficiency % 9.96% 6.52% -4.91% -5.38% -5.41% 9.75% -2.33% -2.33%55 (Revenue Def / Tariffed Revenues)56 Revenue Deficiency % (Without Cost of Gas) 25.78% 22.84% -17.46% -21.66% -23.63% 25.34% -7.65% -7.65%57 (Distribution Margin Only)
May not cross-check due to Rounding
Case No. U-17273 Witness: J.C. Hoffman Malueg
Exhibit A-6 (JCHM-1) Schedule F1.1
Page 2 of 4

Michigan Public Service CommissionMichigan Gas Utilities CorporationProjected Cost of Service Allocation StudyProjected Test Year Ending December 31, 2014
Individual Rate Schedule Detail
(A) (B) (C) (D) (E)
GS-Large TOTAL TOTALLINE SUMMARY OF OPERATING INCOME, General Service LARGE Special SPECIALNO. RATE BASE AND RATE OF RETURN Large COMMERCIAL Contract CONTRACT
1 Operating Revenues:2 Tariffed Revenues 1,883,203 1,883,203 125,365 125,3653 Other Revenues 9,797 9,797 966 9664 Total Operating Revenues: 1,893,000 1,893,000 126,331 126,33156 Operating Expense:7 Operation & Maintenance: Cost of Gas 1,498,862 1,498,862 1,597 1,5978 Operation & Maintenance: Non-Cost of Gas 106,699 106,699 10,334 10,3349 Depreciation Expense - S/L 28,864 28,864 90 9010 Taxes other than Income Tax 23,316 23,316 71 7111 LESS: Income & Other Adj's Before Income Tax 0 0 0 012 Income Tax 14,591 14,591 52 5213 ITC Credit 0 0 0 014 LESS: Income & Other Adj's After Income Tax 0 0 0 015 Total Operating Expense 1,672,331 1,672,331 12,143 12,1431617 NET OPERATING INCOME (Return) 220,669 220,669 114,188 114,18818 AFUDC Allowance 0 0 0 019 Income Tax Affect of Int. Allow for Ratemaking (26) (26) (0) (0)20 ADJUSTED NET OPERATING INCOME 220,643 220,643 114,188 114,188212223 RATE BASE:24 Utility Plant in Service 1,253,381 1,253,381 3,678 3,67825 Accumulated Depreciation - S/L (678,126) (678,126) (1,880) (1,880)26 Construction Work in Progress 0 0 0 027 Net Plant in Service 575,255 575,255 1,799 1,7992829 Gas Stored Underground: 187,619 187,619 561 56130 Fuel Stock 0 0 0 031 Working Capital Allowance 345,596 345,596 1,533 1,53332 Materials & Supplies: 1,154 1,154 3 333 Other - Deferred Taxes (M&S / CWIP) 0 0 0 034 Prepayments 3,921 3,921 4 435 Cash & Bank Balances 1,380 1,380 1 136 Property, Payroll & Income Taxes Accrued: (20,002) (20,002) (24) (24)37 TOTAL RATE BASE 1,094,924 1,094,924 3,877 3,877383940 PERCENT RATE OF RETURN 20.1538% 20.1538% 2945.6378% 2945.6378%4142 Required Rate of Return 6.4020% 6.4020% 6.4020% 6.4020%4344 Required Return 70,097 70,097 248 24845 (Required Return % * Rate Base)46 Return Income Deficiency (150,546) (150,546) (113,940) (113,940) 47 (Required Ret - Adj Operating Income)48 Income Tax Rate 0.6367 0.6367 0.6367 0.6367 4950 Additional Income Tax on Return Def. 16,263 16,263 58 58 51 (Income Deficiency * Tax Factor)52 Revenue Deficiency (134,284) (134,284) (113,882) (113,882) 5354 Revenue Deficiency % -7.13% -7.13% -90.84% -90.84%55 (Revenue Def / Tariffed Revenues)56 Revenue Deficiency % (Without Cost of Gas) -34.94% -34.94% -92.01% -92.01%57 (Distribution Margin Only)
May not cross-check due to Rounding
Case No. U-17273 Witness: J.C. Hoffman Malueg
Exhibit A-6 (JCHM-1) Schedule F1.1
Page 3 of 4

Michigan Public Service CommissionMichigan Gas Utilities CorporationProjected Cost of Service Allocation StudyProjected Test Year Ending December 31, 2014
Individual Rate Schedule Detail
(A) (B) (C) (D) (E) (F) (G) (H) (I) (J) (K) (L) (M) (N) (O)Customer Customer Customer Customer
Customer Customer Customer Choice Choice Choice Choice Aggregated Aggregated AggregatedLINE SUMMARY OF OPERATING INCOME, TR-1 TR-2 TR-3 Choice Choice Choice Multi-Family Multi-Family Multi-Family Multi-Family Transport Transport Transport TOTALNO. RATE BASE AND RATE OF RETURN Transport Transport Transport Residential GS - Small GS - Large Class I Class II Class III Class IV Residential GS - Small GS - Large TRANSPORT
1 Operating Revenues:2 Tariffed Revenues 2,408,779 2,614,173 1,683,100 7,422,621 4,431,105 0 8,708 33,386 0 68,455 14,247 1,849,311 42,424 20,576,3093 Other Revenues 18,829 20,285 13,028 106,710 43,331 0 138 354 0 549 172 15,199 333 218,9284 Total Operating Revenues: 2,427,608 2,634,458 1,696,128 7,529,331 4,474,436 0 8,846 33,740 0 69,004 14,419 1,864,510 42,757 20,795,23756 Operating Expense:7 Operation & Maintenance: Cost of Gas 0 0 0 0 0 0 0 0 0 0 0 0 0 08 Operation & Maintenance: Non-Cost of Gas 633,730 860,088 618,992 5,078,086 1,872,580 0 6,856 13,400 0 20,036 29,755 945,895 11,145 10,090,5639 Depreciation Expense - S/L 180,303 319,438 252,280 1,301,821 538,894 0 1,761 3,423 0 6,772 2,030 213,720 2,744 2,823,18510 Taxes other than Income Tax 128,038 228,935 183,576 524,755 300,698 0 692 1,678 0 4,785 974 158,087 2,317 1,534,53411 LESS: Income & Other Adj's Before Income Tax 0 0 0 0 0 0 0 0 0 0 0 0 0 012 Income Tax 73,850 131,739 107,376 329,436 188,016 0 433 1,032 0 2,760 600 94,589 1,485 931,31813 ITC Credit 0 0 0 0 0 0 0 0 0 0 0 0 0 014 LESS: Income & Other Adj's After Income Tax 0 0 0 0 0 0 0 0 0 0 0 0 0 015 Total Operating Expense 1,015,921 1,540,200 1,162,224 7,234,098 2,900,188 0 9,742 19,534 0 34,353 33,358 1,412,292 17,692 15,379,6001617 NET OPERATING INCOME (Return) 1,411,687 1,094,258 533,904 295,233 1,574,247 0 (896) 14,206 0 34,652 (18,940) 452,219 25,066 5,415,63718 AFUDC Allowance 0 0 0 0 0 0 0 0 0 0 0 0 0 019 Income Tax Affect of Int. Allow for Ratemaking (130) (232) (189) (581) (332) 0 (1) (2) 0 (5) (1) (167) (3) (1,643)20 ADJUSTED NET OPERATING INCOME 1,411,557 1,094,026 533,715 294,652 1,573,916 0 (897) 14,204 0 34,647 (18,941) 452,052 25,063 5,413,994212223 RATE BASE:24 Utility Plant in Service 7,658,875 13,830,688 11,227,761 44,361,999 21,859,630 0 58,604 125,972 0 279,904 72,424 8,815,745 118,821 108,410,42325 Accumulated Depreciation - S/L (4,196,678) (7,612,045) (6,186,660) (23,850,180) (11,401,535) 0 (31,714) (67,256) 0 (151,795) (39,021) (4,758,516) (64,034) (58,359,433)26 Construction Work in Progress 0 0 0 0 0 0 0 0 0 0 0 0 0 027 Net Plant in Service 3,462,197 6,218,642 5,041,102 20,511,820 10,458,095 0 26,890 58,716 0 128,108 33,404 4,057,230 54,787 50,050,9902829 Gas Stored Underground: 504,691 873,062 699,016 1,464,178 1,273,063 0 1,914 6,490 0 28,030 3,972 997,893 19,282 5,871,59130 Fuel Stock 0 0 0 0 0 0 0 0 0 0 0 0 0 031 Working Capital Allowance 1,664,210 2,955,404 2,441,856 2,849,034 2,515,606 0 3,832 12,895 0 54,328 8,021 2,143,406 38,644 14,687,23732 Materials & Supplies: 8,093 14,278 10,975 72,724 23,506 0 101 178 0 311 108 9,647 107 140,02833 Other - Deferred Taxes (M&S / CWIP) 0 0 0 0 0 0 0 0 0 0 0 0 0 034 Prepayments 26,675 48,200 37,263 47,496 43,518 0 59 220 0 986 122 29,579 358 234,47535 Cash & Bank Balances 9,688 17,518 13,531 17,039 15,639 0 21 79 0 355 43 10,579 125 84,61836 Property, Payroll & Income Taxes Accrued: (133,598) (240,922) (185,897) (240,321) (220,035) 0 (301) (1,112) 0 (4,983) (617) (150,014) (1,835) (1,179,636)37 TOTAL RATE BASE 5,541,956 9,886,182 8,057,845 24,721,970 14,109,392 0 32,516 77,465 0 207,135 45,053 7,098,319 111,469 69,889,303383940 PERCENT RATE OF RETURN 25.4727% 11.0686% 6.6259% 1.1942% 11.1574% -2.7565% 18.3386% 16.7291% -42.0387% 6.3708% 22.4868% 7.7489%4142 Required Rate of Return 6.4020% 6.4020% 6.4020% 6.4020% 6.4020% 6.4020% 6.4020% 6.4020% 6.4020% 6.4020% 6.4020% 6.4020% 6.4020% 6.4020%4344 Required Return 354,796 632,913 515,863 1,582,699 903,282 0 2,082 4,959 0 13,261 2,884 454,434 7,136 4,474,30845 (Required Return % * Rate Base)46 Return Income Deficiency (1,056,761) (461,113) (17,852) 1,288,046 (670,634) - 2,979 (9,245) - (21,386) 21,825 2,382 (17,927) (939,687) 47 (Required Ret - Adj Operating Income)48 Income Tax Rate 0.6367 0.6367 0.6367 0.6367 0.6367 0.6367 0.6367 0.6367 0.6367 0.6367 0.6367 0.6367 0.6367 0.6367 4950 Additional Income Tax on Return Def. 82,314 146,839 119,683 367,194 209,566 0 483 1,151 0 3,077 669 105,431 1,656 1,038,06151 (Income Deficiency * Tax Factor)52 Revenue Deficiency (974,447) (314,274) 101,830 1,655,240 (461,068) - 3,462 (8,094) - (18,310) 22,494 107,813 (16,271) 98,374 5354 Revenue Deficiency % -40.45% -12.02% 6.05% 22.30% -10.41% 39.75% -24.24% -26.75% 157.89% 5.83% -38.35% 0.48%55 (Revenue Def / Tariffed Revenues)56 Revenue Deficiency % (Without Cost of Gas) -40.45% -12.02% 6.05% 22.30% -10.41% 39.75% -24.24% -26.75% 157.89% 5.83% -38.35% 0.48%57 (Distribution Margin Only)
May not cross-check due to Rounding
Case No. U-17273 Witness: J.C. Hoffman Malueg
Exhibit A-6 (JCHM-1) Schedule F1.1
Page 4 of 4

Mic
higa
n P
ublic
Ser
vice
Com
mis
sion
Mic
higa
n G
as U
tiliti
es C
orpo
ratio
nP
roje
cted
Cos
t of S
ervi
ce A
lloca
tion
Stu
dyP
roje
cted
Tes
t Yea
r End
ing
Dec
embe
r 31,
201
4
GAS
Rev
enue
Def
icie
ncy
(Exc
ess)
by
Rat
e S
ched
ule
(A)
(B)
(C)
(D)
(E)
(F)
(G)
(H)
(I)(J
)(K
)(L
)(N
)
LIN
E
NO
.S
UM
MAR
Y O
F O
PE
RAT
ING
INC
OM
E, R
ATE
BAS
E,
AND
RAT
E O
F R
ET
UR
NAL
LOC
ATIO
N F
ACT
OR
CO
RP
OR
ATE
T
OT
ALR
esid
entia
lM
ulti-
Fam
ily -
Cla
ss I
Mul
ti-Fa
mily
- C
lass
IIM
ulti-
Fam
ily -
Cla
ss
IIIM
ulti-
Fam
ily -
Cla
ss
IVS
mal
l Gen
eral
S
ervi
ceLa
rge
Gen
eral
S
ervi
ceT
rans
port
- TR
-1T
rans
port
- TR
-2T
rans
port
- TR
-31
Ope
ratin
g R
even
ues:
2
Tar
iffed
Rev
enue
s13
3,75
7,46
787
,828
,772
145,
170
757,
241
204,
544
290,
241
21,9
46,6
221,
883,
203
2,40
8,77
92,
614,
173
1,68
3,10
03
O
ther
Rev
enue
s1,
105,
000
732,
584
1,01
64,
489
1,12
01,
548
134,
551
9,79
718
,829
20,2
8513
,028
4T
otal
Ope
ratin
g R
even
ues:
134,
862,
467
88,5
61,3
5614
6,18
676
1,73
020
5,66
429
1,78
922
,081
,173
1,89
3,00
02,
427,
608
2,63
4,45
81,
696,
128
5 6O
pera
ting
Exp
ense
:7
O
pera
tion
& M
aint
enan
ce: C
ost o
f Gas
71,6
84,7
1653
,882
,128
103,
746
544,
109
153,
745
223,
832
15,2
76,6
961,
498,
862
00
08
O
pera
tion
& M
aint
enan
ce: N
on-C
ost o
f Gas
37,5
18,0
5124
,137
,298
27,3
7986
,380
18,0
5522
,089
3,01
9,25
510
6,69
963
3,73
086
0,08
861
8,99
29
D
epre
ciat
ion
Exp
ense
- S
/L9,
779,
651
6,06
2,37
17,
191
23,5
915,
276
6,64
982
2,43
328
,864
180,
303
319,
438
252,
280
10
Tax
es o
ther
than
Inco
me
Tax
4,50
4,77
72,
462,
247
3,32
013
,733
3,46
04,
706
459,
390
23,3
1612
8,03
822
8,93
518
3,57
611
L
ES
S: I
ncom
e &
Oth
er A
dj's
Bef
ore
Inco
me
Tax
00
00
00
00
00
012
I
ncom
e T
axR
ate
Bas
e2,
804,
951
1,55
6,04
02,
025
8,19
32,
041
2,72
028
7,97
114
,591
73,8
5013
1,73
910
7,37
613
I
TC
Cre
dit
00
00
00
00
00
014
L
ES
S:
Inco
me
& O
ther
Adj
's A
fter I
ncom
e T
ax0
00
00
00
00
00
15T
otal
Ope
ratin
g E
xpen
se12
6,29
2,14
688
,100
,085
143,
660
676,
006
182,
578
259,
996
19,8
65,7
461,
672,
331
1,01
5,92
11,
540,
200
1,16
2,22
416 17
NE
T O
PE
RAT
ING
INC
OM
E (R
etur
n)8,
570,
321
461,
271
2,52
585
,724
23,0
8631
,793
2,21
5,42
722
0,66
91,
411,
687
1,09
4,25
853
3,90
418
AF
UD
C A
llow
ance
00
00
00
00
00
019
In
com
e T
ax A
ffect
of I
nt. A
llow
for R
atem
akin
gR
ateb
ase
(4,9
47)
(2,7
44)
(4)
(14)
(4)
(5)
(508
)(2
6)(1
30)
(232
)(1
89)
20AD
JUS
TE
D N
ET
OP
ER
ATIN
G IN
CO
ME
8,56
5,37
445
8,52
62,
522
85,7
1023
,083
31,7
882,
214,
919
220,
643
1,41
1,55
71,
094,
026
533,
715
21 22 23R
ATE
BAS
E:
24U
tility
Pla
nt in
Ser
vice
353,
437,
558
208,
636,
928
254,
122
928,
687
220,
540
275,
033
33,4
54,7
641,
253,
381
7,65
8,87
513
,830
,688
11,2
27,7
6125
Accu
mul
ated
Dep
reci
atio
n - S
/L(1
89,0
78,1
99)
(111
,713
,373
)(1
37,2
77)
(496
,543
)(1
17,4
70)
(149
,073
)(1
7,42
5,02
4)(6
78,1
26)
(4,1
96,6
78)
(7,6
12,0
45)
(6,1
86,6
60)
26C
onst
ruct
ion
Wor
k in
Pro
gres
s0
00
00
00
00
00
27
Net
Pla
nt in
Ser
vice
164,
359,
359
96,9
23,5
5611
6,84
543
2,14
410
3,07
012
5,96
016
,029
,741
575,
255
3,46
2,19
76,
218,
642
5,04
1,10
228 29
Gas
Sto
red
Und
ergr
ound
:14
,976
,515
6,85
2,38
012
,517
65,3
5218
,129
27,6
261,
940,
740
187,
619
504,
691
873,
062
699,
016
30Fu
el S
tock
00
00
00
00
00
031
Wor
king
Cap
ital A
llow
ance
32,5
91,1
0213
,471
,866
23,7
5612
4,88
334
,196
53,7
703,
848,
267
345,
596
1,66
4,21
02,
955,
404
2,44
1,85
632
Mat
eria
ls &
Sup
plie
s:51
2,21
933
3,37
439
11,
131
229
305
35,6
001,
154
8,09
314
,278
10,9
7533
Oth
er -
Def
erre
d T
axes
(M&
S /
CW
IP)
00
00
00
00
00
034
Pre
paym
ents
527,
688
218,
901
421
2,34
666
296
665
,989
3,92
126
,675
48,2
0037
,263
35C
ash
& B
ank
Bal
ance
s18
9,78
078
,489
152
845
238
348
23,7
101,
380
9,68
817
,518
13,5
3136
Pro
perty
, Pay
roll
& In
com
e T
axes
Acc
rued
:(2
,663
,522
)(1
,107
,959
)(2
,128
)(1
1,85
3)(3
,347
)(4
,883
)(3
33,6
92)
(20,
002)
(133
,598
)(2
40,9
22)
(185
,897
)37
TO
TAL
RAT
E B
ASE
210,
493,
141
116,
770,
608
151,
953
614,
848
153,
178
204,
091
21,6
10,3
551,
094,
924
5,54
1,95
69,
886,
182
8,05
7,84
538
% o
f Rat
e B
ase
RA
TEB
ASE
100.
00%
55.4
7%0.
07%
0.29
%0.
07%
0.10
%10
.27%
0.52
%2.
63%
4.70
%3.
83%
39 40P
ER
CE
NT
RAT
E O
F R
ET
UR
N4.
0692
%0.
3927
%1.
6596
%13
.940
0%15
.069
4%15
.575
6%10
.249
3%20
.151
5%25
.470
4%11
.066
2%6.
6235
%41 42
Req
uire
d R
ate
of R
etur
n6.
4020
%6.
4020
%6.
4020
%6.
4020
%6.
4020
%6.
4020
%6.
4020
%6.
4020
%6.
4020
%6.
4020
%6.
4020
%43 44
Req
uire
d R
etur
n13
,475
,754
7,47
5,64
59,
728
39,3
629,
806
13,0
661,
383,
493
70,0
9735
4,79
663
2,91
351
5,86
345
(Req
uire
d R
etur
n %
* R
ate
Bas
e)46
Ret
urn
Inco
me
Def
icie
ncy
4,91
0,38
07,
017,
119
7,20
6(4
6,34
8)(1
3,27
6)(1
8,72
3)(8
31,4
26)
(150
,546
)(1
,056
,761
)(4
61,1
13)
(17,
852)
47
(R
equi
red
Ret
- Ad
j Ope
ratin
g In
com
e)48
Inco
me
Tax
Rat
e0.
6367
49 50Ad
ditio
nal I
ncom
e T
ax o
n R
etur
n D
ef.
Rat
e B
ase
3,12
6,43
91,
734,
385
2,25
79,
132
2,27
53,
031
320,
977
16,2
6382
,314
146,
839
119,
683
51
(In
com
e D
efic
ienc
y *
Tax
Fac
tor)
52R
even
ue D
efic
ienc
y8,
036,
820
8,75
1,50
49,
463
(37,
215)
(11,
001)
(15,
691)
(510
,449
)(1
34,2
84)
(974
,447
)(3
14,2
74)
101,
830
5320
10 F
orec
ast Y
ear
54R
even
ue D
efic
ienc
y %
6.01
%9.
96%
6.52
%-4
.91%
-5.3
8%-5
.41%
-2.3
3%-7
.13%
-40.
45%
-12.
02%
6.05
%55
(Rev
enue
Def
/ T
ariff
ed R
even
ues)
2010
For
ecas
t Yea
r56
Rev
enue
Def
icie
ncy
% (W
ithou
t Cos
t of G
as)
12.9
5%25
.78%
22.8
4%-1
7.46
%-2
1.66
%-2
3.63
%-7
.65%
-34.
94%
-40.
45%
-12.
02%
6.05
%57
(Dis
tribu
tion
Mar
gin
Onl
y)
May
not
cro
ss-c
heck
due
to R
ound
ing
Case No. U-17273 Witness: J.C. Hoffman Malueg
Exhibit A-6 (JCHM-1) Schedule F1.2
Page 1 of 20

Mic
higa
n P
ublic
Ser
vice
Com
mis
sion
Mic
higa
n G
as U
tiliti
es C
orpo
ratio
nP
roje
cted
Cos
t of S
ervi
ce A
lloca
tion
Stu
dyP
roje
cted
Tes
t Yea
r End
ing
Dec
embe
r 31,
201
4
GAS
Rev
enue
Def
icie
ncy
(Exc
ess)
by
Rat
e S
ched
ule
(A)
(B)
(C)
LIN
E
NO
.S
UM
MAR
Y O
F O
PE
RAT
ING
INC
OM
E, R
ATE
BAS
E,
AND
RAT
E O
F R
ET
UR
NAL
LOC
ATIO
N F
ACT
OR
CO
RP
OR
ATE
T
OT
AL1
Ope
ratin
g R
even
ues:
2
Tar
iffed
Rev
enue
s13
3,75
7,46
73
O
ther
Rev
enue
s1,
105,
000
4T
otal
Ope
ratin
g R
even
ues:
134,
862,
467
5 6O
pera
ting
Exp
ense
:7
O
pera
tion
& M
aint
enan
ce: C
ost o
f Gas
71,6
84,7
168
O
pera
tion
& M
aint
enan
ce: N
on-C
ost o
f Gas
37,5
18,0
519
D
epre
ciat
ion
Exp
ense
- S
/L9,
779,
651
10
Tax
es o
ther
than
Inco
me
Tax
4,50
4,77
711
L
ES
S: I
ncom
e &
Oth
er A
dj's
Bef
ore
Inco
me
Tax
012
I
ncom
e T
axR
ate
Bas
e2,
804,
951
13
IT
C C
redi
t0
14
LE
SS
: In
com
e &
Oth
er A
dj's
Afte
r Inc
ome
Tax
015
Tot
al O
pera
ting
Exp
ense
126,
292,
146
16 17N
ET
OP
ER
ATIN
G IN
CO
ME
(Ret
urn)
8,57
0,32
118
AF
UD
C A
llow
ance
019
In
com
e T
ax A
ffect
of I
nt. A
llow
for R
atem
akin
gR
ateb
ase
(4,9
47)
20AD
JUS
TE
D N
ET
OP
ER
ATIN
G IN
CO
ME
8,56
5,37
421 22 23
RAT
E B
ASE
:24
Util
ity P
lant
in S
ervi
ce35
3,43
7,55
825
Accu
mul
ated
Dep
reci
atio
n - S
/L(1
89,0
78,1
99)
26C
onst
ruct
ion
Wor
k in
Pro
gres
s0
27
Net
Pla
nt in
Ser
vice
164,
359,
359
28 29G
as S
tore
d U
nder
grou
nd:
14,9
76,5
1530
Fuel
Sto
ck0
31W
orki
ng C
apita
l Allo
wan
ce32
,591
,102
32M
ater
ials
& S
uppl
ies:
512,
219
33O
ther
- D
efer
red
Tax
es (M
&S
/ C
WIP
)0
34P
repa
ymen
ts52
7,68
835
Cas
h &
Ban
k B
alan
ces
189,
780
36P
rope
rty, P
ayro
ll &
Inco
me
Tax
es A
ccru
ed:
(2,6
63,5
22)
37T
OT
AL R
ATE
BAS
E21
0,49
3,14
138
% o
f Rat
e B
ase
RA
TEB
ASE
100.
00%
39 40P
ER
CE
NT
RAT
E O
F R
ET
UR
N4.
0692
%41 42
Req
uire
d R
ate
of R
etur
n6.
4020
%43 44
Req
uire
d R
etur
n13
,475
,754
45
(R
equi
red
Ret
urn
% *
Rat
e B
ase)
46R
etur
n In
com
e D
efic
ienc
y4,
910,
380
47
(R
equi
red
Ret
- Ad
j Ope
ratin
g In
com
e)48
Inco
me
Tax
Rat
e0.
6367
49 50Ad
ditio
nal I
ncom
e T
ax o
n R
etur
n D
ef.
Rat
e B
ase
3,12
6,43
951
(Inco
me
Def
icie
ncy
* T
ax F
acto
r)52
Rev
enue
Def
icie
ncy
8,03
6,82
053
2010
For
ecas
t Yea
r54
Rev
enue
Def
icie
ncy
%6.
01%
55
(R
even
ue D
ef /
Tar
iffed
Rev
enue
s)20
10 F
orec
ast Y
ear
56R
even
ue D
efic
ienc
y %
(With
out C
ost o
f Gas
)12
.95%
57
(D
istri
butio
n M
argi
n O
nly)
(D)
(E)
(F)
(G)
(H)
(I)(J
)(K
)(L
)(N
)(O
)
Cus
tom
er C
hoic
e -
Res
iden
tial
Cus
tom
er C
hoic
e -
Sm
all G
SC
usto
mer
Cho
ice
- La
rge
GS
Cus
tom
er C
hoic
e -
Mul
ti-Fa
mily
IC
usto
mer
Cho
ice
- M
ulti-
Fam
ily II
Cus
tom
er C
hoic
e -
Mul
ti-Fa
mily
III
Cus
tom
er C
hoic
e -
Mul
ti-Fa
mily
IVAg
g T
rans
port
- R
esid
entia
lAg
g T
rans
port
- S
mal
l GS
Agg
Tra
nspo
rt -
Larg
e G
SS
peci
al C
ontra
ct
7,42
2,62
14,
431,
105
08,
708
33,3
860
68,4
5514
,247
1,84
9,31
142
,424
125,
365
106,
710
43,3
310
138
354
054
917
215
,199
333
966
7,52
9,33
14,
474,
436
08,
846
33,7
400
69,0
0414
,419
1,86
4,51
042
,757
126,
331
00
00
00
00
00
1,59
75,
078,
086
1,87
2,58
00
6,85
613
,400
020
,036
29,7
5594
5,89
511
,145
10,3
341,
301,
821
538,
894
01,
761
3,42
30
6,77
22,
030
213,
720
2,74
490
524,
755
300,
698
069
21,
678
04,
785
974
158,
087
2,31
771
00
00
00
00
00
032
9,43
618
8,01
60
433
1,03
20
2,76
060
094
,589
1,48
552
00
00
00
00
00
00
00
00
00
00
00
7,23
4,09
82,
900,
188
09,
742
19,5
340
34,3
5333
,358
1,41
2,29
217
,692
12,1
43
295,
233
1,57
4,24
70
(896
)14
,206
034
,652
(18,
940)
452,
219
25,0
6611
4,18
80
00
00
00
00
00
(581
)(3
32)
0(1
)(2
)0
(5)
(1)
(167
)(3
)(0
)29
4,65
21,
573,
916
0(8
97)
14,2
040
34,6
47(1
8,94
1)45
2,05
225
,063
114,
188
44,3
61,9
9921
,859
,630
058
,604
125,
972
027
9,90
472
,424
8,81
5,74
511
8,82
13,
678
(23,
850,
180)
(11,
401,
535)
0(3
1,71
4)(6
7,25
6)0
(151
,795
)(3
9,02
1)(4
,758
,516
)(6
4,03
4)(1
,880
)0
00
00
00
00
00
20,5
11,8
2010
,458
,095
026
,890
58,7
160
128,
108
33,4
044,
057,
230
54,7
871,
799
1,46
4,17
81,
273,
063
01,
914
6,49
00
28,0
303,
972
997,
893
19,2
8256
10
00
00
00
00
00
2,84
9,03
42,
515,
606
03,
832
12,8
950
54,3
288,
021
2,14
3,40
638
,644
1,53
372
,724
23,5
060
101
178
031
110
89,
647
107
30
00
00
00
00
00
47,4
9643
,518
059
220
098
612
229
,579
358
417
,039
15,6
390
2179
035
543
10,5
7912
51
(240
,321
)(2
20,0
35)
0(3
01)
(1,1
12)
0(4
,983
)(6
17)
(150
,014
)(1
,835
)(2
4)24
,721
,970
14,1
09,3
920
32,5
1677
,465
020
7,13
545
,053
7,09
8,31
911
1,46
93,
877
11.7
4%6.
70%
0.00
%0.
02%
0.04
%0.
00%
0.10
%0.
02%
3.37
%0.
05%
0.00
%
1.19
19%
11.1
551%
-2.7
589%
18.3
362%
16.7
267%
-42.
0410
%6.
3684
%22
.484
5%2,
945.
6354
%
6.40
20%
6.40
20%
6.40
20%
6.40
20%
6.40
20%
6.40
20%
6.40
20%
6.40
20%
6.40
20%
6.40
20%
6.40
20%
1,58
2,69
990
3,28
20
2,08
24,
959
013
,261
2,88
445
4,43
47,
136
248
1,28
8,04
6(6
70,6
34)
02,
979
(9,2
45)
0(2
1,38
6)21
,825
2,38
2(1
7,92
7)(1
13,9
40)
367,
194
209,
566
048
31,
151
03,
077
669
105,
431
1,65
658
1,65
5,24
0(4
61,0
68)
03,
462
(8,0
94)
0(1
8,31
0)22
,494
107,
813
(16,
271)
(113
,882
)
22.3
0%-1
0.41
%39
.75%
-24.
24%
-26.
75%
157.
89%
5.83
%-3
8.35
%-9
0.84
%
22.3
0%-1
0.41
%39
.75%
-24.
24%
-26.
75%
157.
89%
5.83
%-3
8.35
%-9
2.01
%
May
not
cro
ss-c
heck
due
to R
ound
ing
Case No. U-17273 Witness: J.C. Hoffman Malueg
Exhibit A-6 (JCHM-1) Schedule F1.2
Page 2 of 20

Mic
higa
n P
ublic
Ser
vice
Com
mis
sion
Mic
higa
n G
as U
tiliti
es C
orpo
ratio
nP
roje
cted
Cos
t of S
ervi
ce A
lloca
tion
Stu
dyP
roje
cted
Tes
t Yea
r End
ing
Dec
embe
r 31,
201
4
ALLO
CAT
ION
OF
OP
ER
ATIN
G R
EVE
NU
E(A
)(B
)(C
)(D
)(E
)(F
)(G
)(H
)(I)
(J)
(K)
(L)
(N)
LIN
E
NO
.D
ES
CR
IPT
ION
ALLO
CAT
ION
FAC
TO
RC
OR
PO
RAT
E
TO
TAL
Res
iden
tial
Mul
ti-Fa
mily
- C
lass
IM
ulti-
Fam
ily -
Cla
ss II
Mul
ti-Fa
mily
- C
lass
III
Mul
ti-Fa
mily
- C
lass
IV
Sm
all G
ener
al
Ser
vice
Larg
e G
ener
al
Ser
vice
Tra
nspo
rt - T
R-1
Tra
nspo
rt - T
R-2
Tra
nspo
rt - T
R-3
1G
AS O
PE
RAT
ING
RE
VEN
UE
SD
irect
133,
757,
467
87,8
28,7
7214
5,17
075
7,24
120
4,54
429
0,24
121
,946
,622
1,88
3,20
32,
408,
779
2,61
4,17
31,
683,
100
2 3O
TH
ER
OP
ER
ATIN
G IN
CO
ME
:4
Acct
487
- La
te P
aym
ent R
evM
argi
n R
even
ue48
0,00
026
2,50
532
01,
648
393
514
51,5
782,
972
18,6
2720
,215
13,0
155
Acct
488
- M
isce
llane
ous
Rev
enue
Cus
tom
er30
0,00
022
5,79
122
537
431
1913
,713
3020
270
136
Acct
493
- R
ent f
rom
Gas
Pro
perty
Rat
e B
ase
00
00
00
00
00
07
Acct
494
- In
terd
epar
tmen
tal R
ents
00
00
00
00
00
08
Acct
495
- O
ther
Gas
Rev
enue
9
Mis
cella
neou
s:10
M
isce
llane
ous
Cus
tom
er0
00
00
00
00
00
11
UE
TM
:D
irect
00
00
00
00
00
012
S
ub-T
otal
: M
isce
llane
ous
495
00
00
00
00
00
013 14
C
usto
mer
Pen
altie
sS
ales
325,
000
244,
288
470
2,46
769
71,
015
69,2
616,
795
00
015
M
I Gas
Tru
e-up
Sal
es0
00
00
00
00
00
16
Gas
Tra
nspo
rt T
rue-
Up
Sal
es0
00
00
00
00
00
17
IL
Tax
Fee
Rat
e B
ase
00
00
00
00
00
018
R
ider
VB
A E
stim
ated
Adj
ustm
ent:
19
Res
iden
tial
Thr
u-pu
t - R
esid
entia
l0
00
00
00
00
00
20
Sm
all G
S &
Sm
all M
ulti-
Fam
ilyT
hru-
put -
Sm
all G
S &
MF
00
00
00
00
00
021
La
rge
Mul
ti-Fa
mily
Thr
u-pu
t - L
arge
MF
00
00
00
00
00
022
Tot
al R
even
ue D
ecou
plin
g0
00
00
00
00
00
23 24
Rev
enue
Dec
oupl
ing
Dire
ct0
00
00
00
00
00
25 26T
OT
AL O
TH
ER
RE
VEN
UE
1,10
5,00
073
2,58
41,
016
4,48
91,
120
1,54
813
4,55
19,
797
18,8
2920
,285
13,0
2827 28
TO
TAL
OP
ER
ATIN
G R
EVE
NU
E13
4,86
2,46
788
,561
,356
146,
186
761,
730
205,
664
291,
789
22,0
81,1
731,
893,
000
2,42
7,60
82,
634,
458
1,69
6,12
829 30 31
Gas
Ope
ratin
g R
even
ues
Line
1 a
bove
133,
757,
467
87,8
28,7
7214
5,17
075
7,24
120
4,54
429
0,24
121
,946
,622
1,88
3,20
32,
408,
779
2,61
4,17
31,
683,
100
32
Pur
chas
ed G
as C
ost -
CO
GP
age
5 &
6, L
ine
271
,684
,716
53,8
82,1
2810
3,74
654
4,10
915
3,74
522
3,83
215
,276
,696
1,49
8,86
20
00
33 T
OT
AL M
ARG
IN R
EVE
NU
E62
,072
,751
33,9
46,6
4441
,424
213,
132
50,7
9966
,409
6,66
9,92
638
4,34
12,
408,
779
2,61
4,17
31,
683,
100
34M
AR
GIN
REV
ENU
E10
0.00
%54
.688
5%0.
0667
%0.
3434
%0.
0818
%0.
1070
%10
.745
3%0.
6192
%3.
8806
%4.
2115
%2.
7115
%
May
not
cro
ss-c
heck
due
to R
ound
ing
Case No. U-17273 Witness: J.C. Hoffman Malueg
Exhibit A-6 (JCHM-1) Schedule F1.2
Page 3 of 20

Mic
higa
n P
ublic
Ser
vice
Com
mis
sion
Mic
higa
n G
as U
tiliti
es C
orpo
ratio
nP
roje
cted
Cos
t of S
ervi
ce A
lloca
tion
Stu
dyP
roje
cted
Tes
t Yea
r End
ing
Dec
embe
r 31,
201
4
ALLO
CAT
ION
OF
OP
ER
ATIN
G R
EVE
NU
E(A
)(B
)(C
)
LIN
E
NO
.D
ES
CR
IPT
ION
ALLO
CAT
ION
FAC
TO
RC
OR
PO
RAT
E
TO
TAL
1G
AS O
PE
RAT
ING
RE
VEN
UE
SD
irect
133,
757,
467
2 3O
TH
ER
OP
ER
ATIN
G IN
CO
ME
:4
Acct
487
- La
te P
aym
ent R
evM
argi
n R
even
ue48
0,00
05
Acct
488
- M
isce
llane
ous
Rev
enue
Cus
tom
er30
0,00
06
Acct
493
- R
ent f
rom
Gas
Pro
perty
Rat
e B
ase
07
Acct
494
- In
terd
epar
tmen
tal R
ents
08
Acct
495
- O
ther
Gas
Rev
enue
9
Mis
cella
neou
s:10
M
isce
llane
ous
Cus
tom
er0
11
UE
TM
:D
irect
012
S
ub-T
otal
: M
isce
llane
ous
495
013 14
C
usto
mer
Pen
altie
sS
ales
325,
000
15
MI G
as T
rue-
upS
ales
016
G
as T
rans
port
Tru
e-U
pS
ales
017
I
L T
ax F
eeR
ate
Bas
e0
18
Rid
er V
BA
Est
imat
ed A
djus
tmen
t:19
R
esid
entia
lT
hru-
put -
Res
iden
tial
020
S
mal
l GS
& S
mal
l Mul
ti-Fa
mily
Thr
u-pu
t - S
mal
l GS
& M
F0
21
Larg
e M
ulti-
Fam
ilyT
hru-
put -
Lar
ge M
F0
22
T
otal
Rev
enue
Dec
oupl
ing
023 24
R
even
ue D
ecou
plin
gD
irect
025 26
TO
TAL
OT
HE
R R
EVE
NU
E1,
105,
000
27 28T
OT
AL O
PE
RAT
ING
RE
VEN
UE
134,
862,
467
29 30 31G
as O
pera
ting
Rev
enue
sLi
ne 1
abo
ve13
3,75
7,46
732
P
urch
ased
Gas
Cos
t - C
OG
Pag
e 5
& 6
, Lin
e 2
71,6
84,7
1633
TO
TAL
MAR
GIN
RE
VEN
UE
62,0
72,7
5134
MA
RG
IN R
EVEN
UE
100.
00%
(D)
(E)
(F)
(G)
(H)
(I)(J
)(K
)(L
)(N
)(O
)
Cus
tom
er C
hoic
e -
Res
iden
tial
Cus
tom
er C
hoic
e -
Sm
all G
SC
usto
mer
Cho
ice
- La
rge
GS
Cus
tom
er C
hoic
e -
Mul
ti-Fa
mily
IC
usto
mer
Cho
ice
- M
ulti-
Fam
ily II
Cus
tom
er C
hoic
e -
Mul
ti-Fa
mily
III
Cus
tom
er C
hoic
e -
Mul
ti-Fa
mily
IVAg
g T
rans
port
- R
esid
entia
lAg
g T
rans
port
- S
mal
l GS
Agg
Tra
nspo
rt -
Larg
e G
SS
peci
al C
ontra
ct7,
422,
621
4,43
1,10
50
8,70
833
,386
068
,455
14,2
471,
849,
311
42,4
2412
5,36
5
57,3
9834
,265
067
258
052
911
014
,300
328
957
49,3
129,
066
070
960
2061
899
52
00
00
00
00
00
00
00
00
00
00
00
00
00
00
00
00
00
00
00
00
00
00
00
00
00
00
00
0
00
00
00
00
00
70
00
00
00
00
00
00
00
00
00
00
00
00
00
00
00
00
00
00
00
00
00
00
00
00
00
00
00
00
00
00
00
00
00
00
00
00
00
00
00
00
00
00
00
0
106,
710
43,3
310
138
354
054
917
215
,199
333
966
7,52
9,33
14,
474,
436
08,
846
33,7
400
69,0
0414
,419
1,86
4,51
042
,757
126,
331
7,42
2,62
14,
431,
105
08,
708
33,3
860
68,4
5514
,247
1,84
9,31
142
,424
125,
365
00
00
00
00
00
1,59
77,
422,
621
4,43
1,10
50
8,70
833
,386
068
,455
14,2
471,
849,
311
42,4
2412
3,76
811
.957
9%7.
1386
%0.
0000
%0.
0140
%0.
0538
%0.
0000
%0.
1103
%0.
0230
%2.
9793
%0.
0683
%0.
1994
%
May
not
cro
ss-c
heck
due
to R
ound
ing
Case No. U-17273 Witness: J.C. Hoffman Malueg
Exhibit A-6 (JCHM-1) Schedule F1.2
Page 4 of 20

Mic
higa
n P
ublic
Ser
vice
Com
mis
sion
Mic
higa
n G
as U
tiliti
es C
orpo
ratio
nP
roje
cted
Cos
t of S
ervi
ce A
lloca
tion
Stu
dyP
roje
cted
Tes
t Yea
r End
ing
Dec
embe
r 31,
201
4
ALLO
CAT
ION
OF
OP
ER
ATIO
N &
MAI
NT
EN
ANC
E(A
)(B
)(C
)(D
)(E
)(F
)(G
)(H
)(I)
(J)
(K)
(L)
(N)
LIN
E
NO
.D
ES
CR
IPT
ION
ALLO
CAT
ION
FAC
TO
RC
OR
PO
RAT
E
TO
TAL
Res
iden
tial
Mul
ti-Fa
mily
- C
lass
IM
ulti-
Fam
ily -
Cla
ss II
Mul
ti-Fa
mily
- C
lass
III
Mul
ti-Fa
mily
- C
lass
IV
Sm
all G
ener
al
Ser
vice
Larg
e G
ener
al
Ser
vice
Tra
nspo
rt - T
R-1
Tra
nspo
rt - T
R-2
Tra
nspo
rt - T
R-3
1P
rodu
ctio
n:2
P
urch
ased
Gas
Cos
t - C
OG
Sal
es71
,684
,716
53,8
82,1
2810
3,74
654
4,10
915
3,74
522
3,83
215
,276
,696
1,49
8,86
20
00
3
Gas
Sup
ply
Acqu
isiti
onS
ales
509,
495
382,
964
737
3,86
71,
093
1,59
110
8,57
810
,653
00
04
P
rodu
ctio
n D
eman
dW
eigh
ted
Pea
k D
eman
d78
6,43
432
5,27
162
63,
500
989
1,44
098
,263
5,71
840
,146
72,5
8256
,044
5
Sto
rage
Cos
tS
tora
ge66
4,84
430
4,19
455
62,
901
805
1,22
686
,154
8,32
922
,404
38,7
5731
,031
6
Tot
al P
rodu
ctio
n73
,645
,489
54,8
94,5
5710
5,66
555
4,37
815
6,63
122
8,08
915
,569
,692
1,52
3,56
262
,551
111,
339
87,0
757 8
T
rans
mis
sion
9
Min
imum
Sys
tem
- T
hrou
ghpu
t Pie
ceM
CF
Thr
ough
put
33,4
9112
,275
2412
435
513,
480
341
2,03
34,
335
4,17
510
D
eman
d R
elat
ed S
yste
mW
eigh
ted
Pea
k D
eman
d31
2,68
312
9,32
624
91,
392
393
572
39,0
692,
273
15,9
6228
,858
22,2
8311
T
otal
Tra
nsm
issi
on34
6,17
414
1,60
127
31,
515
428
623
42,5
492,
615
17,9
9533
,193
26,4
5812 13
Dis
tribu
tion:
1430
2/30
3W
eigh
ted
Pea
k D
eman
d5,
672
2,34
65
257
1070
941
290
523
404
1537
4W
eigh
ted
Pea
k D
eman
d6,
118
2,53
05
278
1176
444
312
565
436
1637
5W
eigh
ted
Pea
k D
eman
d6,
410
2,65
15
298
1280
147
327
592
457
1737
6 (D
eman
d)W
eigh
ted
Pea
k D
eman
d1,
879,
513
777,
370
1,49
78,
364
2,36
33,
441
234,
842
13,6
6595
,946
173,
464
133,
940
1837
6 (F
ixed
Cos
t)C
usto
mer
2,21
9,09
31,
670,
174
1,66
42,
770
226
144
101,
437
221
1,49
652
193
1937
7M
CF
Thr
ough
put
00
00
00
00
00
020
378
Wei
ghte
d P
eak
Dem
and
178,
122
73,6
7214
279
322
432
622
,256
1,29
59,
093
16,4
3912
,694
2137
9W
eigh
ted
Pea
k D
eman
d13
3,38
655
,169
106
594
168
244
16,6
6697
06,
809
12,3
109,
506
2238
0S
ervi
ces
2,24
2,14
61,
694,
823
1,68
82,
652
216
137
97,1
2421
21,
928
671
120
2338
1M
eter
s2,
127,
857
1,15
0,23
174
55,
640
1,60
553
345
2,92
31,
010
9,02
23,
120
438
2438
2M
eter
s0
00
00
00
00
00
2538
3C
usto
mer
888,
284
668,
556
666
1,10
990
5740
,604
8959
920
837
2638
5Ac
ct 3
85 D
eman
d33
,557
00
00
00
1,09
67,
698
13,9
1710
,746
27
Tot
al D
istri
butio
n9,
720,
156
6,09
7,52
26,
522
22,0
024,
915
4,91
696
8,12
518
,691
133,
519
222,
331
168,
871
28 29C
usto
mer
Acc
ount
s:30
Al
loca
ble
Cus
tom
er8,
833,
261
6,64
8,24
86,
622
11,0
2589
957
140
3,77
688
15,
953
2,07
337
231
D
irect
Tra
nspo
rtT
rans
port
Cus
t27
4,23
30
00
00
00
44,3
2015
,433
2,77
032
C
usto
mer
- Ac
ct 9
04 A
lloca
ble
Mar
gin
Rev
enue
1,91
6,68
41,
048,
205
1,27
96,
581
1,56
92,
051
205,
954
11,8
6874
,378
80,7
2151
,971
33
Tot
al C
usto
mer
Acc
ount
s:11
,024
,178
7,69
6,45
47,
901
17,6
062,
468
2,62
260
9,73
012
,749
124,
652
98,2
2655
,113
34 35C
usto
mer
Ser
vice
s:M
argi
n R
even
ue70
1,93
338
3,87
646
82,
410
574
751
75,4
254,
346
27,2
3929
,562
19,0
3336
Cus
tom
er S
ales
:D
irect
00
00
00
00
00
037
Tot
al C
usto
mer
:11
,726
,111
8,08
0,33
08,
369
20,0
163,
042
3,37
368
5,15
517
,095
151,
891
127,
788
74,1
4638 39 40
Allo
c %
of D
istri
butio
n D
eman
d O
&M
41
(n
ot in
clud
ing
Dire
ct A
lloca
ted)
:D
ist O
&M
Dem
and
Rel
ated
100.
00%
40.7
4%0.
08%
0.44
%0.
12%
0.18
%12
.31%
0.77
%5.
37%
9.71
%7.
50%
42Al
loc
% o
f Cus
tom
er O
&M
(not
Dire
ct A
lloca
ted)
:C
usto
mer
O&
M10
0.00
%70
.56%
0.07
%0.
17%
0.03
%0.
03%
5.98
%0.
15%
0.94
%0.
98%
0.62
%43 44
Adm
inis
trativ
e &
Gen
eral
:45
P
urch
ased
Gas
Cos
tS
ales
00
00
00
00
00
046
G
as S
uppl
y Ac
quis
ition
Cos
tS
ales
282,
060
212,
012
408
2,14
160
588
160
,110
5,89
80
00
47
Pro
duct
ion
Dem
and
Wei
ghte
d P
eak
Dem
and
435,
376
180,
072
347
1,93
854
779
754
,399
3,16
522
,225
40,1
8231
,026
48
Sto
rage
Cos
tS
tora
ge26
2,10
811
9,92
621
91,
144
317
483
33,9
653,
284
8,83
315
,280
12,2
3449
D
istri
butio
n D
eman
dD
ist O
&M
Dem
and
Rel
ated
2,01
8,83
382
2,50
01,
584
8,85
02,
501
3,64
124
8,47
515
,445
108,
445
196,
061
151,
389
50
Cus
tom
erC
usto
mer
O&
M10
,588
,169
7,47
0,90
67,
738
18,5
062,
813
3,11
963
3,48
015
,806
99,4
5710
3,88
165
,993
51
Tra
nspo
rt Al
loca
ble
Tra
nspo
rt C
ust
178,
291
00
00
00
028
,815
10,0
341,
801
52
T
otal
Adm
inis
trativ
e an
d G
ener
al13
,764
,837
8,80
5,41
610
,296
32,5
786,
783
8,92
01,
030,
430
43,5
9826
7,77
536
5,43
726
2,44
253 54 55
Tot
al O
pera
tion
& M
aint
enan
ce10
9,20
2,76
778
,019
,426
131,
125
630,
489
171,
800
245,
921
18,2
95,9
521,
605,
560
633,
730
860,
088
618,
992
May
not
cro
ss-c
heck
due
to R
ound
ing
Case No. U-17273 Witness: J.C. Hoffman Malueg
Exhibit A-6 (JCHM-1) Schedule F1.2
Page 5 of 20

Mic
higa
n P
ublic
Ser
vice
Com
mis
sion
Mic
higa
n G
as U
tiliti
es C
orpo
ratio
nP
roje
cted
Cos
t of S
ervi
ce A
lloca
tion
Stu
dyP
roje
cted
Tes
t Yea
r End
ing
Dec
embe
r 31,
201
4
ALLO
CAT
ION
OF
OP
ER
ATIO
N &
MAI
NT
EN
ANC
E(A
)(B
)(C
)
LIN
E
NO
.D
ES
CR
IPT
ION
ALLO
CAT
ION
FAC
TO
RC
OR
PO
RAT
E
TO
TAL
1P
rodu
ctio
n:2
P
urch
ased
Gas
Cos
t - C
OG
Sal
es71
,684
,716
3
Gas
Sup
ply
Acqu
isiti
onS
ales
509,
495
4
Pro
duct
ion
Dem
and
Wei
ghte
d P
eak
Dem
and
786,
434
5
Sto
rage
Cos
tS
tora
ge66
4,84
46
T
otal
Pro
duct
ion
73,6
45,4
897 8
T
rans
mis
sion
9
Min
imum
Sys
tem
- T
hrou
ghpu
t Pie
ceM
CF
Thr
ough
put
33,4
9110
D
eman
d R
elat
ed S
yste
mW
eigh
ted
Pea
k D
eman
d31
2,68
311
T
otal
Tra
nsm
issi
on34
6,17
412 13
Dis
tribu
tion:
1430
2/30
3W
eigh
ted
Pea
k D
eman
d5,
672
1537
4W
eigh
ted
Pea
k D
eman
d6,
118
1637
5W
eigh
ted
Pea
k D
eman
d6,
410
1737
6 (D
eman
d)W
eigh
ted
Pea
k D
eman
d1,
879,
513
1837
6 (F
ixed
Cos
t)C
usto
mer
2,21
9,09
319
377
MC
F T
hrou
ghpu
t0
2037
8W
eigh
ted
Pea
k D
eman
d17
8,12
221
379
Wei
ghte
d P
eak
Dem
and
133,
386
2238
0S
ervi
ces
2,24
2,14
623
381
Met
ers
2,12
7,85
724
382
Met
ers
025
383
Cus
tom
er88
8,28
426
385
Acct
385
Dem
and
33,5
5727
T
otal
Dis
tribu
tion
9,72
0,15
628 29
Cus
tom
er A
ccou
nts:
30
Allo
cabl
eC
usto
mer
8,83
3,26
131
D
irect
Tra
nspo
rtT
rans
port
Cus
t27
4,23
332
C
usto
mer
- Ac
ct 9
04 A
lloca
ble
Mar
gin
Rev
enue
1,91
6,68
433
T
otal
Cus
tom
er A
ccou
nts:
11,0
24,1
7834 35
Cus
tom
er S
ervi
ces:
Mar
gin
Rev
enue
701,
933
36C
usto
mer
Sal
es:
Dire
ct0
37T
otal
Cus
tom
er:
11,7
26,1
1138 39 40
Allo
c %
of D
istri
butio
n D
eman
d O
&M
41
(n
ot in
clud
ing
Dire
ct A
lloca
ted)
:D
ist O
&M
Dem
and
Rel
ated
100.
00%
42Al
loc
% o
f Cus
tom
er O
&M
(not
Dire
ct A
lloca
ted)
:C
usto
mer
O&
M10
0.00
%43 44
Adm
inis
trativ
e &
Gen
eral
:45
P
urch
ased
Gas
Cos
tS
ales
046
G
as S
uppl
y Ac
quis
ition
Cos
tS
ales
282,
060
47
Pro
duct
ion
Dem
and
Wei
ghte
d P
eak
Dem
and
435,
376
48
Sto
rage
Cos
tS
tora
ge26
2,10
849
D
istri
butio
n D
eman
dD
ist O
&M
Dem
and
Rel
ated
2,01
8,83
350
C
usto
mer
Cus
tom
er O
&M
10,5
88,1
6951
T
rans
port
Allo
cabl
eT
rans
port
Cus
t17
8,29
152
Tot
al A
dmin
istra
tive
and
Gen
eral
13,7
64,8
3753 54 55
Tot
al O
pera
tion
& M
aint
enan
ce10
9,20
2,76
7
(D)
(E)
(F)
(G)
(H)
(I)(J
)(K
)(L
)(N
)(O
)
Cus
tom
er C
hoic
e -
Res
iden
tial
Cus
tom
er C
hoic
e -
Sm
all G
SC
usto
mer
Cho
ice
- La
rge
GS
Cus
tom
er C
hoic
e -
Mul
ti-Fa
mily
IC
usto
mer
Cho
ice
- M
ulti-
Fam
ily II
Cus
tom
er C
hoic
e -
Mul
ti-Fa
mily
III
Cus
tom
er C
hoic
e -
Mul
ti-Fa
mily
IVAg
g T
rans
port
- R
esid
entia
lAg
g T
rans
port
- S
mal
l GS
Agg
Tra
nspo
rt -
Larg
e G
SS
peci
al C
ontra
ct
00
00
00
00
00
1,59
70
00
00
00
00
011
70,6
1264
,812
088
328
01,
470
181
43,8
4151
96
64,9
9856
,514
085
288
01,
244
176
44,2
9985
625
135,
610
121,
326
017
361
60
2,71
435
788
,140
1,37
51,
640
2,66
52,
295
03
120
527
1,55
331
028
,075
25,7
690
3513
00
584
7217
,431
206
230
,740
28,0
640
3814
20
637
7918
,984
237
3
509
467
01
20
111
316
40
549
504
01
30
111
341
40
576
528
01
30
121
357
40
168,
756
154,
895
021
178
30
3,51
343
210
4,77
61,
240
1536
4,75
967
,058
052
170
80
147
454
6,65
040
130
00
00
00
00
00
15,9
9314
,679
020
740
333
419,
930
118
111
,976
10,9
930
1556
024
931
7,43
688
137
0,14
264
,206
052
867
80
141
461
6,36
738
1319
2,15
728
7,47
90
137
799
050
525
321
,064
144
520
00
00
00
00
00
146,
010
26,8
430
208
283
059
182
2,66
216
50
00
00
00
00
100
11,
271,
427
627,
653
01,
642
3,38
70
4,98
01,
857
159,
898
1,79
610
2
1,45
1,94
926
6,92
80
2,07
32,
817
058
51,
807
26,4
7015
953
00
00
00
013
,454
197,
068
1,18
70
229,
196
136,
824
026
91,
031
02,
114
440
57,1
031,
310
3,82
21,
681,
145
403,
752
02,
342
3,84
80
2,69
815
,702
280,
640
2,65
73,
875
83,9
3750
,108
098
378
077
416
120
,912
480
1,40
00
00
00
00
00
00
1,76
5,08
245
3,86
00
2,44
04,
225
03,
473
15,8
6330
1,55
33,
136
5,27
4
8.84
%8.
12%
0.00
%0.
01%
0.04
%0.
00%
0.18
%0.
02%
5.49
%0.
07%
0.00
%15
.41%
3.96
%0.
00%
0.02
%0.
04%
0.00
%0.
03%
0.02
%0.
91%
0.02
%0.
05%
00
00
00
00
00
00
00
00
00
00
06
39,0
9135
,880
049
181
081
410
024
,271
287
325
,625
22,2
800
3311
40
491
7017
,464
337
1017
8,55
316
3,88
80
223
828
03,
717
457
110,
858
1,40
216
1,63
1,95
841
9,62
90
2,25
63,
907
03,
211
2,22
796
,605
1,80
24,
877
00
00
00
08,
747
128,
122
772
01,
875,
227
641,
677
02,
562
5,03
00
8,23
211
,600
377,
320
4,60
14,
913
5,07
8,08
61,
872,
580
06,
856
13,4
000
20,0
3629
,755
945,
895
11,1
4511
,931
May
not
cro
ss-c
heck
due
to R
ound
ing
Case No. U-17273 Witness: J.C. Hoffman Malueg
Exhibit A-6 (JCHM-1) Schedule F1.2
Page 6 of 20

Mic
higa
n P
ublic
Ser
vice
Com
mis
sion
Mic
higa
n G
as U
tiliti
es C
orpo
ratio
nP
roje
cted
Cos
t of S
ervi
ce A
lloca
tion
Stu
dyP
roje
cted
Tes
t Yea
r End
ing
Dec
embe
r 31,
201
4
ALLO
CAT
ION
OF
DE
PR
EC
IAT
ION
EXP
EN
SE
(A)
(B)
(C)
(D)
(E)
(F)
(G)
(H)
(I)(J
)(K
)(L
)(N
)
LIN
E
NO
.D
ES
CR
IPT
ION
ALLO
CAT
ION
FAC
TO
RC
OR
PO
RAT
E
TO
TAL
Res
iden
tial
Mul
ti-Fa
mily
- C
lass
IM
ulti-
Fam
ily -
Cla
ss II
Mul
ti-Fa
mily
- C
lass
III
Mul
ti-Fa
mily
- C
lass
IV
Sm
all G
ener
al
Ser
vice
Larg
e G
ener
al
Ser
vice
Tra
nspo
rt - T
R-1
Tra
nspo
rt - T
R-2
Tra
nspo
rt - T
R-3
1D
EP
RE
CIA
TIO
N E
XPE
NS
E -
S/L
:2
P
rodu
ctio
n:3
P
urch
ased
Gas
Cos
tS
ales
00
00
00
00
00
04
P
rodu
ctio
n D
eman
dW
eigh
ted
Pea
k D
eman
d10
8,35
444
,815
8648
213
619
813
,539
788
5,53
110
,000
7,72
25
S
tora
ge C
ost
Sto
rage
379,
665
173,
713
317
1,65
746
070
049
,199
4,75
612
,794
22,1
3317
,721
6
Tot
al P
rodu
ctio
n48
8,01
921
8,52
840
42,
139
596
899
62,7
385,
544
18,3
2632
,133
25,4
427 8
T
rans
mis
sion
9
Min
imum
Sys
tem
- T
hrou
ghpu
t Pie
ceM
CF
Thr
ough
put
264,
897
97,0
9018
798
027
740
327
,527
2,70
116
,078
34,2
8433
,023
10
Dem
and
Rel
ated
Sys
tem
Wei
ghte
d P
eak
Dem
and
362,
753
150,
035
289
1,61
445
666
445
,325
2,63
718
,518
33,4
7925
,851
11
Tot
al T
rans
mis
sion
627,
650
247,
126
476
2,59
573
31,
067
72,8
525,
338
34,5
9667
,763
58,8
7412 13
D
istri
butio
n14
302/
303
Wei
ghte
d P
eak
Dem
and
1,05
643
71
51
213
28
5497
7515
374
Wei
ghte
d P
eak
Dem
and
4,53
11,
874
420
68
566
3323
141
832
316
375
Wei
ghte
d P
eak
Dem
and
3,63
91,
505
316
57
455
2618
633
625
917
376
(Dem
and)
Wei
ghte
d P
eak
Dem
and
2,02
3,14
883
6,77
81,
611
9,00
42,
544
3,70
425
2,78
814
,709
103,
279
186,
720
144,
176
1837
6 (F
ixed
Cos
t)C
usto
mer
2,38
8,67
81,
797,
810
1,79
12,
981
243
155
109,
188
238
1,61
056
110
119
377
MC
F T
hrou
ghpu
t0
00
00
00
00
00
2037
8W
eigh
ted
Pea
k D
eman
d23
0,64
195
,393
184
1,02
629
042
228
,818
1,67
711
,774
21,2
8616
,436
2137
9W
eigh
ted
Pea
k D
eman
d2,
525
1,04
42
113
531
518
129
233
180
2238
0S
ervi
ces
2,82
8,31
82,
137,
906
2,12
93,
345
273
173
122,
515
267
2,43
284
715
223
381
Met
ers
711,
548
384,
634
249
1,88
653
717
815
1,45
633
83,
017
1,04
314
724
382
Met
ers
00
00
00
00
00
025
383
Cus
tom
er45
0,86
333
9,33
733
856
346
2920
,609
4530
410
619
2638
5Ac
ct 3
85 D
eman
d19
,036
00
00
00
622
4,36
77,
895
6,09
627
T
otal
Dis
tribu
tion
8,66
3,98
25,
596,
718
6,31
118
,857
3,94
74,
683
686,
843
17,9
8212
7,38
121
9,54
216
7,96
328 29
C
usto
mer
Cus
tom
er0
00
00
00
00
00
30T
otal
Dep
reci
atio
n E
xpen
se -
S/L
9,77
9,65
16,
062,
371
7,19
123
,591
5,27
66,
649
822,
433
28,8
6418
0,30
331
9,43
825
2,28
031 32 33
Amor
tizat
ions
(406
/407
)0
00
00
00
00
00
34 35 36T
otal
Dep
reci
atio
n &
Am
ortiz
atio
n E
xpen
ses:
9,77
9,65
16,
062,
371
7,19
123
,591
5,27
66,
649
822,
433
28,8
6418
0,30
331
9,43
825
2,28
0
May
not
cro
ss-c
heck
due
to R
ound
ing
Case No. U-17273 Witness: J.C. Hoffman Malueg
Exhibit A-6 (JCHM-1) Schedule F1.2
Page 7 of 20

Mic
higa
n P
ublic
Ser
vice
Com
mis
sion
Mic
higa
n G
as U
tiliti
es C
orpo
ratio
nP
roje
cted
Cos
t of S
ervi
ce A
lloca
tion
Stu
dyP
roje
cted
Tes
t Yea
r End
ing
Dec
embe
r 31,
201
4
ALLO
CAT
ION
OF
DE
PR
EC
IAT
ION
EXP
EN
SE
(A)
(B)
(C)
LIN
E
NO
.D
ES
CR
IPT
ION
ALLO
CAT
ION
FAC
TO
RC
OR
PO
RAT
E
TO
TAL
1D
EP
RE
CIA
TIO
N E
XPE
NS
E -
S/L
:2
P
rodu
ctio
n:3
P
urch
ased
Gas
Cos
tS
ales
04
P
rodu
ctio
n D
eman
dW
eigh
ted
Pea
k D
eman
d10
8,35
45
S
tora
ge C
ost
Sto
rage
379,
665
6
Tot
al P
rodu
ctio
n48
8,01
97 8
T
rans
mis
sion
9
Min
imum
Sys
tem
- T
hrou
ghpu
t Pie
ceM
CF
Thr
ough
put
264,
897
10
Dem
and
Rel
ated
Sys
tem
Wei
ghte
d P
eak
Dem
and
362,
753
11
Tot
al T
rans
mis
sion
627,
650
12 13
Dis
tribu
tion
1430
2/30
3W
eigh
ted
Pea
k D
eman
d1,
056
1537
4W
eigh
ted
Pea
k D
eman
d4,
531
1637
5W
eigh
ted
Pea
k D
eman
d3,
639
1737
6 (D
eman
d)W
eigh
ted
Pea
k D
eman
d2,
023,
148
1837
6 (F
ixed
Cos
t)C
usto
mer
2,38
8,67
819
377
MC
F T
hrou
ghpu
t0
2037
8W
eigh
ted
Pea
k D
eman
d23
0,64
121
379
Wei
ghte
d P
eak
Dem
and
2,52
522
380
Ser
vice
s2,
828,
318
2338
1M
eter
s71
1,54
824
382
Met
ers
025
383
Cus
tom
er45
0,86
326
385
Acct
385
Dem
and
19,0
3627
T
otal
Dis
tribu
tion
8,66
3,98
228 29
C
usto
mer
Cus
tom
er0
30T
otal
Dep
reci
atio
n E
xpen
se -
S/L
9,77
9,65
131 32 33
Amor
tizat
ions
(406
/407
)0
34 35 36T
otal
Dep
reci
atio
n &
Am
ortiz
atio
n E
xpen
ses:
9,77
9,65
1
(D)
(E)
(F)
(G)
(H)
(I)(J
)(K
)(L
)(N
)(O
)
Cus
tom
er C
hoic
e -
Res
iden
tial
Cus
tom
er C
hoic
e -
Sm
all G
SC
usto
mer
Cho
ice
- La
rge
GS
Cus
tom
er C
hoic
e -
Mul
ti-Fa
mily
IC
usto
mer
Cho
ice
- M
ulti-
Fam
ily II
Cus
tom
er C
hoic
e -
Mul
ti-Fa
mily
III
Cus
tom
er C
hoic
e -
Mul
ti-Fa
mily
IVAg
g T
rans
port
- R
esid
entia
lAg
g T
rans
port
- S
mal
l GS
Agg
Tra
nspo
rt -
Larg
e G
SS
peci
al C
ontra
ct
00
00
00
00
00
09,
729
8,93
00
1245
020
325
6,04
072
137
,118
32,2
730
4916
50
711
101
25,2
9748
914
46,8
4741
,203
061
210
091
312
631
,338
560
15
21,0
7718
,156
026
920
412
5412
,281
245
332
,571
29,8
950
4115
10
678
8320
,222
239
353
,647
48,0
520
6724
30
1,09
013
732
,503
485
6
9587
00
00
20
591
040
737
30
12
08
125
33
032
730
00
02
07
120
32
018
1,65
316
6,73
30
227
843
03,
782
465
112,
783
1,33
516
392,
634
72,1
820
561
762
015
848
97,
158
4314
00
00
00
00
00
020
,709
19,0
080
2696
043
153
12,8
5715
22
227
208
00
10
51
141
20
466,
910
80,9
920
667
855
017
758
18,
031
4816
64,2
5796
,132
046
267
016
985
7,04
448
170
00
00
00
00
00
74,1
1013
,624
010
614
40
3092
1,35
18
30
00
00
00
00
561
1,20
1,32
644
9,63
90
1,63
32,
971
04,
769
1,76
714
9,87
91,
699
69
00
00
00
00
00
01,
301,
821
538,
894
01,
761
3,42
30
6,77
22,
030
213,
720
2,74
490
00
00
00
00
00
0
1,30
1,82
153
8,89
40
1,76
13,
423
06,
772
2,03
021
3,72
02,
744
90
May
not
cro
ss-c
heck
due
to R
ound
ing
Case No. U-17273 Witness: J.C. Hoffman Malueg
Exhibit A-6 (JCHM-1) Schedule F1.2
Page 8 of 20

Mic
higa
n P
ublic
Ser
vice
Com
mis
sion
Mic
higa
n G
as U
tiliti
es C
orpo
ratio
nP
roje
cted
Cos
t of S
ervi
ce A
lloca
tion
Stu
dyP
roje
cted
Tes
t Yea
r End
ing
Dec
embe
r 31,
201
4
ALLO
CAT
ION
OF
TAX
ES
OT
HE
R T
HAN
INC
OM
E T
AXE
S(A
)(B
)(C
)(D
)(E
)(F
)(G
)(H
)(I)
(J)
(K)
(L)
(N)
LIN
E
NO
.D
ES
CR
IPT
ION
ALLO
CAT
ION
FAC
TO
RC
OR
PO
RAT
E
TO
TAL
Res
iden
tial
Mul
ti-Fa
mily
- C
lass
IM
ulti-
Fam
ily -
Cla
ss II
Mul
ti-Fa
mily
- C
lass
III
Mul
ti-Fa
mily
- C
lass
IV
Sm
all G
ener
al
Ser
vice
Larg
e G
ener
al
Ser
vice
Tra
nspo
rt - T
R-1
Tra
nspo
rt - T
R-2
Tra
nspo
rt - T
R-3
1R
eal E
st &
Pro
perty
Rat
e B
ase
3,36
6,21
41,
867,
400
2,43
09,
833
2,45
03,
264
345,
594
17,5
1088
,627
158,
100
128,
861
2U
nem
ploy
men
t Com
p. -
FED
Sal
arie
s &
Wag
es11
,802
6,16
09
4111
151,
179
6041
073
756
93
Une
mpl
oym
ent C
omp.
- S
tate
Sal
arie
s &
Wag
es44
,156
23,0
4835
152
3956
4,41
122
51,
534
2,75
72,
128
4IB
S P
ayro
ll T
axS
alar
ies
& W
ages
397,
745
207,
614
311
1,36
535
450
539
,737
2,02
813
,817
24,8
3519
,172
5Fr
anch
ise
Tax
Fee
s an
d S
tate
Uni
tary
Fee
sR
ate
Bas
e0
00
00
00
00
00
6U
naut
hor I
ns T
ax a
nd U
se T
axR
ate
Bas
e15
,982
8,86
612
4712
151,
641
8342
175
161
27
Fede
ral E
xcis
e T
axR
ate
Bas
e61
033
80
20
163
316
2923
8R
etire
men
t Ben
efits
- FE
DS
alar
ies
& W
ages
668,
268
348,
821
523
2,29
459
584
966
,765
3,40
723
,214
41,7
2632
,211
9T
OT
AL T
AXE
S O
TH
ER
TH
AN IN
CO
ME
4,50
4,77
72,
462,
247
3,32
013
,733
3,46
04,
706
459,
390
23,3
1612
8,03
822
8,93
518
3,57
6
May
not
cro
ss-c
heck
due
to R
ound
ing
Case No. U-17273 Witness: J.C. Hoffman Malueg
Exhibit A-6 (JCHM-1) Schedule F1.2
Page 9 of 20

Mic
higa
n P
ublic
Ser
vice
Com
mis
sion
Mic
higa
n G
as U
tiliti
es C
orpo
ratio
nP
roje
cted
Cos
t of S
ervi
ce A
lloca
tion
Stu
dyP
roje
cted
Tes
t Yea
r End
ing
Dec
embe
r 31,
201
4
ALLO
CAT
ION
OF
TAX
ES
OT
HE
R T
HAN
INC
OM
E T
AXE
S(A
)(B
)(C
)
LIN
E
NO
.D
ES
CR
IPT
ION
ALLO
CAT
ION
FAC
TO
RC
OR
PO
RAT
E
TO
TAL
1R
eal E
st &
Pro
perty
Rat
e B
ase
3,36
6,21
42
Une
mpl
oym
ent C
omp.
- FE
DS
alar
ies
& W
ages
11,8
023
Une
mpl
oym
ent C
omp.
- S
tate
Sal
arie
s &
Wag
es44
,156
4IB
S P
ayro
ll T
axS
alar
ies
& W
ages
397,
745
5Fr
anch
ise
Tax
Fee
s an
d S
tate
Uni
tary
Fee
sR
ate
Bas
e0
6U
naut
hor I
ns T
ax a
nd U
se T
axR
ate
Bas
e15
,982
7Fe
dera
l Exc
ise
Tax
Rat
e B
ase
610
8R
etire
men
t Ben
efits
- FE
DS
alar
ies
& W
ages
668,
268
9T
OT
AL T
AXE
S O
TH
ER
TH
AN IN
CO
ME
4,50
4,77
7
(D)
(E)
(F)
(G)
(H)
(I)(J
)(K
)(L
)(N
)(O
)
Cus
tom
er C
hoic
e -
Res
iden
tial
Cus
tom
er C
hoic
e -
Sm
all G
SC
usto
mer
Cho
ice
- La
rge
GS
Cus
tom
er C
hoic
e -
Mul
ti-Fa
mily
IC
usto
mer
Cho
ice
- M
ulti-
Fam
ily II
Cus
tom
er C
hoic
e -
Mul
ti-Fa
mily
III
Cus
tom
er C
hoic
e -
Mul
ti-Fa
mily
IVAg
g T
rans
port
- R
esid
entia
lAg
g T
rans
port
- S
mal
l GS
Agg
Tra
nspo
rt -
Larg
e G
SS
peci
al C
ontra
ct39
5,35
522
5,63
80
520
1,23
90
3,31
372
011
3,51
71,
783
621,
341
778
02
50
153
463
60
5,01
62,
910
07
170
5710
1,73
221
045
,182
26,2
150
6015
30
516
8815
,602
186
30
00
00
00
00
00
1,87
71,
071
02
60
163
539
80
7241
00
00
10
210
075
,913
44,0
450
101
258
086
714
926
,214
313
552
4,75
530
0,69
80
692
1,67
80
4,78
597
415
8,08
72,
317
71
May
not
cro
ss-c
heck
due
to R
ound
ing
Case No. U-17273 Witness: J.C. Hoffman Malueg
Exhibit A-6 (JCHM-1) Schedule F1.2 Page 10 of 20

Mic
higa
n P
ublic
Ser
vice
Com
mis
sion
Mic
higa
n G
as U
tiliti
es C
orpo
ratio
nP
roje
cted
Cos
t of S
ervi
ce A
lloca
tion
Stu
dyP
roje
cted
Tes
t Yea
r End
ing
Dec
embe
r 31,
201
4
ALLO
CAT
ION
OF
OT
HE
R IN
CO
ME
& A
DJU
ST
S(A
)(B
)(C
)(D
)(E
)(F
)(G
)(H
)(I)
(J)
(K)
(L)
(N)
LIN
E
NO
.D
ES
CR
IPT
ION
ALLO
CAT
ION
FAC
TO
RC
OR
PO
RAT
E
TO
TAL
Res
iden
tial
Mul
ti-Fa
mily
- C
lass
IM
ulti-
Fam
ily -
Cla
ss II
Mul
ti-Fa
mily
- C
lass
III
Mul
ti-Fa
mily
- C
lass
IV
Sm
all G
ener
al
Ser
vice
Larg
e G
ener
al
Ser
vice
Tra
nspo
rt - T
R-1
Tra
nspo
rt - T
R-2
Tra
nspo
rt - T
R-3
1B
EFO
RE
TAX
AD
JUST
MEN
TS:
2G
ain/
(Los
s) -
Sal
e of
Util
ity P
rope
rtyR
ate
Bas
e0
00
00
00
00
00
3T
OT
AL O
TH
ER
AD
JUS
TS
00
00
00
00
00
04 5 6
AFT
ER T
AX
AD
JUST
MEN
TS:
7T
ax A
mor
tizat
ions
(409
)R
ate
Bas
e0
00
00
00
00
00
8T
ax A
mor
tizat
ions
(419
/426
/431
)R
ate
Bas
e0
00
00
00
00
00
9T
OT
AL O
TH
ER
AD
JUS
TS
00
00
00
00
00
0
May
not
cro
ss-c
heck
due
to R
ound
ing
Case No. U-17273 Witness: J.C. Hoffman Malueg
Exhibit A-6 (JCHM-1) Schedule F1.2 Page 11 of 20

Mic
higa
n P
ublic
Ser
vice
Com
mis
sion
Mic
higa
n G
as U
tiliti
es C
orpo
ratio
nP
roje
cted
Cos
t of S
ervi
ce A
lloca
tion
Stu
dyP
roje
cted
Tes
t Yea
r End
ing
Dec
embe
r 31,
201
4
ALLO
CAT
ION
OF
OT
HE
R IN
CO
ME
& A
DJU
ST
S(A
)(B
)(C
)
LIN
E
NO
.D
ES
CR
IPT
ION
ALLO
CAT
ION
FAC
TO
RC
OR
PO
RAT
E
TO
TAL
1B
EFO
RE
TAX
AD
JUST
MEN
TS:
2G
ain/
(Los
s) -
Sal
e of
Util
ity P
rope
rtyR
ate
Bas
e0
3T
OT
AL O
TH
ER
AD
JUS
TS
04 5 6
AFT
ER T
AX
AD
JUST
MEN
TS:
7T
ax A
mor
tizat
ions
(409
)R
ate
Bas
e0
8T
ax A
mor
tizat
ions
(419
/426
/431
)R
ate
Bas
e0
9T
OT
AL O
TH
ER
AD
JUS
TS
0
(D)
(E)
(F)
(G)
(H)
(I)(J
)(K
)(L
)(N
)(O
)
Cus
tom
er C
hoic
e -
Res
iden
tial
Cus
tom
er C
hoic
e -
Sm
all G
SC
usto
mer
Cho
ice
- La
rge
GS
Cus
tom
er C
hoic
e -
Mul
ti-Fa
mily
IC
usto
mer
Cho
ice
- M
ulti-
Fam
ily II
Cus
tom
er C
hoic
e -
Mul
ti-Fa
mily
III
Cus
tom
er C
hoic
e -
Mul
ti-Fa
mily
IVAg
g T
rans
port
- R
esid
entia
lAg
g T
rans
port
- S
mal
l GS
Agg
Tra
nspo
rt -
Larg
e G
SS
peci
al C
ontra
ct
00
00
00
00
00
00
00
00
00
00
00
00
00
00
00
00
00
00
00
00
00
00
00
00
00
00
00
0
May
not
cro
ss-c
heck
due
to R
ound
ing
Case No. U-17273 Witness: J.C. Hoffman Malueg
Exhibit A-6 (JCHM-1) Schedule F1.2 Page 12 of 20

Mic
higa
n P
ublic
Ser
vice
Com
mis
sion
Mic
higa
n G
as U
tiliti
es C
orpo
ratio
nP
roje
cted
Cos
t of S
ervi
ce A
lloca
tion
Stu
dyP
roje
cted
Tes
t Yea
r End
ing
Dec
embe
r 31,
201
4
ALLO
CAT
ION
OF
RAT
E B
ASE
CO
MP
ON
EN
T -
PLA
NT
IN S
ER
VIC
E(A
)(B
)(C
)(D
)(E
)(F
)(G
)(H
)(I)
(J)
(K)
(L)
(N)
LIN
E
NO
.D
ES
CR
IPT
ION
ALLO
CAT
ION
FAC
TO
RC
OR
PO
RAT
E
TO
TAL
Res
iden
tial
Mul
ti-Fa
mily
- C
lass
IM
ulti-
Fam
ily -
Cla
ss II
Mul
ti-Fa
mily
- C
lass
III
Mul
ti-Fa
mily
- C
lass
IV
Sm
all G
ener
al
Ser
vice
Larg
e G
ener
al
Ser
vice
Tra
nspo
rt - T
R-1
Tra
nspo
rt - T
R-2
Tra
nspo
rt - T
R-3
1G
AS P
LAN
T:
2
Pro
duct
ion:
3
Pur
chas
ed G
as C
ost
Sal
es0
00
00
00
00
00
4
Pro
duct
ion
Dem
and
Wei
ghte
d P
eak
Dem
and
2,36
5,43
097
8,34
71,
884
10,5
272,
974
4,33
029
5,55
617
,198
120,
751
218,
310
168,
568
5
Sto
rage
Cos
tS
tora
ge17
,211
,746
7,87
5,09
114
,386
75,1
0620
,834
31,7
502,
230,
394
215,
621
580,
016
1,00
3,36
680
3,34
46
T
otal
Pro
duct
ion
19,5
77,1
768,
853,
438
16,2
6985
,633
23,8
0936
,080
2,52
5,95
023
2,81
970
0,76
81,
221,
676
971,
912
7 8
Tra
nsm
issi
on9
M
inim
um S
yste
m -
Thr
ough
put P
iece
MC
F T
hrou
ghpu
t23
,586
,665
8,64
4,99
916
,645
87,2
9824
,667
35,9
122,
451,
036
240,
482
1,43
1,58
73,
052,
659
2,94
0,42
710
D
eman
d R
elat
ed S
yste
mW
eigh
ted
Pea
k D
eman
d30
,753
,432
12,7
19,6
8124
,491
136,
861
38,6
7256
,301
3,84
2,58
222
3,59
41,
569,
914
2,83
8,29
42,
191,
587
11
Tot
al T
rans
mis
sion
54,3
40,0
9721
,364
,680
41,1
3622
4,15
963
,339
92,2
136,
293,
618
464,
076
3,00
1,50
15,
890,
953
5,13
2,01
412 13
D
istri
butio
n14
302/
303
Wei
ghte
d P
eak
Dem
and
320,
446
132,
537
255
1,42
640
358
740
,039
2,33
016
,358
29,5
7522
,836
1537
4W
eigh
ted
Pea
k D
eman
d34
5,65
314
2,96
327
51,
538
435
633
43,1
892,
513
17,6
4531
,901
24,6
3216
375
Wei
ghte
d P
eak
Dem
and
362,
159
149,
790
288
1,61
245
566
345
,251
2,63
318
,488
33,4
2425
,809
1737
6 (D
eman
d)W
eigh
ted
Pea
k D
eman
d61
,903
,775
25,6
03,5
2649
,298
275,
488
77,8
4311
3,32
87,
734,
757
450,
075
3,16
0,09
05,
713,
220
4,41
1,45
818
376
(Fix
ed C
ost)
Cus
tom
er73
,088
,183
55,0
08,9
4854
,790
91,2
197,
440
4,72
83,
340,
921
7,29
349
,256
17,1
523,
079
1937
7M
CF
Thr
ough
put
00
00
00
00
00
020
378
Wei
ghte
d P
eak
Dem
and
5,86
3,90
82,
425,
324
4,67
026
,096
7,37
410
,735
732,
684
42,6
3429
9,34
354
1,19
241
7,88
121
379
Wei
ghte
d P
eak
Dem
and
67,6
8527
,995
5430
185
124
8,45
749
23,
455
6,24
74,
823
2238
0S
ervi
ces
80,7
73,6
9661
,056
,291
60,8
1495
,533
7,79
24,
951
3,49
8,89
37,
638
69,4
5624
,186
4,34
123
381
Met
ers
39,6
27,2
6621
,420
,859
13,8
7210
5,03
529
,882
9,92
18,
434,
831
18,8
1116
8,01
558
,113
8,16
324
382
Met
ers
00
00
00
00
00
025
383
Cus
tom
er16
,542
,584
12,4
50,5
7812
,401
20,6
461,
684
1,07
075
6,17
51,
651
11,1
493,
882
697
2638
5Ac
ct 3
85 D
eman
d62
4,93
00
00
00
020
,417
143,
351
259,
169
200,
117
27
Tot
al D
istri
butio
n27
9,52
0,28
517
8,41
8,81
119
6,71
761
8,89
513
3,39
214
6,74
024
,635
,197
556,
486
3,95
6,60
66,
718,
059
5,12
3,83
628 29
C
usto
mer
Cus
tom
er0
00
00
00
00
00
30 31T
otal
Pla
nt in
Ser
vice
353,
437,
558
208,
636,
928
254,
122
928,
687
220,
540
275,
033
33,4
54,7
641,
253,
381
7,65
8,87
513
,830
,688
11,2
27,7
61
May
not
cro
ss-c
heck
due
to R
ound
ing
Case No. U-17273 Witness: J.C. Hoffman Malueg
Exhibit A-6 (JCHM-1) Schedule F1.2 Page 13 of 20

Mic
higa
n P
ublic
Ser
vice
Com
mis
sion
Mic
higa
n G
as U
tiliti
es C
orpo
ratio
nP
roje
cted
Cos
t of S
ervi
ce A
lloca
tion
Stu
dyP
roje
cted
Tes
t Yea
r End
ing
Dec
embe
r 31,
201
4
ALLO
CAT
ION
OF
RAT
E B
ASE
CO
MP
ON
EN
T -
PLA
NT
IN S
ER
VIC
E(A
)(B
)(C
)
LIN
E
NO
.D
ES
CR
IPT
ION
ALLO
CAT
ION
FAC
TO
RC
OR
PO
RAT
E
TO
TAL
1G
AS P
LAN
T:
2
Pro
duct
ion:
3
Pur
chas
ed G
as C
ost
Sal
es0
4
Pro
duct
ion
Dem
and
Wei
ghte
d P
eak
Dem
and
2,36
5,43
05
S
tora
ge C
ost
Sto
rage
17,2
11,7
466
T
otal
Pro
duct
ion
19,5
77,1
767 8
T
rans
mis
sion
9
Min
imum
Sys
tem
- T
hrou
ghpu
t Pie
ceM
CF
Thr
ough
put
23,5
86,6
6510
D
eman
d R
elat
ed S
yste
mW
eigh
ted
Pea
k D
eman
d30
,753
,432
11
Tot
al T
rans
mis
sion
54,3
40,0
9712 13
D
istri
butio
n14
302/
303
Wei
ghte
d P
eak
Dem
and
320,
446
1537
4W
eigh
ted
Pea
k D
eman
d34
5,65
316
375
Wei
ghte
d P
eak
Dem
and
362,
159
1737
6 (D
eman
d)W
eigh
ted
Pea
k D
eman
d61
,903
,775
1837
6 (F
ixed
Cos
t)C
usto
mer
73,0
88,1
8319
377
MC
F T
hrou
ghpu
t0
2037
8W
eigh
ted
Pea
k D
eman
d5,
863,
908
2137
9W
eigh
ted
Pea
k D
eman
d67
,685
2238
0S
ervi
ces
80,7
73,6
9623
381
Met
ers
39,6
27,2
6624
382
Met
ers
025
383
Cus
tom
er16
,542
,584
2638
5Ac
ct 3
85 D
eman
d62
4,93
027
T
otal
Dis
tribu
tion
279,
520,
285
28 29
Cus
tom
erC
usto
mer
030 31
Tot
al P
lant
in S
ervi
ce35
3,43
7,55
8
(D)
(E)
(F)
(G)
(H)
(I)(J
)(K
)(L
)(N
)(O
)
Cus
tom
er C
hoic
e -
Res
iden
tial
Cus
tom
er C
hoic
e -
Sm
all G
SC
usto
mer
Cho
ice
- La
rge
GS
Cus
tom
er C
hoic
e -
Mul
ti-Fa
mily
IC
usto
mer
Cho
ice
- M
ulti-
Fam
ily II
Cus
tom
er C
hoic
e -
Mul
ti-Fa
mily
III
Cus
tom
er C
hoic
e -
Mul
ti-Fa
mily
IVAg
g T
rans
port
- R
esid
entia
lAg
g T
rans
port
- S
mal
l GS
Agg
Tra
nspo
rt -
Larg
e G
SS
peci
al C
ontra
ct
00
00
00
00
00
021
2,38
519
4,94
10
265
985
04,
422
543
131,
864
1,56
118
1,68
2,70
51,
463,
066
02,
199
7,45
80
32,2
134,
565
1,14
6,82
822
,159
644
1,89
5,09
01,
658,
007
02,
465
8,44
40
36,6
345,
108
1,27
8,69
223
,720
662
1,87
6,70
81,
616,
639
02,
346
8,17
00
36,6
684,
799
1,09
3,54
221
,826
256
2,76
1,26
42,
534,
466
03,
451
12,8
080
57,4
857,
061
1,71
4,38
720
,294
238
4,63
7,97
24,
151,
105
05,
797
20,9
780
94,1
5311
,860
2,80
7,92
942
,120
495
28,7
7226
,409
036
133
059
974
17,8
6421
12
31,0
3528
,486
039
144
064
679
19,2
6922
83
32,5
1729
,846
041
151
067
783
20,1
8923
93
5,55
8,16
65,
101,
643
06,
947
25,7
810
115,
712
14,2
133,
450,
900
40,8
4948
012
,013
,719
2,20
8,61
40
17,1
5223
,309
04,
838
14,9
5321
9,01
41,
319
440
00
00
00
00
00
052
6,50
448
3,25
90
658
2,44
20
10,9
611,
346
326,
891
3,86
945
6,07
75,
578
08
280
127
163,
773
451
13,3
34,4
332,
313,
046
019
,037
24,4
110
5,06
616
,597
229,
370
1,38
246
13,
578,
559
5,35
3,74
50
2,54
314
,875
09,
395
4,71
239
2,28
42,
686
966
00
00
00
00
00
02,
719,
153
499,
892
03,
882
5,27
60
1,09
53,
384
49,5
7129
910
00
00
00
00
00
1,85
322
37,8
28,9
3716
,050
,518
050
,342
96,5
510
149,
116
55,4
574,
729,
125
52,9
812,
521
00
00
00
00
00
0
44,3
61,9
9921
,859
,630
058
,604
125,
972
027
9,90
472
,424
8,81
5,74
511
8,82
13,
678
May
not
cro
ss-c
heck
due
to R
ound
ing
Case No. U-17273 Witness: J.C. Hoffman Malueg
Exhibit A-6 (JCHM-1) Schedule F1.2 Page 14 of 20

Mic
higa
n P
ublic
Ser
vice
Com
mis
sion
Mic
higa
n G
as U
tiliti
es C
orpo
ratio
nP
roje
cted
Cos
t of S
ervi
ce A
lloca
tion
Stu
dyP
roje
cted
Tes
t Yea
r End
ing
Dec
embe
r 31,
201
4
ALLO
CAT
ION
OF
RAT
E B
ASE
CO
MP
ON
EN
T -
DE
PR
EC
IAT
ION
RE
SE
RVE
- S
/L(A
)(B
)(C
)(D
)(E
)(F
)(G
)(H
)(I)
(J)
(K)
(L)
(N)
LIN
E
NO
.D
ES
CR
IPT
ION
ALLO
CAT
ION
FAC
TO
RC
OR
PO
RAT
E
TO
TAL
Res
iden
tial
Mul
ti-Fa
mily
- C
lass
IM
ulti-
Fam
ily -
Cla
ss II
Mul
ti-Fa
mily
- C
lass
III
Mul
ti-Fa
mily
- C
lass
IV
Sm
all G
ener
al
Ser
vice
Larg
e G
ener
al
Ser
vice
Tra
nspo
rt - T
R-1
Tra
nspo
rt - T
R-2
Tra
nspo
rt - T
R-3
1D
EP
RE
CIA
TIO
N R
ES
ER
VE -
S/L
:2
P
rodu
ctio
n:3
P
urch
ased
Gas
Cos
tS
ales
00
00
00
00
00
04
P
rodu
ctio
n D
eman
dW
eigh
ted
Pea
k D
eman
d(1
,265
,721
)(5
23,5
05)
(1,0
08)
(5,6
33)
(1,5
92)
(2,3
17)
(158
,149
)(9
,202
)(6
4,61
3)(1
16,8
16)
(90,
199)
5
Sto
rage
Cos
tS
tora
ge(8
,189
,880
)(3
,747
,212
)(6
,845
)(3
5,73
8)(9
,914
)(1
5,10
7)(1
,061
,290
)(1
02,5
99)
(275
,990
)(4
77,4
32)
(382
,256
)6
T
otal
Pro
duct
ion
(9,4
55,6
01)
(4,2
70,7
16)
(7,8
53)
(41,
371)
(11,
505)
(17,
425)
(1,2
19,4
40)
(111
,802
)(3
40,6
03)
(594
,248
)(4
72,4
55)
7 8
Tra
nsm
issi
on9
M
inim
um S
yste
m -
Thr
ough
put P
iece
MC
F T
hrou
ghpu
t(1
3,20
2,81
7)(4
,839
,104
)(9
,317
)(4
8,86
6)(1
3,80
8)(2
0,10
2)(1
,371
,986
)(1
34,6
11)
(801
,342
)(1
,708
,749
)(1
,645
,927
)10
D
eman
d R
elat
ed S
yste
mW
eigh
ted
Pea
k D
eman
d(1
5,63
6,66
1)(6
,467
,355
)(1
2,45
2)(6
9,58
7)(1
9,66
3)(2
8,62
6)(1
,953
,771
)(1
13,6
87)
(798
,227
)(1
,443
,138
)(1
,114
,318
)11
T
otal
Tra
nsm
issi
on(2
8,83
9,47
8)(1
1,30
6,45
9)(2
1,77
0)(1
18,4
53)
(33,
470)
(48,
728)
(3,3
25,7
57)
(248
,299
)(1
,599
,569
)(3
,151
,887
)(2
,760
,244
)12 13
D
istri
butio
n14
302/
303
Wei
ghte
d P
eak
Dem
and
(308
,981
)(1
27,7
95)
(246
)(1
,375
)(3
89)
(566
)(3
8,60
7)(2
,246
)(1
5,77
3)(2
8,51
6)(2
2,01
9)15
374
Wei
ghte
d P
eak
Dem
and
(34,
895)
(14,
433)
(28)
(155
)(4
4)(6
4)(4
,360
)(2
54)
(1,7
81)
(3,2
20)
(2,4
87)
1637
5W
eigh
ted
Pea
k D
eman
d(2
40,0
75)
(99,
295)
(191
)(1
,068
)(3
02)
(440
)(2
9,99
7)(1
,745
)(1
2,25
5)(2
2,15
7)(1
7,10
8)17
376
(Dem
and)
Wei
ghte
d P
eak
Dem
and
(35,
478,
047)
(14,
673,
792)
(28,
253)
(157
,887
)(4
4,61
3)(6
4,95
0)(4
,432
,914
)(2
57,9
45)
(1,8
11,0
98)
(3,2
74,3
38)
(2,5
28,2
78)
1837
6 (F
ixed
Cos
t)C
usto
mer
(41,
888,
011)
(31,
526,
511)
(31,
401)
(52,
279)
(4,2
64)
(2,7
10)
(1,9
14,7
36)
(4,1
80)
(28,
230)
(9,8
30)
(1,7
64)
1937
7M
CF
Thr
ough
put
00
00
00
00
00
020
378
Wei
ghte
d P
eak
Dem
and
(3,6
03,2
40)
(1,4
90,3
07)
(2,8
69)
(16,
035)
(4,5
31)
(6,5
97)
(450
,218
)(2
6,19
8)(1
83,9
40)
(332
,550
)(2
56,7
78)
2137
9W
eigh
ted
Pea
k D
eman
d3,
374
1,39
63
154
642
225
172
311
240
2238
0S
ervi
ces
(44,
651,
434)
(33,
751,
717)
(33,
618)
(52,
810)
(4,3
07)
(2,7
37)
(1,9
34,1
76)
(4,2
22)
(38,
395)
(13,
370)
(2,4
00)
2338
1M
eter
s(1
7,76
1,01
5)(9
,600
,869
)(6
,217
)(4
7,07
7)(1
3,39
3)(4
,446
)(3
,780
,507
)(8
,431
)(7
5,30
4)(2
6,04
6)(3
,659
)24
382
Met
ers
00
00
00
00
00
025
383
Cus
tom
er(6
,447
,819
)(4
,852
,874
)(4
,834
)(8
,047
)(6
56)
(417
)(2
94,7
35)
(643
)(4
,345
)(1
,513
)(2
72)
2638
5Ac
ct 3
85 D
eman
d(3
72,9
79)
00
00
00
(12,
185)
(85,
557)
(154
,681
)(1
19,4
37)
27
Tot
al D
istri
butio
n(1
50,7
83,1
20)
(96,
136,
197)
(107
,655
)(3
36,7
20)
(72,
495)
(82,
920)
(12,
879,
827)
(318
,026
)(2
,256
,507
)(3
,865
,910
)(2
,953
,960
)28 29
C
usto
mer
Cus
tom
er0
00
00
00
00
00
30 31T
otal
Dep
reci
atio
n R
eser
ve -
Stra
ight
Lin
e:(1
89,0
78,1
99)
(111
,713
,373
)(1
37,2
77)
(496
,543
)(1
17,4
70)
(149
,073
)(1
7,42
5,02
4)(6
78,1
26)
(4,1
96,6
78)
(7,6
12,0
45)
(6,1
86,6
60)
May
not
cro
ss-c
heck
due
to R
ound
ing
Case No. U-17273 Witness: J.C. Hoffman Malueg
Exhibit A-6 (JCHM-1) Schedule F1.2 Page 15 of 20

Mic
higa
n P
ublic
Ser
vice
Com
mis
sion
Mic
higa
n G
as U
tiliti
es C
orpo
ratio
nP
roje
cted
Cos
t of S
ervi
ce A
lloca
tion
Stu
dyP
roje
cted
Tes
t Yea
r End
ing
Dec
embe
r 31,
201
4
ALLO
CAT
ION
OF
RAT
E B
ASE
CO
MP
ON
EN
T -
DE
PR
EC
IAT
ION
RE
SE
RVE
- S
/L(A
)(B
)(C
)
LIN
E
NO
.D
ES
CR
IPT
ION
ALLO
CAT
ION
FAC
TO
RC
OR
PO
RAT
E
TO
TAL
1D
EP
RE
CIA
TIO
N R
ES
ER
VE -
S/L
:2
P
rodu
ctio
n:3
P
urch
ased
Gas
Cos
tS
ales
04
P
rodu
ctio
n D
eman
dW
eigh
ted
Pea
k D
eman
d(1
,265
,721
)5
S
tora
ge C
ost
Sto
rage
(8,1
89,8
80)
6
Tot
al P
rodu
ctio
n(9
,455
,601
)7 8
T
rans
mis
sion
9
Min
imum
Sys
tem
- T
hrou
ghpu
t Pie
ceM
CF
Thr
ough
put
(13,
202,
817)
10
Dem
and
Rel
ated
Sys
tem
Wei
ghte
d P
eak
Dem
and
(15,
636,
661)
11
Tot
al T
rans
mis
sion
(28,
839,
478)
12 13
Dis
tribu
tion
1430
2/30
3W
eigh
ted
Pea
k D
eman
d(3
08,9
81)
1537
4W
eigh
ted
Pea
k D
eman
d(3
4,89
5)16
375
Wei
ghte
d P
eak
Dem
and
(240
,075
)17
376
(Dem
and)
Wei
ghte
d P
eak
Dem
and
(35,
478,
047)
1837
6 (F
ixed
Cos
t)C
usto
mer
(41,
888,
011)
1937
7M
CF
Thr
ough
put
020
378
Wei
ghte
d P
eak
Dem
and
(3,6
03,2
40)
2137
9W
eigh
ted
Pea
k D
eman
d3,
374
2238
0S
ervi
ces
(44,
651,
434)
2338
1M
eter
s(1
7,76
1,01
5)24
382
Met
ers
025
383
Cus
tom
er(6
,447
,819
)26
385
Acct
385
Dem
and
(372
,979
)27
T
otal
Dis
tribu
tion
(150
,783
,120
)28 29
C
usto
mer
Cus
tom
er0
30 31T
otal
Dep
reci
atio
n R
eser
ve -
Stra
ight
Lin
e:(1
89,0
78,1
99)
(D)
(E)
(F)
(G)
(H)
(I)(J
)(K
)(L
)(N
)(O
)
Cus
tom
er C
hoic
e -
Res
iden
tial
Cus
tom
er C
hoic
e -
Sm
all G
SC
usto
mer
Cho
ice
- La
rge
GS
Cus
tom
er C
hoic
e -
Mul
ti-Fa
mily
IC
usto
mer
Cho
ice
- M
ulti-
Fam
ily II
Cus
tom
er C
hoic
e -
Mul
ti-Fa
mily
III
Cus
tom
er C
hoic
e -
Mul
ti-Fa
mily
IVAg
g T
rans
port
- R
esid
entia
lAg
g T
rans
port
- S
mal
l GS
Agg
Tra
nspo
rt -
Larg
e G
SS
peci
al C
ontra
ct
00
00
00
00
00
0(1
13,6
46)
(104
,311
)0
(142
)(5
27)
0(2
,366
)(2
91)
(70,
559)
(835
)(1
0)(8
00,6
83)
(696
,172
)0
(1,0
47)
(3,5
49)
0(1
5,32
8)(2
,172
)(5
45,6
96)
(10,
544)
(307
)(9
14,3
28)
(800
,483
)0
(1,1
89)
(4,0
76)
0(1
7,69
4)(2
,463
)(6
16,2
55)
(11,
379)
(316
)
(1,0
50,5
02)
(904
,926
)0
(1,3
13)
(4,5
73)
0(2
0,52
5)(2
,686
)(6
12,1
18)
(12,
217)
(143
)(1
,403
,972
)(1
,288
,656
)0
(1,7
55)
(6,5
12)
0(2
9,22
9)(3
,590
)(8
71,6
84)
(10,
318)
(121
)(2
,454
,474
)(2
,193
,582
)0
(3,0
68)
(11,
085)
0(4
9,75
3)(6
,276
)(1
,483
,803
)(2
2,53
6)(2
65)
(27,
743)
(25,
464)
0(3
5)(1
29)
0(5
78)
(71)
(17,
224)
(204
)(2
)(3
,133
)(2
,876
)0
(4)
(15)
0(6
5)(8
)(1
,945
)(2
3)(0
)(2
1,55
6)(1
9,78
5)0
(27)
(100
)0
(449
)(5
5)(1
3,38
3)(1
58)
(2)
(3,1
85,4
74)
(2,9
23,8
33)
0(3
,981
)(1
4,77
6)0
(66,
317)
(8,1
46)
(1,9
77,7
66)
(23,
411)
(275
)(6
,885
,255
)(1
,265
,792
)0
(9,8
30)
(13,
359)
0(2
,773
)(8
,570
)(1
25,5
21)
(756
)(2
52)
00
00
00
00
00
0(3
23,5
25)
(296
,952
)0
(404
)(1
,501
)0
(6,7
35)
(827
)(2
00,8
67)
(2,3
78)
(28)
303
278
00
10
61
188
20
(7,3
71,2
31)
(1,2
78,6
44)
0(1
0,52
4)(1
3,49
4)0
(2,8
01)
(9,1
75)
(126
,795
)(7
64)
(255
)(1
,603
,917
)(2
,399
,558
)0
(1,1
40)
(6,6
67)
0(4
,211
)(2
,112
)(1
75,8
22)
(1,2
04)
(433
)0
00
00
00
00
00
(1,0
59,8
47)
(194
,843
)0
(1,5
13)
(2,0
56)
0(4
27)
(1,3
19)
(19,
321)
(116
)(3
9)0
00
00
00
00
(1,1
06)
(13)
(20,
481,
377)
(8,4
07,4
70)
0(2
7,45
7)(5
2,09
4)0
(84,
348)
(30,
282)
(2,6
58,4
58)
(30,
118)
(1,2
99)
00
00
00
00
00
0
(23,
850,
180)
(11,
401,
535)
0(3
1,71
4)(6
7,25
6)0
(151
,795
)(3
9,02
1)(4
,758
,516
)(6
4,03
4)(1
,880
)
May
not
cro
ss-c
heck
due
to R
ound
ing
Case No. U-17273 Witness: J.C. Hoffman Malueg
Exhibit A-6 (JCHM-1) Schedule F1.2 Page 16 of 20

Mic
higa
n P
ublic
Ser
vice
Com
mis
sion
Mic
higa
n G
as U
tiliti
es C
orpo
ratio
nP
roje
cted
Cos
t of S
ervi
ce A
lloca
tion
Stu
dyP
roje
cted
Tes
t Yea
r End
ing
Dec
embe
r 31,
201
4
ALLO
CAT
ION
OF
RAT
E B
ASE
CO
MP
ON
EN
T -
CO
NS
TR
UC
TIO
N W
OR
K IN
PR
OG
RE
SS
(A)
(B)
(C)
(D)
(E)
(F)
(G)
(H)
(I)(J
)(K
)(L
)(N
)
LIN
E
NO
.D
ES
CR
IPT
ION
ALLO
CAT
ION
FAC
TO
RC
OR
PO
RAT
E
TO
TAL
Res
iden
tial
Mul
ti-Fa
mily
- C
lass
IM
ulti-
Fam
ily -
Cla
ss II
Mul
ti-Fa
mily
- C
lass
III
Mul
ti-Fa
mily
- C
lass
IV
Sm
all G
ener
al
Ser
vice
Larg
e G
ener
al
Ser
vice
Tra
nspo
rt - T
R-1
Tra
nspo
rt - T
R-2
Tra
nspo
rt - T
R-3
1C
ON
ST
RU
CT
ION
WO
RK
IN P
RO
GR
ES
S2
P
rodu
ctio
n:3
P
urch
ased
Gas
Cos
tS
ales
00
00
00
00
00
04
P
rodu
ctio
n D
eman
dW
eigh
ted
Pea
k D
eman
d0
00
00
00
00
00
5
Sto
rage
Cos
tS
tora
ge0
00
00
00
00
00
6
Tot
al P
rodu
ctio
n0
00
00
00
00
00
7 8
Tra
nsm
issi
on9
M
inim
um S
yste
m -
Thr
ough
put P
iece
MC
F T
hrou
ghpu
t0
00
00
00
00
00
10
Dem
and
Rel
ated
Sys
tem
Wei
ghte
d P
eak
Dem
and
00
00
00
00
00
011
T
otal
Tra
nsm
issi
on0
00
00
00
00
00
12 13
Dis
tribu
tion
1430
2/30
3W
eigh
ted
Pea
k D
eman
d0
00
00
00
00
00
1537
4W
eigh
ted
Pea
k D
eman
d0
00
00
00
00
00
1637
5W
eigh
ted
Pea
k D
eman
d0
00
00
00
00
00
1737
6 (D
eman
d)W
eigh
ted
Pea
k D
eman
d0
00
00
00
00
00
1837
6 (F
ixed
Cos
t)C
usto
mer
00
00
00
00
00
019
377
MC
F T
hrou
ghpu
t0
00
00
00
00
00
2037
8W
eigh
ted
Pea
k D
eman
d0
00
00
00
00
00
2137
9W
eigh
ted
Pea
k D
eman
d0
00
00
00
00
00
2238
0S
ervi
ces
00
00
00
00
00
023
381
Met
ers
00
00
00
00
00
024
382
Met
ers
00
00
00
00
00
025
383
Cus
tom
er0
00
00
00
00
00
2638
5Ac
ct 3
85 D
eman
d0
00
00
00
00
00
27
Tot
al D
istri
butio
n0
00
00
00
00
00
28 29
Cus
tom
erC
usto
mer
00
00
00
00
00
030 31
Tot
al C
onst
ruct
ion
Wor
k in
Pro
gres
s0
00
00
00
00
00
May
not
cro
ss-c
heck
due
to R
ound
ing
Case No. U-17273 Witness: J.C. Hoffman Malueg
Exhibit A-6 (JCHM-1) Schedule F1.2 Page 17 of 20

Mic
higa
n P
ublic
Ser
vice
Com
mis
sion
Mic
higa
n G
as U
tiliti
es C
orpo
ratio
nP
roje
cted
Cos
t of S
ervi
ce A
lloca
tion
Stu
dyP
roje
cted
Tes
t Yea
r End
ing
Dec
embe
r 31,
201
4
ALLO
CAT
ION
OF
RAT
E B
ASE
CO
MP
ON
EN
T -
CO
NS
TR
UC
TIO
N W
OR
K IN
PR
OG
RE
SS
(A)
(B)
(C)
LIN
E
NO
.D
ES
CR
IPT
ION
ALLO
CAT
ION
FAC
TO
RC
OR
PO
RAT
E
TO
TAL
1C
ON
ST
RU
CT
ION
WO
RK
IN P
RO
GR
ES
S2
P
rodu
ctio
n:3
P
urch
ased
Gas
Cos
tS
ales
04
P
rodu
ctio
n D
eman
dW
eigh
ted
Pea
k D
eman
d0
5
Sto
rage
Cos
tS
tora
ge0
6
Tot
al P
rodu
ctio
n0
7 8
Tra
nsm
issi
on9
M
inim
um S
yste
m -
Thr
ough
put P
iece
MC
F T
hrou
ghpu
t0
10
Dem
and
Rel
ated
Sys
tem
Wei
ghte
d P
eak
Dem
and
011
T
otal
Tra
nsm
issi
on0
12 13
Dis
tribu
tion
1430
2/30
3W
eigh
ted
Pea
k D
eman
d0
1537
4W
eigh
ted
Pea
k D
eman
d0
1637
5W
eigh
ted
Pea
k D
eman
d0
1737
6 (D
eman
d)W
eigh
ted
Pea
k D
eman
d0
1837
6 (F
ixed
Cos
t)C
usto
mer
019
377
MC
F T
hrou
ghpu
t0
2037
8W
eigh
ted
Pea
k D
eman
d0
2137
9W
eigh
ted
Pea
k D
eman
d0
2238
0S
ervi
ces
023
381
Met
ers
024
382
Met
ers
025
383
Cus
tom
er0
2638
5Ac
ct 3
85 D
eman
d0
27
Tot
al D
istri
butio
n0
28 29
Cus
tom
erC
usto
mer
030 31
Tot
al C
onst
ruct
ion
Wor
k in
Pro
gres
s0
(D)
(E)
(F)
(G)
(H)
(I)(J
)(K
)(L
)(N
)(O
)
Cus
tom
er C
hoic
e -
Res
iden
tial
Cus
tom
er C
hoic
e -
Sm
all G
SC
usto
mer
Cho
ice
- La
rge
GS
Cus
tom
er C
hoic
e -
Mul
ti-Fa
mily
IC
usto
mer
Cho
ice
- M
ulti-
Fam
ily II
Cus
tom
er C
hoic
e -
Mul
ti-Fa
mily
III
Cus
tom
er C
hoic
e -
Mul
ti-Fa
mily
IVAg
g T
rans
port
- R
esid
entia
lAg
g T
rans
port
- S
mal
l GS
Agg
Tra
nspo
rt -
Larg
e G
SS
peci
al C
ontra
ct
00
00
00
00
00
00
00
00
00
00
00
00
00
00
00
00
00
00
00
00
00
00
00
00
00
00
00
00
00
00
00
00
00
00
00
00
00
00
0
00
00
00
00
00
00
00
00
00
00
00
00
00
00
00
00
00
00
00
00
00
00
00
00
00
00
00
00
00
00
00
00
00
00
00
00
00
00
00
00
00
00
00
00
00
00
00
00
00
00
00
00
00
00
00
00
00
00
00
00
00
00
00
00
00
00
00
00
00
00
00
00
00
00
00
00
00
00
00
00
00
00
0
00
00
00
00
00
0
May
not
cro
ss-c
heck
due
to R
ound
ing
Case No. U-17273 Witness: J.C. Hoffman Malueg
Exhibit A-6 (JCHM-1) Schedule F1.2 Page 18 of 20

Mic
higa
n P
ublic
Ser
vice
Com
mis
sion
Mic
higa
n G
as U
tiliti
es C
orpo
ratio
nP
roje
cted
Cos
t of S
ervi
ce A
lloca
tion
Stu
dyP
roje
cted
Tes
t Yea
r End
ing
Dec
embe
r 31,
201
4
OT
HE
R R
ATE
BAS
E C
OM
PO
NE
NT
S(A
)(B
)(C
)(D
)(E
)(F
)(G
)(H
)(I)
(J)
(K)
(L)
(N)
LIN
E
NO
.D
ES
CR
IPT
ION
ALLO
CAT
ION
FAC
TO
RC
OR
PO
RAT
E
TO
TAL
Res
iden
tial
Mul
ti-Fa
mily
- C
lass
IM
ulti-
Fam
ily -
Cla
ss II
Mul
ti-Fa
mily
- C
lass
III
Mul
ti-Fa
mily
- C
lass
IV
Sm
all G
ener
al
Ser
vice
Larg
e G
ener
al
Ser
vice
Tra
nspo
rt - T
R-1
Tra
nspo
rt - T
R-2
Tra
nspo
rt - T
R-3
1 2G
as S
tore
d U
nder
grou
nd:
Sto
rage
14,9
76,5
156,
852,
380
12,5
1765
,352
18,1
2927
,626
1,94
0,74
018
7,61
950
4,69
187
3,06
269
9,01
63 4
Fuel
Sto
ck0
00
00
00
00
00
5 6W
orki
ng C
apita
l Allo
wan
ce7
Ene
rgy
Rel
ated
MC
F T
hrou
ghpu
t2,
746,
387
1,00
6,60
71,
938
10,1
652,
872
4,18
228
5,39
428
,001
166,
691
355,
446
342,
378
8
P
rodu
ctio
n D
eman
d R
elat
edW
eigh
ted
Pea
k D
eman
d23
9,31
687
,714
169
886
250
364
24,8
692,
440
14,5
2530
,973
29,8
349
Tra
nsm
issi
on R
elat
edW
eigh
ted
Pea
k D
eman
d4,
599,
387
1,90
2,31
63,
663
20,4
695,
784
8,42
057
4,68
533
,440
234,
791
424,
486
327,
767
10
D
istri
butio
n R
elat
edW
eigh
ted
Pea
k D
eman
d23
,373
,980
9,72
8,50
616
,622
86,2
4123
,314
37,7
932,
751,
832
261,
270
1,19
3,20
52,
049,
359
1,66
5,70
411
Sto
rage
Rel
ated
Wei
ghte
d P
eak
Dem
and
1,63
2,03
274
6,72
31,
364
7,12
21,
976
3,01
121
1,48
820
,445
54,9
9895
,140
76,1
7412
Cus
tom
er R
elat
edC
usto
mer
00
00
00
00
00
013
S
ub-T
otal
32,5
91,1
0213
,471
,866
23,7
5612
4,88
334
,196
53,7
703,
848,
267
345,
596
1,66
4,21
02,
955,
404
2,44
1,85
614 15
Mat
eria
ls &
Sup
plie
s:16
D
istri
butio
n D
eman
dW
eigh
ted
Pea
k D
eman
d15
3,79
463
,610
122
684
193
282
19,2
161,
118
7,85
114
,194
10,9
6017
D
istri
butio
n Fi
xed
Cos
tC
usto
mer
358,
425
269,
764
269
447
3623
16,3
8436
242
8415
18
Sub
-Tot
al51
2,21
933
3,37
439
11,
131
229
305
35,6
001,
154
8,09
314
,278
10,9
7519 20
Oth
er -
Def
erre
d T
axes
(M&
S /
CW
IP)
21
Dis
tribu
tion
Dem
and
Wei
ghte
d P
eak
Dem
and
00
00
00
00
00
022
D
istri
butio
n Fi
xed
Cos
tC
usto
mer
00
00
00
00
00
023
S
ub-T
otal
00
00
00
00
00
024 25
Pre
paym
ents
:26
Ene
rgy
Rel
ated
MC
F T
hrou
ghpu
t77
828
51
31
181
847
101
9727
Pro
duct
ion
Dem
and
Rel
ated
Wei
ghte
d P
eak
Dem
and
38,4
6515
,909
3117
148
704,
806
280
1,96
43,
550
2,74
128
Tra
nsm
issi
on R
elat
edW
eigh
ted
Pea
k D
eman
d13
,251
5,48
111
5917
241,
656
9667
61,
223
944
29
D
istri
butio
n R
elat
edW
eigh
ted
Pea
k D
eman
d45
9,59
419
0,08
936
62,
045
578
841
57,4
253,
342
23,4
6242
,417
32,7
5230
Sto
rage
Rel
ated
Sto
rage
15,6
007,
138
1368
1929
2,02
219
552
690
972
831
Cus
tom
er R
elat
edC
usto
mer
00
00
00
00
00
032
S
ub-T
otal
527,
688
218,
901
421
2,34
666
296
665
,989
3,92
126
,675
48,2
0037
,263
33 34C
ash
& B
ank
Bal
ance
s:35
Ene
rgy
Rel
ated
MC
F T
hrou
ghpu
t16
962
01
00
182
1022
2136
Pro
duct
ion
Dem
and
Rel
ated
Wei
ghte
d P
eak
Dem
and
187,
795
77,6
7215
083
623
634
423
,465
1,36
59,
587
17,3
3213
,383
37
T
rans
mis
sion
Rel
ated
Wei
ghte
d P
eak
Dem
and
282
117
01
01
352
1426
2038
Dis
tribu
tion
Rel
ated
Wei
ghte
d P
eak
Dem
and
1,43
459
31
62
317
910
7313
210
239
Sto
rage
Rel
ated
Sto
rage
100
460
00
013
13
65
40
C
usto
mer
Rel
ated
Cus
tom
er0
00
00
00
00
00
41
Sub
-Tot
al18
9,78
078
,489
152
845
238
348
23,7
101,
380
9,68
817
,518
13,5
3142 43
Pro
perty
, Pay
roll
& In
com
e T
axes
Acc
rued
:44
Ene
rgy
Rel
ated
MC
F T
hrou
ghpu
t13
,945
5,11
110
5215
211,
449
142
846
1,80
51,
738
45
P
rodu
ctio
n D
eman
d R
elat
edW
eigh
ted
Pea
k D
eman
d(1
9,66
7)(8
,134
)(1
6)(8
8)(2
5)(3
6)(2
,457
)(1
43)
(1,0
04)
(1,8
15)
(1,4
02)
46
T
rans
mis
sion
Rel
ated
Wei
ghte
d P
eak
Dem
and
(407
,820
)(1
68,6
75)
(325
)(1
,815
)(5
13)
(747
)(5
0,95
6)(2
,965
)(2
0,81
9)(3
7,63
9)(2
9,06
3)47
Dis
tribu
tion
Rel
ated
Wei
ghte
d P
eak
Dem
and
(2,1
21,0
64)
(877
,276
)(1
,689
)(9
,439
)(2
,667
)(3
,883
)(2
65,0
23)
(15,
421)
(108
,277
)(1
95,7
57)
(151
,154
)48
Sto
rage
Rel
ated
Sto
rage
(128
,916
)(5
8,98
4)(1
08)
(563
)(1
56)
(238
)(1
6,70
6)(1
,615
)(4
,344
)(7
,515
)(6
,017
)49
Cus
tom
er R
elat
edC
usto
mer
00
00
00
00
00
050
S
ub-T
otal
(2,6
63,5
22)
(1,1
07,9
59)
(2,1
28)
(11,
853)
(3,3
47)
(4,8
83)
(333
,692
)(2
0,00
2)(1
33,5
98)
(240
,922
)(1
85,8
97)
51 52T
OT
AL O
TH
ER
RAT
E B
ASE
CO
MP
ON
EN
TS
46,1
33,7
8219
,847
,052
35,1
0918
2,70
450
,108
78,1
315,
580,
614
519,
669
2,07
9,75
93,
667,
540
3,01
6,74
3
May
not
cro
ss-c
heck
due
to R
ound
ing
Case No. U-17273 Witness: J.C. Hoffman Malueg
Exhibit A-6 (JCHM-1) Schedule F1.2 Page 19 of 20

Mic
higa
n P
ublic
Ser
vice
Com
mis
sion
Mic
higa
n G
as U
tiliti
es C
orpo
ratio
nP
roje
cted
Cos
t of S
ervi
ce A
lloca
tion
Stu
dyP
roje
cted
Tes
t Yea
r End
ing
Dec
embe
r 31,
201
4
OT
HE
R R
ATE
BAS
E C
OM
PO
NE
NT
S(A
)(B
)(C
)
LIN
E
NO
.D
ES
CR
IPT
ION
ALLO
CAT
ION
FAC
TO
RC
OR
PO
RAT
E
TO
TAL
1 2G
as S
tore
d U
nder
grou
nd:
Sto
rage
14,9
76,5
153 4
Fuel
Sto
ck0
5 6W
orki
ng C
apita
l Allo
wan
ce7
Ene
rgy
Rel
ated
MC
F T
hrou
ghpu
t2,
746,
387
8
P
rodu
ctio
n D
eman
d R
elat
edW
eigh
ted
Pea
k D
eman
d23
9,31
69
Tra
nsm
issi
on R
elat
edW
eigh
ted
Pea
k D
eman
d4,
599,
387
10
D
istri
butio
n R
elat
edW
eigh
ted
Pea
k D
eman
d23
,373
,980
11
S
tora
ge R
elat
edW
eigh
ted
Pea
k D
eman
d1,
632,
032
12
C
usto
mer
Rel
ated
Cus
tom
er0
13
Sub
-Tot
al32
,591
,102
14 15M
ater
ials
& S
uppl
ies:
16
Dis
tribu
tion
Dem
and
Wei
ghte
d P
eak
Dem
and
153,
794
17
Dis
tribu
tion
Fixe
d C
ost
Cus
tom
er35
8,42
518
S
ub-T
otal
512,
219
19 20O
ther
- D
efer
red
Tax
es (M
&S
/ C
WIP
)21
D
istri
butio
n D
eman
dW
eigh
ted
Pea
k D
eman
d0
22
Dis
tribu
tion
Fixe
d C
ost
Cus
tom
er0
23
Sub
-Tot
al0
24 25P
repa
ymen
ts:
26
E
nerg
y R
elat
edM
CF
Thr
ough
put
778
27
P
rodu
ctio
n D
eman
d R
elat
edW
eigh
ted
Pea
k D
eman
d38
,465
28
T
rans
mis
sion
Rel
ated
Wei
ghte
d P
eak
Dem
and
13,2
5129
Dis
tribu
tion
Rel
ated
Wei
ghte
d P
eak
Dem
and
459,
594
30
S
tora
ge R
elat
edS
tora
ge15
,600
31
C
usto
mer
Rel
ated
Cus
tom
er0
32
Sub
-Tot
al52
7,68
833 34
Cas
h &
Ban
k B
alan
ces:
35
E
nerg
y R
elat
edM
CF
Thr
ough
put
169
36
P
rodu
ctio
n D
eman
d R
elat
edW
eigh
ted
Pea
k D
eman
d18
7,79
537
Tra
nsm
issi
on R
elat
edW
eigh
ted
Pea
k D
eman
d28
238
Dis
tribu
tion
Rel
ated
Wei
ghte
d P
eak
Dem
and
1,43
439
Sto
rage
Rel
ated
Sto
rage
100
40
C
usto
mer
Rel
ated
Cus
tom
er0
41
Sub
-Tot
al18
9,78
042 43
Pro
perty
, Pay
roll
& In
com
e T
axes
Acc
rued
:44
Ene
rgy
Rel
ated
MC
F T
hrou
ghpu
t13
,945
45
P
rodu
ctio
n D
eman
d R
elat
edW
eigh
ted
Pea
k D
eman
d(1
9,66
7)46
Tra
nsm
issi
on R
elat
edW
eigh
ted
Pea
k D
eman
d(4
07,8
20)
47
D
istri
butio
n R
elat
edW
eigh
ted
Pea
k D
eman
d(2
,121
,064
)48
Sto
rage
Rel
ated
Sto
rage
(128
,916
)49
Cus
tom
er R
elat
edC
usto
mer
050
S
ub-T
otal
(2,6
63,5
22)
51 52T
OT
AL O
TH
ER
RAT
E B
ASE
CO
MP
ON
EN
TS
46,1
33,7
82
(D)
(E)
(F)
(G)
(H)
(I)(J
)(K
)(L
)(N
)(O
)
Cus
tom
er C
hoic
e -
Res
iden
tial
Cus
tom
er C
hoic
e -
Sm
all G
SC
usto
mer
Cho
ice
- La
rge
GS
Cus
tom
er C
hoic
e -
Mul
ti-Fa
mily
IC
usto
mer
Cho
ice
- M
ulti-
Fam
ily II
Cus
tom
er C
hoic
e -
Mul
ti-Fa
mily
III
Cus
tom
er C
hoic
e -
Mul
ti-Fa
mily
IVAg
g T
rans
port
- R
esid
entia
lAg
g T
rans
port
- S
mal
l GS
Agg
Tra
nspo
rt -
Larg
e G
SS
peci
al C
ontra
ct
1,46
4,17
81,
273,
063
01,
914
6,49
00
28,0
303,
972
997,
893
19,2
8256
1
00
00
00
00
00
0
218,
520
188,
238
027
395
10
4,27
055
912
7,33
02,
541
3019
,042
16,4
030
2483
037
249
11,0
9522
13
412,
966
379,
047
051
61,
916
08,
597
1,05
625
6,39
83,
035
362,
038,
951
1,79
3,18
90
2,81
19,
237
038
,035
5,92
41,
639,
840
30,7
461,
403
159,
555
138,
729
020
970
70
3,05
443
310
8,74
32,
101
610
00
00
00
00
00
2,84
9,03
42,
515,
606
03,
832
12,8
950
54,3
288,
021
2,14
3,40
638
,644
1,53
3
13,8
0912
,675
017
640
287
358,
573
101
158
,915
10,8
310
8411
40
2473
1,07
46
272
,724
23,5
060
101
178
031
110
89,
647
107
3
00
00
00
00
00
00
00
00
00
00
00
00
00
00
00
00
0
6253
00
00
10
361
03,
454
3,17
00
416
072
92,
144
250
1,19
01,
092
01
60
253
739
90
41,2
6637
,876
052
191
085
910
625
,621
303
41,
525
1,32
60
27
029
41,
039
201
00
00
00
00
00
047
,496
43,5
180
5922
00
986
122
29,5
7935
84
1312
00
00
00
80
016
,862
15,4
770
2178
035
143
10,4
6912
41
2523
00
00
10
160
012
911
80
01
03
080
10
109
00
00
00
70
00
00
00
00
00
00
17,0
3915
,639
021
790
355
4310
,579
125
1
1,11
095
60
15
022
364
713
0(1
,766
)(1
,621
)0
(2)
(8)
0(3
7)(5
)(1
,096
)(1
3)0
(36,
617)
(33,
609)
0(4
6)(1
70)
0(7
62)
(94)
(22,
734)
(269
)(3
)(1
90,4
44)
(174
,802
)0
(238
)(8
83)
0(3
,965
)(4
87)
(118
,241
)(1
,400
)(1
6)(1
2,60
3)(1
0,95
8)0
(16)
(56)
0(2
41)
(34)
(8,5
90)
(166
)(5
)0
00
00
00
00
00
(240
,321
)(2
20,0
35)
0(3
01)
(1,1
12)
0(4
,983
)(6
17)
(150
,014
)(1
,835
)(2
4)
4,21
0,15
13,
651,
297
05,
626
18,7
490
79,0
2711
,649
3,04
1,08
956
,682
2,07
8
May
not
cro
ss-c
heck
due
to R
ound
ing
Case No. U-17273 Witness: J.C. Hoffman Malueg
Exhibit A-6 (JCHM-1) Schedule F1.2 Page 20 of 20

Michigan Public Service CommissionMichigan Gas Utilities CorporationProjected Cost of Service Allocation StudyProjected Test Year Ending December 31, 2014Revenue Requirement and Rate Base by Individual Rate Schedule
(A) (B) (C) (D) (E) (F) (G) (H) (I) (J)
GAS SUPPLY DISTRIBUTION DISTRIBUTION ENHANCEDLINE PURCHASED ACQUISITION PRODUCTION STORAGE DEMAND CUSTOMER OTHERNO. RATE: RESIDENTIAL GAS COST COST DEMAND COST RELATED RELATED CUSTOMER SERVICES TOTAL
12 Operation & Maintenance Expense:3 Production:4 Purchased Gas Cost 53,882,128 53,882,128 5 Gas Supply Acquisition Cost 382,964 382,964 6 Production Demand 325,271 325,271 7 Storage Cost 304,194 304,194 8 Total - Production 53,882,128 382,964 325,271 304,194 - - - - 54,894,557 910 Transmission: 129,326 12,275 141,601 11 Distribution: 913,738 5,183,784 6,097,522 12 Customer Accounts and Services: - 13 Allocable 8,080,330 8,080,330 14 Transport Allocable - - 15 Customer Sales: - - 16 Administrative & General: - 212,012 180,072 119,926 822,500 - 7,470,906 - 8,805,416 17 Total Operation & Maintenance Expense: 53,882,128 594,976 505,343 424,119 1,865,564 5,196,059 15,551,236 - 78,019,426 1819 Depreciation & Amort Expense: - - 44,815 173,713 1,087,067 4,756,777 - - 6,062,371 2021 Taxes Other Than Income Taxes:22 Unemployment Comp - FED & STATE 606 936 563 1,890 15,949 9,264 - 29,209 23 Retirement Benefits - FED 7,242 11,178 6,729 22,568 190,473 110,631 - 348,821 24 IBS Payroll Tax 4,310 6,653 4,005 13,432 113,367 65,846 - 207,614 25 Michigan SBT & Real Estate/Property - - 10,043 186,710 482,753 1,187,894 - - 1,867,400 26 Misc - Unauthorized Ins. Tax & Franchise - - 50 920 2,379 5,855 - - 9,204 27 Total Taxes Other Than Income Taxes: - 12,158 28,859 198,928 523,021 1,513,540 185,741 - 2,462,247 2829 Other Income Before Income Taxes: - - - - - - - - - 3031 Income Taxes - - 8,369 155,579 402,261 989,832 - - 1,556,040 32 ITC - - - - - - - - - 3334 Other Income After Income Taxes: - - - - - - - - - 3536 TOTAL EXPENSES: 53,882,128 607,134 587,386 952,339 3,877,914 12,456,207 15,736,977 - 88,100,085 3738 Other Operating Income (Revenue Credits):39 Acct 487, Acct 493, Acct 495: IL Tax Fee - - (1,412) (26,246) (67,862) (166,985) - - (262,505) 40 Acct 488, Acct 495: Miscellaneous (225,791) (225,791) 41 Acct 495: Customer Penalities & Gas True-up (244,288) (244,288) 42 Acct 495: VBA and Decoupling related - - 43 Total Other Operating Income: (244,288) - (1,412) (26,246) (67,862) (166,985) (225,791) - (732,584) 4445 Actual Return (Net Operating Income) - - 2,481 46,120 119,246 293,424 - - 461,271 4647 Return Income Deficiency - - 37,739 701,599 1,814,037 4,463,744 - - 7,017,119 4849 Additional Income Taxes on Deficiency: - - 9,328 173,411 448,366 1,103,281 - - 1,734,385 5051 REVENUE REQUIREMENTS: 53,637,841 607,134 635,522 1,847,222 6,191,701 18,149,671 15,511,185 - 96,580,276 5253545556 RATE BASE:57 Utility Plant in Service - - 978,347 7,875,091 41,201,815 158,581,675 - - 208,636,928 58 Accumulated Depreciation - S/L - - (523,505) (3,747,212) (22,871,581) (84,571,075) - - (111,713,373) 59 Construction Work in Progress - - - - - - - - - 60 Net Plant in Service - - 454,842 4,127,880 18,330,234 74,010,600 - - 96,923,556 6162 Gas Stored Underground: - - - 6,852,380 - - - - 6,852,380 63 Fuel Stock - - - - - - - - - 64 Working Capital Allowance - - 87,714 746,723 12,637,429 - - - 13,471,866 65 Materials & Supplies: - - - - 63,610 269,764 - - 333,374 66 Other - Deferred Taxes (M&S / CWIP) - - - - - - - - - 67 Prepayments - - 15,909 7,138 195,855 - - - 218,901 68 Cash & Bank Balances - - 77,672 46 772 - - - 78,489 69 Property, Payroll & Income Taxes Accrued: - - (8,134) (58,984) (1,040,840) - - (1,107,959) 70 TOTAL RATE BASE - - 628,003 11,675,181 30,187,060 74,280,364 - - 116,770,608 71 % of Rate Base 0.0000% 0.0000% 0.5378% 9.9984% 25.8516% 63.6122% 0.0000% 0.0000% 100.0000%
COMMODITY DEMAND CUSTOMER
May not cross-check due to rounding.
Case No. U-17273 Witness: J.C. Hoffman Malueg
Exhibit A-6 (JCHM-1) Schedule F1.3
Page 1 of 21

Michigan Public Service CommissionMichigan Gas Utilities CorporationProjected Cost of Service Allocation StudyProjected Test Year Ending December 31, 2014Revenue Requirement and Rate Base by Individual Rate Schedule
(A) (B) (C) (D) (E) (F) (G) (H) (I) (J)
GAS SUPPLY DISTRIBUTION DISTRIBUTION ENHANCEDLINE PURCHASED ACQUISITION PRODUCTION STORAGE DEMAND CUSTOMER OTHERNO. RATE: MULTI-FAMILY I GAS COST COST DEMAND COST RELATED RELATED CUSTOMER SERVICES TOTAL
12 Operation & Maintenance Expense:3 Production:4 Purchased Gas Cost 103,746 103,746 5 Gas Supply Acquisition Cost 737 737 6 Production Demand 626 626 7 Storage Cost 556 556 8 Total - Production 103,746 737 626 556 - - - - 105,665 910 Transmission: 249 24 273 11 Distribution: 1,759 4,762 6,522 12 Customer Accounts and Services: - 13 Allocable 8,369 8,369 14 Transport Allocable - - 15 Customer Sales: - - 16 Administrative & General: - 408 347 219 1,584 - 7,738 - 10,296 17 Total Operation & Maintenance Expense: 103,746 1,146 973 775 3,592 4,786 16,107 - 131,125 1819 Depreciation & Amort Expense: - - 86 317 2,093 4,694 - - 7,191 2021 Taxes Other Than Income Taxes:22 Unemployment Comp - FED & STATE 1 1 1 3 24 14 - 44 23 Retirement Benefits - FED 11 17 10 34 285 166 - 523 24 IBS Payroll Tax 6 10 6 20 170 99 - 311 25 Michigan SBT & Real Estate/Property - - 19 341 896 1,174 - - 2,430 26 Misc - Unauthorized Ins. Tax & Franchise - - 0 2 4 6 - - 12 27 Total Taxes Other Than Income Taxes: - 18 48 360 957 1,659 278 - 3,320 2829 Other Income Before Income Taxes: - - - - - - - - - 3031 Income Taxes - - 16 284 746 978 - - 2,025 32 ITC - - - - - - - - - 3334 Other Income After Income Taxes: - - - - - - - - - 3536 TOTAL EXPENSES: 103,746 1,164 1,123 1,736 7,388 12,117 16,386 - 143,660 3738 Other Operating Income (Revenue Credits):39 Acct 487, Acct 493, Acct 495: IL Tax Fee - - (3) (45) (118) (155) - - (320) 40 Acct 488, Acct 495: Miscellaneous (225) (225) 41 Acct 495: Customer Penalities & Gas True-up (470) (470) 42 Acct 495: VBA and Decoupling related - - 43 Total Other Operating Income: (470) - (3) (45) (118) (155) (225) - (1,016) 4445 Actual Return (Net Operating Income) - - 20 354 931 1,220 - - 2,525 4647 Return Income Deficiency - - 57 1,011 2,656 3,481 - - 7,206 4849 Additional Income Taxes on Deficiency: - - 18 317 832 1,090 - - 2,257 5051 REVENUE REQUIREMENTS: 103,276 1,164 1,216 3,374 11,690 17,754 16,161 - 154,633 5253545556 RATE BASE:57 Utility Plant in Service - - 1,884 14,386 79,331 158,522 - - 254,122 58 Accumulated Depreciation - S/L - - (1,008) (6,845) (44,038) (85,387) - - (137,277) 59 Construction Work in Progress - - - - - - - - - 60 Net Plant in Service - - 876 7,540 35,294 73,135 - - 116,845 6162 Gas Stored Underground: - - - 12,517 - - - - 12,517 63 Fuel Stock - - - - - - - - - 64 Working Capital Allowance - - 169 1,364 22,223 - - - 23,756 65 Materials & Supplies: - - - - 122 269 - - 391 66 Other - Deferred Taxes (M&S / CWIP) - - - - - - - - - 67 Prepayments - - 31 13 377 - - - 421 68 Cash & Bank Balances - - 150 0 1 - - - 152 69 Property, Payroll & Income Taxes Accrued: - - (16) (108) (2,004) - - (2,128) 70 TOTAL RATE BASE - - 1,210 21,327 56,013 73,404 - - 151,953 71 % of Rate Base 0.0000% 0.0000% 0.7961% 14.0352% 36.8618% 48.3069% 0.0000% 0.0000% 100.0000%
COMMODITY DEMAND CUSTOMER
May not cross-check due to rounding.
Case No. U-17273 Witness: J.C. Hoffman Malueg
Exhibit A-6 (JCHM-1) Schedule F1.3
Page 2 of 21

Michigan Public Service CommissionMichigan Gas Utilities CorporationProjected Cost of Service Allocation StudyProjected Test Year Ending December 31, 2014Revenue Requirement and Rate Base by Individual Rate Schedule
(A) (B) (C) (D) (E) (F) (G) (H) (I) (J)
GAS SUPPLY DISTRIBUTION DISTRIBUTION ENHANCEDLINE PURCHASED ACQUISITION PRODUCTION STORAGE DEMAND CUSTOMER OTHERNO. RATE: MULTI-FAMILY II GAS COST COST DEMAND COST RELATED RELATED CUSTOMER SERVICES TOTAL
12 Operation & Maintenance Expense:3 Production:4 Purchased Gas Cost 544,109 544,109 5 Gas Supply Acquisition Cost 3,867 3,867 6 Production Demand 3,500 3,500 7 Storage Cost 2,901 2,901 8 Total - Production 544,109 3,867 3,500 2,901 - - - - 554,378 910 Transmission: 1,392 124 1,515 11 Distribution: 9,832 12,170 22,002 12 Customer Accounts and Services: - 13 Allocable 20,016 20,016 14 Transport Allocable - - 15 Customer Sales: - - 16 Administrative & General: - 2,141 1,938 1,144 8,850 - 18,506 - 32,578 17 Total Operation & Maintenance Expense: 544,109 6,008 5,437 4,045 20,073 12,294 38,522 - 630,489 1819 Depreciation & Amort Expense: - - 482 1,657 11,697 9,755 - - 23,591 2021 Taxes Other Than Income Taxes:22 Unemployment Comp - FED & STATE 4 6 4 12 105 61 - 192 23 Retirement Benefits - FED 48 74 44 148 1,253 728 - 2,294 24 IBS Payroll Tax 28 44 26 88 746 433 - 1,365 25 Michigan SBT & Real Estate/Property - - 107 1,781 4,889 3,056 - - 9,833 26 Misc - Unauthorized Ins. Tax & Franchise - - 1 9 24 15 - - 48 27 Total Taxes Other Than Income Taxes: - 80 231 1,864 5,162 5,174 1,222 - 13,733 2829 Other Income Before Income Taxes: - - - - - - - - - 3031 Income Taxes - - 89 1,484 4,074 2,547 - - 8,193 32 ITC - - - - - - - - - 3334 Other Income After Income Taxes: - - - - - - - - - 3536 TOTAL EXPENSES: 544,109 6,088 6,240 9,049 41,005 29,770 39,744 - 676,006 3738 Other Operating Income (Revenue Credits):39 Acct 487, Acct 493, Acct 495: IL Tax Fee - - (18) (298) (819) (512) - - (1,648) 40 Acct 488, Acct 495: Miscellaneous (374) (374) 41 Acct 495: Customer Penalities & Gas True-up (2,467) (2,467) 42 Acct 495: VBA and Decoupling related - - 43 Total Other Operating Income: (2,467) - (18) (298) (819) (512) (374) - (4,489) 4445 Actual Return (Net Operating Income) - - 934 15,525 42,622 26,644 - - 85,724 4647 Return Income Deficiency - - (505) (8,393) (23,044) (14,405) - - (46,348) 4849 Additional Income Taxes on Deficiency: - - 99 1,654 4,541 2,838 - - 9,132 5051 REVENUE REQUIREMENTS: 541,642 6,088 6,751 17,536 64,305 44,335 39,369 - 720,026 5253545556 RATE BASE:57 Utility Plant in Service - - 10,527 75,106 443,323 399,732 - - 928,687 58 Accumulated Depreciation - S/L - - (5,633) (35,738) (246,093) (209,080) - - (496,543) 59 Construction Work in Progress - - - - - - - - - 60 Net Plant in Service - - 4,894 39,368 197,229 190,652 - - 432,144 6162 Gas Stored Underground: - - - 65,352 - - - - 65,352 63 Fuel Stock - - - - - - - - - 64 Working Capital Allowance - - 886 7,122 116,875 - - - 124,883 65 Materials & Supplies: - - - - 684 447 - - 1,131 66 Other - Deferred Taxes (M&S / CWIP) - - - - - - - - - 67 Prepayments - - 171 68 2,107 - - - 2,346 68 Cash & Bank Balances - - 836 0 8 - - - 845 69 Property, Payroll & Income Taxes Accrued: - - (88) (563) (11,203) - - (11,853) 70 TOTAL RATE BASE - - 6,699 111,348 305,701 191,099 - - 614,848 71 % of Rate Base 0.0000% 0.0000% 1.0895% 18.1098% 49.7199% 31.0807% 0.0000% 0.0000% 100.0000%
COMMODITY DEMAND CUSTOMER
May not cross-check due to rounding.
Case No. U-17273 Witness: J.C. Hoffman Malueg
Exhibit A-6 (JCHM-1) Schedule F1.3
Page 3 of 21

Michigan Public Service CommissionMichigan Gas Utilities CorporationProjected Cost of Service Allocation StudyProjected Test Year Ending December 31, 2014Revenue Requirement and Rate Base by Individual Rate Schedule
(A) (B) (C) (D) (E) (F) (G) (H) (I) (J)
GAS SUPPLY DISTRIBUTION DISTRIBUTION ENHANCEDLINE PURCHASED ACQUISITION PRODUCTION STORAGE DEMAND CUSTOMER OTHERNO. RATE: MULTI-FAMILY III GAS COST COST DEMAND COST RELATED RELATED CUSTOMER SERVICES TOTAL
12 Operation & Maintenance Expense:3 Production:4 Purchased Gas Cost 153,745 153,745 5 Gas Supply Acquisition Cost 1,093 1,093 6 Production Demand 989 989 7 Storage Cost 805 805 8 Total - Production 153,745 1,093 989 805 - - - - 156,631 910 Transmission: 393 35 428 11 Distribution: 2,778 2,137 4,915 12 Customer Accounts and Services: - 13 Allocable 3,042 3,042 14 Transport Allocable - - 15 Customer Sales: - - 16 Administrative & General: - 605 547 317 2,501 - 2,813 - 6,783 17 Total Operation & Maintenance Expense: 153,745 1,698 1,536 1,122 5,672 2,172 5,855 - 171,800 1819 Depreciation & Amort Expense: - - 136 460 3,305 1,375 - - 5,276 2021 Taxes Other Than Income Taxes:22 Unemployment Comp - FED & STATE 1 2 1 3 27 16 - 50 23 Retirement Benefits - FED 12 19 11 38 325 189 - 595 24 IBS Payroll Tax 7 11 7 23 193 112 - 354 25 Michigan SBT & Real Estate/Property - - 30 494 1,365 561 - - 2,450 26 Misc - Unauthorized Ins. Tax & Franchise - - 0 2 7 3 - - 12 27 Total Taxes Other Than Income Taxes: - 21 62 516 1,436 1,109 317 - 3,460 2829 Other Income Before Income Taxes: - - - - - - - - - 3031 Income Taxes - - 25 412 1,137 467 - - 2,041 32 ITC - - - - - - - - - 3334 Other Income After Income Taxes: - - - - - - - - - 3536 TOTAL EXPENSES: 153,745 1,718 1,760 2,509 11,550 5,124 6,172 - 182,578 3738 Other Operating Income (Revenue Credits):39 Acct 487, Acct 493, Acct 495: IL Tax Fee - - (5) (79) (219) (90) - - (393) 40 Acct 488, Acct 495: Miscellaneous (31) (31) 41 Acct 495: Customer Penalities & Gas True-up (697) (697) 42 Acct 495: VBA and Decoupling related - - 43 Total Other Operating Income: (697) - (5) (79) (219) (90) (31) - (1,120) 4445 Actual Return (Net Operating Income) - - 285 4,655 12,860 5,286 - - 23,086 4647 Return Income Deficiency - - (164) (2,677) (7,395) (3,040) - - (13,276) 4849 Additional Income Taxes on Deficiency: - - 28 459 1,267 521 - - 2,275 5051 REVENUE REQUIREMENTS: 153,048 1,718 1,905 4,867 18,063 7,801 6,141 - 193,543 5253545556 RATE BASE:57 Utility Plant in Service - - 2,974 20,834 125,266 71,465 - - 220,540 58 Accumulated Depreciation - S/L - - (1,592) (9,914) (69,537) (36,428) - - (117,470) 59 Construction Work in Progress - - - - - - - - - 60 Net Plant in Service - - 1,383 10,921 55,730 35,036 - - 103,070 6162 Gas Stored Underground: - - - 18,129 - - - - 18,129 63 Fuel Stock - - - - - - - - - 64 Working Capital Allowance - - 250 1,976 31,970 - - - 34,196 65 Materials & Supplies: - - - - 193 36 - - 229 66 Other - Deferred Taxes (M&S / CWIP) - - - - - - - - - 67 Prepayments - - 48 19 595 - - - 662 68 Cash & Bank Balances - - 236 0 2 - - - 238 69 Property, Payroll & Income Taxes Accrued: - - (25) (156) (3,166) - - (3,347) 70 TOTAL RATE BASE - - 1,892 30,888 85,325 35,072 - - 153,178 71 % of Rate Base 0.0000% 0.0000% 1.2351% 20.1650% 55.7033% 22.8966% 0.0000% 0.0000% 100.0000%
COMMODITY DEMAND CUSTOMER
May not cross-check due to rounding.
Case No. U-17273 Witness: J.C. Hoffman Malueg
Exhibit A-6 (JCHM-1) Schedule F1.3
Page 4 of 21

Michigan Public Service CommissionMichigan Gas Utilities CorporationProjected Cost of Service Allocation StudyProjected Test Year Ending December 31, 2014Revenue Requirement and Rate Base by Individual Rate Schedule
(A) (B) (C) (D) (E) (F) (G) (H) (I) (J)
GAS SUPPLY DISTRIBUTION DISTRIBUTION ENHANCEDLINE PURCHASED ACQUISITION PRODUCTION STORAGE DEMAND CUSTOMER OTHERNO. RATE: MULTI-FAMILY IV GAS COST COST DEMAND COST RELATED RELATED CUSTOMER SERVICES TOTAL
12 Operation & Maintenance Expense:3 Production:4 Purchased Gas Cost 223,832 223,832 5 Gas Supply Acquisition Cost 1,591 1,591 6 Production Demand 1,440 1,440 7 Storage Cost 1,226 1,226 8 Total - Production 223,832 1,591 1,440 1,226 - - - - 228,089 910 Transmission: 572 51 623 11 Distribution: 4,044 871 4,916 12 Customer Accounts and Services: - 13 Allocable 3,373 3,373 14 Transport Allocable - - 15 Customer Sales: - - 16 Administrative & General: - 881 797 483 3,641 - 3,119 - 8,920 17 Total Operation & Maintenance Expense: 223,832 2,472 2,237 1,710 8,258 922 6,491 - 245,921 1819 Depreciation & Amort Expense: - - 198 700 4,812 939 - - 6,649 2021 Taxes Other Than Income Taxes:22 Unemployment Comp - FED & STATE 1 2 1 5 39 23 - 71 23 Retirement Benefits - FED 18 27 16 55 464 269 - 849 24 IBS Payroll Tax 10 16 10 33 276 160 - 505 25 Michigan SBT & Real Estate/Property - - 44 753 2,048 419 - - 3,264 26 Misc - Unauthorized Ins. Tax & Franchise - - 0 4 10 2 - - 16 27 Total Taxes Other Than Income Taxes: - 30 90 784 2,150 1,200 452 - 4,706 2829 Other Income Before Income Taxes: - - - - - - - - - 3031 Income Taxes - - 37 627 1,707 349 - - 2,720 32 ITC - - - - - - - - - 3334 Other Income After Income Taxes: - - - - - - - - - 3536 TOTAL EXPENSES: 223,832 2,501 2,562 3,821 16,926 3,409 6,944 - 259,996 3738 Other Operating Income (Revenue Credits):39 Acct 487, Acct 493, Acct 495: IL Tax Fee - - (7) (118) (322) (66) - - (514) 40 Acct 488, Acct 495: Miscellaneous (19) (19) 41 Acct 495: Customer Penalities & Gas True-up (1,015) (1,015) 42 Acct 495: VBA and Decoupling related - - 43 Total Other Operating Income: (1,015) - (7) (118) (322) (66) (19) - (1,548) 4445 Actual Return (Net Operating Income) - - 429 7,333 19,951 4,080 - - 31,793 4647 Return Income Deficiency - - (253) (4,318) (11,749) (2,403) - - (18,723) 4849 Additional Income Taxes on Deficiency: - - 41 699 1,902 389 - - 3,031 5051 REVENUE REQUIREMENTS: 222,817 2,501 2,772 7,417 26,709 5,410 6,924 - 274,550 5253545556 RATE BASE:57 Utility Plant in Service - - 4,330 31,750 182,371 56,582 - - 275,033 58 Accumulated Depreciation - S/L - - (2,317) (15,107) (101,236) (30,412) - - (149,073) 59 Construction Work in Progress - - - - - - - - - 60 Net Plant in Service - - 2,013 16,642 81,135 26,170 - - 125,960 6162 Gas Stored Underground: - - - 27,626 - - - - 27,626 63 Fuel Stock - - - - - - - - - 64 Working Capital Allowance - - 364 3,011 50,395 - - - 53,770 65 Materials & Supplies: - - - - 282 23 - - 305 66 Other - Deferred Taxes (M&S / CWIP) - - - - - - - - - 67 Prepayments - - 70 29 867 - - - 966 68 Cash & Bank Balances - - 344 0 3 - - - 348 69 Property, Payroll & Income Taxes Accrued: - - (36) (238) (4,609) - - (4,883) 70 TOTAL RATE BASE - - 2,755 47,070 128,073 26,193 - - 204,091 71 % of Rate Base 0.0000% 0.0000% 1.3500% 23.0632% 62.7530% 12.8338% 0.0000% 0.0000% 100.0000%
COMMODITY DEMAND CUSTOMER
May not cross-check due to rounding.
Case No. U-17273 Witness: J.C. Hoffman Malueg
Exhibit A-6 (JCHM-1) Schedule F1.3
Page 5 of 21

Michigan Public Service CommissionMichigan Gas Utilities CorporationProjected Cost of Service Allocation StudyProjected Test Year Ending December 31, 2014Revenue Requirement and Rate Base by Individual Rate Schedule
(A) (B) (C) (D) (E) (F) (G) (H) (I) (J)
GAS SUPPLY DISTRIBUTION DISTRIBUTION ENHANCEDLINE PURCHASED ACQUISITION PRODUCTION STORAGE DEMAND CUSTOMER OTHERNO. RATE: SMALL GS GAS COST COST DEMAND COST RELATED RELATED CUSTOMER SERVICES TOTAL
12 Operation & Maintenance Expense:3 Production:4 Purchased Gas Cost 15,276,696 15,276,696 5 Gas Supply Acquisition Cost 108,578 108,578 6 Production Demand 98,263 98,263 7 Storage Cost 86,154 86,154 8 Total - Production 15,276,696 108,578 98,263 86,154 - - - - 15,569,692 910 Transmission: 39,069 3,480 42,549 11 Distribution: 276,038 692,088 968,125 12 Customer Accounts and Services: - 13 Allocable 685,155 685,155 14 Transport Allocable - - 15 Customer Sales: - - 16 Administrative & General: - 60,110 54,399 33,965 248,475 - 633,480 - 1,030,430 17 Total Operation & Maintenance Expense: 15,276,696 168,688 152,663 120,120 563,582 695,568 1,318,635 - 18,295,952 1819 Depreciation & Amort Expense: - - 13,539 49,199 328,400 431,296 - - 822,433 2021 Taxes Other Than Income Taxes:22 Unemployment Comp - FED & STATE 116 179 108 362 3,053 1,773 - 5,591 23 Retirement Benefits - FED 1,386 2,139 1,288 4,319 36,457 21,175 - 66,765 24 IBS Payroll Tax 825 1,273 767 2,571 21,699 12,603 - 39,737 25 Michigan SBT & Real Estate/Property - - 3,008 52,880 142,545 147,160 - - 345,594 26 Misc - Unauthorized Ins. Tax & Franchise - - 15 261 703 725 - - 1,703 27 Total Taxes Other Than Income Taxes: - 2,327 6,615 55,303 150,500 209,094 35,551 - 459,390 2829 Other Income Before Income Taxes: - - - - - - - - - 3031 Income Taxes - - 2,506 44,063 118,778 122,624 - - 287,971 32 ITC - - - - - - - - - 3334 Other Income After Income Taxes: - - - - - - - - - 3536 TOTAL EXPENSES: 15,276,696 171,015 175,323 268,685 1,161,260 1,458,581 1,354,186 - 19,865,746 3738 Other Operating Income (Revenue Credits):39 Acct 487, Acct 493, Acct 495: IL Tax Fee - - (449) (7,892) (21,274) (21,963) - - (51,578) 40 Acct 488, Acct 495: Miscellaneous (13,713) (13,713) 41 Acct 495: Customer Penalities & Gas True-up (69,261) (69,261) 42 Acct 495: VBA and Decoupling related - - 43 Total Other Operating Income: (69,261) - (449) (7,892) (21,274) (21,963) (13,713) - (134,551) 4445 Actual Return (Net Operating Income) - - 19,282 338,989 913,785 943,371 - - 2,215,427 4647 Return Income Deficiency - - (7,236) (127,219) (342,934) (354,037) - - (831,426) 4849 Additional Income Taxes on Deficiency: - - 2,794 49,114 132,392 136,678 - - 320,977 5051 REVENUE REQUIREMENTS: 15,207,436 171,015 189,713 521,677 1,843,229 2,162,630 1,340,472 - 21,436,173 5253545556 RATE BASE:57 Utility Plant in Service - - 295,556 2,230,394 12,446,959 18,481,855 - - 33,454,764 58 Accumulated Depreciation - S/L - - (158,149) (1,061,290) (6,909,444) (9,296,140) - - (17,425,024) 59 Construction Work in Progress - - - - - - - - - 60 Net Plant in Service - - 137,407 1,169,104 5,537,515 9,185,715 - - 16,029,741 6162 Gas Stored Underground: - - - 1,940,740 - - - - 1,940,740 63 Fuel Stock - - - - - - - - - 64 Working Capital Allowance - - 24,869 211,488 3,611,911 - - - 3,848,267 65 Materials & Supplies: - - - - 19,216 16,384 - - 35,600 66 Other - Deferred Taxes (M&S / CWIP) - - - - - - - - - 67 Prepayments - - 4,806 2,022 59,162 - - - 65,989 68 Cash & Bank Balances - - 23,465 13 232 - - - 23,710 69 Property, Payroll & Income Taxes Accrued: - - (2,457) (16,706) (314,530) - - (333,692) 70 TOTAL RATE BASE - - 188,090 3,306,660 8,913,506 9,202,099 - - 21,610,355 71 % of Rate Base 0.0000% 0.0000% 0.8704% 15.3013% 41.2465% 42.5819% 0.0000% 0.0000% 100.0000%
COMMODITY DEMAND CUSTOMER
May not cross-check due to rounding.
Case No. U-17273 Witness: J.C. Hoffman Malueg
Exhibit A-6 (JCHM-1) Schedule F1.3
Page 6 of 21

Michigan Public Service CommissionMichigan Gas Utilities CorporationProjected Cost of Service Allocation StudyProjected Test Year Ending December 31, 2014Revenue Requirement and Rate Base by Individual Rate Schedule
(A) (B) (C) (D) (E) (F) (G) (H) (I) (J)
GAS SUPPLY DISTRIBUTION DISTRIBUTION ENHANCEDLINE PURCHASED ACQUISITION PRODUCTION STORAGE DEMAND CUSTOMER OTHERNO. RATE: LARGE GS GAS COST COST DEMAND COST RELATED RELATED CUSTOMER SERVICES TOTAL
12 Operation & Maintenance Expense:3 Production:4 Purchased Gas Cost 1,498,862 1,498,862 5 Gas Supply Acquisition Cost 10,653 10,653 6 Production Demand 5,718 5,718 7 Storage Cost 8,329 8,329 8 Total - Production 1,498,862 10,653 5,718 8,329 - - - - 1,523,562 910 Transmission: 2,273 341 2,615 11 Distribution: 17,159 1,532 18,691 12 Customer Accounts and Services: - 13 Allocable 17,095 17,095 14 Transport Allocable - - 15 Customer Sales: - - 16 Administrative & General: - 5,898 3,165 3,284 15,445 - 15,806 - 43,598 17 Total Operation & Maintenance Expense: 1,498,862 16,551 8,883 11,612 34,877 1,874 32,901 - 1,605,560 1819 Depreciation & Amort Expense: - - 788 4,756 19,731 3,589 - - 28,864 2021 Taxes Other Than Income Taxes:22 Unemployment Comp - FED & STATE 6 9 6 18 156 90 - 285 23 Retirement Benefits - FED 71 109 66 220 1,860 1,080 - 3,407 24 IBS Payroll Tax 42 65 39 131 1,107 643 - 2,028 25 Michigan SBT & Real Estate/Property - - 191 5,112 10,227 1,980 - - 17,510 26 Misc - Unauthorized Ins. Tax & Franchise - - 1 25 50 10 - - 86 27 Total Taxes Other Than Income Taxes: - 119 375 5,248 10,647 5,113 1,814 - 23,316 2829 Other Income Before Income Taxes: - - - - - - - - - 3031 Income Taxes - - 159 4,260 8,522 1,650 - - 14,591 32 ITC - - - - - - - - - 3334 Other Income After Income Taxes: - - - - - - - - - 3536 TOTAL EXPENSES: 1,498,862 16,669 10,205 25,876 73,777 12,226 34,715 - 1,672,331 3738 Other Operating Income (Revenue Credits):39 Acct 487, Acct 493, Acct 495: IL Tax Fee - - (32) (868) (1,736) (336) - - (2,972) 40 Acct 488, Acct 495: Miscellaneous (30) (30) 41 Acct 495: Customer Penalities & Gas True-up (6,795) (6,795) 42 Acct 495: VBA and Decoupling related - - 43 Total Other Operating Income: (6,795) - (32) (868) (1,736) (336) (30) - (9,797) 4445 Actual Return (Net Operating Income) - - 2,406 64,425 128,883 24,955 - - 220,669 4647 Return Income Deficiency - - (1,641) (43,953) (87,927) (17,025) - - (150,546) 4849 Additional Income Taxes on Deficiency: - - 177 4,748 9,498 1,839 - - 16,263 5051 REVENUE REQUIREMENTS: 1,492,066 16,669 11,115 50,229 122,495 21,659 34,685 - 1,748,919 5253545556 RATE BASE:57 Utility Plant in Service - - 17,198 215,621 744,688 275,875 - - 1,253,381 58 Accumulated Depreciation - S/L - - (9,202) (102,599) (414,236) (152,088) - - (678,126) 59 Construction Work in Progress - - - - - - - - - 60 Net Plant in Service - - 7,995 113,022 330,452 123,787 - - 575,255 6162 Gas Stored Underground: - - - 187,619 - - - - 187,619 63 Fuel Stock - - - - - - - - - 64 Working Capital Allowance - - 2,440 20,445 322,711 - - - 345,596 65 Materials & Supplies: - - - - 1,118 36 - - 1,154 66 Other - Deferred Taxes (M&S / CWIP) - - - - - - - - - 67 Prepayments - - 280 195 3,446 - - - 3,921 68 Cash & Bank Balances - - 1,365 1 14 - - - 1,380 69 Property, Payroll & Income Taxes Accrued: - - (143) (1,615) (18,244) - - (20,002) 70 TOTAL RATE BASE - - 11,937 319,668 639,496 123,823 - - 1,094,924 71 % of Rate Base 0.0000% 0.0000% 1.0903% 29.1954% 58.4055% 11.3088% 0.0000% 0.0000% 100.0000%
COMMODITY DEMAND CUSTOMER
May not cross-check due to rounding.
Case No. U-17273 Witness: J.C. Hoffman Malueg
Exhibit A-6 (JCHM-1) Schedule F1.3
Page 7 of 21

Michigan Public Service CommissionMichigan Gas Utilities CorporationProjected Cost of Service Allocation StudyProjected Test Year Ending December 31, 2014Revenue Requirement and Rate Base by Individual Rate Schedule
(A) (B) (C) (D) (E) (F) (G) (H) (I) (J)
GAS SUPPLY DISTRIBUTION DISTRIBUTION ENHANCEDLINE PURCHASED ACQUISITION PRODUCTION STORAGE DEMAND CUSTOMER OTHERNO. RATE: TRANSPORT - TR1 GAS COST COST DEMAND COST RELATED RELATED CUSTOMER SERVICES TOTAL
12 Operation & Maintenance Expense:3 Production:4 Purchased Gas Cost - - 5 Gas Supply Acquisition Cost - - 6 Production Demand 40,146 40,146 7 Storage Cost 22,404 22,404 8 Total - Production - - 40,146 22,404 - - - - 62,551 910 Transmission: 15,962 2,033 17,995 11 Distribution: 120,475 13,044 133,519 12 Customer Accounts and Services: - 13 Allocable 107,570 107,570 14 Transport Allocable 44,320 44,320 15 Customer Sales: - - 16 Administrative & General: - - 22,225 8,833 108,445 - 99,457 28,815 267,775 17 Total Operation & Maintenance Expense: - - 62,371 31,237 244,882 15,077 207,028 73,135 633,730 1819 Depreciation & Amort Expense: - - 5,531 12,794 138,537 23,440 - - 180,303 2021 Taxes Other Than Income Taxes:22 Unemployment Comp - FED & STATE 103 37 126 1,061 616 - 1,944 23 Retirement Benefits - FED 1,226 448 1,502 12,676 7,362 - 23,214 24 IBS Payroll Tax 730 267 894 7,545 4,382 - 13,817 25 Michigan SBT & Real Estate/Property - - 1,299 13,752 61,070 12,507 - - 88,627 26 Misc - Unauthorized Ins. Tax & Franchise - - 6 68 301 62 - - 437 27 Total Taxes Other Than Income Taxes: - - 3,363 14,571 63,892 33,851 12,361 - 128,038 2829 Other Income Before Income Taxes: - - - - - - - - - 3031 Income Taxes - - 1,082 11,459 50,887 10,422 - - 73,850 32 ITC - - - - - - - - - 3334 Other Income After Income Taxes: - - - - - - - - - 3536 TOTAL EXPENSES: - - 72,348 70,061 498,198 82,790 219,389 73,135 1,015,921 3738 Other Operating Income (Revenue Credits):39 Acct 487, Acct 493, Acct 495: IL Tax Fee - - (273) (2,890) (12,835) (2,629) - - (18,627) 40 Acct 488, Acct 495: Miscellaneous (202) (202) 41 Acct 495: Customer Penalities & Gas True-up - - 42 Acct 495: VBA and Decoupling related - - 43 Total Other Operating Income: - - (273) (2,890) (12,835) (2,629) (202) - (18,829) 4445 Actual Return (Net Operating Income) - - 20,687 219,040 972,741 199,219 - - 1,411,687 4647 Return Income Deficiency - - (15,486) (163,969) (728,175) (149,132) - - (1,056,761) 4849 Additional Income Taxes on Deficiency: - - 1,206 12,772 56,720 11,616 - - 82,314 5051 REVENUE REQUIREMENTS: - - 78,482 135,014 786,649 141,865 219,186 73,135 1,434,332 5253545556 RATE BASE:57 Utility Plant in Service - - 120,751 580,016 5,228,645 1,729,462 - - 7,658,875 58 Accumulated Depreciation - S/L - - (64,613) (275,990) (2,908,459) (947,616) - - (4,196,678) 59 Construction Work in Progress - - - - - - - - - 60 Net Plant in Service - - 56,138 304,027 2,320,186 781,846 - - 3,462,197 6162 Gas Stored Underground: - - - 504,691 - - - - 504,691 63 Fuel Stock - - - - - - - - - 64 Working Capital Allowance - - 14,525 54,998 1,594,687 - - - 1,664,210 65 Materials & Supplies: - - - - 7,851 242 - - 8,093 66 Other - Deferred Taxes (M&S / CWIP) - - - - - - - - - 67 Prepayments - - 1,964 526 24,185 - - - 26,675 68 Cash & Bank Balances - - 9,587 3 98 - - - 9,688 69 Property, Payroll & Income Taxes Accrued: - - (1,004) (4,344) (128,250) - - (133,598) 70 TOTAL RATE BASE - - 81,210 859,900 3,818,757 782,088 - - 5,541,956 71 % of Rate Base 0.0000% 0.0000% 1.4654% 15.5162% 68.9063% 14.1121% 0.0000% 0.0000% 100.0000%
COMMODITY DEMAND CUSTOMER
May not cross-check due to rounding.
Case No. U-17273 Witness: J.C. Hoffman Malueg
Exhibit A-6 (JCHM-1) Schedule F1.3
Page 8 of 21

Michigan Public Service CommissionMichigan Gas Utilities CorporationProjected Cost of Service Allocation StudyProjected Test Year Ending December 31, 2014Revenue Requirement and Rate Base by Individual Rate Schedule
(A) (B) (C) (D) (E) (F) (G) (H) (I) (J)
GAS SUPPLY DISTRIBUTION DISTRIBUTION ENHANCEDLINE PURCHASED ACQUISITION PRODUCTION STORAGE DEMAND CUSTOMER OTHERNO. RATE: TRANSPORT - TR2 GAS COST COST DEMAND COST RELATED RELATED CUSTOMER SERVICES TOTAL
12 Operation & Maintenance Expense:3 Production:4 Purchased Gas Cost - - 5 Gas Supply Acquisition Cost - - 6 Production Demand 72,582 72,582 7 Storage Cost 38,757 38,757 8 Total - Production - - 72,582 38,757 - - - - 111,339 910 Transmission: 28,858 4,335 33,193 11 Distribution: 217,810 4,521 222,331 12 Customer Accounts and Services: - 13 Allocable 112,355 112,355 14 Transport Allocable 15,433 15,433 15 Customer Sales: - - 16 Administrative & General: - - 40,182 15,280 196,061 - 103,881 10,034 365,437 17 Total Operation & Maintenance Expense: - - 112,763 54,037 442,729 8,856 216,236 25,467 860,088 1819 Depreciation & Amort Expense: - - 10,000 22,133 250,465 36,841 - - 319,438 2021 Taxes Other Than Income Taxes:22 Unemployment Comp - FED & STATE 184 67 226 1,908 1,108 - 3,494 23 Retirement Benefits - FED 2,203 805 2,700 22,785 13,234 - 41,726 24 IBS Payroll Tax 1,311 479 1,607 13,561 7,877 - 24,835 25 Michigan SBT & Real Estate/Property - - 2,423 23,789 109,554 22,334 - - 158,100 26 Misc - Unauthorized Ins. Tax & Franchise - - 12 117 540 110 - - 779 27 Total Taxes Other Than Income Taxes: - - 6,135 25,257 114,627 60,698 22,219 - 228,935 2829 Other Income Before Income Taxes: - - - - - - - - - 3031 Income Taxes - - 2,019 19,822 91,288 18,610 - - 131,739 32 ITC - - - - - - - - - 3334 Other Income After Income Taxes: - - - - - - - - - 3536 TOTAL EXPENSES: - - 130,917 121,250 899,108 125,004 238,455 25,467 1,540,200 3738 Other Operating Income (Revenue Credits):39 Acct 487, Acct 493, Acct 495: IL Tax Fee - - (310) (3,042) (14,008) (2,856) - - (20,215) 40 Acct 488, Acct 495: Miscellaneous (70) (70) 41 Acct 495: Customer Penalities & Gas True-up - - 42 Acct 495: VBA and Decoupling related - - 43 Total Other Operating Income: - - (310) (3,042) (14,008) (2,856) (70) - (20,285) 4445 Actual Return (Net Operating Income) - - 16,773 164,649 758,257 154,580 - - 1,094,258 4647 Return Income Deficiency - - (7,068) (69,382) (319,524) (65,139) - - (461,113) 4849 Additional Income Taxes on Deficiency: - - 2,251 22,094 101,751 20,743 - - 146,839 5051 REVENUE REQUIREMENTS: - - 142,563 235,569 1,425,583 232,332 238,384 25,467 2,299,899 5253545556 RATE BASE:57 Utility Plant in Service - - 218,310 1,003,366 9,453,021 3,155,991 - - 13,830,688 58 Accumulated Depreciation - S/L - - (116,816) (477,432) (5,258,289) (1,759,508) - - (7,612,045) 59 Construction Work in Progress - - - - - - - - - 60 Net Plant in Service - - 101,494 525,933 4,194,732 1,396,483 - - 6,218,642 6162 Gas Stored Underground: - - - 873,062 - - - - 873,062 63 Fuel Stock - - - - - - - - - 64 Working Capital Allowance - - 30,973 95,140 2,829,291 - - - 2,955,404 65 Materials & Supplies: - - - - 14,194 84 - - 14,278 66 Other - Deferred Taxes (M&S / CWIP) - - - - - - - - - 67 Prepayments - - 3,550 909 43,740 - - - 48,200 68 Cash & Bank Balances - - 17,332 6 180 - - - 17,518 69 Property, Payroll & Income Taxes Accrued: - - (1,815) (7,515) (231,591) - - (240,922) 70 TOTAL RATE BASE - - 151,534 1,487,535 6,850,546 1,396,567 - - 9,886,182 71 % of Rate Base 0.0000% 0.0000% 1.5328% 15.0466% 69.2942% 14.1264% 0.0000% 0.0000% 100.0000%
COMMODITY DEMAND CUSTOMER
May not cross-check due to rounding.
Case No. U-17273 Witness: J.C. Hoffman Malueg
Exhibit A-6 (JCHM-1) Schedule F1.3
Page 9 of 21

Michigan Public Service CommissionMichigan Gas Utilities CorporationProjected Cost of Service Allocation StudyProjected Test Year Ending December 31, 2014Revenue Requirement and Rate Base by Individual Rate Schedule
(A) (B) (C) (D) (E) (F) (G) (H) (I) (J)
GAS SUPPLY DISTRIBUTION DISTRIBUTION ENHANCEDLINE PURCHASED ACQUISITION PRODUCTION STORAGE DEMAND CUSTOMER OTHERNO. RATE: TRANSPORT - TR3 GAS COST COST DEMAND COST RELATED RELATED CUSTOMER SERVICES TOTAL
12 Operation & Maintenance Expense:3 Production:4 Purchased Gas Cost - - 5 Gas Supply Acquisition Cost - - 6 Production Demand 56,044 56,044 7 Storage Cost 31,031 31,031 8 Total - Production - - 56,044 31,031 - - - - 87,075 910 Transmission: 22,283 4,175 26,458 11 Distribution: 168,182 690 168,871 12 Customer Accounts and Services: - 13 Allocable 71,376 71,376 14 Transport Allocable 2,770 2,770 15 Customer Sales: - - 16 Administrative & General: - - 31,026 12,234 151,389 - 65,993 1,801 262,442 17 Total Operation & Maintenance Expense: - - 87,070 43,265 341,853 4,865 137,368 4,571 618,992 1819 Depreciation & Amort Expense: - - 7,722 17,721 193,396 33,442 - - 252,280 2021 Taxes Other Than Income Taxes:22 Unemployment Comp - FED & STATE 142 52 175 1,473 855 - 2,697 23 Retirement Benefits - FED 1,701 621 2,084 17,589 10,216 - 32,211 24 IBS Payroll Tax 1,012 370 1,240 10,469 6,080 - 19,172 25 Michigan SBT & Real Estate/Property - - 1,966 19,046 87,016 20,833 - - 128,861 26 Misc - Unauthorized Ins. Tax & Franchise - - 10 94 429 103 - - 635 27 Total Taxes Other Than Income Taxes: - - 4,831 20,184 90,944 50,466 17,152 - 183,576 2829 Other Income Before Income Taxes: - - - - - - - - - 3031 Income Taxes - - 1,638 15,871 72,508 17,359 - - 107,376 32 ITC - - - - - - - - - 3334 Other Income After Income Taxes: - - - - - - - - - 3536 TOTAL EXPENSES: - - 101,261 97,040 698,701 106,131 154,520 4,571 1,162,224 3738 Other Operating Income (Revenue Credits):39 Acct 487, Acct 493, Acct 495: IL Tax Fee - - (199) (1,924) (8,789) (2,104) - - (13,015) 40 Acct 488, Acct 495: Miscellaneous (13) (13) 41 Acct 495: Customer Penalities & Gas True-up - - 42 Acct 495: VBA and Decoupling related - - 43 Total Other Operating Income: - - (199) (1,924) (8,789) (2,104) (13) - (13,028) 4445 Actual Return (Net Operating Income) - - 8,145 78,914 360,530 86,316 - - 533,904 4647 Return Income Deficiency - - (272) (2,639) (12,055) (2,886) - - (17,852) 4849 Additional Income Taxes on Deficiency: - - 1,826 17,690 80,818 19,349 - - 119,683 5051 REVENUE REQUIREMENTS: - - 110,761 189,081 1,119,205 206,806 154,507 4,571 1,784,930 5253545556 RATE BASE:57 Utility Plant in Service - - 168,568 803,344 7,299,143 2,956,707 - - 11,227,761 58 Accumulated Depreciation - S/L - - (90,199) (382,256) (4,060,184) (1,654,021) - - (6,186,660) 59 Construction Work in Progress - - - - - - - - - 60 Net Plant in Service - - 78,369 421,088 3,238,959 1,302,686 - - 5,041,102 6162 Gas Stored Underground: - - - 699,016 - - - - 699,016 63 Fuel Stock - - - - - - - - - 64 Working Capital Allowance - - 29,834 76,174 2,335,848 - - - 2,441,856 65 Materials & Supplies: - - - - 10,960 15 - - 10,975 66 Other - Deferred Taxes (M&S / CWIP) - - - - - - - - - 67 Prepayments - - 2,741 728 33,793 - - - 37,263 68 Cash & Bank Balances - - 13,383 5 143 - - - 13,531 69 Property, Payroll & Income Taxes Accrued: - - (1,402) (6,017) (178,478) - - (185,897) 70 TOTAL RATE BASE - - 122,925 1,190,994 5,441,226 1,302,701 - - 8,057,845 71 % of Rate Base 0.0000% 0.0000% 1.5255% 14.7805% 67.5271% 16.1669% 0.0000% 0.0000% 100.0000%
COMMODITY DEMAND CUSTOMER
May not cross-check due to rounding.
Case No. U-17273 Witness: J.C. Hoffman Malueg
Exhibit A-6 (JCHM-1) Schedule F1.3 Page 10 of 21

Michigan Public Service CommissionMichigan Gas Utilities CorporationProjected Cost of Service Allocation StudyProjected Test Year Ending December 31, 2014Revenue Requirement and Rate Base by Individual Rate Schedule
(A) (B) (C) (D) (E) (F) (G) (H) (I) (J)
GAS SUPPLY DISTRIBUTION DISTRIBUTION ENHANCEDLINE PURCHASED ACQUISITION PRODUCTION STORAGE DEMAND CUSTOMER OTHERNO. RATE: CUST CHOICE - RESID. GAS COST COST DEMAND COST RELATED RELATED CUSTOMER SERVICES TOTAL
12 Operation & Maintenance Expense:3 Production:4 Purchased Gas Cost - - 5 Gas Supply Acquisition Cost - - 6 Production Demand 70,612 70,612 7 Storage Cost 64,998 64,998 8 Total - Production - - 70,612 64,998 - - - - 135,610 910 Transmission: 28,075 2,665 30,740 11 Distribution: 198,360 1,073,068 1,271,427 12 Customer Accounts and Services: - 13 Allocable 1,765,082 1,765,082 14 Transport Allocable - - 15 Customer Sales: - - 16 Administrative & General: - - 39,091 25,625 178,553 - 1,631,958 - 1,875,227 17 Total Operation & Maintenance Expense: - - 109,703 90,623 404,988 1,075,732 3,397,040 - 5,078,086 1819 Depreciation & Amort Expense: - - 9,729 37,118 235,987 1,018,987 - - 1,301,821 2021 Taxes Other Than Income Taxes:22 Unemployment Comp - FED & STATE 336 123 411 3,471 2,016 - 6,357 23 Retirement Benefits - FED 4,009 1,464 4,911 41,452 24,076 - 75,913 24 IBS Payroll Tax 2,386 872 2,923 24,672 14,330 - 45,182 25 Michigan SBT & Real Estate/Property - - 2,180 39,895 103,632 249,647 - - 395,355 26 Misc - Unauthorized Ins. Tax & Franchise - - 11 197 511 1,231 - - 1,949 27 Total Taxes Other Than Income Taxes: - - 8,921 42,551 112,388 320,473 40,422 - 524,755 2829 Other Income Before Income Taxes: - - - - - - - - - 3031 Income Taxes - - 1,817 33,243 86,353 208,023 - - 329,436 32 ITC - - - - - - - - - 3334 Other Income After Income Taxes: - - - - - - - - - 3536 TOTAL EXPENSES: - - 130,169 203,535 839,716 2,623,215 3,437,462 - 7,234,098 3738 Other Operating Income (Revenue Credits):39 Acct 487, Acct 493, Acct 495: IL Tax Fee - - (317) (5,792) (15,045) (36,244) - - (57,398) 40 Acct 488, Acct 495: Miscellaneous (49,312) (49,312) 41 Acct 495: Customer Penalities & Gas True-up - - 42 Acct 495: VBA and Decoupling related - - 43 Total Other Operating Income: - - (317) (5,792) (15,045) (36,244) (49,312) - (106,710) 4445 Actual Return (Net Operating Income) - - 1,628 29,792 77,388 186,426 - - 295,233 4647 Return Income Deficiency - - 7,103 129,976 337,628 813,339 - - 1,288,046 4849 Additional Income Taxes on Deficiency: - - 2,025 37,053 96,250 231,865 - - 367,194 5051 REVENUE REQUIREMENTS: - - 140,609 394,565 1,335,936 3,818,601 3,388,150 - 9,077,861 5253545556 RATE BASE:57 Utility Plant in Service - - 212,385 1,682,705 8,944,336 33,522,573 - - 44,361,999 58 Accumulated Depreciation - S/L - - (113,646) (800,683) (4,965,099) (17,970,752) - - (23,850,180) 59 Construction Work in Progress - - - - - - - - - 60 Net Plant in Service - - 98,740 882,022 3,979,237 15,551,821 - - 20,511,820 6162 Gas Stored Underground: - - - 1,464,178 - - - - 1,464,178 63 Fuel Stock - - - - - - - - - 64 Working Capital Allowance - - 19,042 159,555 2,670,437 - - - 2,849,034 65 Materials & Supplies: - - - - 13,809 58,915 - - 72,724 66 Other - Deferred Taxes (M&S / CWIP) - - - - - - - - - 67 Prepayments - - 3,454 1,525 42,517 - - - 47,496 68 Cash & Bank Balances - - 16,862 10 168 - - - 17,039 69 Property, Payroll & Income Taxes Accrued: - - (1,766) (12,603) (225,952) - - (240,321) 70 TOTAL RATE BASE - - 136,332 2,494,687 6,480,216 15,610,736 - - 24,721,970 71 % of Rate Base 0.0000% 0.0000% 0.5515% 10.0910% 26.2124% 63.1452% 0.0000% 0.0000% 100.0000%
COMMODITY DEMAND CUSTOMER
May not cross-check due to rounding.
Case No. U-17273 Witness: J.C. Hoffman Malueg
Exhibit A-6 (JCHM-1) Schedule F1.3 Page 11 of 21

Michigan Public Service CommissionMichigan Gas Utilities CorporationProjected Cost of Service Allocation StudyProjected Test Year Ending December 31, 2014Revenue Requirement and Rate Base by Individual Rate Schedule
(A) (B) (C) (D) (E) (F) (G) (H) (I) (J)
GAS SUPPLY DISTRIBUTION DISTRIBUTION ENHANCEDLINE PURCHASED ACQUISITION PRODUCTION STORAGE DEMAND CUSTOMER OTHERNO. RATE: CUST CHOICE - SMALL GS GAS COST COST DEMAND COST RELATED RELATED CUSTOMER SERVICES TOTAL
12 Operation & Maintenance Expense:3 Production:4 Purchased Gas Cost - - 5 Gas Supply Acquisition Cost - - 6 Production Demand 64,812 64,812 7 Storage Cost 56,514 56,514 8 Total - Production - - 64,812 56,514 - - - - 121,326 910 Transmission: 25,769 2,295 28,064 11 Distribution: 182,067 445,585 627,653 12 Customer Accounts and Services: - 13 Allocable 453,860 453,860 14 Transport Allocable - - 15 Customer Sales: - - 16 Administrative & General: - - 35,880 22,280 163,888 - 419,629 - 641,677 17 Total Operation & Maintenance Expense: - - 100,692 78,795 371,724 447,881 873,489 - 1,872,580 1819 Depreciation & Amort Expense: - - 8,930 32,273 216,604 281,087 - - 538,894 2021 Taxes Other Than Income Taxes:22 Unemployment Comp - FED & STATE 195 71 239 2,014 1,170 - 3,688 23 Retirement Benefits - FED 2,326 850 2,850 24,051 13,969 - 44,045 24 IBS Payroll Tax 1,384 506 1,696 14,315 8,314 - 26,215 25 Michigan SBT & Real Estate/Property - - 1,984 34,688 93,670 95,297 - - 225,638 26 Misc - Unauthorized Ins. Tax & Franchise - - 10 171 462 470 - - 1,112 27 Total Taxes Other Than Income Taxes: - - 5,899 36,285 98,916 136,145 23,453 - 300,698 2829 Other Income Before Income Taxes: - - - - - - - - - 3031 Income Taxes - - 1,653 28,904 78,052 79,407 - - 188,016 32 ITC - - - - - - - - - 3334 Other Income After Income Taxes: - - - - - - - - - 3536 TOTAL EXPENSES: - - 117,174 176,257 765,295 944,521 896,942 - 2,900,188 3738 Other Operating Income (Revenue Credits):39 Acct 487, Acct 493, Acct 495: IL Tax Fee - - (301) (5,268) (14,225) (14,472) - - (34,265) 40 Acct 488, Acct 495: Miscellaneous (9,066) (9,066) 41 Acct 495: Customer Penalities & Gas True-up - - 42 Acct 495: VBA and Decoupling related - - 43 Total Other Operating Income: - - (301) (5,268) (14,225) (14,472) (9,066) - (43,331) 4445 Actual Return (Net Operating Income) - - 13,842 242,012 653,521 664,872 - - 1,574,247 4647 Return Income Deficiency - - (5,897) (103,098) (278,402) (283,237) - - (670,634) 4849 Additional Income Taxes on Deficiency: - - 1,843 32,217 86,998 88,509 - - 209,566 5051 REVENUE REQUIREMENTS: - - 126,660 342,120 1,213,188 1,400,193 887,876 - 3,970,037 5253545556 RATE BASE:57 Utility Plant in Service - - 194,941 1,463,066 8,209,688 11,991,935 - - 21,859,630 58 Accumulated Depreciation - S/L - - (104,311) (696,172) (4,557,288) (6,043,764) - - (11,401,535) 59 Construction Work in Progress - - - - - - - - - 60 Net Plant in Service - - 90,630 766,894 3,652,400 5,948,171 - - 10,458,095 6162 Gas Stored Underground: - - - 1,273,063 - - - - 1,273,063 63 Fuel Stock - - - - - - - - - 64 Working Capital Allowance - - 16,403 138,729 2,360,474 - - - 2,515,606 65 Materials & Supplies: - - - - 12,675 10,831 - - 23,506 66 Other - Deferred Taxes (M&S / CWIP) - - - - - - - - - 67 Prepayments - - 3,170 1,326 39,022 - - - 43,518 68 Cash & Bank Balances - - 15,477 9 153 - - - 15,639 69 Property, Payroll & Income Taxes Accrued: - - (1,621) (10,958) (207,455) - - (220,035) 70 TOTAL RATE BASE - - 124,059 2,169,062 5,857,268 5,959,002 - - 14,109,392 71 % of Rate Base 0.0000% 0.0000% 0.8793% 15.3732% 41.5133% 42.2343% 0.0000% 0.0000% 100.0000%
COMMODITY DEMAND CUSTOMER
May not cross-check due to rounding.
Case No. U-17273 Witness: J.C. Hoffman Malueg
Exhibit A-6 (JCHM-1) Schedule F1.3 Page 12 of 21

Michigan Public Service CommissionMichigan Gas Utilities CorporationProjected Cost of Service Allocation StudyProjected Test Year Ending December 31, 2014Revenue Requirement and Rate Base by Individual Rate Schedule
(A) (B) (C) (D) (E) (F) (G) (H) (I) (J)
GAS SUPPLY DISTRIBUTION DISTRIBUTION ENHANCEDLINE PURCHASED ACQUISITION PRODUCTION STORAGE DEMAND CUSTOMER OTHERNO. RATE: CUST CHOICE - LARGE GS GAS COST COST DEMAND COST RELATED RELATED CUSTOMER SERVICES TOTAL
12 Operation & Maintenance Expense:3 Production:4 Purchased Gas Cost - - 5 Gas Supply Acquisition Cost - - 6 Production Demand - - 7 Storage Cost - - 8 Total - Production - - - - - - - - - 910 Transmission: - - - 11 Distribution: - - - 12 Customer Accounts and Services: - 13 Allocable - - 14 Transport Allocable - - 15 Customer Sales: - - 16 Administrative & General: - - - - - - - - - 17 Total Operation & Maintenance Expense: - - - - - - - - - 1819 Depreciation & Amort Expense: - - - - - - - - - 2021 Taxes Other Than Income Taxes:22 Unemployment Comp - FED & STATE - - - - - - - 23 Retirement Benefits - FED - - - - - - - 24 IBS Payroll Tax - - - - - - - 25 Michigan SBT & Real Estate/Property - - - - - - - - - 26 Misc - Unauthorized Ins. Tax & Franchise - - - - - - - - - 27 Total Taxes Other Than Income Taxes: - - - - - - - - - 2829 Other Income Before Income Taxes: - - - - - - - - - 3031 Income Taxes - - - - - - - - - 32 ITC - - - - - - - - - 3334 Other Income After Income Taxes: - - - - - - - - - 3536 TOTAL EXPENSES: - - - - - - - - - 3738 Other Operating Income (Revenue Credits):39 Acct 487, Acct 493, Acct 495: IL Tax Fee - - - - - - - - - 40 Acct 488, Acct 495: Miscellaneous - - 41 Acct 495: Customer Penalities & Gas True-up - - 42 Acct 495: VBA and Decoupling related - - 43 Total Other Operating Income: - - - - - - - - - 4445 Actual Return (Net Operating Income) - - - - - - - - - 4647 Return Income Deficiency - - - - - - - - - 4849 Additional Income Taxes on Deficiency: - - - - - - - - - 5051 REVENUE REQUIREMENTS: - - - - - - - - - 5253545556 RATE BASE:57 Utility Plant in Service - - - - - - - - - 58 Accumulated Depreciation - S/L - - - - - - - - - 59 Construction Work in Progress - - - - - - - - - 60 Net Plant in Service - - - - - - - - - 6162 Gas Stored Underground: - - - - - - - - - 63 Fuel Stock - - - - - - - - - 64 Working Capital Allowance - - - - - - - - - 65 Materials & Supplies: - - - - - - - - - 66 Other - Deferred Taxes (M&S / CWIP) - - - - - - - - - 67 Prepayments - - - - - - - - - 68 Cash & Bank Balances - - - - - - - - - 69 Property, Payroll & Income Taxes Accrued: - - - - - - - - 70 TOTAL RATE BASE - - - - - - - - - 71 % of Rate Base 0.0000% 0.0000% 0.0000% 0.0000% 0.0000% 0.0000% 0.0000% 0.0000% 0.0000%
COMMODITY DEMAND CUSTOMER
May not cross-check due to rounding.
Case No. U-17273 Witness: J.C. Hoffman Malueg
Exhibit A-6 (JCHM-1) Schedule F1.3 Page 13 of 21

Michigan Public Service CommissionMichigan Gas Utilities CorporationProjected Cost of Service Allocation StudyProjected Test Year Ending December 31, 2014Revenue Requirement and Rate Base by Individual Rate Schedule
(A) (B) (C) (D) (E) (F) (G) (H) (I) (J)
GAS SUPPLY DISTRIBUTION DISTRIBUTION ENHANCEDLINE PURCHASED ACQUISITION PRODUCTION STORAGE DEMAND CUSTOMER OTHERNO. RATE: CUST CHOICE - MULTI FAM 1 GAS COST COST DEMAND COST RELATED RELATED CUSTOMER SERVICES TOTAL
12 Operation & Maintenance Expense:3 Production:4 Purchased Gas Cost - - 5 Gas Supply Acquisition Cost - - 6 Production Demand 88 88 7 Storage Cost 85 85 8 Total - Production - - 88 85 - - - - 173 910 Transmission: 35 3 38 11 Distribution: 248 1,394 1,642 12 Customer Accounts and Services: - 13 Allocable 2,440 2,440 14 Transport Allocable - - 15 Customer Sales: - - 16 Administrative & General: - - 49 33 223 - 2,256 - 2,562 17 Total Operation & Maintenance Expense: - - 137 118 506 1,398 4,697 - 6,856 1819 Depreciation & Amort Expense: - - 12 49 295 1,405 - - 1,761 2021 Taxes Other Than Income Taxes:22 Unemployment Comp - FED & STATE 0 0 1 5 3 - 8 23 Retirement Benefits - FED 5 2 7 55 32 - 101 24 IBS Payroll Tax 3 1 4 33 19 - 60 25 Michigan SBT & Real Estate/Property - - 3 52 134 331 - - 520 26 Misc - Unauthorized Ins. Tax & Franchise - - 0 0 1 2 - - 3 27 Total Taxes Other Than Income Taxes: - - 12 56 145 426 54 - 692 2829 Other Income Before Income Taxes: - - - - - - - - - 3031 Income Taxes - - 2 43 111 276 - - 433 32 ITC - - - - - - - - - 3334 Other Income After Income Taxes: - - - - - - - - - 3536 TOTAL EXPENSES: - - 163 266 1,058 3,504 4,750 - 9,742 3738 Other Operating Income (Revenue Credits):39 Acct 487, Acct 493, Acct 495: IL Tax Fee - - (0) (7) (17) (43) - - (67) 40 Acct 488, Acct 495: Miscellaneous (70) (70) 41 Acct 495: Customer Penalities & Gas True-up - - 42 Acct 495: VBA and Decoupling related - - 43 Total Other Operating Income: - - (0) (7) (17) (43) (70) - (138) 4445 Actual Return (Net Operating Income) - - (5) (90) (230) (571) - - (896) 4647 Return Income Deficiency - - 16 299 766 1,898 - - 2,979 4849 Additional Income Taxes on Deficiency: - - 3 48 124 308 - - 483 5051 REVENUE REQUIREMENTS: - - 176 517 1,700 5,097 4,680 - 12,170 5253545556 RATE BASE:57 Utility Plant in Service - - 265 2,199 11,179 44,959 - - 58,604 58 Accumulated Depreciation - S/L - - (142) (1,047) (6,206) (24,319) - - (31,714) 59 Construction Work in Progress - - - - - - - - - 60 Net Plant in Service - - 123 1,153 4,974 20,640 - - 26,890 6162 Gas Stored Underground: - - - 1,914 - - - - 1,914 63 Fuel Stock - - - - - - - - - 64 Working Capital Allowance - - 24 209 3,600 - - - 3,832 65 Materials & Supplies: - - - - 17 84 - - 101 66 Other - Deferred Taxes (M&S / CWIP) - - - - - - - - - 67 Prepayments - - 4 2 53 - - - 59 68 Cash & Bank Balances - - 21 0 0 - - - 21 69 Property, Payroll & Income Taxes Accrued: - - (2) (16) (283) - - (301) 70 TOTAL RATE BASE - - 170 3,261 8,361 20,724 - - 32,516 71 % of Rate Base 0.0000% 0.0000% 0.5241% 10.0288% 25.7132% 63.7340% 0.0000% 0.0000% 100.0000%
COMMODITY DEMAND CUSTOMER
May not cross-check due to rounding.
Case No. U-17273 Witness: J.C. Hoffman Malueg
Exhibit A-6 (JCHM-1) Schedule F1.3 Page 14 of 21

Michigan Public Service CommissionMichigan Gas Utilities CorporationProjected Cost of Service Allocation StudyProjected Test Year Ending December 31, 2014Revenue Requirement and Rate Base by Individual Rate Schedule
(A) (B) (C) (D) (E) (F) (G) (H) (I) (J)
GAS SUPPLY DISTRIBUTION DISTRIBUTION ENHANCEDLINE PURCHASED ACQUISITION PRODUCTION STORAGE DEMAND CUSTOMER OTHERNO. RATE: CUST CHOICE - MULTI FAM 2 GAS COST COST DEMAND COST RELATED RELATED CUSTOMER SERVICES TOTAL
12 Operation & Maintenance Expense:3 Production:4 Purchased Gas Cost - - 5 Gas Supply Acquisition Cost - - 6 Production Demand 328 328 7 Storage Cost 288 288 8 Total - Production - - 328 288 - - - - 616 910 Transmission: 130 12 142 11 Distribution: 920 2,467 3,387 12 Customer Accounts and Services: - 13 Allocable 4,225 4,225 14 Transport Allocable - - 15 Customer Sales: - - 16 Administrative & General: - - 181 114 828 - 3,907 - 5,030 17 Total Operation & Maintenance Expense: - - 509 402 1,879 2,479 8,132 - 13,400 1819 Depreciation & Amort Expense: - - 45 165 1,095 2,119 - - 3,423 2021 Taxes Other Than Income Taxes:22 Unemployment Comp - FED & STATE 1 0 1 12 7 - 22 23 Retirement Benefits - FED 14 5 17 141 82 - 258 24 IBS Payroll Tax 8 3 10 84 49 - 153 25 Michigan SBT & Real Estate/Property - - 10 177 476 576 - - 1,239 26 Misc - Unauthorized Ins. Tax & Franchise - - 0 1 2 3 - - 6 27 Total Taxes Other Than Income Taxes: - - 33 186 507 815 137 - 1,678 2829 Other Income Before Income Taxes: - - - - - - - - - 3031 Income Taxes - - 8 147 397 480 - - 1,032 32 ITC - - - - - - - - - 3334 Other Income After Income Taxes: - - - - - - - - - 3536 TOTAL EXPENSES: - - 595 900 3,876 5,893 8,270 - 19,534 3738 Other Operating Income (Revenue Credits):39 Acct 487, Acct 493, Acct 495: IL Tax Fee - - (2) (37) (99) (120) - - (258) 40 Acct 488, Acct 495: Miscellaneous (96) (96) 41 Acct 495: Customer Penalities & Gas True-up - - 42 Acct 495: VBA and Decoupling related - - 43 Total Other Operating Income: - - (2) (37) (99) (120) (96) - (354) 4445 Actual Return (Net Operating Income) - - 115 2,028 5,460 6,603 - - 14,206 4647 Return Income Deficiency - - (75) (1,320) (3,553) (4,297) - - (9,245) 4849 Additional Income Taxes on Deficiency: - - 9 164 442 535 - - 1,151 5051 REVENUE REQUIREMENTS: - - 643 1,735 6,126 8,614 8,174 - 25,292 5253545556 RATE BASE:57 Utility Plant in Service - - 985 7,458 41,488 76,040 - - 125,972 58 Accumulated Depreciation - S/L - - (527) (3,549) (23,030) (40,149) - - (67,256) 59 Construction Work in Progress - - - - - - - - - 60 Net Plant in Service - - 458 3,909 18,458 35,891 - - 58,716 6162 Gas Stored Underground: - - - 6,490 - - - - 6,490 63 Fuel Stock - - - - - - - - - 64 Working Capital Allowance - - 83 707 12,105 - - - 12,895 65 Materials & Supplies: - - - - 64 114 - - 178 66 Other - Deferred Taxes (M&S / CWIP) - - - - - - - - - 67 Prepayments - - 16 7 197 - - - 220 68 Cash & Bank Balances - - 78 0 1 - - - 79 69 Property, Payroll & Income Taxes Accrued: - - (8) (56) (1,049) - - (1,112) 70 TOTAL RATE BASE - - 627 11,058 29,776 36,005 - - 77,465 71 % of Rate Base 0.0000% 0.0000% 0.8094% 14.2743% 38.4375% 46.4788% 0.0000% 0.0000% 100.0000%
COMMODITY DEMAND CUSTOMER
May not cross-check due to rounding.
Case No. U-17273 Witness: J.C. Hoffman Malueg
Exhibit A-6 (JCHM-1) Schedule F1.3 Page 15 of 21

Michigan Public Service CommissionMichigan Gas Utilities CorporationProjected Cost of Service Allocation StudyProjected Test Year Ending December 31, 2014Revenue Requirement and Rate Base by Individual Rate Schedule
(A) (B) (C) (D) (E) (F) (G) (H) (I) (J)
GAS SUPPLY DISTRIBUTION DISTRIBUTION ENHANCEDLINE PURCHASED ACQUISITION PRODUCTION STORAGE DEMAND CUSTOMER OTHERNO. RATE: CUST CHOICE - MULTI FAM 3 GAS COST COST DEMAND COST RELATED RELATED CUSTOMER SERVICES TOTAL
12 Operation & Maintenance Expense:3 Production:4 Purchased Gas Cost - - 5 Gas Supply Acquisition Cost - - 6 Production Demand - - 7 Storage Cost - - 8 Total - Production - - - - - - - - - 910 Transmission: - - - 11 Distribution: - - - 12 Customer Accounts and Services: - 13 Allocable - - 14 Transport Allocable - - 15 Customer Sales: - - 16 Administrative & General: - - - - - - - - - 17 Total Operation & Maintenance Expense: - - - - - - - - - 1819 Depreciation & Amort Expense: - - - - - - - - - 2021 Taxes Other Than Income Taxes:22 Unemployment Comp - FED & STATE - - - - - - - 23 Retirement Benefits - FED - - - - - - - 24 IBS Payroll Tax - - - - - - - 25 Michigan SBT & Real Estate/Property - - - - - - - - - 26 Misc - Unauthorized Ins. Tax & Franchise - - - - - - - - - 27 Total Taxes Other Than Income Taxes: - - - - - - - - - 2829 Other Income Before Income Taxes: - - - - - - - - - 3031 Income Taxes - - - - - - - - - 32 ITC - - - - - - - - - 3334 Other Income After Income Taxes: - - - - - - - - - 3536 TOTAL EXPENSES: - - - - - - - - - 3738 Other Operating Income (Revenue Credits):39 Acct 487, Acct 493, Acct 495: IL Tax Fee - - - - - - - - - 40 Acct 488, Acct 495: Miscellaneous - - 41 Acct 495: Customer Penalities & Gas True-up - - 42 Acct 495: VBA and Decoupling related - - 43 Total Other Operating Income: - - - - - - - - - 4445 Actual Return (Net Operating Income) - - - - - - - - - 4647 Return Income Deficiency - - - - - - - - - 4849 Additional Income Taxes on Deficiency: - - - - - - - - - 5051 REVENUE REQUIREMENTS: - - - - - - - - - 5253545556 RATE BASE:57 Utility Plant in Service - - - - - - - - - 58 Accumulated Depreciation - S/L - - - - - - - - - 59 Construction Work in Progress - - - - - - - - - 60 Net Plant in Service - - - - - - - - - 6162 Gas Stored Underground: - - - - - - - - - 63 Fuel Stock - - - - - - - - - 64 Working Capital Allowance - - - - - - - - - 65 Materials & Supplies: - - - - - - - - - 66 Other - Deferred Taxes (M&S / CWIP) - - - - - - - - - 67 Prepayments - - - - - - - - - 68 Cash & Bank Balances - - - - - - - - - 69 Property, Payroll & Income Taxes Accrued: - - - - - - - - 70 TOTAL RATE BASE - - - - - - - - - 71 % of Rate Base 0.0000% 0.0000% 0.0000% 0.0000% 0.0000% 0.0000% 0.0000% 0.0000% 0.0000%
COMMODITY DEMAND CUSTOMER
May not cross-check due to rounding.
Case No. U-17273 Witness: J.C. Hoffman Malueg
Exhibit A-6 (JCHM-1) Schedule F1.3 Page 16 of 21

Michigan Public Service CommissionMichigan Gas Utilities CorporationProjected Cost of Service Allocation StudyProjected Test Year Ending December 31, 2014Revenue Requirement and Rate Base by Individual Rate Schedule
(A) (B) (C) (D) (E) (F) (G) (H) (I) (J)
GAS SUPPLY DISTRIBUTION DISTRIBUTION ENHANCEDLINE PURCHASED ACQUISITION PRODUCTION STORAGE DEMAND CUSTOMER OTHERNO. RATE: CUST CHOICE - MULTI FAM 4 GAS COST COST DEMAND COST RELATED RELATED CUSTOMER SERVICES TOTAL
12 Operation & Maintenance Expense:3 Production:4 Purchased Gas Cost - - 5 Gas Supply Acquisition Cost - - 6 Production Demand 1,470 1,470 7 Storage Cost 1,244 1,244 8 Total - Production - - 1,470 1,244 - - - - 2,714 910 Transmission: 584 52 637 11 Distribution: 4,130 851 4,980 12 Customer Accounts and Services: - 13 Allocable 3,473 3,473 14 Transport Allocable - - 15 Customer Sales: - - 16 Administrative & General: - - 814 491 3,717 - 3,211 - 8,232 17 Total Operation & Maintenance Expense: - - 2,284 1,735 8,431 903 6,683 - 20,036 1819 Depreciation & Amort Expense: - - 203 711 4,913 946 - - 6,772 2021 Taxes Other Than Income Taxes:22 Unemployment Comp - FED & STATE 4 1 5 40 23 - 73 23 Retirement Benefits - FED 46 17 56 473 275 - 867 24 IBS Payroll Tax 27 10 33 282 164 - 516 25 Michigan SBT & Real Estate/Property - - 45 764 2,082 421 - - 3,313 26 Misc - Unauthorized Ins. Tax & Franchise - - 0 4 10 2 - - 16 27 Total Taxes Other Than Income Taxes: - - 122 796 2,187 1,218 462 - 4,785 2829 Other Income Before Income Taxes: - - - - - - - - - 3031 Income Taxes - - 37 636 1,735 351 - - 2,760 32 ITC - - - - - - - - - 3334 Other Income After Income Taxes: - - - - - - - - - 3536 TOTAL EXPENSES: - - 2,646 3,877 17,266 3,418 7,145 - 34,353 3738 Other Operating Income (Revenue Credits):39 Acct 487, Acct 493, Acct 495: IL Tax Fee - - (7) (122) (333) (67) - - (529) 40 Acct 488, Acct 495: Miscellaneous (20) (20) 41 Acct 495: Customer Penalities & Gas True-up - - 42 Acct 495: VBA and Decoupling related - - 43 Total Other Operating Income: - - (7) (122) (333) (67) (20) - (549) 4445 Actual Return (Net Operating Income) - - 471 7,989 21,784 4,408 - - 34,652 4647 Return Income Deficiency - - (290) (4,931) (13,444) (2,721) - - (21,386) 4849 Additional Income Taxes on Deficiency: - - 42 709 1,934 391 - - 3,077 5051 REVENUE REQUIREMENTS: - - 2,861 7,523 27,207 5,430 7,125 - 50,145 5253545556 RATE BASE:57 Utility Plant in Service - - 4,422 32,213 186,207 57,062 - - 279,904 58 Accumulated Depreciation - S/L - - (2,366) (15,328) (103,366) (30,736) - - (151,795) 59 Construction Work in Progress - - - - - - - - - 60 Net Plant in Service - - 2,056 16,885 82,841 26,326 - - 128,108 6162 Gas Stored Underground: - - - 28,030 - - - - 28,030 63 Fuel Stock - - - - - - - - - 64 Working Capital Allowance - - 372 3,054 50,902 - - - 54,328 65 Materials & Supplies: - - - - 287 24 - - 311 66 Other - Deferred Taxes (M&S / CWIP) - - - - - - - - - 67 Prepayments - - 72 29 885 - - - 986 68 Cash & Bank Balances - - 351 0 3 - - - 355 69 Property, Payroll & Income Taxes Accrued: - - (37) (241) (4,705) - - (4,983) 70 TOTAL RATE BASE - - 2,814 47,758 130,214 26,350 - - 207,135 71 % of Rate Base 0.0000% 0.0000% 1.3583% 23.0563% 62.8642% 12.7212% 0.0000% 0.0000% 100.0000%
COMMODITY DEMAND CUSTOMER
May not cross-check due to rounding.
Case No. U-17273 Witness: J.C. Hoffman Malueg
Exhibit A-6 (JCHM-1) Schedule F1.3 Page 17 of 21

Michigan Public Service CommissionMichigan Gas Utilities CorporationProjected Cost of Service Allocation StudyProjected Test Year Ending December 31, 2014Revenue Requirement and Rate Base by Individual Rate Schedule
(A) (B) (C) (D) (E) (F) (G) (H) (I) (J)
GAS SUPPLY DISTRIBUTION DISTRIBUTION ENHANCEDLINE PURCHASED ACQUISITION PRODUCTION STORAGE DEMAND CUSTOMER OTHERNO. RATE: AGG TRNSPT - RESID. GAS COST COST DEMAND COST RELATED RELATED CUSTOMER SERVICES TOTAL
12 Operation & Maintenance Expense:3 Production:4 Purchased Gas Cost - - 5 Gas Supply Acquisition Cost - - 6 Production Demand 181 181 7 Storage Cost 176 176 8 Total - Production - - 181 176 - - - - 357 910 Transmission: 72 7 79 11 Distribution: 507 1,349 1,857 12 Customer Accounts and Services: - 13 Allocable 2,408 2,408 14 Transport Allocable 13,454 13,454 15 Customer Sales: - - 16 Administrative & General: - - 100 70 457 - 2,227 8,747 11,600 17 Total Operation & Maintenance Expense: - - 281 246 1,036 1,356 4,635 22,202 29,755 1819 Depreciation & Amort Expense: - - 25 101 603 1,301 - - 2,030 2021 Taxes Other Than Income Taxes:22 Unemployment Comp - FED & STATE 1 0 1 7 4 - 12 23 Retirement Benefits - FED 8 3 10 81 47 - 149 24 IBS Payroll Tax 5 2 6 48 28 - 88 25 Michigan SBT & Real Estate/Property - - 6 108 276 330 - - 720 26 Misc - Unauthorized Ins. Tax & Franchise - - 0 1 1 2 - - 4 27 Total Taxes Other Than Income Taxes: - - 19 114 294 468 79 - 974 2829 Other Income Before Income Taxes: - - - - - - - - - 3031 Income Taxes - - 5 90 230 275 - - 600 32 ITC - - - - - - - - - 3334 Other Income After Income Taxes: - - - - - - - - - 3536 TOTAL EXPENSES: - - 329 550 2,163 3,400 4,714 22,202 33,358 3738 Other Operating Income (Revenue Credits):39 Acct 487, Acct 493, Acct 495: IL Tax Fee - - (1) (17) (42) (51) - - (110) 40 Acct 488, Acct 495: Miscellaneous (61) (61) 41 Acct 495: Customer Penalities & Gas True-up - - 42 Acct 495: VBA and Decoupling related - - 43 Total Other Operating Income: - - (1) (17) (42) (51) (61) - (172) 4445 Actual Return (Net Operating Income) - - (147) (2,845) (7,265) (8,684) - - (18,940) 4647 Return Income Deficiency - - 169 3,278 8,371 10,006 - - 21,825 4849 Additional Income Taxes on Deficiency: - - 5 101 257 307 - - 669 5051 REVENUE REQUIREMENTS: - - 355 1,068 3,484 4,979 4,652 22,202 36,741 5253545556 RATE BASE:57 Utility Plant in Service - - 543 4,565 22,872 44,444 - - 72,424 58 Accumulated Depreciation - S/L - - (291) (2,172) (12,697) (23,861) - - (39,021) 59 Construction Work in Progress - - - - - - - - - 60 Net Plant in Service - - 252 2,393 10,176 20,583 - - 33,404 6162 Gas Stored Underground: - - - 3,972 - - - - 3,972 63 Fuel Stock - - - - - - - - - 64 Working Capital Allowance - - 49 433 7,539 - - - 8,021 65 Materials & Supplies: - - - - 35 73 - - 108 66 Other - Deferred Taxes (M&S / CWIP) - - - - - - - - - 67 Prepayments - - 9 4 109 - - - 122 68 Cash & Bank Balances - - 43 0 0 - - - 43 69 Property, Payroll & Income Taxes Accrued: - - (5) (34) (578) - - (617) 70 TOTAL RATE BASE - - 348 6,767 17,281 20,656 - - 45,053 71 % of Rate Base 0.0000% 0.0000% 0.7735% 15.0212% 38.3568% 45.8485% 0.0000% 0.0000% 100.0000%
COMMODITY DEMAND CUSTOMER
May not cross-check due to rounding.
Case No. U-17273 Witness: J.C. Hoffman Malueg
Exhibit A-6 (JCHM-1) Schedule F1.3 Page 18 of 21

Michigan Public Service CommissionMichigan Gas Utilities CorporationProjected Cost of Service Allocation StudyProjected Test Year Ending December 31, 2014Revenue Requirement and Rate Base by Individual Rate Schedule
(A) (B) (C) (D) (E) (F) (G) (H) (I) (J)
GAS SUPPLY DISTRIBUTION DISTRIBUTION ENHANCEDLINE PURCHASED ACQUISITION PRODUCTION STORAGE DEMAND CUSTOMER OTHERNO. RATE: AGG TRNSPT - SMALL GS GAS COST COST DEMAND COST RELATED RELATED CUSTOMER SERVICES TOTAL
12 Operation & Maintenance Expense:3 Production:4 Purchased Gas Cost - - 5 Gas Supply Acquisition Cost - - 6 Production Demand 43,841 43,841 7 Storage Cost 44,299 44,299 8 Total - Production - - 43,841 44,299 - - - - 88,140 910 Transmission: 17,431 1,553 18,984 11 Distribution: 123,156 36,743 159,898 12 Customer Accounts and Services: - 13 Allocable 104,485 104,485 14 Transport Allocable 197,068 197,068 15 Customer Sales: - - 16 Administrative & General: - - 24,271 17,464 110,858 - 96,605 128,122 377,320 17 Total Operation & Maintenance Expense: - - 68,111 61,763 251,445 38,296 201,090 325,190 945,895 1819 Depreciation & Amort Expense: - - 6,040 25,297 146,517 35,866 - - 213,720 2021 Taxes Other Than Income Taxes:22 Unemployment Comp - FED & STATE 116 42 142 1,199 696 - 2,195 23 Retirement Benefits - FED 1,384 506 1,696 14,314 8,314 - 26,214 24 IBS Payroll Tax 824 301 1,009 8,520 4,948 - 15,602 25 Michigan SBT & Real Estate/Property - - 1,342 27,190 70,187 14,797 - - 113,517 26 Misc - Unauthorized Ins. Tax & Franchise - - 7 134 346 73 - - 560 27 Total Taxes Other Than Income Taxes: - - 3,673 28,173 73,381 38,902 13,958 - 158,087 2829 Other Income Before Income Taxes: - - - - - - - - - 3031 Income Taxes - - 1,118 22,657 58,485 12,330 - - 94,589 32 ITC - - - - - - - - - 3334 Other Income After Income Taxes: - - - - - - - - - 3536 TOTAL EXPENSES: - - 78,942 137,890 529,828 125,393 215,048 325,190 1,412,292 3738 Other Operating Income (Revenue Credits):39 Acct 487, Acct 493, Acct 495: IL Tax Fee - - (169) (3,425) (8,842) (1,864) - - (14,300) 40 Acct 488, Acct 495: Miscellaneous (899) (899) 41 Acct 495: Customer Penalities & Gas True-up - - 42 Acct 495: VBA and Decoupling related - - 43 Total Other Operating Income: - - (169) (3,425) (8,842) (1,864) (899) - (15,199) 4445 Actual Return (Net Operating Income) - - 5,346 108,318 279,608 58,947 - - 452,219 4647 Return Income Deficiency - - 28 571 1,473 310 - - 2,382 4849 Additional Income Taxes on Deficiency: - - 1,246 25,253 65,188 13,743 - - 105,431 5051 REVENUE REQUIREMENTS: - - 85,394 268,606 867,254 196,530 214,149 325,190 1,957,124 5253545556 RATE BASE:57 Utility Plant in Service - - 131,864 1,146,828 5,553,272 1,983,781 - - 8,815,745 58 Accumulated Depreciation - S/L - - (70,559) (545,696) (3,082,682) (1,059,578) - - (4,758,516) 59 Construction Work in Progress - - - - - - - - - 60 Net Plant in Service - - 61,305 601,132 2,470,590 924,203 - - 4,057,230 6162 Gas Stored Underground: - - - 997,893 - - - - 997,893 63 Fuel Stock - - - - - - - - - 64 Working Capital Allowance - - 11,095 108,743 2,023,568 - - - 2,143,406 65 Materials & Supplies: - - - - 8,573 1,074 - - 9,647 66 Other - Deferred Taxes (M&S / CWIP) - - - - - - - - - 67 Prepayments - - 2,144 1,039 26,395 - - - 29,579 68 Cash & Bank Balances - - 10,469 7 103 - - - 10,579 69 Property, Payroll & Income Taxes Accrued: - - (1,096) (8,590) (140,329) - - (150,014) 70 TOTAL RATE BASE - - 83,917 1,700,224 4,388,900 925,277 - - 7,098,319 71 % of Rate Base 0.0000% 0.0000% 1.1822% 23.9525% 61.8301% 13.0352% 0.0000% 0.0000% 100.0000%
COMMODITY DEMAND CUSTOMER
May not cross-check due to rounding.
Case No. U-17273 Witness: J.C. Hoffman Malueg
Exhibit A-6 (JCHM-1) Schedule F1.3 Page 19 of 21

Michigan Public Service CommissionMichigan Gas Utilities CorporationProjected Cost of Service Allocation StudyProjected Test Year Ending December 31, 2014Revenue Requirement and Rate Base by Individual Rate Schedule
(A) (B) (C) (D) (E) (F) (G) (H) (I) (J)
GAS SUPPLY DISTRIBUTION DISTRIBUTION ENHANCEDLINE PURCHASED ACQUISITION PRODUCTION STORAGE DEMAND CUSTOMER OTHERNO. RATE: AGG TRNSPT - LARGE GS GAS COST COST DEMAND COST RELATED RELATED CUSTOMER SERVICES TOTAL
12 Operation & Maintenance Expense:3 Production:4 Purchased Gas Cost - - 5 Gas Supply Acquisition Cost - - 6 Production Demand 519 519 7 Storage Cost 856 856 8 Total - Production - - 519 856 - - - - 1,375 910 Transmission: 206 31 237 11 Distribution: 1,557 239 1,796 12 Customer Accounts and Services: - 13 Allocable 1,949 1,949 14 Transport Allocable 1,187 1,187 15 Customer Sales: - - 16 Administrative & General: - - 287 337 1,402 - 1,802 772 4,601 17 Total Operation & Maintenance Expense: - - 806 1,193 3,165 270 3,751 1,959 11,145 1819 Depreciation & Amort Expense: - - 72 489 1,791 393 - - 2,744 2021 Taxes Other Than Income Taxes:22 Unemployment Comp - FED & STATE 1 1 2 14 8 - 26 23 Retirement Benefits - FED 17 6 20 171 99 - 313 24 IBS Payroll Tax 10 4 12 102 59 - 186 25 Michigan SBT & Real Estate/Property - - 17 525 1,041 199 - - 1,783 26 Misc - Unauthorized Ins. Tax & Franchise - - 0 3 5 1 - - 9 27 Total Taxes Other Than Income Taxes: - - 45 538 1,080 487 167 - 2,317 2829 Other Income Before Income Taxes: - - - - - - - - - 3031 Income Taxes - - 14 438 867 166 - - 1,485 32 ITC - - - - - - - - - 3334 Other Income After Income Taxes: - - - - - - - - - 3536 TOTAL EXPENSES: - - 937 2,658 6,903 1,316 3,918 1,959 17,692 3738 Other Operating Income (Revenue Credits):39 Acct 487, Acct 493, Acct 495: IL Tax Fee - - (3) (97) (192) (37) - - (328) 40 Acct 488, Acct 495: Miscellaneous (5) (5) 41 Acct 495: Customer Penalities & Gas True-up - - 42 Acct 495: VBA and Decoupling related - - 43 Total Other Operating Income: - - (3) (97) (192) (37) (5) - (333) 4445 Actual Return (Net Operating Income) - - 243 7,388 14,633 2,802 - - 25,066 4647 Return Income Deficiency - - (174) (5,284) (10,465) (2,004) - - (17,927) 4849 Additional Income Taxes on Deficiency: - - 16 488 967 185 - - 1,656 5051 REVENUE REQUIREMENTS: - - 1,020 5,153 11,846 2,262 3,913 1,959 26,153 5253545556 RATE BASE:57 Utility Plant in Service - - 1,561 22,159 67,589 27,512 - - 118,821 58 Accumulated Depreciation - S/L - - (835) (10,544) (37,597) (15,058) - - (64,034) 59 Construction Work in Progress - - - - - - - - - 60 Net Plant in Service - - 726 11,615 29,992 12,454 - - 54,787 6162 Gas Stored Underground: - - - 19,282 - - - - 19,282 63 Fuel Stock - - - - - - - - - 64 Working Capital Allowance - - 221 2,101 36,322 - - - 38,644 65 Materials & Supplies: - - - - 101 6 - - 107 66 Other - Deferred Taxes (M&S / CWIP) - - - - - - - - - 67 Prepayments - - 25 20 313 - - - 358 68 Cash & Bank Balances - - 124 0 1 - - - 125 69 Property, Payroll & Income Taxes Accrued: - - (13) (166) (1,656) - - (1,835) 70 TOTAL RATE BASE - - 1,083 32,853 65,074 12,460 - - 111,469 71 % of Rate Base 0.0000% 0.0000% 0.9713% 29.4724% 58.3780% 11.1783% 0.0000% 0.0000% 100.0000%
COMMODITY DEMAND CUSTOMER
May not cross-check due to rounding.
Case No. U-17273 Witness: J.C. Hoffman Malueg
Exhibit A-6 (JCHM-1) Schedule F1.3 Page 20 of 21

Michigan Public Service CommissionMichigan Gas Utilities CorporationProjected Cost of Service Allocation StudyProjected Test Year Ending December 31, 2014Revenue Requirement and Rate Base by Individual Rate Schedule
(A) (B) (C) (D) (E) (F) (G) (H) (I) (J)
GAS SUPPLY DISTRIBUTION DISTRIBUTION ENHANCEDLINE PURCHASED ACQUISITION PRODUCTION STORAGE DEMAND CUSTOMER OTHERNO. RATE: SPECIAL CONTRACT GAS COST COST DEMAND COST RELATED RELATED CUSTOMER SERVICES TOTAL
12 Operation & Maintenance Expense:3 Production:4 Purchased Gas Cost 1,597 1,597 5 Gas Supply Acquisition Cost 11 11 6 Production Demand 6 6 7 Storage Cost 25 25 8 Total - Production 1,597 11 6 25 - - - - 1,640 910 Transmission: 2 0 3 11 Distribution: 18 83 102 12 Customer Accounts and Services: - 13 Allocable 5,274 5,274 14 Transport Allocable - - 15 Customer Sales: - - 16 Administrative & General: - 6 3 10 16 - 4,877 - 4,913 17 Total Operation & Maintenance Expense: 1,597 18 9 35 37 84 10,151 - 11,931 1819 Depreciation & Amort Expense: - - 1 14 21 53 - - 90 2021 Taxes Other Than Income Taxes:22 Unemployment Comp - FED & STATE 0 0 0 0 0 0 - 0 23 Retirement Benefits - FED 0 0 0 0 3 2 - 5 24 IBS Payroll Tax 0 0 0 0 2 1 - 3 25 Michigan SBT & Real Estate/Property - - 0 15 29 18 - - 62 26 Misc - Unauthorized Ins. Tax & Franchise - - 0 0 0 0 - - 0 27 Total Taxes Other Than Income Taxes: - 0 0 16 30 22 3 - 71 2829 Other Income Before Income Taxes: - - - - - - - - - 3031 Income Taxes - - 0 13 24 15 - - 52 32 ITC - - - - - - - - - 3334 Other Income After Income Taxes: - - - - - - - - - 3536 TOTAL EXPENSES: 1,597 18 11 77 112 174 10,154 - 12,143 3738 Other Operating Income (Revenue Credits):39 Acct 487, Acct 493, Acct 495: IL Tax Fee - - (3) (236) (446) (272) - - (957) 40 Acct 488, Acct 495: Miscellaneous (2) (2) 41 Acct 495: Customer Penalities & Gas True-up (7) (7) 42 Acct 495: VBA and Decoupling related - - 43 Total Other Operating Income: (7) - (3) (236) (446) (272) (2) - (966) 4445 Actual Return (Net Operating Income) - - 369 28,145 53,207 32,467 - - 114,188 4647 Return Income Deficiency - - (368) (28,084) (53,091) (32,396) - - (113,940) 4849 Additional Income Taxes on Deficiency: - - 0 14 27 16 - - 58 5051 REVENUE REQUIREMENTS: 1,590 18 9 (83) (192) (11) 10,152 - 11,483 5253545556 RATE BASE:57 Utility Plant in Service - - 18 644 794 2,222 - - 3,678 58 Accumulated Depreciation - S/L - - (10) (307) (441) (1,122) - - (1,880) 59 Construction Work in Progress - - - - - - - - - 60 Net Plant in Service - - 9 338 352 1,100 - - 1,799 6162 Gas Stored Underground: - - - 561 - - - - 561 63 Fuel Stock - - - - - - - - - 64 Working Capital Allowance - - 3 61 1,469 - - - 1,533 65 Materials & Supplies: - - - - 1 2 - - 3 66 Other - Deferred Taxes (M&S / CWIP) - - - - - - - - - 67 Prepayments - - - 1 4 - - - 4 68 Cash & Bank Balances - - 1 0 0 - - - 1 69 Property, Payroll & Income Taxes Accrued: - - - (5) (19) - - (24) 70 TOTAL RATE BASE - - 13 955 1,806 1,102 - - 3,877 71 % of Rate Base 0.0000% 0.0000% 0.3230% 24.6483% 46.5960% 28.4327% 0.0000% 0.0000% 100.0000%
COMMODITY DEMAND CUSTOMER
May not cross-check due to rounding.
Case No. U-17273 Witness: J.C. Hoffman Malueg
Exhibit A-6 (JCHM-1) Schedule F1.3 Page 21 of 21

Mic
higa
n P
ublic
Ser
vice
Com
mis
sion
Mic
higa
n G
as U
tiliti
es C
orpo
ratio
nP
roje
cted
Cos
t of S
ervi
ce A
lloca
tion
Stu
dyP
roje
cted
Tes
t Yea
r End
ing
Dec
embe
r 31,
201
4
CO
NS
UM
PTI
ON
CO
STS
BY
BIL
LIN
G U
NIT
(A)
(B)
(C)
(D)
(E)
(F)
(G)
(H)
TOTA
LG
AS
ENH
AN
CED
MO
NTH
LYLO
CA
LSU
PPLY
TOTA
LLI
NE
FIXE
DA
DM
IN.
FIXE
DVO
LUM
ETR
ICST
OR
AG
EA
CQ
UIS
ITIO
NM
CF
NO
.R
ATE
SC
HE
DU
LEC
HA
RG
EC
HA
RG
EC
HA
RG
ER
ATE
RA
TER
ATE
RA
TE
1R
esid
entia
l$2
2.35
-
$22.
35$0
.620
4$0
.167
5$0
.055
$0.8
431
2M
ulti-
Fam
ily -
Cla
ss I
$22.
35-
$2
2.35
$0.6
204
$0.1
675
$0.0
55$0
.843
13
Cus
t Cho
ice
- Res
iden
tial
$22.
35-
$2
2.35
$0.6
204
$0.1
675
-
$0.7
878
4C
ust C
hoic
e - M
ulti-
Fam
ily -
Cla
ss I
$22.
35-
$2
2.35
$0.6
204
$0.1
675
-
$0.7
878
5A
gg T
rans
p - R
esid
entia
l$2
2.35
$54.
42$7
6.76
$0.6
204
$0.1
675
-
$0.7
878
6M
ulti-
Fam
ily -
Cla
ss II
$39.
39-
$3
9.39
$0.6
582
$0.1
720
$0.0
55$0
.885
07
Mul
ti-Fa
mily
- C
lass
III
$39.
39-
$3
9.39
$0.6
582
$0.1
720
$0.0
55$0
.885
08
Mul
ti-Fa
mily
- C
lass
IV$3
9.39
-
$39.
39$0
.658
2$0
.172
0$0
.055
$0.8
850
9S
mal
l Gen
eral
Ser
vice
$39.
39-
$3
9.39
$0.6
582
$0.1
720
$0.0
55$0
.885
010
Cus
t Cho
ice
- Sm
all G
S$3
9.39
-
$39.
39$0
.658
2$0
.172
0-
$0
.830
211
Cus
t Cho
ice
- Mul
ti-Fa
mily
- C
lass
II$3
9.39
-
$39.
39$0
.658
2$0
.172
0-
$0
.830
212
Cus
t Cho
ice
- Mul
ti-Fa
mily
- C
lass
III
$39.
39-
$3
9.39
$0.6
582
$0.1
720
-
$0.8
302
13C
ust C
hoic
e - M
ulti-
Fam
ily -
Cla
ss IV
$39.
39-
$3
9.39
$0.6
582
$0.1
720
-
$0.8
302
14A
gg T
rans
p - S
mal
l GS
$39.
39$5
4.42
$93.
80$0
.658
2$0
.172
0-
$0
.830
215
Larg
e G
ener
al S
ervi
ce$2
66.0
4-
$2
66.0
4$0
.439
0$0
.166
0$0
.054
$0.6
594
16C
ust C
hoic
e - L
arge
GS
$266
.04
-
$266
.04
$0.4
390
$0.1
660
-
$0.6
049
17A
gg T
rans
p - L
arge
GS
$266
.04
$54.
42$3
20.4
6$0
.439
0$0
.166
0-
$0
.604
918
Tran
spor
t - T
R-1
$268
.64
$54.
42$3
23.0
6$0
.475
0$0
.074
1-
$0
.549
219
Tran
spor
t - T
R-2
$1,0
05.8
0$5
4.42
$1,0
60.2
2$0
.403
8$0
.060
7-
$0
.464
520
Tran
spor
t - T
R-3
$4,3
01.3
4$5
4.42
$4,3
55.7
6$0
.328
8$0
.050
5-
$0
.379
421
Spe
cial
Con
tract
N/A
N/A
N/A
N/A
N/A
N/A
N/A
Case No. U-17273 Witness: J.C. Hoffman Malueg
Exhibit A-6 (JCHM-1) Schedule F1.4
Page 1 of 3

Mic
higa
n P
ublic
Ser
vice
Com
mis
sion
Mic
higa
n G
as U
tiliti
es C
orpo
ratio
nP
roje
cted
Cos
t of S
ervi
ce A
lloca
tion
Stu
dyP
roje
cted
Tes
t Yea
r End
ing
Dec
embe
r 31,
201
4
CO
NS
UM
PTI
ON
CO
STS
BY
BIL
LIN
G U
NIT
(A)
(B)
(C)
(D)
(E)
(F)
(G)
(H)
(I)
GA
SG
AS
LOC
AL
SU
PP
LYSU
PPLY
LIN
EM
CF
DE
MA
ND
VOLU
MET
RIC
STO
RA
GE
STO
RA
GE
MC
FA
CQ
UIS
ITIO
NA
CQ
UIS
ITIO
NN
O.
RA
TE S
CH
ED
ULE
THR
OU
GH
PU
TC
OS
TR
ATE
CO
ST
RA
TES
ALE
SC
OS
TR
ATE
1R
esid
entia
l:2
Res
iden
tial
10,9
97,5
69
6,82
7,22
2$
1,
847,
222
$
10,9
97,5
6960
7,13
4$
3
Mul
ti-Fa
mily
- C
lass
I21
,175
12,9
05$
3,
374
$
21,1
751,
164
$
4
Cus
t Cho
ice
- Res
iden
tial
2,38
7,41
8
1,
476,
545
$
394,
565
$
-
-
$
5
Cus
t Cho
ice
- Mul
ti-Fa
mily
- C
lass
I2,
984
1,87
7$
517
$
-
-
$
6
Agg
Tra
nsp
- Res
iden
tial
6,10
5
3,
840
$
1,
068
$
-
-$
713
,415
,251
8,
322,
389
$
$0.6
204
2,24
6,74
5$
$0
.167
511
,018
,744
608,
298
$
$0.0
558 9
Sm
all S
ervi
ce10
Mul
ti-Fa
mily
- C
lass
II11
1,05
5
71,0
55$
17
,536
$
111,
055
6,08
8$
11M
ulti-
Fam
ily -
Cla
ss II
I31
,380
19,9
67$
4,
867
$
31,3
801,
718
$
12
Mul
ti-Fa
mily
- C
lass
IV45
,685
29,4
81$
7,
417
$
45,6
852,
501
$
13
Sm
all G
ener
al S
ervi
ce3,
118,
038
2,03
2,94
2$
52
1,67
7$
3,11
8,03
817
1,01
5$
14
Cus
t Cho
ice
- Sm
all G
S2,
056,
576
1,33
9,84
8$
34
2,12
0$
-
-$
15C
ust C
hoic
e - M
ulti-
Fam
ily -
Cla
ss II
10,3
93
6,
769
$
1,
735
$
-
-$
16C
ust C
hoic
e - M
ulti-
Fam
ily -
Cla
ss II
I-
-
$
-
$
-
-$
17C
ust C
hoic
e - M
ulti-
Fam
ily -
Cla
ss IV
46,6
46
30
,067
$
7,52
3$
-
-
$
18
Agg
Tra
nsp
- Sm
all G
S1,
391,
128
952,
648
$
26
8,60
6$
-
-$
196,
810,
901
4,48
2,77
8$
$0
.658
21,
171,
481
$
$0.1
720
3,30
6,15
818
1,32
3$
$0
.055
20 21La
rge
Ser
vice
22La
rge
Gen
eral
Ser
vice
305,
924
13
3,61
0$
50,2
29$
30
5,92
4
16
,669
$
23
Cus
t Cho
ice
- Lar
ge G
S-
-
$
-
$
-
-$
24A
gg T
rans
p - L
arge
GS
27,7
66
12
,865
$
5,15
3$
-
-
$
25
333,
690
14
6,47
5$
$0.4
390
55,3
82$
$0
.166
030
5,92
416
,669
$
$0
.054
26 27La
rge
Tran
spor
t Ser
vice
28Tr
ansp
ort -
TR
-11,
821,
166
865,
132
$
$0
.475
013
5,01
4$
$0.0
741
-
-$
29 30Tr
ansp
ort -
TR
-23,
883,
381
1,56
8,14
6$
$0
.403
823
5,56
9$
$0.0
607
-
-$
31 32Tr
ansp
ort -
TR
-33,
740,
608
1,22
9,96
6$
$0
.328
818
9,08
1$
$0.0
505
-
-$
33 34S
peci
al C
ontra
cts
35S
peci
al C
ontra
ct32
6
(183
)$
N/A
(83)
$
N
/A32
618
$
N
/A36 37
GR
AN
D T
OTA
LS30
,005
,323
16
,614
,703
$
4,
033,
189
$
14,6
31,1
52
80
6,30
8$
Case No. U-17273 Witness: J.C. Hoffman Malueg
Exhibit A-6 (JCHM-1) Schedule F1.4
Page 2 of 3

Mic
higa
n P
ublic
Ser
vice
Com
mis
sion
Mic
higa
n G
as U
tiliti
es C
orpo
ratio
nP
roje
cted
Cos
t of S
ervi
ce A
lloca
tion
Stu
dyP
roje
cted
Tes
t Yea
r End
ing
Dec
embe
r 31,
201
4
CO
NS
UM
PTI
ON
CO
STS
BY
BIL
LIN
G U
NIT
(A)
(B)
(C)
(D)
(E)
(F)
(G)
TOTA
LE
NH
AN
CE
DEN
HA
NC
EDM
ON
THLY
LIN
EC
US
TOM
ER
CU
STO
ME
RFI
XED
AD
MIN
ISTR
ATI
VE
AD
MIN
.FI
XED
NO
.R
ATE
SC
HE
DU
LEC
OU
NT
CO
STS
CH
AR
GE
CO
STS
CH
AR
GE
CH
AR
GE
1R
esid
entia
l:2
Res
iden
tial
1,50
0,96
8
33
,660
,857
$
-
$
-$
$2
2.35
3M
ulti-
Fam
ily -
Cla
ss I
1,49
5
33
,915
$
-$
-
$
$22.
354
Cus
t Cho
ice
- Res
iden
tial
327,
805
7,
206,
751
$
-$
-
$
$22.
355
Cus
t Cho
ice
- Mul
ti-Fa
mily
- C
lass
I46
8
9,77
7$
-$
-
$
$22.
356
Agg
Tra
nsp
- Res
iden
tial
408
9,
632
$
22
,202
$
54.4
2$
$7
6.76
71,
831,
144
40,9
20,9
31$
$22.
358 9
Sm
all S
ervi
ce10
Mul
ti-Fa
mily
- C
lass
II2,
489
83,7
04$
-
$
-$
$3
9.39
11M
ulti-
Fam
ily -
Cla
ss II
I20
3
13,9
42$
-
$
-$
$3
9.39
12M
ulti-
Fam
ily -
Cla
ss IV
129
12
,334
$
-$
-
$
$39.
3913
Sm
all G
ener
al S
ervi
ce91
,160
3,50
3,10
3$
-
$
-$
$3
9.39
14C
ust C
hoic
e - S
mal
l GS
60,2
64
2,
288,
069
$
-$
-
$
$39.
3915
Cus
t Cho
ice
- Mul
ti-Fa
mily
- C
lass
II63
6
16,7
87$
-
$
-$
$3
9.39
16C
ust C
hoic
e - M
ulti-
Fam
ily -
Cla
ss II
I-
-
$
-
$
-$
$3
9.39
17C
ust C
hoic
e - M
ulti-
Fam
ily -
Cla
ss IV
132
12
,555
$
-$
-
$
$39.
3918
Agg
Tra
nsp
- Sm
all G
S5,
976
410,
679
$
32
5,19
0$
54.4
2$
$9
3.80
1916
0,98
9
6,34
1,17
3$
$3
9.39
20 21La
rge
Ser
vice
22La
rge
Gen
eral
Ser
vice
199
56
,345
$
-$
-
$
$266
.04
23C
ust C
hoic
e - L
arge
GS
-
-$
-$
-
$
$266
.04
24A
gg T
rans
p - L
arge
GS
36
6,
175
$
1,
959
$
54.4
2$
$3
20.4
625
235
62
,519
$
$266
.04
26 27La
rge
Tran
spor
t Ser
vice
28Tr
ansp
ort -
TR
-11,
344
361,
051
$
$2
68.6
473
,135
$
54.4
2$
$3
23.0
629 30
Tran
spor
t - T
R-2
468
47
0,71
7$
$1,0
05.8
025
,467
$
54.4
2$
$1
,060
.22
31 32Tr
ansp
ort -
TR
-384
361,
313
$
$4
,301
.34
4,57
1$
54
.42
$
$4,3
55.7
633 34
Spe
cial
Con
tract
s35
Spe
cial
Con
tract
12
10
,141
$
N/A
N/A
N/A
N/A
36 371,
994,
276
48,5
27,8
45$
452,
524
$
Case No. U-17273 Witness: J.C. Hoffman Malueg
Exhibit A-6 (JCHM-1) Schedule F1.4
Page 3 of 3

Mic
higa
n P
ublic
Ser
vice
Com
mis
sion
Mic
higa
n G
as U
tiliti
es C
orpo
ratio
nP
roje
cted
Cos
t of S
ervi
ce A
lloca
tion
Stu
dyP
roje
cted
Tes
t Yea
r End
ing
Dec
embe
r 31,
201
4
Allo
catio
n Fa
ctor
s us
ed w
ithin
the
Gas
Cos
t of S
ervi
ce S
tudy
(A)
(B)
(C)
(D)
(E)
(F)
(G)
(H)
(I)(J
)(K
)(L
)(M
)
LIN
E
NO
.D
ES
CR
IPTI
ON
OF
ALL
OC
ATI
ON
DA
TAC
OR
PO
RA
TE T
OTA
LR
esid
entia
lM
ulti-
Fam
ily -
Cla
ss I
Mul
ti-Fa
mily
- C
lass
IIM
ulti-
Fam
ily -
Cla
ss
IIIM
ulti-
Fam
ily -
Cla
ss
IVS
mal
l Gen
eral
S
ervi
ceLa
rge
Gen
eral
S
ervi
ceTr
ansp
ort -
TR
-1Tr
ansp
ort -
TR
-2Tr
ansp
ort -
TR
-3S
OU
RC
E o
r ALL
OC
ATI
ON
FA
CTO
R1
GR
OU
P PE
AK
DEM
AN
D4,
931,
651
2,05
2,60
7
3,
507
18,1
96
4,91
9
7,
974
580,
606
55
,125
25
1,75
3
432,
392
35
1,44
5
2P
erce
ntag
e1.
0000
0
0.41
621
0.
0007
1
0.00
369
0.
0010
0
0.00
162
0.
1177
3
0.01
118
0.
0510
5
0.08
768
0.
0712
6
Gro
up D
eman
d3 4
Res
iden
tial C
usto
mer
s5
G
roup
Pea
k P
erce
ntag
e0.
5045
3
0.41
621
0.
0007
1
Line
26
A
nnua
l MC
F Th
roug
hput
13,4
15,2
51
10,9
97,5
69
21,1
75
Line
46
7
P
ropo
rtion
0.81
978
0.
0015
8
8
Res
iden
tial W
eigh
t for
Gro
up P
eak
Dem
and
0.50
453
0.
5045
3
Line
5, C
orpo
rate
Tot
al9
Wei
ghte
d P
ropo
rtion
0.50
453
0.
4136
0
0.00
080
10 11
Com
mer
cial
Sm
all C
usto
mer
s:12
G
roup
Pea
k P
erce
ntag
e0.
2729
3
0.00
369
0.
0010
0
0.00
162
0.
1177
3
Line
213
A
nnua
l MC
F Th
roug
hput
6,81
0,90
1
11
1,05
5
31,3
80
45,6
85
3,11
8,03
8
Li
ne 4
614
Pro
porti
on0.
0163
1
0.00
461
0.
0067
1
0.45
780
15
C
om. S
mal
l Wei
ght f
or C
oinc
iden
t Pea
k D
eman
d0.
2729
3
0.27
293
0.
2729
3
0.27
293
Li
ne 1
2, C
orpo
rate
Tot
al16
Wei
ghte
d P
ropo
rtion
0.27
293
0.
0044
5
0.00
126
0.
0018
3
0.12
495
17 18
Com
mer
cial
Med
ium
Cus
tom
ers:
19
Gro
up P
eak
Per
cent
age
0.05
105
0.
0510
5
Line
220
A
nnua
l MC
F Th
roug
hput
1,82
1,16
6
1,
821,
166
Line
46
21
P
ropo
rtion
1.00
000
22
C
om. M
ediu
m W
eigh
t for
Coi
ncid
ent P
eak
Dem
and
0.05
105
Li
ne 1
9, C
orpo
rate
Tot
al23
Wei
ghte
d P
ropo
rtion
0.05
105
0.
0510
5
24 25C
omm
erci
al L
arge
Cus
tom
ers:
26
Gro
up P
eak
Per
cent
age
0.10
023
0.
0111
8
0.08
768
Li
ne 2
27
Ann
ual M
CF
Thro
ughp
ut4,
217,
397
305,
924
3,
883,
381
Line
46
28
P
ropo
rtion
0.07
254
0.
9208
0
29
Com
. Lar
ge W
eigh
t for
Coi
ncid
ent P
eak
Dem
and
0.10
023
0.
1002
3
Line
26,
Cor
pora
te T
otal
30
W
eigh
ted
Pro
porti
on0.
1002
3
0.00
727
0.
0922
9
31 32S
uper
Lar
ge C
usto
mer
s:33
G
roup
Pea
k P
erce
ntag
e0.
0712
6
0.07
126
Li
ne 2
34
Ann
ual M
CF
Thro
ughp
ut3,
740,
608
3,74
0,60
8
Li
ne 4
635
Pro
porti
on1.
0000
0
36
Sup
er L
arge
Wei
ght f
or C
oinc
iden
t Pea
k D
eman
d0.
0712
6
Line
33,
Cor
pora
te T
otal
37
W
eigh
ted
Pro
porti
on0.
0712
6
0.07
126
38 39
Tota
l Wei
ghte
d P
eak
Dem
and
Allo
cato
r1.
0000
0
0.41
360
0.
0008
0
0.00
445
0.
0012
6
0.00
183
0.
1249
5
0.00
727
0.
0510
5
0.09
229
0.
0712
6
Wei
ghte
d Pe
ak D
eman
d40 41 42
SALE
S / C
OM
MO
DIT
Y14
,631
,152
10
,997
,569
21
,175
11
1,05
5
31,3
80
45,6
85
3,11
8,03
8
30
5,92
4
-
-
-
43P
erce
ntag
e1.
0000
0
0.75
165
0.
0014
5
0.00
759
0.
0021
4
0.00
312
0.
2131
1
0.02
091
-
-
-
Sa
les
44 45 46M
CF
THR
OU
GH
PUT
30,0
05,3
23
10,9
97,5
69
21,1
75
111,
055
31
,380
45
,685
3,
118,
038
305,
924
1,
821,
166
3,88
3,38
1
3,
740,
608
47P
erce
ntag
e1.
0000
0
0.36
652
0.
0007
1
0.00
370
0.
0010
5
0.00
152
0.
1039
2
0.01
020
0.
0606
9
0.12
942
0.
1246
6
MC
F Th
roug
hput
48 49 50TH
RO
UG
HPU
T - R
ESID
ENTI
AL
13,3
91,0
92
10,9
97,5
69
-
-
-
-
-
-
-
-
-
51P
erce
ntag
e1.
0000
0
0.82
126
-
-
-
-
-
-
-
-
-
Th
ru-p
ut -
Res
iden
tial
52 53 54TH
RO
UG
HPU
T - S
MA
LL G
S &
MF
6,71
1,34
9
-
21
,175
11
1,05
5
-
-
3,11
8,03
8
-
-
-
-
55
Per
cent
age
1.00
000
-
0.
0031
6
0.01
655
-
-
0.
4645
9
-
-
-
-
Thru
-put
- Sm
all G
S &
MF
56 57 58TH
RO
UG
HPU
T - L
AR
GE
MF
123,
711
-
-
-
31
,380
45
,685
-
-
-
-
-
59
Per
cent
age
1.00
000
-
-
-
0.
2536
6
0.36
929
-
-
-
-
-
Th
ru-p
ut -
Larg
e M
F60 61 62
STO
RA
GE
CA
PAC
ITY
7,01
2,16
7
3,
498,
177
6,73
5
35
,325
9,
982
14,5
32
991,
805
97
,310
11
4,64
4
202,
749
15
4,86
5
63P
erce
ntag
e1.
0000
0
0.49
887
0.
0009
6
0.00
504
0.
0014
2
0.00
207
0.
1414
4
0.01
388
0.
0163
5
0.02
891
0.
0220
9
64 65G
roup
Pea
k - 5
0%0.
5000
0
0.20
811
0.
0003
6
0.00
184
0.
0005
0
0.00
081
0.
0588
7
0.00
559
0.
0255
2
0.04
384
0.
0356
3
66S
tora
ge C
apac
ity -
50%
0.50
000
0.
2494
40.
0004
80.
0025
20.
0007
10.
0010
40.
0707
20.
0069
40.
0081
70.
0144
60.
0110
467
S
tora
ge C
apac
ity A
lloca
tor -
50/
501.
0000
0
0.45
754
0.
0008
4
0.00
436
0.
0012
1
0.00
184
0.
1295
9
0.01
253
0.
0337
0
0.05
830
0.
0466
7
Stor
age
68 69 70C
UST
OM
ERS
- TO
TAL
AN
NU
AL
1,99
4,27
6
1,
500,
968
1,49
5
2,
489
203
12
9
91,1
60
199
1,
344
468
84
71P
erce
ntag
e1.
0000
0
0.75
264
0.
0007
5
0.00
125
0.
0001
0
0.00
006
0.
0457
1
0.00
010
0.
0006
7
0.00
023
0.
0000
4
Cus
tom
er
Case No. U-17273 Witness: J.C. Hoffman Malueg
Exhibit A-6 (JCHM-1) Schedule F1.5
Page 1 of 4

Mic
higa
n P
ublic
Ser
vice
Com
mis
sion
Mic
higa
n G
as U
tiliti
es C
orpo
ratio
nP
roje
cted
Cos
t of S
ervi
ce A
lloca
tion
Stu
dyP
roje
cted
Tes
t Yea
r End
ing
Dec
embe
r 31,
201
4
Allo
catio
n Fa
ctor
s us
ed w
ithin
the
Gas
Cos
t of S
ervi
ce S
tudy
(A)
(B)
LIN
E
NO
.D
ES
CR
IPTI
ON
OF
ALL
OC
ATI
ON
DA
TAC
OR
PO
RA
TE T
OTA
L1
GR
OU
P PE
AK
DEM
AN
D4,
931,
651
2P
erce
ntag
e1.
0000
0
3 4R
esid
entia
l Cus
tom
ers
5
Gro
up P
eak
Per
cent
age
0.50
453
6
A
nnua
l MC
F Th
roug
hput
13,4
15,2
51
7
P
ropo
rtion
8
Res
iden
tial W
eigh
t for
Gro
up P
eak
Dem
and
9
W
eigh
ted
Pro
porti
on0.
5045
3
10 11C
omm
erci
al S
mal
l Cus
tom
ers:
12
Gro
up P
eak
Per
cent
age
0.27
293
13
A
nnua
l MC
F Th
roug
hput
6,81
0,90
1
14
Pro
porti
on15
C
om. S
mal
l Wei
ght f
or C
oinc
iden
t Pea
k D
eman
d16
Wei
ghte
d P
ropo
rtion
0.27
293
17 18
Com
mer
cial
Med
ium
Cus
tom
ers:
19
Gro
up P
eak
Per
cent
age
0.05
105
20
A
nnua
l MC
F Th
roug
hput
1,82
1,16
6
21
Pro
porti
on22
C
om. M
ediu
m W
eigh
t for
Coi
ncid
ent P
eak
Dem
and
23
W
eigh
ted
Pro
porti
on0.
0510
5
24 25C
omm
erci
al L
arge
Cus
tom
ers:
26
Gro
up P
eak
Per
cent
age
0.10
023
27
A
nnua
l MC
F Th
roug
hput
4,21
7,39
7
28
Pro
porti
on29
C
om. L
arge
Wei
ght f
or C
oinc
iden
t Pea
k D
eman
d30
Wei
ghte
d P
ropo
rtion
0.10
023
31 32
Sup
er L
arge
Cus
tom
ers:
33
Gro
up P
eak
Per
cent
age
0.07
126
34
A
nnua
l MC
F Th
roug
hput
3,74
0,60
8
35
Pro
porti
on36
S
uper
Lar
ge W
eigh
t for
Coi
ncid
ent P
eak
Dem
and
37
W
eigh
ted
Pro
porti
on0.
0712
6
38 39To
tal W
eigh
ted
Pea
k D
eman
d A
lloca
tor
1.00
000
40 41 42
SALE
S / C
OM
MO
DIT
Y14
,631
,152
43
Per
cent
age
1.00
000
44 45 46
MC
F TH
RO
UG
HPU
T30
,005
,323
47
Per
cent
age
1.00
000
48 49 50
THR
OU
GH
PUT
- RES
IDEN
TIA
L13
,391
,092
51
Per
cent
age
1.00
000
52 53 54
THR
OU
GH
PUT
- SM
ALL
GS
& M
F6,
711,
349
55P
erce
ntag
e1.
0000
0
56 57 58TH
RO
UG
HPU
T - L
AR
GE
MF
123,
711
59
Per
cent
age
1.00
000
60 61 62
STO
RA
GE
CA
PAC
ITY
7,01
2,16
7
63
Per
cent
age
1.00
000
64 65
Gro
up P
eak
- 50%
0.50
000
66
Sto
rage
Cap
acity
- 50
%0.
5000
0
67
Sto
rage
Cap
acity
Allo
cato
r - 5
0/50
1.00
000
68 69 70
CU
STO
MER
S - T
OTA
L A
NN
UA
L1,
994,
276
71P
erce
ntag
e1.
0000
0
(C)
(D)
(E)
(F)
(G)
(H)
(I)(J
)(K
)(L
)(M
)(N
)
Cus
tom
er C
hoic
e -
Res
iden
tial
Cus
tom
er C
hoic
e -
Sm
all G
SC
usto
mer
Cho
ice
- La
rge
GS
Cus
tom
er C
hoic
e -
Mul
ti-Fa
mily
IC
usto
mer
Cho
ice
- M
ulti-
Fam
ily II
Cus
tom
er C
hoic
e -
Mul
ti-Fa
mily
III
Cus
tom
er C
hoic
e -
Mul
ti-Fa
mily
IVA
gg T
rans
port
- R
esid
entia
lA
gg T
rans
port
- S
mal
l GS
Agg
Tra
nspo
rt -
Larg
e G
SS
peci
al C
ontra
ctS
OU
RC
E o
r ALL
OC
ATI
ON
FA
CTO
R43
0,19
6
378,
343
-
59
3
1,94
9
-
8,
025
1,25
0
34
5,98
8
6,48
7
29
6
0.08
723
0.
0767
2
-
0.00
012
0.
0004
0
-
0.00
163
0.
0002
5
0.07
016
0.
0013
2
0.00
006
G
roup
Dem
and
0.08
723
0.
0001
2
0.00
025
Li
ne 2
2,38
7,41
8
2,
984
6,10
5
Li
ne 4
60.
1779
6
0.00
022
0.
0004
6
0.50
453
0.
5045
3
0.50
453
Li
ne 5
, Cor
pora
te T
otal
0.08
979
0.
0001
1
0.00
023
0.07
672
0.
0004
0
-
0.00
163
0.
0701
6
Line
22,
056,
576
10,3
93
-
46,6
46
1,39
1,12
8
Li
ne 4
60.
3019
5
0.00
153
-
0.
0068
5
0.20
425
0.
2729
3
0.27
293
0.
2729
3
0.27
293
0.
2729
3
Line
12,
Cor
pora
te T
otal
0.08
241
0.
0004
2
-
0.00
187
0.
0557
5
Line
2Li
ne 4
6
Line
19,
Cor
pora
te T
otal
-
0.00
132
0.
0000
6
Line
2-
27
,766
32
6
Line
46
-
0.00
658
0.
0000
8
0.10
023
0.
1002
3
0.10
023
Li
ne 2
6, C
orpo
rate
Tot
al-
0.
0006
6
0.00
001
Line
2Li
ne 4
6
Line
33,
Cor
pora
te T
otal
0.08
979
0.
0824
1
-
0.00
011
0.
0004
2
-
0.00
187
0.
0002
3
0.05
575
0.
0006
6
0.00
001
W
eigh
ted
Peak
Dem
and
-
-
-
-
-
-
-
-
-
-
326
-
-
-
-
-
-
-
-
-
-
0.
0000
2
Sale
s
2,38
7,41
8
2,
056,
576
-
2,98
4
10
,393
-
46
,646
6,
105
1,39
1,12
8
27
,766
32
6
0.07
957
0.
0685
4
-
0.00
010
0.
0003
5
-
0.00
155
0.
0002
0
0.04
636
0.
0009
3
0.00
001
M
CF
Thro
ughp
ut
2,38
7,41
8
-
-
-
-
-
-
6,
105
-
-
-
0.17
828
-
-
-
-
-
-
0.
0004
6
-
-
-
Thru
-put
- R
esid
entia
l
-
2,05
6,57
6
-
2,
984
10,3
93
-
-
-
1,39
1,12
8
-
-
-
0.
3064
3
-
0.00
044
0.
0015
5
-
-
-
0.20
728
-
-
Th
ru-p
ut -
Smal
l GS
& M
F
-
-
-
-
-
-
46,6
46
-
-
-
-
-
-
-
-
-
-
0.37
706
-
-
-
-
Th
ru-p
ut -
Larg
e M
F
759,
405
65
4,16
9
-
949
3,
306
-
14,8
37
1,94
2
44
2,49
9
8,83
2
10
4
0.10
830
0.
0932
9
-
0.00
014
0.
0004
7
-
0.00
212
0.
0002
8
0.06
310
0.
0012
6
0.00
001
0.04
362
0.
0383
6
-
0.00
006
0.
0002
0
-
0.00
081
0.
0001
3
0.03
508
0.
0006
6
0.00
003
0.
0541
50.
0466
5-
0.
0000
70.
0002
4-
0.
0010
6
0.00
014
0.03
155
0.00
063
0.00
001
0.09
776
0.
0850
0
-
0.00
013
0.
0004
3
-
0.00
187
0.
0002
7
0.06
663
0.
0012
9
0.00
004
St
orag
e
327,
805
60
,264
-
46
8
636
-
13
2
408
5,
976
36
12
0.16
437
0.
0302
2
-
0.00
023
0.
0003
2
-
0.00
007
0.
0002
0
0.00
300
0.
0000
2
0.00
001
C
usto
mer
Case No. U-17273 Witness: J.C. Hoffman Malueg
Exhibit A-6 (JCHM-1) Schedule F1.5
Page 2 of 4

Mic
higa
n P
ublic
Ser
vice
Com
mis
sion
Mic
higa
n G
as U
tiliti
es C
orpo
ratio
nP
roje
cted
Cos
t of S
ervi
ce A
lloca
tion
Stu
dyP
roje
cted
Tes
t Yea
r End
ing
Dec
embe
r 31,
201
4
Allo
catio
n Fa
ctor
s us
ed w
ithin
the
Gas
Cos
t of S
ervi
ce S
tudy
(A)
(B)
(C)
(D)
(E)
(F)
(G)
(H)
(I)(J
)(K
)(L
)(M
)
LIN
E
NO
.D
ES
CR
IPTI
ON
OF
ALL
OC
ATI
ON
DA
TAC
OR
PO
RA
TE T
OTA
LR
esid
entia
lM
ulti-
Fam
ily -
Cla
ss I
Mul
ti-Fa
mily
- C
lass
IIM
ulti-
Fam
ily -
Cla
ss
IIIM
ulti-
Fam
ily -
Cla
ss
IVS
mal
l Gen
eral
S
ervi
ceLa
rge
Gen
eral
S
ervi
ceTr
ansp
ort -
TR
-1Tr
ansp
ort -
TR
-2Tr
ansp
ort -
TR
-3S
OU
RC
E o
r ALL
OC
ATI
ON
FA
CTO
R
1SE
RVI
CES
2C
usto
mer
s - A
vera
ge16
6,19
0
125,
081
12
5
207
17
11
7,
597
17
11
2
39
7
Pag
e 1,
line
70
divi
ded
by 1
23
Wei
ghtin
g Fa
ctor
- A
ve. C
ost p
er F
oot f
or S
ervi
ces
1.00
1.00
0.94
0.94
0.94
0.94
0.94
1.27
1.27
1.27
4W
eigh
ted
Cou
nt fo
r Ser
vice
s - A
cct 3
8016
5,47
4
125,
081
12
5
196
16
10
7,
168
16
14
2
50
9
5P
erce
ntag
e1.
0000
0
0.75
589
0.
0007
5
0.00
118
0.
0001
0
0.00
006
0.
0433
2
0.00
009
0.
0008
6
0.00
030
0.
0000
5
Serv
ices
6 7 8M
ETER
S9
Cus
tom
ers
- Ave
rage
166,
190
12
5,08
1
125
20
7
17
11
7,59
7
17
112
39
7
P
age
1, li
ne 7
0 di
vide
d by
12
10 W
eigh
ting
Fact
or -
Cos
t Per
Met
er25
7.65
$
16
7.51
$
76
1.85
$
2,
657.
54$
1,
388.
40$
1,
670.
45$
1,
706.
58$
2,
256.
88$
2,
241.
74$
1,
754.
43$
11
Est
imat
ed C
ost o
f Met
ers
- Acc
t 381
59,6
17,5
75$
32,2
26,7
92$
20,8
69$
158,
021
$
44
,957
$
14
,925
$
12
,689
,852
$
28
,301
$
25
2,77
1$
87,4
28$
12,2
81$
12P
erce
ntag
e1.
0000
0
0.54
056
0.
0003
5
0.00
265
0.
0007
5
0.00
025
0.
2128
5
0.00
047
0.
0042
4
0.00
147
0.
0002
1
Met
ers
13 14 15TR
AN
SPO
RT
CU
STO
MER
S - T
OTA
L A
NN
UA
L8,
316
-
-
-
-
-
-
-
1,34
4
46
8
84
P
age
1, li
ne 7
016
Per
cent
age
1.00
000
-
-
-
-
-
-
-
0.
1616
2
0.05
628
0.
0101
0
Tran
spor
t Cus
t17 18 19
AC
CO
UN
T 38
5 D
EMA
ND
20W
eigh
ted
Dem
and
Allo
catio
n P
erce
ntag
e fo
r Acc
t 385
21
Indu
stria
l Siz
e C
usto
mer
s:0.
2225
4
-
-
-
-
-
-
0.00
727
0.
0510
5
0.09
229
0.
0712
6
Pag
e 1,
Lin
e 39
22
Per
cent
age
1.00
000
-
-
-
-
-
-
0.
0326
7
0.22
939
0.
4147
2
0.32
022
A
cct 3
85 D
eman
d23 24 25
SALA
RIE
S &
WA
GES
- FU
NC
TIO
NA
L:26
P
rodu
ctio
n55
9,52
2
5.28
05%
7.73
31%
27
Dis
tribu
tion
6,35
0,64
1
59
.934
2%87
.771
5%28
Tr
ansm
issi
on12
0,84
8
1.14
05%
1.67
02%
29
Sto
rage
204,
416
1.
9292
%2.
8252
%30
C
usto
mer
Acc
ount
ing
3,05
8,08
3
28
.860
7%-
31
C
usto
mer
Ser
vice
302,
516
2.
8550
%-
32
C
usto
mer
Sal
es-
0.00
00%
-
33TO
TAL
SA
LAR
IES
& W
AG
ES
10,5
96,0
26
100.
000%
100.
000%
34 35 36SA
LAR
IES
& W
AG
ES -
RA
TE S
CH
EDU
LE:
37
Pro
duct
ion
559,
522
23
1,41
9
446
2,
490
704
1,
024
69,9
11
4,06
8
28
,563
51
,639
39
,873
W
eigh
ted
Pea
k D
eman
d38
D
istri
butio
n6,
350,
641
2,62
6,63
8
5,
057
28,2
62
7,98
6
11
,626
79
3,50
0
46,1
73
324,
190
58
6,11
3
452,
567
W
eigh
ted
Pea
k D
eman
d39
Tr
ansm
issi
on12
0,84
8
49,9
83
96
53
8
152
22
1
15,1
00
879
6,
169
11,1
53
8,61
2
W
eigh
ted
Pea
k D
eman
d40
S
tora
ge20
4,41
6
93,5
29
171
89
2
247
37
7
26,4
89
2,56
1
6,
889
11,9
17
9,54
1
S
tora
ge41
C
usto
mer
Acc
ount
ing
3,05
8,08
3
2,
301,
630
2,29
2
3,
817
311
19
8
139,
787
30
5
2,06
1
71
8
129
C
usto
mer
42
Cus
tom
er S
ervi
ce30
2,51
6
227,
685
22
7
378
31
20
13
,828
30
204
71
13
C
usto
mer
43
Cus
tom
er S
ales
-
-
-
-
-
-
-
-
-
-
-
C
usto
mer
44TO
TAL
SA
LAR
IES
& W
AG
ES
10,5
96,0
26
5,53
0,88
4
8,
289
36,3
76
9,43
1
13
,466
1,
058,
616
54,0
15
368,
075
66
1,61
1
510,
735
45
P
erce
ntag
e1.
0000
0
0.52
198
0.
0007
8
0.00
343
0.
0008
9
0.00
127
0.
0999
1
0.00
510
0.
0347
4
0.06
244
0.
0482
0
Sala
ries
& W
ages
Case No. U-17273 Witness: J.C. Hoffman Malueg
Exhibit A-6 (JCHM-1) Schedule F1.5
Page 3 of 4

Mic
higa
n P
ublic
Ser
vice
Com
mis
sion
Mic
higa
n G
as U
tiliti
es C
orpo
ratio
nP
roje
cted
Cos
t of S
ervi
ce A
lloca
tion
Stu
dyP
roje
cted
Tes
t Yea
r End
ing
Dec
embe
r 31,
201
4
Allo
catio
n Fa
ctor
s us
ed w
ithin
the
Gas
Cos
t of S
ervi
ce S
tudy
(A)
(B)
LIN
E
NO
.D
ES
CR
IPTI
ON
OF
ALL
OC
ATI
ON
DA
TAC
OR
PO
RA
TE T
OTA
L
1SE
RVI
CES
2C
usto
mer
s - A
vera
ge16
6,19
0
3 W
eigh
ting
Fact
or -
Ave
. Cos
t per
Foo
t for
Ser
vice
s4
Wei
ghte
d C
ount
for S
ervi
ces
- Acc
t 380
165,
474
5
Per
cent
age
1.00
000
6 7 8
MET
ERS
9C
usto
mer
s - A
vera
ge16
6,19
0
10 W
eigh
ting
Fact
or -
Cos
t Per
Met
er11
Est
imat
ed C
ost o
f Met
ers
- Acc
t 381
59,6
17,5
75$
12P
erce
ntag
e1.
0000
0
13 14 15TR
AN
SPO
RT
CU
STO
MER
S - T
OTA
L A
NN
UA
L8,
316
16P
erce
ntag
e1.
0000
0
17 18 19A
CC
OU
NT
385
DEM
AN
D20
Wei
ghte
d D
eman
d A
lloca
tion
Per
cent
age
for A
cct 3
8521
In
dust
rial S
ize
Cus
tom
ers:
0.22
254
22
P
erce
ntag
e1.
0000
0
23 24 25SA
LAR
IES
& W
AG
ES -
FUN
CTI
ON
AL:
26
Pro
duct
ion
559,
522
27
D
istri
butio
n6,
350,
641
28
Tran
smis
sion
120,
848
29
S
tora
ge20
4,41
6
30
Cus
tom
er A
ccou
ntin
g3,
058,
083
31
Cus
tom
er S
ervi
ce30
2,51
6
32
Cus
tom
er S
ales
-
33
TOTA
L S
ALA
RIE
S &
WA
GE
S10
,596
,026
34 35 36
SALA
RIE
S &
WA
GES
- R
ATE
SC
HED
ULE
:37
P
rodu
ctio
n55
9,52
2
38
Dis
tribu
tion
6,35
0,64
1
39
Tr
ansm
issi
on12
0,84
8
40
Sto
rage
204,
416
41
C
usto
mer
Acc
ount
ing
3,05
8,08
3
42
C
usto
mer
Ser
vice
302,
516
43
C
usto
mer
Sal
es-
44TO
TAL
SA
LAR
IES
& W
AG
ES
10,5
96,0
26
45
Per
cent
age
1.00
000
(C)
(D)
(E)
(F)
(G)
(H)
(I)(J
)(K
)(L
)(M
)(N
)
Cus
tom
er C
hoic
e -
Res
iden
tial
Cus
tom
er C
hoic
e -
Sm
all G
SC
usto
mer
Cho
ice
- La
rge
GS
Cus
tom
er C
hoic
e -
Mul
ti-Fa
mily
IC
usto
mer
Cho
ice
- M
ulti-
Fam
ily II
Cus
tom
er C
hoic
e -
Mul
ti-Fa
mily
III
Cus
tom
er C
hoic
e -
Mul
ti-Fa
mily
IVA
gg T
rans
port
- R
esid
entia
lA
gg T
rans
port
- S
mal
l GS
Agg
Tra
nspo
rt -
Larg
e G
SS
peci
al C
ontra
ctS
OU
RC
E o
r ALL
OC
ATI
ON
FA
CTO
R
27,3
17
5,02
2
-
39
53
-
11
34
49
8
3
1
Pag
e 2,
line
70
divi
ded
by 1
21.
000.
940.
941.
000.
940.
940.
941.
000.
940.
940.
9427
,317
4,
739
-
39
50
-
10
34
470
3
1
0.
1650
8
0.02
864
-
0.
0002
4
0.00
030
-
0.
0000
6
0.00
021
0.
0028
4
0.00
002
0.
0000
1
Serv
ices
27,3
17
5,02
2
-
39
53
-
11
34
49
8
3
1
Pag
e 2,
line
70
divi
ded
by 1
219
7.09
$
1,
603.
84$
-
$
98
.09
$
422.
25$
3,53
6.50
$
1,28
5.00
$
208.
49$
1,18
5.09
$
1,34
7.00
$
1,45
3.00
$
5,38
3,79
3$
8,
054,
486
$
-$
3,82
5$
22
,379
$
-
$
14
,135
$
7,
089
$
590,
175
$
4,
041
$
1,45
3$
0.
0903
1
0.13
510
-
0.
0000
6
0.00
038
-
0.
0002
4
0.00
012
0.
0099
0
0.00
007
0.
0000
2
Met
ers
408
5,
976
36
P
age
2, li
ne 7
0-
-
-
-
-
-
-
0.
0490
6
0.71
861
0.
0043
3
-
Tran
spor
t Cus
t
-
-
-
-
-
-
-
-
-
0.00
066
0.
0000
1
Pag
e 2,
Lin
e 39
-
-
-
-
-
-
-
-
-
0.00
297
0.
0000
3
Acc
t 385
Dem
and
50,2
38
46,1
12
-
63
23
3
-
1,04
6
12
8
31,1
91
369
4
Wei
ghte
d P
eak
Dem
and
570,
206
52
3,37
2
-
713
2,
645
-
11,8
71
1,45
8
35
4,02
4
4,19
1
49
Wei
ghte
d P
eak
Dem
and
10,8
51
9,95
9
-
14
50
-
22
6
28
6,
737
80
1
Wei
ghte
d P
eak
Dem
and
19,9
85
17,3
76
-
26
89
-
383
54
13,6
20
263
8
Sto
rage
502,
666
92
,411
-
71
8
975
-
20
2
626
9,
164
55
18
Cus
tom
er49
,725
9,
142
-
71
96
-
20
62
907
5
2
C
usto
mer
-
-
-
-
-
-
-
-
-
-
-
Cus
tom
er1,
203,
671
698,
371
-
1,
604
4,08
9
-
13
,748
2,
356
415,
643
4,
963
82
0.
1136
0
0.06
591
-
0.
0001
5
0.00
039
-
0.
0013
0
0.00
022
0.
0392
3
0.00
047
0.
0000
1
Sala
ries
& W
ages
Case No. U-17273 Witness: J.C. Hoffman Malueg
Exhibit A-6 (JCHM-1) Schedule F1.5
Page 4 of 4

Mic
higa
n P
ublic
Ser
vice
Com
mis
sion
Mic
higa
n G
as U
tiliti
es C
orpo
ratio
nP
roje
cted
Cos
t of S
ervi
ce A
lloca
tion
Stu
dyA
ccou
nt 3
80:
Ave
rage
Cos
t per
Ser
vice
Lin
e pe
r Foo
tP
roje
cted
Tes
t Yea
r End
ing
Dec
embe
r 31,
201
4
[A]
[B]
[C]
[D]
[E]
Line
No.
ME
TER
SIZ
ETo
tal
Rat
e C
lass
Rat
e S
ched
ule
125
0 M
eter
Siz
e A
ve. C
ost
$11.
871.
00
Wei
ghtin
g Fa
ctor
= R
esid
entia
l, M
ulti-
Fam
ily I
2 360
0 M
eter
Siz
e A
ve. C
ost
$11.
200.
94
Wei
ghtin
g Fa
ctor
= S
mal
l GS
, Lar
ge G
S, M
ulti-
Fam
ily II
, III,
IV4 5
1000
Met
er A
ve. C
ost
$15.
081.
27
Wei
ghtin
g Fa
ctor
= TR
-1, T
R-2
6 75M
Ave
Cos
t$1
5.08
1.27
W
eigh
ting
Fact
or=
TR-3
8 9 10N
OTE
: Th
is d
ata
is b
ased
upo
n th
e hi
stor
ical
per
iod
endi
ng D
ecem
ber 3
1, 2
012
11
Case No. U-17273 Witness: J.C. Hoffman Malueg
Exhibit A-6 (JCHM-1) Schedule F1.6
Page 1 of 1

Michigan Public Service CommissionMichigan Gas Utilities CorporationProjected Cost of Service Allocation StudyAccount 381: Average Cost Per MeterProjected Test Year Ending December 31, 2014
[A] [B] [C] [D] [E] [F]
Line No. YEAR ACCT RATE SCHEDULEMeter & Device
Replacement Cost Meter CountCOST PER
METER
1 2012 381 Residential $32,342,562 125,530 257.65$ 23 Transp. Agg - Residential $8,131 39 208.49$ 45 Customer Choice-Residential $4,918,853 24,958 197.09$ 67 Multi Family - I $18,929 113 167.51$ 89 Multi Family - II $155,418 204 761.85$ 1011 Multi Family - III $34,548 13 2,657.54$ 1213 Multi Family - IV $13,884 10 1,388.40$ 1415 GS - Small $13,483,873 8,072 1,670.45$ 1617 GS - Large $32,425 19 1,706.58$ 1819 TR-1 $232,459 103 2,256.88$ 2021 TR-2 $87,428 39 2,241.74$ 2223 TR-3 $12,281 7 1,754.43$ 2425 Guardian Glass $1,453 1 1,453.00$ 2627 Transp.Agg - GS-Small $603,211 509 1,185.09$ 2829 Customer Choice-GS Small $7,496,350 4,674 1,603.84$ 3031 Transp. Agg - GS-Large $4,041 3 1,347.00$ 3233 Customer Choice - Multi Family - I $2,256 23 98.09$ 3435 Customer Choice - Multi Family - II $5,067 12 422.25$ 3637 Customer Choice - Multi Family - III $14,146 4 3,536.50$ 3839 Customer Choice - Multi Family - IV $3,855 3 1,285.00$ 4041 NOTE: This data is based upon the historical period ending December 31, 2012
Case No. U-17273 Witness: J.C. Hoffman Malueg
Exhibit A-6 (JCHM-1) Schedule F1.7
Page 1 of 1

Mic
higa
n P
ublic
Ser
vice
Com
mis
sion
Mic
higa
n G
as U
tiliti
es C
orpo
ratio
nP
roje
cted
Cos
t of S
ervi
ce A
lloca
tion
Stu
dyP
roje
cted
Tes
t Yea
r End
ing
Dec
embe
r 31,
201
4
CLA
SS
IFIC
ATI
ON
OF
PLA
NT
IN S
ER
VIC
E -
13
MO
NTH
AV
G. A
ND
G/C
ALL
OC
ATE
D(A
)(B
)(C
)(D
)(E
)(F
)(G
)(H
)(I)
(J)
GA
S S
UP
PLY
EN
HA
NC
ED
LIN
EA
CC
T.C
OR
PO
RA
TEP
UR
CH
AS
ED
AC
QU
ISIT
ION
PR
OD
UC
TIO
NS
TOR
AG
ED
ISTR
IBU
TIO
NO
THE
RN
O.
DE
SC
RIP
TIO
N N
O.
TOTA
LG
AS
CO
ST
CO
ST
DE
MA
ND
CO
ST
DE
MA
ND
CU
STO
ME
RS
ER
VIC
ES
1P
RO
DU
CTI
ON
2P
rodu
ctio
n &
Gat
herin
g P
lant
325-
337
2,36
5,43
00
02,
365,
430
00
00
3U
nder
grou
nd S
tora
ge P
lant
350-
357
17,2
11,7
460
00
17,2
11,7
460
00
4TO
TAL
PR
OD
UC
TIO
N P
LT A
CC
T19
,577
,176
00
2,36
5,43
017
,211
,746
00
05 6
TRA
NS
MIS
SIO
N7
M
AIN
S36
740
,739
,167
00
00
17,1
52,5
0223
,586
,665
08
O
THE
R T
RA
NS
MIS
SIO
N E
XP
EN
SE
365,
366
, 369
13,6
00,9
300
00
013
,600
,930
00
9TO
TAL
TRA
NS
MIS
SIO
N54
,340
,097
00
00
30,7
53,4
3223
,586
,665
010 11
DIS
TRIB
UTI
ON
-GE
NE
RA
L R
ELA
TED
12In
tang
ible
302/
303
26,5
570
00
026
,557
00
13La
nd a
nd L
and
Rig
hts
374
28,6
460
00
028
,646
00
14S
truct
ures
and
Impr
ovem
ents
375
30,0
140
00
030
,014
00
15M
ains
376
11,1
87,3
670
00
05,
130,
233
6,05
7,13
30
16C
ompr
esso
r Sta
tion
Equ
ipm
ent
377
00
00
00
00
17M
easu
ring
& R
egul
atio
n E
quip
men
t - G
ener
al37
848
5,96
70
00
048
5,96
70
018
Mea
surin
g &
Reg
ulat
ion
Equ
ipm
ent -
Gat
e S
tatio
n37
95,
609
00
00
5,60
90
019
Ser
vice
s38
06,
694,
065
00
00
06,
694,
065
020
Met
ers
381
3,28
4,08
30
00
00
3,28
4,08
30
21M
eter
Con
nect
ions
& In
stal
latio
ns38
20
00
00
00
022
Hou
se R
egul
ator
s38
31,
370,
955
00
00
01,
370,
955
023
Indu
stria
l Met
erin
g &
Reg
ulat
ing
Sta
tion
Equ
ip.
385
51,7
910
00
051
,791
00
24TO
TAL
DIS
TRIB
UTI
ON
-GE
NE
RA
L R
ELA
TED
23,1
65,0
530
00
05,
758,
817
17,4
06,2
360
25 26D
ISTR
IBU
TIO
N-D
IRE
CT
PLA
NT
AC
CT
27In
tang
ible
302/
303
293,
889
00
00
293,
889
00
28La
nd a
nd L
and
Rig
hts
374
317,
007
00
00
317,
007
00
29S
truct
ures
and
Impr
ovem
ents
375
332,
145
00
00
332,
145
00
30M
ains
376
123,
804,
592
00
00
56,7
73,5
4267
,031
,050
031
Com
pres
sor S
tatio
n E
quip
men
t37
70
00
00
00
032
Mea
surin
g &
Reg
ulat
ion
Equ
ipm
ent -
Gen
eral
378
5,37
7,94
10
00
05,
377,
941
00
33M
easu
ring
& R
egul
atio
n E
quip
men
t - G
ate
Sta
tion
379
62,0
760
00
062
,076
00
34S
ervi
ces
380
74,0
79,6
310
00
00
74,0
79,6
310
35M
eter
s38
136
,343
,183
00
00
036
,343
,183
036
Met
er C
onne
ctio
ns &
Inst
alla
tions
382
00
00
00
00
37H
ouse
Reg
ulat
ors
383
15,1
71,6
290
00
00
15,1
71,6
290
38In
dust
rial M
eter
ing
& R
egul
atin
g S
tatio
n E
quip
.38
557
3,13
90
00
057
3,13
90
039
TOTA
L D
ISTR
IBU
TIO
N P
LT A
CC
T25
6,35
5,23
20
00
063
,729
,739
192,
625,
493
040
TOTA
L D
ISTR
IBU
TIO
N F
UN
CTI
ON
279,
520,
285
00
00
69,4
88,5
5621
0,03
1,72
90
41 42C
US
TOM
ER
- A
LLO
CA
BLE
00
00
00
00
43 44TO
TAL
PLA
NT
IN S
ER
VIC
E35
3,43
7,55
80
02,
365,
430
17,2
11,7
4610
0,24
1,98
723
3,61
8,39
50
4510
0.00
%30
.03%
69.9
7%
CO
MM
OD
ITY
DE
MA
ND
CU
STO
ME
R
May
not
cro
ss-c
heck
due
to R
ound
ing
Case No. U-17273 Witness: J.C. Hoffman Malueg
Exhibit A-6 (JCHM-1) Schedule F1.8
Page 1 of 5

Mic
higa
n P
ublic
Ser
vice
Com
mis
sion
Mic
higa
n G
as U
tiliti
es C
orpo
ratio
nP
roje
cted
Cos
t of S
ervi
ce A
lloca
tion
Stu
dyP
roje
cted
Tes
t Yea
r End
ing
Dec
embe
r 31,
201
4
CLA
SS
IFIC
ATI
ON
OF
DE
PR
EC
IATI
ON
RE
SE
RV
E S
/L -
13 M
ON
TH A
VG
. AN
D G
/C A
LLO
CA
TED
(A)
(B)
(C)
(D)
(E)
(F)
(G)
(H)
(I)(J
)
GA
S S
UP
PLY
EN
HA
NC
ED
LIN
EA
CC
T.C
OR
PO
RA
TEP
UR
CH
AS
ED
AC
QU
ISIT
ION
PR
OD
UC
TIO
NS
TOR
AG
ED
ISTR
IBU
TIO
NO
THE
RN
O.
DE
SC
RIP
TIO
N N
O.
TOTA
LG
AS
CO
ST
CO
ST
DE
MA
ND
CO
ST
DE
MA
ND
CU
STO
ME
RS
ER
VIC
ES
1P
RO
DU
CTI
ON
2P
rodu
ctio
n &
Gat
herin
g P
lant
325-
337
(1,2
65,7
21)
00
(1,2
65,7
21)
00
00
3U
nder
grou
nd S
tora
ge P
lant
350-
357
(8,1
89,8
80)
00
0(8
,189
,880
)0
00
4TO
TAL
PR
OD
UC
TIO
N P
LT A
CC
T(9
,455
,601
)0
0(1
,265
,721
)(8
,189
,880
)0
00
5 6TR
AN
SM
ISS
ION
7
MA
INS
367
(22,
804,
061)
00
00
(9,6
01,2
45)
(13,
202,
817)
08
O
THE
R T
RA
NS
MIS
SIO
N E
XP
EN
SE
365,
366
, 369
(6,0
35,4
17)
00
00
(6,0
35,4
17)
00
9TO
TAL
TRA
NS
MIS
SIO
N(2
8,83
9,47
8)0
00
0(1
5,63
6,66
1)(1
3,20
2,81
7)0
7 8D
ISTR
IBU
TIO
N-G
EN
ER
AL
RE
LATE
D9
Inta
ngib
le30
2/30
3(2
3,55
1)0
00
0(2
3,55
1)0
010
Land
and
Lan
d R
ight
s37
4(2
,660
)0
00
0(2
,660
)0
011
Stru
ctur
es a
nd Im
prov
emen
ts37
5(1
8,29
9)0
00
0(1
8,29
9)0
012
Mai
ns37
6(5
,896
,867
)0
00
0(2
,704
,149
)(3
,192
,719
)0
13C
ompr
esso
r Sta
tion
Equ
ipm
ent
377
00
00
00
00
14M
easu
ring
& R
egul
atio
n E
quip
men
t - G
ener
al37
8(2
74,6
40)
00
00
(274
,640
)0
015
Mea
surin
g &
Reg
ulat
ion
Equ
ipm
ent -
Gat
e S
tatio
n37
925
70
00
025
70
016
Ser
vice
s38
0(3
,403
,348
)0
00
00
(3,4
03,3
48)
017
Met
ers
381
(1,3
53,7
51)
00
00
0(1
,353
,751
)0
18M
eter
Con
nect
ions
& In
stal
latio
ns38
20
00
00
00
019
Hou
se R
egul
ator
s38
3(4
91,4
55)
00
00
0(4
91,4
55)
020
Indu
stria
l Met
erin
g &
Reg
ulat
ing
Sta
tion
Equ
ip.
385
(28,
429)
00
00
(28,
429)
00
21TO
TAL
DIS
TRIB
UTI
ON
-GE
NE
RA
L R
ELA
TED
(11,
492,
741)
00
00
(3,0
51,4
69)
(8,4
41,2
72)
022 23
DIS
TRIB
UTI
ON
-DIR
EC
T P
LAN
T A
CC
T24
Inta
ngib
le30
2/30
3(2
85,4
30)
00
00
(285
,430
)0
025
Land
and
Lan
d R
ight
s37
4(3
2,23
5)0
00
0(3
2,23
5)0
026
Stru
ctur
es a
nd Im
prov
emen
ts37
5(2
21,7
76)
00
00
(221
,776
)0
027
Mai
ns37
6(7
1,46
9,19
1)0
00
0(3
2,77
3,89
8)(3
8,69
5,29
3)0
28C
ompr
esso
r Sta
tion
Equ
ipm
ent
377
00
00
00
00
29M
easu
ring
& R
egul
atio
n E
quip
men
t - G
ener
al37
8(3
,328
,600
)0
00
0(3
,328
,600
)0
030
Mea
surin
g &
Reg
ulat
ion
Equ
ipm
ent -
Gat
e S
tatio
n37
93,
117
00
00
3,11
70
031
Ser
vice
s38
0(4
1,24
8,08
6)0
00
00
(41,
248,
086)
032
Met
ers
381
(16,
407,
264)
00
00
0(1
6,40
7,26
4)0
33M
eter
Con
nect
ions
& In
stal
latio
ns38
20
00
00
00
034
Hou
se R
egul
ator
s38
3(5
,956
,364
)0
00
00
(5,9
56,3
64)
035
Indu
stria
l Met
erin
g &
Reg
ulat
ing
Sta
tion
Equ
ip.
385
(344
,550
)0
00
0(3
44,5
50)
00
36TO
TAL
DIS
TRIB
UTI
ON
PLT
AC
CT
(139
,290
,379
)0
00
0(3
6,98
3,37
2)(1
02,3
07,0
07)
037
TOTA
L D
ISTR
IBU
TIO
N F
UN
CTI
ON
(150
,783
,120
)0
00
0(4
0,03
4,84
2)(1
10,7
48,2
78)
038 39
CU
STO
ME
R -
ALL
OC
AB
LE0
00
00
00
040 41
TOTA
L D
EP
RE
CIA
TIO
N R
ES
ER
VE
- S
TRA
IGH
T LI
NE
(189
,078
,199
)0
0(1
,265
,721
)(8
,189
,880
)(5
5,67
1,50
3)(1
23,9
51,0
95)
0
CO
MM
OD
ITY
DE
MA
ND
CU
STO
ME
R
May
not
cro
ss-c
heck
due
to R
ound
ing
Case No. U-17273 Witness: J.C. Hoffman Malueg
Exhibit A-6 (JCHM-1) Schedule F1.8
Page 2 of 5

Mic
higa
n P
ublic
Ser
vice
Com
mis
sion
Mic
higa
n G
as U
tiliti
es C
orpo
ratio
nP
roje
cted
Cos
t of S
ervi
ce A
lloca
tion
Stu
dyP
roje
cted
Tes
t Yea
r End
ing
Dec
embe
r 31,
201
4
CLA
SS
IFIC
ATI
ON
OF
CO
NS
TRU
CTI
ON
WO
RK
IN P
RO
GR
ES
S(A
)(B
)(C
)(D
)(E
)(F
)(G
)(H
)(I)
(J)
GA
S S
UP
PLY
EN
HA
NC
ED
LIN
EA
CC
T.C
OR
PO
RA
TEP
UR
CH
AS
ED
AC
QU
ISIT
ION
PR
OD
UC
TIO
NS
TOR
AG
ED
ISTR
IBU
TIO
NO
THE
RN
O.
DE
SC
RIP
TIO
N N
O.
TOTA
LG
AS
CO
ST
CO
ST
DE
MA
ND
CO
ST
DE
MA
ND
CU
STO
ME
RS
ER
VIC
ES
1P
RO
DU
CTI
ON
2P
rodu
ctio
n &
Gat
herin
g P
lant
325-
337
00
00
00
00
3U
nder
grou
nd S
tora
ge P
lant
350-
357
00
00
00
00
4TO
TAL
PR
OD
UC
TIO
N P
LT A
CC
T0
00
00
00
05 6
TRA
NS
MIS
SIO
N7
M
AIN
S36
70
00
00
00
08
O
THE
R T
RA
NS
MIS
SIO
N E
XP
EN
SE
365,
366
, 369
00
00
00
00
9TO
TAL
TRA
NS
MIS
SIO
N0
00
00
00
010 11
DIS
TRIB
UTI
ON
-GE
NE
RA
L R
ELA
TED
12In
tang
ible
302/
303
00
00
00
00
13La
nd a
nd L
and
Rig
hts
374
00
00
00
00
14S
truct
ures
and
Impr
ovem
ents
375
00
00
00
00
15M
ains
376
00
00
00
00
16C
ompr
esso
r Sta
tion
Equ
ipm
ent
377
00
00
00
00
17M
easu
ring
& R
egul
atio
n E
quip
men
t - G
ener
al37
80
00
00
00
018
Mea
surin
g &
Reg
ulat
ion
Equ
ipm
ent -
Gat
e S
tatio
n37
90
00
00
00
019
Ser
vice
s38
00
00
00
00
020
Met
ers
381
00
00
00
00
21M
eter
Con
nect
ions
& In
stal
latio
ns38
20
00
00
00
022
Hou
se R
egul
ator
s38
30
00
00
00
023
Indu
stria
l Met
erin
g &
Reg
ulat
ing
Sta
tion
Equ
ip.
385
00
00
00
00
24TO
TAL
DIS
TRIB
UTI
ON
-GE
NE
RA
L R
ELA
TED
00
00
00
00
25 26D
ISTR
IBU
TIO
N-D
IRE
CT
PLA
NT
AC
CT
27In
tang
ible
302/
303
00
00
00
00
28La
nd a
nd L
and
Rig
hts
374
00
00
00
00
29S
truct
ures
and
Impr
ovem
ents
375
00
00
00
00
30M
ains
376
00
00
00
00
31C
ompr
esso
r Sta
tion
Equ
ipm
ent
377
00
00
00
00
32M
easu
ring
& R
egul
atio
n E
quip
men
t - G
ener
al37
80
00
00
00
033
Mea
surin
g &
Reg
ulat
ion
Equ
ipm
ent -
Gat
e S
tatio
n37
90
00
00
00
034
Ser
vice
s38
00
00
00
00
035
Met
ers
381
00
00
00
00
36M
eter
Con
nect
ions
& In
stal
latio
ns38
20
00
00
00
037
Hou
se R
egul
ator
s38
30
00
00
00
038
Indu
stria
l Met
erin
g &
Reg
ulat
ing
Sta
tion
Equ
ip.
385
00
00
00
00
39TO
TAL
DIS
TRIB
UTI
ON
PLT
AC
CT
00
00
00
00
40TO
TAL
DIS
TRIB
UTI
ON
FU
NC
TIO
N0
00
00
00
041 42
CU
STO
ME
R -
ALL
OC
AB
LE0
00
00
00
043 44
TOTA
L C
ON
STR
UC
TIO
N W
OR
K IN
PR
OG
RE
SS
00
00
00
00
CO
MM
OD
ITY
DE
MA
ND
CU
STO
ME
R
May
not
cro
ss-c
heck
due
to R
ound
ing
Case No. U-17273 Witness: J.C. Hoffman Malueg
Exhibit A-6 (JCHM-1) Schedule F1.8
Page 3 of 5

Mic
higa
n P
ublic
Ser
vice
Com
mis
sion
Mic
higa
n G
as U
tiliti
es C
orpo
ratio
nP
roje
cted
Cos
t of S
ervi
ce A
lloca
tion
Stu
dyP
roje
cted
Tes
t Yea
r End
ing
Dec
embe
r 31,
201
4
CLA
SS
IFIC
ATI
ON
OF
DE
PR
EC
IATI
ON
EX
PE
NS
E S
/L -
YE
AR
EN
D T
OTA
L A
ND
G/C
ALL
OC
ATE
D(A
)(B
)(C
)(D
)(E
)(F
)(G
)(H
)(I)
(J)
GA
S S
UP
PLY
EN
HA
NC
ED
LIN
EA
CC
T.C
OR
PO
RA
TEP
UR
CH
AS
ED
AC
QU
ISIT
ION
PR
OD
UC
TIO
NS
TOR
AG
ED
ISTR
IBU
TIO
NO
THE
RN
O.
DE
SC
RIP
TIO
N N
O.
TOTA
LG
AS
CO
ST
CO
ST
DE
MA
ND
CO
ST
DE
MA
ND
CU
STO
ME
RS
ER
VIC
ES
1P
RO
DU
CTI
ON
2P
rodu
ctio
n &
Gat
herin
g P
lant
325-
337
108,
354
00
108,
354
00
00
3U
nder
grou
nd S
tora
ge P
lant
350-
357
379,
665
00
037
9,66
50
00
4TO
TAL
PR
OD
UC
TIO
N P
LT A
CC
T48
8,01
90
010
8,35
437
9,66
50
00
5 6TR
AN
SM
ISS
ION
7
MA
INS
367
457,
534
00
00
192,
636
264,
897
08
O
THE
R T
RA
NS
MIS
SIO
N E
XP
EN
SE
365,
366
, 369
170,
116
00
00
170,
116
00
9TO
TAL
TRA
NS
MIS
SIO
N62
7,65
00
00
036
2,75
326
4,89
70
7 8D
ISTR
IBU
TIO
N-G
EN
ER
AL
RE
LATE
D9
Inta
ngib
le30
2/30
315
00
00
015
00
010
Land
and
Lan
d R
ight
s37
464
30
00
064
30
011
Stru
ctur
es a
nd Im
prov
emen
ts37
551
60
00
051
60
012
Mai
ns37
662
6,12
50
00
028
7,12
533
9,00
10
13C
ompr
esso
r Sta
tion
Equ
ipm
ent
377
00
00
00
00
14M
easu
ring
& R
egul
atio
n E
quip
men
t - G
ener
al37
832
,732
00
00
32,7
320
015
Mea
surin
g &
Reg
ulat
ion
Equ
ipm
ent -
Gat
e S
tatio
n37
935
80
00
035
80
016
Ser
vice
s38
040
1,39
40
00
00
401,
394
017
Met
ers
381
100,
983
00
00
010
0,98
30
18M
eter
Con
nect
ions
& In
stal
latio
ns38
20
00
00
00
019
Hou
se R
egul
ator
s38
363
,986
00
00
063
,986
020
Indu
stria
l Met
erin
g &
Reg
ulat
ing
Sta
tion
Equ
ip.
385
2,70
20
00
02,
702
00
21TO
TAL
DIS
TRIB
UTI
ON
-GE
NE
RA
L R
ELA
TED
1,22
9,59
00
00
032
4,22
690
5,36
40
22 23D
ISTR
IBU
TIO
N-D
IRE
CT
PLA
NT
AC
CT
24In
tang
ible
302/
303
906
00
00
906
00
25La
nd a
nd L
and
Rig
hts
374
3,88
80
00
03,
888
00
26S
truct
ures
and
Impr
ovem
ents
375
3,12
20
00
03,
122
00
27M
ains
376
3,78
5,70
10
00
01,
736,
023
2,04
9,67
80
28C
ompr
esso
r Sta
tion
Equ
ipm
ent
377
00
00
00
00
29M
easu
ring
& R
egul
atio
n E
quip
men
t - G
ener
al37
819
7,90
80
00
019
7,90
80
030
Mea
surin
g &
Reg
ulat
ion
Equ
ipm
ent -
Gat
e S
tatio
n37
92,
166
00
00
2,16
60
031
Ser
vice
s38
02,
426,
924
00
00
02,
426,
924
032
Met
ers
381
610,
566
00
00
061
0,56
60
33M
eter
Con
nect
ions
& In
stal
latio
ns38
20
00
00
00
034
Hou
se R
egul
ator
s38
338
6,87
70
00
00
386,
877
035
Indu
stria
l Met
erin
g &
Reg
ulat
ing
Sta
tion
Equ
ip.
385
16,3
350
00
016
,335
00
36TO
TAL
DIS
TRIB
UTI
ON
PLT
AC
CT
7,43
4,39
20
00
01,
960,
348
5,47
4,04
30
37TO
TAL
DIS
TRIB
UTI
ON
FU
NC
TIO
N8,
663,
982
00
00
2,28
4,57
56,
379,
407
038 39
CU
STO
ME
R -
ALL
OC
AB
LE0
00
00
00
040 41
TOTA
L D
EP
RE
CIA
TIO
N E
XP
EN
SE
9,77
9,65
10
010
8,35
437
9,66
52,
647,
327
6,64
4,30
40
CO
MM
OD
ITY
DE
MA
ND
CU
STO
ME
R
May
not
cro
ss-c
heck
due
to R
ound
ing
Case No. U-17273 Witness: J.C. Hoffman Malueg
Exhibit A-6 (JCHM-1) Schedule F1.8
Page 4 of 5

Mic
higa
n P
ublic
Ser
vice
Com
mis
sion
Mic
higa
n G
as U
tiliti
es C
orpo
ratio
nP
roje
cted
Cos
t of S
ervi
ce A
lloca
tion
Stu
dyP
roje
cted
Tes
t Yea
r End
ing
Dec
embe
r 31,
201
4
CLA
SS
IFIC
ATI
ON
OF
OP
ER
ATI
ON
& M
AIN
TEN
AN
CE
- Y
EA
R E
ND
TO
TAL
(A)
(B)
(C)
(D)
(E)
(F)
(G)
(H)
(I)(J
)
GA
S S
UP
PLY
EN
HA
NC
ED
LIN
EA
CC
T.C
OR
PO
RA
TEP
UR
CH
AS
ED
AC
QU
ISIT
ION
PR
OD
UC
TIO
NS
TOR
AG
ED
ISTR
IBU
TIO
NO
THE
RN
O.
DE
SC
RIP
TIO
N N
O.
TOTA
LG
AS
CO
ST
CO
ST
DE
MA
ND
CO
ST
DE
MA
ND
CU
STO
ME
RS
ER
VIC
ES
1P
RO
DU
CTI
ON
EX
PE
NS
E:
2
MA
NU
FAC
TUR
ED
GA
S P
RO
DU
CTI
ON
710-
742
518,
186
00
518,
186
00
00
3
NA
TUR
AL
GA
S P
RO
DU
CTI
ON
& G
ATH
ER
ING
750-
769
268,
248
00
268,
248
00
00
4
GA
S P
UR
CH
AS
ES
- C
OG
800-
810
71,9
52,9
6471
,952
,964
00
00
00
5
GA
S P
UR
CH
AS
ES
- N
on-C
OG
Rel
ated
8041
11, 8
0412
052
3,43
70
523,
437
00
00
06
G
AS
US
ED
FO
R U
TILI
TY O
PS
- C
OG
812
(268
,248
)(2
68,2
48)
00
00
00
7
OTH
ER
GA
S S
UP
PLI
ES
EX
PE
NS
E81
3(1
3,94
2)0
(13,
942)
00
00
08
SU
BTO
TAL
PR
OD
UC
TIO
N72
,980
,645
71,6
84,7
1650
9,49
578
6,43
40
00
09 10
UN
DE
RG
RO
UN
D S
TOR
AG
E:
814-
842
664,
844
00
066
4,84
40
00
11TO
TAL
PR
OD
UC
TIO
N73
,645
,489
71,6
84,7
1650
9,49
578
6,43
466
4,84
40
00
12 13To
tal G
as S
uppl
y A
cq. &
Dem
and
rela
ted
Pro
duct
ion
O&
M1,
295,
929
509,
495
786,
434
14
Per
cent
age
100.
00%
39.3
2%60
.68%
15 16TR
AN
SM
ISS
ION
EX
PE
NS
E:
17
MA
INS
856,
863
57,8
460
00
024
,355
33,4
910
18
OTH
ER
TR
AN
SM
ISS
ION
EX
PE
NS
E85
0, 8
57, 8
59, 8
65, 8
6728
8,32
80
00
028
8,32
80
019
TOTA
L TR
AN
SM
ISS
ION
346,
174
00
00
312,
683
33,4
910
20
Cla
ssifi
catio
n P
erce
ntag
e of
Tra
nsm
issi
on F
unct
ion
100.
00%
90.3
3%9.
67%
21 22D
ISTR
IBU
TIO
N-D
IRE
CT
PLA
NT
AC
CT
870-
894
23In
tang
ible
302/
303
5,67
20
00
05,
672
00
24La
nd a
nd L
and
Rig
hts
374
6,11
80
00
06,
118
00
25S
truct
ures
and
Impr
ovem
ents
375
6,41
00
00
06,
410
00
26M
ains
376
4,09
8,60
60
00
01,
879,
513
2,21
9,09
30
27C
ompr
esso
r Sta
tion
Equ
ipm
ent
377
00
00
00
00
28M
easu
ring
& R
egul
atio
n E
quip
men
t - G
ener
al37
817
8,12
20
00
017
8,12
20
029
Mea
surin
g &
Reg
ulat
ion
Equ
ipm
ent -
Gat
e S
tatio
n37
913
3,38
60
00
013
3,38
60
030
Ser
vice
s38
02,
242,
146
00
00
02,
242,
146
031
Met
ers
381
2,12
7,85
70
00
00
2,12
7,85
70
32M
eter
Con
nect
ions
& In
stal
lato
ins
382
00
00
00
00
33H
ouse
Reg
ulat
ors
383
888,
284
00
00
088
8,28
40
34In
dust
rial M
eter
ing
& R
egul
atin
g S
tatio
n E
quip
.38
533
,557
00
00
33,5
570
035
TOTA
L D
ISTR
IBU
TIO
N F
UN
CTI
ON
9,72
0,15
60
00
02,
242,
777
7,47
7,37
90
36
Cla
ssifi
catio
n P
erce
ntag
e of
Dis
tribu
tion
Func
tion
100.
00%
23.0
7%76
.93%
37 38C
US
TOM
ER
AC
CO
UN
TS E
XP
EN
SE
S:
39
CU
STO
ME
R -
ALL
OC
AB
LE90
1, 9
02, 9
03, 9
058,
833,
261
00
00
08,
833,
261
040
C
US
TOM
ER
- TR
AN
SP
OR
T A
LLO
CA
BLE
901,
902
, 903
, 905
274,
233
00
00
00
274,
233
41
Unc
olle
ctib
le A
ccou
nts
904
1,91
6,68
40
00
00
1,91
6,68
40
42C
US
TOM
ER
- A
LLO
CA
BLE
907-
910
701,
933
00
00
070
1,93
30
43C
US
TOM
ER
- D
irect
Ass
igna
ble
911-
917
00
00
00
00
44TO
TAL
CU
STO
ME
R11
,726
,111
00
00
011
,451
,878
274,
233
45 46C
lass
ifica
tion
Per
cent
age
of D
istri
butio
n an
d C
usto
mer
Fun
ctio
ns21
,172
,034
2,24
2,77
718
,929
,257
047
E
xclu
ding
Dire
ct A
ssig
ned
100.
00%
10.5
9%89
.41%
0.00
%48 49
AD
MIN
ISTR
ATI
VE
& G
EN
ER
AL
- ALL
OC
AB
LE92
0-93
513
,586
,546
028
2,06
043
5,37
626
2,10
82,
018,
833
10,5
88,1
690
50A
DM
INIS
TRA
TIV
E &
GE
NE
RA
L - T
RA
NS
PO
RT
920-
935
178,
291
00
00
00
178,
291
51TO
TAL
CU
STO
ME
R13
,764
,837
028
2,06
043
5,37
626
2,10
82,
018,
833
10,5
88,1
6917
8,29
152 53
TOTA
L O
PE
RA
TIO
N &
MA
INTE
NA
NC
E E
XP
EN
SE
:10
9,20
2,76
771
,684
,716
791,
555
1,22
1,81
092
6,95
24,
574,
293
29,5
50,9
1745
2,52
4
CO
MM
OD
ITY
DE
MA
ND
CU
STO
ME
R
May
not
cro
ss-c
heck
due
to R
ound
ing
Case No. U-17273 Witness: J.C. Hoffman Malueg
Exhibit A-6 (JCHM-1) Schedule F1.8
Page 5 of 5

Mic
higa
n P
ublic
Ser
vice
Com
mis
sion
Mic
higa
n G
as U
tiliti
es C
orpo
ratio
nP
roje
cted
Cos
t of S
ervi
ce A
lloca
tion
Stu
dyTr
ansl
atio
n of
Dis
tribu
tion
O&
M F
ER
C A
ccou
nts
to P
lant
Acc
ount
sP
roje
cted
Tes
t Yea
r End
ing
Dec
embe
r 31,
201
4
Line
[A]
[B]
[C]
[D]
[E]
[F]
[G]
[H]
[I][J
][K
][L
][M
][N
][O
][P
][Q
][R
][S
][T
]N
o. 1A
lloc
Met
hod
Allo
c M
etho
dA
lloc
Met
hod
YEYE
TO
TAL
2A
ve P
lant
AB
CFE
RC
Tota
lD
ist O
&M
3La
nd a
nd L
and
Rig
hts
374
317,
007
0.
0012
4
870
1,05
4,57
8
374
6,11
8
4S
truct
ures
and
Impr
ovem
ents
375
332,
145
0.
0013
0
871
386,
033
375
6,41
0
5M
ains
376
123,
804,
592
0.
4829
4
123,
804,
592
0.62
5642
872
037
64,
098,
606
6C
ompr
esso
r Sta
tion
Equ
ipm
ent
377
-
-
87
30
377
-
7
Mea
surin
g &
Reg
ulat
ion
Equ
ipm
ent -
Gen
eral
378
5,37
7,94
1
0.02
098
87
41,
252,
253
37
817
8,12
2
8M
easu
ring
& R
egul
atio
n E
quip
men
t - G
ate
Sta
tion
379
62,0
76
0.
0002
4
875
19,8
94
379
133,
386
9
Ser
vice
s38
074
,079
,631
0.28
897
74
,079
,631
0.
3743
58
87
6-
380
2,24
2,14
6
10
Met
ers
381.
0
36,3
43,1
83
0.
1417
7
36,3
43,1
83
0.
6977
27
877
68,6
52
381.
0
2,12
7,85
7
11
Aut
omat
ed M
eter
Rea
ding
- P
urch
ases
381.
2
-
-
-
-
878
1,14
4,80
2
381.
2
-
12
Dem
and
Dev
ices
- P
urch
ases
381.
3
-
-
-
-
879
602,
579
381.
3
-
13
Met
er C
onne
ctio
ns &
Inst
alla
tions
382.
0
-
-
88
02,
811,
781
38
2.0
-
14A
utom
ated
Met
er In
stal
latio
ns38
2.2
-
-
881
16,4
86
382.
2
-
15
Dem
and
Dev
ice
- Ins
talla
tions
382.
3
-
-
88
549
1,68
1
38
2.3
-
16H
ouse
Reg
ulat
ors
383
15,1
71,6
29
0.
0591
8
15,1
71,6
29
0.
2912
69
886
-
38
388
8,28
4
17In
dust
rial M
eter
ing
& R
egul
atin
g S
tatio
n E
quip
.38
557
3,13
9
0.00
224
57
3,13
9
0.
0110
03
887
925,
866
385
33,5
57
18
Oth
er P
rop
on C
ust P
rem
386
-
-
88
8-
386
-
19
303/
302
293,
889
0.
0011
5
889
54,4
40
303/
303
5,67
2
2025
6,35
5,23
2
52,0
87,9
51
19
7,88
4,22
3
89
0-
9,72
0,15
6
21
891
63,5
36
22
892
343,
707
2389
329
7,08
2
**
The
se fi
gure
s do
not
incl
ude
G&
C a
lloca
tions
or A
&G
allo
catio
ns24
894
186,
786
259,
720,
156
26 27
Dis
trib
utio
n O
&M
Acc
ts a
re m
appe
d to
the
appr
opria
te, c
orre
spon
ding
Pla
nt S
erie
s of
Dis
trib
utio
n A
ccou
nts.
28Th
is h
elps
to k
eep
the
CO
SS o
n an
app
les-
to-a
pple
s co
mpa
rison
bas
is.
29 30 31 32 33PE
RC
ENTA
GES
ASS
IGN
ED/T
RA
NSL
ATE
D:
34 35P
lant
Acc
t:36
FER
C A
cct:
374
375
376
37
7
378
379
380
381.
0
38
1.2
381.
3
38
2.0
382.
2
382.
3
38
3
38
5
386
303/
302
Allo
c M
etho
d37
(870
)Sup
erv
& E
ngr
0.00
124
0.00
130
0.
4829
4
-
0.02
098
0.00
024
0.28
897
0.14
177
-
-
-
-
-
0.
0591
8
0.
0022
4
-
0.
0011
5
(A
)38
(871
)Loa
d D
ispa
tch
0.00
124
0.00
130
0.
4829
4
-
0.02
098
0.00
024
0.28
897
0.14
177
-
-
-
-
-
0.
0591
8
0.
0022
4
-
0.
0011
5
(A
)39
(872
)Com
p La
br &
Ex
1.00
000
Dire
ct40
(873
)Com
p Fu
el &
Pw
1.00
000
Dire
ct41
(874
)Mai
ns&
Ser
v E
xp0.
6256
4
0.37
436
( C )
42(8
75)M
s&R
eg E
xp G
en1.
0000
0
D
irect
43(8
77)M
s&R
eg E
xp G
at1.
0000
0
D
irect
44(8
78)M
tr&H
ous
Reg
ul0.
6977
3
-
-
0.29
127
0.01
100
(B
)45
(879
)Cus
t Ins
tall
0.69
773
-
-
0.
2912
7
0.
0110
0
(B)
46(8
80)O
ther
0.00
124
0.00
130
0.
4829
4
-
0.02
098
0.00
024
0.28
897
0.14
177
-
-
-
-
-
0.
0591
8
0.
0022
4
-
0.
0011
5
(A
)47
(881
)Ren
ts0.
0012
4
0.
0013
0
0.48
294
-
0.
0209
8
0.
0002
4
0.
2889
7
0.
1417
7
-
-
-
-
-
0.05
918
0.00
224
-
0.00
115
(A)
48(8
85)S
uper
v.&
Eng
r.0.
0012
4
0.
0013
0
0.48
294
-
0.
0209
8
0.
0002
4
0.
2889
7
0.
1417
7
-
-
-
-
-
0.05
918
0.00
224
-
0.00
115
(A)
49(8
86)S
truct
& Im
prv
1.00
000
D
irect
50(8
87)M
ains
1.00
000
D
irect
51(8
88)C
omp
Sta
t Equ
p1.
0000
0
D
irect
52(8
89)M
s&R
eg E
xp G
en1.
0000
0
D
irect
53(8
90)M
s&R
eg E
xp In
dust
1.00
000
Dire
ct54
(891
)Ms&
Reg
Exp
Gat
1.00
000
Dire
ct55
(892
)Ser
vice
s1.
0000
0
D
irect
56(8
93)M
tr&H
ous
Reg
ul0.
6977
3
-
-
0.29
127
0.01
100
(B
)57
(894
)Oth
er E
quip
mt
0.00
124
0.00
130
0.
4829
4
-
0.02
098
0.00
024
0.28
897
0.14
177
-
-
-
-
-
0.
0591
8
0.
0022
4
-
0.
0011
5
(A
)58 59 60
DO
LLA
RS
ASS
IGN
ED/T
RA
NSL
ATE
D B
ASE
D O
N P
ERC
ENTA
GES
AB
OVE
:61
Pla
nt A
cct:
62FE
RC
Acc
t:37
4
37
5
37
6
377
37
8
37
9
38
0
38
1.0
381.
2
38
1.3
382.
0
38
2.2
38
2.3
383
385
38
6
30
3/30
2A
lloc
Met
hod
63(8
70)S
uper
v &
Eng
r1,
304
1,
366
50
9,30
0
-
22,1
23
255
304,
744
149,
506
-
-
-
-
-
62
,412
2,35
8
-
1,
209
(A
)1,
054,
578
64
(871
)Loa
d D
ispa
tch
477
500
186,
431
-
8,
098
93
11
1,55
3
54
,727
-
-
-
-
-
22
,846
863
-
443
(A)
386,
033
65(8
72)C
omp
Labr
& E
x-
-
-
-
-
-
-
-
-
-
-
-
-
-
-
-
-
D
irect
-
66
(873
)Com
p Fu
el &
Pw
-
-
-
-
-
-
-
-
-
-
-
-
-
-
-
-
-
Dire
ct-
67(8
74)M
ains
&S
erv
Exp
-
-
78
3,46
2
-
-
-
46
8,79
1
-
-
-
-
-
-
-
-
-
-
( C )
1,25
2,25
3
68(8
75)M
s&R
eg E
xp G
en-
-
-
-
19,8
94
-
-
-
-
-
-
-
-
-
-
-
-
D
irect
19,8
94
69
(877
)Ms&
Reg
Exp
Gat
-
-
-
-
-
68
,652
-
-
-
-
-
-
-
-
-
-
-
Dire
ct68
,652
70(8
78)M
tr&H
ous
Reg
ul-
-
-
-
-
-
-
798,
760
-
-
-
-
-
33
3,44
6
12
,597
-
-
(B
)1,
144,
802
71
(879
)Cus
t Ins
tall
-
-
-
-
-
-
-
42
0,43
6
-
-
-
-
-
175,
513
6,63
0
-
-
(B
)60
2,57
9
72
(880
)Oth
er3,
477
3,
643
1,
357,
926
-
58,9
87
681
812,
528
398,
623
-
-
-
-
-
16
6,40
7
6,
286
-
3,22
3
(A)
2,81
1,78
1
73(8
81)R
ents
20
21
7,
962
-
346
4
4,
764
2,
337
-
-
-
-
-
976
37
-
19
(A)
16,4
86
74
(885
)Sup
erv.
& E
ngr.
608
637
237,
453
-
10
,315
11
9
14
2,08
2
69
,705
-
-
-
-
-
29
,099
1,09
9
-
56
4
(A
)49
1,68
1
75
(886
)Stru
ct &
Impr
v-
-
-
-
-
-
-
-
-
-
-
-
-
-
-
-
-
D
irect
-
76
(887
)Mai
ns-
-
925,
866
-
-
-
-
-
-
-
-
-
-
-
-
-
-
Dire
ct92
5,86
6
77
(888
)Com
p S
tat E
qup
-
-
-
-
-
-
-
-
-
-
-
-
-
-
-
-
-
Dire
ct-
78(8
89)M
s&R
eg E
xp G
en-
-
-
-
54,4
40
-
-
-
-
-
-
-
-
-
-
-
-
D
irect
54,4
40
79
(890
)Ms&
Reg
Exp
Indu
st-
-
-
-
-
-
-
-
-
-
-
-
-
-
-
-
-
D
irect
-
80
(891
)Ms&
Reg
Exp
Gat
-
-
-
-
-
63
,536
-
-
-
-
-
-
-
-
-
-
-
Dire
ct63
,536
81(8
92)S
ervi
ces
-
-
-
-
-
-
343,
707
-
-
-
-
-
-
-
-
-
-
D
irect
343,
707
82(8
93)M
tr&H
ous
Reg
ul-
-
-
-
-
-
-
207,
282
-
-
-
-
-
86
,531
3,26
9
-
-
(B
)29
7,08
2
83
(894
)Oth
er E
quip
mt
231
242
90,2
07
-
3,91
8
45
53,9
76
26
,480
-
-
-
-
-
11
,054
418
-
214
(A)
186,
786
846,
118
6,
410
4,
098,
606
-
178,
122
133,
386
2,24
2,14
6
2,
127,
857
-
-
-
-
-
88
8,28
4
33
,557
-
5,
672
9,
720,
156
Case No. U-17273 Witness: J.C. Hoffman Malueg
Exhibit A-6 (JCHM-1) Schedule F1.9
Page 1 of 1

Michigan Gas Utilities Corporation
Account 367: Transmission Gas Mains Regression Analysis
Historical Year Ending December 31, 2012
Summarized Input Data
MATERIAL SIZE SQSIZE COST HWICOST QTY TOTQTY UCOST UHWICOST
STEEL 2 4 $24 $374 277 2,261,558 $13.04 $39.54
2 4 $35 $474 86 2,261,558 $13.04 $39.54
2 4 $3 $33 5 2,261,558 $13.04 $39.54
2 4 $619 $6,257 650 2,261,558 $13.04 $39.54
2 4 $2,918 $28,467 3,009 2,261,558 $13.04 $39.54
2 4 $119 $1,034 60 2,261,558 $13.04 $39.54
2 4 $7,597 $64,979 1,581 2,261,558 $13.04 $39.54
2 4 $52 $425 24 2,261,558 $13.04 $39.54
2 4 $1,171 $6,513 432 2,261,558 $13.04 $39.54
2 4 $979 $4,735 231 2,261,558 $13.04 $39.54
2 4 $7,521 $31,921 395 2,261,558 $13.04 $39.54
2 4 $63 $238 19 2,261,558 $13.04 $39.54
2 4 $44,129 $119,106 2,235 2,261,558 $13.04 $39.54
2 4 $3,106 $7,227 310 2,261,558 $13.04 $39.54
2 4 $665 $1,555 94 2,261,558 $13.04 $39.54
2 4 $55,621 $125,712 344 2,261,558 $13.04 $39.54
2 4 $669 $1,353 45 2,261,558 $13.04 $39.54
2 4 $1,514 $3,288 359 2,261,558 $13.04 $39.54
2 4 $595 $1,248 53 2,261,558 $13.04 $39.54
2 4 $250 $458 27 2,261,558 $13.04 $39.54
2 4 $7,733 $13,915 346 2,261,558 $13.04 $39.54
2 4 $6,024 $10,666 270 2,261,558 $13.04 $39.54
2 4 $785 $1,102 49 2,261,558 $13.04 $39.54
4 16 $216 $5,721 916 2,261,558 $9.68 $40.09
4 16 $4,792 $74,007 20,317 2,261,558 $9.68 $40.09
4 16 $573 $8,166 263 2,261,558 $9.68 $40.09
4 16 $2,744 $37,216 2,589 2,261,558 $9.68 $40.09
4 16 $14,784 $174,888 11,406 2,261,558 $9.68 $40.09
4 16 $623 $6,932 25 2,261,558 $9.68 $40.09
4 16 $7,484 $80,016 15,113 2,261,558 $9.68 $40.09
4 16 $3,195 $32,901 1,241 2,261,558 $9.68 $40.09
4 16 $69,434 $701,917 26,954 2,261,558 $9.68 $40.09
4 16 $239,374 $2,334,949 99,745 2,261,558 $9.68 $40.09
4 16 $4,591 $44,007 7,669 2,261,558 $9.68 $40.09
4 16 $354,004 $3,174,618 22,487 2,261,558 $9.68 $40.09
4 16 $311,107 $2,745,639 105,301 2,261,558 $9.68 $40.09
4 16 $129,330 $1,123,554 23,837 2,261,558 $9.68 $40.09
4 16 $33,642 $287,766 2,596 2,261,558 $9.68 $40.09
4 16 $121,368 $992,362 19,794 2,261,558 $9.68 $40.09
4 16 $183,947 $1,382,091 25,984 2,261,558 $9.68 $40.09
4 16 $16,569 $115,152 4,376 2,261,558 $9.68 $40.09
4 16 $24,698 $143,044 2,699 2,261,558 $9.68 $40.09
4 16 $1,358 $7,549 186 2,261,558 $9.68 $40.09
4 16 $20,482 $99,026 1,772 2,261,558 $9.68 $40.09
4 16 $11,540 $40,608 834 2,261,558 $9.68 $40.09
4 16 $82,909 $263,414 258 2,261,558 $9.68 $40.09
4 16 $262,718 $709,083 4,925 2,261,558 $9.68 $40.09
4 16 $136,190 $327,800 3,695 2,261,558 $9.68 $40.09
4 16 $78,743 $173,048 23,693 2,261,558 $9.68 $40.09
4 16 $95,491 $222,147 3,512 2,261,558 $9.68 $40.09
4 16 $552,100 $1,284,382 22,796 2,261,558 $9.68 $40.09
4 16 $2,347 $5,482 123 2,261,558 $9.68 $40.09
4 16 $53,767 $121,522 124 2,261,558 $9.68 $40.09
4 16 $22,505 $49,457 983 2,261,558 $9.68 $40.09
4 16 $108,486 $220,945 1,873 2,261,558 $9.68 $40.09
4 16 $117,724 $255,681 10,387 2,261,558 $9.68 $40.09
4 16 $148,495 $320,012 7,527 2,261,558 $9.68 $40.09
4 16 $7,790 $16,405 265 2,261,558 $9.68 $40.09
4 16 $4,382 $9,193 148 2,261,558 $9.68 $40.09
4 16 $33,090 $63,882 1,216 2,261,558 $9.68 $40.09
4 16 $429 $806 14 2,261,558 $9.68 $40.09
4 16 $7,944 $14,481 87 2,261,558 $9.68 $40.09
4 16 $67,889 $122,157 1,123 2,261,558 $9.68 $40.09
4 16 $1,022,654 $1,810,814 16,913 2,261,558 $9.68 $40.09
4 16 $7,163 $12,408 119 2,261,558 $9.68 $40.09
4 16 $551,934 $774,938 12,820 2,261,558 $9.68 $40.09
4 16 $2,552 $3,293 23 2,261,558 $9.68 $40.09
6 36 $1,292 $21,131 2,959 2,261,558 $11.66 $56.74
Case No. U-17273 Witness: J.C. Hoffman Malueg
Exhibit A-6 (JCHM-1) Schedule F1.10
Page 1 of 8

Michigan Gas Utilities Corporation
Account 367: Transmission Gas Mains Regression Analysis
Historical Year Ending December 31, 2012
Summarized Input Data
MATERIAL SIZE SQSIZE COST HWICOST QTY TOTQTY UCOST UHWICOST
STEEL 6 36 $17,722 $273,700 41,652 2,261,558 $11.66 $56.74
6 36 $43,923 $595,642 22,364 2,261,558 $11.66 $56.74
6 36 $123,256 $1,370,608 2,763 2,261,558 $11.66 $56.74
6 36 $5,897 $63,057 6,431 2,261,558 $11.66 $56.74
6 36 $187,545 $1,931,021 39,315 2,261,558 $11.66 $56.74
6 36 $1,046,801 $10,582,206 219,401 2,261,558 $11.66 $56.74
6 36 $518,964 $5,062,176 107,044 2,261,558 $11.66 $56.74
6 36 $913 $8,754 824 2,261,558 $11.66 $56.74
6 36 $3,670 $32,908 126 2,261,558 $11.66 $56.74
6 36 $1,526 $13,464 279 2,261,558 $11.66 $56.74
6 36 $180,298 $1,542,238 7,503 2,261,558 $11.66 $56.74
6 36 $125,235 $870,381 17,871 2,261,558 $11.66 $56.74
6 36 $24,336 $152,032 1,570 2,261,558 $11.66 $56.74
6 36 $1,864 $10,794 110 2,261,558 $11.66 $56.74
6 36 $135,409 $752,873 10,003 2,261,558 $11.66 $56.74
6 36 $11,418 $55,205 535 2,261,558 $11.66 $56.74
6 36 $26,858 $94,514 1,048 2,261,558 $11.66 $56.74
6 36 $106,985 $288,755 1,083 2,261,558 $11.66 $56.74
6 36 $164,561 $396,086 2,411 2,261,558 $11.66 $56.74
6 36 $65,436 $152,227 1,300 2,261,558 $11.66 $56.74
6 36 $402,042 $939,224 11,348 2,261,558 $11.66 $56.74
6 36 $332,002 $729,618 7,837 2,261,558 $11.66 $56.74
6 36 $677,850 $1,460,793 12,176 2,261,558 $11.66 $56.74
6 36 $120,646 $262,029 5,748 2,261,558 $11.66 $56.74
6 36 $342,047 $742,884 8,356 2,261,558 $11.66 $56.74
6 36 $114,382 $246,498 3,131 2,261,558 $11.66 $56.74
6 36 $25,316 $53,116 465 2,261,558 $11.66 $56.74
6 36 $138,791 $267,943 2,754 2,261,558 $11.66 $56.74
6 36 $91,838 $172,506 1,708 2,261,558 $11.66 $56.74
6 36 $113,637 $204,474 1,015 2,261,558 $11.66 $56.74
6 36 $621,912 $1,101,219 5,554 2,261,558 $11.66 $56.74
6 36 $321,294 $556,509 2,869 2,261,558 $11.66 $56.74
6 36 $374,529 $469,005 5,145 2,261,558 $11.66 $56.74
8 64 $6,452 $105,507 14,773 2,261,558 $14.89 $73.22
8 64 $2,342 $36,174 5,363 2,261,558 $14.89 $73.22
8 64 $365,155 $5,487,197 90,490 2,261,558 $14.89 $73.22
8 64 $442,682 $6,311,062 109,703 2,261,558 $14.89 $73.22
8 64 $173,367 $2,351,031 88,321 2,261,558 $14.89 $73.22
8 64 $2,132 $25,223 888 2,261,558 $14.89 $73.22
8 64 $242,039 $2,492,104 50,739 2,261,558 $14.89 $73.22
8 64 $191,904 $1,871,910 39,607 2,261,558 $14.89 $73.22
8 64 $4,732 $41,760 865 2,261,558 $14.89 $73.22
8 64 $457,140 $3,971,404 45,500 2,261,558 $14.89 $73.22
8 64 $337,610 $2,887,867 14,070 2,261,558 $14.89 $73.22
8 64 $213,441 $1,745,195 18,797 2,261,558 $14.89 $73.22
8 64 $241,008 $1,810,820 18,384 2,261,558 $14.89 $73.22
8 64 $7,884 $54,794 1,125 2,261,558 $14.89 $73.22
8 64 $524,698 $3,277,887 33,830 2,261,558 $14.89 $73.22
8 64 $376,754 $2,182,036 26,977 2,261,558 $14.89 $73.22
8 64 $195,592 $1,087,491 14,449 2,261,558 $14.89 $73.22
8 64 $384,221 $1,857,624 17,967 2,261,558 $14.89 $73.22
8 64 $248,360 $1,054,106 2,599 2,261,558 $14.89 $73.22
8 64 $213,978 $497,789 4,249 2,261,558 $14.89 $73.22
8 64 $772,512 $1,746,002 959 2,261,558 $14.89 $73.22
8 64 $587,701 $1,291,548 13,873 2,261,558 $14.89 $73.22
8 64 $413,858 $836,746 5,549 2,261,558 $14.89 $73.22
8 64 $116,073 $236,397 1,082 2,261,558 $14.89 $73.22
8 64 $25,553 $55,498 1,218 2,261,558 $14.89 $73.22
8 64 $97,219 $211,147 2,375 2,261,558 $14.89 $73.22
8 64 $1,205,110 $2,597,060 32,989 2,261,558 $14.89 $73.22
8 64 $1,852,826 $3,887,439 34,025 2,261,558 $14.89 $73.22
8 64 $208,913 $403,319 4,145 2,261,558 $14.89 $73.22
8 64 $11,772 $21,531 236 2,261,558 $14.89 $73.22
8 64 $213,436 $377,932 1,906 2,261,558 $14.89 $73.22
8 64 $91,439 $117,959 433 2,261,558 $14.89 $73.22
8 64 $67,374 $77,718 52 2,261,558 $14.89 $73.22
8 64 $104,750 $117,658 706 2,261,558 $14.89 $73.22
10 100 $22,259 $334,483 5,516 2,261,558 $15.00 $73.51
Case No. U-17273 Witness: J.C. Hoffman Malueg
Exhibit A-6 (JCHM-1) Schedule F1.10
Page 2 of 8

Michigan Gas Utilities Corporation
Account 367: Transmission Gas Mains Regression Analysis
Historical Year Ending December 31, 2012
Summarized Input Data
MATERIAL SIZE SQSIZE COST HWICOST QTY TOTQTY UCOST UHWICOST
STEEL 10 100 $488,652 $6,966,418 121,093 2,261,558 $15.00 $73.51
10 100 $22,497 $195,446 2,239 2,261,558 $15.00 $73.51
10 100 $395,910 $1,914,138 18,514 2,261,558 $15.00 $73.51
10 100 $537,332 $2,032,358 32,382 2,261,558 $15.00 $73.51
10 100 $885,054 $3,114,494 34,530 2,261,558 $15.00 $73.51
10 100 $463,735 $1,386,219 12,380 2,261,558 $15.00 $73.51
10 100 $571,398 $1,155,263 7,660 2,261,558 $15.00 $73.51
10 100 $21,283 $43,346 198 2,261,558 $15.00 $73.51
10 100 $3,431 $7,395 94 2,261,558 $15.00 $73.51
10 100 $3,462 $7,291 64 2,261,558 $15.00 $73.51
10 100 $3,646 $6,848 68 2,261,558 $15.00 $73.51
10 100 $108,532 $121,907 400 2,261,558 $15.00 $73.51
12 144 $384 $5,212 196 2,261,558 $25.50 $105.00
12 144 $49,839 $644,431 1,860 2,261,558 $25.50 $105.00
12 144 $442,638 $5,593,335 59,188 2,261,558 $25.50 $105.00
12 144 $124,770 $1,387,443 2,796 2,261,558 $25.50 $105.00
12 144 $1,781,890 $10,320,110 105,114 2,261,558 $25.50 $105.00
12 144 $11,635 $64,688 859 2,261,558 $25.50 $105.00
12 144 $799,010 $1,627,288 7,450 2,261,558 $25.50 $105.00
12 144 $3,231,589 $6,964,200 75,807 2,261,558 $25.50 $105.00
12 144 $1,220 $2,356 24 2,261,558 $25.50 $105.00
12 144 $29,808 $55,991 555 2,261,558 $25.50 $105.00
$31,935,545 $147,377,744 2,261,558
Case No. U-17273 Witness: J.C. Hoffman Malueg
Exhibit A-6 (JCHM-1) Schedule F1.10
Page 3 of 8

Michigan Gas Utilities Corporation
Account 367: Transmission Gas Mains Regression Analysis
Historical Year Ending December 31, 2012
Relating Current Cost Per Foot to Pipe Diameter Squared
Eliminating Outliers
DEPENDENT VARIABLE: UHWICOST
SUM OF MEAN
SOURCE DF SQUARES SQUARE F VALUE PROB>F
MODEL 1 765874703.3 765874703.3 1,812 0.0001
ERROR 156 65954087.51 422782.6123
C TOTAL 157 831828790.8
ROOT MSE 650.21736 R‐SQUARE 0.9207
DEP MEAN 65.16646 ADJ R‐SQ 0.9202
C.V. 997.7791
PARAMETER STANDARD T FOR H0:
VARIABLE DF ESTIMATE ERROR PARAMETER=0 PROB > |T|
INTERCEP 1 37.729283 0.776214 48.6070000 0.0001
SQSIZE 1 0.46687 0.01096922 42.562 0.0001
‐‐‐‐‐‐‐‐‐‐‐‐‐‐‐‐‐‐‐‐‐‐‐‐‐‐‐‐‐‐‐‐‐‐‐‐‐‐‐‐‐‐‐‐‐‐‐‐‐‐‐‐‐‐‐‐‐‐ MATERIAL=STEEL ‐‐‐‐‐‐‐‐‐‐‐‐‐‐‐‐‐‐‐‐‐‐‐‐‐‐‐‐‐‐‐‐‐‐‐‐‐‐‐‐‐‐‐‐‐‐‐‐‐‐‐‐‐‐‐‐‐‐
ANALYSIS OF VARIANCE
PARAMETER ESTIMATES
Case No. U-17273 Witness: J.C. Hoffman Malueg
Exhibit A-6 (JCHM-1) Schedule F1.10
Page 4 of 8

Michigan Gas Utilities Corporation
Account 367: Transmission Gas Mains Regression Analysis
Historical Year Ending December 31, 2008
Relating Current Cost Per Foot to Pipe Diameter Squared
Eliminating Outliers
DEP VAR PREDICT STD ERR STD ERR STUDENT COOK'S
OBS WEIGHT UHWICOST VALUE PREDICT RESIDUAL RESIDUAL RESIDUAL ‐2‐1‐0 1 2 D
1 277 39.545 39.5968 0.74 ‐0.0518 39.061 ‐0.001 | | | 0
2 86 39.545 39.5968 0.74 ‐0.0518 70.111 ‐0.001 | | | 0
3 5 39.545 39.5968 0.74 ‐0.0518 290.785 0 | | | 0
4 650 39.545 39.5968 0.74 ‐0.0518 25.493 ‐0.002 | | | 0
5 3009 39.545 39.5968 0.74 ‐0.0518 11.83 ‐0.004 | | | 0
6 60 39.545 39.5968 0.74 ‐0.0518 83.939 ‐0.001 | | | 0
7 1581 39.545 39.5968 0.74 ‐0.0518 16.336 ‐0.003 | | | 0
8 24 39.545 39.5968 0.74 ‐0.0518 132.723 0 | | | 0
9 432 39.545 39.5968 0.74 ‐0.0518 31.275 ‐0.002 | | | 0
10 231 39.545 39.5968 0.74 ‐0.0518 42.775 ‐0.001 | | | 0
11 395 39.545 39.5968 0.74 ‐0.0518 32.708 ‐0.002 | | | 0
12 19 39.545 39.5968 0.74 ‐0.0518 149.168 0 | | | 0
13 2235 39.545 39.5968 0.74 ‐0.0518 13.734 ‐0.004 | | | 0
14 310 39.545 39.5968 0.74 ‐0.0518 36.922 ‐0.001 | | | 0
15 94 39.545 39.5968 0.74 ‐0.0518 67.061 ‐0.001 | | | 0
16 344 39.545 39.5968 0.74 ‐0.0518 35.05 ‐0.001 | | | 0
17 45 39.545 39.5968 0.74 ‐0.0518 96.926 ‐0.001 | | | 0
18 359 39.545 39.5968 0.74 ‐0.0518 34.309 ‐0.002 | | | 0
19 53 39.545 39.5968 0.74 ‐0.0518 89.311 ‐0.001 | | | 0
20 27 39.545 39.5968 0.74 ‐0.0518 125.132 0 | | | 0
21 346 39.545 39.5968 0.74 ‐0.0518 34.948 ‐0.001 | | | 0
22 270 39.545 39.5968 0.74 ‐0.0518 39.564 ‐0.001 | | | 0
23 49 39.545 39.5968 0.74 ‐0.0518 92.885 ‐0.001 | | | 0
24 916 40.0872 45.1992 0.638 ‐5.112 21.474 ‐0.238 | | | 0
25 20317 40.0872 45.1992 0.638 ‐5.112 4.517 ‐1.132 | **| | 0.013
26 263 40.0872 45.1992 0.638 ‐5.112 40.089 ‐0.128 | | | 0
27 2589 40.0872 45.1992 0.638 ‐5.112 12.763 ‐0.401 | | | 0
28 11406 40.0872 45.1992 0.638 ‐5.112 6.055 ‐0.844 | *| | 0.004
29 25 40.0872 45.1992 0.638 ‐5.112 130.042 ‐0.039 | | | 0
30 15113 40.0872 45.1992 0.638 ‐5.112 5.25 ‐0.974 | *| | 0.007
31 1241 40.0872 45.1992 0.638 ‐5.112 18.446 ‐0.277 | | | 0
32 26954 40.0872 45.1992 0.638 ‐5.112 3.909 ‐1.308 | **| | 0.023
33 99745 40.0872 45.1992 0.638 ‐5.112 1.957 ‐2.612 | *****| | 0.362
34 7669 40.0872 45.1992 0.638 ‐5.112 7.397 ‐0.691 | *| | 0.002
35 22487 40.0872 45.1992 0.638 ‐5.112 4.289 ‐1.192 | **| | 0.016
36 105301 40.0872 45.1992 0.638 ‐5.112 1.899 ‐2.691 | *****| | 0.409
37 23837 40.0872 45.1992 0.638 ‐5.112 4.163 ‐1.228 | **| | 0.018
38 2596 40.0872 45.1992 0.638 ‐5.112 12.746 ‐0.401 | | | 0
39 19794 40.0872 45.1992 0.638 ‐5.112 4.577 ‐1.117 | **| | 0.012
40 25984 40.0872 45.1992 0.638 ‐5.112 3.983 ‐1.283 | **| | 0.021
41 4376 40.0872 45.1992 0.638 ‐5.112 9.809 ‐0.521 | *| | 0.001
42 2699 40.0872 45.1992 0.638 ‐5.112 12.499 ‐0.409 | | | 0
43 186 40.0872 45.1992 0.638 ‐5.112 47.672 ‐0.107 | | | 0
44 1772 40.0872 45.1992 0.638 ‐5.112 15.433 ‐0.331 | | | 0
45 834 40.0872 45.1992 0.638 ‐5.112 22.506 ‐0.227 | | | 0
46 258 40.0872 45.1992 0.638 ‐5.112 40.476 ‐0.126 | | | 0
47 4925 40.0872 45.1992 0.638 ‐5.112 9.243 ‐0.553 | *| | 0.001
48 3695 40.0872 45.1992 0.638 ‐5.112 10.678 ‐0.479 | | | 0
49 23693 40.0872 45.1992 0.638 ‐5.112 4.176 ‐1.224 | **| | 0.017
50 3512 40.0872 45.1992 0.638 ‐5.112 10.953 ‐0.467 | | | 0
51 22796 40.0872 45.1992 0.638 ‐5.112 4.259 ‐1.2 | **| | 0.016
‐‐‐‐‐‐‐‐‐‐‐‐‐‐‐‐‐‐‐‐‐‐‐‐‐‐‐‐‐‐‐‐‐‐‐‐‐‐‐‐‐‐‐‐‐‐‐‐‐‐‐‐‐‐‐‐‐‐ MATERIAL=STEEL ‐‐‐‐‐‐‐‐‐‐‐‐‐‐‐‐‐‐‐‐‐‐‐‐‐‐‐‐‐‐‐‐‐‐‐‐‐‐‐‐‐‐‐‐‐‐‐‐‐‐‐‐‐‐‐‐‐‐
Case No. U-17273 Witness: J.C. Hoffman Malueg
Exhibit A-6 (JCHM-1) Schedule F1.10
Page 5 of 8

Michigan Gas Utilities Corporation
Account 367: Transmission Gas Mains Regression Analysis
Historical Year Ending December 31, 2008
Relating Current Cost Per Foot to Pipe Diameter Squared
Eliminating Outliers
DEP VAR PREDICT STD ERR STD ERR STUDENT COOK'S
OBS WEIGHT UHWICOST VALUE PREDICT RESIDUAL RESIDUAL RESIDUAL ‐2‐1‐0 1 2 D
52 123 40.0872 45.1992 0.638 ‐5.112 58.625 ‐0.087 | | | 0
53 124 40.0872 45.1992 0.638 ‐5.112 58.388 ‐0.088 | | | 0
54 983 40.0872 45.1992 0.638 ‐5.112 20.729 ‐0.247 | | | 0
55 1873 40.0872 45.1992 0.638 ‐5.112 15.011 ‐0.341 | | | 0
56 10387 40.0872 45.1992 0.638 ‐5.112 6.348 ‐0.805 | *| | 0.003
57 7527 40.0872 45.1992 0.638 ‐5.112 7.467 ‐0.685 | *| | 0.002
58 265 40.0872 45.1992 0.638 ‐5.112 39.937 ‐0.128 | | | 0
59 148 40.0872 45.1992 0.638 ‐5.112 53.444 ‐0.096 | | | 0
60 1216 40.0872 45.1992 0.638 ‐5.112 18.635 ‐0.274 | | | 0
61 14 40.0872 45.1992 0.638 ‐5.112 173.777 ‐0.029 | | | 0
62 87 40.0872 45.1992 0.638 ‐5.112 69.708 ‐0.073 | | | 0
63 1123 40.0872 45.1992 0.638 ‐5.112 19.392 ‐0.264 | | | 0
64 16913 40.0872 45.1992 0.638 ‐5.112 4.959 ‐1.031 | **| | 0.009
65 119 40.0872 45.1992 0.638 ‐5.112 59.602 ‐0.086 | | | 0
66 12820 40.0872 45.1992 0.638 ‐5.112 5.707 ‐0.896 | *| | 0.005
67 23 40.0872 45.1992 0.638 ‐5.112 135.578 ‐0.038 | | | 0
68 2959 56.7436 54.5366 0.499 2.207 11.943 0.185 | | | 0
69 41652 56.7436 54.5366 0.499 2.207 3.147 0.701 | |* | 0.006
70 22364 56.7436 54.5366 0.499 2.207 4.319 0.511 | |* | 0.002
71 2763 56.7436 54.5366 0.499 2.207 12.36 0.179 | | | 0
72 6431 56.7436 54.5366 0.499 2.207 8.093 0.273 | | | 0
73 39315 56.7436 54.5366 0.499 2.207 3.241 0.681 | |* | 0.006
74 219401 56.7436 54.5366 0.499 2.207 1.295 1.704 | |*** | 0.216
75 107044 56.7436 54.5366 0.499 2.207 1.924 1.147 | |** | 0.044
76 824 56.7436 54.5366 0.499 2.207 22.646 0.097 | | | 0
77 126 56.7436 54.5366 0.499 2.207 57.924 0.038 | | | 0
78 279 56.7436 54.5366 0.499 2.207 38.924 0.057 | | | 0
79 7503 56.7436 54.5366 0.499 2.207 7.49 0.295 | | | 0
80 17871 56.7436 54.5366 0.499 2.207 4.838 0.456 | | | 0.001
81 1570 56.7436 54.5366 0.499 2.207 16.402 0.135 | | | 0
82 110 56.7436 54.5366 0.499 2.207 61.994 0.036 | | | 0
83 10003 56.7436 54.5366 0.499 2.207 6.482 0.34 | | | 0
84 535 56.7436 54.5366 0.499 2.207 28.107 0.079 | | | 0
85 1048 56.7436 54.5366 0.499 2.207 20.079 0.11 | | | 0
86 1083 56.7436 54.5366 0.499 2.207 19.752 0.112 | | | 0
87 2411 56.7436 54.5366 0.499 2.207 13.233 0.167 | | | 0
88 1300 56.7436 54.5366 0.499 2.207 18.027 0.122 | | | 0
89 11348 56.7436 54.5366 0.499 2.207 6.083 0.363 | | | 0
90 7837 56.7436 54.5366 0.499 2.207 7.328 0.301 | | | 0
91 12176 56.7436 54.5366 0.499 2.207 5.871 0.376 | | | 0.001
92 5748 56.7436 54.5366 0.499 2.207 8.562 0.258 | | | 0
93 8356 56.7436 54.5366 0.499 2.207 7.096 0.311 | | | 0
94 3131 56.7436 54.5366 0.499 2.207 11.61 0.19 | | | 0
95 465 56.7436 54.5366 0.499 2.207 30.149 0.073 | | | 0
96 2754 56.7436 54.5366 0.499 2.207 12.38 0.178 | | | 0
97 1708 56.7436 54.5366 0.499 2.207 15.725 0.14 | | | 0
98 1015 56.7436 54.5366 0.499 2.207 20.403 0.108 | | | 0
99 5554 56.7436 54.5366 0.499 2.207 8.711 0.253 | | | 0
100 2869 56.7436 54.5366 0.499 2.207 12.129 0.182 | | | 0
101 5145 56.7436 54.5366 0.499 2.207 9.051 0.244 | | | 0
102 14773 73.2222 67.609 0.436 5.6132 5.332 1.053 | |** | 0.004
‐‐‐‐‐‐‐‐‐‐‐‐‐‐‐‐‐‐‐‐‐‐‐‐‐‐‐‐‐‐‐‐‐‐‐‐‐‐‐‐‐‐‐‐‐‐‐‐‐‐‐‐‐‐‐‐‐‐ MATERIAL=STEEL ‐‐‐‐‐‐‐‐‐‐‐‐‐‐‐‐‐‐‐‐‐‐‐‐‐‐‐‐‐‐‐‐‐‐‐‐‐‐‐‐‐‐‐‐‐‐‐‐‐‐‐‐‐‐‐‐‐‐
Case No. U-17273 Witness: J.C. Hoffman Malueg
Exhibit A-6 (JCHM-1) Schedule F1.10
Page 6 of 8

Michigan Gas Utilities Corporation
Account 367: Transmission Gas Mains Regression Analysis
Historical Year Ending December 31, 2008
Relating Current Cost Per Foot to Pipe Diameter Squared
Eliminating Outliers
DEP VAR PREDICT STD ERR STD ERR STUDENT COOK'S
OBS WEIGHT UHWICOST VALUE PREDICT RESIDUAL RESIDUAL RESIDUAL ‐2‐1‐0 1 2 D
103 5363 73.2222 67.609 0.436 5.6132 8.868 0.633 | |* | 0
104 90490 73.2222 67.609 0.436 5.6132 2.117 2.651 | |***** | 0.149
105 109703 73.2222 67.609 0.436 5.6132 1.914 2.933 | |***** | 0.223
106 88321 73.2222 67.609 0.436 5.6132 2.144 2.618 | |***** | 0.142
107 888 73.2222 67.609 0.436 5.6132 21.816 0.257 | | | 0
108 50739 73.2222 67.609 0.436 5.6132 2.853 1.967 | |*** | 0.045
109 39607 73.2222 67.609 0.436 5.6132 3.238 1.734 | |*** | 0.027
110 865 73.2222 67.609 0.436 5.6132 22.104 0.254 | | | 0
111 45500 73.2222 67.609 0.436 5.6132 3.017 1.861 | |*** | 0.036
112 14070 73.2222 67.609 0.436 5.6132 5.464 1.027 | |** | 0.003
113 18797 73.2222 67.609 0.436 5.6132 4.722 1.189 | |** | 0.006
114 18384 73.2222 67.609 0.436 5.6132 4.776 1.175 | |** | 0.006
115 1125 73.2222 67.609 0.436 5.6132 19.381 0.29 | | | 0
116 33830 73.2222 67.609 0.436 5.6132 3.508 1.6 | |*** | 0.02
117 26977 73.2222 67.609 0.436 5.6132 3.935 1.427 | |** | 0.013
118 14449 73.2222 67.609 0.436 5.6132 5.392 1.041 | |** | 0.004
119 17967 73.2222 67.609 0.436 5.6132 4.831 1.162 | |** | 0.006
120 2599 73.2222 67.609 0.436 5.6132 12.747 0.44 | | | 0
121 4249 73.2222 67.609 0.436 5.6132 9.966 0.563 | |* | 0
122 959 73.2222 67.609 0.436 5.6132 20.992 0.267 | | | 0
123 13873 73.2222 67.609 0.436 5.6132 5.503 1.02 | |** | 0.003
124 5549 73.2222 67.609 0.436 5.6132 8.718 0.644 | |* | 0.001
125 1082 73.2222 67.609 0.436 5.6132 19.762 0.284 | | | 0
126 1218 73.2222 67.609 0.436 5.6132 18.626 0.301 | | | 0
127 2375 73.2222 67.609 0.436 5.6132 13.335 0.421 | | | 0
128 32989 73.2222 67.609 0.436 5.6132 3.553 1.58 | |*** | 0.019
129 34025 73.2222 67.609 0.436 5.6132 3.498 1.605 | |*** | 0.02
130 4145 73.2222 67.609 0.436 5.6132 10.09 0.556 | |* | 0
131 236 73.2222 67.609 0.436 5.6132 42.323 0.133 | | | 0
132 1906 73.2222 67.609 0.436 5.6132 14.887 0.377 | | | 0
133 433 73.2222 67.609 0.436 5.6132 31.244 0.18 | | | 0
134 52 73.2222 67.609 0.436 5.6132 90.168 0.062 | | | 0
135 706 73.2222 67.609 0.436 5.6132 24.467 0.229 | | | 0
136 5516 73.5126 84.4163 0.626 ‐10.9037 8.732 ‐1.249 | **| | 0.004
137 121093 73.5126 84.4163 0.626 ‐10.9037 1.761 ‐6.193 |******| | 2.422
138 2239 73.5126 84.4163 0.626 ‐10.9037 13.727 ‐0.794 | *| | 0.001
139 18514 73.5126 84.4163 0.626 ‐10.9037 4.738 ‐2.302 | ****| | 0.046
140 32382 73.5126 84.4163 0.626 ‐10.9037 3.559 ‐3.064 |******| | 0.145
141 34530 73.5126 84.4163 0.626 ‐10.9037 3.443 ‐3.167 |******| | 0.166
142 12380 73.5126 84.4163 0.626 ‐10.9037 5.81 ‐1.877 | ***| | 0.02
143 7660 73.5126 84.4163 0.626 ‐10.9037 7.403 ‐1.473 | **| | 0.008
144 198 73.5126 84.4163 0.626 ‐10.9037 46.205 ‐0.236 | | | 0
145 94 73.5126 84.4163 0.626 ‐10.9037 67.062 ‐0.163 | | | 0
146 64 73.5126 84.4163 0.626 ‐10.9037 81.275 ‐0.134 | | | 0
147 68 73.5126 84.4163 0.626 ‐10.9037 78.848 ‐0.138 | | | 0
148 400 73.5126 84.4163 0.626 ‐10.9037 32.505 ‐0.335 | | | 0
149 196 105 105 1.03 0.0844 46.433 0.002 | | | 0
150 1860 105 105 1.03 0.0844 15.041 0.006 | | | 0
151 59188 105 105 1.03 0.0844 2.466 0.034 | | | 0
152 2796 105 105 1.03 0.0844 12.254 0.007 | | | 0
153 105114 105 105 1.03 0.0844 1.721 0.049 | | | 0
154 859 105 105 1.03 0.0844 22.161 0.004 | | | 0
155 7450 105 105 1.03 0.0844 7.462 0.011 | | | 0
156 75807 105 105 1.03 0.0844 2.125 0.04 | | | 0
157 24 105 105 1.03 0.0844 132.721 0.001 | | | 0
158 555 105 105 1.03 0.0844 27.581 0.003 | | | 0
SUM OF RESIDUALS 0
SUM OF SQUARED RESIDUALS 65954087.513
PREDICTED RESID SS (PRESS) 73646187.970
NOTE: THE ABOVE STATISTICS USE OBSERVATION WEIGHTS OR FREQUENCIES.
‐‐‐‐‐‐‐‐‐‐‐‐‐‐‐‐‐‐‐‐‐‐‐‐‐‐‐‐‐‐‐‐‐‐‐‐‐‐‐‐‐‐‐‐‐‐‐‐‐‐‐‐‐‐‐‐‐‐ MATERIAL=STEEL ‐‐‐‐‐‐‐‐‐‐‐‐‐‐‐‐‐‐‐‐‐‐‐‐‐‐‐‐‐‐‐‐‐‐‐‐‐‐‐‐‐‐‐‐‐‐‐‐‐‐‐‐‐‐‐‐‐‐
Case No. U-17273 Witness: J.C. Hoffman Malueg
Exhibit A-6 (JCHM-1) Schedule F1.10
Page 7 of 8

Michigan Gas Utilities Corporation
Account 367: Transmission Gas Mains Regression Analysis
Historical Year Ending December 31, 2012
MATERIAL _MODEL_ _TYPE_ _DEPVAR_ _RMSE_ INTERCEP SQSIZE UHWICOST
STEEL MODEL1 PARMS UHWICOST 650.217 37.7293 0.46687 ‐1
MINIMUM MINIMUM
SYSTEM SYSTEM AT
CURRENT COST CURRENT
MATERIAL QUANTITY PER UNIT COST
STEEL 2,261,558 37.7293 85,326,962
MINIMUM MINIMUM DEMAND
SYSTEM AT TOTAL AT SYSTEM AT RELATED
CURRENT CURRENT CURRENT COST CURRENT COST
COST COST PERCENT PERCENT
85,326,962 147,377,744 0.57897 0.42103
Eliminating Outliers
Current Cost Estimates
Eliminating Outliers
Estimation of Minimum Cost of Gas Transmission Mains
Eliminating Outliers
Estimation of Percentage of Minimum Cost of Gas Transmission Mains
Case No. U-17273 Witness: J.C. Hoffman Malueg
Exhibit A-6 (JCHM-1) Schedule F1.10
Page 8 of 8

Michigan Gas Utilities Corporation
Account 376: Distribution Gas Mains Regression Analysis
Historical Year Ending December 31, 2012
Summarized Input Data
MATERIAL SIZE SQSIZE COST HWICOST QTY TOTQTY UCOST UHWICOSTPLASTIC 0.75 0.563 $730.0 $9,360.0 1,414 10,587,131 $1.33 $8.34
0.75 0.563 $12.0 $80.0 23 10,587,131 $1.33 $8.34
0.75 0.563 $456.0 $2,438.0 170 10,587,131 $1.33 $8.34
0.75 0.563 $1,175.0 $2,954.0 171 10,587,131 $1.33 $8.34
1 1 $777.0 $9,962.0 1,505 10,587,131 $7.47 $17.47
1 1 $273.0 $1,522.0 529 10,587,131 $7.47 $17.47
1 1 $586.0 $3,132.0 219 10,587,131 $7.47 $17.47
1 1 $21,063.0 $108,053.0 4,172 10,587,131 $7.47 $17.47
1 1 $588.0 $2,695.0 117 10,587,131 $7.47 $17.47
1 1 $7,787.0 $31,455.0 1,250 10,587,131 $7.47 $17.47
1 1 $7,188.0 $27,314.0 1,308 10,587,131 $7.47 $17.47
1 1 $1,048.0 $3,734.0 207 10,587,131 $7.47 $17.47
1 1 $2,250.0 $7,447.0 834 10,587,131 $7.47 $17.47
1 1 $508.0 $1,393.0 106 10,587,131 $7.47 $17.47
1 1 $6,243.0 $14,047.0 536 10,587,131 $7.47 $17.47
1 1 $2,808.0 $6,131.0 393 10,587,131 $7.47 $17.47
1 1 $1,215.0 $2,534.0 196 10,587,131 $7.47 $17.47
1 1 $3,692.0 $7,399.0 550 10,587,131 $7.47 $17.47
1 1 $5,095.0 $8,741.0 1,428 10,587,131 $7.47 $17.47
1 1 $3,533.0 $5,809.0 604 10,587,131 $7.47 $17.47
1 1 $10,037.0 $16,040.0 1,741 10,587,131 $7.47 $17.47
1 1 $421.0 $659.0 81 10,587,131 $7.47 $17.47
1 1 $5,538.0 $8,164.0 942 10,587,131 $7.47 $17.47
1 1 $3,504.0 $5,021.0 511 10,587,131 $7.47 $17.47
1 1 $381.0 $510.0 38 10,587,131 $7.47 $17.47
1 1 $41,208.0 $46,666.0 1,694 10,587,131 $7.47 $17.47
1 1 $19,949.0 $22,055.0 530 10,587,131 $7.47 $17.47
1.25 1.563 $2,608.0 $33,444.0 4,987 10,587,131 $5.00 $18.10
1.25 1.563 $6,766.0 $36,156.0 2,529 10,587,131 $5.00 $18.10
1.25 1.563 $8,598.0 $44,107.0 1,703 10,587,131 $5.00 $18.10
1.25 1.563 $1,325.0 $6,071.0 264 10,587,131 $5.00 $18.10
1.25 1.563 $87,877.0 $354,966.0 14,118 10,587,131 $5.00 $18.10
1.25 1.563 $28,616.0 $108,739.0 5,206 10,587,131 $5.00 $18.10
1.25 1.563 $2,476.0 $8,820.0 489 10,587,131 $5.00 $18.10
1.25 1.563 $4,110.0 $13,602.0 950 10,587,131 $5.00 $18.10
1.25 1.563 $6,418.0 $19,481.0 1,392 10,587,131 $5.00 $18.10
1.25 1.563 $3,684.0 $10,108.0 767 10,587,131 $5.00 $18.10
1.25 1.563 $1,730.0 $4,350.0 252 10,587,131 $5.00 $18.10
1.25 1.563 $3,705.0 $8,640.0 390 10,587,131 $5.00 $18.10
1.25 1.563 $8,288.0 $18,649.0 712 10,587,131 $5.00 $18.10
1.25 1.563 $9,928.0 $21,672.0 1,386 10,587,131 $5.00 $18.10
1.25 1.563 $718.0 $1,339.0 124 10,587,131 $5.00 $18.10
1.25 1.563 $3,392.0 $6,149.0 613 10,587,131 $5.00 $18.10
1.25 1.563 $1,190.0 $2,106.0 302 10,587,131 $5.00 $18.10
1.25 1.563 $377.0 $619.0 65 10,587,131 $5.00 $18.10
1.25 1.563 $855.0 $1,366.0 148 10,587,131 $5.00 $18.10
1.25 1.563 $9,977.0 $15,605.0 1,927 10,587,131 $5.00 $18.10
1.25 1.563 $2,612.0 $3,988.0 504 10,587,131 $5.00 $18.10
1.25 1.563 $5,319.0 $5,661.0 1,255 10,587,131 $5.00 $18.10
2 4 $5.0 $331.0 10 10,587,131 $6.60 $13.14
2 4 $4.0 $58.0 7 10,587,131 $6.60 $13.14
2 4 $11.0 $157.0 22 10,587,131 $6.60 $13.14
2 4 $47,271.0 $606,247.0 90,885 10,587,131 $6.60 $13.14
2 4 $54.0 $656.0 104 10,587,131 $6.60 $13.14
2 4 $19.0 $207.0 36 10,587,131 $6.60 $13.14
2 4 $12.0 $119.0 23 10,587,131 $6.60 $13.14
2 4 $16.0 $155.0 31 10,587,131 $6.60 $13.14
Case No. U-17273 Witness: J.C. Hoffman Malueg
Exhibit A-6 (JCHM-1) Schedule F1.11
Page 1 of 20

Michigan Gas Utilities Corporation
Account 376: Distribution Gas Mains Regression Analysis
Historical Year Ending December 31, 2012
Summarized Input Data
MATERIAL SIZE SQSIZE COST HWICOST QTY TOTQTY UCOST UHWICOSTPLASTIC 2 4 $1,378.0 $12,854.0 2,670 10,587,131 $6.60 $13.14
2 4 $28.0 $251.0 50 10,587,131 $6.60 $13.14
2 4 $1.0 $4.0 1 10,587,131 $6.60 $13.14
2 4 $315.0 $2,275.0 610 10,587,131 $6.60 $13.14
2 4 $581.0 $4,084.0 1,126 10,587,131 $6.60 $13.14
2 4 $811.0 $5,473.0 292 10,587,131 $6.60 $13.14
2 4 $27.0 $180.0 53 10,587,131 $6.60 $13.14
2 4 $346.0 $2,063.0 670 10,587,131 $6.60 $13.14
2 4 $39,243.0 $218,822.0 75,102 10,587,131 $6.60 $13.14
2 4 $495,360.0 $2,647,080.0 184,935 10,587,131 $6.60 $13.14
2 4 $1,336,278.0 $6,855,108.0 264,655 10,587,131 $6.60 $13.14
2 4 $710,231.0 $3,253,111.0 140,655 10,587,131 $6.60 $13.14
2 4 $866,576.0 $3,500,421.0 138,386 10,587,131 $6.60 $13.14
2 4 $809,211.0 $3,075,001.0 147,099 10,587,131 $6.60 $13.14
2 4 $672,559.0 $2,395,991.0 132,503 10,587,131 $6.60 $13.14
2 4 $798,516.0 $2,642,831.0 184,368 10,587,131 $6.60 $13.14
2 4 $1,158,074.0 $3,515,338.0 251,165 10,587,131 $6.60 $13.14
2 4 $751,542.0 $2,061,716.0 156,437 10,587,131 $6.60 $13.14
2 4 $906,783.0 $2,280,292.0 131,830 10,587,131 $6.60 $13.14
2 4 $473,509.0 $1,104,137.0 50,008 10,587,131 $6.60 $13.14
2 4 $671,076.0 $1,509,921.0 59,272 10,587,131 $6.60 $13.14
2 4 $753,528.0 $1,659,054.0 94,199 10,587,131 $6.60 $13.14
2 4 $555,915.0 $1,213,550.0 78,577 10,587,131 $6.60 $13.14
2 4 $789,928.0 $1,695,535.0 120,364 10,587,131 $6.60 $13.14
2 4 $832,488.0 $1,736,042.0 133,948 10,587,131 $6.60 $13.14
2 4 $1,136,749.0 $2,277,938.0 169,286 10,587,131 $6.60 $13.14
2 4 $974,548.0 $1,817,975.0 168,549 10,587,131 $6.60 $13.14
2 4 $1,257,566.0 $2,279,616.0 227,226 10,587,131 $6.60 $13.14
2 4 $704,188.0 $1,245,683.0 178,710 10,587,131 $6.60 $13.14
2 4 $837,811.0 $1,466,885.0 308,712 10,587,131 $6.60 $13.14
2 4 $1,247,520.0 $2,140,393.0 349,154 10,587,131 $6.60 $13.14
2 4 $1,485,619.0 $2,490,596.0 203,727 10,587,131 $6.60 $13.14
2 4 $923,775.0 $1,518,898.0 157,690 10,587,131 $6.60 $13.14
2 4 $1,105,234.0 $1,766,308.0 192,188 10,587,131 $6.60 $13.14
2 4 $1,166,673.0 $1,824,706.0 224,931 10,587,131 $6.60 $13.14
2 4 $892,635.0 $1,362,863.0 172,423 10,587,131 $6.60 $13.14
2 4 $1,514,261.0 $2,271,392.0 199,733 10,587,131 $6.60 $13.14
2 4 $1,157,234.0 $1,705,923.0 198,250 10,587,131 $6.60 $13.14
2 4 $1,117,071.0 $1,600,719.0 162,676 10,587,131 $6.60 $13.14
2 4 $1,690,246.0 $2,369,116.0 103,283 10,587,131 $6.60 $13.14
2 4 $1,824,407.0 $2,522,697.0 151,071 10,587,131 $6.60 $13.14
2 4 $1,719,346.0 $2,302,936.0 171,354 10,587,131 $6.60 $13.14
2 4 $2,008,372.0 $2,519,059.0 172,017 10,587,131 $6.60 $13.14
2 4 $1,864,549.0 $2,224,451.0 177,713 10,587,131 $6.60 $13.14
2 4 $1,538,679.0 $1,742,478.0 132,675 10,587,131 $6.60 $13.14
2 4 $1,050,088.0 $1,160,980.0 73,956 10,587,131 $6.60 $13.14
2 4 $880,719.0 $912,745.0 63,575 10,587,131 $6.60 $13.14
2 4 $1,168,347.0 $1,243,489.0 84,584 10,587,131 $6.60 $13.14
2 4 $1,063,214.0 $1,097,442.0 57,144 10,587,131 $6.60 $13.14
2 4 $228,587.0 $228,587.0 9,020 10,587,131 $6.60 $13.14
3 9 $119.0 $204.0 33 10,587,131 $3.59 $6.17
4 16 $16,184.0 $207,556.0 29,181 10,587,131 $11.62 $22.49
4 16 $61.0 $750.0 119 10,587,131 $11.62 $22.49
4 16 $157.0 $1,750.0 304 10,587,131 $11.62 $22.49
4 16 $90.0 $903.0 174 10,587,131 $11.62 $22.49
4 16 $40.0 $390.0 78 10,587,131 $11.62 $22.49
4 16 $43.0 $400.0 83 10,587,131 $11.62 $22.49
Case No. U-17273 Witness: J.C. Hoffman Malueg
Exhibit A-6 (JCHM-1) Schedule F1.11
Page 2 of 20

Michigan Gas Utilities Corporation
Account 376: Distribution Gas Mains Regression Analysis
Historical Year Ending December 31, 2012
Summarized Input Data
MATERIAL SIZE SQSIZE COST HWICOST QTY TOTQTY UCOST UHWICOSTPLASTIC 4 16 $17.0 $153.0 33 10,587,131 $11.62 $22.49
4 16 $5.0 $34.0 9 10,587,131 $11.62 $22.49
4 16 $66.0 $442.0 127 10,587,131 $11.62 $22.49
4 16 $8.0 $51.0 15 10,587,131 $11.62 $22.49
4 16 $83.0 $517.0 160 10,587,131 $11.62 $22.49
4 16 $813.0 $4,536.0 1,576 10,587,131 $11.62 $22.49
4 16 $327,300.0 $1,749,011.0 55,897 10,587,131 $11.62 $22.49
4 16 $1,155,251.0 $5,926,440.0 114,407 10,587,131 $11.62 $22.49
4 16 $770,651.0 $3,529,856.0 80,122 10,587,131 $11.62 $22.49
4 16 $434,725.0 $1,756,015.0 35,148 10,587,131 $11.62 $22.49
4 16 $729,953.0 $2,773,821.0 66,330 10,587,131 $11.62 $22.49
4 16 $498,903.0 $1,777,343.0 49,232 10,587,131 $11.62 $22.49
4 16 $788,463.0 $2,609,557.0 91,029 10,587,131 $11.62 $22.49
4 16 $1,115,510.0 $3,386,133.0 120,999 10,587,131 $11.62 $22.49
4 16 $1,562,870.0 $4,287,445.0 162,663 10,587,131 $11.62 $22.49
4 16 $874,003.0 $2,197,861.0 63,532 10,587,131 $11.62 $22.49
4 16 $564,730.0 $1,316,849.0 29,759 10,587,131 $11.62 $22.49
4 16 $614,589.0 $1,382,826.0 26,670 10,587,131 $11.62 $22.49
4 16 $568,873.0 $1,252,496.0 35,441 10,587,131 $11.62 $22.49
4 16 $949,310.0 $2,072,324.0 66,649 10,587,131 $11.62 $22.49
4 16 $718,229.0 $1,541,637.0 54,646 10,587,131 $11.62 $22.49
4 16 $760,858.0 $1,586,668.0 61,206 10,587,131 $11.62 $22.49
4 16 $662,403.0 $1,327,394.0 49,326 10,587,131 $11.62 $22.49
4 16 $621,729.0 $1,159,807.0 54,804 10,587,131 $11.62 $22.49
4 16 $701,146.0 $1,270,982.0 63,419 10,587,131 $11.62 $22.49
4 16 $1,355,312.0 $2,397,500.0 171,820 10,587,131 $11.62 $22.49
4 16 $1,760,825.0 $3,082,945.0 325,396 10,587,131 $11.62 $22.49
4 16 $3,498,716.0 $6,002,814.0 495,208 10,587,131 $11.62 $22.49
4 16 $1,763,611.0 $2,956,641.0 120,333 10,587,131 $11.62 $22.49
4 16 $2,100,535.0 $3,453,765.0 179,541 10,587,131 $11.62 $22.49
4 16 $1,472,357.0 $2,353,020.0 125,679 10,587,131 $11.62 $22.49
4 16 $1,756,348.0 $2,746,971.0 168,701 10,587,131 $11.62 $22.49
4 16 $1,213,087.0 $1,852,123.0 114,792 10,587,131 $11.62 $22.49
4 16 $1,284,300.0 $1,926,450.0 81,773 10,587,131 $11.62 $22.49
4 16 $1,646,260.0 $2,426,815.0 140,148 10,587,131 $11.62 $22.49
4 16 $1,088,622.0 $1,559,953.0 78,135 10,587,131 $11.62 $22.49
4 16 $1,212,462.0 $1,699,434.0 35,395 10,587,131 $11.62 $22.49
4 16 $1,451,694.0 $2,007,329.0 60,054 10,587,131 $11.62 $22.49
4 16 $706,370.0 $946,130.0 34,824 10,587,131 $11.62 $22.49
4 16 $1,126,085.0 $1,412,424.0 51,784 10,587,131 $11.62 $22.49
4 16 $989,584.0 $1,180,597.0 51,555 10,587,131 $11.62 $22.49
4 16 $1,040,626.0 $1,178,457.0 41,555 10,587,131 $11.62 $22.49
4 16 $1,622,922.0 $1,794,308.0 96,168 10,587,131 $11.62 $22.49
4 16 $928,867.0 $962,644.0 49,360 10,587,131 $11.62 $22.49
4 16 $1,418,944.0 $1,510,204.0 97,656 10,587,131 $11.62 $22.49
4 16 $1,815,506.0 $1,873,953.0 99,727 10,587,131 $11.62 $22.49
4 16 $20,790.0 $20,790.0 235 10,587,131 $11.62 $22.49
6 36 $2,272.0 $29,139.0 4,402 10,587,131 $21.97 $29.39
6 36 $12,645.0 $57,920.0 1,263 10,587,131 $21.97 $29.39
6 36 $18,521.0 $27,782.0 1,347 10,587,131 $21.97 $29.39
6 36 $146,390.0 $215,799.0 12,311 10,587,131 $21.97 $29.39
6 36 $4,842.0 $6,938.0 353 10,587,131 $21.97 $29.39
6 36 $269,088.0 $377,165.0 7,855 10,587,131 $21.97 $29.39
6 36 $3,817.0 $5,113.0 1,947 10,587,131 $21.97 $29.39
6 36 $4,916.0 $6,166.0 2,639 10,587,131 $21.97 $29.39
6 36 $191,706.0 $228,710.0 6,451 10,587,131 $21.97 $29.39
6 36 $53,709.0 $60,823.0 1,372 10,587,131 $21.97 $29.39
Case No. U-17273 Witness: J.C. Hoffman Malueg
Exhibit A-6 (JCHM-1) Schedule F1.11
Page 3 of 20

Michigan Gas Utilities Corporation
Account 376: Distribution Gas Mains Regression Analysis
Historical Year Ending December 31, 2012
Summarized Input Data
MATERIAL SIZE SQSIZE COST HWICOST QTY TOTQTY UCOST UHWICOSTPLASTIC 6 36 $43,996.0 $45,595.0 742 10,587,131 $21.97 $29.39
6 36 $112,985.0 $120,251.0 1,266 10,587,131 $21.97 $29.39
6 36 $79,969.0 $82,543.0 1,051 10,587,131 $21.97 $29.39
8 64 $215.0 $368.0 30 10,587,131 $7.15 $12.28
$90,233,844.0 $176,905,622.0 10,587,131
STEEL 0.75 0.563 $55.0 $2,549.0 72 7,456,205 $2.27 $23.07
0.75 0.563 $233.0 $8,807.0 304 7,456,205 $2.27 $23.07
0.75 0.563 $153.0 $2,409.0 189 7,456,205 $2.27 $23.07
0.75 0.563 $301.0 $4,553.0 613 7,456,205 $2.27 $23.07
0.75 0.563 $1,569.0 $22,527.0 1,026 7,456,205 $2.27 $23.07
0.75 0.563 $1,060.0 $13,585.0 484 7,456,205 $2.27 $23.07
0.75 0.563 $9.0 $103.0 8 7,456,205 $2.27 $23.07
0.75 0.563 $112.0 $582.0 32 7,456,205 $2.27 $23.07
0.75 0.563 $2,902.0 $9,947.0 92 7,456,205 $2.27 $23.07
1 1 $827.0 $40,529.0 1,081 7,456,205 $1.44 $26.22
1 1 $623.0 $30,519.0 814 7,456,205 $1.44 $26.22
1 1 $652.0 $31,944.0 852 7,456,205 $1.44 $26.22
1 1 $217.0 $10,021.0 283 7,456,205 $1.44 $26.22
1 1 $1,368.0 $63,312.0 1,788 7,456,205 $1.44 $26.22
1 1 $819.0 $37,924.0 1,071 7,456,205 $1.44 $26.22
1 1 $57.0 $2,516.0 75 7,456,205 $1.44 $26.22
1 1 $6.0 $232.0 8 7,456,205 $1.44 $26.22
1 1 $373.0 $11,938.0 487 7,456,205 $1.44 $26.22
1 1 $21.0 $558.0 28 7,456,205 $1.44 $26.22
1 1 $31.0 $729.0 40 7,456,205 $1.44 $26.22
1 1 $2,997.0 $67,475.0 3,917 7,456,205 $1.44 $26.22
1 1 $1,058.0 $22,037.0 1,383 7,456,205 $1.44 $26.22
1 1 $466.0 $9,251.0 486 7,456,205 $1.44 $26.22
1 1 $3.0 $58.0 3 7,456,205 $1.44 $26.22
1 1 $259.0 $4,696.0 122 7,456,205 $1.44 $26.22
1 1 $632.0 $10,750.0 518 7,456,205 $1.44 $26.22
1 1 $134.0 $2,192.0 129 7,456,205 $1.44 $26.22
1 1 $128.0 $1,944.0 121 7,456,205 $1.44 $26.22
1 1 $732.0 $10,692.0 233 7,456,205 $1.44 $26.22
1 1 $412.0 $5,924.0 270 7,456,205 $1.44 $26.22
1 1 $384.0 $5,159.0 290 7,456,205 $1.44 $26.22
1 1 $469.0 $6,103.0 423 7,456,205 $1.44 $26.22
1 1 $1,623.0 $18,777.0 919 7,456,205 $1.44 $26.22
1 1 $2,476.0 $22,669.0 749 7,456,205 $1.44 $26.22
1 1 $495.0 $4,293.0 153 7,456,205 $1.44 $26.22
1 1 $393.0 $2,578.0 115 7,456,205 $1.44 $26.22
1 1 $1,185.0 $4,219.0 130 7,456,205 $1.44 $26.22
1 1 $2,711.0 $3,608.0 31 7,456,205 $1.44 $26.22
1 1 $2,329.0 $2,985.0 95 7,456,205 $1.44 $26.22
1.25 1.563 $145.0 $7,124.0 190 7,456,205 $5.39 $28.82
1.25 1.563 $598.0 $33,186.0 781 7,456,205 $5.39 $28.82
1.25 1.563 $456.0 $19,993.0 596 7,456,205 $5.39 $28.82
1.25 1.563 $6.0 $255.0 8 7,456,205 $5.39 $28.82
1.25 1.563 $1,063.0 $40,241.0 1,389 7,456,205 $5.39 $28.82
1.25 1.563 $1,678.0 $43,680.0 2,193 7,456,205 $5.39 $28.82
1.25 1.563 $328.0 $7,812.0 429 7,456,205 $5.39 $28.82
1.25 1.563 $633.0 $14,246.0 827 7,456,205 $5.39 $28.82
1.25 1.563 $261.0 $5,434.0 341 7,456,205 $5.39 $28.82
1.25 1.563 $197.0 $3,914.0 206 7,456,205 $5.39 $28.82
1.25 1.563 $1,103.0 $21,366.0 1,318 7,456,205 $5.39 $28.82
Case No. U-17273 Witness: J.C. Hoffman Malueg
Exhibit A-6 (JCHM-1) Schedule F1.11
Page 4 of 20

Michigan Gas Utilities Corporation
Account 376: Distribution Gas Mains Regression Analysis
Historical Year Ending December 31, 2012
Summarized Input Data
MATERIAL SIZE SQSIZE COST HWICOST QTY TOTQTY UCOST UHWICOSTSTEEL 1.25 1.563 $253.0 $4,585.0 238 7,456,205 $5.39 $28.82
1.25 1.563 $1,167.0 $19,843.0 956 7,456,205 $5.39 $28.82
1.25 1.563 $184.0 $2,998.0 176 7,456,205 $5.39 $28.82
1.25 1.563 $319.0 $4,833.0 652 7,456,205 $5.39 $28.82
1.25 1.563 $2,330.0 $34,050.0 741 7,456,205 $5.39 $28.82
1.25 1.563 $26.0 $377.0 17 7,456,205 $5.39 $28.82
1.25 1.563 $502.0 $6,973.0 229 7,456,205 $5.39 $28.82
1.25 1.563 $278.0 $3,741.0 210 7,456,205 $5.39 $28.82
1.25 1.563 $1,180.0 $15,361.0 1,066 7,456,205 $5.39 $28.82
1.25 1.563 $1,578.0 $20,223.0 720 7,456,205 $5.39 $28.82
1.25 1.563 $418.0 $5,044.0 388 7,456,205 $5.39 $28.82
1.25 1.563 $1,790.0 $20,706.0 1,015 7,456,205 $5.39 $28.82
1.25 1.563 $3,576.0 $38,191.0 2,219 7,456,205 $5.39 $28.82
1.25 1.563 $12,496.0 $125,410.0 3,326 7,456,205 $5.39 $28.82
1.25 1.563 $1,335.0 $12,222.0 403 7,456,205 $5.39 $28.82
1.25 1.563 $636.0 $5,523.0 238 7,456,205 $5.39 $28.82
1.25 1.563 $2,801.0 $18,371.0 820 7,456,205 $5.39 $28.82
1.25 1.563 $375.0 $1,335.0 73 7,456,205 $5.39 $28.82
1.25 1.563 $1,848.0 $5,499.0 105 7,456,205 $5.39 $28.82
1.25 1.563 $347.0 $991.0 100 7,456,205 $5.39 $28.82
1.25 1.563 $85.0 $196.0 3 7,456,205 $5.39 $28.82
1.25 1.563 $1,628.0 $3,569.0 72 7,456,205 $5.39 $28.82
1.25 1.563 $3,672.0 $6,564.0 60 7,456,205 $5.39 $28.82
1.25 1.563 $52,871.0 $70,354.0 588 7,456,205 $5.39 $28.82
1.25 1.563 $23,431.0 $32,694.0 118 7,456,205 $5.39 $28.82
1.25 1.563 $1,677.0 $2,308.0 66 7,456,205 $5.39 $28.82
1.5 2.25 $25.0 $526.0 33 7,456,205 $1.12 $19.64
1.5 2.25 $145.0 $2,460.0 119 7,456,205 $1.12 $19.64
2 4 $106.0 $5,537.0 139 7,456,205 $1.44 $19.61
2 4 $439.0 $21,521.0 574 7,456,205 $1.44 $19.61
2 4 $37.0 $1,800.0 48 7,456,205 $1.44 $19.61
2 4 $1,536.0 $79,950.0 356 7,456,205 $1.44 $19.61
2 4 $696.0 $32,187.0 909 7,456,205 $1.44 $19.61
2 4 $638.0 $29,532.0 815 7,456,205 $1.44 $19.61
2 4 $1,680.0 $77,759.0 2,196 7,456,205 $1.44 $19.61
2 4 $872.0 $38,242.0 1,140 7,456,205 $1.44 $19.61
2 4 $5,451.0 $227,032.0 7,124 7,456,205 $1.44 $19.61
2 4 $1,051.0 $39,807.0 1,374 7,456,205 $1.44 $19.61
2 4 $424.0 $13,581.0 554 7,456,205 $1.44 $19.61
2 4 $2,299.0 $66,023.0 3,004 7,456,205 $1.44 $19.61
2 4 $2,590.0 $69,597.0 3,385 7,456,205 $1.44 $19.61
2 4 $15,768.0 $410,468.0 20,663 7,456,205 $1.44 $19.61
2 4 $7,012.0 $166,882.0 9,164 7,456,205 $1.44 $19.61
2 4 $56,553.0 $1,273,211.0 73,911 7,456,205 $1.44 $19.61
2 4 $53,680.0 $1,117,877.0 67,916 7,456,205 $1.44 $19.61
2 4 $56,039.0 $1,111,449.0 58,394 7,456,205 $1.44 $19.61
2 4 $107,159.0 $2,075,893.0 127,756 7,456,205 $1.44 $19.61
2 4 $90,660.0 $1,641,734.0 85,013 7,456,205 $1.44 $19.61
2 4 $137,101.0 $2,330,723.0 111,976 7,456,205 $1.44 $19.61
2 4 $139,355.0 $2,276,123.0 130,832 7,456,205 $1.44 $19.61
2 4 $125,771.0 $1,976,743.0 152,849 7,456,205 $1.44 $19.61
2 4 $414,152.0 $6,272,518.0 836,584 7,456,205 $1.44 $19.61
2 4 $1,294,273.0 $18,914,553.0 412,603 7,456,205 $1.44 $19.61
2 4 $188,708.0 $2,710,233.0 123,475 7,456,205 $1.44 $19.61
2 4 $303,948.0 $4,219,806.0 139,047 7,456,205 $1.44 $19.61
2 4 $263,614.0 $3,541,778.0 199,445 7,456,205 $1.44 $19.61
2 4 $305,111.0 $3,971,204.0 274,544 7,456,205 $1.44 $19.61
Case No. U-17273 Witness: J.C. Hoffman Malueg
Exhibit A-6 (JCHM-1) Schedule F1.11
Page 5 of 20

Michigan Gas Utilities Corporation
Account 376: Distribution Gas Mains Regression Analysis
Historical Year Ending December 31, 2012
Summarized Input Data
MATERIAL SIZE SQSIZE COST HWICOST QTY TOTQTY UCOST UHWICOSTSTEEL 2 4 $523,701.0 $6,711,427.0 238,647 7,456,205 $1.44 $19.61
2 4 $312,688.0 $3,774,917.0 289,645 7,456,205 $1.44 $19.61
2 4 $524,325.0 $6,066,145.0 296,937 7,456,205 $1.44 $19.61
2 4 $183,579.0 $1,960,528.0 113,606 7,456,205 $1.44 $19.61
2 4 $157,706.0 $1,582,756.0 41,937 7,456,205 $1.44 $19.61
2 4 $22,713.0 $207,909.0 6,865 7,456,205 $1.44 $19.61
2 4 $26,802.0 $232,564.0 8,246 7,456,205 $1.44 $19.61
2 4 $3,232.0 $26,919.0 3,868 7,456,205 $1.44 $19.61
2 4 $3,094.0 $22,412.0 616 7,456,205 $1.44 $19.61
2 4 $6,683.0 $43,832.0 1,956 7,456,205 $1.44 $19.61
2 4 $1,585.0 $8,203.0 453 7,456,205 $1.44 $19.61
2 4 $9,630.0 $46,101.0 2,248 7,456,205 $1.44 $19.61
2 4 $6,349.0 $28,282.0 5,062 7,456,205 $1.44 $19.61
2 4 $4,776.0 $19,217.0 855 7,456,205 $1.44 $19.61
2 4 $1,477.0 $5,443.0 268 7,456,205 $1.44 $19.61
2 4 $2,686.0 $9,563.0 295 7,456,205 $1.44 $19.61
2 4 $2,368.0 $8,429.0 456 7,456,205 $1.44 $19.61
2 4 $4,968.0 $15,734.0 1,613 7,456,205 $1.44 $19.61
2 4 $767.0 $2,324.0 413 7,456,205 $1.44 $19.61
2 4 $20,414.0 $60,730.0 1,168 7,456,205 $1.44 $19.61
2 4 $11,176.0 $32,552.0 1,058 7,456,205 $1.44 $19.61
2 4 $4,497.0 $12,828.0 997 7,456,205 $1.44 $19.61
2 4 $5,174.0 $14,760.0 1,495 7,456,205 $1.44 $19.61
2 4 $11,788.0 $29,756.0 281 7,456,205 $1.44 $19.61
2 4 $2,393.0 $5,968.0 301 7,456,205 $1.44 $19.61
2 4 $4,478.0 $10,812.0 370 7,456,205 $1.44 $19.61
2 4 $3,799.0 $8,965.0 384 7,456,205 $1.44 $19.61
2 4 $49,142.0 $114,025.0 1,452 7,456,205 $1.44 $19.61
2 4 $44,446.0 $95,420.0 1,987 7,456,205 $1.44 $19.61
2 4 $15,938.0 $22,970.0 91 7,456,205 $1.44 $19.61
2 4 $9,135.0 $12,156.0 807 7,456,205 $1.44 $19.61
2 4 $9,905.0 $13,820.0 210 7,456,205 $1.44 $19.61
2 4 ($30,934.0) ($39,643.0) 4 7,456,205 $1.44 $19.61
2 4 $6,964.0 $8,482.0 2 7,456,205 $1.44 $19.61
2 4 $11,812.0 $13,243.0 71 7,456,205 $1.44 $19.61
3 9 $380.0 $18,634.0 497 7,456,205 $1.35 $20.21
3 9 $66.0 $3,224.0 86 7,456,205 $1.35 $20.21
3 9 $1,085.0 $53,165.0 1,418 7,456,205 $1.35 $20.21
3 9 $295.0 $16,402.0 386 7,456,205 $1.35 $20.21
3 9 $674.0 $33,031.0 881 7,456,205 $1.35 $20.21
3 9 $2,368.0 $109,593.0 3,095 7,456,205 $1.35 $20.21
3 9 $7,231.0 $334,621.0 9,450 7,456,205 $1.35 $20.21
3 9 $210.0 $9,192.0 274 7,456,205 $1.35 $20.21
3 9 $402.0 $15,239.0 526 7,456,205 $1.35 $20.21
3 9 $12,617.0 $328,446.0 16,490 7,456,205 $1.35 $20.21
3 9 $1,348.0 $32,093.0 1,756 7,456,205 $1.35 $20.21
3 9 $6,490.0 $146,113.0 8,482 7,456,205 $1.35 $20.21
3 9 $8,145.0 $169,621.0 9,327 7,456,205 $1.35 $20.21
3 9 $11,765.0 $233,333.0 12,258 7,456,205 $1.35 $20.21
3 9 $5,464.0 $105,854.0 6,531 7,456,205 $1.35 $20.21
3 9 $7,657.0 $138,652.0 7,176 7,456,205 $1.35 $20.21
3 9 $3,967.0 $67,435.0 3,252 7,456,205 $1.35 $20.21
3 9 $379.0 $6,190.0 364 7,456,205 $1.35 $20.21
3 9 $1,888.0 $29,679.0 2,335 7,456,205 $1.35 $20.21
3 9 $17,611.0 $266,728.0 35,905 7,456,205 $1.35 $20.21
3 9 $17,251.0 $252,103.0 5,486 7,456,205 $1.35 $20.21
3 9 $3,578.0 $51,394.0 2,341 7,456,205 $1.35 $20.21
Case No. U-17273 Witness: J.C. Hoffman Malueg
Exhibit A-6 (JCHM-1) Schedule F1.11
Page 6 of 20

Michigan Gas Utilities Corporation
Account 376: Distribution Gas Mains Regression Analysis
Historical Year Ending December 31, 2012
Summarized Input Data
MATERIAL SIZE SQSIZE COST HWICOST QTY TOTQTY UCOST UHWICOSTSTEEL 3 9 $17,725.0 $246,086.0 8,105 7,456,205 $1.35 $20.21
3 9 $2,951.0 $39,642.0 2,232 7,456,205 $1.35 $20.21
3 9 $512.0 $6,667.0 463 7,456,205 $1.35 $20.21
3 9 $1,741.0 $15,108.0 536 7,456,205 $1.35 $20.21
3 9 $995.0 $2,840.0 287 7,456,205 $1.35 $20.21
3 9 $56,338.0 $130,724.0 1,665 7,456,205 $1.35 $20.21
4 16 $115.0 $5,624.0 150 7,456,205 $4.63 $48.71
4 16 $976.0 $47,840.0 1,276 7,456,205 $4.63 $48.71
4 16 $1,745.0 $85,521.0 2,281 7,456,205 $4.63 $48.71
4 16 $937.0 $45,890.0 1,224 7,456,205 $4.63 $48.71
4 16 $1,797.0 $88,032.0 2,348 7,456,205 $4.63 $48.71
4 16 $5.0 $248.0 7 7,456,205 $4.63 $48.71
4 16 $941.0 $43,553.0 1,230 7,456,205 $4.63 $48.71
4 16 $3,965.0 $183,493.0 5,182 7,456,205 $4.63 $48.71
4 16 $1,125.0 $52,052.0 1,470 7,456,205 $4.63 $48.71
4 16 $631.0 $27,675.0 825 7,456,205 $4.63 $48.71
4 16 $2.0 $101.0 3 7,456,205 $4.63 $48.71
4 16 $1,797.0 $68,025.0 2,348 7,456,205 $4.63 $48.71
4 16 $216.0 $6,198.0 282 7,456,205 $4.63 $48.71
4 16 $18,348.0 $477,609.0 23,971 7,456,205 $4.63 $48.71
4 16 $12,588.0 $299,602.0 16,452 7,456,205 $4.63 $48.71
4 16 $56,121.0 $1,263,478.0 73,346 7,456,205 $4.63 $48.71
4 16 $88,055.0 $1,833,751.0 114,313 7,456,205 $4.63 $48.71
4 16 $234,555.0 $4,652,011.0 91,010 7,456,205 $4.63 $48.71
4 16 $99,753.0 $1,932,417.0 44,539 7,456,205 $4.63 $48.71
4 16 $324,433.0 $5,875,058.0 113,111 7,456,205 $4.63 $48.71
4 16 $200,463.0 $3,407,878.0 60,876 7,456,205 $4.63 $48.71
4 16 $263,673.0 $4,306,660.0 93,633 7,456,205 $4.63 $48.71
4 16 $174,951.0 $2,749,703.0 80,129 7,456,205 $4.63 $48.71
4 16 $526,866.0 $7,979,627.0 396,420 7,456,205 $4.63 $48.71
4 16 $1,816,963.0 $26,553,163.0 215,566 7,456,205 $4.63 $48.71
4 16 $282,716.0 $4,060,389.0 68,511 7,456,205 $4.63 $48.71
4 16 $271,695.0 $3,772,039.0 45,955 7,456,205 $4.63 $48.71
4 16 $406,858.0 $5,466,330.0 114,009 7,456,205 $4.63 $48.71
4 16 $507,739.0 $6,608,536.0 169,763 7,456,205 $4.63 $48.71
4 16 $528,671.0 $6,775,123.0 89,366 7,456,205 $4.63 $48.71
4 16 $792,776.0 $9,570,758.0 273,172 7,456,205 $4.63 $48.71
4 16 $749,112.0 $8,666,814.0 157,095 7,456,205 $4.63 $48.71
4 16 $304,933.0 $3,256,526.0 70,322 7,456,205 $4.63 $48.71
4 16 $402,839.0 $4,042,947.0 39,717 7,456,205 $4.63 $48.71
4 16 $199,634.0 $1,827,417.0 23,342 7,456,205 $4.63 $48.71
4 16 $148,567.0 $1,289,132.0 16,746 7,456,205 $4.63 $48.71
4 16 $26,452.0 $220,344.0 11,522 7,456,205 $4.63 $48.71
4 16 $44,359.0 $321,312.0 3,275 7,456,205 $4.63 $48.71
4 16 $3,137.0 $20,573.0 340 7,456,205 $4.63 $48.71
4 16 $5,871.0 $35,959.0 632 7,456,205 $4.63 $48.71
4 16 $29,596.0 $168,861.0 2,884 7,456,205 $4.63 $48.71
4 16 $243,423.0 $1,259,450.0 25,920 7,456,205 $4.63 $48.71
4 16 $85,156.0 $407,671.0 7,368 7,456,205 $4.63 $48.71
4 16 $64,135.0 $285,694.0 18,933 7,456,205 $4.63 $48.71
4 16 $92,875.0 $373,743.0 6,173 7,456,205 $4.63 $48.71
4 16 $70,197.0 $258,735.0 4,749 7,456,205 $4.63 $48.71
4 16 $2,370.0 $8,438.0 96 7,456,205 $4.63 $48.71
4 16 $56,299.0 $192,992.0 4,757 7,456,205 $4.63 $48.71
4 16 $2,455.0 $8,417.0 144 7,456,205 $4.63 $48.71
4 16 $42,549.0 $151,465.0 3,036 7,456,205 $4.63 $48.71
4 16 $234,023.0 $802,226.0 2,511 7,456,205 $4.63 $48.71
Case No. U-17273 Witness: J.C. Hoffman Malueg
Exhibit A-6 (JCHM-1) Schedule F1.11
Page 7 of 20

Michigan Gas Utilities Corporation
Account 376: Distribution Gas Mains Regression Analysis
Historical Year Ending December 31, 2012
Summarized Input Data
MATERIAL SIZE SQSIZE COST HWICOST QTY TOTQTY UCOST UHWICOSTSTEEL 4 16 $5,490.0 $17,390.0 961 7,456,205 $4.63 $48.71
4 16 $95,356.0 $288,841.0 19,008 7,456,205 $4.63 $48.71
4 16 $25,878.0 $76,986.0 547 7,456,205 $4.63 $48.71
4 16 $30,701.0 $89,418.0 1,235 7,456,205 $4.63 $48.71
4 16 $59,965.0 $171,065.0 4,447 7,456,205 $4.63 $48.71
4 16 $49,801.0 $142,069.0 5,335 7,456,205 $4.63 $48.71
4 16 $14,028.0 $36,630.0 862 7,456,205 $4.63 $48.71
4 16 $136,187.0 $343,770.0 1,204 7,456,205 $4.63 $48.71
4 16 $85,681.0 $213,691.0 3,495 7,456,205 $4.63 $48.71
4 16 $95,622.0 $230,879.0 4,040 7,456,205 $4.63 $48.71
4 16 $23,795.0 $56,152.0 3,882 7,456,205 $4.63 $48.71
4 16 $17,789.0 $41,276.0 195 7,456,205 $4.63 $48.71
4 16 $64,715.0 $141,861.0 1,071 7,456,205 $4.63 $48.71
4 16 $16,738.0 $35,936.0 276 7,456,205 $4.63 $48.71
4 16 $8,873.0 $18,712.0 147 7,456,205 $4.63 $48.71
4 16 $43,523.0 $77,800.0 1,262 7,456,205 $4.63 $48.71
4 16 $40,840.0 $58,857.0 358 7,456,205 $4.63 $48.71
4 16 $238,677.0 $317,601.0 3,649 7,456,205 $4.63 $48.71
4 16 $201,010.0 $280,472.0 4,834 7,456,205 $4.63 $48.71
4 16 $1,107,602.0 $1,525,013.0 29,582 7,456,205 $4.63 $48.71
4 16 $114,201.0 $146,353.0 1,707 7,456,205 $4.63 $48.71
4 16 $35,922.0 $43,748.0 238 7,456,205 $4.63 $48.71
4 16 $71,798.0 $80,495.0 1,400 7,456,205 $4.63 $48.71
6 36 $23,069.0 $1,067,586.0 27,181 7,456,205 $11.18 $73.20
6 36 $6,378.0 $166,035.0 8,336 7,456,205 $11.18 $73.20
6 36 $245.0 $5,827.0 320 7,456,205 $11.18 $73.20
6 36 $390.0 $8,785.0 510 7,456,205 $11.18 $73.20
6 36 $40,172.0 $836,578.0 51,749 7,456,205 $11.18 $73.20
6 36 $40,040.0 $794,127.0 8,344 7,456,205 $11.18 $73.20
6 36 $77,515.0 $1,501,633.0 18,534 7,456,205 $11.18 $73.20
6 36 $36,311.0 $657,541.0 6,807 7,456,205 $11.18 $73.20
6 36 $70,532.0 $1,199,046.0 11,566 7,456,205 $11.18 $73.20
6 36 $76,078.0 $1,242,609.0 14,620 7,456,205 $11.18 $73.20
6 36 $121,211.0 $1,905,068.0 29,978 7,456,205 $11.18 $73.20
6 36 $560,802.0 $8,493,597.0 223,580 7,456,205 $11.18 $73.20
6 36 $57,234.0 $822,002.0 7,490 7,456,205 $11.18 $73.20
6 36 $17,059.0 $236,832.0 1,560 7,456,205 $11.18 $73.20
6 36 $101,632.0 $1,322,809.0 18,347 7,456,205 $11.18 $73.20
6 36 $114,705.0 $1,469,990.0 10,470 7,456,205 $11.18 $73.20
6 36 $44,923.0 $542,328.0 8,359 7,456,205 $11.18 $73.20
6 36 $80,718.0 $933,865.0 9,143 7,456,205 $11.18 $73.20
6 36 $54,695.0 $584,116.0 6,786 7,456,205 $11.18 $73.20
6 36 $43,987.0 $441,460.0 2,342 7,456,205 $11.18 $73.20
6 36 $135,419.0 $1,175,038.0 8,335 7,456,205 $11.18 $73.20
6 36 $168,959.0 $1,407,428.0 40,416 7,456,205 $11.18 $73.20
6 36 $631.0 $4,567.0 25 7,456,205 $11.18 $73.20
6 36 $25,854.0 $169,579.0 1,514 7,456,205 $11.18 $73.20
6 36 $53,254.0 $326,183.0 3,092 7,456,205 $11.18 $73.20
6 36 $94,943.0 $541,695.0 4,824 7,456,205 $11.18 $73.20
6 36 $142,024.0 $734,820.0 8,166 7,456,205 $11.18 $73.20
6 36 $356,713.0 $1,707,710.0 16,662 7,456,205 $11.18 $73.20
6 36 $28,311.0 $126,112.0 4,513 7,456,205 $11.18 $73.20
6 36 $312,256.0 $1,256,567.0 11,204 7,456,205 $11.18 $73.20
6 36 $324,262.0 $1,195,178.0 11,846 7,456,205 $11.18 $73.20
6 36 $106,467.0 $379,005.0 2,332 7,456,205 $11.18 $73.20
6 36 $101,697.0 $348,615.0 4,682 7,456,205 $11.18 $73.20
6 36 $112,828.0 $386,771.0 3,591 7,456,205 $11.18 $73.20
Case No. U-17273 Witness: J.C. Hoffman Malueg
Exhibit A-6 (JCHM-1) Schedule F1.11
Page 8 of 20

Michigan Gas Utilities Corporation
Account 376: Distribution Gas Mains Regression Analysis
Historical Year Ending December 31, 2012
Summarized Input Data
MATERIAL SIZE SQSIZE COST HWICOST QTY TOTQTY UCOST UHWICOSTSTEEL 8 6 36 $331,902.0 $1,181,514.0 12,789 7,456,205 $11.18 $73.20
6 36 $70,200.0 $222,345.0 4,556 7,456,205 $11.18 $73.20
6 36 $13,545.0 $41,028.0 1,458 7,456,205 $11.18 $73.20
6 36 $35,268.0 $104,921.0 403 7,456,205 $11.18 $73.20
6 36 $34,030.0 $99,116.0 739 7,456,205 $11.18 $73.20
6 36 $108,512.0 $309,556.0 4,346 7,456,205 $11.18 $73.20
6 36 $85,239.0 $243,164.0 4,931 7,456,205 $11.18 $73.20
6 36 $650,751.0 $1,699,297.0 21,554 7,456,205 $11.18 $73.20
6 36 $92,502.0 $233,497.0 442 7,456,205 $11.18 $73.20
6 36 $56,874.0 $141,844.0 1,434 7,456,205 $11.18 $73.20
6 36 $361,382.0 $872,553.0 5,965 7,456,205 $11.18 $73.20
6 36 $146,864.0 $346,565.0 2,938 7,456,205 $11.18 $73.20
6 36 $641,589.0 $1,377,432.0 5,784 7,456,205 $11.18 $73.20
6 36 $411,880.0 $855,600.0 597 7,456,205 $11.18 $73.20
6 36 $23,593.0 $42,174.0 296 7,456,205 $11.18 $73.20
6 36 $24,526.0 $32,636.0 2 7,456,205 $11.18 $73.20
6 36 $114,740.0 $160,098.0 727 7,456,205 $11.18 $73.20
6 36 $179,344.0 $229,836.0 2,340 7,456,205 $11.18 $73.20
6 36 $237,076.0 $288,719.0 2,856 7,456,205 $11.18 $73.20
6 36 $85,061.0 $95,364.0 1,191 7,456,205 $11.18 $73.20
8 64 $11,464.0 $207,595.0 2,149 7,456,205 $10.38 $68.22
8 64 $659.0 $10,356.0 163 7,456,205 $10.38 $68.22
8 64 $69,955.0 $1,059,500.0 28,526 7,456,205 $10.38 $68.22
8 64 $63,376.0 $926,183.0 4,031 7,456,205 $10.38 $68.22
8 64 $6,782.0 $86,910.0 619 7,456,205 $10.38 $68.22
8 64 $119,681.0 $1,444,844.0 22,269 7,456,205 $10.38 $68.22
8 64 $184.0 $2,131.0 21 7,456,205 $10.38 $68.22
8 64 $4,393.0 $46,918.0 545 7,456,205 $10.38 $68.22
8 64 $7,232.0 $72,579.0 385 7,456,205 $10.38 $68.22
8 64 $298.0 $2,731.0 18 7,456,205 $10.38 $68.22
8 64 $30,532.0 $264,927.0 1,879 7,456,205 $10.38 $68.22
8 64 $22,480.0 $162,833.0 896 7,456,205 $10.38 $68.22
0 64 $8,774.0 $53,742.0 509 7,456,205 $10.38 $68.22
8 64 $5,408.0 $27,983.0 311 7,456,205 $10.38 $68.22
8 64 $23,783.0 $113,856.0 1,111 7,456,205 $10.38 $68.22
8 64 $78,886.0 $270,420.0 2,511 7,456,205 $10.38 $68.22
8 64 $64,116.0 $228,241.0 2,471 7,456,205 $10.38 $68.22
8 64 $44,379.0 $129,257.0 964 7,456,205 $10.38 $68.22
8 64 $79,604.0 $200,941.0 380 7,456,205 $10.38 $68.22
8 64 $294,513.0 $632,291.0 2,774 7,456,205 $10.38 $68.22
8 64 $6,736.0 $8,204.0 9 7,456,205 $10.38 $68.22
10 100 $181.0 $1,569.0 11 7,456,205 $3.17 $39.39
10 100 $4,190.0 $16,861.0 150 7,456,205 $3.17 $39.39
$26,098,275.0 $254,739,361.0 7,381,860
$116,332,119.0 $431,644,983.0 17,968,991
Case No. U-17273 Witness: J.C. Hoffman Malueg
Exhibit A-6 (JCHM-1) Schedule F1.11
Page 9 of 20

Michigan Gas Utilities Corporation
Account 376: Distribution Gas Mains Regression Analysis
Historical Year Ending December 31, 2012
Relating Current Cost Per Foot to Pipe Diameter Squared
Eliminating Outliers
DEPENDENT VARIABLE: UHWICOST
SUM OF MEAN
SOURCE DF SQUARES SQUARE F VALUE PROB>F
MODEL 1 216342439.4 216,342,439 6,656 0.00
ERROR 173 5623245.346 32,504
C TOTAL 174 221965684.8
ROOT MSE 180.2895 R‐SQUARE 0.97470
DEP MEAN 16.7095 ADJ R‐SQ 0.9745
C.V. 1078.96436
PARAMETER STANDARD T FOR H0:
VARIABLE DF ESTIMATE ERROR PARAMETER=0 PROB > |T|
INTERCEP 1 10.320942 0.0959281 107.5900 0.0001
SQSIZE 1 0.745224 0.00913454 81.583 0.0001
‐‐‐‐‐‐‐‐‐‐‐‐‐‐‐‐‐‐‐‐‐‐‐‐‐‐‐‐‐‐‐‐‐‐‐‐‐‐‐‐‐‐‐‐‐‐‐‐‐‐‐‐‐‐‐‐‐ MATERIAL=PLASTIC ‐‐‐‐‐‐‐‐‐‐‐‐‐‐‐‐‐‐‐‐‐‐‐‐‐‐‐‐‐‐‐‐‐‐‐‐‐‐‐‐‐‐‐‐‐‐‐‐‐‐‐‐‐‐‐‐‐
DEP VAR PREDICT STD ERR STD ERR STUDENT COOK'S
OBS WEIGHT UHWICOST VALUE PREDICT RESIDUAL RESIDUAL RESIDUAL ‐2‐1‐0 1 2 D
1 1414 8.3417 10.7401 0.092 ‐2.3984 4.794 ‐0.5 | *| | 0
2 23 8.3417 10.7401 0.092 ‐2.3984 37.593 ‐0.064 | | | 0
3 170 8.3417 10.7401 0.092 ‐2.3984 13.827 ‐0.173 | | | 0
4 171 8.3417 10.7401 0.092 ‐2.3984 13.787 ‐0.174 | | | 0
5 1505 17.4687 11.0662 0.089 6.4026 4.646 1.378 | |** | 0
6 529 17.4687 11.0662 0.089 6.4026 7.838 0.817 | |* | 0
7 219 17.4687 11.0662 0.089 6.4026 12.183 0.526 | |* | 0
8 4172 17.4687 11.0662 0.089 6.4026 2.79 2.295 | |**** | 0.003
9 117 17.4687 11.0662 0.089 6.4026 16.668 0.384 | | | 0
10 1250 17.4687 11.0662 0.089 6.4026 5.099 1.256 | |** | 0
11 1308 17.4687 11.0662 0.089 6.4026 4.984 1.285 | |** | 0
12 207 17.4687 11.0662 0.089 6.4026 12.531 0.511 | |* | 0
13 834 17.4687 11.0662 0.089 6.4026 6.242 1.026 | |** | 0
14 106 17.4687 11.0662 0.089 6.4026 17.511 0.366 | | | 0
15 536 17.4687 11.0662 0.089 6.4026 7.787 0.822 | |* | 0
16 393 17.4687 11.0662 0.089 6.4026 9.094 0.704 | |* | 0
17 196 17.4687 11.0662 0.089 6.4026 12.878 0.497 | | | 0
18 550 17.4687 11.0662 0.089 6.4026 7.687 0.833 | |* | 0
19 1428 17.4687 11.0662 0.089 6.4026 4.77 1.342 | |** | 0
20 604 17.4687 11.0662 0.089 6.4026 7.335 0.873 | |* | 0
21 1741 17.4687 11.0662 0.089 6.4026 4.32 1.482 | |** | 0
22 81 17.4687 11.0662 0.089 6.4026 20.032 0.32 | | | 0
23 942 17.4687 11.0662 0.089 6.4026 5.873 1.09 | |** | 0
24 511 17.4687 11.0662 0.089 6.4026 7.975 0.803 | |* | 0
25 38 17.4687 11.0662 0.089 6.4026 29.247 0.219 | | | 0
26 1694 17.4687 11.0662 0.089 6.4026 4.38 1.462 | |** | 0
27 530 17.4687 11.0662 0.089 6.4026 7.831 0.818 | |* | 0
--------------------------------------------------------- MATERIAL=PLASTIC ---------------------------------------------------------
ANALYSIS OF VARIANCE
PARAMETER ESTIMATES
Case No. U-17273 Witness: J.C. Hoffman Malueg
Exhibit A-6 (JCHM-1) Schedule F1.11
Page 10 of 20

DEP VAR PREDICT STD ERR STD ERR STUDENT COOK'S
OBS WEIGHT UHWICOST VALUE PREDICT RESIDUAL RESIDUAL RESIDUAL ‐2‐1‐0 1 2 D
28 4987 18.1034 11.4854 0.085 6.618 2.552 2.594 | |***** | 0.004
29 2529 18.1034 11.4854 0.085 6.618 3.584 1.847 | |*** | 0.001
30 1703 18.1034 11.4854 0.085 6.618 4.368 1.515 | |*** | 0
31 264 18.1034 11.4854 0.085 6.618 11.096 0.596 | |* | 0
32 14118 18.1034 11.4854 0.085 6.618 1.515 4.368 | |******| 0.03
33 5206 18.1034 11.4854 0.085 6.618 2.497 2.65 | |***** | 0.004
34 489 18.1034 11.4854 0.085 6.618 8.153 0.812 | |* | 0
35 950 18.1034 11.4854 0.085 6.618 5.849 1.132 | |** | 0
36 1392 18.1034 11.4854 0.085 6.618 4.832 1.37 | |** | 0
37 767 18.1034 11.4854 0.085 6.618 6.509 1.017 | |** | 0
38 252 18.1034 11.4854 0.085 6.618 11.357 0.583 | |* | 0
39 390 18.1034 11.4854 0.085 6.618 9.129 0.725 | |* | 0
40 712 18.1034 11.4854 0.085 6.618 6.756 0.98 | |* | 0
41 1386 18.1034 11.4854 0.085 6.618 4.842 1.367 | |** | 0
42 124 18.1034 11.4854 0.085 6.618 16.19 0.409 | | | 0
43 613 18.1034 11.4854 0.085 6.618 7.281 0.909 | |* | 0
44 302 18.1034 11.4854 0.085 6.618 10.374 0.638 | |* | 0
45 65 18.1034 11.4854 0.085 6.618 22.362 0.296 | | | 0
46 148 18.1034 11.4854 0.085 6.618 14.819 0.447 | | | 0
47 1927 18.1034 11.4854 0.085 6.618 4.106 1.612 | |*** | 0.001
48 504 18.1034 11.4854 0.085 6.618 8.03 0.824 | |* | 0
49 1255 18.1034 11.4854 0.085 6.618 5.088 1.301 | |** | 0
50 10 13.1445 13.3018 0.069 ‐0.1574 57.013 ‐0.003 | | | 0
51 7 13.1445 13.3018 0.069 ‐0.1574 68.143 ‐0.002 | | | 0
52 22 13.1445 13.3018 0.069 ‐0.1574 38.438 ‐0.004 | | | 0
53 90885 13.1445 13.3018 0.069 ‐0.1574 0.594 ‐0.265 | | | 0
54 104 13.1445 13.3018 0.069 ‐0.1574 17.679 ‐0.009 | | | 0
55 36 13.1445 13.3018 0.069 ‐0.1574 30.048 ‐0.005 | | | 0
56 23 13.1445 13.3018 0.069 ‐0.1574 37.593 ‐0.004 | | | 0
57 31 13.1445 13.3018 0.069 ‐0.1574 32.381 ‐0.005 | | | 0
58 2670 13.1445 13.3018 0.069 ‐0.1574 3.488 ‐0.045 | | | 0
59 50 13.1445 13.3018 0.069 ‐0.1574 25.497 ‐0.006 | | | 0
60 1 13.1445 13.3018 0.069 ‐0.1574 180.289 ‐0.001 | | | 0
61 610 13.1445 13.3018 0.069 ‐0.1574 7.299 ‐0.022 | | | 0
62 1126 13.1445 13.3018 0.069 ‐0.1574 5.372 ‐0.029 | | | 0
63 292 13.1445 13.3018 0.069 ‐0.1574 10.55 ‐0.015 | | | 0
64 53 13.1445 13.3018 0.069 ‐0.1574 24.765 ‐0.006 | | | 0
65 670 13.1445 13.3018 0.069 ‐0.1574 6.965 ‐0.023 | | | 0
66 75102 13.1445 13.3018 0.069 ‐0.1574 0.654 ‐0.241 | | | 0
67 184935 13.1445 13.3018 0.069 ‐0.1574 0.413 ‐0.381 | | | 0.002
68 264655 13.1445 13.3018 0.069 ‐0.1574 0.344 ‐0.458 | | | 0.004
69 140655 13.1445 13.3018 0.069 ‐0.1574 0.476 ‐0.331 | | | 0.001
70 138386 13.1445 13.3018 0.069 ‐0.1574 0.48 ‐0.328 | | | 0.001
71 147099 13.1445 13.3018 0.069 ‐0.1574 0.465 ‐0.338 | | | 0.001
72 132503 13.1445 13.3018 0.069 ‐0.1574 0.49 ‐0.321 | | | 0.001
73 184368 13.1445 13.3018 0.069 ‐0.1574 0.414 ‐0.38 | | | 0.002
74 251165 13.1445 13.3018 0.069 ‐0.1574 0.353 ‐0.446 | | | 0.004
75 156437 13.1445 13.3018 0.069 ‐0.1574 0.451 ‐0.349 | | | 0.001
76 131830 13.1445 13.3018 0.069 ‐0.1574 0.492 ‐0.32 | | | 0.001
77 50008 13.1445 13.3018 0.069 ‐0.1574 0.803 ‐0.196 | | | 0
78 59272 13.1445 13.3018 0.069 ‐0.1574 0.737 ‐0.213 | | | 0
79 94199 13.1445 13.3018 0.069 ‐0.1574 0.583 ‐0.27 | | | 0.001
80 78577 13.1445 13.3018 0.069 ‐0.1574 0.639 ‐0.246 | | | 0
81 120364 13.1445 13.3018 0.069 ‐0.1574 0.515 ‐0.306 | | | 0.001
82 133948 13.1445 13.3018 0.069 ‐0.1574 0.488 ‐0.323 | | | 0.001
83 169286 13.1445 13.3018 0.069 ‐0.1574 0.433 ‐0.364 | | | 0.002
84 168549 13.1445 13.3018 0.069 ‐0.1574 0.434 ‐0.363 | | | 0.002
85 227226 13.1445 13.3018 0.069 ‐0.1574 0.372 ‐0.423 | | | 0.003
86 178710 13.1445 13.3018 0.069 ‐0.1574 0.421 ‐0.374 | | | 0.002
87 308712 13.1445 13.3018 0.069 ‐0.1574 0.317 ‐0.496 | | | 0.006
88 349154 13.1445 13.3018 0.069 ‐0.1574 0.297 ‐0.53 | *| | 0.008
89 203727 13.1445 13.3018 0.069 ‐0.1574 0.393 ‐0.4 | | | 0.002
90 157690 13.1445 13.3018 0.069 ‐0.1574 0.449 ‐0.351 | | | 0.001
Case No. U-17273 Witness: J.C. Hoffman Malueg
Exhibit A-6 (JCHM-1) Schedule F1.11
Page 11 of 20

DEP VAR PREDICT STD ERR STD ERR STUDENT COOK'S
OBS WEIGHT UHWICOST VALUE PREDICT RESIDUAL RESIDUAL RESIDUAL ‐2‐1‐0 1 2 D
91 192188 13.1445 13.3018 0.069 ‐0.1574 0.405 ‐0.388 | | | 0.002
92 224931 13.1445 13.3018 0.069 ‐0.1574 0.374 ‐0.421 | | | 0.003
93 172423 13.1445 13.3018 0.069 ‐0.1574 0.429 ‐0.367 | | | 0.002
94 199733 13.1445 13.3018 0.069 ‐0.1574 0.397 ‐0.396 | | | 0.002
95 198250 13.1445 13.3018 0.069 ‐0.1574 0.399 ‐0.394 | | | 0.002
96 162676 13.1445 13.3018 0.069 ‐0.1574 0.442 ‐0.356 | | | 0.002
97 103283 13.1445 13.3018 0.069 ‐0.1574 0.557 ‐0.283 | | | 0.001
98 151071 13.1445 13.3018 0.069 ‐0.1574 0.459 ‐0.343 | | | 0.001
99 171354 13.1445 13.3018 0.069 ‐0.1574 0.43 ‐0.366 | | | 0.002
100 172017 13.1445 13.3018 0.069 ‐0.1574 0.429 ‐0.367 | | | 0.002
101 177713 13.1445 13.3018 0.069 ‐0.1574 0.422 ‐0.373 | | | 0.002
102 132675 13.1445 13.3018 0.069 ‐0.1574 0.49 ‐0.321 | | | 0.001
103 73956 13.1445 13.3018 0.069 ‐0.1574 0.659 ‐0.239 | | | 0
104 63575 13.1445 13.3018 0.069 ‐0.1574 0.712 ‐0.221 | | | 0
105 84584 13.1445 13.3018 0.069 ‐0.1574 0.616 ‐0.255 | | | 0
106 57144 13.1445 13.3018 0.069 ‐0.1574 0.751 ‐0.21 | | | 0
107 9020 13.1445 13.3018 0.069 ‐0.1574 1.897 ‐0.083 | | | 0
108 33 6.1673 17.028 0.056 ‐10.8607 31.384 ‐0.346 | | | 0
109 29181 22.4937 22.2445 0.088 0.2492 1.052 0.237 | | | 0
110 119 22.4937 22.2445 0.088 0.2492 16.527 0.015 | | | 0
111 304 22.4937 22.2445 0.088 0.2492 10.34 0.024 | | | 0
112 174 22.4937 22.2445 0.088 0.2492 13.667 0.018 | | | 0
113 78 22.4937 22.2445 0.088 0.2492 20.414 0.012 | | | 0
114 83 22.4937 22.2445 0.088 0.2492 19.789 0.013 | | | 0
115 33 22.4937 22.2445 0.088 0.2492 31.384 0.008 | | | 0
116 9 22.4937 22.2445 0.088 0.2492 60.096 0.004 | | | 0
117 127 22.4937 22.2445 0.088 0.2492 15.998 0.016 | | | 0
118 15 22.4937 22.2445 0.088 0.2492 46.55 0.005 | | | 0
119 160 22.4937 22.2445 0.088 0.2492 14.253 0.017 | | | 0
120 1576 22.4937 22.2445 0.088 0.2492 4.541 0.055 | | | 0
121 55897 22.4937 22.2445 0.088 0.2492 0.758 0.329 | | | 0.001
122 114407 22.4937 22.2445 0.088 0.2492 0.526 0.474 | | | 0.003
123 80122 22.4937 22.2445 0.088 0.2492 0.631 0.395 | | | 0.002
124 35148 22.4937 22.2445 0.088 0.2492 0.958 0.26 | | | 0
125 66330 22.4937 22.2445 0.088 0.2492 0.695 0.359 | | | 0.001
126 49232 22.4937 22.2445 0.088 0.2492 0.808 0.308 | | | 0.001
127 91029 22.4937 22.2445 0.088 0.2492 0.591 0.422 | | | 0.002
128 120999 22.4937 22.2445 0.088 0.2492 0.511 0.488 | | | 0.003
129 162663 22.4937 22.2445 0.088 0.2492 0.438 0.568 | |* | 0.006
130 63532 22.4937 22.2445 0.088 0.2492 0.71 0.351 | | | 0.001
131 29759 22.4937 22.2445 0.088 0.2492 1.041 0.239 | | | 0
132 26670 22.4937 22.2445 0.088 0.2492 1.1 0.226 | | | 0
133 35441 22.4937 22.2445 0.088 0.2492 0.954 0.261 | | | 0
134 66649 22.4937 22.2445 0.088 0.2492 0.693 0.36 | | | 0.001
135 54646 22.4937 22.2445 0.088 0.2492 0.766 0.325 | | | 0.001
136 61206 22.4937 22.2445 0.088 0.2492 0.723 0.344 | | | 0.001
137 49326 22.4937 22.2445 0.088 0.2492 0.807 0.309 | | | 0.001
138 54804 22.4937 22.2445 0.088 0.2492 0.765 0.326 | | | 0.001
139 63419 22.4937 22.2445 0.088 0.2492 0.711 0.351 | | | 0.001
140 171820 22.4937 22.2445 0.088 0.2492 0.426 0.585 | |* | 0.007
141 325396 22.4937 22.2445 0.088 0.2492 0.304 0.821 | |* | 0.028
142 495208 22.4937 22.2445 0.088 0.2492 0.241 1.035 | |** | 0.071
143 120333 22.4937 22.2445 0.088 0.2492 0.512 0.486 | | | 0.003
144 179541 22.4937 22.2445 0.088 0.2492 0.416 0.598 | |* | 0.008
145 125679 22.4937 22.2445 0.088 0.2492 0.501 0.497 | | | 0.004
146 168701 22.4937 22.2445 0.088 0.2492 0.43 0.579 | |* | 0.007
147 114792 22.4937 22.2445 0.088 0.2492 0.525 0.475 | | | 0.003
148 81773 22.4937 22.2445 0.088 0.2492 0.624 0.399 | | | 0.002
149 140148 22.4937 22.2445 0.088 0.2492 0.474 0.526 | |* | 0.005
150 78135 22.4937 22.2445 0.088 0.2492 0.639 0.39 | | | 0.001
151 35395 22.4937 22.2445 0.088 0.2492 0.954 0.261 | | | 0
152 60054 22.4937 22.2445 0.088 0.2492 0.73 0.341 | | | 0.001
153 34824 22.4937 22.2445 0.088 0.2492 0.962 0.259 | | | 0
Case No. U-17273 Witness: J.C. Hoffman Malueg
Exhibit A-6 (JCHM-1) Schedule F1.11
Page 12 of 20

DEP VAR PREDICT STD ERR STD ERR STUDENT COOK'S
OBS WEIGHT UHWICOST VALUE PREDICT RESIDUAL RESIDUAL RESIDUAL ‐2‐1‐0 1 2 D
154 51784 22.4937 22.2445 0.088 0.2492 0.787 0.316 | | | 0.001
155 51555 22.4937 22.2445 0.088 0.2492 0.789 0.316 | | | 0.001
156 41555 22.4937 22.2445 0.088 0.2492 0.88 0.283 | | | 0
157 96168 22.4937 22.2445 0.088 0.2492 0.575 0.434 | | | 0.002
158 49360 22.4937 22.2445 0.088 0.2492 0.807 0.309 | | | 0.001
159 97656 22.4937 22.2445 0.088 0.2492 0.57 0.437 | | | 0.002
160 99727 22.4937 22.2445 0.088 0.2492 0.564 0.442 | | | 0.002
161 235 22.4937 22.2445 0.088 0.2492 11.76 0.021 | | | 0
162 4402 29.3948 37.149 0.257 ‐7.7542 2.705 ‐2.866 | *****| | 0.037
163 1263 29.3948 37.149 0.257 ‐7.7542 5.067 ‐1.53 | ***| | 0.003
164 1347 29.3948 37.149 0.257 ‐7.7542 4.906 ‐1.581 | ***| | 0.003
165 12311 29.3948 37.149 0.257 ‐7.7542 1.605 ‐4.833 |******| | 0.299
166 353 29.3948 37.149 0.257 ‐7.7542 9.592 ‐0.808 | *| | 0
167 7855 29.3948 37.149 0.257 ‐7.7542 2.018 ‐3.843 |******| | 0.119
168 1947 29.3948 37.149 0.257 ‐7.7542 4.078 ‐1.902 | ***| | 0.007
169 2639 29.3948 37.149 0.257 ‐7.7542 3.5 ‐2.215 | ****| | 0.013
170 6451 29.3948 37.149 0.257 ‐7.7542 2.23 ‐3.477 |******| | 0.08
171 1372 29.3948 37.149 0.257 ‐7.7542 4.861 ‐1.595 | ***| | 0.004
172 742 29.3948 37.149 0.257 ‐7.7542 6.614 ‐1.172 | **| | 0.001
173 1266 29.3948 37.149 0.257 ‐7.7542 5.061 ‐1.532 | ***| | 0.003
174 1051 29.3948 37.149 0.257 ‐7.7542 5.555 ‐1.396 | **| | 0.002
175 30 12.2753 58.0153 0.509 ‐45.74 32.912 ‐1.39 | **| | 0
SUM OF RESIDUALS 0
SUM OF SQUARED RESIDUALS 5623245.3462
PREDICTED RESID SS (PRESS) 5734054.0338
NOTE: THE ABOVE STATISTICS USE OBSERVATION WEIGHTS OR FREQUENCIES.
Case No. U-17273 Witness: J.C. Hoffman Malueg
Exhibit A-6 (JCHM-1) Schedule F1.11
Page 13 of 20

Michigan Gas Utilities Corporation
Account 376: Distribution Gas Mains Regression Analysis
Historical Year Ending December 31, 2012
Relating Current Cost Per Foot to Pipe Diameter Squared
Eliminating Outliers
‐‐‐‐‐‐‐‐‐‐‐‐‐‐‐‐‐‐‐‐‐‐‐‐‐‐‐‐‐‐‐‐‐‐‐‐‐‐‐‐‐‐‐‐‐‐‐‐‐‐‐‐‐‐‐‐‐‐ MATERIAL=STEEL ‐‐‐‐‐‐‐‐‐‐‐‐‐‐‐‐‐‐‐‐‐‐‐‐‐‐‐‐‐‐‐‐‐‐‐‐‐‐‐‐‐‐‐‐‐‐‐‐‐‐‐‐‐‐‐‐
DEPENDENT VARIABLE: UHWICOST
SUM OF MEAN
SOURCE DF SQUARES SQUARE F VALUE PROB>F
MODEL 1 2121128859 2,121,128,859 1,864 0.00
ERROR 319 363094262.5 1,138,227
C TOTAL 320 2484223121
ROOT MSE 1,066.8770 R‐SQUARE 0.85380
DEP MEAN 35.1744 ADJ R‐SQ 0.85340
C.V. 3,033.1029
PARAMETER STANDARD T FOR H0:
VARIABLE DF ESTIMATE ERROR PARAMETER=0 PROB > |T|
INTERCEP 1 16.856827 0.5781393 29.1570 0.0001
SQSIZE 1 1.557903 0.0360887 43.1690 0.0001
‐‐‐‐‐‐‐‐‐‐‐‐‐‐‐‐‐‐‐‐‐‐‐‐‐‐‐‐‐‐‐‐‐‐‐‐‐‐‐‐‐‐‐‐‐‐‐‐‐‐‐‐‐‐‐‐‐‐ MATERIAL=STEEL ‐‐‐‐‐‐‐‐‐‐‐‐‐‐‐‐‐‐‐‐‐‐‐‐‐‐‐‐‐‐‐‐‐‐‐‐‐‐‐‐‐‐‐‐‐‐‐‐‐‐‐‐‐‐‐‐
DEP VAR PREDICT STD ERR STD ERR STUDENT COOK'S
OBS WEIGHT UHWICOST VALUE PREDICT RESIDUAL RESIDUAL RESIDUAL ‐2‐1‐0 1 2 D
1 72 23.0718 17.7331 0.563 5.3387 125.731 0.042 | | | 0
2 304 23.0718 17.7331 0.563 5.3387 61.187 0.087 | | | 0
3 189 23.0718 17.7331 0.563 5.3387 77.602 0.069 | | | 0
4 613 23.0718 17.7331 0.563 5.3387 43.087 0.124 | | | 0
5 1026 23.0718 17.7331 0.563 5.3387 33.303 0.16 | | | 0
6 484 23.0718 17.7331 0.563 5.3387 48.491 0.11 | | | 0
7 8 23.0718 17.7331 0.563 5.3387 377.198 0.014 | | | 0
8 32 23.0718 17.7331 0.563 5.3387 188.598 0.028 | | | 0
9 92 23.0718 17.7331 0.563 5.3387 111.228 0.048 | | | 0
10 1081 26.2208 18.4147 0.552 7.8061 32.444 0.241 | | | 0
11 814 26.2208 18.4147 0.552 7.8061 37.39 0.209 | | | 0
12 852 26.2208 18.4147 0.552 7.8061 36.546 0.214 | | | 0
13 283 26.2208 18.4147 0.552 7.8061 63.417 0.123 | | | 0
14 1788 26.2208 18.4147 0.552 7.8061 25.225 0.309 | | | 0
15 1071 26.2208 18.4147 0.552 7.8061 32.595 0.239 | | | 0
16 75 26.2208 18.4147 0.552 7.8061 123.191 0.063 | | | 0
17 8 26.2208 18.4147 0.552 7.8061 377.198 0.021 | | | 0
18 487 26.2208 18.4147 0.552 7.8061 48.342 0.161 | | | 0
19 28 26.2208 18.4147 0.552 7.8061 201.62 0.039 | | | 0
20 40 26.2208 18.4147 0.552 7.8061 168.687 0.046 | | | 0
21 3917 26.2208 18.4147 0.552 7.8061 17.038 0.458 | | | 0
22 1383 26.2208 18.4147 0.552 7.8061 28.683 0.272 | | | 0
23 486 26.2208 18.4147 0.552 7.8061 48.391 0.161 | | | 0
24 3 26.2208 18.4147 0.552 7.8061 615.961 0.013 | | | 0
25 122 26.2208 18.4147 0.552 7.8061 96.589 0.081 | | | 0
26 518 26.2208 18.4147 0.552 7.8061 46.873 0.167 | | | 0
27 129 26.2208 18.4147 0.552 7.8061 93.932 0.083 | | | 0
28 121 26.2208 18.4147 0.552 7.8061 96.987 0.08 | | | 0
29 233 26.2208 18.4147 0.552 7.8061 69.891 0.112 | | | 0
ANALYSIS OF VARIANCE
PARAMETER ESTIMATES
Case No. U-17273 Witness: J.C. Hoffman Malueg
Exhibit A-6 (JCHM-1) Schedule F1.11
Page 14 of 20

‐‐‐‐‐‐‐‐‐‐‐‐‐‐‐‐‐‐‐‐‐‐‐‐‐‐‐‐‐‐‐‐‐‐‐‐‐‐‐‐‐‐‐‐‐‐‐‐‐‐‐‐‐‐‐‐‐‐ MATERIAL=STEEL ‐‐‐‐‐‐‐‐‐‐‐‐‐‐‐‐‐‐‐‐‐‐‐‐‐‐‐‐‐‐‐‐‐‐‐‐‐‐‐‐‐‐‐‐‐‐‐‐‐‐‐‐‐‐‐‐
DEP VAR PREDICT STD ERR STD ERR STUDENT COOK'S
OBS WEIGHT UHWICOST VALUE PREDICT RESIDUAL RESIDUAL RESIDUAL ‐2‐1‐0 1 2 D
30 270 26.2208 18.4147 0.552 7.8061 64.926 0.12 | | | 0
31 290 26.2208 18.4147 0.552 7.8061 62.647 0.125 | | | 0
32 423 26.2208 18.4147 0.552 7.8061 51.87 0.15 | | | 0
33 919 26.2208 18.4147 0.552 7.8061 35.189 0.222 | | | 0
34 749 26.2208 18.4147 0.552 7.8061 38.979 0.2 | | | 0
35 153 26.2208 18.4147 0.552 7.8061 86.25 0.091 | | | 0
36 115 26.2208 18.4147 0.552 7.8061 99.485 0.078 | | | 0
37 130 26.2208 18.4147 0.552 7.8061 93.57 0.083 | | | 0
38 31 26.2208 18.4147 0.552 7.8061 191.616 0.041 | | | 0
39 95 26.2208 18.4147 0.552 7.8061 109.458 0.071 | | | 0
40 190 28.8154 19.2911 0.538 9.5244 77.398 0.123 | | | 0
41 781 28.8154 19.2911 0.538 9.5244 38.172 0.25 | | | 0
42 596 28.8154 19.2911 0.538 9.5244 43.698 0.218 | | | 0
43 8 28.8154 19.2911 0.538 9.5244 377.198 0.025 | | | 0
44 1389 28.8154 19.2911 0.538 9.5244 28.621 0.333 | | | 0
45 2193 28.8154 19.2911 0.538 9.5244 22.776 0.418 | | | 0
46 429 28.8154 19.2911 0.538 9.5244 51.506 0.185 | | | 0
47 827 28.8154 19.2911 0.538 9.5244 37.095 0.257 | | | 0
48 341 28.8154 19.2911 0.538 9.5244 57.772 0.165 | | | 0
49 206 28.8154 19.2911 0.538 9.5244 74.331 0.128 | | | 0
50 1318 28.8154 19.2911 0.538 9.5244 29.382 0.324 | | | 0
51 238 28.8154 19.2911 0.538 9.5244 69.153 0.138 | | | 0
52 956 28.8154 19.2911 0.538 9.5244 34.501 0.276 | | | 0
53 176 28.8154 19.2911 0.538 9.5244 80.417 0.118 | | | 0
54 652 28.8154 19.2911 0.538 9.5244 41.779 0.228 | | | 0
55 741 28.8154 19.2911 0.538 9.5244 39.189 0.243 | | | 0
56 17 28.8154 19.2911 0.538 9.5244 258.755 0.037 | | | 0
57 229 28.8154 19.2911 0.538 9.5244 70.499 0.135 | | | 0
58 210 28.8154 19.2911 0.538 9.5244 73.62 0.129 | | | 0
59 1066 28.8154 19.2911 0.538 9.5244 32.672 0.292 | | | 0
60 720 28.8154 19.2911 0.538 9.5244 39.757 0.24 | | | 0
61 388 28.8154 19.2911 0.538 9.5244 54.16 0.176 | | | 0
62 1015 28.8154 19.2911 0.538 9.5244 33.483 0.284 | | | 0
63 2219 28.8154 19.2911 0.538 9.5244 22.642 0.421 | | | 0
64 3326 28.8154 19.2911 0.538 9.5244 18.491 0.515 | |* | 0
65 403 28.8154 19.2911 0.538 9.5244 53.142 0.179 | | | 0
66 238 28.8154 19.2911 0.538 9.5244 69.153 0.138 | | | 0
67 820 28.8154 19.2911 0.538 9.5244 37.253 0.256 | | | 0
68 73 28.8154 19.2911 0.538 9.5244 124.867 0.076 | | | 0
69 105 28.8154 19.2911 0.538 9.5244 104.115 0.091 | | | 0
70 100 28.8154 19.2911 0.538 9.5244 106.686 0.089 | | | 0
71 3 28.8154 19.2911 0.538 9.5244 615.961 0.015 | | | 0
72 72 28.8154 19.2911 0.538 9.5244 125.732 0.076 | | | 0
73 60 28.8154 19.2911 0.538 9.5244 137.732 0.069 | | | 0
74 588 28.8154 19.2911 0.538 9.5244 43.994 0.216 | | | 0
75 118 28.8154 19.2911 0.538 9.5244 98.213 0.097 | | | 0
76 66 28.8154 19.2911 0.538 9.5244 131.322 0.073 | | | 0
77 33 19.6418 20.3621 0.521 ‐0.7203 185.719 ‐0.004 | | | 0
78 119 19.6418 20.3621 0.521 ‐0.7203 97.799 ‐0.007 | | | 0
79 139 19.611 23.0884 0.482 ‐3.4775 90.49 ‐0.038 | | | 0
80 574 19.611 23.0884 0.482 ‐3.4775 44.528 ‐0.078 | | | 0
81 48 19.611 23.0884 0.482 ‐3.4775 153.99 ‐0.023 | | | 0
82 356 19.611 23.0884 0.482 ‐3.4775 56.542 ‐0.062 | | | 0
83 909 19.611 23.0884 0.482 ‐3.4775 35.383 ‐0.098 | | | 0
84 815 19.611 23.0884 0.482 ‐3.4775 37.368 ‐0.093 | | | 0
85 2196 19.611 23.0884 0.482 ‐3.4775 22.761 ‐0.153 | | | 0
86 1140 19.611 23.0884 0.482 ‐3.4775 31.594 ‐0.11 | | | 0
87 7124 19.611 23.0884 0.482 ‐3.4775 12.631 ‐0.275 | | | 0
88 1374 19.611 23.0884 0.482 ‐3.4775 28.778 ‐0.121 | | | 0
89 554 19.611 23.0884 0.482 ‐3.4775 45.325 ‐0.077 | | | 0
90 3004 19.611 23.0884 0.482 ‐3.4775 19.459 ‐0.179 | | | 0
91 3385 19.611 23.0884 0.482 ‐3.4775 18.331 ‐0.19 | | | 0
92 20663 19.611 23.0884 0.482 ‐3.4775 7.406 ‐0.47 | | | 0
93 9164 19.611 23.0884 0.482 ‐3.4775 11.134 ‐0.312 | | | 0
Case No. U-17273 Witness: J.C. Hoffman Malueg
Exhibit A-6 (JCHM-1) Schedule F1.11
Page 15 of 20

‐‐‐‐‐‐‐‐‐‐‐‐‐‐‐‐‐‐‐‐‐‐‐‐‐‐‐‐‐‐‐‐‐‐‐‐‐‐‐‐‐‐‐‐‐‐‐‐‐‐‐‐‐‐‐‐‐‐ MATERIAL=STEEL ‐‐‐‐‐‐‐‐‐‐‐‐‐‐‐‐‐‐‐‐‐‐‐‐‐‐‐‐‐‐‐‐‐‐‐‐‐‐‐‐‐‐‐‐‐‐‐‐‐‐‐‐‐‐‐‐
DEP VAR PREDICT STD ERR STD ERR STUDENT COOK'S
OBS WEIGHT UHWICOST VALUE PREDICT RESIDUAL RESIDUAL RESIDUAL ‐2‐1‐0 1 2 D
94 73911 19.611 23.0884 0.482 ‐3.4775 3.895 ‐0.893 | *| | 0.006
95 67916 19.611 23.0884 0.482 ‐3.4775 4.065 ‐0.855 | *| | 0.005
96 58394 19.611 23.0884 0.482 ‐3.4775 4.389 ‐0.792 | *| | 0.004
97 127756 19.611 23.0884 0.482 ‐3.4775 2.946 ‐1.181 | **| | 0.019
98 85013 19.611 23.0884 0.482 ‐3.4775 3.627 ‐0.959 | *| | 0.008
99 111976 19.611 23.0884 0.482 ‐3.4775 3.152 ‐1.103 | **| | 0.014
100 130832 19.611 23.0884 0.482 ‐3.4775 2.91 ‐1.195 | **| | 0.02
101 152849 19.611 23.0884 0.482 ‐3.4775 2.686 ‐1.295 | **| | 0.027
102 836584 19.611 23.0884 0.482 ‐3.4775 1.062 ‐3.274 |******| | 1.105
103 412603 19.611 23.0884 0.482 ‐3.4775 1.589 ‐2.188 | ****| | 0.22
104 123475 19.611 23.0884 0.482 ‐3.4775 2.998 ‐1.16 | **| | 0.017
105 139047 19.611 23.0884 0.482 ‐3.4775 2.82 ‐1.233 | **| | 0.022
106 199445 19.611 23.0884 0.482 ‐3.4775 2.34 ‐1.486 | **| | 0.047
107 274544 19.611 23.0884 0.482 ‐3.4775 1.978 ‐1.758 | ***| | 0.092
108 238647 19.611 23.0884 0.482 ‐3.4775 2.13 ‐1.633 | ***| | 0.068
109 289645 19.611 23.0884 0.482 ‐3.4775 1.923 ‐1.809 | ***| | 0.103
110 296937 19.611 23.0884 0.482 ‐3.4775 1.898 ‐1.833 | ***| | 0.108
111 113606 19.611 23.0884 0.482 ‐3.4775 3.128 ‐1.112 | **| | 0.015
112 41937 19.611 23.0884 0.482 ‐3.4775 5.187 ‐0.67 | *| | 0.002
113 6865 19.611 23.0884 0.482 ‐3.4775 12.867 ‐0.27 | | | 0
114 8246 19.611 23.0884 0.482 ‐3.4775 11.739 ‐0.296 | | | 0
115 3868 19.611 23.0884 0.482 ‐3.4775 17.147 ‐0.203 | | | 0
116 616 19.611 23.0884 0.482 ‐3.4775 42.983 ‐0.081 | | | 0
117 1956 19.611 23.0884 0.482 ‐3.4775 24.118 ‐0.144 | | | 0
118 453 19.611 23.0884 0.482 ‐3.4775 50.124 ‐0.069 | | | 0
119 2248 19.611 23.0884 0.482 ‐3.4775 22.497 ‐0.155 | | | 0
120 5062 19.611 23.0884 0.482 ‐3.4775 14.987 ‐0.232 | | | 0
121 855 19.611 23.0884 0.482 ‐3.4775 36.483 ‐0.095 | | | 0
122 268 19.611 23.0884 0.482 ‐3.4775 65.168 ‐0.053 | | | 0
123 295 19.611 23.0884 0.482 ‐3.4775 62.114 ‐0.056 | | | 0
124 456 19.611 23.0884 0.482 ‐3.4775 49.959 ‐0.07 | | | 0
125 1613 19.611 23.0884 0.482 ‐3.4775 26.56 ‐0.131 | | | 0
126 413 19.611 23.0884 0.482 ‐3.4775 52.495 ‐0.066 | | | 0
127 1168 19.611 23.0884 0.482 ‐3.4775 31.213 ‐0.111 | | | 0
128 1058 19.611 23.0884 0.482 ‐3.4775 32.796 ‐0.106 | | | 0
129 997 19.611 23.0884 0.482 ‐3.4775 33.785 ‐0.103 | | | 0
130 1495 19.611 23.0884 0.482 ‐3.4775 27.588 ‐0.126 | | | 0
131 281 19.611 23.0884 0.482 ‐3.4775 63.643 ‐0.055 | | | 0
132 301 19.611 23.0884 0.482 ‐3.4775 61.492 ‐0.057 | | | 0
133 370 19.611 23.0884 0.482 ‐3.4775 55.462 ‐0.063 | | | 0
134 384 19.611 23.0884 0.482 ‐3.4775 54.442 ‐0.064 | | | 0
135 1452 19.611 23.0884 0.482 ‐3.4775 27.994 ‐0.124 | | | 0
136 1987 19.611 23.0884 0.482 ‐3.4775 23.929 ‐0.145 | | | 0
137 91 19.611 23.0884 0.482 ‐3.4775 111.838 ‐0.031 | | | 0
138 807 19.611 23.0884 0.482 ‐3.4775 37.553 ‐0.093 | | | 0
139 210 19.611 23.0884 0.482 ‐3.4775 73.62 ‐0.047 | | | 0
140 4 19.611 23.0884 0.482 ‐3.4775 533.438 ‐0.007 | | | 0
141 2 19.611 23.0884 0.482 ‐3.4775 754.396 ‐0.005 | | | 0
142 71 19.611 23.0884 0.482 ‐3.4775 126.614 ‐0.027 | | | 0
143 497 20.2099 30.878 0.405 ‐10.668 47.854 ‐0.223 | | | 0
144 86 20.2099 30.878 0.405 ‐10.668 115.044 ‐0.093 | | | 0
145 1418 20.2099 30.878 0.405 ‐10.668 28.329 ‐0.377 | | | 0
146 386 20.2099 30.878 0.405 ‐10.668 54.301 ‐0.196 | | | 0
147 881 20.2099 30.878 0.405 ‐10.668 35.942 ‐0.297 | | | 0
148 3095 20.2099 30.878 0.405 ‐10.668 19.173 ‐0.556 | *| | 0
149 9450 20.2099 30.878 0.405 ‐10.668 10.967 ‐0.973 | *| | 0.001
150 274 20.2099 30.878 0.405 ‐10.668 64.451 ‐0.166 | | | 0
151 526 20.2099 30.878 0.405 ‐10.668 46.516 ‐0.229 | | | 0
152 16490 20.2099 30.878 0.405 ‐10.668 8.298 ‐1.286 | **| | 0.002
153 1756 20.2099 30.878 0.405 ‐10.668 25.456 ‐0.419 | | | 0
154 8482 20.2099 30.878 0.405 ‐10.668 11.577 ‐0.921 | *| | 0.001
155 9327 20.2099 30.878 0.405 ‐10.668 11.04 ‐0.966 | *| | 0.001
156 12258 20.2099 30.878 0.405 ‐10.668 9.628 ‐1.108 | **| | 0.001
157 6531 20.2099 30.878 0.405 ‐10.668 13.195 ‐0.808 | *| | 0
Case No. U-17273 Witness: J.C. Hoffman Malueg
Exhibit A-6 (JCHM-1) Schedule F1.11
Page 16 of 20

‐‐‐‐‐‐‐‐‐‐‐‐‐‐‐‐‐‐‐‐‐‐‐‐‐‐‐‐‐‐‐‐‐‐‐‐‐‐‐‐‐‐‐‐‐‐‐‐‐‐‐‐‐‐‐‐‐‐ MATERIAL=STEEL ‐‐‐‐‐‐‐‐‐‐‐‐‐‐‐‐‐‐‐‐‐‐‐‐‐‐‐‐‐‐‐‐‐‐‐‐‐‐‐‐‐‐‐‐‐‐‐‐‐‐‐‐‐‐‐‐
DEP VAR PREDICT STD ERR STD ERR STUDENT COOK'S
OBS WEIGHT UHWICOST VALUE PREDICT RESIDUAL RESIDUAL RESIDUAL ‐2‐1‐0 1 2 D
158 7176 20.2099 30.878 0.405 ‐10.668 12.588 ‐0.847 | *| | 0
159 3252 20.2099 30.878 0.405 ‐10.668 18.704 ‐0.57 | *| | 0
160 364 20.2099 30.878 0.405 ‐10.668 55.918 ‐0.191 | | | 0
161 2335 20.2099 30.878 0.405 ‐10.668 22.075 ‐0.483 | | | 0
162 35905 20.2099 30.878 0.405 ‐10.668 5.616 ‐1.9 | ***| | 0.009
163 5486 20.2099 30.878 0.405 ‐10.668 14.398 ‐0.741 | *| | 0
164 2341 20.2099 30.878 0.405 ‐10.668 22.047 ‐0.484 | | | 0
165 8105 20.2099 30.878 0.405 ‐10.668 11.844 ‐0.901 | *| | 0
166 2232 20.2099 30.878 0.405 ‐10.668 22.579 ‐0.472 | | | 0
167 463 20.2099 30.878 0.405 ‐10.668 49.58 ‐0.215 | | | 0
168 536 20.2099 30.878 0.405 ‐10.668 46.08 ‐0.232 | | | 0
169 287 20.2099 30.878 0.405 ‐10.668 62.974 ‐0.169 | | | 0
170 1665 20.2099 30.878 0.405 ‐10.668 26.143 ‐0.408 | | | 0
171 150 48.7149 41.7833 0.421 6.9316 87.109 0.08 | | | 0
172 1276 48.7149 41.7833 0.421 6.9316 29.864 0.232 | | | 0
173 2281 48.7149 41.7833 0.421 6.9316 22.334 0.31 | | | 0
174 1224 48.7149 41.7833 0.421 6.9316 30.492 0.227 | | | 0
175 2348 48.7149 41.7833 0.421 6.9316 22.013 0.315 | | | 0
176 7 48.7149 41.7833 0.421 6.9316 403.241 0.017 | | | 0
177 1230 48.7149 41.7833 0.421 6.9316 30.417 0.228 | | | 0
178 5182 48.7149 41.7833 0.421 6.9316 14.815 0.468 | | | 0
179 1470 48.7149 41.7833 0.421 6.9316 27.823 0.249 | | | 0
180 825 48.7149 41.7833 0.421 6.9316 37.141 0.187 | | | 0
181 3 48.7149 41.7833 0.421 6.9316 615.962 0.011 | | | 0
182 2348 48.7149 41.7833 0.421 6.9316 22.013 0.315 | | | 0
183 282 48.7149 41.7833 0.421 6.9316 63.53 0.109 | | | 0
184 23971 48.7149 41.7833 0.421 6.9316 6.878 1.008 | |** | 0.002
185 16452 48.7149 41.7833 0.421 6.9316 8.307 0.834 | |* | 0.001
186 73346 48.7149 41.7833 0.421 6.9316 3.917 1.77 | |*** | 0.018
187 114313 48.7149 41.7833 0.421 6.9316 3.127 2.217 | |**** | 0.045
188 91010 48.7149 41.7833 0.421 6.9316 3.511 1.974 | |*** | 0.028
189 44539 48.7149 41.7833 0.421 6.9316 5.038 1.376 | |** | 0.007
190 113111 48.7149 41.7833 0.421 6.9316 3.144 2.205 | |**** | 0.044
191 60876 48.7149 41.7833 0.421 6.9316 4.303 1.611 | |*** | 0.012
192 93633 48.7149 41.7833 0.421 6.9316 3.461 2.003 | |**** | 0.03
193 80129 48.7149 41.7833 0.421 6.9316 3.745 1.851 | |*** | 0.022
194 396420 48.7149 41.7833 0.421 6.9316 1.641 4.223 | |******| 0.588
195 215566 48.7149 41.7833 0.421 6.9316 2.259 3.069 | |******| 0.164
196 68511 48.7149 41.7833 0.421 6.9316 4.054 1.71 | |*** | 0.016
197 45955 48.7149 41.7833 0.421 6.9316 4.959 1.398 | |** | 0.007
198 114009 48.7149 41.7833 0.421 6.9316 3.131 2.214 | |**** | 0.044
199 169763 48.7149 41.7833 0.421 6.9316 2.555 2.713 | |***** | 0.1
200 89366 48.7149 41.7833 0.421 6.9316 3.544 1.956 | |*** | 0.027
201 273172 48.7149 41.7833 0.421 6.9316 1.997 3.471 | |******| 0.268
202 157095 48.7149 41.7833 0.421 6.9316 2.659 2.607 | |***** | 0.085
203 70322 48.7149 41.7833 0.421 6.9316 4.001 1.732 | |*** | 0.017
204 39717 48.7149 41.7833 0.421 6.9316 5.337 1.299 | |** | 0.005
205 23342 48.7149 41.7833 0.421 6.9316 6.97 0.994 | |* | 0.002
206 16746 48.7149 41.7833 0.421 6.9316 8.234 0.842 | |* | 0.001
207 11522 48.7149 41.7833 0.421 6.9316 9.93 0.698 | |* | 0
208 3275 48.7149 41.7833 0.421 6.9316 18.638 0.372 | | | 0
209 340 48.7149 41.7833 0.421 6.9316 57.858 0.12 | | | 0
210 632 48.7149 41.7833 0.421 6.9316 42.436 0.163 | | | 0
211 2884 48.7149 41.7833 0.421 6.9316 19.862 0.349 | | | 0
212 25920 48.7149 41.7833 0.421 6.9316 6.613 1.048 | |** | 0.002
213 7368 48.7149 41.7833 0.421 6.9316 12.422 0.558 | |* | 0
214 18933 48.7149 41.7833 0.421 6.9316 7.742 0.895 | |* | 0.001
215 6173 48.7149 41.7833 0.421 6.9316 13.572 0.511 | |* | 0
216 4749 48.7149 41.7833 0.421 6.9316 15.476 0.448 | | | 0
217 96 48.7149 41.7833 0.421 6.9316 108.887 0.064 | | | 0
218 4757 48.7149 41.7833 0.421 6.9316 15.463 0.448 | | | 0
219 144 48.7149 41.7833 0.421 6.9316 88.905 0.078 | | | 0
220 3036 48.7149 41.7833 0.421 6.9316 19.358 0.358 | | | 0
Case No. U-17273 Witness: J.C. Hoffman Malueg
Exhibit A-6 (JCHM-1) Schedule F1.11
Page 17 of 20

‐‐‐‐‐‐‐‐‐‐‐‐‐‐‐‐‐‐‐‐‐‐‐‐‐‐‐‐‐‐‐‐‐‐‐‐‐‐‐‐‐‐‐‐‐‐‐‐‐‐‐‐‐‐‐‐‐‐ MATERIAL=STEEL ‐‐‐‐‐‐‐‐‐‐‐‐‐‐‐‐‐‐‐‐‐‐‐‐‐‐‐‐‐‐‐‐‐‐‐‐‐‐‐‐‐‐‐‐‐‐‐‐‐‐‐‐‐‐‐‐
DEP VAR PREDICT STD ERR STD ERR STUDENT COOK'S
OBS WEIGHT UHWICOST VALUE PREDICT RESIDUAL RESIDUAL RESIDUAL ‐2‐1‐0 1 2 D
221 2511 48.7149 41.7833 0.421 6.9316 21.287 0.326 | | | 0
222 961 48.7149 41.7833 0.421 6.9316 34.413 0.201 | | | 0
223 19008 48.7149 41.7833 0.421 6.9316 7.727 0.897 | |* | 0.001
224 547 48.7149 41.7833 0.421 6.9316 45.614 0.152 | | | 0
225 1235 48.7149 41.7833 0.421 6.9316 30.356 0.228 | | | 0
226 4447 48.7149 41.7833 0.421 6.9316 15.993 0.433 | | | 0
227 5335 48.7149 41.7833 0.421 6.9316 14.6 0.475 | | | 0
228 862 48.7149 41.7833 0.421 6.9316 36.336 0.191 | | | 0
229 1204 48.7149 41.7833 0.421 6.9316 30.744 0.225 | | | 0
230 3495 48.7149 41.7833 0.421 6.9316 18.041 0.384 | | | 0
231 4040 48.7149 41.7833 0.421 6.9316 16.78 0.413 | | | 0
232 3882 48.7149 41.7833 0.421 6.9316 17.118 0.405 | | | 0
233 195 48.7149 41.7833 0.421 6.9316 76.399 0.091 | | | 0
234 1071 48.7149 41.7833 0.421 6.9316 32.597 0.213 | | | 0
235 276 48.7149 41.7833 0.421 6.9316 64.217 0.108 | | | 0
236 147 48.7149 41.7833 0.421 6.9316 87.994 0.079 | | | 0
237 1262 48.7149 41.7833 0.421 6.9316 30.029 0.231 | | | 0
238 358 48.7149 41.7833 0.421 6.9316 56.385 0.123 | | | 0
239 3649 48.7149 41.7833 0.421 6.9316 17.656 0.393 | | | 0
240 4834 48.7149 41.7833 0.421 6.9316 15.339 0.452 | | | 0
241 29582 48.7149 41.7833 0.421 6.9316 6.189 1.12 | |** | 0.003
242 1707 48.7149 41.7833 0.421 6.9316 25.819 0.268 | | | 0
243 238 48.7149 41.7833 0.421 6.9316 69.154 0.1 | | | 0
244 1400 48.7149 41.7833 0.421 6.9316 28.51 0.243 | | | 0
245 27181 73.1965 72.9414 0.959 0.2551 6.4 0.04 | | | 0
246 8336 73.1965 72.9414 0.959 0.2551 11.646 0.022 | | | 0
247 320 73.1965 72.9414 0.959 0.2551 59.633 0.004 | | | 0
248 510 73.1965 72.9414 0.959 0.2551 47.232 0.005 | | | 0
249 51749 73.1965 72.9414 0.959 0.2551 4.591 0.056 | | | 0
250 8344 73.1965 72.9414 0.959 0.2551 11.64 0.022 | | | 0
251 18534 73.1965 72.9414 0.959 0.2551 7.778 0.033 | | | 0
252 6807 73.1965 72.9414 0.959 0.2551 12.896 0.02 | | | 0
253 11566 73.1965 72.9414 0.959 0.2551 9.874 0.026 | | | 0
254 14620 73.1965 72.9414 0.959 0.2551 8.771 0.029 | | | 0
255 29978 73.1965 72.9414 0.959 0.2551 6.087 0.042 | | | 0
256 223580 73.1965 72.9414 0.959 0.2551 2.042 0.125 | | | 0.002
257 7490 73.1965 72.9414 0.959 0.2551 12.29 0.021 | | | 0
258 1560 73.1965 72.9414 0.959 0.2551 26.995 0.009 | | | 0
259 18347 73.1965 72.9414 0.959 0.2551 7.818 0.033 | | | 0
260 10470 73.1965 72.9414 0.959 0.2551 10.382 0.025 | | | 0
261 8359 73.1965 72.9414 0.959 0.2551 11.63 0.022 | | | 0
262 9143 73.1965 72.9414 0.959 0.2551 11.116 0.023 | | | 0
263 6786 73.1965 72.9414 0.959 0.2551 12.916 0.02 | | | 0
264 2342 73.1965 72.9414 0.959 0.2551 22.025 0.012 | | | 0
265 8335 73.1965 72.9414 0.959 0.2551 11.646 0.022 | | | 0
266 40416 73.1965 72.9414 0.959 0.2551 5.22 0.049 | | | 0
267 25 73.1965 72.9414 0.959 0.2551 213.373 0.001 | | | 0
268 1514 73.1965 72.9414 0.959 0.2551 27.402 0.009 | | | 0
269 3092 73.1965 72.9414 0.959 0.2551 19.162 0.013 | | | 0
270 4824 73.1965 72.9414 0.959 0.2551 15.331 0.017 | | | 0
271 8166 73.1965 72.9414 0.959 0.2551 11.767 0.022 | | | 0
272 16662 73.1965 72.9414 0.959 0.2551 8.209 0.031 | | | 0
273 4513 73.1965 72.9414 0.959 0.2551 15.852 0.016 | | | 0
274 11204 73.1965 72.9414 0.959 0.2551 10.034 0.025 | | | 0
275 11846 73.1965 72.9414 0.959 0.2551 9.755 0.026 | | | 0
276 2332 73.1965 72.9414 0.959 0.2551 22.072 0.012 | | | 0
277 4682 73.1965 72.9414 0.959 0.2551 15.562 0.016 | | | 0
278 3591 73.1965 72.9414 0.959 0.2551 17.778 0.014 | | | 0
279 12789 73.1965 72.9414 0.959 0.2551 9.385 0.027 | | | 0
280 4556 73.1965 72.9414 0.959 0.2551 15.777 0.016 | | | 0
281 1458 73.1965 72.9414 0.959 0.2551 27.924 0.009 | | | 0
282 403 73.1965 72.9414 0.959 0.2551 53.136 0.005 | | | 0
283 739 73.1965 72.9414 0.959 0.2551 39.234 0.007 | | | 0
284 4346 73.1965 72.9414 0.959 0.2551 16.155 0.016 | | | 0
285 4931 73.1965 72.9414 0.959 0.2551 15.163 0.017 | | | 0
286 21554 73.1965 72.9414 0.959 0.2551 7.203 0.035 | | | 0
Case No. U-17273 Witness: J.C. Hoffman Malueg
Exhibit A-6 (JCHM-1) Schedule F1.11
Page 18 of 20

‐‐‐‐‐‐‐‐‐‐‐‐‐‐‐‐‐‐‐‐‐‐‐‐‐‐‐‐‐‐‐‐‐‐‐‐‐‐‐‐‐‐‐‐‐‐‐‐‐‐‐‐‐‐‐‐‐‐ MATERIAL=STEEL ‐‐‐‐‐‐‐‐‐‐‐‐‐‐‐‐‐‐‐‐‐‐‐‐‐‐‐‐‐‐‐‐‐‐‐‐‐‐‐‐‐‐‐‐‐‐‐‐‐‐‐‐‐‐‐‐
DEP VAR PREDICT STD ERR STD ERR STUDENT COOK'S
OBS WEIGHT UHWICOST VALUE PREDICT RESIDUAL RESIDUAL RESIDUAL ‐2‐1‐0 1 2 D
287 442 73.1965 72.9414 0.959 0.2551 50.737 0.005 | | | 0
288 1434 73.1965 72.9414 0.959 0.2551 28.157 0.009 | | | 0
289 5965 73.1965 72.9414 0.959 0.2551 13.78 0.019 | | | 0
290 2938 73.1965 72.9414 0.959 0.2551 19.659 0.013 | | | 0
291 5784 73.1965 72.9414 0.959 0.2551 13.995 0.018 | | | 0
292 597 73.1965 72.9414 0.959 0.2551 43.654 0.006 | | | 0
293 296 73.1965 72.9414 0.959 0.2551 62.004 0.004 | | | 0
294 2 73.1965 72.9414 0.959 0.2551 754.395 0 | | | 0
295 727 73.1965 72.9414 0.959 0.2551 39.557 0.006 | | | 0
296 2340 73.1965 72.9414 0.959 0.2551 22.034 0.012 | | | 0
297 2856 73.1965 72.9414 0.959 0.2551 19.94 0.013 | | | 0
298 1191 73.1965 72.9414 0.959 0.2551 30.899 0.008 | | | 0
299 2149 68.2152 116.6 1.926 ‐48.3474 22.933 ‐2.108 | ****| | 0.016
300 163 68.2152 116.6 1.926 ‐48.3474 83.542 ‐0.579 | *| | 0
301 28526 68.2152 116.6 1.926 ‐48.3474 6.016 ‐8.036 |******| | 3.309
302 4031 68.2152 116.6 1.926 ‐48.3474 16.693 ‐2.896 | *****| | 0.056
303 619 68.2152 116.6 1.926 ‐48.3474 42.838 ‐1.129 | **| | 0.001
304 22269 68.2152 116.6 1.926 ‐48.3474 6.885 ‐7.022 |******| | 1.929
305 21 68.2152 116.6 1.926 ‐48.3474 232.804 ‐0.208 | | | 0
306 545 68.2152 116.6 1.926 ‐48.3474 45.659 ‐1.059 | **| | 0.001
307 385 68.2152 116.6 1.926 ‐48.3474 54.339 ‐0.89 | *| | 0
308 18 68.2152 116.6 1.926 ‐48.3474 251.458 ‐0.192 | | | 0
309 1879 68.2152 116.6 1.926 ‐48.3474 24.537 ‐1.970 | ***| | 0.012
310 896 68.2152 116.6 1.926 ‐48.3474 35.59 ‐1.358 | **| | 0.003
311 509 68.2152 116.6 1.926 ‐48.3474 47.249 ‐1.023 | **| | 0.001
312 311 68.2152 116.6 1.926 ‐48.3474 60.466 ‐0.8 | *| | 0
313 1111 68.2152 116.6 1.926 ‐48.3474 31.95 ‐1.513 | ***| | 0.004
314 2511 68.2152 116.6 1.926 ‐48.3474 21.203 ‐2.28 | ****| | 0.021
315 2471 68.2152 116.6 1.926 ‐48.3474 21.376 ‐2.262 | ****| | 0.021
316 964 68.2152 116.6 1.926 ‐48.3474 34.308 ‐1.409 | **| | 0.003
317 380 68.2152 116.6 1.926 ‐48.3474 54.696 ‐0.884 | *| | 0
318 2774 68.2152 116.6 1.926 ‐48.3474 20.165 ‐2.398 | ****| | 0.026
319 9 68.2152 116.6 1.926 ‐48.3474 355.62 ‐0.136 | | | 0
320 11 39.3868 172.6 3.209 ‐133.3 321.66 ‐0.414 | | | 0
321 150 39.3868 172.6 3.209 ‐133.3 87.051 ‐1.531 | ***| | 0.002
SUM OF RESIDUALS 0
SUM OF SQUARED RESIDUALS 363094262.49
PREDICTED RESID SS (PRESS) 401778531.61
NOTE: THE ABOVE STATISTICS USE OBSERVATION WEIGHTS OR FREQUENCIES.
Case No. U-17273 Witness: J.C. Hoffman Malueg
Exhibit A-6 (JCHM-1) Schedule F1.11
Page 19 of 20

Michigan Gas Utilities Corporation
Account 376: Distribution Gas Mains Regression Analysis
Historical Year Ending December 31, 2012
MATERIAL _MODEL_ _TYPE_ _DEPVAR_ _RMSE_ INTERCEP SQSIZE UHWICOST
PLASTIC MODEL1 PARMS UHWICOST 180.29 10.3209 0.7452 ‐1
STEEL MODEL1 PARMS UHWICOST 1,066.88 16.8568 1.5579 ‐1
MINIMUM MINIMUM
SYSTEM SYSTEM AT
CURRENT COST CURRENT
MATERIAL QUANTITY PER UNIT COST
PLASTIC 10,587,131 10.3209 109,269,168
STEEL 7,381,860 16.8568 124,434,736
17,968,991 233,703,904
MINIMUM MINIMUM DEMAND
SYSTEM AT TOTAL AT SYSTEM AT RELATED
CURRENT CURRENT CURRENT COST CURRENT COST
COST COST PERCENT PERCENT
233,703,904 431,644,983 0.54143 0.45857
Eliminating Outliers
Current Cost Estimates
Eliminating Outliers
Estimation of Minimum Cost of Gas Mains
Eliminating Outliers
Estimation of Percentage of Minimum Cost of Gas Mains
Case No. U-17273 Witness: J.C. Hoffman Malueg
Exhibit A-6 (JCHM-1) Schedule F1.11
Page 20 of 20

Mic
higa
n P
ublic
Ser
vice
Com
mis
sion
Mic
higa
n G
as U
tiliti
es C
orpo
ratio
nH
isto
rical
Cos
t of S
ervi
ce A
lloca
tion
Stu
dyH
isto
rical
Yea
r End
ing
Dec
embe
r 31,
201
2
(A)
(B)
(C)
(D)
(E)
(F)
(G)
(H)
TOTA
LTO
TAL
TOTA
LLI
NE
SU
MM
AR
Y O
F O
PE
RA
TIN
G IN
CO
ME
,C
OR
PO
RA
TER
ETA
ILTO
TAL
SM
ALL
LAR
GE
TOTA
LS
PE
CIA
LN
O.
RA
TE B
AS
E A
ND
RA
TE O
F R
ETU
RN
MG
UJU
RIS
.R
ES
IDE
NTI
AL
CO
MM
ER
CIA
LC
OM
ME
RC
IAL
TRA
NS
PO
RT
CO
NTR
AC
T1
Ope
ratin
g R
even
ues:
2
Tarif
fed
Rev
enue
s11
5,65
3,99
811
5,65
3,99
874
,894
,888
16,2
93,9
541,
812,
396
22,5
30,7
6312
1,99
73
O
ther
Rev
enue
s6,
967,
206
6,96
7,20
65,
594,
620
996,
588
142,
020
232,
749
1,22
94
Tota
l Ope
ratin
g R
even
ues:
122,
621,
205
122,
621,
205
80,4
89,5
0817
,290
,542
1,95
4,41
722
,763
,512
123,
226
50
06
Ope
ratin
g E
xpen
se:
00
7
Ope
ratio
n &
Mai
nten
ance
: Cos
t of G
as63
,534
,006
63,5
34,0
0650
,294
,847
11,6
80,6
161,
557,
202
01,
340
8
Ope
ratio
n &
Mai
nten
ance
: Non
-Cos
t of G
as33
,647
,791
33,6
47,7
9122
,130
,764
2,53
6,85
911
5,11
48,
854,
925
10,1
299
D
epre
ciat
ion
Exp
ense
- S
/L8,
115,
374
8,11
5,37
45,
206,
537
617,
358
30,0
522,
261,
354
7310
T
axes
oth
er th
an In
com
e Ta
x4,
264,
075
4,26
4,07
52,
408,
614
379,
404
36,3
791,
439,
608
7011
L
ES
S: I
ncom
e &
Oth
er A
dj's
Bef
ore
Inco
me
Tax
00
00
00
012
I
ncom
e Ta
x3,
068,
197
3,06
8,19
71,
759,
391
282,
678
28,6
1199
7,45
859
13
ITC
Cre
dit
00
00
00
014
L
ES
S:
Inco
me
& O
ther
Adj
's A
fter I
ncom
e Ta
x0
00
00
00
15To
tal O
pera
ting
Exp
ense
112,
629,
443
112,
629,
443
81,8
00,1
5415
,496
,914
1,76
7,35
813
,553
,344
11,6
7216
00
17N
ET
OP
ER
ATI
NG
INC
OM
E (R
etur
n)9,
991,
762
9,99
1,76
2(1
,310
,646
)1,
793,
628
187,
058
9,21
0,16
911
1,55
418
A
FUD
C A
llow
ance
00
00
00
019
In
com
e Ta
x A
ffect
of I
nt. A
llow
for R
atem
akin
g(4
8,17
1)(4
8,17
1)(2
7,62
3)(4
,438
)(4
49)
(15,
660)
(1)
20A
DJU
STE
D N
ET
OP
ER
ATI
NG
INC
OM
E9,
943,
591
9,94
3,59
1(1
,338
,269
)1,
789,
190
186,
609
9,19
4,50
811
1,55
321
00
220
023
RA
TE B
AS
E:
00
24U
tility
Pla
nt in
Ser
vice
310,
262,
591
310,
262,
591
190,
198,
143
26,5
79,7
221,
349,
921
92,1
31,6
443,
161
25A
ccum
ulat
ed D
epre
ciat
ion
- S/L
(171
,640
,370
)(1
71,6
40,3
70)
(104
,213
,626
)(1
4,26
7,83
7)(7
69,7
71)
(52,
387,
477)
(1,6
59)
26C
onst
ruct
ion
Wor
k in
Pro
gres
s4,
139,
150
4,13
9,15
02,
198,
733
343,
384
32,3
201,
564,
669
4527
N
et P
lant
in S
ervi
ce14
2,76
1,37
114
2,76
1,37
188
,183
,250
12,6
55,2
7061
2,46
941
,308
,836
1,54
628
00
29G
as S
tore
d U
nder
grou
nd:
16,5
47,6
9816
,547
,698
7,92
3,65
21,
823,
680
365,
133
6,43
4,63
759
530
Fuel
Sto
ck0
00
00
00
31W
orki
ng C
apita
l Allo
wan
ce34
,923
,273
34,9
23,2
7315
,141
,817
3,43
2,82
383
6,57
515
,510
,434
1,62
332
Mat
eria
ls &
Sup
plie
s:48
8,15
248
8,15
233
0,41
829
,746
1,22
512
6,76
03
33O
ther
- D
efer
red
Taxe
s (M
&S
/ C
WIP
)0
00
00
00
34P
repa
ymen
ts47
1,25
647
1,25
620
6,02
743
,736
4,15
821
7,33
14
35C
ash
& B
ank
Bal
ance
s66
4,73
166
4,73
128
7,12
861
,267
5,95
431
0,37
76
36P
rope
rty, P
ayro
ll &
Inco
me
Taxe
s A
ccru
ed:
(1,7
80,2
24)
(1,7
80,2
24)
(783
,461
)(1
65,9
87)
(15,
736)
(815
,026
)(1
5)37
TOTA
L R
ATE
BA
SE
194,
076,
257
194,
076,
257
111,
288,
831
17,8
80,5
351,
809,
778
63,0
93,3
493,
762
38 39 40P
ER
CE
NT
RA
TE O
F R
ETU
RN
5.15
%5.
15%
-1.1
8%10
.03%
10.3
4%14
.60%
2965
.14%
41 42R
equi
red
Rat
e of
Ret
urn
7.11
%7.
11%
7.11
%7.
11%
7.11
%7.
11%
7.11
%43 44
Req
uire
d R
etur
n13
,793
,776
13,7
93,7
767,
909,
742
1,27
0,84
112
8,62
84,
484,
297
267
45
(R
equi
red
Ret
urn
% *
Rat
e B
ase)
46R
etur
n In
com
e D
efic
ienc
y3,
850,
185
3,85
0,18
5
9,24
8,01
1
(5
18,3
49)
(57,
981)
(4,7
10,2
12)
(1
11,2
86)
47
(R
equi
red
Ret
- A
dj O
pera
ting
Inco
me)
48In
com
e Ta
x R
ate
0.63
70
0.
6370
0.63
70
0.63
70
0.63
70
0.
6370
0.
6370
49 50
Add
ition
al In
com
e Ta
x on
Ret
urn
Def
.2,
452,
554
2,45
2,55
4
1,40
6,37
222
5,95
922
,870
797,
319
4851
(Inco
me
Def
icie
ncy
* Ta
x Fa
ctor
)52
Rev
enue
Def
icie
ncy
6,30
2,73
6
6,
302,
736
10
,654
,382
(2
92,3
90)
(35,
111)
(3,9
12,8
93)
(1
11,2
38)
53 54R
even
ue D
efic
ienc
y %
5.45
%5.
45%
14.2
3%-1
.79%
-1.9
4%-1
7.37
%-9
1.18
%55
(Rev
enue
Def
/ Ta
riffe
d R
even
ues)
56R
even
ue D
efic
ienc
y %
(With
out C
ost o
f Gas
)12
.09%
12.0
9%43
.31%
-6.3
4%-1
3.76
%-1
7.37
%-9
2.19
%57
(Dis
tribu
tion
Mar
gin
Onl
y)
May
not
cro
ss-c
heck
due
to R
ound
ing
Case No. U-17273 Witness: J.C. Hoffman Malueg
Exhibit A-16 (JCHM-2) Schedule F1.1
Page 1 of 4

Mic
higa
n P
ublic
Ser
vice
Com
mis
sion
Mic
higa
n G
as U
tiliti
es C
orpo
ratio
nH
isto
rical
Cos
t of S
ervi
ce A
lloca
tion
Stu
dyH
isto
rical
Yea
r End
ing
Dec
embe
r 31,
201
2
Indi
vidu
al R
ate
Sch
edul
e D
etai
l
(A)
(B)
(C)
(D)
(E)
(F)
(G)
(H)
(I)
MF-
IM
F-II
MF-
IIIM
F-IV
GS
-Sm
all
TOTA
LLI
NE
SU
MM
AR
Y O
F O
PE
RA
TIN
G IN
CO
ME
,M
ulti-
Fam
ilyM
ulti-
Fam
ilyM
ulti-
Fam
ilyM
ulti-
Fam
ilyTO
TAL
Gen
eral
Ser
vice
SM
ALL
NO
.R
ATE
BA
SE
AN
D R
ATE
OF
RE
TUR
NR
esid
entia
lC
lass
IC
lass
IIC
lass
III
Cla
ss IV
RE
SID
EN
TIA
LS
mal
lC
OM
ME
RC
IAL
1O
pera
ting
Rev
enue
s:2
Ta
riffe
d R
even
ues
73,8
62,2
9010
4,45
958
4,83
312
5,87
021
7,43
674
,894
,888
16,2
93,9
5416
,293
,954
3
Oth
er R
even
ues
5,49
7,36
96,
912
38,0
6418
,662
33,6
135,
594,
620
996,
588
996,
588
4To
tal O
pera
ting
Rev
enue
s:79
,359
,659
111,
371
622,
896
144,
532
251,
049
80,4
89,5
0817
,290
,542
17,2
90,5
425 6
Ope
ratin
g E
xpen
se:
7
Ope
ratio
n &
Mai
nten
ance
: Cos
t of G
as49
,461
,802
79,1
9745
2,52
310
7,78
819
3,53
750
,294
,847
11,6
80,6
1611
,680
,616
8
Ope
ratio
n &
Mai
nten
ance
: Non
-Cos
t of G
as22
,011
,606
22,6
6068
,863
11,3
9716
,239
22,1
30,7
642,
536,
859
2,53
6,85
99
D
epre
ciat
ion
Exp
ense
- S
/L5,
176,
068
5,50
917
,034
3,17
84,
748
5,20
6,53
761
7,35
861
7,35
810
T
axes
oth
er th
an In
com
e Ta
x2,
387,
955
2,80
811
,323
2,52
54,
004
2,40
8,61
437
9,40
437
9,40
411
L
ES
S: I
ncom
e &
Oth
er A
dj's
Bef
ore
Inco
me
Tax
00
00
00
00
12
Inc
ome
Tax
1,74
4,95
71,
981
7,93
91,
785
2,72
91,
759,
391
282,
678
282,
678
13
ITC
Cre
dit
00
00
00
00
14
LE
SS
: In
com
e &
Oth
er A
dj's
Afte
r Inc
ome
Tax
00
00
00
00
15To
tal O
pera
ting
Exp
ense
80,7
82,3
8811
2,15
555
7,68
212
6,67
322
1,25
781
,800
,154
15,4
96,9
1415
,496
,914
16 17N
ET
OP
ER
ATI
NG
INC
OM
E (R
etur
n)(1
,422
,729
)(7
83)
65,2
1417
,859
29,7
92(1
,310
,646
)1,
793,
628
1,79
3,62
818
A
FUD
C A
llow
ance
00
00
00
00
19
Inco
me
Tax
Affe
ct o
f Int
. Allo
w fo
r Rat
emak
ing
(27,
396)
(31)
(125
)(2
8)(4
3)(2
7,62
3)(4
,438
)(4
,438
)20
AD
JUS
TED
NE
T O
PE
RA
TIN
G IN
CO
ME
(1,4
50,1
25)
(814
)65
,090
17,8
3129
,749
(1,3
38,2
69)
1,78
9,19
01,
789,
190
21 22 23R
ATE
BA
SE
:24
Util
ity P
lant
in S
ervi
ce18
8,94
5,15
320
3,61
270
3,71
414
0,10
920
5,55
619
0,19
8,14
326
,579
,722
26,5
79,7
2225
Acc
umul
ated
Dep
reci
atio
n - S
/L(1
03,5
07,7
60)
(113
,540
)(3
94,3
95)
(78,
767)
(119
,164
)(1
04,2
13,6
26)
(14,
267,
837)
(14,
267,
837)
26C
onst
ruct
ion
Wor
k in
Pro
gres
s2,
176,
604
2,82
712
,021
2,67
54,
606
2,19
8,73
334
3,38
434
3,38
427
N
et P
lant
in S
ervi
ce87
,613
,997
92,8
9932
1,33
964
,016
90,9
9888
,183
,250
12,6
55,2
7012
,655
,270
28 29G
as S
tore
d U
nder
grou
nd:
7,80
0,37
911
,573
65,5
8117
,022
29,0
977,
923,
652
1,82
3,68
01,
823,
680
30Fu
el S
tock
00
00
00
00
31W
orki
ng C
apita
l Allo
wan
ce14
,918
,622
20,9
3711
6,68
132
,301
53,2
7715
,141
,817
3,43
2,82
33,
432,
823
32M
ater
ials
& S
uppl
ies:
328,
759
348
922
150
239
330,
418
29,7
4629
,746
33O
ther
- D
efer
red
Taxe
s (M
&S
/ C
WIP
)0
00
00
00
034
Pre
paym
ents
202,
888
323
1,68
940
472
320
6,02
743
,736
43,7
3635
Cas
h &
Ban
k B
alan
ces
282,
731
451
2,36
656
61,
014
287,
128
61,2
6761
,267
36P
rope
rty, P
ayro
ll &
Inco
me
Taxe
s A
ccru
ed:
(771
,551
)(1
,230
)(6
,403
)(1
,533
)(2
,744
)(7
83,4
61)
(165
,987
)(1
65,9
87)
37TO
TAL
RA
TE B
AS
E11
0,37
5,82
412
5,30
250
2,17
511
2,92
617
2,60
511
1,28
8,83
117
,880
,535
17,8
80,5
3538 39 40
PE
RC
EN
T R
ATE
OF
RE
TUR
N-1
.29%
-0.6
3%12
.99%
15.8
2%17
.26%
-1.2
9%10
.03%
10.0
3%41 42
Req
uire
d R
ate
of R
etur
n7.
11%
7.11
%7.
11%
7.11
%7.
11%
7.11
%7.
11%
7.11
%43 44
Req
uire
d R
etur
n7,
844,
851
8,90
635
,692
8,02
612
,268
7,90
9,74
21,
270,
841
1,27
0,84
145
(Req
uire
d R
etur
n %
* R
ate
Bas
e)46
Ret
urn
Inco
me
Def
icie
ncy
9,29
4,97
6
9,
720
(2
9,39
8)
(9,8
05)
(1
7,48
2)
9,
248,
011
(518
,349
)
(5
18,3
49)
47
(Req
uire
d R
et -
Adj
Ope
ratin
g In
com
e)48
Inco
me
Tax
Rat
e0.
6370
0.63
70
0.
6370
0.
6370
0.
6370
0.63
70
0.63
70
0.63
70
49 50
Add
ition
al In
com
e Ta
x on
Ret
urn
Def
.1,
394,
834
1,58
36,
346
1,42
72,
181
1,40
6,37
222
5,95
922
5,95
9
51
(In
com
e D
efic
ienc
y *
Tax
Fact
or)
52R
even
ue D
efic
ienc
y10
,689
,810
11
,304
(23,
052)
(8
,378
)
(15,
300)
10,6
54,3
83
(292
,390
)
(2
92,3
90)
53 54
Rev
enue
Def
icie
ncy
%14
.47%
10.8
2%-3
.94%
-6.6
6%-7
.04%
14.2
3%-1
.79%
-1.7
9%55
(Rev
enue
Def
/ Ta
riffe
d R
even
ues)
56R
even
ue D
efic
ienc
y %
(With
out C
ost o
f Gas
)43
.81%
44.7
5%-1
7.42
%-4
6.33
%-6
4.02
%43
.31%
-6.3
4%-6
.34%
57
(D
istri
butio
n M
argi
n O
nly)
May
not
cro
ss-c
heck
due
to R
ound
ing
Case No. U-17273 Witness: J.C. Hoffman Malueg
Exhibit A-16 (JCHM-2) Schedule F1.1
Page 2 of 4

Mic
higa
n P
ublic
Ser
vice
Com
mis
sion
Mic
higa
n G
as U
tiliti
es C
orpo
ratio
nH
isto
rical
Cos
t of S
ervi
ce A
lloca
tion
Stu
dyH
isto
rical
Yea
r End
ing
Dec
embe
r 31,
201
2
Indi
vidu
al R
ate
Sch
edul
e D
etai
l
(A)
(B)
(C)
(D)
(E)
GS
-Lar
geTO
TAL
TOTA
LLI
NE
SU
MM
AR
Y O
F O
PE
RA
TIN
G IN
CO
ME
,G
ener
al S
ervi
ceLA
RG
ES
peci
alS
PE
CIA
LN
O.
RA
TE B
AS
E A
ND
RA
TE O
F R
ETU
RN
Larg
eC
OM
ME
RC
IAL
Con
tract
CO
NTR
AC
T1
Ope
ratin
g R
even
ues:
2
Tarif
fed
Rev
enue
s1,
812,
396
1,81
2,39
612
1,99
712
1,99
73
O
ther
Rev
enue
s14
2,02
014
2,02
01,
229
1,22
94
Tota
l Ope
ratin
g R
even
ues:
1,95
4,41
71,
954,
417
123,
226
123,
226
5 6O
pera
ting
Exp
ense
:7
O
pera
tion
& M
aint
enan
ce: C
ost o
f Gas
1,55
7,20
21,
557,
202
1,34
01,
340
8
Ope
ratio
n &
Mai
nten
ance
: Non
-Cos
t of G
as11
5,11
411
5,11
410
,129
10,1
299
D
epre
ciat
ion
Exp
ense
- S
/L30
,052
30,0
5273
7310
T
axes
oth
er th
an In
com
e Ta
x36
,379
36,3
7970
7011
L
ES
S: I
ncom
e &
Oth
er A
dj's
Bef
ore
Inco
me
Tax
00
00
12
Inc
ome
Tax
28,6
1128
,611
5959
13
ITC
Cre
dit
00
00
14
LE
SS
: In
com
e &
Oth
er A
dj's
Afte
r Inc
ome
Tax
00
00
15To
tal O
pera
ting
Exp
ense
1,76
7,35
81,
767,
358
11,6
7211
,672
16 17N
ET
OP
ER
ATI
NG
INC
OM
E (R
etur
n)18
7,05
818
7,05
811
1,55
411
1,55
418
A
FUD
C A
llow
ance
00
00
19
Inco
me
Tax
Affe
ct o
f Int
. Allo
w fo
r Rat
emak
ing
(449
)(4
49)
(1)
(1)
20A
DJU
STE
D N
ET
OP
ER
ATI
NG
INC
OM
E18
6,60
918
6,60
911
1,55
311
1,55
321 22 23
RA
TE B
AS
E:
24U
tility
Pla
nt in
Ser
vice
1,34
9,92
11,
349,
921
3,16
13,
161
25A
ccum
ulat
ed D
epre
ciat
ion
- S/L
(769
,771
)(7
69,7
71)
(1,6
59)
(1,6
59)
26C
onst
ruct
ion
Wor
k in
Pro
gres
s32
,320
32,3
2045
4527
N
et P
lant
in S
ervi
ce61
2,46
961
2,46
91,
546
1,54
628 29
Gas
Sto
red
Und
ergr
ound
:36
5,13
336
5,13
359
559
530
Fuel
Sto
ck0
00
031
Wor
king
Cap
ital A
llow
ance
836,
575
836,
575
1,62
31,
623
32M
ater
ials
& S
uppl
ies:
1,22
51,
225
33
33O
ther
- D
efer
red
Taxe
s (M
&S
/ C
WIP
)0
00
034
Pre
paym
ents
4,15
84,
158
44
35C
ash
& B
ank
Bal
ance
s5,
954
5,95
46
636
Pro
perty
, Pay
roll
& In
com
e Ta
xes
Acc
rued
:(1
5,73
6)(1
5,73
6)(1
5)(1
5)37
TOTA
L R
ATE
BA
SE
1,80
9,77
81,
809,
778
3,76
23,
762
38 39 40P
ER
CE
NT
RA
TE O
F R
ETU
RN
10.3
4%10
.34%
2965
.14%
2965
.14%
41 42R
equi
red
Rat
e of
Ret
urn
7.11
%7.
11%
7.11
%7.
11%
43 44R
equi
red
Ret
urn
128,
628
128,
628
267
267
45
(R
equi
red
Ret
urn
% *
Rat
e B
ase)
46R
etur
n In
com
e D
efic
ienc
y(5
7,98
1)
(57,
981)
(111
,286
)
(1
11,2
86)
47
(Req
uire
d R
et -
Adj
Ope
ratin
g In
com
e)48
Inco
me
Tax
Rat
e0.
6370
0.63
70
0.
6370
0.
6370
49 50A
dditi
onal
Inco
me
Tax
on R
etur
n D
ef.
22,8
7022
,870
4848
51
(Inco
me
Def
icie
ncy
* Ta
x Fa
ctor
)52
Rev
enue
Def
icie
ncy
(35,
111)
(3
5,11
1)
(1
11,2
38)
(111
,238
)
53 54R
even
ue D
efic
ienc
y %
-1.9
4%-1
.94%
-91.
18%
-91.
18%
55
(R
even
ue D
ef /
Tarif
fed
Rev
enue
s)56
Rev
enue
Def
icie
ncy
% (W
ithou
t Cos
t of G
as)
-13.
76%
-13.
76%
-92.
19%
-92.
19%
57
(D
istri
butio
n M
argi
n O
nly)
May
not
cro
ss-c
heck
due
to R
ound
ing
Case No. U-17273 Witness: J.C. Hoffman Malueg
Exhibit A-16 (JCHM-2) Schedule F1.1
Page 3 of 4

Mic
higa
n P
ublic
Ser
vice
Com
mis
sion
Mic
higa
n G
as U
tiliti
es C
orpo
ratio
nH
isto
rical
Cos
t of S
ervi
ce A
lloca
tion
Stu
dyH
isto
rical
Yea
r End
ing
Dec
embe
r 31,
201
2
Indi
vidu
al R
ate
Sch
edul
e D
etai
l
(A)
(B)
(C)
(D)
(E)
(F)
(G)
(H)
(I)(J
)(K
)(L
)(M
)(N
)(O
)C
usto
mer
Cus
tom
erC
usto
mer
Cus
tom
erC
usto
mer
Cus
tom
erC
usto
mer
Cho
ice
Cho
ice
Cho
ice
Cho
ice
Agg
rega
ted
Agg
rega
ted
Agg
rega
ted
LIN
ES
UM
MA
RY
OF
OP
ER
ATI
NG
INC
OM
E,
TR-1
TR-2
TR-3
Cho
ice
Cho
ice
Cho
ice
Mul
ti-Fa
mily
Mul
ti-Fa
mily
Mul
ti-Fa
mily
Mul
ti-Fa
mily
Tran
spor
tTr
ansp
ort
Tran
spor
tTO
TAL
NO
.R
ATE
BA
SE
AN
D R
ATE
OF
RE
TUR
NTr
ansp
ort
Tran
spor
tTr
ansp
ort
Res
iden
tial
GS
- S
mal
lG
S -
Larg
eC
lass
IC
lass
IIC
lass
III
Cla
ss IV
Res
iden
tial
GS
- S
mal
lG
S -
Larg
eTR
AN
SP
OR
T1
Ope
ratin
g R
even
ues:
2
Tarif
fed
Rev
enue
s2,
376,
825
2,58
0,58
01,
561,
896
7,56
3,83
16,
890,
859
04,
508
14,1
194,
114
15,5
1514
,220
1,46
3,83
240
,464
22,5
30,7
633
O
ther
Rev
enue
s8,
334
10,9
517,
699
239,
361
(30,
023)
027
(198
)92
23,
336
455
(8,2
17)
104
232,
749
4To
tal O
pera
ting
Rev
enue
s:2,
385,
159
2,59
1,53
11,
569,
595
7,80
3,19
26,
860,
835
04,
535
13,9
215,
036
18,8
5114
,674
1,45
5,61
540
,567
22,7
63,5
125 6
Ope
ratin
g E
xpen
se:
7
Ope
ratio
n &
Mai
nten
ance
: Cos
t of G
as0
00
00
00
00
00
00
08
O
pera
tion
& M
aint
enan
ce: N
on-C
ost o
f Gas
586,
143
829,
785
576,
623
4,13
4,04
21,
944,
823
02,
172
3,77
91,
091
3,34
431
,385
731,
172
10,5
658,
854,
925
9
Dep
reci
atio
n E
xpen
se -
S/L
153,
903
299,
966
230,
761
968,
483
481,
762
052
788
432
199
21,
855
119,
404
2,49
62,
261,
354
10
Tax
es o
ther
than
Inco
me
Tax
127,
278
241,
334
194,
571
454,
903
321,
683
028
358
732
71,
064
1,05
993
,954
2,56
51,
439,
608
11
LE
SS
: Inc
ome
& O
ther
Adj
's B
efor
e In
com
e Ta
x0
00
00
00
00
00
00
012
I
ncom
e Ta
x84
,513
155,
833
129,
888
328,
045
231,
335
020
241
525
078
874
863
,523
1,91
899
7,45
813
I
TC C
redi
t0
00
00
00
00
00
00
014
L
ES
S:
Inco
me
& O
ther
Adj
's A
fter I
ncom
e Ta
x0
00
00
00
00
00
00
015
Tota
l Ope
ratin
g E
xpen
se95
1,83
71,
526,
918
1,13
1,84
35,
885,
472
2,97
9,60
30
3,18
45,
665
1,99
06,
188
35,0
471,
008,
054
17,5
4313
,553
,344
16 17N
ET
OP
ER
ATI
NG
INC
OM
E (R
etur
n)1,
433,
322
1,06
4,61
343
7,75
21,
917,
720
3,88
1,23
30
1,35
18,
256
3,04
612
,663
(20,
373)
447,
561
23,0
259,
210,
169
18
AFU
DC
Allo
wan
ce0
00
00
00
00
00
00
019
In
com
e Ta
x A
ffect
of I
nt. A
llow
for R
atem
akin
g(1
,327
)(2
,447
)(2
,039
)(5
,150
)(3
,632
)0
(3)
(7)
(4)
(12)
(12)
(997
)(3
0)(1
5,66
0)20
AD
JUS
TED
NE
T O
PE
RA
TIN
G IN
CO
ME
1,43
1,99
51,
062,
166
435,
712
1,91
2,56
93,
877,
601
01,
348
8,24
93,
043
12,6
51(2
0,38
4)44
6,56
422
,995
9,19
4,50
821 22 23
RA
TE B
AS
E:
24U
tility
Pla
nt in
Ser
vice
6,82
7,57
313
,394
,990
10,5
44,3
2835
,208
,002
20,7
27,9
520
19,3
6735
,501
14,2
8543
,232
70,4
315,
134,
306
111,
675
92,1
31,6
4425
Acc
umul
ated
Dep
reci
atio
n - S
/L(4
,058
,634
)(8
,043
,445
)(6
,351
,526
)(1
9,42
1,39
7)(1
1,38
5,63
0)0
(10,
842)
(19,
980)
(7,9
55)
(24,
905)
(39,
465)
(2,9
59,2
35)
(64,
462)
(52,
387,
477)
26C
onst
ruct
ion
Wor
k in
Pro
gres
s15
2,22
230
4,66
524
0,55
543
0,09
432
2,07
00
281
613
291
1,03
81,
078
109,
150
2,61
21,
564,
669
27
Net
Pla
nt in
Ser
vice
2,92
1,16
15,
656,
210
4,43
3,35
716
,216
,699
9,66
4,39
10
8,80
616
,134
6,62
119
,365
32,0
442,
284,
222
49,8
2541
,308
,836
28 29G
as S
tore
d U
nder
grou
nd:
574,
103
959,
466
849,
149
1,58
1,70
51,
782,
862
01,
322
3,51
42,
718
9,24
25,
232
641,
206
24,1
186,
434,
637
30Fu
el S
tock
00
00
00
00
00
00
00
31W
orki
ng C
apita
l Allo
wan
ce1,
874,
596
3,28
9,21
82,
967,
059
2,94
9,62
33,
224,
594
02,
640
6,68
56,
545
21,4
0610
,085
1,11
0,25
947
,725
15,5
10,4
3432
Mat
eria
ls &
Sup
plie
s:7,
738
15,3
3011
,410
62,1
2823
,681
034
5014
4711
36,
106
109
126,
760
33O
ther
- D
efer
red
Taxe
s (M
&S
/ C
WIP
)0
00
00
00
00
00
00
034
Pre
paym
ents
24,6
4749
,844
37,4
3242
,576
45,0
010
3283
4115
413
517
,029
357
217,
331
35C
ash
& B
ank
Bal
ance
s35
,481
72,2
0855
,287
59,3
4163
,057
045
116
5721
418
823
,869
513
310,
377
36P
rope
rty, P
ayro
ll &
Inco
me
Taxe
s A
ccru
ed:
(91,
944)
(185
,190
)(1
37,7
30)
(161
,860
)(1
70,7
00)
0(1
23)
(315
)(1
55)
(584
)(5
12)
(64,
565)
(1,3
46)
(815
,026
)37
TOTA
L R
ATE
BA
SE
5,34
5,78
29,
857,
086
8,21
5,96
320
,750
,212
14,6
32,8
870
12,7
5526
,267
15,8
4149
,844
47,2
844,
018,
125
121,
302
63,0
93,3
4938 39 40
PE
RC
EN
T R
ATE
OF
RE
TUR
N26
.81%
10.8
0%5.
33%
9.24
%26
.52%
#DIV
/0!
10.5
9%31
.43%
19.2
3%25
.41%
-43.
09%
11.1
4%18
.98%
14.6
0%41 42
Req
uire
d R
ate
of R
etur
n7.
11%
7.11
%7.
11%
7.11
%7.
11%
7.11
%7.
11%
7.11
%7.
11%
7.11
%7.
11%
7.11
%7.
11%
7.11
%43 44
Req
uire
d R
etur
n37
9,94
670
0,58
358
3,94
11,
474,
801
1,04
0,01
80
907
1,86
71,
126
3,54
33,
361
285,
584
8,62
14,
484,
297
45
(R
equi
red
Ret
urn
% *
Rat
e B
ase)
46R
etur
n In
com
e D
efic
ienc
y(1
,052
,049
)
(3
61,5
84)
14
8,22
9
(4
37,7
69)
(2,8
37,5
83)
-
(441
)
(6
,382
)
(1,9
17)
(9,1
08)
23,7
45
(1
60,9
80)
(1
4,37
3)
(4,7
10,2
12)
47
(R
equi
red
Ret
- A
dj O
pera
ting
Inco
me)
48In
com
e Ta
x R
ate
0.63
70
0.
6370
0.63
70
0.63
70
0.63
70
0.
6370
0.
6370
0.
6370
0.
6370
0.63
70
0.
6370
0.63
70
0.
6370
0.63
70
49 50
Add
ition
al In
com
e Ta
x on
Ret
urn
Def
.67
,555
124,
565
103,
826
262,
223
184,
918
016
133
220
063
059
850
,778
1,53
379
7,31
951
(Inco
me
Def
icie
ncy
* Ta
x Fa
ctor
)52
Rev
enue
Def
icie
ncy
(984
,494
)
(237
,018
)
252,
055
(175
,546
)
(2
,652
,665
)
-
(2
80)
(6,0
50)
(1
,716
)
(8
,478
)
24
,343
(110
,202
)
(12,
840)
(3
,912
,893
)
53 54
Rev
enue
Def
icie
ncy
%-4
1.42
%-9
.18%
16.1
4%-2
.32%
-38.
50%
#DIV
/0!
-6.2
1%-4
2.85
%-4
1.72
%-5
4.65
%17
1.19
%-7
.53%
-31.
73%
-17.
37%
55
(R
even
ue D
ef /
Tarif
fed
Rev
enue
s)56
Rev
enue
Def
icie
ncy
% (W
ithou
t Cos
t of G
as)
-41.
42%
-9.1
8%16
.14%
-2.3
2%-3
8.50
%#D
IV/0
!-6
.21%
-42.
85%
-41.
72%
-54.
65%
171.
19%
-7.5
3%-3
1.73
%-1
7.37
%57
(Dis
tribu
tion
Mar
gin
Onl
y)
May
not
cro
ss-c
heck
due
to R
ound
ing
Case No. U-17273 Witness: J.C. Hoffman Malueg
Exhibit A-16 (JCHM-2) Schedule F1.1
Page 4 of 4

Mic
higa
n P
ublic
Ser
vice
Com
mis
sion
Mic
higa
n G
as U
tiliti
es C
orpo
ratio
nH
isto
rical
Cos
t of S
ervi
ce A
lloca
tion
Stu
dyH
isto
rical
Yea
r End
ing
Dec
embe
r 31,
201
2
GA
S R
even
ue D
efic
ienc
y (E
xces
s) b
y R
ate
Sch
edul
e(A
)(B
)(C
)(D
)(E
)(F
)(G
)(H
)(I)
(J)
(K)
(L)
(N)
LIN
E
NO
.S
UM
MA
RY
OF
OP
ER
ATI
NG
INC
OM
E, R
ATE
BA
SE
, A
ND
RA
TE O
F R
ETU
RN
ALL
OC
ATI
ON
FA
CTO
RC
OR
PO
RA
TE
TOTA
LR
esid
entia
lM
ulti-
Fam
ily -
Cla
ss I
Mul
ti-Fa
mily
- C
lass
IIM
ulti-
Fam
ily -
Cla
ss
IIIM
ulti-
Fam
ily -
Cla
ss
IVS
mal
l Gen
eral
S
ervi
ceLa
rge
Gen
eral
S
ervi
ceTr
ansp
ort -
TR
-1Tr
ansp
ort -
TR
-2Tr
ansp
ort -
TR
-31
Ope
ratin
g R
even
ues:
2
Tarif
fed
Rev
enue
s11
5,65
3,99
873
,862
,290
104,
459
584,
833
125,
870
217,
436
16,2
93,9
541,
812,
396
2,37
6,82
52,
580,
580
1,56
1,89
63
O
ther
Rev
enue
s6,
967,
206
5,49
7,36
96,
912
38,0
6418
,662
33,6
1399
6,58
814
2,02
08,
334
10,9
517,
699
4To
tal O
pera
ting
Rev
enue
s:12
2,62
1,20
579
,359
,659
111,
371
622,
896
144,
532
251,
049
17,2
90,5
421,
954,
417
2,38
5,15
92,
591,
531
1,56
9,59
55 6
Ope
ratin
g E
xpen
se:
7
Ope
ratio
n &
Mai
nten
ance
: Cos
t of G
as63
,534
,006
49,4
61,8
0279
,197
452,
523
107,
788
193,
537
11,6
80,6
161,
557,
202
00
08
O
pera
tion
& M
aint
enan
ce: N
on-C
ost o
f Gas
33,6
47,7
9122
,011
,606
22,6
6068
,863
11,3
9716
,239
2,53
6,85
911
5,11
458
6,14
382
9,78
557
6,62
39
D
epre
ciat
ion
Exp
ense
- S
/L8,
115,
374
5,17
6,06
85,
509
17,0
343,
178
4,74
861
7,35
830
,052
153,
903
299,
966
230,
761
10
Tax
es o
ther
than
Inco
me
Tax
4,26
4,07
52,
387,
955
2,80
811
,323
2,52
54,
004
379,
404
36,3
7912
7,27
824
1,33
419
4,57
111
L
ES
S: I
ncom
e &
Oth
er A
dj's
Bef
ore
Inco
me
Tax
00
00
00
00
00
012
I
ncom
e Ta
xR
ate
Bas
e3,
068,
197
1,74
4,95
71,
981
7,93
91,
785
2,72
928
2,67
828
,611
84,5
1315
5,83
312
9,88
813
I
TC C
redi
t0
00
00
00
00
00
14
LE
SS
: In
com
e &
Oth
er A
dj's
Afte
r Inc
ome
Tax
00
00
00
00
00
015
Tota
l Ope
ratin
g E
xpen
se11
2,62
9,44
380
,782
,388
112,
155
557,
682
126,
673
221,
257
15,4
96,9
141,
767,
358
951,
837
1,52
6,91
81,
131,
843
16 17N
ET
OP
ER
ATI
NG
INC
OM
E (R
etur
n)9,
991,
762
(1,4
22,7
29)
(783
)65
,214
17,8
5929
,792
1,79
3,62
818
7,05
81,
433,
322
1,06
4,61
343
7,75
218
A
FUD
C A
llow
ance
00
00
00
00
00
019
In
com
e Ta
x A
ffect
of I
nt. A
llow
for R
atem
akin
gR
ateb
ase
(48,
171)
(27,
396)
(31)
(125
)(2
8)(4
3)(4
,438
)(4
49)
(1,3
27)
(2,4
47)
(2,0
39)
20A
DJU
STE
D N
ET
OP
ER
ATI
NG
INC
OM
E9,
943,
591
(1,4
50,1
25)
(814
)65
,090
17,8
3129
,749
1,78
9,19
018
6,60
91,
431,
995
1,06
2,16
643
5,71
221 22 23
RA
TE B
AS
E:
24U
tility
Pla
nt in
Ser
vice
310,
262,
591
188,
945,
153
203,
612
703,
714
140,
109
205,
556
26,5
79,7
221,
349,
921
6,82
7,57
313
,394
,990
10,5
44,3
2825
Acc
umul
ated
Dep
reci
atio
n - S
/L(1
71,6
40,3
70)
(103
,507
,760
)(1
13,5
40)
(394
,395
)(7
8,76
7)(1
19,1
64)
(14,
267,
837)
(769
,771
)(4
,058
,634
)(8
,043
,445
)(6
,351
,526
)26
Con
stru
ctio
n W
ork
in P
rogr
ess
4,13
9,15
02,
176,
604
2,82
712
,021
2,67
54,
606
343,
384
32,3
2015
2,22
230
4,66
524
0,55
527
N
et P
lant
in S
ervi
ce14
2,76
1,37
187
,613
,997
92,8
9932
1,33
964
,016
90,9
9812
,655
,270
612,
469
2,92
1,16
15,
656,
210
4,43
3,35
728 29
Gas
Sto
red
Und
ergr
ound
:16
,547
,698
7,80
0,37
911
,573
65,5
8117
,022
29,0
971,
823,
680
365,
133
574,
103
959,
466
849,
149
30Fu
el S
tock
00
00
00
00
00
031
Wor
king
Cap
ital A
llow
ance
34,9
23,2
7314
,918
,622
20,9
3711
6,68
132
,301
53,2
773,
432,
823
836,
575
1,87
4,59
63,
289,
218
2,96
7,05
932
Mat
eria
ls &
Sup
plie
s:48
8,15
232
8,75
934
892
215
023
929
,746
1,22
57,
738
15,3
3011
,410
33O
ther
- D
efer
red
Taxe
s (M
&S
/ C
WIP
)0
00
00
00
00
00
34P
repa
ymen
ts47
1,25
620
2,88
832
31,
689
404
723
43,7
364,
158
24,6
4749
,844
37,4
3235
Cas
h &
Ban
k B
alan
ces
664,
731
282,
731
451
2,36
656
61,
014
61,2
675,
954
35,4
8172
,208
55,2
8736
Pro
perty
, Pay
roll
& In
com
e Ta
xes
Acc
rued
:(1
,780
,224
)(7
71,5
51)
(1,2
30)
(6,4
03)
(1,5
33)
(2,7
44)
(165
,987
)(1
5,73
6)(9
1,94
4)(1
85,1
90)
(137
,730
)37
TOTA
L R
ATE
BA
SE
194,
076,
257
110,
375,
824
125,
302
502,
175
112,
926
172,
605
17,8
80,5
351,
809,
778
5,34
5,78
29,
857,
086
8,21
5,96
338
% o
f Rat
e B
ase
RA
TEB
ASE
100.
00%
56.8
7%0.
06%
0.26
%0.
06%
0.09
%9.
21%
0.93
%2.
75%
5.08
%4.
23%
39 40P
ER
CE
NT
RA
TE O
F R
ETU
RN
5.12
35%
-1.3
138%
-0.6
500%
12.9
616%
15.7
903%
17.2
356%
10.0
064%
10.3
112%
26.7
874%
10.7
757%
5.30
32%
41 42R
equi
red
Rat
e of
Ret
urn
7.10
74%
7.10
74%
7.10
74%
7.10
74%
7.10
74%
7.10
74%
7.10
74%
7.10
74%
7.10
74%
7.10
74%
7.10
74%
43 44R
equi
red
Ret
urn
13,7
93,7
767,
844,
851
8,90
635
,692
8,02
612
,268
1,27
0,84
112
8,62
837
9,94
670
0,58
358
3,94
145
(Req
uire
d R
etur
n %
* R
ate
Bas
e)46
Ret
urn
Inco
me
Def
icie
ncy
3,85
0,18
59,
294,
976
9,72
0(2
9,39
8)(9
,805
)(1
7,48
2)(5
18,3
49)
(57,
981)
(1,0
52,0
49)
(361
,584
)14
8,22
947
(Req
uire
d R
et -
Adj
Ope
ratin
g In
com
e)48
Inco
me
Tax
Rat
e0.
6370
49 50A
dditi
onal
Inco
me
Tax
on R
etur
n D
ef.
Rat
e B
ase
2,45
2,56
81,
394,
834
1,58
36,
346
1,42
72,
181
225,
959
22,8
7067
,555
124,
565
103,
826
51
(In
com
e D
efic
ienc
y *
Tax
Fact
or)
52R
even
ue D
efic
ienc
y6,
302,
753
10,6
89,8
1011
,304
(23,
052)
(8,3
78)
(15,
300)
(292
,390
)(3
5,11
1)(9
84,4
94)
(237
,018
)25
2,05
553 54
Rev
enue
Def
icie
ncy
%5.
45%
14.4
7%10
.82%
-3.9
4%-6
.66%
-7.0
4%-1
.79%
-1.9
4%-4
1.42
%-9
.18%
16.1
4%55
(Rev
enue
Def
/ Ta
riffe
d R
even
ues)
56R
even
ue D
efic
ienc
y %
(With
out C
ost o
f Gas
)12
.09%
43.8
1%44
.75%
-17.
42%
-46.
33%
-64.
02%
-6.3
4%-1
3.76
%-4
1.42
%-9
.18%
16.1
4%57
(Dis
tribu
tion
Mar
gin
Onl
y)
May
not
cro
ss-c
heck
due
to R
ound
ing
Case No. U-17273 Witness: J.C. Hoffman Malueg
Exhibit A-16 (JCHM-2) Schedule F1.2
Page 1 of 20

Mic
higa
n P
ublic
Ser
vice
Com
mis
sion
Mic
higa
n G
as U
tiliti
es C
orpo
ratio
nH
isto
rical
Cos
t of S
ervi
ce A
lloca
tion
Stu
dyH
isto
rical
Yea
r End
ing
Dec
embe
r 31,
201
2
GA
S R
even
ue D
efic
ienc
y (E
xces
s) b
y R
ate
Sch
edul
e(A
)(B
)(C
)
LIN
E
NO
.S
UM
MA
RY
OF
OP
ER
ATI
NG
INC
OM
E, R
ATE
BA
SE
, A
ND
RA
TE O
F R
ETU
RN
ALL
OC
ATI
ON
FA
CTO
RC
OR
PO
RA
TE
TOTA
L1
Ope
ratin
g R
even
ues:
2
Tarif
fed
Rev
enue
s11
5,65
3,99
83
O
ther
Rev
enue
s6,
967,
206
4To
tal O
pera
ting
Rev
enue
s:12
2,62
1,20
55 6
Ope
ratin
g E
xpen
se:
7
Ope
ratio
n &
Mai
nten
ance
: Cos
t of G
as63
,534
,006
8
Ope
ratio
n &
Mai
nten
ance
: Non
-Cos
t of G
as33
,647
,791
9
Dep
reci
atio
n E
xpen
se -
S/L
8,11
5,37
410
T
axes
oth
er th
an In
com
e Ta
x4,
264,
075
11
LE
SS
: Inc
ome
& O
ther
Adj
's B
efor
e In
com
e Ta
x0
12
Inc
ome
Tax
Rat
e B
ase
3,06
8,19
713
I
TC C
redi
t0
14
LE
SS
: In
com
e &
Oth
er A
dj's
Afte
r Inc
ome
Tax
015
Tota
l Ope
ratin
g E
xpen
se11
2,62
9,44
316 17
NE
T O
PE
RA
TIN
G IN
CO
ME
(Ret
urn)
9,99
1,76
218
A
FUD
C A
llow
ance
019
In
com
e Ta
x A
ffect
of I
nt. A
llow
for R
atem
akin
gR
ateb
ase
(48,
171)
20A
DJU
STE
D N
ET
OP
ER
ATI
NG
INC
OM
E9,
943,
591
21 22 23R
ATE
BA
SE
:24
Util
ity P
lant
in S
ervi
ce31
0,26
2,59
125
Acc
umul
ated
Dep
reci
atio
n - S
/L(1
71,6
40,3
70)
26C
onst
ruct
ion
Wor
k in
Pro
gres
s4,
139,
150
27
Net
Pla
nt in
Ser
vice
142,
761,
371
28 29G
as S
tore
d U
nder
grou
nd:
16,5
47,6
9830
Fuel
Sto
ck0
31W
orki
ng C
apita
l Allo
wan
ce34
,923
,273
32M
ater
ials
& S
uppl
ies:
488,
152
33O
ther
- D
efer
red
Taxe
s (M
&S
/ C
WIP
)0
34P
repa
ymen
ts47
1,25
635
Cas
h &
Ban
k B
alan
ces
664,
731
36P
rope
rty, P
ayro
ll &
Inco
me
Taxe
s A
ccru
ed:
(1,7
80,2
24)
37TO
TAL
RA
TE B
AS
E19
4,07
6,25
738
% o
f Rat
e B
ase
RA
TEB
ASE
100.
00%
39 40P
ER
CE
NT
RA
TE O
F R
ETU
RN
5.12
35%
41 42R
equi
red
Rat
e of
Ret
urn
7.10
74%
43 44R
equi
red
Ret
urn
13,7
93,7
7645
(Req
uire
d R
etur
n %
* R
ate
Bas
e)46
Ret
urn
Inco
me
Def
icie
ncy
3,85
0,18
547
(Req
uire
d R
et -
Adj
Ope
ratin
g In
com
e)48
Inco
me
Tax
Rat
e0.
6370
49 50A
dditi
onal
Inco
me
Tax
on R
etur
n D
ef.
Rat
e B
ase
2,45
2,56
851
(Inco
me
Def
icie
ncy
* Ta
x Fa
ctor
)52
Rev
enue
Def
icie
ncy
6,30
2,75
353 54
Rev
enue
Def
icie
ncy
%5.
45%
55
(R
even
ue D
ef /
Tarif
fed
Rev
enue
s)56
Rev
enue
Def
icie
ncy
% (W
ithou
t Cos
t of G
as)
12.0
9%57
(Dis
tribu
tion
Mar
gin
Onl
y)
(D)
(E)
(F)
(G)
(H)
(I)(J
)(K
)(L
)(N
)(O
)
Cus
tom
er C
hoic
e -
Res
iden
tial
Cus
tom
er C
hoic
e -
Sm
all G
SC
usto
mer
Cho
ice
- La
rge
GS
Cus
tom
er C
hoic
e -
Mul
ti-Fa
mily
IC
usto
mer
Cho
ice
- M
ulti-
Fam
ily II
Cus
tom
er C
hoic
e -
Mul
ti-Fa
mily
III
Cus
tom
er C
hoic
e -
Mul
ti-Fa
mily
IVA
gg T
rans
port
- R
esid
entia
lA
gg T
rans
port
- S
mal
l GS
Agg
Tra
nspo
rt -
Larg
e G
SS
peci
al C
ontra
ct
7,56
3,83
16,
890,
859
04,
508
14,1
194,
114
15,5
1514
,220
1,46
3,83
240
,464
121,
997
239,
361
(30,
023)
027
(198
)92
23,
336
455
(8,2
17)
104
1,22
97,
803,
192
6,86
0,83
50
4,53
513
,921
5,03
618
,851
14,6
741,
455,
615
40,5
6712
3,22
6
00
00
00
00
00
1,34
04,
134,
042
1,94
4,82
30
2,17
23,
779
1,09
13,
344
31,3
8573
1,17
210
,565
10,1
2996
8,48
348
1,76
20
527
884
321
992
1,85
511
9,40
42,
496
7345
4,90
332
1,68
30
283
587
327
1,06
41,
059
93,9
542,
565
700
00
00
00
00
00
328,
045
231,
335
020
241
525
078
874
863
,523
1,91
859
00
00
00
00
00
00
00
00
00
00
00
5,88
5,47
22,
979,
603
03,
184
5,66
51,
990
6,18
835
,047
1,00
8,05
417
,543
11,6
72
1,91
7,72
03,
881,
233
01,
351
8,25
63,
046
12,6
63(2
0,37
3)44
7,56
123
,025
111,
554
00
00
00
00
00
0(5
,150
)(3
,632
)0
(3)
(7)
(4)
(12)
(12)
(997
)(3
0)(1
)1,
912,
569
3,87
7,60
10
1,34
88,
249
3,04
312
,651
(20,
384)
446,
564
22,9
9511
1,55
3
35,2
08,0
0220
,727
,952
019
,367
35,5
0114
,285
43,2
3270
,431
5,13
4,30
611
1,67
53,
161
(19,
421,
397)
(11,
385,
630)
0(1
0,84
2)(1
9,98
0)(7
,955
)(2
4,90
5)(3
9,46
5)(2
,959
,235
)(6
4,46
2)(1
,659
)43
0,09
432
2,07
00
281
613
291
1,03
81,
078
109,
150
2,61
245
16,2
16,6
999,
664,
391
08,
806
16,1
346,
621
19,3
6532
,044
2,28
4,22
249
,825
1,54
6
1,58
1,70
51,
782,
862
01,
322
3,51
42,
718
9,24
25,
232
641,
206
24,1
1859
50
00
00
00
00
00
2,94
9,62
33,
224,
594
02,
640
6,68
56,
545
21,4
0610
,085
1,11
0,25
947
,725
1,62
362
,128
23,6
810
3450
1447
113
6,10
610
93
00
00
00
00
00
042
,576
45,0
010
3283
4115
413
517
,029
357
459
,341
63,0
570
4511
657
214
188
23,8
6951
36
(161
,860
)(1
70,7
00)
0(1
23)
(315
)(1
55)
(584
)(5
12)
(64,
565)
(1,3
46)
(15)
20,7
50,2
1214
,632
,887
012
,755
26,2
6715
,841
49,8
4447
,284
4,01
8,12
512
1,30
23,
762
10.6
9%7.
54%
0.00
%0.
01%
0.01
%0.
01%
0.03
%0.
02%
2.07
%0.
06%
0.00
%
9.21
71%
26.4
992%
#DIV
/0!
10.5
665%
31.4
053%
19.2
067%
25.3
808%
-43.
1104
%11
.113
7%18
.956
6%2,
965.
1153
%
7.10
74%
7.10
74%
7.10
74%
7.10
74%
7.10
74%
7.10
74%
7.10
74%
7.10
74%
7.10
74%
7.10
74%
7.10
74%
1,47
4,80
11,
040,
018
090
71,
867
1,12
63,
543
3,36
128
5,58
48,
621
267
(437
,769
)(2
,837
,583
)0
(441
)(6
,382
)(1
,917
)(9
,108
)23
,745
(160
,980
)(1
4,37
3)(1
11,2
86)
262,
223
184,
918
016
133
220
063
059
850
,778
1,53
348
(175
,546
)(2
,652
,665
)0
(280
)(6
,050
)(1
,716
)(8
,478
)24
,343
(110
,202
)(1
2,84
0)(1
11,2
38)
-2.3
2%-3
8.50
%#D
IV/0
!-6
.21%
-42.
85%
-41.
72%
-54.
65%
171.
19%
-7.5
3%-3
1.73
%-9
1.18
%
-2.3
2%-3
8.50
%#D
IV/0
!-6
.21%
-42.
85%
-41.
72%
-54.
65%
171.
19%
-7.5
3%-3
1.73
%-9
2.19
%
May
not
cro
ss-c
heck
due
to R
ound
ing
Case No. U-17273 Witness: J.C. Hoffman Malueg
Exhibit A-16 (JCHM-2) Schedule F1.2
Page 2 of 20

Mic
higa
n P
ublic
Ser
vice
Com
mis
sion
Mic
higa
n G
as U
tiliti
es C
orpo
ratio
nH
isto
rical
Cos
t of S
ervi
ce A
lloca
tion
Stu
dyH
isto
rical
Yea
r End
ing
Dec
embe
r 31,
201
2
ALL
OC
ATI
ON
OF
OP
ER
ATI
NG
RE
VE
NU
E(A
)(B
)(C
)(D
)(E
)(F
)(G
)(H
)(I)
(J)
(K)
(L)
(N)
LIN
E
NO
.D
ES
CR
IPTI
ON
ALL
OC
ATI
ON
FA
CTO
RC
OR
PO
RA
TE
TOTA
LR
esid
entia
lM
ulti-
Fam
ily -
Cla
ss I
Mul
ti-Fa
mily
- C
lass
IIM
ulti-
Fam
ily -
Cla
ss
IIIM
ulti-
Fam
ily -
Cla
ss
IVS
mal
l Gen
eral
S
ervi
ceLa
rge
Gen
eral
S
ervi
ceTr
ansp
ort -
TR
-1Tr
ansp
ort -
TR
-2Tr
ansp
ort -
TR
-31
GA
S O
PE
RA
TIN
G R
EV
EN
UE
SD
irect
115,
653,
998
73,8
62,2
9010
4,45
958
4,83
312
5,87
021
7,43
616
,293
,954
1,81
2,39
62,
376,
825
2,58
0,58
01,
561,
896
2 3O
THE
R O
PE
RA
TIN
G IN
CO
ME
:4
Acc
t 487
- La
te P
aym
ent R
evM
argi
n R
even
ue47
6,00
422
2,84
623
11,
208
165
218
42,1
332,
331
21,7
0723
,568
14,2
655
Acc
t 488
- M
isce
llane
ous
Rev
enue
Cus
tom
er26
3,64
020
3,87
619
131
723
1812
,715
4517
761
106
Acc
t 493
- R
ent f
rom
Gas
Pro
perty
Rat
e B
ase
5,55
63,
160
414
35
512
5215
328
223
57
Acc
t 494
- In
terd
epar
tmen
tal R
ents
00
00
00
00
00
08
Acc
t 495
- O
ther
Gas
Rev
enue
9
Mis
cella
neou
s:10
M
isce
llane
ous
Cus
tom
er28
5,09
322
0,46
620
634
324
1913
,750
4819
266
1011
U
ETM
:D
irect
(311
,057
)(1
94,2
82)
(248
)(1
,186
)(2
89)
(154
)(5
9,27
8)(4
,352
)(1
3,95
6)(1
3,14
0)(6
,916
)12
S
ub-T
otal
: M
isce
llane
ous
495
(25,
965)
26,1
84(4
2)(8
43)
(264
)(1
35)
(45,
528)
(4,3
04)
(13,
765)
(13,
074)
(6,9
05)
13 14
Cus
tom
er P
enal
ties
Sal
es32
4,18
825
2,38
340
42,
309
550
988
59,6
017,
946
00
015
M
I Gas
Tru
e-up
Sal
es5,
395,
900
4,20
0,75
76,
726
38,4
329,
154
16,4
3799
2,02
713
2,25
20
00
16
Gas
Tra
nspo
rt Tr
ue-U
pS
ales
150,
084
116,
842
187
1,06
925
545
727
,593
3,67
90
00
17
IL
Tax
Fee
Rat
e B
ase
2,23
31,
270
16
12
206
2162
113
9518
R
ider
VB
A E
stim
ated
Adj
ustm
ent:
19
Res
iden
tial
Thru
-put
- R
esid
entia
l72
,507
59,8
810
00
00
00
00
20
Sm
all G
S &
Sm
all M
ulti-
Fam
ilyTh
ru-p
ut -
Sm
all G
S &
MF
1,04
1,85
30
2,85
916
,334
00
421,
627
00
00
21
Larg
e M
ulti-
Fam
ilyTh
ru-p
ut -
Larg
e M
F20
,838
00
06,
384
11,4
620
00
00
22
To
tal R
even
ue D
ecou
plin
g1,
135,
198
59,8
812,
859
16,3
346,
384
11,4
6242
1,62
70
00
023 24
R
even
ue D
ecou
plin
gD
irect
(759
,632
)41
0,17
0(3
,649
)(2
0,78
3)2,
391
4,16
1(5
14,2
98)
00
00
25 26TO
TAL
OTH
ER
RE
VE
NU
E6,
967,
206
5,49
7,36
96,
912
38,0
6418
,662
33,6
1399
6,58
814
2,02
08,
334
10,9
517,
699
27 28TO
TAL
OP
ER
ATI
NG
RE
VE
NU
E12
2,62
1,20
579
,359
,659
111,
371
622,
896
144,
532
251,
049
17,2
90,5
421,
954,
417
2,38
5,15
92,
591,
531
1,56
9,59
529 30 31
Gas
Ope
ratin
g R
even
ues
Line
1 a
bove
115,
653,
998
73,8
62,2
9010
4,45
958
4,83
312
5,87
021
7,43
616
,293
,954
1,81
2,39
62,
376,
825
2,58
0,58
01,
561,
896
32
Pur
chas
ed G
as C
ost -
CO
GP
age
5 &
6, L
ine
263
,534
,006
49,4
61,8
0279
,197
452,
523
107,
788
193,
537
11,6
80,6
161,
557,
202
00
033
TO
TAL
MA
RG
IN R
EV
EN
UE
52,1
19,9
9224
,400
,488
25,2
6213
2,30
918
,082
23,8
994,
613,
338
255,
194
2,37
6,82
52,
580,
580
1,56
1,89
634
MA
RG
IN R
EVEN
UE
100.
00%
46.8
160%
0.04
85%
0.25
39%
0.03
47%
0.04
59%
8.85
14%
0.48
96%
4.56
03%
4.95
12%
2.99
67%
May
not
cro
ss-c
heck
due
to R
ound
ing
Case No. U-17273 Witness: J.C. Hoffman Malueg
Exhibit A-16 (JCHM-2) Schedule F1.2
Page 3 of 20

Mic
higa
n P
ublic
Ser
vice
Com
mis
sion
Mic
higa
n G
as U
tiliti
es C
orpo
ratio
nH
isto
rical
Cos
t of S
ervi
ce A
lloca
tion
Stu
dyH
isto
rical
Yea
r End
ing
Dec
embe
r 31,
201
2
ALL
OC
ATI
ON
OF
OP
ER
ATI
NG
RE
VE
NU
E(A
)(B
)(C
)
LIN
E
NO
.D
ES
CR
IPTI
ON
ALL
OC
ATI
ON
FA
CTO
RC
OR
PO
RA
TE
TOTA
L1
GA
S O
PE
RA
TIN
G R
EV
EN
UE
SD
irect
115,
653,
998
2 3O
THE
R O
PE
RA
TIN
G IN
CO
ME
:4
Acc
t 487
- La
te P
aym
ent R
evM
argi
n R
even
ue47
6,00
45
Acc
t 488
- M
isce
llane
ous
Rev
enue
Cus
tom
er26
3,64
06
Acc
t 493
- R
ent f
rom
Gas
Pro
perty
Rat
e B
ase
5,55
67
Acc
t 494
- In
terd
epar
tmen
tal R
ents
08
Acc
t 495
- O
ther
Gas
Rev
enue
9
Mis
cella
neou
s:10
M
isce
llane
ous
Cus
tom
er28
5,09
311
U
ETM
:D
irect
(311
,057
)12
S
ub-T
otal
: M
isce
llane
ous
495
(25,
965)
13 14
Cus
tom
er P
enal
ties
Sal
es32
4,18
815
M
I Gas
Tru
e-up
Sal
es5,
395,
900
16
Gas
Tra
nspo
rt Tr
ue-U
pS
ales
150,
084
17
IL
Tax
Fee
Rat
e B
ase
2,23
318
R
ider
VB
A E
stim
ated
Adj
ustm
ent:
19
Res
iden
tial
Thru
-put
- R
esid
entia
l72
,507
20
Sm
all G
S &
Sm
all M
ulti-
Fam
ilyTh
ru-p
ut -
Sm
all G
S &
MF
1,04
1,85
321
La
rge
Mul
ti-Fa
mily
Thru
-put
- La
rge
MF
20,8
3822
Tota
l Rev
enue
Dec
oupl
ing
1,13
5,19
823 24
R
even
ue D
ecou
plin
gD
irect
(759
,632
)25 26
TOTA
L O
THE
R R
EV
EN
UE
6,96
7,20
627 28
TOTA
L O
PE
RA
TIN
G R
EV
EN
UE
122,
621,
205
29 30 31G
as O
pera
ting
Rev
enue
sLi
ne 1
abo
ve11
5,65
3,99
832
P
urch
ased
Gas
Cos
t - C
OG
Pag
e 5
& 6
, Lin
e 2
63,5
34,0
0633
TO
TAL
MA
RG
IN R
EV
EN
UE
52,1
19,9
9234
MA
RG
IN R
EVEN
UE
100.
00%
(D)
(E)
(F)
(G)
(H)
(I)(J
)(K
)(L
)(N
)(O
)
Cus
tom
er C
hoic
e -
Res
iden
tial
Cus
tom
er C
hoic
e -
Sm
all G
SC
usto
mer
Cho
ice
- La
rge
GS
Cus
tom
er C
hoic
e -
Mul
ti-Fa
mily
IC
usto
mer
Cho
ice
- M
ulti-
Fam
ily II
Cus
tom
er C
hoic
e -
Mul
ti-Fa
mily
III
Cus
tom
er C
hoic
e -
Mul
ti-Fa
mily
IVA
gg T
rans
port
- R
esid
entia
lA
gg T
rans
port
- S
mal
l GS
Agg
Tra
nspo
rt -
Larg
e G
SS
peci
al C
ontra
ct7,
563,
831
6,89
0,85
90
4,50
814
,119
4,11
415
,515
14,2
201,
463,
832
40,4
6412
1,99
7
69,0
7962
,933
041
129
3814
213
013
,369
370
1,10
237
,549
7,78
90
1819
22
5576
75
259
441
90
01
01
111
53
00
00
00
00
00
00
40,6
058,
423
020
212
260
829
52
(3,8
55)
(7,6
37)
0(3
8)(1
44)
0(3
43)
(66)
(4,8
93)
(280
)0
36,7
5078
60
(18)
(123
)2
(341
)(7
)(4
,064
)(2
75)
2
00
00
00
00
00
70
00
00
00
00
011
40
00
00
00
00
03
239
168
00
00
11
461
0
12,5
860
00
00
040
00
00
434,
951
028
380
00
00
164,
998
00
00
00
062
52,
367
00
00
12,5
8643
4,95
10
283
800
625
2,36
740
164,
998
00
82,5
64(5
37,0
70)
0(2
98)
(1,0
25)
255
1,16
523
4(1
83,4
49)
00
239,
361
(30,
023)
027
(198
)92
23,
336
455
(8,2
17)
104
1,22
9
7,80
3,19
26,
860,
835
04,
535
13,9
215,
036
18,8
5114
,674
1,45
5,61
540
,567
123,
226
7,56
3,83
16,
890,
859
04,
508
14,1
194,
114
15,5
1514
,220
1,46
3,83
240
,464
121,
997
00
00
00
00
00
1,34
07,
563,
831
6,89
0,85
90
4,50
814
,119
4,11
415
,515
14,2
201,
463,
832
40,4
6412
0,65
714
.512
3%13
.221
1%0.
0000
%0.
0086
%0.
0271
%0.
0079
%0.
0298
%0.
0273
%2.
8086
%0.
0776
%0.
2315
%
May
not
cro
ss-c
heck
due
to R
ound
ing
Case No. U-17273 Witness: J.C. Hoffman Malueg
Exhibit A-16 (JCHM-2) Schedule F1.2
Page 4 of 20

Mic
higa
n P
ublic
Ser
vice
Com
mis
sion
Mic
higa
n G
as U
tiliti
es C
orpo
ratio
nH
isto
rical
Cos
t of S
ervi
ce A
lloca
tion
Stu
dyH
isto
rical
Yea
r End
ing
Dec
embe
r 31,
201
2
ALL
OC
ATI
ON
OF
OP
ER
ATI
ON
& M
AIN
TEN
AN
CE
(A)
(B)
(C)
(D)
(E)
(F)
(G)
(H)
(I)(J
)(K
)(L
)(N
)
LIN
E
NO
.D
ES
CR
IPTI
ON
ALL
OC
ATI
ON
FA
CTO
RC
OR
PO
RA
TE
TOTA
LR
esid
entia
lM
ulti-
Fam
ily -
Cla
ss I
Mul
ti-Fa
mily
- C
lass
IIM
ulti-
Fam
ily -
Cla
ss
IIIM
ulti-
Fam
ily -
Cla
ss
IVS
mal
l Gen
eral
S
ervi
ceLa
rge
Gen
eral
S
ervi
ceTr
ansp
ort -
TR
-1Tr
ansp
ort -
TR
-2Tr
ansp
ort -
TR
-31
Pro
duct
ion:
2
Pur
chas
ed G
as C
ost -
CO
GS
ales
63,5
34,0
0649
,461
,802
79,1
9745
2,52
310
7,78
819
3,53
711
,680
,616
1,55
7,20
20
00
3
Gas
Sup
ply
Acq
uisi
tion
Sal
es72
2,01
556
2,09
590
05,
143
1,22
52,
199
132,
741
17,6
960
00
4
Pro
duct
ion
Dem
and
Wei
ghte
d P
eak
Dem
and
376,
862
161,
635
259
1,34
432
057
534
,696
3,10
519
,988
40,6
1530
,354
5
Sto
rage
Cos
tS
tora
ge50
0,60
123
5,97
735
01,
984
515
880
55,1
7011
,046
17,3
6829
,026
25,6
886
T
otal
Pro
duct
ion
65,1
33,4
8450
,421
,509
80,7
0646
0,99
410
9,84
819
7,19
211
,903
,223
1,58
9,05
037
,356
69,6
4156
,043
7 8
Tra
nsm
issi
on9
M
inim
um S
yste
m -
Thro
ughp
ut P
iece
MC
F Th
roug
hput
32,3
3911
,494
1810
525
452,
714
362
2,18
64,
733
4,32
010
D
eman
d R
elat
ed S
yste
mW
eigh
ted
Pea
k D
eman
d30
1,53
012
9,32
520
71,
075
256
460
27,7
612,
485
15,9
9332
,496
24,2
8711
T
otal
Tra
nsm
issi
on33
3,86
914
0,81
922
51,
181
281
505
30,4
752,
846
18,1
7837
,229
28,6
0712 13
Dis
tribu
tion:
1430
2/30
3W
eigh
ted
Pea
k D
eman
d3,
867
1,65
83
143
635
632
205
417
311
1537
4W
eigh
ted
Pea
k D
eman
d5,
701
2,44
54
205
952
547
302
614
459
1637
5W
eigh
ted
Pea
k D
eman
d5,
980
2,56
54
215
955
149
317
644
482
1737
6 (D
eman
d)W
eigh
ted
Pea
k D
eman
d1,
575,
004
675,
514
1,08
25,
618
1,33
82,
403
145,
004
12,9
7883
,536
169,
741
126,
859
1837
6 (F
ixed
Cos
t)C
usto
mer
1,85
9,56
71,
438,
029
1,34
72,
237
159
124
89,6
8731
51,
251
430
6719
377
MC
F Th
roug
hput
00
00
00
00
00
020
378
Wei
ghte
d P
eak
Dem
and
151,
593
65,0
1810
454
112
923
113
,957
1,24
98,
040
16,3
3712
,210
2137
9W
eigh
ted
Pea
k D
eman
d12
8,89
655
,283
8946
011
019
711
,867
1,06
26,
836
13,8
9110
,382
2238
0S
ervi
ces
1,95
2,25
91,
516,
369
1,42
02,
225
158
124
89,2
3431
31,
675
576
9023
381
Met
ers
1,98
7,14
01,
091,
899
665
5,02
21,
244
509
441,
519
1,58
48,
318
2,84
034
824
382
Met
ers
00
00
00
00
00
025
383
Cus
tom
er82
1,86
963
5,56
359
598
970
5539
,639
139
553
190
3026
385
Acc
t 385
Dem
and
33,6
570
00
00
01,
108
7,13
114
,490
10,8
2927
T
otal
Dis
tribu
tion
8,52
5,53
45,
484,
343
5,31
217
,146
3,22
13,
666
832,
338
18,8
7611
8,16
522
0,17
216
2,06
828 29
Cus
tom
er A
ccou
nts:
30
Allo
cabl
eC
usto
mer
7,72
7,03
95,
975,
426
5,59
79,
294
660
517
372,
674
1,30
95,
197
1,78
728
031
D
irect
Tra
nspo
rtTr
ansp
ort C
ust
274,
233
00
00
00
045
,249
15,5
562,
435
32
Cus
tom
er -
Acc
t 904
Allo
cabl
eM
argi
n R
even
ue1,
440,
571
674,
418
698
3,65
750
066
112
7,51
07,
053
65,6
9471
,326
43,1
7033
To
tal C
usto
mer
Acc
ount
s:9,
441,
843
6,64
9,84
36,
295
12,9
511,
160
1,17
750
0,18
58,
362
116,
140
88,6
6945
,885
34 35C
usto
mer
Ser
vice
s:M
argi
n R
even
ue69
0,77
832
3,39
533
51,
754
240
317
61,1
433,
382
31,5
0234
,202
20,7
0136
Cus
tom
er S
ales
:D
irect
00
00
00
00
00
037
Tota
l Cus
tom
er:
10,1
32,6
216,
973,
238
6,63
014
,705
1,40
01,
494
561,
328
11,7
4514
7,64
112
2,87
166
,585
38 39 40A
lloc
% o
f Dis
tribu
tion
Dem
and
O&
M
41
(not
incl
udin
g D
irect
Allo
cate
d):
Dis
t O&
M D
eman
d R
elat
ed10
0.00
%42
.13%
0.07
%0.
35%
0.08
%0.
15%
9.04
%0.
87%
5.58
%11
.35%
8.48
%42
Allo
c %
of C
usto
mer
O&
M (n
ot D
irect
Allo
cate
d):
Cus
tom
er O
&M
100.
00%
70.7
3%0.
07%
0.15
%0.
01%
0.02
%5.
69%
0.12
%1.
04%
1.09
%0.
65%
43 44 A
dmin
istra
tive
& G
ener
al:
45
Pur
chas
ed G
as C
ost
Sal
es0
00
00
00
00
00
46
Gas
Sup
ply
Acq
uisi
tion
Cos
tS
ales
555,
940
432,
805
693
3,96
094
31,
694
102,
209
13,6
260
00
47
Pro
duct
ion
Dem
and
Wei
ghte
d P
eak
Dem
and
290,
178
124,
456
199
1,03
524
744
326
,715
2,39
115
,391
31,2
7323
,372
48
Sto
rage
Cos
tS
tora
ge25
1,39
311
8,50
317
699
625
944
227
,705
5,54
78,
722
14,5
7612
,900
49
Dis
tribu
tion
Dem
and
Dis
t O&
M D
eman
d R
elat
ed1,
899,
958
800,
486
1,28
26,
657
1,58
62,
847
171,
830
16,4
8310
6,10
321
5,59
816
1,13
150
C
usto
mer
Cus
tom
er O
&M
9,86
4,05
96,
977,
249
6,63
314
,713
1,40
11,
495
561,
651
11,7
5110
2,45
110
7,37
664
,187
51
Tra
nspo
rt A
lloca
ble
Tran
spor
t Cus
t19
4,76
10
00
00
00
32,1
3611
,048
1,72
952
Tota
l Adm
inis
trativ
e an
d G
ener
al13
,056
,289
8,45
3,49
98,
983
27,3
614,
434
6,92
089
0,11
149
,799
264,
803
379,
872
263,
320
53 54 55To
tal O
pera
tion
& M
aint
enan
ce97
,181
,797
71,4
73,4
0810
1,85
752
1,38
611
9,18
420
9,77
614
,217
,475
1,67
2,31
658
6,14
382
9,78
557
6,62
3
May
not
cro
ss-c
heck
due
to R
ound
ing
Case No. U-17273 Witness: J.C. Hoffman Malueg
Exhibit A-16 (JCHM-2) Schedule F1.2
Page 5 of 20

Mic
higa
n P
ublic
Ser
vice
Com
mis
sion
Mic
higa
n G
as U
tiliti
es C
orpo
ratio
nH
isto
rical
Cos
t of S
ervi
ce A
lloca
tion
Stu
dyH
isto
rical
Yea
r End
ing
Dec
embe
r 31,
201
2
ALL
OC
ATI
ON
OF
OP
ER
ATI
ON
& M
AIN
TEN
AN
CE
(A)
(B)
(C)
LIN
E
NO
.D
ES
CR
IPTI
ON
ALL
OC
ATI
ON
FA
CTO
RC
OR
PO
RA
TE
TOTA
L1
Pro
duct
ion:
2
Pur
chas
ed G
as C
ost -
CO
GS
ales
63,5
34,0
063
G
as S
uppl
y A
cqui
sitio
nS
ales
722,
015
4
Pro
duct
ion
Dem
and
Wei
ghte
d P
eak
Dem
and
376,
862
5
Sto
rage
Cos
tS
tora
ge50
0,60
16
T
otal
Pro
duct
ion
65,1
33,4
847 8
T
rans
mis
sion
9
Min
imum
Sys
tem
- Th
roug
hput
Pie
ceM
CF
Thro
ughp
ut32
,339
10
Dem
and
Rel
ated
Sys
tem
Wei
ghte
d P
eak
Dem
and
301,
530
11
Tot
al T
rans
mis
sion
333,
869
12 13D
istri
butio
n:14
302/
303
Wei
ghte
d P
eak
Dem
and
3,86
715
374
Wei
ghte
d P
eak
Dem
and
5,70
116
375
Wei
ghte
d P
eak
Dem
and
5,98
017
376
(Dem
and)
Wei
ghte
d P
eak
Dem
and
1,57
5,00
418
376
(Fix
ed C
ost)
Cus
tom
er1,
859,
567
1937
7M
CF
Thro
ughp
ut0
2037
8W
eigh
ted
Pea
k D
eman
d15
1,59
321
379
Wei
ghte
d P
eak
Dem
and
128,
896
2238
0S
ervi
ces
1,95
2,25
923
381
Met
ers
1,98
7,14
024
382
Met
ers
025
383
Cus
tom
er82
1,86
926
385
Acc
t 385
Dem
and
33,6
5727
T
otal
Dis
tribu
tion
8,52
5,53
428 29
Cus
tom
er A
ccou
nts:
30
Allo
cabl
eC
usto
mer
7,72
7,03
931
D
irect
Tra
nspo
rtTr
ansp
ort C
ust
274,
233
32
Cus
tom
er -
Acc
t 904
Allo
cabl
eM
argi
n R
even
ue1,
440,
571
33
Tota
l Cus
tom
er A
ccou
nts:
9,44
1,84
334 35
Cus
tom
er S
ervi
ces:
Mar
gin
Rev
enue
690,
778
36C
usto
mer
Sal
es:
Dire
ct0
37To
tal C
usto
mer
:10
,132
,621
38 39 40A
lloc
% o
f Dis
tribu
tion
Dem
and
O&
M
41
(not
incl
udin
g D
irect
Allo
cate
d):
Dis
t O&
M D
eman
d R
elat
ed10
0.00
%42
Allo
c %
of C
usto
mer
O&
M (n
ot D
irect
Allo
cate
d):
Cus
tom
er O
&M
100.
00%
43 44 A
dmin
istra
tive
& G
ener
al:
45
Pur
chas
ed G
as C
ost
Sal
es0
46
Gas
Sup
ply
Acq
uisi
tion
Cos
tS
ales
555,
940
47
Pro
duct
ion
Dem
and
Wei
ghte
d P
eak
Dem
and
290,
178
48
Sto
rage
Cos
tS
tora
ge25
1,39
349
D
istri
butio
n D
eman
dD
ist O
&M
Dem
and
Rel
ated
1,89
9,95
850
C
usto
mer
Cus
tom
er O
&M
9,86
4,05
951
T
rans
port
Allo
cabl
eTr
ansp
ort C
ust
194,
761
52
To
tal A
dmin
istra
tive
and
Gen
eral
13,0
56,2
8953 54 55
Tota
l Ope
ratio
n &
Mai
nten
ance
97,1
81,7
97
(D)
(E)
(F)
(G)
(H)
(I)(J
)(K
)(L
)(N
)(O
)
Cus
tom
er C
hoic
e -
Res
iden
tial
Cus
tom
er C
hoic
e -
Sm
all G
SC
usto
mer
Cho
ice
- La
rge
GS
Cus
tom
er C
hoic
e -
Mul
ti-Fa
mily
IC
usto
mer
Cho
ice
- M
ulti-
Fam
ily II
Cus
tom
er C
hoic
e -
Mul
ti-Fa
mily
III
Cus
tom
er C
hoic
e -
Mul
ti-Fa
mily
IVA
gg T
rans
port
- R
esid
entia
lA
gg T
rans
port
- S
mal
l GS
Agg
Tra
nspo
rt -
Larg
e G
SS
peci
al C
ontra
ct
00
00
00
00
00
1,34
00
00
00
00
00
015
33,9
7435
,793
026
6631
119
107
13,5
7827
43
47,8
5053
,935
040
106
8228
015
819
,398
730
1881
,824
89,7
280
6617
211
439
826
532
,976
1,00
41,
376
2,41
62,
800
02
52
98
1,06
232
027
,183
28,6
380
2153
2595
8610
,864
219
229
,599
31,4
380
2258
2810
493
11,9
2625
12
349
367
00
10
11
139
30
514
541
00
10
22
205
40
539
568
00
10
22
215
40
141,
986
149,
586
010
727
513
149
644
856
,746
1,14
611
264,
850
54,9
420
128
136
1111
391
5,40
833
110
00
00
00
00
00
13,6
6614
,398
010
2613
4843
5,46
211
01
11,6
2012
,242
09
2311
4137
4,64
494
127
9,27
954
,665
013
513
611
1141
25,
381
3311
153,
831
259,
689
037
170
117
4224
018
,888
130
480
00
00
00
00
00
117,
055
24,2
830
5760
55
173
2,39
014
50
00
00
00
00
981
983,
689
571,
281
048
482
930
065
91,
747
99,4
781,
669
90
1,10
0,53
022
8,30
00
532
567
4747
1,62
322
,472
136
470
00
00
00
14,1
3619
5,67
31,
184
020
9,06
119
0,46
00
125
390
114
429
393
40,4
601,
118
3,33
51,
309,
590
418,
760
065
795
716
047
516
,153
258,
604
2,43
83,
381
100,
248
91,3
290
6018
755
206
188
19,4
0153
61,
599
00
00
00
00
00
01,
409,
838
510,
089
071
61,
144
215
681
16,3
4127
8,00
62,
974
4,98
1
8.86
%9.
33%
0.00
%0.
01%
0.02
%0.
01%
0.03
%0.
03%
3.54
%0.
08%
0.00
%14
.30%
5.17
%0.
00%
0.01
%0.
01%
0.00
%0.
01%
0.02
%0.
84%
0.02
%0.
05%
00
00
00
00
00
00
00
00
00
00
012
26,1
5927
,560
020
5124
9183
10,4
5521
12
24,0
2927
,085
020
5341
140
799,
741
366
916
8,25
417
7,26
00
127
326
155
588
531
67,2
441,
456
141,
410,
649
510,
382
071
71,
145
215
681
2,20
682
,380
1,79
24,
983
00
00
00
010
,039
138,
967
841
01,
629,
092
742,
287
088
41,
575
436
1,50
112
,938
308,
787
4,66
65,
021
4,13
4,04
21,
944,
823
02,
172
3,77
91,
091
3,34
431
,385
731,
172
10,5
6511
,469
May
not
cro
ss-c
heck
due
to R
ound
ing
Case No. U-17273 Witness: J.C. Hoffman Malueg
Exhibit A-16 (JCHM-2) Schedule F1.2
Page 6 of 20

Mic
higa
n P
ublic
Ser
vice
Com
mis
sion
Mic
higa
n G
as U
tiliti
es C
orpo
ratio
nH
isto
rical
Cos
t of S
ervi
ce A
lloca
tion
Stu
dyH
isto
rical
Yea
r End
ing
Dec
embe
r 31,
201
2
ALL
OC
ATI
ON
OF
DE
PR
EC
IATI
ON
EX
PE
NS
E(A
)(B
)(C
)(D
)(E
)(F
)(G
)(H
)(I)
(J)
(K)
(L)
(N)
LIN
E
NO
.D
ES
CR
IPTI
ON
ALL
OC
ATI
ON
FA
CTO
RC
OR
PO
RA
TE
TOTA
LR
esid
entia
lM
ulti-
Fam
ily -
Cla
ss I
Mul
ti-Fa
mily
- C
lass
IIM
ulti-
Fam
ily -
Cla
ss
IIIM
ulti-
Fam
ily -
Cla
ss
IVS
mal
l Gen
eral
S
ervi
ceLa
rge
Gen
eral
S
ervi
ceTr
ansp
ort -
TR
-1Tr
ansp
ort -
TR
-2Tr
ansp
ort -
TR
-31
DE
PR
EC
IATI
ON
EX
PE
NS
E -
S/L
:2
P
rodu
ctio
n:3
P
urch
ased
Gas
Cos
tS
ales
00
00
00
00
00
04
P
rodu
ctio
n D
eman
dW
eigh
ted
Pea
k D
eman
d56
,881
24,3
9639
203
4887
5,23
746
93,
017
6,13
04,
581
5
Sto
rage
Cos
tS
tora
ge34
1,06
316
0,77
323
91,
352
351
600
37,5
887,
526
11,8
3319
,775
17,5
026
T
otal
Pro
duct
ion
397,
944
185,
169
278
1,55
539
968
642
,824
7,99
414
,850
25,9
0622
,083
7 8
Tra
nsm
issi
on9
M
inim
um S
yste
m -
Thro
ughp
ut P
iece
MC
F Th
roug
hput
212,
084
75,3
7912
169
016
429
517
,801
2,37
314
,334
31,0
4028
,329
10
Dem
and
Rel
ated
Sys
tem
Wei
ghte
d P
eak
Dem
and
275,
591
118,
200
189
983
234
420
25,3
722,
271
14,6
1729
,701
22,1
9811
T
otal
Tra
nsm
issi
on48
7,67
519
3,57
931
01,
673
398
715
43,1
744,
644
28,9
5160
,741
50,5
2712 13
D
istri
butio
n14
302/
303
Wei
ghte
d P
eak
Dem
and
976
419
13
11
908
5210
579
1537
4W
eigh
ted
Pea
k D
eman
d4,
181
1,79
33
154
638
534
222
451
337
1637
5W
eigh
ted
Pea
k D
eman
d3,
363
1,44
22
123
531
028
178
362
271
1737
6 (D
eman
d)W
eigh
ted
Pea
k D
eman
d1,
706,
422
731,
879
1,17
26,
086
1,45
02,
603
157,
103
14,0
6090
,506
183,
904
137,
444
1837
6 (F
ixed
Cos
t)C
usto
mer
2,01
4,72
81,
558,
017
1,45
92,
423
172
135
97,1
7034
11,
355
466
7319
377
MC
F Th
roug
hput
00
00
00
00
00
020
378
Wei
ghte
d P
eak
Dem
and
175,
857
75,4
2512
162
714
926
816
,190
1,44
99,
327
18,9
5214
,164
2137
9W
eigh
ted
Pea
k D
eman
d(1
,315
)(5
64)
(1)
(5)
(1)
(2)
(121
)(1
1)(7
0)(1
42)
(106
)22
380
Ser
vice
s2,
311,
223
1,79
5,18
51,
681
2,63
518
714
610
5,64
237
11,
983
682
107
2338
1M
eter
s61
2,32
333
6,46
120
51,
547
383
157
136,
051
488
2,56
387
510
724
382
Met
ers
00
00
00
00
00
025
383
Cus
tom
er38
4,40
229
7,26
327
846
233
2618
,540
6525
989
1426
385
Acc
t 385
Dem
and
17,5
940
00
00
057
93,
728
7,57
55,
661
27
Tot
al D
istri
butio
n7,
229,
755
4,79
7,32
04,
922
13,8
072,
381
3,34
653
1,36
017
,413
110,
103
213,
320
158,
151
28 29
Cus
tom
erC
usto
mer
00
00
00
00
00
030
Tota
l Dep
reci
atio
n E
xpen
se -
S/L
8,11
5,37
45,
176,
068
5,50
917
,034
3,17
84,
748
617,
358
30,0
5215
3,90
329
9,96
623
0,76
131 32 33
Am
ortiz
atio
ns (4
06/4
07)
00
00
00
00
00
034 35 36
Tota
l Dep
reci
atio
n &
Am
ortiz
atio
n E
xpen
ses:
8,11
5,37
45,
176,
068
5,50
917
,034
3,17
84,
748
617,
358
30,0
5215
3,90
329
9,96
623
0,76
1
May
not
cro
ss-c
heck
due
to R
ound
ing
Case No. U-17273 Witness: J.C. Hoffman Malueg
Exhibit A-16 (JCHM-2) Schedule F1.2
Page 7 of 20

Mic
higa
n P
ublic
Ser
vice
Com
mis
sion
Mic
higa
n G
as U
tiliti
es C
orpo
ratio
nH
isto
rical
Cos
t of S
ervi
ce A
lloca
tion
Stu
dyH
isto
rical
Yea
r End
ing
Dec
embe
r 31,
201
2
ALL
OC
ATI
ON
OF
DE
PR
EC
IATI
ON
EX
PE
NS
E(A
)(B
)(C
)
LIN
E
NO
.D
ES
CR
IPTI
ON
ALL
OC
ATI
ON
FA
CTO
RC
OR
PO
RA
TE
TOTA
L1
DE
PR
EC
IATI
ON
EX
PE
NS
E -
S/L
:2
P
rodu
ctio
n:3
P
urch
ased
Gas
Cos
tS
ales
04
P
rodu
ctio
n D
eman
dW
eigh
ted
Pea
k D
eman
d56
,881
5
Sto
rage
Cos
tS
tora
ge34
1,06
36
T
otal
Pro
duct
ion
397,
944
7 8
Tra
nsm
issi
on9
M
inim
um S
yste
m -
Thro
ughp
ut P
iece
MC
F Th
roug
hput
212,
084
10
Dem
and
Rel
ated
Sys
tem
Wei
ghte
d P
eak
Dem
and
275,
591
11
Tot
al T
rans
mis
sion
487,
675
12 13
Dis
tribu
tion
1430
2/30
3W
eigh
ted
Pea
k D
eman
d97
615
374
Wei
ghte
d P
eak
Dem
and
4,18
116
375
Wei
ghte
d P
eak
Dem
and
3,36
317
376
(Dem
and)
Wei
ghte
d P
eak
Dem
and
1,70
6,42
218
376
(Fix
ed C
ost)
Cus
tom
er2,
014,
728
1937
7M
CF
Thro
ughp
ut0
2037
8W
eigh
ted
Pea
k D
eman
d17
5,85
721
379
Wei
ghte
d P
eak
Dem
and
(1,3
15)
2238
0S
ervi
ces
2,31
1,22
323
381
Met
ers
612,
323
2438
2M
eter
s0
2538
3C
usto
mer
384,
402
2638
5A
cct 3
85 D
eman
d17
,594
27
Tot
al D
istri
butio
n7,
229,
755
28 29
Cus
tom
erC
usto
mer
030
Tota
l Dep
reci
atio
n E
xpen
se -
S/L
8,11
5,37
431 32 33
Am
ortiz
atio
ns (4
06/4
07)
034 35 36
Tota
l Dep
reci
atio
n &
Am
ortiz
atio
n E
xpen
ses:
8,11
5,37
4
(D)
(E)
(F)
(G)
(H)
(I)(J
)(K
)(L
)(N
)(O
)
Cus
tom
er C
hoic
e -
Res
iden
tial
Cus
tom
er C
hoic
e -
Sm
all G
SC
usto
mer
Cho
ice
- La
rge
GS
Cus
tom
er C
hoic
e -
Mul
ti-Fa
mily
IC
usto
mer
Cho
ice
- M
ulti-
Fam
ily II
Cus
tom
er C
hoic
e -
Mul
ti-Fa
mily
III
Cus
tom
er C
hoic
e -
Mul
ti-Fa
mily
IVA
gg T
rans
port
- R
esid
entia
lA
gg T
rans
port
- S
mal
l GS
Agg
Tra
nspo
rt -
Larg
e G
SS
peci
al C
ontra
ct
00
00
00
00
00
05,
128
5,40
20
410
518
162,
049
410
32,6
0036
,746
027
7256
190
108
13,2
1649
712
37,7
2842
,149
031
8261
208
124
15,2
6553
813
15,8
4418
,364
012
3416
6150
6,96
621
02
24,8
4426
,174
019
4823
8778
9,92
920
12
40,6
8844
,538
031
8239
148
128
16,8
9541
04
8893
00
00
00
351
037
739
70
01
01
115
13
030
331
90
01
01
112
12
015
3,83
316
2,06
80
116
298
142
538
485
61,4
801,
242
1228
6,94
959
,526
013
914
812
1242
35,
859
3512
00
00
00
00
00
015
,853
16,7
020
1231
1555
506,
336
128
1(1
19)
(125
)0
(0)
(0)
(0)
(0)
(0)
(47)
(1)
(0)
330,
630
64,7
160
160
161
1313
488
6,37
039
1347
,402
80,0
210
1152
3613
745,
820
4015
00
00
00
00
00
054
,749
11,3
570
2628
22
811,
118
72
00
00
00
00
051
089
0,06
639
5,07
50
465
719
221
636
1,60
387
,243
1,54
756
00
00
00
00
00
096
8,48
348
1,76
20
527
884
321
992
1,85
511
9,40
42,
496
73
00
00
00
00
00
0
968,
483
481,
762
052
788
432
199
21,
855
119,
404
2,49
673
May
not
cro
ss-c
heck
due
to R
ound
ing
Case No. U-17273 Witness: J.C. Hoffman Malueg
Exhibit A-16 (JCHM-2) Schedule F1.2
Page 8 of 20

Mic
higa
n P
ublic
Ser
vice
Com
mis
sion
Mic
higa
n G
as U
tiliti
es C
orpo
ratio
nH
isto
rical
Cos
t of S
ervi
ce A
lloca
tion
Stu
dyH
isto
rical
Yea
r End
ing
Dec
embe
r 31,
201
2
ALL
OC
ATI
ON
OF
TAX
ES
OTH
ER
TH
AN
INC
OM
E T
AX
ES
(A)
(B)
(C)
(D)
(E)
(F)
(G)
(H)
(I)(J
)(K
)(L
)(N
)
LIN
E
NO
.D
ES
CR
IPTI
ON
ALL
OC
ATI
ON
FA
CTO
RC
OR
PO
RA
TE
TOTA
LR
esid
entia
lM
ulti-
Fam
ily -
Cla
ss I
Mul
ti-Fa
mily
- C
lass
IIM
ulti-
Fam
ily -
Cla
ss
IIIM
ulti-
Fam
ily -
Cla
ss
IVS
mal
l Gen
eral
S
ervi
ceLa
rge
Gen
eral
S
ervi
ceTr
ansp
ort -
TR
-1Tr
ansp
ort -
TR
-2Tr
ansp
ort -
TR
-31
Rea
l Est
& P
rope
rtyR
ate
Bas
e3,
205,
383
1,82
2,97
82,
069
8,29
41,
865
2,85
129
5,31
729
,890
88,2
9116
2,80
113
5,69
62
Une
mpl
oym
ent C
omp.
- FE
DS
alar
ies
& W
ages
11,1
665,
953
832
712
885
6841
383
262
33
Une
mpl
oym
ent C
omp.
- S
tate
Sal
arie
s &
Wag
es42
,140
22,4
6829
121
2646
3,34
025
61,
557
3,13
92,
351
4IB
S P
ayro
ll Ta
xS
alar
ies
& W
ages
353,
472
188,
464
247
1,01
222
038
628
,014
2,15
113
,061
26,3
3219
,721
5Fr
anch
ise
Tax
Fees
and
Sta
te U
nita
ry F
ees
Rat
e B
ase
131
750
00
012
14
76
6U
naut
hor I
ns T
ax a
nd U
se T
axR
ate
Bas
e13
,315
7,57
39
348
121,
227
124
367
676
564
7Fe
dera
l Exc
ise
Tax
Rat
e B
ase
709
403
02
01
657
2036
308
Ret
irem
ent B
enef
its -
FED
Sal
arie
s &
Wag
es63
7,75
934
0,04
044
51,
827
398
696
50,5
453,
881
23,5
6647
,511
35,5
819
TOTA
L TA
XE
S O
THE
R T
HA
N IN
CO
ME
4,26
4,07
52,
387,
955
2,80
811
,323
2,52
54,
004
379,
404
36,3
7912
7,27
824
1,33
419
4,57
1
May
not
cro
ss-c
heck
due
to R
ound
ing
Case No. U-17273 Witness: J.C. Hoffman Malueg
Exhibit A-16 (JCHM-2) Schedule F1.2
Page 9 of 20

Mic
higa
n P
ublic
Ser
vice
Com
mis
sion
Mic
higa
n G
as U
tiliti
es C
orpo
ratio
nH
isto
rical
Cos
t of S
ervi
ce A
lloca
tion
Stu
dyH
isto
rical
Yea
r End
ing
Dec
embe
r 31,
201
2
ALL
OC
ATI
ON
OF
TAX
ES
OTH
ER
TH
AN
INC
OM
E T
AX
ES
(A)
(B)
(C)
LIN
E
NO
.D
ES
CR
IPTI
ON
ALL
OC
ATI
ON
FA
CTO
RC
OR
PO
RA
TE
TOTA
L1
Rea
l Est
& P
rope
rtyR
ate
Bas
e3,
205,
383
2U
nem
ploy
men
t Com
p. -
FED
Sal
arie
s &
Wag
es11
,166
3U
nem
ploy
men
t Com
p. -
Sta
teS
alar
ies
& W
ages
42,1
404
IBS
Pay
roll
Tax
Sal
arie
s &
Wag
es35
3,47
25
Fran
chis
e Ta
x Fe
es a
nd S
tate
Uni
tary
Fee
sR
ate
Bas
e13
16
Una
utho
r Ins
Tax
and
Use
Tax
Rat
e B
ase
13,3
157
Fede
ral E
xcis
e Ta
xR
ate
Bas
e70
98
Ret
irem
ent B
enef
its -
FED
Sal
arie
s &
Wag
es63
7,75
99
TOTA
L TA
XE
S O
THE
R T
HA
N IN
CO
ME
4,26
4,07
5
(D)
(E)
(F)
(G)
(H)
(I)(J
)(K
)(L
)(N
)(O
)
Cus
tom
er C
hoic
e -
Res
iden
tial
Cus
tom
er C
hoic
e -
Sm
all G
SC
usto
mer
Cho
ice
- La
rge
GS
Cus
tom
er C
hoic
e -
Mul
ti-Fa
mily
IC
usto
mer
Cho
ice
- M
ulti-
Fam
ily II
Cus
tom
er C
hoic
e -
Mul
ti-Fa
mily
III
Cus
tom
er C
hoic
e -
Mul
ti-Fa
mily
IVA
gg T
rans
port
- R
esid
entia
lA
gg T
rans
port
- S
mal
l GS
Agg
Tra
nspo
rt -
Larg
e G
SS
peci
al C
ontra
ct34
2,71
324
1,67
80
211
434
262
823
781
66,3
642,
003
621,
183
844
01
21
33
292
60
4,46
53,
185
03
63
1011
1,10
122
037
,453
26,7
120
2451
2280
939,
237
187
314
100
00
00
03
00
1,42
41,
004
01
21
33
276
80
7653
00
00
00
150
067
,576
48,1
960
4493
3914
516
816
,667
337
545
4,90
332
1,68
30
283
587
327
1,06
41,
059
93,9
542,
565
70
May
not
cro
ss-c
heck
due
to R
ound
ing
Case No. U-17273 Witness: J.C. Hoffman Malueg
Exhibit A-16 (JCHM-2) Schedule F1.2 Page 10 of 20

Mic
higa
n P
ublic
Ser
vice
Com
mis
sion
Mic
higa
n G
as U
tiliti
es C
orpo
ratio
nH
isto
rical
Cos
t of S
ervi
ce A
lloca
tion
Stu
dyH
isto
rical
Yea
r End
ing
Dec
embe
r 31,
201
2
ALL
OC
ATI
ON
OF
OTH
ER
INC
OM
E &
AD
JUS
TS(A
)(B
)(C
)(D
)(E
)(F
)(G
)(H
)(I)
(J)
(K)
(L)
(N)
LIN
E
NO
.D
ES
CR
IPTI
ON
ALL
OC
ATI
ON
FA
CTO
RC
OR
PO
RA
TE
TOTA
LR
esid
entia
lM
ulti-
Fam
ily -
Cla
ss I
Mul
ti-Fa
mily
- C
lass
IIM
ulti-
Fam
ily -
Cla
ss
IIIM
ulti-
Fam
ily -
Cla
ss
IVS
mal
l Gen
eral
S
ervi
ceLa
rge
Gen
eral
S
ervi
ceTr
ansp
ort -
TR
-1Tr
ansp
ort -
TR
-2Tr
ansp
ort -
TR
-31
BEF
OR
E TA
X A
DJU
STM
ENTS
:2
Gai
n/(L
oss)
- S
ale
of U
tility
Pro
perty
Rat
e B
ase
00
00
00
00
00
03
TOTA
L O
THE
R A
DJU
STS
00
00
00
00
00
04 5 6
AFT
ER T
AX
AD
JUST
MEN
TS:
7Ta
x A
mor
tizat
ions
(409
)R
ate
Bas
e0
00
00
00
00
00
8Ta
x A
mor
tizat
ions
(419
/426
/431
)R
ate
Bas
e0
00
00
00
00
00
9TO
TAL
OTH
ER
AD
JUS
TS0
00
00
00
00
00
May
not
cro
ss-c
heck
due
to R
ound
ing
Case No. U-17273 Witness: J.C. Hoffman Malueg
Exhibit A-16 (JCHM-2) Schedule F1.2 Page 11 of 20

Mic
higa
n P
ublic
Ser
vice
Com
mis
sion
Mic
higa
n G
as U
tiliti
es C
orpo
ratio
nH
isto
rical
Cos
t of S
ervi
ce A
lloca
tion
Stu
dyH
isto
rical
Yea
r End
ing
Dec
embe
r 31,
201
2
ALL
OC
ATI
ON
OF
OTH
ER
INC
OM
E &
AD
JUS
TS(A
)(B
)(C
)
LIN
E
NO
.D
ES
CR
IPTI
ON
ALL
OC
ATI
ON
FA
CTO
RC
OR
PO
RA
TE
TOTA
L1
BEF
OR
E TA
X A
DJU
STM
ENTS
:2
Gai
n/(L
oss)
- S
ale
of U
tility
Pro
perty
Rat
e B
ase
03
TOTA
L O
THE
R A
DJU
STS
04 5 6
AFT
ER T
AX
AD
JUST
MEN
TS:
7Ta
x A
mor
tizat
ions
(409
)R
ate
Bas
e0
8Ta
x A
mor
tizat
ions
(419
/426
/431
)R
ate
Bas
e0
9TO
TAL
OTH
ER
AD
JUS
TS0
(D)
(E)
(F)
(G)
(H)
(I)(J
)(K
)(L
)(N
)(O
)
Cus
tom
er C
hoic
e -
Res
iden
tial
Cus
tom
er C
hoic
e -
Sm
all G
SC
usto
mer
Cho
ice
- La
rge
GS
Cus
tom
er C
hoic
e -
Mul
ti-Fa
mily
IC
usto
mer
Cho
ice
- M
ulti-
Fam
ily II
Cus
tom
er C
hoic
e -
Mul
ti-Fa
mily
III
Cus
tom
er C
hoic
e -
Mul
ti-Fa
mily
IVA
gg T
rans
port
- R
esid
entia
lA
gg T
rans
port
- S
mal
l GS
Agg
Tra
nspo
rt -
Larg
e G
SS
peci
al C
ontra
ct
00
00
00
00
00
00
00
00
00
00
00
00
00
00
00
00
00
00
00
00
00
00
00
00
00
00
00
0
May
not
cro
ss-c
heck
due
to R
ound
ing
Case No. U-17273 Witness: J.C. Hoffman Malueg
Exhibit A-16 (JCHM-2) Schedule F1.2 Page 12 of 20

Mic
higa
n P
ublic
Ser
vice
Com
mis
sion
Mic
higa
n G
as U
tiliti
es C
orpo
ratio
nH
isto
rical
Cos
t of S
ervi
ce A
lloca
tion
Stu
dyH
isto
rical
Yea
r End
ing
Dec
embe
r 31,
201
2
ALL
OC
ATI
ON
OF
RA
TE B
AS
E C
OM
PO
NE
NT
- PLA
NT
IN S
ER
VIC
E(A
)(B
)(C
)(D
)(E
)(F
)(G
)(H
)(I)
(J)
(K)
(L)
(N)
LIN
E
NO
.D
ES
CR
IPTI
ON
ALL
OC
ATI
ON
FA
CTO
RC
OR
PO
RA
TE
TOTA
LR
esid
entia
lM
ulti-
Fam
ily -
Cla
ss I
Mul
ti-Fa
mily
- C
lass
IIM
ulti-
Fam
ily -
Cla
ss
IIIM
ulti-
Fam
ily -
Cla
ss
IVS
mal
l Gen
eral
S
ervi
ceLa
rge
Gen
eral
S
ervi
ceTr
ansp
ort -
TR
-1Tr
ansp
ort -
TR
-2Tr
ansp
ort -
TR
-31
GA
S P
LAN
T:2
P
rodu
ctio
n:3
P
urch
ased
Gas
Cos
tS
ales
00
00
00
00
00
04
P
rodu
ctio
n D
eman
dW
eigh
ted
Pea
k D
eman
d2,
416,
670
1,03
6,50
21,
660
8,62
02,
053
3,68
722
2,49
319
,913
128,
176
260,
449
194,
651
5
Sto
rage
Cos
tS
tora
ge15
,799
,487
7,44
7,68
211
,049
62,6
1616
,252
27,7
811,
741,
222
348,
623
548,
145
916,
083
810,
754
6
Tot
al P
rodu
ctio
n18
,216
,157
8,48
4,18
412
,709
71,2
3518
,305
31,4
681,
963,
715
368,
535
676,
322
1,17
6,53
21,
005,
405
7 8
Tra
nsm
issi
on9
M
inim
um S
yste
m -
Thro
ughp
ut P
iece
MC
F Th
roug
hput
19,1
50,5
796,
806,
505
10,8
9862
,272
14,8
3326
,633
1,60
7,38
521
4,28
91,
294,
307
2,80
2,81
72,
558,
067
10
Dem
and
Rel
ated
Sys
tem
Wei
ghte
d P
eak
Dem
and
22,6
66,9
619,
721,
784
15,5
6680
,848
19,2
5734
,577
2,08
6,85
318
6,76
81,
202,
220
2,44
2,86
01,
825,
716
11
Tot
al T
rans
mis
sion
41,8
17,5
4016
,528
,289
26,4
6514
3,12
034
,090
61,2
103,
694,
238
401,
057
2,49
6,52
75,
245,
677
4,38
3,78
312 13
D
istri
butio
n14
302/
303
Wei
ghte
d P
eak
Dem
and
232,
474
99,7
0716
082
919
835
521
,403
1,91
612
,330
25,0
5418
,725
1537
4W
eigh
ted
Pea
k D
eman
d34
2,71
714
6,99
023
51,
222
291
523
31,5
532,
824
18,1
7736
,935
27,6
0416
375
Wei
ghte
d P
eak
Dem
and
359,
508
154,
192
247
1,28
230
554
833
,098
2,96
219
,068
38,7
4528
,957
1737
6 (D
eman
d)W
eigh
ted
Pea
k D
eman
d55
,669
,409
23,8
76,4
2538
,230
198,
559
47,2
9584
,921
5,12
5,25
245
8,69
82,
952,
617
5,99
9,59
54,
483,
906
1837
6 (F
ixed
Cos
t)C
usto
mer
65,7
27,4
2750
,827
,923
47,6
0679
,057
5,61
64,
394
3,17
0,02
611
,133
44,2
0315
,197
2,37
919
377
MC
F Th
roug
hput
00
00
00
00
00
020
378
Wei
ghte
d P
eak
Dem
and
4,80
2,09
92,
059,
604
3,29
817
,128
4,08
07,
325
442,
109
39,5
6825
4,69
651
7,53
138
6,78
621
379
Wei
ghte
d P
eak
Dem
and
(37,
850)
(16,
234)
(26)
(135
)(3
2)(5
8)(3
,485
)(3
12)
(2,0
07)
(4,0
79)
(3,0
49)
2238
0S
ervi
ces
70,7
38,3
8754
,944
,294
51,4
6180
,635
5,72
84,
482
3,23
3,33
311
,356
60,7
0520
,870
3,26
723
381
Met
ers
36,6
26,0
5220
,125
,379
12,2
5592
,560
22,9
379,
375
8,13
7,87
829
,199
153,
312
52,3
546,
413
2438
2M
eter
s0
00
00
00
00
00
2538
3C
usto
mer
15,1
48,3
1311
,714
,399
10,9
7218
,220
1,29
41,
013
730,
601
2,56
610
,188
3,50
254
826
385
Acc
t 385
Dem
and
620,
356
00
00
00
20,4
1913
1,43
726
7,07
519
9,60
327
T
otal
Dis
tribu
tion
250,
228,
894
163,
932,
680
164,
438
489,
359
87,7
1311
2,87
820
,921
,769
580,
328
3,65
4,72
56,
972,
781
5,15
5,13
928 29
C
usto
mer
Cus
tom
er0
00
00
00
00
00
30 31To
tal P
lant
in S
ervi
ce31
0,26
2,59
118
8,94
5,15
320
3,61
270
3,71
414
0,10
920
5,55
626
,579
,722
1,34
9,92
16,
827,
573
13,3
94,9
9010
,544
,328
May
not
cro
ss-c
heck
due
to R
ound
ing
Case No. U-17273 Witness: J.C. Hoffman Malueg
Exhibit A-16 (JCHM-2) Schedule F1.2 Page 13 of 20

Mic
higa
n P
ublic
Ser
vice
Com
mis
sion
Mic
higa
n G
as U
tiliti
es C
orpo
ratio
nH
isto
rical
Cos
t of S
ervi
ce A
lloca
tion
Stu
dyH
isto
rical
Yea
r End
ing
Dec
embe
r 31,
201
2
ALL
OC
ATI
ON
OF
RA
TE B
AS
E C
OM
PO
NE
NT
- PLA
NT
IN S
ER
VIC
E(A
)(B
)(C
)
LIN
E
NO
.D
ES
CR
IPTI
ON
ALL
OC
ATI
ON
FA
CTO
RC
OR
PO
RA
TE
TOTA
L1
GA
S P
LAN
T:2
P
rodu
ctio
n:3
P
urch
ased
Gas
Cos
tS
ales
04
P
rodu
ctio
n D
eman
dW
eigh
ted
Pea
k D
eman
d2,
416,
670
5
Sto
rage
Cos
tS
tora
ge15
,799
,487
6
Tot
al P
rodu
ctio
n18
,216
,157
7 8
Tra
nsm
issi
on9
M
inim
um S
yste
m -
Thro
ughp
ut P
iece
MC
F Th
roug
hput
19,1
50,5
7910
D
eman
d R
elat
ed S
yste
mW
eigh
ted
Pea
k D
eman
d22
,666
,961
11
Tot
al T
rans
mis
sion
41,8
17,5
4012 13
D
istri
butio
n14
302/
303
Wei
ghte
d P
eak
Dem
and
232,
474
1537
4W
eigh
ted
Pea
k D
eman
d34
2,71
716
375
Wei
ghte
d P
eak
Dem
and
359,
508
1737
6 (D
eman
d)W
eigh
ted
Pea
k D
eman
d55
,669
,409
1837
6 (F
ixed
Cos
t)C
usto
mer
65,7
27,4
2719
377
MC
F Th
roug
hput
020
378
Wei
ghte
d P
eak
Dem
and
4,80
2,09
921
379
Wei
ghte
d P
eak
Dem
and
(37,
850)
2238
0S
ervi
ces
70,7
38,3
8723
381
Met
ers
36,6
26,0
5224
382
Met
ers
025
383
Cus
tom
er15
,148
,313
2638
5A
cct 3
85 D
eman
d62
0,35
627
T
otal
Dis
tribu
tion
250,
228,
894
28 29
Cus
tom
erC
usto
mer
030 31
Tota
l Pla
nt in
Ser
vice
310,
262,
591
(D)
(E)
(F)
(G)
(H)
(I)(J
)(K
)(L
)(N
)(O
)
Cus
tom
er C
hoic
e -
Res
iden
tial
Cus
tom
er C
hoic
e -
Sm
all G
SC
usto
mer
Cho
ice
- La
rge
GS
Cus
tom
er C
hoic
e -
Mul
ti-Fa
mily
IC
usto
mer
Cho
ice
- M
ulti-
Fam
ily II
Cus
tom
er C
hoic
e -
Mul
ti-Fa
mily
III
Cus
tom
er C
hoic
e -
Mul
ti-Fa
mily
IVA
gg T
rans
port
- R
esid
entia
lA
gg T
rans
port
- S
mal
l GS
Agg
Tra
nspo
rt -
Larg
e G
SS
peci
al C
ontra
ct
00
00
00
00
00
021
7,86
222
9,52
40
164
422
201
761
687
87,0
701,
759
171,
510,
188
1,70
2,24
90
1,26
23,
355
2,59
58,
824
4,99
661
2,21
423
,027
569
1,72
8,05
01,
931,
773
01,
427
3,77
82,
796
9,58
65,
683
699,
284
24,7
8658
6
1,43
0,65
61,
658,
179
01,
080
3,05
11,
452
5,50
04,
512
629,
030
18,9
2818
42,
043,
417
2,15
2,79
80
1,54
23,
962
1,88
67,
140
6,44
581
6,66
416
,497
161
3,47
4,07
43,
810,
976
02,
621
7,01
33,
338
12,6
4010
,957
1,44
5,69
435
,425
345
20,9
5722
,079
016
4119
7366
8,37
616
92
30,8
9632
,550
023
6029
108
9712
,348
249
232
,410
34,1
440
2463
3011
310
212
,953
262
35,
018,
575
5,28
7,21
00
3,78
79,
730
4,63
117
,536
15,8
282,
005,
703
40,5
1739
59,
361,
282
1,94
1,95
70
4,52
64,
823
396
396
13,8
0919
1,15
01,
156
396
00
00
00
00
00
043
2,90
745
6,08
00
327
839
399
1,51
31,
365
173,
014
3,49
534
(3,4
12)
(3,5
95)
0(3
)(7
)(3
)(1
2)(1
1)(1
,364
)(2
8)(0
)10
,119
,419
1,98
0,73
90
4,89
34,
920
404
404
14,9
2819
4,96
71,
179
404
2,83
5,33
44,
786,
473
068
23,
130
2,15
578
34,
425
348,
129
2,39
488
50
00
00
00
00
00
2,15
7,51
144
7,56
60
1,04
31,
112
9191
3,18
344
,055
266
910
00
00
00
00
1,80
418
30,0
05,8
7914
,985
,203
015
,318
24,7
118,
152
21,0
0653
,792
2,98
9,32
951
,464
2,23
0
00
00
00
00
00
0
35,2
08,0
0220
,727
,952
019
,367
35,5
0114
,285
43,2
3270
,431
5,13
4,30
611
1,67
53,
161
May
not
cro
ss-c
heck
due
to R
ound
ing
Case No. U-17273 Witness: J.C. Hoffman Malueg
Exhibit A-16 (JCHM-2) Schedule F1.2 Page 14 of 20

Mic
higa
n P
ublic
Ser
vice
Com
mis
sion
Mic
higa
n G
as U
tiliti
es C
orpo
ratio
nH
isto
rical
Cos
t of S
ervi
ce A
lloca
tion
Stu
dyH
isto
rical
Yea
r End
ing
Dec
embe
r 31,
201
2
ALL
OC
ATI
ON
OF
RA
TE B
AS
E C
OM
PO
NE
NT
- DE
PR
EC
IATI
ON
RE
SE
RV
E -
S/L
(A)
(B)
(C)
(D)
(E)
(F)
(G)
(H)
(I)(J
)(K
)(L
)(N
)
LIN
E
NO
.D
ES
CR
IPTI
ON
ALL
OC
ATI
ON
FA
CTO
RC
OR
PO
RA
TE
TOTA
LR
esid
entia
lM
ulti-
Fam
ily -
Cla
ss I
Mul
ti-Fa
mily
- C
lass
IIM
ulti-
Fam
ily -
Cla
ss
IIIM
ulti-
Fam
ily -
Cla
ss
IVS
mal
l Gen
eral
S
ervi
ceLa
rge
Gen
eral
S
ervi
ceTr
ansp
ort -
TR
-1Tr
ansp
ort -
TR
-2Tr
ansp
ort -
TR
-31
DE
PR
EC
IATI
ON
RE
SE
RV
E -
S/L
:2
P
rodu
ctio
n:3
P
urch
ased
Gas
Cos
tS
ales
00
00
00
00
00
04
P
rodu
ctio
n D
eman
dW
eigh
ted
Pea
k D
eman
d(1
,238
,072
)(5
31,0
05)
(850
)(4
,416
)(1
,052
)(1
,889
)(1
13,9
84)
(10,
201)
(65,
665)
(133
,429
)(9
9,72
1)5
S
tora
ge C
ost
Sto
rage
(7,4
42,1
08)
(3,5
08,1
17)
(5,2
05)
(29,
494)
(7,6
55)
(13,
086)
(820
,176
)(1
64,2
14)
(258
,195
)(4
31,5
07)
(381
,893
)6
T
otal
Pro
duct
ion
(8,6
80,1
80)
(4,0
39,1
22)
(6,0
55)
(33,
910)
(8,7
07)
(14,
975)
(934
,160
)(1
74,4
15)
(323
,861
)(5
64,9
36)
(481
,614
)7 8
T
rans
mis
sion
9
Min
imum
Sys
tem
- Th
roug
hput
Pie
ceM
CF
Thro
ughp
ut(1
2,75
3,07
5)(4
,532
,702
)(7
,258
)(4
1,46
9)(9
,878
)(1
7,73
6)(1
,070
,417
)(1
42,7
03)
(861
,927
)(1
,866
,499
)(1
,703
,511
)10
D
eman
d R
elat
ed S
yste
mW
eigh
ted
Pea
k D
eman
d(1
5,02
0,30
8)(6
,442
,160
)(1
0,31
5)(5
3,57
4)(1
2,76
1)(2
2,91
3)(1
,382
,858
)(1
23,7
62)
(796
,653
)(1
,618
,766
)(1
,209
,814
)11
T
otal
Tra
nsm
issi
on(2
7,77
3,38
3)(1
0,97
4,86
2)(1
7,57
3)(9
5,04
3)(2
2,63
9)(4
0,64
9)(2
,453
,274
)(2
66,4
65)
(1,6
58,5
80)
(3,4
85,2
65)
(2,9
13,3
25)
12 13
Dis
tribu
tion
1430
2/30
3W
eigh
ted
Pea
k D
eman
d(2
19,0
37)
(93,
944)
(150
)(7
81)
(186
)(3
34)
(20,
166)
(1,8
05)
(11,
617)
(23,
606)
(17,
642)
1537
4W
eigh
ted
Pea
k D
eman
d(2
6,19
8)(1
1,23
6)(1
8)(9
3)(2
2)(4
0)(2
,412
)(2
16)
(1,3
89)
(2,8
23)
(2,1
10)
1637
5W
eigh
ted
Pea
k D
eman
d(2
31,2
29)
(99,
174)
(159
)(8
25)
(196
)(3
53)
(21,
288)
(1,9
05)
(12,
264)
(24,
920)
(18,
624)
1737
6 (D
eman
d)W
eigh
ted
Pea
k D
eman
d(3
1,70
8,70
3)(1
3,59
9,75
7)(2
1,77
6)(1
13,0
97)
(26,
939)
(48,
370)
(2,9
19,2
89)
(261
,269
)(1
,681
,779
)(3
,417
,306
)(2
,553
,985
)18
376
(Fix
ed C
ost)
Cus
tom
er(3
7,43
7,64
3)(2
8,95
1,04
4)(2
7,11
6)(4
5,03
0)(3
,199
)(2
,503
)(1
,805
,613
)(6
,341
)(2
5,17
8)(8
,656
)(1
,355
)19
377
MC
F Th
roug
hput
00
00
00
00
00
020
378
Wei
ghte
d P
eak
Dem
and
(3,1
08,6
35)
(1,3
33,2
83)
(2,1
35)
(11,
088)
(2,6
41)
(4,7
42)
(286
,199
)(2
5,61
4)(1
64,8
77)
(335
,023
)(2
50,3
86)
2137
9W
eigh
ted
Pea
k D
eman
d(2
81)
(120
)(0
)(1
)(0
)(0
)(2
6)(2
)(1
5)(3
0)(2
3)22
380
Ser
vice
s(3
9,64
8,46
4)(3
0,79
5,96
4)(2
8,84
4)(4
5,19
6)(3
,211
)(2
,512
)(1
,812
,265
)(6
,365
)(3
4,02
5)(1
1,69
8)(1
,831
)23
381
Met
ers
(16,
839,
055)
(9,2
52,7
68)
(5,6
34)
(42,
555)
(10,
545)
(4,3
10)
(3,7
41,4
40)
(13,
424)
(70,
486)
(24,
070)
(2,9
49)
2438
2M
eter
s0
00
00
00
00
00
2538
3C
usto
mer
(5,6
33,5
27)
(4,3
56,4
84)
(4,0
80)
(6,7
76)
(481
)(3
77)
(271
,704
)(9
54)
(3,7
89)
(1,3
03)
(204
)26
385
Acc
t 385
Dem
and
(334
,036
)0
00
00
0(1
0,99
5)(7
0,77
4)(1
43,8
09)
(107
,478
)27
T
otal
Dis
tribu
tion
(135
,186
,807
)(8
8,49
3,77
5)(8
9,91
2)(2
65,4
42)
(47,
421)
(63,
541)
(10,
880,
402)
(328
,891
)(2
,076
,193
)(3
,993
,244
)(2
,956
,587
)28 29
C
usto
mer
Cus
tom
er0
00
00
00
00
00
30 31To
tal D
epre
ciat
ion
Res
erve
- S
traig
ht L
ine:
(171
,640
,370
)(1
03,5
07,7
60)
(113
,540
)(3
94,3
95)
(78,
767)
(119
,164
)(1
4,26
7,83
7)(7
69,7
71)
(4,0
58,6
34)
(8,0
43,4
45)
(6,3
51,5
26)
May
not
cro
ss-c
heck
due
to R
ound
ing
Case No. U-17273 Witness: J.C. Hoffman Malueg
Exhibit A-16 (JCHM-2) Schedule F1.2 Page 15 of 20

Mic
higa
n P
ublic
Ser
vice
Com
mis
sion
Mic
higa
n G
as U
tiliti
es C
orpo
ratio
nH
isto
rical
Cos
t of S
ervi
ce A
lloca
tion
Stu
dyH
isto
rical
Yea
r End
ing
Dec
embe
r 31,
201
2
ALL
OC
ATI
ON
OF
RA
TE B
AS
E C
OM
PO
NE
NT
- DE
PR
EC
IATI
ON
RE
SE
RV
E -
S/L
(A)
(B)
(C)
LIN
E
NO
.D
ES
CR
IPTI
ON
ALL
OC
ATI
ON
FA
CTO
RC
OR
PO
RA
TE
TOTA
L1
DE
PR
EC
IATI
ON
RE
SE
RV
E -
S/L
:2
P
rodu
ctio
n:3
P
urch
ased
Gas
Cos
tS
ales
04
P
rodu
ctio
n D
eman
dW
eigh
ted
Pea
k D
eman
d(1
,238
,072
)5
S
tora
ge C
ost
Sto
rage
(7,4
42,1
08)
6
Tot
al P
rodu
ctio
n(8
,680
,180
)7 8
T
rans
mis
sion
9
Min
imum
Sys
tem
- Th
roug
hput
Pie
ceM
CF
Thro
ughp
ut(1
2,75
3,07
5)10
D
eman
d R
elat
ed S
yste
mW
eigh
ted
Pea
k D
eman
d(1
5,02
0,30
8)11
T
otal
Tra
nsm
issi
on(2
7,77
3,38
3)12 13
D
istri
butio
n14
302/
303
Wei
ghte
d P
eak
Dem
and
(219
,037
)15
374
Wei
ghte
d P
eak
Dem
and
(26,
198)
1637
5W
eigh
ted
Pea
k D
eman
d(2
31,2
29)
1737
6 (D
eman
d)W
eigh
ted
Pea
k D
eman
d(3
1,70
8,70
3)18
376
(Fix
ed C
ost)
Cus
tom
er(3
7,43
7,64
3)19
377
MC
F Th
roug
hput
020
378
Wei
ghte
d P
eak
Dem
and
(3,1
08,6
35)
2137
9W
eigh
ted
Pea
k D
eman
d(2
81)
2238
0S
ervi
ces
(39,
648,
464)
2338
1M
eter
s(1
6,83
9,05
5)24
382
Met
ers
025
383
Cus
tom
er(5
,633
,527
)26
385
Acc
t 385
Dem
and
(334
,036
)27
T
otal
Dis
tribu
tion
(135
,186
,807
)28 29
C
usto
mer
Cus
tom
er0
30 31To
tal D
epre
ciat
ion
Res
erve
- S
traig
ht L
ine:
(171
,640
,370
)
(D)
(E)
(F)
(G)
(H)
(I)(J
)(K
)(L
)(N
)(O
)
Cus
tom
er C
hoic
e -
Res
iden
tial
Cus
tom
er C
hoic
e -
Sm
all G
SC
usto
mer
Cho
ice
- La
rge
GS
Cus
tom
er C
hoic
e -
Mul
ti-Fa
mily
IC
usto
mer
Cho
ice
- M
ulti-
Fam
ily II
Cus
tom
er C
hoic
e -
Mul
ti-Fa
mily
III
Cus
tom
er C
hoic
e -
Mul
ti-Fa
mily
IVA
gg T
rans
port
- R
esid
entia
lA
gg T
rans
port
- S
mal
l GS
Agg
Tra
nspo
rt -
Larg
e G
SS
peci
al C
ontra
ct
00
00
00
00
00
0(1
11,6
12)
(117
,586
)0
(84)
(216
)(1
03)
(390
)(3
52)
(44,
606)
(901
)(9
)(7
11,3
51)
(801
,819
)0
(595
)(1
,580
)(1
,222
)(4
,157
)(2
,353
)(2
88,3
74)
(10,
847)
(268
)(8
22,9
63)
(919
,405
)0
(679
)(1
,797
)(1
,325
)(4
,547
)(2
,705
)(3
32,9
80)
(11,
748)
(277
)
(952
,727
)(1
,104
,242
)0
(719
)(2
,032
)(9
67)
(3,6
62)
(3,0
05)
(418
,894
)(1
2,60
5)(1
23)
(1,3
54,0
75)
(1,4
26,5
56)
0(1
,022
)(2
,625
)(1
,249
)(4
,731
)(4
,271
)(5
41,1
64)
(10,
932)
(107
)(2
,306
,801
)(2
,530
,798
)0
(1,7
41)
(4,6
57)
(2,2
17)
(8,3
94)
(7,2
75)
(960
,058
)(2
3,53
7)(2
29)
(19,
746)
(20,
803)
0(1
5)(3
8)(1
8)(6
9)(6
2)(7
,892
)(1
59)
(2)
(2,3
62)
(2,4
88)
0(2
)(5
)(2
)(8
)(7
)(9
44)
(19)
(0)
(20,
845)
(21,
961)
0(1
6)(4
0)(1
9)(7
3)(6
6)(8
,331
)(1
68)
(2)
(2,8
58,5
27)
(3,0
11,5
38)
0(2
,157
)(5
,542
)(2
,638
)(9
,988
)(9
,015
)(1
,142
,427
)(2
3,07
8)(2
25)
(5,3
32,0
87)
(1,1
06,1
18)
0(2
,578
)(2
,747
)(2
26)
(226
)(7
,866
)(1
08,8
77)
(659
)(2
26)
00
00
00
00
00
0(2
80,2
42)
(295
,243
)0
(211
)(5
43)
(259
)(9
79)
(884
)(1
12,0
00)
(2,2
62)
(22)
(25)
(27)
0(0
)(0
)(0
)(0
)(0
)(1
0)(0
)(0
)(5
,671
,877
)(1
,110
,193
)0
(2,7
42)
(2,7
57)
(227
)(2
27)
(8,3
67)
(109
,278
)(6
61)
(227
)(1
,303
,562
)(2
,200
,611
)0
(314
)(1
,439
)(9
91)
(360
)(2
,034
)(1
60,0
54)
(1,1
00)
(407
)0
00
00
00
00
00
(802
,360
)(1
66,4
46)
0(3
88)
(413
)(3
4)(3
4)(1
,184
)(1
6,38
4)(9
9)(3
4)0
00
00
00
00
(971
)(9
)(1
6,29
1,63
3)(7
,935
,428
)0
(8,4
23)
(13,
526)
(4,4
13)
(11,
964)
(29,
485)
(1,6
66,1
96)
(29,
178)
(1,1
53)
00
00
00
00
00
0
(19,
421,
397)
(11,
385,
630)
0(1
0,84
2)(1
9,98
0)(7
,955
)(2
4,90
5)(3
9,46
5)(2
,959
,235
)(6
4,46
2)(1
,659
)
May
not
cro
ss-c
heck
due
to R
ound
ing
Case No. U-17273 Witness: J.C. Hoffman Malueg
Exhibit A-16 (JCHM-2) Schedule F1.2 Page 16 of 20

Mic
higa
n P
ublic
Ser
vice
Com
mis
sion
Mic
higa
n G
as U
tiliti
es C
orpo
ratio
nH
isto
rical
Cos
t of S
ervi
ce A
lloca
tion
Stu
dyH
isto
rical
Yea
r End
ing
Dec
embe
r 31,
201
2
ALL
OC
ATI
ON
OF
RA
TE B
AS
E C
OM
PO
NE
NT
- CO
NS
TRU
CTI
ON
WO
RK
IN P
RO
GR
ES
S(A
)(B
)(C
)(D
)(E
)(F
)(G
)(H
)(I)
(J)
(K)
(L)
(N)
LIN
E
NO
.D
ES
CR
IPTI
ON
ALL
OC
ATI
ON
FA
CTO
RC
OR
PO
RA
TE
TOTA
LR
esid
entia
lM
ulti-
Fam
ily -
Cla
ss I
Mul
ti-Fa
mily
- C
lass
IIM
ulti-
Fam
ily -
Cla
ss
IIIM
ulti-
Fam
ily -
Cla
ss
IVS
mal
l Gen
eral
S
ervi
ceLa
rge
Gen
eral
S
ervi
ceTr
ansp
ort -
TR
-1Tr
ansp
ort -
TR
-2Tr
ansp
ort -
TR
-31
CO
NS
TRU
CTI
ON
WO
RK
IN P
RO
GR
ES
S2
P
rodu
ctio
n:3
P
urch
ased
Gas
Cos
tS
ales
00
00
00
00
00
04
P
rodu
ctio
n D
eman
dW
eigh
ted
Pea
k D
eman
d44
,355
19,0
2430
158
3868
4,08
436
52,
353
4,78
03,
573
5
Sto
rage
Cos
tS
tora
ge49
9,73
823
5,57
034
91,
981
514
879
55,0
7511
,027
17,3
3828
,976
25,6
446
T
otal
Pro
duct
ion
544,
093
254,
594
380
2,13
955
294
659
,158
11,3
9219
,690
33,7
5629
,217
7 8
Tra
nsm
issi
on9
M
inim
um S
yste
m -
Thro
ughp
ut P
iece
MC
F Th
roug
hput
375,
532
133,
472
214
1,22
129
152
231
,520
4,20
225
,381
54,9
6250
,162
10
Dem
and
Rel
ated
Sys
tem
Wei
ghte
d P
eak
Dem
and
1,10
0,33
747
1,93
175
63,
925
935
1,67
910
1,30
39,
066
58,3
6011
8,58
588
,627
11
Tot
al T
rans
mis
sion
1,47
5,86
960
5,40
396
95,
146
1,22
62,
201
132,
823
13,2
6883
,741
173,
547
138,
789
12 13
Dis
tribu
tion
1430
2/30
3W
eigh
ted
Pea
k D
eman
d37
516
10
10
135
320
4030
1537
4W
eigh
ted
Pea
k D
eman
d55
323
70
20
151
529
6045
1637
5W
eigh
ted
Pea
k D
eman
d58
024
90
20
153
531
6347
1737
6 (D
eman
d)W
eigh
ted
Pea
k D
eman
d85
7,46
136
7,76
258
93,
058
728
1,30
878
,943
7,06
545
,478
92,4
1069
,064
1837
6 (F
ixed
Cos
t)C
usto
mer
1,01
2,38
278
2,88
973
31,
218
8768
48,8
2717
168
123
437
1937
7M
CF
Thro
ughp
ut0
00
00
00
00
00
2037
8W
eigh
ted
Pea
k D
eman
d37
,151
15,9
3426
133
3257
3,42
030
61,
970
4,00
42,
992
2137
9W
eigh
ted
Pea
k D
eman
d(6
1)(2
6)(0
)(0
)(0
)(0
)(6
)(1
)(3
)(7
)(5
)22
380
Ser
vice
s12
6,20
198
,024
9214
410
85,
768
2010
837
623
381
Met
ers
59,1
0132
,475
2014
937
1513
,131
4724
784
1024
382
Met
ers
00
00
00
00
00
025
383
Cus
tom
er24
,444
18,9
0318
292
21,
179
416
61
2638
5A
cct 3
85 D
eman
d1,
001
00
00
00
3321
243
132
227
T
otal
Dis
tribu
tion
2,11
9,18
81,
316,
607
1,47
84,
736
897
1,45
915
1,40
27,
659
48,7
9197
,362
72,5
4928 29
C
usto
mer
Cus
tom
er0
00
00
00
00
00
30 31To
tal C
onst
ruct
ion
Wor
k in
Pro
gres
s4,
139,
150
2,17
6,60
42,
827
12,0
212,
675
4,60
634
3,38
432
,320
152,
222
304,
665
240,
555
May
not
cro
ss-c
heck
due
to R
ound
ing
Case No. U-17273 Witness: J.C. Hoffman Malueg
Exhibit A-16 (JCHM-2) Schedule F1.2 Page 17 of 20

Mic
higa
n P
ublic
Ser
vice
Com
mis
sion
Mic
higa
n G
as U
tiliti
es C
orpo
ratio
nH
isto
rical
Cos
t of S
ervi
ce A
lloca
tion
Stu
dyH
isto
rical
Yea
r End
ing
Dec
embe
r 31,
201
2
ALL
OC
ATI
ON
OF
RA
TE B
AS
E C
OM
PO
NE
NT
- CO
NS
TRU
CTI
ON
WO
RK
IN P
RO
GR
ES
S(A
)(B
)(C
)
LIN
E
NO
.D
ES
CR
IPTI
ON
ALL
OC
ATI
ON
FA
CTO
RC
OR
PO
RA
TE
TOTA
L1
CO
NS
TRU
CTI
ON
WO
RK
IN P
RO
GR
ES
S2
P
rodu
ctio
n:3
P
urch
ased
Gas
Cos
tS
ales
04
P
rodu
ctio
n D
eman
dW
eigh
ted
Pea
k D
eman
d44
,355
5
Sto
rage
Cos
tS
tora
ge49
9,73
86
T
otal
Pro
duct
ion
544,
093
7 8
Tra
nsm
issi
on9
M
inim
um S
yste
m -
Thro
ughp
ut P
iece
MC
F Th
roug
hput
375,
532
10
Dem
and
Rel
ated
Sys
tem
Wei
ghte
d P
eak
Dem
and
1,10
0,33
711
T
otal
Tra
nsm
issi
on1,
475,
869
12 13
Dis
tribu
tion
1430
2/30
3W
eigh
ted
Pea
k D
eman
d37
515
374
Wei
ghte
d P
eak
Dem
and
553
1637
5W
eigh
ted
Pea
k D
eman
d58
017
376
(Dem
and)
Wei
ghte
d P
eak
Dem
and
857,
461
1837
6 (F
ixed
Cos
t)C
usto
mer
1,01
2,38
219
377
MC
F Th
roug
hput
020
378
Wei
ghte
d P
eak
Dem
and
37,1
5121
379
Wei
ghte
d P
eak
Dem
and
(61)
2238
0S
ervi
ces
126,
201
2338
1M
eter
s59
,101
2438
2M
eter
s0
2538
3C
usto
mer
24,4
4426
385
Acc
t 385
Dem
and
1,00
127
T
otal
Dis
tribu
tion
2,11
9,18
828 29
C
usto
mer
Cus
tom
er0
30 31To
tal C
onst
ruct
ion
Wor
k in
Pro
gres
s4,
139,
150
(D)
(E)
(F)
(G)
(H)
(I)(J
)(K
)(L
)(N
)(O
)
Cus
tom
er C
hoic
e -
Res
iden
tial
Cus
tom
er C
hoic
e -
Sm
all G
SC
usto
mer
Cho
ice
- La
rge
GS
Cus
tom
er C
hoic
e -
Mul
ti-Fa
mily
IC
usto
mer
Cho
ice
- M
ulti-
Fam
ily II
Cus
tom
er C
hoic
e -
Mul
ti-Fa
mily
III
Cus
tom
er C
hoic
e -
Mul
ti-Fa
mily
IVA
gg T
rans
port
- R
esid
entia
lA
gg T
rans
port
- S
mal
l GS
Agg
Tra
nspo
rt -
Larg
e G
SS
peci
al C
ontra
ct
00
00
00
00
00
03,
999
4,21
30
38
414
131,
598
320
47,7
6753
,842
040
106
8227
915
819
,364
728
1851
,766
58,0
550
4311
486
293
171
20,9
6276
118
28,0
5432
,516
021
6028
108
8812
,335
371
499
,195
104,
505
075
192
9234
731
339
,644
801
812
7,24
913
7,02
10
9625
212
045
440
151
,979
1,17
211
3436
00
00
00
140
050
530
00
00
020
00
5255
00
00
00
210
077
,300
81,4
370
5815
071
270
244
30,8
9362
46
144,
189
29,9
110
7074
66
213
2,94
418
60
00
00
00
00
00
3,34
93,
528
03
63
1211
1,33
827
0(6
)(6
)0
(0)
(0)
(0)
(0)
(0)
(2)
(0)
(0)
18,0
543,
534
09
91
127
348
21
4,57
57,
724
01
53
17
562
41
00
00
00
00
00
03,
481
722
02
20
05
710
00
00
00
00
00
30
251,
079
126,
994
014
224
785
291
506
36,2
0967
915
00
00
00
00
00
0
430,
094
322,
070
028
161
329
11,
038
1,07
810
9,15
02,
612
45
May
not
cro
ss-c
heck
due
to R
ound
ing
Case No. U-17273 Witness: J.C. Hoffman Malueg
Exhibit A-16 (JCHM-2) Schedule F1.2 Page 18 of 20

Mic
higa
n P
ublic
Ser
vice
Com
mis
sion
Mic
higa
n G
as U
tiliti
es C
orpo
ratio
nH
isto
rical
Cos
t of S
ervi
ce A
lloca
tion
Stu
dyH
isto
rical
Yea
r End
ing
Dec
embe
r 31,
201
2
OTH
ER
RA
TE B
AS
E C
OM
PO
NE
NTS (A
)(B
)(C
)(D
)(E
)(F
)(G
)(H
)(I)
(J)
(K)
(L)
(N)
LIN
E
NO
.D
ES
CR
IPTI
ON
ALL
OC
ATI
ON
FA
CTO
RC
OR
PO
RA
TE
TOTA
LR
esid
entia
lM
ulti-
Fam
ily -
Cla
ss I
Mul
ti-Fa
mily
- C
lass
IIM
ulti-
Fam
ily -
Cla
ss
IIIM
ulti-
Fam
ily -
Cla
ss
IVS
mal
l Gen
eral
S
ervi
ceLa
rge
Gen
eral
S
ervi
ceTr
ansp
ort -
TR
-1Tr
ansp
ort -
TR
-2Tr
ansp
ort -
TR
-31 2
Gas
Sto
red
Und
ergr
ound
:S
tora
ge16
,547
,698
7,80
0,37
911
,573
65,5
8117
,022
29,0
971,
823,
680
365,
133
574,
103
959,
466
849,
149
3 4Fu
el S
tock
00
00
00
00
00
05 6
Wor
king
Cap
ital A
llow
ance
7
E
nerg
y R
elat
edM
CF
Thro
ughp
ut3,
654,
092
1,29
8,73
92,
080
11,8
822,
830
5,08
230
6,70
340
,888
246,
965
534,
801
488,
101
8
P
rodu
ctio
n D
eman
d R
elat
edW
eigh
ted
Pea
k D
eman
d31
8,57
011
3,22
618
11,
036
247
443
26,7
393,
565
21,5
3146
,625
42,5
539
Tra
nsm
issi
on R
elat
edW
eigh
ted
Pea
k D
eman
d3,
366,
289
1,44
3,79
02,
312
12,0
072,
860
5,13
530
9,92
027
,737
178,
543
362,
791
271,
139
10
D
istri
butio
n R
elat
edW
eigh
ted
Pea
k D
eman
d25
,650
,690
11,1
51,3
7715
,012
84,0
9224
,374
39,2
182,
576,
361
721,
719
1,36
0,47
22,
232,
886
2,06
6,04
111
Sto
rage
Rel
ated
Wei
ghte
d P
eak
Dem
and
1,93
3,63
291
1,49
01,
352
7,66
31,
989
3,40
021
3,10
142
,666
67,0
8511
2,11
599
,225
12
C
usto
mer
Rel
ated
Cus
tom
er0
00
00
00
00
00
13
Sub
-Tot
al34
,923
,273
14,9
18,6
2220
,937
116,
681
32,3
0153
,277
3,43
2,82
383
6,57
51,
874,
596
3,28
9,21
82,
967,
059
14 15M
ater
ials
& S
uppl
ies:
16
Dis
tribu
tion
Dem
and
Wei
ghte
d P
eak
Dem
and
141,
501
60,6
8997
505
120
216
13,0
271,
166
7,50
515
,250
11,3
9717
D
istri
butio
n Fi
xed
Cos
tC
usto
mer
346,
651
268,
070
251
417
3023
16,7
1959
233
8013
18
Sub
-Tot
al48
8,15
232
8,75
934
892
215
023
929
,746
1,22
57,
738
15,3
3011
,410
19 20O
ther
- D
efer
red
Taxe
s (M
&S
/ C
WIP
)21
D
istri
butio
n D
eman
dW
eigh
ted
Pea
k D
eman
d0
00
00
00
00
00
22
Dis
tribu
tion
Fixe
d C
ost
Cus
tom
er0
00
00
00
00
00
23
Sub
-Tot
al0
00
00
00
00
00
24 25P
repa
ymen
ts:
26
E
nerg
y R
elat
edM
CF
Thro
ughp
ut94
633
61
31
179
1164
138
126
27
P
rodu
ctio
n D
eman
d R
elat
edW
eigh
ted
Pea
k D
eman
d20
,909
8,96
814
7518
321,
925
172
1,10
92,
253
1,68
428
Tra
nsm
issi
on R
elat
edW
eigh
ted
Pea
k D
eman
d41
,431
17,7
7028
148
3563
3,81
434
12,
197
4,46
53,
337
29
D
istri
butio
n R
elat
edW
eigh
ted
Pea
k D
eman
d38
8,27
916
6,53
226
71,
385
330
592
35,7
473,
199
20,5
9441
,846
31,2
7430
Sto
rage
Rel
ated
Sto
rage
19,6
919,
282
1478
2035
2,17
043
468
31,
142
1,01
031
Cus
tom
er R
elat
edC
usto
mer
00
00
00
00
00
032
S
ub-T
otal
471,
256
202,
888
323
1,68
940
472
343
,736
4,15
824
,647
49,8
4437
,432
33 34C
ash
& B
ank
Bal
ance
s:35
Ene
rgy
Rel
ated
MC
F Th
roug
hput
46,4
8216
,521
2615
136
653,
901
520
3,14
26,
803
6,20
936
Pro
duct
ion
Dem
and
Rel
ated
Wei
ghte
d P
eak
Dem
and
224,
539
96,3
0415
480
119
134
320
,672
1,85
011
,909
24,1
9918
,086
37
T
rans
mis
sion
Rel
ated
Wei
ghte
d P
eak
Dem
and
42,8
2118
,366
2915
336
653,
942
353
2,27
14,
615
3,44
938
Dis
tribu
tion
Rel
ated
Wei
ghte
d P
eak
Dem
and
326,
292
139,
946
224
1,16
427
749
830
,040
2,68
917
,306
35,1
6526
,281
39
S
tora
ge R
elat
edS
tora
ge24
,597
11,5
9517
9725
432,
711
543
853
1,42
61,
262
40
C
usto
mer
Rel
ated
Cus
tom
er0
00
00
00
00
00
41
Sub
-Tot
al66
4,73
128
2,73
145
12,
366
566
1,01
461
,267
5,95
435
,481
72,2
0855
,287
42 43P
rope
rty, P
ayro
ll &
Inco
me
Taxe
s A
ccru
ed:
44
E
nerg
y R
elat
edM
CF
Thro
ughp
ut57
,426
20,4
1033
187
4480
4,82
064
33,
881
8,40
57,
671
45
P
rodu
ctio
n D
eman
d R
elat
edW
eigh
ted
Pea
k D
eman
d(1
6,56
9)(7
,106
)(1
1)(5
9)(1
4)(2
5)(1
,525
)(1
37)
(879
)(1
,786
)(1
,335
)46
Tra
nsm
issi
on R
elat
edW
eigh
ted
Pea
k D
eman
d(2
63,3
25)
(112
,939
)(1
81)
(939
)(2
24)
(402
)(2
4,24
3)(2
,170
)(1
3,96
6)(2
8,37
9)(2
1,21
0)47
Dis
tribu
tion
Rel
ated
Wei
ghte
d P
eak
Dem
and
(1,4
68,3
28)
(629
,761
)(1
,008
)(5
,237
)(1
,247
)(2
,240
)(1
35,1
83)
(12,
099)
(77,
878)
(158
,244
)(1
18,2
67)
48
S
tora
ge R
elat
edS
tora
ge(8
9,42
8)(4
2,15
5)(6
3)(3
54)
(92)
(157
)(9
,856
)(1
,973
)(3
,103
)(5
,185
)(4
,589
)49
Cus
tom
er R
elat
edC
usto
mer
00
00
00
00
00
050
S
ub-T
otal
(1,7
80,2
24)
(771
,551
)(1
,230
)(6
,403
)(1
,533
)(2
,744
)(1
65,9
87)
(15,
736)
(91,
944)
(185
,190
)(1
37,7
30)
51 52TO
TAL
OTH
ER
RA
TE B
AS
E C
OM
PO
NE
NTS
51,3
14,8
8622
,761
,827
32,4
0218
0,83
648
,910
81,6
075,
225,
266
1,19
7,30
92,
424,
621
4,20
0,87
63,
782,
607
May
not
cro
ss-c
heck
due
to R
ound
ing
Case No. U-17273 Witness: J.C. Hoffman Malueg
Exhibit A-16 (JCHM-2) Schedule F1.2 Page 19 of 20

Mic
higa
n P
ublic
Ser
vice
Com
mis
sion
Mic
higa
n G
as U
tiliti
es C
orpo
ratio
nH
isto
rical
Cos
t of S
ervi
ce A
lloca
tion
Stu
dyH
isto
rical
Yea
r End
ing
Dec
embe
r 31,
201
2
OTH
ER
RA
TE B
AS
E C
OM
PO
NE
NTS (A
)(B
)(C
)
LIN
E
NO
.D
ES
CR
IPTI
ON
ALL
OC
ATI
ON
FA
CTO
RC
OR
PO
RA
TE
TOTA
L1 2
Gas
Sto
red
Und
ergr
ound
:S
tora
ge16
,547
,698
3 4Fu
el S
tock
05 6
Wor
king
Cap
ital A
llow
ance
7
E
nerg
y R
elat
edM
CF
Thro
ughp
ut3,
654,
092
8
P
rodu
ctio
n D
eman
d R
elat
edW
eigh
ted
Pea
k D
eman
d31
8,57
09
Tra
nsm
issi
on R
elat
edW
eigh
ted
Pea
k D
eman
d3,
366,
289
10
D
istri
butio
n R
elat
edW
eigh
ted
Pea
k D
eman
d25
,650
,690
11
S
tora
ge R
elat
edW
eigh
ted
Pea
k D
eman
d1,
933,
632
12
C
usto
mer
Rel
ated
Cus
tom
er0
13
Sub
-Tot
al34
,923
,273
14 15M
ater
ials
& S
uppl
ies:
16
Dis
tribu
tion
Dem
and
Wei
ghte
d P
eak
Dem
and
141,
501
17
Dis
tribu
tion
Fixe
d C
ost
Cus
tom
er34
6,65
118
S
ub-T
otal
488,
152
19 20O
ther
- D
efer
red
Taxe
s (M
&S
/ C
WIP
)21
D
istri
butio
n D
eman
dW
eigh
ted
Pea
k D
eman
d0
22
Dis
tribu
tion
Fixe
d C
ost
Cus
tom
er0
23
Sub
-Tot
al0
24 25P
repa
ymen
ts:
26
E
nerg
y R
elat
edM
CF
Thro
ughp
ut94
627
Pro
duct
ion
Dem
and
Rel
ated
Wei
ghte
d P
eak
Dem
and
20,9
0928
Tra
nsm
issi
on R
elat
edW
eigh
ted
Pea
k D
eman
d41
,431
29
D
istri
butio
n R
elat
edW
eigh
ted
Pea
k D
eman
d38
8,27
930
Sto
rage
Rel
ated
Sto
rage
19,6
9131
Cus
tom
er R
elat
edC
usto
mer
032
S
ub-T
otal
471,
256
33 34C
ash
& B
ank
Bal
ance
s:35
Ene
rgy
Rel
ated
MC
F Th
roug
hput
46,4
8236
Pro
duct
ion
Dem
and
Rel
ated
Wei
ghte
d P
eak
Dem
and
224,
539
37
T
rans
mis
sion
Rel
ated
Wei
ghte
d P
eak
Dem
and
42,8
2138
Dis
tribu
tion
Rel
ated
Wei
ghte
d P
eak
Dem
and
326,
292
39
S
tora
ge R
elat
edS
tora
ge24
,597
40
C
usto
mer
Rel
ated
Cus
tom
er0
41
Sub
-Tot
al66
4,73
142 43
Pro
perty
, Pay
roll
& In
com
e Ta
xes
Acc
rued
:44
Ene
rgy
Rel
ated
MC
F Th
roug
hput
57,4
2645
Pro
duct
ion
Dem
and
Rel
ated
Wei
ghte
d P
eak
Dem
and
(16,
569)
46
T
rans
mis
sion
Rel
ated
Wei
ghte
d P
eak
Dem
and
(263
,325
)47
Dis
tribu
tion
Rel
ated
Wei
ghte
d P
eak
Dem
and
(1,4
68,3
28)
48
S
tora
ge R
elat
edS
tora
ge(8
9,42
8)49
Cus
tom
er R
elat
edC
usto
mer
050
S
ub-T
otal
(1,7
80,2
24)
51 52TO
TAL
OTH
ER
RA
TE B
AS
E C
OM
PO
NE
NTS
51,3
14,8
86
(D)
(E)
(F)
(G)
(H)
(I)(J
)(K
)(L
)(N
)(O
)
Cus
tom
er C
hoic
e -
Res
iden
tial
Cus
tom
er C
hoic
e -
Sm
all G
SC
usto
mer
Cho
ice
- La
rge
GS
Cus
tom
er C
hoic
e -
Mul
ti-Fa
mily
IC
usto
mer
Cho
ice
- M
ulti-
Fam
ily II
Cus
tom
er C
hoic
e -
Mul
ti-Fa
mily
III
Cus
tom
er C
hoic
e -
Mul
ti-Fa
mily
IVA
gg T
rans
port
- R
esid
entia
lA
gg T
rans
port
- S
mal
l GS
Agg
Tra
nspo
rt -
Larg
e G
SS
peci
al C
ontra
ct
1,58
1,70
51,
782,
862
01,
322
3,51
42,
718
9,24
25,
232
641,
206
24,1
1859
5
00
00
00
00
00
0
272,
981
316,
394
020
658
227
71,
049
861
120,
024
3,61
235
23,7
9927
,584
018
5124
9175
10,4
6431
53
303,
470
319,
714
022
958
828
01,
060
957
121,
283
2,45
024
2,16
4,54
72,
352,
571
02,
032
5,05
35,
646
18,1
267,
580
783,
562
38,5
311,
491
184,
825
208,
331
015
441
131
81,
080
611
74,9
262,
818
700
00
00
00
00
00
2,94
9,62
33,
224,
594
02,
640
6,68
56,
545
21,4
0610
,085
1,11
0,25
947
,725
1,62
3
12,7
5613
,439
010
2512
4540
5,09
810
31
49,3
7210
,242
024
252
273
1,00
86
262
,128
23,6
810
3450
1447
113
6,10
610
93
00
00
00
00
00
00
00
00
00
00
00
00
00
00
00
00
0
7182
00
00
00
311
01,
885
1,98
60
14
27
675
315
03,
735
3,93
50
37
313
121,
493
300
35,0
0336
,877
026
6832
122
110
13,9
8928
33
1,88
22,
122
02
43
116
763
291
00
00
00
00
00
042
,576
45,0
010
3283
4115
413
517
,029
357
4
3,47
24,
025
03
74
1311
1,52
746
020
,242
21,3
260
1539
1971
648,
090
163
23,
860
4,06
70
37
413
121,
543
310
29,4
1530
,990
022
5727
103
9311
,756
237
22,
351
2,65
00
25
414
895
336
10
00
00
00
00
00
59,3
4163
,057
045
116
5721
418
823
,869
513
6
4,29
04,
972
03
94
1614
1,88
657
1(1
,494
)(1
,574
)0
(1)
(3)
(1)
(5)
(5)
(597
)(1
2)0
(23,
739)
(25,
009)
0(1
8)(4
6)(2
2)(8
3)(7
5)(9
,487
)(1
92)
(2)
(132
,369
)(1
39,4
55)
0(1
00)
(257
)(1
22)
(463
)(4
17)
(52,
902)
(1,0
69)
(10)
(8,5
48)
(9,6
35)
0(7
)(1
9)(1
5)(5
0)(2
8)(3
,465
)(1
30)
(3)
00
00
00
00
00
0(1
61,8
60)
(170
,700
)0
(123
)(3
15)
(155
)(5
84)
(512
)(6
4,56
5)(1
,346
)(1
5)
4,53
3,51
24,
968,
496
03,
949
10,1
339,
220
30,4
7915
,240
1,73
3,90
471
,477
2,21
6
May
not
cro
ss-c
heck
due
to R
ound
ing
Case No. U-17273 Witness: J.C. Hoffman Malueg
Exhibit A-16 (JCHM-2) Schedule F1.2 Page 20 of 20

Michigan Public Service CommissionMichigan Gas Utilities CorporationHistorical Cost of Service Allocation StudyHistorical Year Ending December 31, 2012Revenue Requirement and Rate Base by Individual Rate Schedule
(A) (B) (C) (D) (E) (F) (G) (H) (I) (J)
GAS SUPPLY DISTRIBUTION DISTRIBUTION ENHANCEDLINE PURCHASED ACQUISITION PRODUCTION STORAGE DEMAND CUSTOMER OTHERNO. RATE: RESIDENTIAL GAS COST COST DEMAND COST RELATED RELATED CUSTOMER SERVICES TOTAL
12 Operation & Maintenance Expense:3 Production:4 Purchased Gas Cost 49,461,802 49,461,802 5 Gas Supply Acquisition Cost 562,095 562,095 6 Production Demand 161,635 161,635 7 Storage Cost 235,977 235,977 8 Total - Production 49,461,802 562,095 161,635 235,977 - - - - 50,421,509 910 Transmission: 129,325 11,494 140,819 11 Distribution: 802,483 4,681,859 5,484,343 12 Customer Accounts and Services: - 13 Allocable 6,973,238 6,973,238 14 Transport Allocable - - 15 Customer Sales: - - 16 Administrative & General: - 432,805 124,456 118,503 800,486 - 6,977,249 - 8,453,499 17 Total Operation & Maintenance Expense: 49,461,802 994,900 286,091 354,480 1,732,295 4,693,353 13,950,486 - 71,473,408 1819 Depreciation & Amort Expense: - - 24,396 160,773 928,594 4,062,305 - - 5,176,068 2021 Taxes Other Than Income Taxes:22 Unemployment Comp - FED & STATE 1,229 641 556 1,809 15,650 8,537 - 28,422 23 Retirement Benefits - FED 14,698 7,672 6,646 21,642 187,244 102,138 - 340,040 24 IBS Payroll Tax 8,146 4,252 3,684 11,995 103,778 56,609 - 188,464 25 Michigan SBT & Real Estate/Property - - 12,155 212,500 477,513 1,120,884 - - 1,823,053 26 Misc - Unauthorized Ins. Tax & Franchise - - 53 930 2,089 4,904 - - 7,976 27 Total Taxes Other Than Income Taxes: - 24,073 24,773 224,316 515,048 1,432,460 167,284 - 2,387,955 2829 Other Income Before Income Taxes: - - - - - - - - - 3031 Income Taxes - - 11,634 203,397 457,058 1,072,868 - - 1,744,957 32 ITC - - - - - - - - - 3334 Other Income After Income Taxes: - - - - - - - - - 3536 TOTAL EXPENSES: 49,461,802 1,018,973 346,895 942,966 3,632,995 11,260,987 14,117,771 - 80,782,388 3738 Other Operating Income (Revenue Credits):39 Acct 487, Acct 493, Acct 495: IL Tax Fee - - (1,515) (26,492) (59,530) (139,738) - - (227,276) 40 Acct 488, Acct 495: Miscellaneous (230,060) (230,060) 41 Acct 495: Customer Penalities & Gas True-up (4,569,982) (4,569,982) 42 Acct 495: VBA and Decoupling related (470,051) (470,051) 43 Total Other Operating Income: (4,569,982) - (1,515) (26,492) (529,581) (139,738) (230,060) - (5,497,369) 4445 Actual Return (Net Operating Income) - - (9,486) (165,837) (372,656) (874,749) - - (1,422,729) 4647 Return Income Deficiency - - 61,973 1,083,449 2,434,640 5,714,915 - - 9,294,976 4849 Additional Income Taxes on Deficiency: - - 9,300 162,586 365,350 857,598 - - 1,394,834 5051 REVENUE REQUIREMENTS: 44,891,820 1,018,973 407,166 1,996,672 5,530,746 16,819,012 13,887,710 - 84,552,100 5253545556 RATE BASE:57 Utility Plant in Service - - 1,036,502 7,447,682 36,042,469 144,418,500 - - 188,945,153 58 Accumulated Depreciation - S/L - - (531,005) (3,508,117) (21,579,675) (77,888,963) - - (103,507,760) 59 Construction Work in Progress - - 19,024 235,570 856,248 1,065,762 - - 2,176,604 60 Net Plant in Service - - 524,520 4,175,135 15,319,042 67,595,300 - - 87,613,997 6162 Gas Stored Underground: - - - 7,800,379 - - - - 7,800,379 63 Fuel Stock - - - - - - - - - 64 Working Capital Allowance - - 113,226 911,490 13,893,905 - - - 14,918,622 65 Materials & Supplies: - - - - 60,689 268,070 - - 328,759 66 Other - Deferred Taxes (M&S / CWIP) - - - - - - - - - 67 Prepayments - - 8,968 9,282 184,637 - - - 202,888 68 Cash & Bank Balances - - 96,304 11,595 174,832 - - - 282,731 69 Property, Payroll & Income Taxes Accrued: - - (7,106) (42,155) (722,290) - - (771,551) 70 TOTAL RATE BASE - - 735,912 12,865,726 28,910,816 67,863,370 - - 110,375,824 71 % of Rate Base 0.0000% 0.0000% 0.6667% 11.6563% 26.1931% 61.4839% 0.0000% 0.0000% 100.0000%
COMMODITY DEMAND CUSTOMER
May not cross-check due to rounding.
Case No. U-17273 Witness: J.C. Hoffman Malueg
Exhibit A-16 (JCHM-2) Schedule F1.3
Page 1 of 21

Michigan Public Service CommissionMichigan Gas Utilities CorporationHistorical Cost of Service Allocation StudyHistorical Year Ending December 31, 2012Revenue Requirement and Rate Base by Individual Rate Schedule
(A) (B) (C) (D) (E) (F) (G) (H) (I) (J)
GAS SUPPLY DISTRIBUTION DISTRIBUTION ENHANCEDLINE PURCHASED ACQUISITION PRODUCTION STORAGE DEMAND CUSTOMER OTHERNO. RATE: MULTI-FAMILY I GAS COST COST DEMAND COST RELATED RELATED CUSTOMER SERVICES TOTAL
12 Operation & Maintenance Expense:3 Production:4 Purchased Gas Cost 79,197 79,197 5 Gas Supply Acquisition Cost 900 900 6 Production Demand 259 259 7 Storage Cost 350 350 8 Total - Production 79,197 900 259 350 - - - - 80,706 910 Transmission: 207 18 225 11 Distribution: 1,285 4,027 5,312 12 Customer Accounts and Services: - 13 Allocable 6,630 6,630 14 Transport Allocable - - 15 Customer Sales: - - 16 Administrative & General: - 693 199 176 1,282 - 6,633 - 8,983 17 Total Operation & Maintenance Expense: 79,197 1,593 458 526 2,774 4,046 13,263 - 101,857 1819 Depreciation & Amort Expense: - - 39 239 1,487 3,745 - - 5,509 2021 Taxes Other Than Income Taxes:22 Unemployment Comp - FED & STATE 2 1 1 2 20 11 - 37 23 Retirement Benefits - FED 19 10 9 28 245 134 - 445 24 IBS Payroll Tax 11 6 5 16 136 74 - 247 25 Michigan SBT & Real Estate/Property - - 19 315 718 1,017 - - 2,070 26 Misc - Unauthorized Ins. Tax & Franchise - - 0 1 3 4 - - 9 27 Total Taxes Other Than Income Taxes: - 32 36 331 767 1,423 219 - 2,808 2829 Other Income Before Income Taxes: - - - - - - - - - 3031 Income Taxes - - 19 302 687 974 - - 1,981 32 ITC - - - - - - - - - 3334 Other Income After Income Taxes: - - - - - - - - - 3536 TOTAL EXPENSES: 79,197 1,625 552 1,397 5,715 10,187 13,482 - 112,155 3738 Other Operating Income (Revenue Credits):39 Acct 487, Acct 493, Acct 495: IL Tax Fee - - (2) (36) (82) (116) - - (236) 40 Acct 488, Acct 495: Miscellaneous (149) (149) 41 Acct 495: Customer Penalities & Gas True-up (7,317) (7,317) 42 Acct 495: VBA and Decoupling related 790 790 43 Total Other Operating Income: (7,317) - (2) (36) 708 (116) (149) - (6,912) 4445 Actual Return (Net Operating Income) - - (7) (119) (272) (385) - - (783) 4647 Return Income Deficiency - - 91 1,481 3,370 4,778 - - 9,720 4849 Additional Income Taxes on Deficiency: - - 15 241 549 778 - - 1,583 5051 REVENUE REQUIREMENTS: 71,880 1,625 648 2,964 10,071 15,242 13,333 - 115,763 5253545556 RATE BASE:57 Utility Plant in Service - - 1,660 11,049 57,711 133,192 - - 203,612 58 Accumulated Depreciation - S/L - - (850) (5,205) (34,553) (72,932) - - (113,540) 59 Construction Work in Progress - - 30 349 1,371 1,076 - - 2,827 60 Net Plant in Service - - 840 6,194 24,529 61,337 - - 92,899 6162 Gas Stored Underground: - - - 11,573 - - - - 11,573 63 Fuel Stock - - - - - - - - - 64 Working Capital Allowance - - 181 1,352 19,404 - - - 20,937 65 Materials & Supplies: - - - - 97 251 - - 348 66 Other - Deferred Taxes (M&S / CWIP) - - - - - - - - - 67 Prepayments - - 14 14 296 - - - 323 68 Cash & Bank Balances - - 154 17 280 - - - 451 69 Property, Payroll & Income Taxes Accrued: - - (11) (63) (1,157) - - (1,230) 70 TOTAL RATE BASE - - 1,178 19,088 43,448 61,588 - - 125,302 71 % of Rate Base 0.0000% 0.0000% 0.9400% 15.2336% 34.6748% 49.1516% 0.0000% 0.0000% 100.0000%
COMMODITY DEMAND CUSTOMER
May not cross-check due to rounding.
Case No. U-17273 Witness: J.C. Hoffman Malueg
Exhibit A-16 (JCHM-2) Schedule F1.3
Page 2 of 21

Michigan Public Service CommissionMichigan Gas Utilities CorporationHistorical Cost of Service Allocation StudyHistorical Year Ending December 31, 2012Revenue Requirement and Rate Base by Individual Rate Schedule
(A) (B) (C) (D) (E) (F) (G) (H) (I) (J)
GAS SUPPLY DISTRIBUTION DISTRIBUTION ENHANCEDLINE PURCHASED ACQUISITION PRODUCTION STORAGE DEMAND CUSTOMER OTHERNO. RATE: MULTI-FAMILY II GAS COST COST DEMAND COST RELATED RELATED CUSTOMER SERVICES TOTAL
12 Operation & Maintenance Expense:3 Production:4 Purchased Gas Cost 452,523 452,523 5 Gas Supply Acquisition Cost 5,143 5,143 6 Production Demand 1,344 1,344 7 Storage Cost 1,984 1,984 8 Total - Production 452,523 5,143 1,344 1,984 - - - - 460,994 910 Transmission: 1,075 105 1,181 11 Distribution: 6,674 10,472 17,146 12 Customer Accounts and Services: - 13 Allocable 14,705 14,705 14 Transport Allocable - - 15 Customer Sales: - - 16 Administrative & General: - 3,960 1,035 996 6,657 - 14,713 - 27,361 17 Total Operation & Maintenance Expense: 452,523 9,102 2,379 2,980 14,406 10,578 29,418 - 521,386 1819 Depreciation & Amort Expense: - - 203 1,352 7,722 7,757 - - 17,034 2021 Taxes Other Than Income Taxes:22 Unemployment Comp - FED & STATE 7 3 3 10 84 46 - 153 23 Retirement Benefits - FED 79 41 36 116 1,006 549 - 1,827 24 IBS Payroll Tax 44 23 20 64 558 304 - 1,012 25 Michigan SBT & Real Estate/Property - - 103 1,787 3,847 2,558 - - 8,294 26 Misc - Unauthorized Ins. Tax & Franchise - - 0 8 17 11 - - 36 27 Total Taxes Other Than Income Taxes: - 129 171 1,853 4,054 4,217 899 - 11,323 2829 Other Income Before Income Taxes: - - - - - - - - - 3031 Income Taxes - - 98 1,710 3,682 2,449 - - 7,939 32 ITC - - - - - - - - - 3334 Other Income After Income Taxes: - - - - - - - - - 3536 TOTAL EXPENSES: 452,523 9,232 2,851 7,895 29,864 25,001 30,316 - 557,682 3738 Other Operating Income (Revenue Credits):39 Acct 487, Acct 493, Acct 495: IL Tax Fee - - (15) (265) (570) (379) - - (1,229) 40 Acct 488, Acct 495: Miscellaneous 526 526 41 Acct 495: Customer Penalities & Gas True-up (41,811) (41,811) 42 Acct 495: VBA and Decoupling related 4,449 4,449 43 Total Other Operating Income: (41,811) - (15) (265) 3,879 (379) 526 - (38,064) 4445 Actual Return (Net Operating Income) - - 807 14,047 30,245 20,116 - - 65,214 4647 Return Income Deficiency - - (364) (6,332) (13,634) (9,068) - - (29,398) 4849 Additional Income Taxes on Deficiency: - - 79 1,367 2,943 1,957 - - 6,346 5051 REVENUE REQUIREMENTS: 410,713 9,232 3,358 16,712 53,297 37,627 30,843 - 561,780 5253545556 RATE BASE:57 Utility Plant in Service - - 8,620 62,616 299,734 332,745 - - 703,714 58 Accumulated Depreciation - S/L - - (4,416) (29,494) (179,459) (181,026) - - (394,395) 59 Construction Work in Progress - - 158 1,981 7,121 2,761 - - 12,021 60 Net Plant in Service - - 4,362 35,102 127,395 154,480 - - 321,339 6162 Gas Stored Underground: - - - 65,581 - - - - 65,581 63 Fuel Stock - - - - - - - - - 64 Working Capital Allowance - - 1,036 7,663 107,981 - - - 116,681 65 Materials & Supplies: - - - - 505 417 - - 922 66 Other - Deferred Taxes (M&S / CWIP) - - - - - - - - - 67 Prepayments - - 75 78 1,536 - - - 1,689 68 Cash & Bank Balances - - 801 97 1,468 - - - 2,366 69 Property, Payroll & Income Taxes Accrued: - - (59) (354) (5,989) - - (6,403) 70 TOTAL RATE BASE - - 6,215 108,167 232,895 154,897 - - 502,175 71 % of Rate Base 0.0000% 0.0000% 1.2376% 21.5398% 46.3773% 30.8453% 0.0000% 0.0000% 100.0000%
COMMODITY DEMAND CUSTOMER
May not cross-check due to rounding.
Case No. U-17273 Witness: J.C. Hoffman Malueg
Exhibit A-16 (JCHM-2) Schedule F1.3
Page 3 of 21

Michigan Public Service CommissionMichigan Gas Utilities CorporationHistorical Cost of Service Allocation StudyHistorical Year Ending December 31, 2012Revenue Requirement and Rate Base by Individual Rate Schedule
(A) (B) (C) (D) (E) (F) (G) (H) (I) (J)
GAS SUPPLY DISTRIBUTION DISTRIBUTION ENHANCEDLINE PURCHASED ACQUISITION PRODUCTION STORAGE DEMAND CUSTOMER OTHERNO. RATE: MULTI-FAMILY III GAS COST COST DEMAND COST RELATED RELATED CUSTOMER SERVICES TOTAL
12 Operation & Maintenance Expense:3 Production:4 Purchased Gas Cost 107,788 107,788 5 Gas Supply Acquisition Cost 1,225 1,225 6 Production Demand 320 320 7 Storage Cost 515 515 8 Total - Production 107,788 1,225 320 515 - - - - 109,848 910 Transmission: 256 25 281 11 Distribution: 1,590 1,632 3,221 12 Customer Accounts and Services: - 13 Allocable 1,400 1,400 14 Transport Allocable - - 15 Customer Sales: - - 16 Administrative & General: - 943 247 259 1,586 - 1,401 - 4,434 17 Total Operation & Maintenance Expense: 107,788 2,168 567 774 3,431 1,657 2,800 - 119,184 1819 Depreciation & Amort Expense: - - 48 351 1,839 940 - - 3,178 2021 Taxes Other Than Income Taxes:22 Unemployment Comp - FED & STATE 1 1 1 2 18 10 - 33 23 Retirement Benefits - FED 17 9 8 25 219 119 - 398 24 IBS Payroll Tax 10 5 4 14 121 66 - 220 25 Michigan SBT & Real Estate/Property - - 24 464 988 389 - - 1,865 26 Misc - Unauthorized Ins. Tax & Franchise - - 0 2 4 2 - - 8 27 Total Taxes Other Than Income Taxes: - 28 39 478 1,034 749 196 - 2,525 2829 Other Income Before Income Taxes: - - - - - - - - - 3031 Income Taxes - - 23 444 946 372 - - 1,785 32 ITC - - - - - - - - - 3334 Other Income After Income Taxes: - - - - - - - - - 3536 TOTAL EXPENSES: 107,788 2,196 678 2,047 7,250 3,718 2,996 - 126,673 3738 Other Operating Income (Revenue Credits):39 Acct 487, Acct 493, Acct 495: IL Tax Fee - - (2) (42) (90) (35) - - (170) 40 Acct 488, Acct 495: Miscellaneous 242 242 41 Acct 495: Customer Penalities & Gas True-up (9,959) (9,959) 42 Acct 495: VBA and Decoupling related (8,775) (8,775) 43 Total Other Operating Income: (9,959) - (2) (42) (8,865) (35) 242 - (18,662) 4445 Actual Return (Net Operating Income) - - 234 4,440 9,460 3,725 - - 17,859 4647 Return Income Deficiency - - (129) (2,438) (5,194) (2,045) - - (9,805) 4849 Additional Income Taxes on Deficiency: - - 19 355 756 298 - - 1,427 5051 REVENUE REQUIREMENTS: 97,829 2,196 800 4,362 3,407 5,660 3,238 - 117,492 5253545556 RATE BASE:57 Utility Plant in Service - - 2,053 16,252 71,394 50,409 - - 140,109 58 Accumulated Depreciation - S/L - - (1,052) (7,655) (42,746) (27,314) - - (78,767) 59 Construction Work in Progress - - 38 514 1,696 427 - - 2,675 60 Net Plant in Service - - 1,039 9,111 30,345 23,521 - - 64,016 6162 Gas Stored Underground: - - - 17,022 - - - - 17,022 63 Fuel Stock - - - - - - - - - 64 Working Capital Allowance - - 247 1,989 30,065 - - - 32,301 65 Materials & Supplies: - - - - 120 30 - - 150 66 Other - Deferred Taxes (M&S / CWIP) - - - - - - - - - 67 Prepayments - - 18 20 366 - - - 404 68 Cash & Bank Balances - - 191 25 350 - - - 566 69 Property, Payroll & Income Taxes Accrued: - - (14) (92) (1,427) - - (1,533) 70 TOTAL RATE BASE - - 1,481 28,076 59,818 23,551 - - 112,926 71 % of Rate Base 0.0000% 0.0000% 1.3115% 24.8620% 52.9709% 20.8556% 0.0000% 0.0000% 100.0000%
COMMODITY DEMAND CUSTOMER
May not cross-check due to rounding.
Case No. U-17273 Witness: J.C. Hoffman Malueg
Exhibit A-16 (JCHM-2) Schedule F1.3
Page 4 of 21

Michigan Public Service CommissionMichigan Gas Utilities CorporationHistorical Cost of Service Allocation StudyHistorical Year Ending December 31, 2012Revenue Requirement and Rate Base by Individual Rate Schedule
(A) (B) (C) (D) (E) (F) (G) (H) (I) (J)
GAS SUPPLY DISTRIBUTION DISTRIBUTION ENHANCEDLINE PURCHASED ACQUISITION PRODUCTION STORAGE DEMAND CUSTOMER OTHERNO. RATE: MULTI-FAMILY IV GAS COST COST DEMAND COST RELATED RELATED CUSTOMER SERVICES TOTAL
12 Operation & Maintenance Expense:3 Production:4 Purchased Gas Cost 193,537 193,537 5 Gas Supply Acquisition Cost 2,199 2,199 6 Production Demand 575 575 7 Storage Cost 880 880 8 Total - Production 193,537 2,199 575 880 - - - - 197,192 910 Transmission: 460 45 505 11 Distribution: 2,854 812 3,666 12 Customer Accounts and Services: - 13 Allocable 1,494 1,494 14 Transport Allocable - - 15 Customer Sales: - - 16 Administrative & General: - 1,694 443 442 2,847 - 1,495 - 6,920 17 Total Operation & Maintenance Expense: 193,537 3,893 1,018 1,322 6,161 857 2,989 - 209,776 1819 Depreciation & Amort Expense: - - 87 600 3,303 758 - - 4,748 2021 Taxes Other Than Income Taxes:22 Unemployment Comp - FED & STATE 3 1 1 4 32 17 - 58 23 Retirement Benefits - FED 30 16 14 44 383 209 - 696 24 IBS Payroll Tax 17 9 8 25 213 116 - 386 25 Michigan SBT & Real Estate/Property - - 44 793 1,699 315 - - 2,851 26 Misc - Unauthorized Ins. Tax & Franchise - - 0 3 7 1 - - 12 27 Total Taxes Other Than Income Taxes: - 49 70 818 1,779 945 343 - 4,004 2829 Other Income Before Income Taxes: - - - - - - - - - 3031 Income Taxes - - 42 759 1,626 302 - - 2,729 32 ITC - - - - - - - - - 3334 Other Income After Income Taxes: - - - - - - - - - 3536 TOTAL EXPENSES: 193,537 3,942 1,216 3,499 12,869 2,862 3,331 - 221,257 3738 Other Operating Income (Revenue Credits):39 Acct 487, Acct 493, Acct 495: IL Tax Fee - - (3) (63) (134) (25) - - (225) 40 Acct 488, Acct 495: Miscellaneous 117 117 41 Acct 495: Customer Penalities & Gas True-up (17,882) (17,882) 42 Acct 495: VBA and Decoupling related (15,623) (15,623) 43 Total Other Operating Income: (17,882) - (3) (63) (15,757) (25) 117 - (33,613) 4445 Actual Return (Net Operating Income) - - 459 8,284 17,754 3,296 - - 29,792 4647 Return Income Deficiency - - (269) (4,861) (10,418) (1,934) - - (17,482) 4849 Additional Income Taxes on Deficiency: - - 34 606 1,300 241 - - 2,181 5051 REVENUE REQUIREMENTS: 175,656 3,942 1,436 7,466 5,748 4,440 3,449 - 202,136 5253545556 RATE BASE:57 Utility Plant in Service - - 3,687 27,781 128,192 45,896 - - 205,556 58 Accumulated Depreciation - S/L - - (1,889) (13,086) (76,752) (27,437) - - (119,164) 59 Construction Work in Progress - - 68 879 3,045 615 - - 4,606 60 Net Plant in Service - - 1,866 15,574 54,485 19,074 - - 90,998 6162 Gas Stored Underground: - - - 29,097 - - - - 29,097 63 Fuel Stock - - - - - - - - - 64 Working Capital Allowance - - 443 3,400 49,434 - - - 53,277 65 Materials & Supplies: - - - - 216 23 - - 239 66 Other - Deferred Taxes (M&S / CWIP) - - - - - - - - - 67 Prepayments - - 32 35 657 - - - 723 68 Cash & Bank Balances - - 343 43 628 - - - 1,014 69 Property, Payroll & Income Taxes Accrued: - - (25) (157) (2,562) - - (2,744) 70 TOTAL RATE BASE - - 2,659 47,992 102,858 19,097 - - 172,605 71 % of Rate Base 0.0000% 0.0000% 1.5403% 27.8044% 59.5916% 11.0637% 0.0000% 0.0000% 100.0000%
COMMODITY DEMAND CUSTOMER
May not cross-check due to rounding.
Case No. U-17273 Witness: J.C. Hoffman Malueg
Exhibit A-16 (JCHM-2) Schedule F1.3
Page 5 of 21

Michigan Public Service CommissionMichigan Gas Utilities CorporationHistorical Cost of Service Allocation StudyHistorical Year Ending December 31, 2012Revenue Requirement and Rate Base by Individual Rate Schedule
(A) (B) (C) (D) (E) (F) (G) (H) (I) (J)
GAS SUPPLY DISTRIBUTION DISTRIBUTION ENHANCEDLINE PURCHASED ACQUISITION PRODUCTION STORAGE DEMAND CUSTOMER OTHERNO. RATE: SMALL GS GAS COST COST DEMAND COST RELATED RELATED CUSTOMER SERVICES TOTAL
12 Operation & Maintenance Expense:3 Production:4 Purchased Gas Cost 11,680,616 11,680,616 5 Gas Supply Acquisition Cost 132,741 132,741 6 Production Demand 34,696 34,696 7 Storage Cost 55,170 55,170 8 Total - Production 11,680,616 132,741 34,696 55,170 - - - - 11,903,223 910 Transmission: 27,761 2,714 30,475 11 Distribution: 172,259 660,079 832,338 12 Customer Accounts and Services: - 13 Allocable 561,328 561,328 14 Transport Allocable - - 15 Customer Sales: - - 16 Administrative & General: - 102,209 26,715 27,705 171,830 - 561,651 - 890,111 17 Total Operation & Maintenance Expense: 11,680,616 234,950 61,412 82,875 371,850 662,793 1,122,979 - 14,217,475 1819 Depreciation & Amort Expense: - - 5,237 37,588 199,330 375,204 - - 617,358 2021 Taxes Other Than Income Taxes:22 Unemployment Comp - FED & STATE 183 95 83 269 2,326 1,269 - 4,225 23 Retirement Benefits - FED 2,185 1,140 988 3,217 27,832 15,182 - 50,545 24 IBS Payroll Tax 1,211 632 548 1,783 15,426 8,415 - 28,014 25 Michigan SBT & Real Estate/Property - - 2,649 49,681 105,993 137,005 - - 295,329 26 Misc - Unauthorized Ins. Tax & Franchise - - 12 217 464 599 - - 1,292 27 Total Taxes Other Than Income Taxes: - 3,578 4,529 51,517 111,725 183,190 24,866 - 379,404 2829 Other Income Before Income Taxes: - - - - - - - - - 3031 Income Taxes - - 2,536 47,553 101,452 131,136 - - 282,678 32 ITC - - - - - - - - - 3334 Other Income After Income Taxes: - - - - - - - - - 3536 TOTAL EXPENSES: 11,680,616 238,528 73,713 219,533 784,357 1,352,323 1,147,845 - 15,496,914 3738 Other Operating Income (Revenue Credits):39 Acct 487, Acct 493, Acct 495: IL Tax Fee - - (384) (7,208) (15,379) (19,879) - - (42,851) 40 Acct 488, Acct 495: Miscellaneous 32,813 32,813 41 Acct 495: Customer Penalities & Gas True-up (1,079,221) (1,079,221) 42 Acct 495: VBA and Decoupling related 92,671 92,671 43 Total Other Operating Income: (1,079,221) - (384) (7,208) 77,292 (19,879) 32,813 - (996,588) 4445 Actual Return (Net Operating Income) - - 16,090 301,730 643,728 832,079 - - 1,793,628 4647 Return Income Deficiency - - (4,650) (87,198) (186,034) (240,466) - - (518,349) 4849 Additional Income Taxes on Deficiency: - - 2,027 38,012 81,096 104,824 - - 225,959 5051 REVENUE REQUIREMENTS: 10,601,395 238,528 86,796 464,868 1,400,439 2,028,881 1,180,657 - 16,001,564 5253545556 RATE BASE:57 Utility Plant in Service - - 222,493 1,741,222 7,736,784 16,879,224 - - 26,579,722 58 Accumulated Depreciation - S/L - - (113,984) (820,176) (4,632,237) (8,701,439) - - (14,267,837) 59 Construction Work in Progress - - 4,084 55,075 183,800 100,426 - - 343,384 60 Net Plant in Service - - 112,592 976,121 3,288,346 8,278,211 - - 12,655,270 6162 Gas Stored Underground: - - - 1,823,680 - - - - 1,823,680 63 Fuel Stock - - - - - - - - - 64 Working Capital Allowance - - 26,739 213,101 3,192,984 - - - 3,432,823 65 Materials & Supplies: - - - - 13,027 16,719 - - 29,746 66 Other - Deferred Taxes (M&S / CWIP) - - - - - - - - - 67 Prepayments - - 1,925 2,170 39,641 - - - 43,736 68 Cash & Bank Balances - - 20,672 2,711 37,884 - - - 61,267 69 Property, Payroll & Income Taxes Accrued: - - (1,525) (9,856) (154,606) - - (165,987) 70 TOTAL RATE BASE - - 160,403 3,007,927 6,417,276 8,294,930 - - 17,880,535 71 % of Rate Base 0.0000% 0.0000% 0.8971% 16.8224% 35.8897% 46.3908% 0.0000% 0.0000% 100.0000%
COMMODITY DEMAND CUSTOMER
May not cross-check due to rounding.
Case No. U-17273 Witness: J.C. Hoffman Malueg
Exhibit A-16 (JCHM-2) Schedule F1.3
Page 6 of 21

Michigan Public Service CommissionMichigan Gas Utilities CorporationHistorical Cost of Service Allocation StudyHistorical Year Ending December 31, 2012Revenue Requirement and Rate Base by Individual Rate Schedule
(A) (B) (C) (D) (E) (F) (G) (H) (I) (J)
GAS SUPPLY DISTRIBUTION DISTRIBUTION ENHANCEDLINE PURCHASED ACQUISITION PRODUCTION STORAGE DEMAND CUSTOMER OTHERNO. RATE: LARGE GS GAS COST COST DEMAND COST RELATED RELATED CUSTOMER SERVICES TOTAL
12 Operation & Maintenance Expense:3 Production:4 Purchased Gas Cost 1,557,202 1,557,202 5 Gas Supply Acquisition Cost 17,696 17,696 6 Production Demand 3,105 3,105 7 Storage Cost 11,046 11,046 8 Total - Production 1,557,202 17,696 3,105 11,046 - - - - 1,589,050 910 Transmission: 2,485 362 2,846 11 Distribution: 16,525 2,352 18,876 12 Customer Accounts and Services: - 13 Allocable 11,745 11,745 14 Transport Allocable - - 15 Customer Sales: - - 16 Administrative & General: - 13,626 2,391 5,547 16,483 - 11,751 - 49,799 17 Total Operation & Maintenance Expense: 1,557,202 31,322 5,496 16,593 35,493 2,714 23,496 - 1,672,316 1819 Depreciation & Amort Expense: - - 469 7,526 18,419 3,639 - - 30,052 2021 Taxes Other Than Income Taxes:22 Unemployment Comp - FED & STATE 14 7 6 21 179 97 - 324 23 Retirement Benefits - FED 168 88 76 247 2,137 1,166 - 3,881 24 IBS Payroll Tax 93 49 42 137 1,185 646 - 2,151 25 Michigan SBT & Real Estate/Property - - 256 9,947 17,983 1,706 - - 29,892 26 Misc - Unauthorized Ins. Tax & Franchise - - 1 44 79 7 - - 131 27 Total Taxes Other Than Income Taxes: - 275 401 10,115 18,466 5,213 1,909 - 36,379 2829 Other Income Before Income Taxes: - - - - - - - - - 3031 Income Taxes - - 245 9,521 17,212 1,632 - - 28,611 32 ITC - - - - - - - - - 3334 Other Income After Income Taxes: - - - - - - - - - 3536 TOTAL EXPENSES: 1,557,202 31,597 6,611 43,755 89,590 13,198 25,405 - 1,767,358 3738 Other Operating Income (Revenue Credits):39 Acct 487, Acct 493, Acct 495: IL Tax Fee - - (21) (800) (1,446) (137) - - (2,403) 40 Acct 488, Acct 495: Miscellaneous 4,259 4,259 41 Acct 495: Customer Penalities & Gas True-up (143,876) (143,876) 42 Acct 495: VBA and Decoupling related - - 43 Total Other Operating Income: (143,876) - (21) (800) (1,446) (137) 4,259 - (142,020) 4445 Actual Return (Net Operating Income) - - 1,605 62,247 112,533 10,673 - - 187,058 4647 Return Income Deficiency - - (497) (19,294) (34,881) (3,308) - - (57,981) 4849 Additional Income Taxes on Deficiency: - - 196 7,611 13,759 1,305 - - 22,870 5051 REVENUE REQUIREMENTS: 1,413,326 31,597 7,894 93,518 179,555 21,731 29,665 - 1,777,286 5253545556 RATE BASE:57 Utility Plant in Service - - 19,913 348,623 712,843 268,543 - - 1,349,921 58 Accumulated Depreciation - S/L - - (10,201) (164,214) (425,569) (169,788) - - (769,771) 59 Construction Work in Progress - - 365 11,027 16,483 4,445 - - 32,320 60 Net Plant in Service - - 10,077 195,436 303,756 103,200 - - 612,469 6162 Gas Stored Underground: - - - 365,133 - - - - 365,133 63 Fuel Stock - - - - - - - - - 64 Working Capital Allowance - - 3,565 42,666 790,344 - - - 836,575 65 Materials & Supplies: - - - - 1,166 59 - - 1,225 66 Other - Deferred Taxes (M&S / CWIP) - - - - - - - - - 67 Prepayments - - 172 434 3,551 - - - 4,158 68 Cash & Bank Balances - - 1,850 543 3,561 - - - 5,954 69 Property, Payroll & Income Taxes Accrued: - - (137) (1,973) (13,626) - - (15,736) 70 TOTAL RATE BASE - - 15,527 602,240 1,088,753 103,259 - - 1,809,778 71 % of Rate Base 0.0000% 0.0000% 0.8579% 33.2770% 60.1595% 5.7056% 0.0000% 0.0000% 100.0000%
COMMODITY DEMAND CUSTOMER
May not cross-check due to rounding.
Case No. U-17273 Witness: J.C. Hoffman Malueg
Exhibit A-16 (JCHM-2) Schedule F1.3
Page 7 of 21

Michigan Public Service CommissionMichigan Gas Utilities CorporationHistorical Cost of Service Allocation StudyHistorical Year Ending December 31, 2012Revenue Requirement and Rate Base by Individual Rate Schedule
(A) (B) (C) (D) (E) (F) (G) (H) (I) (J)
GAS SUPPLY DISTRIBUTION DISTRIBUTION ENHANCEDLINE PURCHASED ACQUISITION PRODUCTION STORAGE DEMAND CUSTOMER OTHERNO. RATE: TRANSPORT - TR1 GAS COST COST DEMAND COST RELATED RELATED CUSTOMER SERVICES TOTAL
12 Operation & Maintenance Expense:3 Production:4 Purchased Gas Cost - - 5 Gas Supply Acquisition Cost - - 6 Production Demand 19,988 19,988 7 Storage Cost 17,368 17,368 8 Total - Production - - 19,988 17,368 - - - - 37,356 910 Transmission: 15,993 2,186 18,178 11 Distribution: 106,368 11,797 118,165 12 Customer Accounts and Services: - 13 Allocable 102,392 102,392 14 Transport Allocable 45,249 45,249 15 Customer Sales: - - 16 Administrative & General: - - 15,391 8,722 106,103 - 102,451 32,136 264,803 17 Total Operation & Maintenance Expense: - - 35,379 26,090 228,464 13,982 204,844 77,385 586,143 1819 Depreciation & Amort Expense: - - 3,017 11,833 118,560 20,494 - - 153,903 2021 Taxes Other Than Income Taxes:22 Unemployment Comp - FED & STATE 130 38 125 1,085 592 - 1,970 23 Retirement Benefits - FED 1,550 461 1,500 12,976 7,078 - 23,566 24 IBS Payroll Tax 859 255 831 7,192 3,923 - 13,061 25 Michigan SBT & Real Estate/Property - - 1,627 15,640 61,217 9,811 - - 88,295 26 Misc - Unauthorized Ins. Tax & Franchise - - 7 68 268 43 - - 386 27 Total Taxes Other Than Income Taxes: - - 4,174 16,463 63,941 31,107 11,593 - 127,278 2829 Other Income Before Income Taxes: - - - - - - - - - 3031 Income Taxes - - 1,558 14,970 58,595 9,390 - - 84,513 32 ITC - - - - - - - - - 3334 Other Income After Income Taxes: - - - - - - - - - 3536 TOTAL EXPENSES: - - 44,127 69,355 469,560 74,973 216,437 77,385 951,837 3738 Other Operating Income (Revenue Credits):39 Acct 487, Acct 493, Acct 495: IL Tax Fee - - (404) (3,883) (15,199) (2,436) - - (21,922) 40 Acct 488, Acct 495: Miscellaneous 13,587 13,587 41 Acct 495: Customer Penalities & Gas True-up - - 42 Acct 495: VBA and Decoupling related - - 43 Total Other Operating Income: - - (404) (3,883) (15,199) (2,436) 13,587 - (8,334) 4445 Actual Return (Net Operating Income) - - 26,419 253,887 993,757 159,258 - - 1,433,322 4647 Return Income Deficiency - - (19,391) (186,352) (729,411) (116,895) - - (1,052,049) 4849 Additional Income Taxes on Deficiency: - - 1,245 11,966 46,838 7,506 - - 67,555 5051 REVENUE REQUIREMENTS: - - 51,996 144,974 765,545 122,407 230,024 77,385 1,392,331 5253545556 RATE BASE:57 Utility Plant in Service - - 128,176 548,145 4,588,538 1,562,714 - - 6,827,573 58 Accumulated Depreciation - S/L - - (65,665) (258,195) (2,739,369) (995,404) - - (4,058,634) 59 Construction Work in Progress - - 2,353 17,338 106,098 26,434 - - 152,222 60 Net Plant in Service - - 64,863 307,288 1,955,266 593,744 - - 2,921,161 6162 Gas Stored Underground: - - - 574,103 - - - - 574,103 63 Fuel Stock - - - - - - - - - 64 Working Capital Allowance - - 21,531 67,085 1,785,980 - - - 1,874,596 65 Materials & Supplies: - - - - 7,505 233 - - 7,738 66 Other - Deferred Taxes (M&S / CWIP) - - - - - - - - - 67 Prepayments - - 1,109 683 22,855 - - - 24,647 68 Cash & Bank Balances - - 11,909 853 22,719 - - - 35,481 69 Property, Payroll & Income Taxes Accrued: - - (879) (3,103) (87,963) - - (91,944) 70 TOTAL RATE BASE - - 98,533 946,910 3,706,362 593,977 - - 5,345,782 71 % of Rate Base 0.0000% 0.0000% 1.8432% 17.7132% 69.3325% 11.1111% 0.0000% 0.0000% 100.0000%
COMMODITY DEMAND CUSTOMER
May not cross-check due to rounding.
Case No. U-17273 Witness: J.C. Hoffman Malueg
Exhibit A-16 (JCHM-2) Schedule F1.3
Page 8 of 21

Michigan Public Service CommissionMichigan Gas Utilities CorporationHistorical Cost of Service Allocation StudyHistorical Year Ending December 31, 2012Revenue Requirement and Rate Base by Individual Rate Schedule
(A) (B) (C) (D) (E) (F) (G) (H) (I) (J)
GAS SUPPLY DISTRIBUTION DISTRIBUTION ENHANCEDLINE PURCHASED ACQUISITION PRODUCTION STORAGE DEMAND CUSTOMER OTHERNO. RATE: TRANSPORT - TR2 GAS COST COST DEMAND COST RELATED RELATED CUSTOMER SERVICES TOTAL
12 Operation & Maintenance Expense:3 Production:4 Purchased Gas Cost - - 5 Gas Supply Acquisition Cost - - 6 Production Demand 40,615 40,615 7 Storage Cost 29,026 29,026 8 Total - Production - - 40,615 29,026 - - - - 69,641 910 Transmission: 32,496 4,733 37,229 11 Distribution: 216,136 4,036 220,172 12 Customer Accounts and Services: - 13 Allocable 107,315 107,315 14 Transport Allocable 15,556 15,556 15 Customer Sales: - - 16 Administrative & General: - - 31,273 14,576 215,598 - 107,376 11,048 379,872 17 Total Operation & Maintenance Expense: - - 71,888 43,602 464,230 8,770 214,691 26,605 829,785 1819 Depreciation & Amort Expense: - - 6,130 19,775 240,909 33,152 - - 299,966 2021 Taxes Other Than Income Taxes:22 Unemployment Comp - FED & STATE 261 78 253 2,187 1,193 - 3,971 23 Retirement Benefits - FED 3,126 929 3,024 26,162 14,271 - 47,511 24 IBS Payroll Tax 1,732 515 1,676 14,500 7,909 - 26,332 25 Michigan SBT & Real Estate/Property - - 3,354 26,138 116,172 17,143 - - 162,807 26 Misc - Unauthorized Ins. Tax & Franchise - - 15 114 508 75 - - 712 27 Total Taxes Other Than Income Taxes: - - 8,488 27,773 121,633 60,067 23,373 - 241,334 2829 Other Income Before Income Taxes: - - - - - - - - - 3031 Income Taxes - - 3,211 25,018 111,195 16,409 - - 155,833 32 ITC - - - - - - - - - 3334 Other Income After Income Taxes: - - - - - - - - - 3536 TOTAL EXPENSES: - - 89,717 116,169 937,966 118,397 238,064 26,605 1,526,918 3738 Other Operating Income (Revenue Credits):39 Acct 487, Acct 493, Acct 495: IL Tax Fee - - (494) (3,847) (17,099) (2,523) - - (23,964) 40 Acct 488, Acct 495: Miscellaneous 13,013 13,013 41 Acct 495: Customer Penalities & Gas True-up - - 42 Acct 495: VBA and Decoupling related - - 43 Total Other Operating Income: - - (494) (3,847) (17,099) (2,523) 13,013 - (10,951) 4445 Actual Return (Net Operating Income) - - 21,935 170,919 759,659 112,100 - - 1,064,613 4647 Return Income Deficiency - - (7,450) (58,051) (258,009) (38,074) - - (361,584) 4849 Additional Income Taxes on Deficiency: - - 2,566 19,998 88,884 13,116 - - 124,565 5051 REVENUE REQUIREMENTS: - - 106,275 245,189 1,511,400 203,016 251,077 26,605 2,343,562 5253545556 RATE BASE:57 Utility Plant in Service - - 260,449 916,083 9,323,717 2,894,741 - - 13,394,990 58 Accumulated Depreciation - S/L - - (133,429) (431,507) (5,566,284) (1,912,225) - - (8,043,445) 59 Construction Work in Progress - - 4,780 28,976 215,586 55,323 - - 304,665 60 Net Plant in Service - - 131,800 513,552 3,973,019 1,037,839 - - 5,656,210 6162 Gas Stored Underground: - - - 959,466 - - - - 959,466 63 Fuel Stock - - - - - - - - - 64 Working Capital Allowance - - 46,625 112,115 3,130,478 - - - 3,289,218 65 Materials & Supplies: - - - - 15,250 80 - - 15,330 66 Other - Deferred Taxes (M&S / CWIP) - - - - - - - - - 67 Prepayments - - 2,253 1,142 46,449 - - - 49,844 68 Cash & Bank Balances - - 24,199 1,426 46,583 - - - 72,208 69 Property, Payroll & Income Taxes Accrued: - - (1,786) (5,185) (178,219) - - (185,190) 70 TOTAL RATE BASE - - 203,091 1,582,516 7,033,561 1,037,919 - - 9,857,086 71 % of Rate Base 0.0000% 0.0000% 2.0604% 16.0546% 71.3554% 10.5297% 0.0000% 0.0000% 100.0000%
COMMODITY DEMAND CUSTOMER
May not cross-check due to rounding.
Case No. U-17273 Witness: J.C. Hoffman Malueg
Exhibit A-16 (JCHM-2) Schedule F1.3
Page 9 of 21

Michigan Public Service CommissionMichigan Gas Utilities CorporationHistorical Cost of Service Allocation StudyHistorical Year Ending December 31, 2012Revenue Requirement and Rate Base by Individual Rate Schedule
(A) (B) (C) (D) (E) (F) (G) (H) (I) (J)
GAS SUPPLY DISTRIBUTION DISTRIBUTION ENHANCEDLINE PURCHASED ACQUISITION PRODUCTION STORAGE DEMAND CUSTOMER OTHERNO. RATE: TRANSPORT - TR3 GAS COST COST DEMAND COST RELATED RELATED CUSTOMER SERVICES TOTAL
12 Operation & Maintenance Expense:3 Production:4 Purchased Gas Cost - - 5 Gas Supply Acquisition Cost - - 6 Production Demand 30,354 30,354 7 Storage Cost 25,688 25,688 8 Total - Production - - 30,354 25,688 - - - - 56,043 910 Transmission: 24,287 4,320 28,607 11 Distribution: 161,533 535 162,068 12 Customer Accounts and Services: - 13 Allocable 64,150 64,150 14 Transport Allocable 2,435 2,435 15 Customer Sales: - - 16 Administrative & General: - - 23,372 12,900 161,131 - 64,187 1,729 263,320 17 Total Operation & Maintenance Expense: - - 53,727 38,589 346,951 4,855 128,338 4,164 576,623 1819 Depreciation & Amort Expense: - - 4,581 17,502 180,048 28,630 - - 230,761 2021 Taxes Other Than Income Taxes:22 Unemployment Comp - FED & STATE 196 58 189 1,638 893 - 2,974 23 Retirement Benefits - FED 2,341 695 2,265 19,593 10,688 - 35,581 24 IBS Payroll Tax 1,297 385 1,255 10,859 5,924 - 19,721 25 Michigan SBT & Real Estate/Property - - 2,634 23,133 94,887 15,048 - - 135,701 26 Misc - Unauthorized Ins. Tax & Franchise - - 12 101 415 66 - - 594 27 Total Taxes Other Than Income Taxes: - - 6,480 24,373 99,011 47,203 17,504 - 194,571 2829 Other Income Before Income Taxes: - - - - - - - - - 3031 Income Taxes - - 2,521 22,142 90,822 14,403 - - 129,888 32 ITC - - - - - - - - - 3334 Other Income After Income Taxes: - - - - - - - - - 3536 TOTAL EXPENSES: - - 67,309 102,605 716,831 95,092 145,842 4,164 1,131,843 3738 Other Operating Income (Revenue Credits):39 Acct 487, Acct 493, Acct 495: IL Tax Fee - - (283) (2,488) (10,205) (1,618) - - (14,594) 40 Acct 488, Acct 495: Miscellaneous 6,896 6,896 41 Acct 495: Customer Penalities & Gas True-up - - 42 Acct 495: VBA and Decoupling related - - 43 Total Other Operating Income: - - (283) (2,488) (10,205) (1,618) 6,896 - (7,699) 4445 Actual Return (Net Operating Income) - - 8,498 74,623 306,089 48,541 - - 437,752 4647 Return Income Deficiency - - 2,877 25,268 103,646 16,437 - - 148,229 4849 Additional Income Taxes on Deficiency: - - 2,016 17,699 72,599 11,513 - - 103,826 5051 REVENUE REQUIREMENTS: - - 80,417 217,708 1,188,960 169,965 152,738 4,164 1,813,952 5253545556 RATE BASE:57 Utility Plant in Service - - 194,651 810,754 6,968,249 2,570,674 - - 10,544,328 58 Accumulated Depreciation - S/L - - (99,721) (381,893) (4,160,063) (1,709,849) - - (6,351,526) 59 Construction Work in Progress - - 3,573 25,644 161,122 50,216 - - 240,555 60 Net Plant in Service - - 98,503 454,505 2,969,308 911,041 - - 4,433,357 6162 Gas Stored Underground: - - - 849,149 - - - - 849,149 63 Fuel Stock - - - - - - - - - 64 Working Capital Allowance - - 42,553 99,225 2,825,281 - - - 2,967,059 65 Materials & Supplies: - - - - 11,397 13 - - 11,410 66 Other - Deferred Taxes (M&S / CWIP) - - - - - - - - - 67 Prepayments - - 1,684 1,010 34,737 - - - 37,432 68 Cash & Bank Balances - - 18,086 1,262 35,939 - - - 55,287 69 Property, Payroll & Income Taxes Accrued: - - (1,335) (4,589) (131,806) - - (137,730) 70 TOTAL RATE BASE - - 159,491 1,400,562 5,744,856 911,054 - - 8,215,963 71 % of Rate Base 0.0000% 0.0000% 1.9412% 17.0468% 69.9231% 11.0888% 0.0000% 0.0000% 100.0000%
COMMODITY DEMAND CUSTOMER
May not cross-check due to rounding.
Case No. U-17273 Witness: J.C. Hoffman Malueg
Exhibit A-16 (JCHM-2) Schedule F1.3 Page 10 of 21

Michigan Public Service CommissionMichigan Gas Utilities CorporationHistorical Cost of Service Allocation StudyHistorical Year Ending December 31, 2012Revenue Requirement and Rate Base by Individual Rate Schedule
(A) (B) (C) (D) (E) (F) (G) (H) (I) (J)
GAS SUPPLY DISTRIBUTION DISTRIBUTION ENHANCEDLINE PURCHASED ACQUISITION PRODUCTION STORAGE DEMAND CUSTOMER OTHERNO. RATE: CUST CHOICE - RESID. GAS COST COST DEMAND COST RELATED RELATED CUSTOMER SERVICES TOTAL
12 Operation & Maintenance Expense:3 Production:4 Purchased Gas Cost - - 5 Gas Supply Acquisition Cost - - 6 Production Demand 33,974 33,974 7 Storage Cost 47,850 47,850 8 Total - Production - - 33,974 47,850 - - - - 81,824 910 Transmission: 27,183 2,416 29,599 11 Distribution: 168,674 815,015 983,689 12 Customer Accounts and Services: - 13 Allocable 1,409,838 1,409,838 14 Transport Allocable - - 15 Customer Sales: - - 16 Administrative & General: - - 26,159 24,029 168,254 - 1,410,649 - 1,629,092 17 Total Operation & Maintenance Expense: - - 60,133 71,879 364,110 817,431 2,820,488 - 4,134,042 1819 Depreciation & Amort Expense: - - 5,128 32,600 195,181 735,574 - - 968,483 2021 Taxes Other Than Income Taxes:22 Unemployment Comp - FED & STATE 372 110 359 3,110 1,697 - 5,648 23 Retirement Benefits - FED 4,446 1,321 4,301 37,211 20,298 - 67,576 24 IBS Payroll Tax 2,464 732 2,384 20,624 11,250 - 37,453 25 Michigan SBT & Real Estate/Property - - 2,555 43,089 97,406 199,677 - - 342,727 26 Misc - Unauthorized Ins. Tax & Franchise - - 11 189 426 874 - - 1,499 27 Total Taxes Other Than Income Taxes: - - 9,847 45,441 104,876 261,495 33,244 - 454,903 2829 Other Income Before Income Taxes: - - - - - - - - - 3031 Income Taxes - - 2,445 41,243 93,233 191,123 - - 328,045 32 ITC - - - - - - - - - 3334 Other Income After Income Taxes: - - - - - - - - - 3536 TOTAL EXPENSES: - - 77,554 191,164 757,400 2,005,622 2,853,732 - 5,885,472 3738 Other Operating Income (Revenue Credits):39 Acct 487, Acct 493, Acct 495: IL Tax Fee - - (521) (8,790) (19,870) (40,732) - - (69,912) 40 Acct 488, Acct 495: Miscellaneous (74,299) (74,299) 41 Acct 495: Customer Penalities & Gas True-up - - 42 Acct 495: VBA and Decoupling related (95,150) (95,150) 43 Total Other Operating Income: - - (521) (8,790) (115,020) (40,732) (74,299) - (239,361) 4445 Actual Return (Net Operating Income) - - 14,295 241,105 545,033 1,117,286 - - 1,917,720 4647 Return Income Deficiency - - (3,263) (55,038) (124,418) (255,049) - - (437,769) 4849 Additional Income Taxes on Deficiency: - - 1,955 32,968 74,526 152,774 - - 262,223 5051 REVENUE REQUIREMENTS: - - 90,019 401,409 1,137,522 2,979,901 2,779,433 - 7,388,285 5253545556 RATE BASE:57 Utility Plant in Service - - 217,862 1,510,188 7,575,750 25,904,202 - - 35,208,002 58 Accumulated Depreciation - S/L - - (111,612) (711,351) (4,535,822) (14,062,612) - - (19,421,397) 59 Construction Work in Progress - - 3,999 47,767 179,974 198,354 - - 430,094 60 Net Plant in Service - - 110,249 846,604 3,219,903 12,039,944 - - 16,216,699 6162 Gas Stored Underground: - - - 1,581,705 - - - - 1,581,705 63 Fuel Stock - - - - - - - - - 64 Working Capital Allowance - - 23,799 184,825 2,740,998 - - - 2,949,623 65 Materials & Supplies: - - - - 12,756 49,372 - - 62,128 66 Other - Deferred Taxes (M&S / CWIP) - - - - - - - - - 67 Prepayments - - 1,885 1,882 38,809 - - - 42,576 68 Cash & Bank Balances - - 20,242 2,351 36,748 - - - 59,341 69 Property, Payroll & Income Taxes Accrued: - - (1,494) (8,548) (151,818) - - (161,860) 70 TOTAL RATE BASE - - 154,681 2,608,820 5,897,395 12,089,316 - - 20,750,212 71 % of Rate Base 0.0000% 0.0000% 0.7454% 12.5725% 28.4209% 58.2612% 0.0000% 0.0000% 100.0000%
COMMODITY DEMAND CUSTOMER
May not cross-check due to rounding.
Case No. U-17273 Witness: J.C. Hoffman Malueg
Exhibit A-16 (JCHM-2) Schedule F1.3 Page 11 of 21

Michigan Public Service CommissionMichigan Gas Utilities CorporationHistorical Cost of Service Allocation StudyHistorical Year Ending December 31, 2012Revenue Requirement and Rate Base by Individual Rate Schedule
(A) (B) (C) (D) (E) (F) (G) (H) (I) (J)
GAS SUPPLY DISTRIBUTION DISTRIBUTION ENHANCEDLINE PURCHASED ACQUISITION PRODUCTION STORAGE DEMAND CUSTOMER OTHERNO. RATE: CUST CHOICE - SMALL GS GAS COST COST DEMAND COST RELATED RELATED CUSTOMER SERVICES TOTAL
12 Operation & Maintenance Expense:3 Production:4 Purchased Gas Cost - - 5 Gas Supply Acquisition Cost - - 6 Production Demand 35,793 35,793 7 Storage Cost 53,935 53,935 8 Total - Production - - 35,793 53,935 - - - - 89,728 910 Transmission: 28,638 2,800 31,438 11 Distribution: 177,702 393,579 571,281 12 Customer Accounts and Services: - 13 Allocable 510,089 510,089 14 Transport Allocable - - 15 Customer Sales: - - 16 Administrative & General: - - 27,560 27,085 177,260 - 510,382 - 742,287 17 Total Operation & Maintenance Expense: - - 63,352 81,020 383,600 396,379 1,020,471 - 1,944,823 1819 Depreciation & Amort Expense: - - 5,402 36,746 205,628 233,985 - - 481,762 2021 Taxes Other Than Income Taxes:22 Unemployment Comp - FED & STATE 265 79 256 2,218 1,210 - 4,028 23 Retirement Benefits - FED 3,171 942 3,067 26,539 14,477 - 48,196 24 IBS Payroll Tax 1,757 522 1,700 14,709 8,024 - 26,712 25 Michigan SBT & Real Estate/Property - - 2,733 48,569 104,301 86,085 - - 241,688 26 Misc - Unauthorized Ins. Tax & Franchise - - 12 212 456 377 - - 1,057 27 Total Taxes Other Than Income Taxes: - - 7,938 50,325 109,781 129,928 23,710 - 321,683 2829 Other Income Before Income Taxes: - - - - - - - - - 3031 Income Taxes - - 2,616 46,489 99,833 82,397 - - 231,335 32 ITC - - - - - - - - - 3334 Other Income After Income Taxes: - - - - - - - - - 3536 TOTAL EXPENSES: - - 79,309 214,580 798,843 842,689 1,044,181 - 2,979,603 3738 Other Operating Income (Revenue Credits):39 Acct 487, Acct 493, Acct 495: IL Tax Fee - - (718) (12,765) (27,412) (22,625) - - (63,520) 40 Acct 488, Acct 495: Miscellaneous (8,576) (8,576) 41 Acct 495: Customer Penalities & Gas True-up - - 42 Acct 495: VBA and Decoupling related 102,119 102,119 43 Total Other Operating Income: - - (718) (12,765) 74,707 (22,625) (8,576) - 30,023 4445 Actual Return (Net Operating Income) - - 43,890 779,967 1,674,956 1,382,420 - - 3,881,233 4647 Return Income Deficiency - - (32,088) (570,236) (1,224,566) (1,010,692) - - (2,837,583) 4849 Additional Income Taxes on Deficiency: - - 2,091 37,161 79,802 65,864 - - 184,918 5051 REVENUE REQUIREMENTS: - - 92,483 448,706 1,403,742 1,257,657 1,035,606 - 4,238,194 5253545556 RATE BASE:57 Utility Plant in Service - - 229,524 1,702,249 7,981,266 10,814,913 - - 20,727,952 58 Accumulated Depreciation - S/L - - (117,586) (801,819) (4,778,616) (5,687,609) - - (11,385,630) 59 Construction Work in Progress - - 4,213 53,842 189,608 74,407 - - 322,070 60 Net Plant in Service - - 116,150 954,273 3,392,258 5,201,711 - - 9,664,391 6162 Gas Stored Underground: - - - 1,782,862 - - - - 1,782,862 63 Fuel Stock - - - - - - - - - 64 Working Capital Allowance - - 27,584 208,331 2,988,679 - - - 3,224,594 65 Materials & Supplies: - - - - 13,439 10,242 - - 23,681 66 Other - Deferred Taxes (M&S / CWIP) - - - - - - - - - 67 Prepayments - - 1,986 2,122 40,894 - - - 45,001 68 Cash & Bank Balances - - 21,326 2,650 39,081 - - - 63,057 69 Property, Payroll & Income Taxes Accrued: - - (1,574) (9,635) (159,491) - - (170,700) 70 TOTAL RATE BASE - - 165,472 2,940,602 6,314,860 5,211,953 - - 14,632,887 71 % of Rate Base 0.0000% 0.0000% 1.1308% 20.0958% 43.1553% 35.6181% 0.0000% 0.0000% 100.0000%
COMMODITY DEMAND CUSTOMER
May not cross-check due to rounding.
Case No. U-17273 Witness: J.C. Hoffman Malueg
Exhibit A-16 (JCHM-2) Schedule F1.3 Page 12 of 21

Michigan Public Service CommissionMichigan Gas Utilities CorporationHistorical Cost of Service Allocation StudyHistorical Year Ending December 31, 2012Revenue Requirement and Rate Base by Individual Rate Schedule
(A) (B) (C) (D) (E) (F) (G) (H) (I) (J)
GAS SUPPLY DISTRIBUTION DISTRIBUTION ENHANCEDLINE PURCHASED ACQUISITION PRODUCTION STORAGE DEMAND CUSTOMER OTHERNO. RATE: CUST CHOICE - LARGE GS GAS COST COST DEMAND COST RELATED RELATED CUSTOMER SERVICES TOTAL
12 Operation & Maintenance Expense:3 Production:4 Purchased Gas Cost - - 5 Gas Supply Acquisition Cost - - 6 Production Demand - - 7 Storage Cost - - 8 Total - Production - - - - - - - - - 910 Transmission: - - - 11 Distribution: - - - 12 Customer Accounts and Services: - 13 Allocable - - 14 Transport Allocable - - 15 Customer Sales: - - 16 Administrative & General: - - - - - - - - - 17 Total Operation & Maintenance Expense: - - - - - - - - - 1819 Depreciation & Amort Expense: - - - - - - - - - 2021 Taxes Other Than Income Taxes:22 Unemployment Comp - FED & STATE - - - - - - - 23 Retirement Benefits - FED - - - - - - - 24 IBS Payroll Tax - - - - - - - 25 Michigan SBT & Real Estate/Property - - - - - - - - - 26 Misc - Unauthorized Ins. Tax & Franchise - - - - - - - - - 27 Total Taxes Other Than Income Taxes: - - - - - - - - - 2829 Other Income Before Income Taxes: - - - - - - - - - 3031 Income Taxes - - - - - - - - - 32 ITC - - - - - - - - - 3334 Other Income After Income Taxes: - - - - - - - - - 3536 TOTAL EXPENSES: - - - - - - - - - 3738 Other Operating Income (Revenue Credits):39 Acct 487, Acct 493, Acct 495: IL Tax Fee - - - - - - - - - 40 Acct 488, Acct 495: Miscellaneous - - 41 Acct 495: Customer Penalities & Gas True-up - - 42 Acct 495: VBA and Decoupling related - - 43 Total Other Operating Income: - - - - - - - - - 4445 Actual Return (Net Operating Income) - - - - - - - - - 4647 Return Income Deficiency - - - - - - - - - 4849 Additional Income Taxes on Deficiency: - - - - - - - - - 5051 REVENUE REQUIREMENTS: - - - - - - - - - 5253545556 RATE BASE:57 Utility Plant in Service - - - - - - - - - 58 Accumulated Depreciation - S/L - - - - - - - - - 59 Construction Work in Progress - - - - - - - - - 60 Net Plant in Service - - - - - - - - - 6162 Gas Stored Underground: - - - - - - - - - 63 Fuel Stock - - - - - - - - - 64 Working Capital Allowance - - - - - - - - - 65 Materials & Supplies: - - - - - - - - - 66 Other - Deferred Taxes (M&S / CWIP) - - - - - - - - - 67 Prepayments - - - - - - - - - 68 Cash & Bank Balances - - - - - - - - - 69 Property, Payroll & Income Taxes Accrued: - - - - - - - - 70 TOTAL RATE BASE - - - - - - - - - 71 % of Rate Base 0.0000% 0.0000% 0.0000% 0.0000% 0.0000% 0.0000% 0.0000% 0.0000% 0.0000%
COMMODITY DEMAND CUSTOMER
May not cross-check due to rounding.
Case No. U-17273 Witness: J.C. Hoffman Malueg
Exhibit A-16 (JCHM-2) Schedule F1.3 Page 13 of 21

Michigan Public Service CommissionMichigan Gas Utilities CorporationHistorical Cost of Service Allocation StudyHistorical Year Ending December 31, 2012Revenue Requirement and Rate Base by Individual Rate Schedule
(A) (B) (C) (D) (E) (F) (G) (H) (I) (J)
GAS SUPPLY DISTRIBUTION DISTRIBUTION ENHANCEDLINE PURCHASED ACQUISITION PRODUCTION STORAGE DEMAND CUSTOMER OTHERNO. RATE: CUST CHOICE - MULTI FAM 1 GAS COST COST DEMAND COST RELATED RELATED CUSTOMER SERVICES TOTAL
12 Operation & Maintenance Expense:3 Production:4 Purchased Gas Cost - - 5 Gas Supply Acquisition Cost - - 6 Production Demand 26 26 7 Storage Cost 40 40 8 Total - Production - - 26 40 - - - - 66 910 Transmission: 21 2 22 11 Distribution: 127 357 484 12 Customer Accounts and Services: - 13 Allocable 716 716 14 Transport Allocable - - 15 Customer Sales: - - 16 Administrative & General: - - 20 20 127 - 717 - 884 17 Total Operation & Maintenance Expense: - - 45 60 275 359 1,433 - 2,172 1819 Depreciation & Amort Expense: - - 4 27 147 348 - - 527 2021 Taxes Other Than Income Taxes:22 Unemployment Comp - FED & STATE 0 0 0 2 1 - 4 23 Retirement Benefits - FED 3 1 3 24 13 - 44 24 IBS Payroll Tax 2 0 2 13 7 - 24 25 Michigan SBT & Real Estate/Property - - 2 36 80 93 - - 211 26 Misc - Unauthorized Ins. Tax & Franchise - - 0 0 0 0 - - 1 27 Total Taxes Other Than Income Taxes: - - 7 38 85 132 21 - 283 2829 Other Income Before Income Taxes: - - - - - - - - - 3031 Income Taxes - - 2 34 77 89 - - 202 32 ITC - - - - - - - - - 3334 Other Income After Income Taxes: - - - - - - - - - 3536 TOTAL EXPENSES: - - 58 159 584 928 1,455 - 3,184 3738 Other Operating Income (Revenue Credits):39 Acct 487, Acct 493, Acct 495: IL Tax Fee - - (0) (7) (16) (18) - - (42) 40 Acct 488, Acct 495: Miscellaneous 0 0 41 Acct 495: Customer Penalities & Gas True-up - - 42 Acct 495: VBA and Decoupling related 15 15 43 Total Other Operating Income: - - (0) (7) (1) (18) 0 - (27) 4445 Actual Return (Net Operating Income) - - 12 231 514 594 - - 1,351 4647 Return Income Deficiency - - (4) (75) (168) (194) - - (441) 4849 Additional Income Taxes on Deficiency: - - 1 28 61 71 - - 161 5051 REVENUE REQUIREMENTS: - - 67 335 990 1,381 1,455 - 4,228 5253545556 RATE BASE:57 Utility Plant in Service - - 164 1,262 5,716 12,223 - - 19,367 58 Accumulated Depreciation - S/L - - (84) (595) (3,423) (6,741) - - (10,842) 59 Construction Work in Progress - - 3 40 136 102 - - 281 60 Net Plant in Service - - 83 708 2,430 5,585 - - 8,806 6162 Gas Stored Underground: - - - 1,322 - - - - 1,322 63 Fuel Stock - - - - - - - - - 64 Working Capital Allowance - - 18 154 2,467 - - - 2,640 65 Materials & Supplies: - - - - 10 24 - - 34 66 Other - Deferred Taxes (M&S / CWIP) - - - - - - - - - 67 Prepayments - - 1 2 29 - - - 32 68 Cash & Bank Balances - - 15 2 28 - - - 45 69 Property, Payroll & Income Taxes Accrued: - - (1) (7) (115) - - (123) 70 TOTAL RATE BASE - - 116 2,181 4,849 5,609 - - 12,755 71 % of Rate Base 0.0000% 0.0000% 0.9109% 17.0957% 38.0176% 43.9758% 0.0000% 0.0000% 100.0000%
COMMODITY DEMAND CUSTOMER
May not cross-check due to rounding.
Case No. U-17273 Witness: J.C. Hoffman Malueg
Exhibit A-16 (JCHM-2) Schedule F1.3 Page 14 of 21

Michigan Public Service CommissionMichigan Gas Utilities CorporationHistorical Cost of Service Allocation StudyHistorical Year Ending December 31, 2012Revenue Requirement and Rate Base by Individual Rate Schedule
(A) (B) (C) (D) (E) (F) (G) (H) (I) (J)
GAS SUPPLY DISTRIBUTION DISTRIBUTION ENHANCEDLINE PURCHASED ACQUISITION PRODUCTION STORAGE DEMAND CUSTOMER OTHERNO. RATE: CUST CHOICE - MULTI FAM 2 GAS COST COST DEMAND COST RELATED RELATED CUSTOMER SERVICES TOTAL
12 Operation & Maintenance Expense:3 Production:4 Purchased Gas Cost - - 5 Gas Supply Acquisition Cost - - 6 Production Demand 66 66 7 Storage Cost 106 106 8 Total - Production - - 66 106 - - - - 172 910 Transmission: 53 5 58 11 Distribution: 327 502 829 12 Customer Accounts and Services: - 13 Allocable 1,144 1,144 14 Transport Allocable - - 15 Customer Sales: - - 16 Administrative & General: - - 51 53 326 - 1,145 - 1,575 17 Total Operation & Maintenance Expense: - - 117 160 706 508 2,290 - 3,779 1819 Depreciation & Amort Expense: - - 10 72 378 423 - - 884 2021 Taxes Other Than Income Taxes:22 Unemployment Comp - FED & STATE 1 0 0 4 2 - 8 23 Retirement Benefits - FED 6 2 6 51 28 - 93 24 IBS Payroll Tax 3 1 3 28 15 - 51 25 Michigan SBT & Real Estate/Property - - 5 96 204 129 - - 434 26 Misc - Unauthorized Ins. Tax & Franchise - - 0 0 1 1 - - 2 27 Total Taxes Other Than Income Taxes: - - 15 99 214 213 46 - 587 2829 Other Income Before Income Taxes: - - - - - - - - - 3031 Income Taxes - - 5 92 195 124 - - 415 32 ITC - - - - - - - - - 3334 Other Income After Income Taxes: - - - - - - - - - 3536 TOTAL EXPENSES: - - 146 423 1,494 1,267 2,335 - 5,665 3738 Other Operating Income (Revenue Credits):39 Acct 487, Acct 493, Acct 495: IL Tax Fee - - (2) (29) (61) (39) - - (130) 40 Acct 488, Acct 495: Miscellaneous 104 104 41 Acct 495: Customer Penalities & Gas True-up - - 42 Acct 495: VBA and Decoupling related 224 224 43 Total Other Operating Income: - - (2) (29) 163 (39) 104 - 198 4445 Actual Return (Net Operating Income) - - 96 1,822 3,880 2,458 - - 8,256 4647 Return Income Deficiency - - (74) (1,408) (2,999) (1,900) - - (6,382) 4849 Additional Income Taxes on Deficiency: - - 4 73 156 99 - - 332 5051 REVENUE REQUIREMENTS: - - 170 881 2,694 1,885 2,439 - 8,069 5253545556 RATE BASE:57 Utility Plant in Service - - 422 3,355 14,688 17,036 - - 35,501 58 Accumulated Depreciation - S/L - - (216) (1,580) (8,794) (9,389) - - (19,980) 59 Construction Work in Progress - - 8 106 349 150 - - 613 60 Net Plant in Service - - 214 1,881 6,243 7,797 - - 16,134 6162 Gas Stored Underground: - - - 3,514 - - - - 3,514 63 Fuel Stock - - - - - - - - - 64 Working Capital Allowance - - 51 411 6,223 - - - 6,685 65 Materials & Supplies: - - - - 25 25 - - 50 66 Other - Deferred Taxes (M&S / CWIP) - - - - - - - - - 67 Prepayments - - 4 4 75 - - - 83 68 Cash & Bank Balances - - 39 5 72 - - - 116 69 Property, Payroll & Income Taxes Accrued: - - (3) (19) (293) - - (315) 70 TOTAL RATE BASE - - 305 5,796 12,345 7,822 - - 26,267 71 % of Rate Base 0.0000% 0.0000% 1.1602% 22.0659% 46.9968% 29.7771% 0.0000% 0.0000% 100.0000%
COMMODITY DEMAND CUSTOMER
May not cross-check due to rounding.
Case No. U-17273 Witness: J.C. Hoffman Malueg
Exhibit A-16 (JCHM-2) Schedule F1.3 Page 15 of 21

Michigan Public Service CommissionMichigan Gas Utilities CorporationHistorical Cost of Service Allocation StudyHistorical Year Ending December 31, 2012Revenue Requirement and Rate Base by Individual Rate Schedule
(A) (B) (C) (D) (E) (F) (G) (H) (I) (J)
GAS SUPPLY DISTRIBUTION DISTRIBUTION ENHANCEDLINE PURCHASED ACQUISITION PRODUCTION STORAGE DEMAND CUSTOMER OTHERNO. RATE: CUST CHOICE - MULTI FAM 3 GAS COST COST DEMAND COST RELATED RELATED CUSTOMER SERVICES TOTAL
12 Operation & Maintenance Expense:3 Production:4 Purchased Gas Cost - - 5 Gas Supply Acquisition Cost - - 6 Production Demand 31 31 7 Storage Cost 82 82 8 Total - Production - - 31 82 - - - - 114 910 Transmission: 25 2 28 11 Distribution: 156 144 300 12 Customer Accounts and Services: - 13 Allocable 215 215 14 Transport Allocable - - 15 Customer Sales: - - 16 Administrative & General: - - 24 41 155 - 215 - 436 17 Total Operation & Maintenance Expense: - - 55 124 336 147 430 - 1,091 1819 Depreciation & Amort Expense: - - 5 56 180 80 - - 321 2021 Taxes Other Than Income Taxes:22 Unemployment Comp - FED & STATE 0 0 0 2 1 - 3 23 Retirement Benefits - FED 3 1 3 22 12 - 39 24 IBS Payroll Tax 1 0 1 12 7 - 22 25 Michigan SBT & Real Estate/Property - - 2 74 151 35 - - 262 26 Misc - Unauthorized Ins. Tax & Franchise - - 0 0 1 0 - - 1 27 Total Taxes Other Than Income Taxes: - - 7 76 155 70 19 - 327 2829 Other Income Before Income Taxes: - - - - - - - - - 3031 Income Taxes - - 2 71 144 33 - - 250 32 ITC - - - - - - - - - 3334 Other Income After Income Taxes: - - - - - - - - - 3536 TOTAL EXPENSES: - - 69 326 816 330 449 - 1,990 3738 Other Operating Income (Revenue Credits):39 Acct 487, Acct 493, Acct 495: IL Tax Fee - - (0) (11) (22) (5) - - (38) 40 Acct 488, Acct 495: Miscellaneous (3) (3) 41 Acct 495: Customer Penalities & Gas True-up - - 42 Acct 495: VBA and Decoupling related (880) (880) 43 Total Other Operating Income: - - (0) (11) (902) (5) (3) - (922) 4445 Actual Return (Net Operating Income) - - 28 862 1,753 403 - - 3,046 4647 Return Income Deficiency - - (18) (542) (1,103) (254) - - (1,917) 4849 Additional Income Taxes on Deficiency: - - 2 57 115 26 - - 200 5051 REVENUE REQUIREMENTS: - - 81 692 679 501 446 - 2,398 5253545556 RATE BASE:57 Utility Plant in Service - - 201 2,595 6,990 4,499 - - 14,285 58 Accumulated Depreciation - S/L - - (103) (1,222) (4,185) (2,444) - - (7,955) 59 Construction Work in Progress - - 4 82 166 39 - - 291 60 Net Plant in Service - - 102 1,455 2,971 2,094 - - 6,621 6162 Gas Stored Underground: - - - 2,718 - - - - 2,718 63 Fuel Stock - - - - - - - - - 64 Working Capital Allowance - - 24 318 6,203 - - - 6,545 65 Materials & Supplies: - - - - 12 2 - - 14 66 Other - Deferred Taxes (M&S / CWIP) - - - - - - - - - 67 Prepayments - - 2 3 36 - - - 41 68 Cash & Bank Balances - - 19 4 34 - - - 57 69 Property, Payroll & Income Taxes Accrued: - - (1) (15) (140) - - (155) 70 TOTAL RATE BASE - - 146 4,483 9,116 2,096 - - 15,841 71 % of Rate Base 0.0000% 0.0000% 0.9200% 28.2997% 57.5498% 13.2305% 0.0000% 0.0000% 100.0000%
COMMODITY DEMAND CUSTOMER
May not cross-check due to rounding.
Case No. U-17273 Witness: J.C. Hoffman Malueg
Exhibit A-16 (JCHM-2) Schedule F1.3 Page 16 of 21

Michigan Public Service CommissionMichigan Gas Utilities CorporationHistorical Cost of Service Allocation StudyHistorical Year Ending December 31, 2012Revenue Requirement and Rate Base by Individual Rate Schedule
(A) (B) (C) (D) (E) (F) (G) (H) (I) (J)
GAS SUPPLY DISTRIBUTION DISTRIBUTION ENHANCEDLINE PURCHASED ACQUISITION PRODUCTION STORAGE DEMAND CUSTOMER OTHERNO. RATE: CUST CHOICE - MULTI FAM 4 GAS COST COST DEMAND COST RELATED RELATED CUSTOMER SERVICES TOTAL
12 Operation & Maintenance Expense:3 Production:4 Purchased Gas Cost - - 5 Gas Supply Acquisition Cost - - 6 Production Demand 119 119 7 Storage Cost 280 280 8 Total - Production - - 119 280 - - - - 398 910 Transmission: 95 9 104 11 Distribution: 589 70 659 12 Customer Accounts and Services: - 13 Allocable 681 681 14 Transport Allocable - - 15 Customer Sales: - - 16 Administrative & General: - - 91 140 588 - 681 - 1,501 17 Total Operation & Maintenance Expense: - - 210 420 1,272 79 1,363 - 3,344 1819 Depreciation & Amort Expense: - - 18 190 682 102 - - 992 2021 Taxes Other Than Income Taxes:22 Unemployment Comp - FED & STATE 1 0 1 7 4 - 12 23 Retirement Benefits - FED 10 3 9 80 43 - 145 24 IBS Payroll Tax 5 2 5 44 24 - 80 25 Michigan SBT & Real Estate/Property - - 9 252 516 46 - - 823 26 Misc - Unauthorized Ins. Tax & Franchise - - 0 1 2 0 - - 4 27 Total Taxes Other Than Income Taxes: - - 25 258 534 177 71 - 1,064 2829 Other Income Before Income Taxes: - - - - - - - - - 3031 Income Taxes - - 9 241 494 44 - - 788 32 ITC - - - - - - - - - 3334 Other Income After Income Taxes: - - - - - - - - - 3536 TOTAL EXPENSES: - - 261 1,109 2,982 402 1,434 - 6,188 3738 Other Operating Income (Revenue Credits):39 Acct 487, Acct 493, Acct 495: IL Tax Fee - - (2) (44) (90) (8) - - (144) 40 Acct 488, Acct 495: Miscellaneous 339 339 41 Acct 495: Customer Penalities & Gas True-up - - 42 Acct 495: VBA and Decoupling related (3,532) (3,532) 43 Total Other Operating Income: - - (2) (44) (3,622) (8) 339 - (3,336) 4445 Actual Return (Net Operating Income) - - 140 3,873 7,944 707 - - 12,663 4647 Return Income Deficiency - - (100) (2,786) (5,714) (509) - - (9,108) 4849 Additional Income Taxes on Deficiency: - - 7 193 395 35 - - 630 5051 REVENUE REQUIREMENTS: - - 306 2,345 1,986 627 1,773 - 7,037 5253545556 RATE BASE:57 Utility Plant in Service - - 761 8,824 26,471 7,175 - - 43,232 58 Accumulated Depreciation - S/L - - (390) (4,157) (15,849) (4,509) - - (24,905) 59 Construction Work in Progress - - 14 279 629 116 - - 1,038 60 Net Plant in Service - - 385 4,947 11,251 2,782 - - 19,365 6162 Gas Stored Underground: - - - 9,242 - - - - 9,242 63 Fuel Stock - - - - - - - - - 64 Working Capital Allowance - - 91 1,080 20,235 - - - 21,406 65 Materials & Supplies: - - - - 45 2 - - 47 66 Other - Deferred Taxes (M&S / CWIP) - - - - - - - - - 67 Prepayments - - 7 11 136 - - - 154 68 Cash & Bank Balances - - 71 14 130 - - - 214 69 Property, Payroll & Income Taxes Accrued: - - (5) (50) (529) - - (584) 70 TOTAL RATE BASE - - 549 15,244 31,267 2,784 - - 49,844 71 % of Rate Base 0.0000% 0.0000% 1.1019% 30.5828% 62.7299% 5.5854% 0.0000% 0.0000% 100.0000%
COMMODITY DEMAND CUSTOMER
May not cross-check due to rounding.
Case No. U-17273 Witness: J.C. Hoffman Malueg
Exhibit A-16 (JCHM-2) Schedule F1.3 Page 17 of 21

Michigan Public Service CommissionMichigan Gas Utilities CorporationHistorical Cost of Service Allocation StudyHistorical Year Ending December 31, 2012Revenue Requirement and Rate Base by Individual Rate Schedule
(A) (B) (C) (D) (E) (F) (G) (H) (I) (J)
GAS SUPPLY DISTRIBUTION DISTRIBUTION ENHANCEDLINE PURCHASED ACQUISITION PRODUCTION STORAGE DEMAND CUSTOMER OTHERNO. RATE: AGG TRNSPT - RESID. GAS COST COST DEMAND COST RELATED RELATED CUSTOMER SERVICES TOTAL
12 Operation & Maintenance Expense:3 Production:4 Purchased Gas Cost - - 5 Gas Supply Acquisition Cost - - 6 Production Demand 107 107 7 Storage Cost 158 158 8 Total - Production - - 107 158 - - - - 265 910 Transmission: 86 8 93 11 Distribution: 532 1,215 1,747 12 Customer Accounts and Services: - 13 Allocable 2,205 2,205 14 Transport Allocable 14,136 14,136 15 Customer Sales: - - 16 Administrative & General: - - 83 79 531 - 2,206 10,039 12,938 17 Total Operation & Maintenance Expense: - - 190 238 1,148 1,223 4,411 24,176 31,385 1819 Depreciation & Amort Expense: - - 16 108 616 1,116 - - 1,855 2021 Taxes Other Than Income Taxes:22 Unemployment Comp - FED & STATE 1 0 1 8 4 - 14 23 Retirement Benefits - FED 11 3 11 92 50 - 168 24 IBS Payroll Tax 6 2 6 51 28 - 93 25 Michigan SBT & Real Estate/Property - - 8 143 320 311 - - 781 26 Misc - Unauthorized Ins. Tax & Franchise - - 0 1 1 1 - - 3 27 Total Taxes Other Than Income Taxes: - - 26 149 339 463 82 - 1,059 2829 Other Income Before Income Taxes: - - - - - - - - - 3031 Income Taxes - - 8 136 306 297 - - 748 32 ITC - - - - - - - - - 3334 Other Income After Income Taxes: - - - - - - - - - 3536 TOTAL EXPENSES: - - 240 631 2,408 3,099 4,494 24,176 35,047 3738 Other Operating Income (Revenue Credits):39 Acct 487, Acct 493, Acct 495: IL Tax Fee - - (1) (24) (54) (52) - - (132) 40 Acct 488, Acct 495: Miscellaneous (49) (49) 41 Acct 495: Customer Penalities & Gas True-up - - 42 Acct 495: VBA and Decoupling related (274) (274) 43 Total Other Operating Income: - - (1) (24) (328) (52) (49) - (455) 4445 Actual Return (Net Operating Income) - - (210) (3,718) (8,338) (8,106) - - (20,373) 4647 Return Income Deficiency - - 245 4,334 9,718 9,448 - - 23,745 4849 Additional Income Taxes on Deficiency: - - 6 109 245 238 - - 598 5051 REVENUE REQUIREMENTS: - - 279 1,331 3,705 4,627 4,445 24,176 38,562 5253545556 RATE BASE:57 Utility Plant in Service - - 687 4,996 23,893 40,856 - - 70,431 58 Accumulated Depreciation - S/L - - (352) (2,353) (14,305) (22,455) - - (39,465) 59 Construction Work in Progress - - 13 158 568 340 - - 1,078 60 Net Plant in Service - - 348 2,800 10,155 18,741 - - 32,044 6162 Gas Stored Underground: - - - 5,232 - - - - 5,232 63 Fuel Stock - - - - - - - - - 64 Working Capital Allowance - - 75 611 9,398 - - - 10,085 65 Materials & Supplies: - - - - 40 73 - - 113 66 Other - Deferred Taxes (M&S / CWIP) - - - - - - - - - 67 Prepayments - - 6 6 122 - - - 135 68 Cash & Bank Balances - - 64 8 116 - - - 188 69 Property, Payroll & Income Taxes Accrued: - - (5) (28) (479) - - (512) 70 TOTAL RATE BASE - - 488 8,630 19,353 18,814 - - 47,284 71 % of Rate Base 0.0000% 0.0000% 1.0314% 18.2504% 40.9284% 39.7897% 0.0000% 0.0000% 100.0000%
COMMODITY DEMAND CUSTOMER
May not cross-check due to rounding.
Case No. U-17273 Witness: J.C. Hoffman Malueg
Exhibit A-16 (JCHM-2) Schedule F1.3 Page 18 of 21

Michigan Public Service CommissionMichigan Gas Utilities CorporationHistorical Cost of Service Allocation StudyHistorical Year Ending December 31, 2012Revenue Requirement and Rate Base by Individual Rate Schedule
(A) (B) (C) (D) (E) (F) (G) (H) (I) (J)
GAS SUPPLY DISTRIBUTION DISTRIBUTION ENHANCEDLINE PURCHASED ACQUISITION PRODUCTION STORAGE DEMAND CUSTOMER OTHERNO. RATE: AGG TRNSPT - SMALL GS GAS COST COST DEMAND COST RELATED RELATED CUSTOMER SERVICES TOTAL
12 Operation & Maintenance Expense:3 Production:4 Purchased Gas Cost - - 5 Gas Supply Acquisition Cost - - 6 Production Demand 13,578 13,578 7 Storage Cost 19,398 19,398 8 Total - Production - - 13,578 19,398 - - - - 32,976 910 Transmission: 10,864 1,062 11,926 11 Distribution: 67,411 32,067 99,478 12 Customer Accounts and Services: - 13 Allocable 82,333 82,333 14 Transport Allocable 195,673 195,673 15 Customer Sales: - - 16 Administrative & General: - - 10,455 9,741 67,244 - 82,380 138,967 308,787 17 Total Operation & Maintenance Expense: - - 24,033 29,139 145,519 33,129 164,712 334,640 731,172 1819 Depreciation & Amort Expense: - - 2,049 13,216 78,005 26,134 - - 119,404 2021 Taxes Other Than Income Taxes:22 Unemployment Comp - FED & STATE 92 27 89 767 418 - 1,393 23 Retirement Benefits - FED 1,096 326 1,061 9,178 5,006 - 16,667 24 IBS Payroll Tax 608 181 588 5,087 2,775 - 9,237 25 Michigan SBT & Real Estate/Property - - 1,037 17,468 37,768 10,094 - - 66,366 26 Misc - Unauthorized Ins. Tax & Franchise - - 5 76 165 44 - - 290 27 Total Taxes Other Than Income Taxes: - - 2,837 18,078 39,671 25,169 8,199 - 93,954 2829 Other Income Before Income Taxes: - - - - - - - - - 3031 Income Taxes - - 992 16,720 36,150 9,661 - - 63,523 32 ITC - - - - - - - - - 3334 Other Income After Income Taxes: - - - - - - - - - 3536 TOTAL EXPENSES: - - 29,912 77,152 299,345 94,093 172,912 334,640 1,008,054 3738 Other Operating Income (Revenue Credits):39 Acct 487, Acct 493, Acct 495: IL Tax Fee - - (211) (3,561) (7,700) (2,058) - - (13,530) 40 Acct 488, Acct 495: Miscellaneous 3,297 3,297 41 Acct 495: Customer Penalities & Gas True-up - - 42 Acct 495: VBA and Decoupling related 18,450 18,450 43 Total Other Operating Income: - - (211) (3,561) 10,750 (2,058) 3,297 - 8,217 4445 Actual Return (Net Operating Income) - - 6,992 117,800 254,700 68,069 - - 447,561 4647 Return Income Deficiency - - (2,515) (42,370) (91,611) (24,483) - - (160,980) 4849 Additional Income Taxes on Deficiency: - - 793 13,365 28,897 7,723 - - 50,778 5051 REVENUE REQUIREMENTS: - - 34,970 162,385 502,081 143,344 176,209 334,640 1,353,630 5253545556 RATE BASE:57 Utility Plant in Service - - 87,070 612,214 3,027,693 1,407,330 - - 5,134,306 58 Accumulated Depreciation - S/L - - (44,606) (288,374) (1,812,768) (813,487) - - (2,959,235) 59 Construction Work in Progress - - 1,598 19,364 71,928 16,260 - - 109,150 60 Net Plant in Service - - 44,062 343,204 1,286,853 610,103 - - 2,284,222 6162 Gas Stored Underground: - - - 641,206 - - - - 641,206 63 Fuel Stock - - - - - - - - - 64 Working Capital Allowance - - 10,464 74,926 1,024,869 - - - 1,110,259 65 Materials & Supplies: - - - - 5,098 1,008 - - 6,106 66 Other - Deferred Taxes (M&S / CWIP) - - - - - - - - - 67 Prepayments - - 753 763 15,513 - - - 17,029 68 Cash & Bank Balances - - 8,090 953 14,825 - - - 23,869 69 Property, Payroll & Income Taxes Accrued: - - (597) (3,465) (60,503) - - (64,565) 70 TOTAL RATE BASE - - 62,772 1,057,587 2,286,655 611,111 - - 4,018,125 71 % of Rate Base 0.0000% 0.0000% 1.5622% 26.3204% 56.9085% 15.2089% 0.0000% 0.0000% 100.0000%
COMMODITY DEMAND CUSTOMER
May not cross-check due to rounding.
Case No. U-17273 Witness: J.C. Hoffman Malueg
Exhibit A-16 (JCHM-2) Schedule F1.3 Page 19 of 21

Michigan Public Service CommissionMichigan Gas Utilities CorporationHistorical Cost of Service Allocation StudyHistorical Year Ending December 31, 2012Revenue Requirement and Rate Base by Individual Rate Schedule
(A) (B) (C) (D) (E) (F) (G) (H) (I) (J)
GAS SUPPLY DISTRIBUTION DISTRIBUTION ENHANCEDLINE PURCHASED ACQUISITION PRODUCTION STORAGE DEMAND CUSTOMER OTHERNO. RATE: AGG TRNSPT - LARGE GS GAS COST COST DEMAND COST RELATED RELATED CUSTOMER SERVICES TOTAL
12 Operation & Maintenance Expense:3 Production:4 Purchased Gas Cost - - 5 Gas Supply Acquisition Cost - - 6 Production Demand 274 274 7 Storage Cost 730 730 8 Total - Production - - 274 730 - - - - 1,004 910 Transmission: 219 32 251 11 Distribution: 1,460 210 1,669 12 Customer Accounts and Services: - 13 Allocable 1,791 1,791 14 Transport Allocable 1,184 1,184 15 Customer Sales: - - 16 Administrative & General: - - 211 366 1,456 - 1,792 841 4,666 17 Total Operation & Maintenance Expense: - - 485 1,096 3,135 242 3,582 2,024 10,565 1819 Depreciation & Amort Expense: - - 41 497 1,627 330 - - 2,496 2021 Taxes Other Than Income Taxes:22 Unemployment Comp - FED & STATE 2 1 2 16 8 - 28 23 Retirement Benefits - FED 22 7 21 186 101 - 337 24 IBS Payroll Tax 12 4 12 103 56 - 187 25 Michigan SBT & Real Estate/Property - - 23 657 1,172 152 - - 2,004 26 Misc - Unauthorized Ins. Tax & Franchise - - 0 3 5 1 - - 9 27 Total Taxes Other Than Income Taxes: - - 59 671 1,212 457 166 - 2,565 2829 Other Income Before Income Taxes: - - - - - - - - - 3031 Income Taxes - - 22 629 1,122 145 - - 1,918 32 ITC - - - - - - - - - 3334 Other Income After Income Taxes: - - - - - - - - - 3536 TOTAL EXPENSES: - - 608 2,893 7,096 1,174 3,748 2,024 17,543 3738 Other Operating Income (Revenue Credits):39 Acct 487, Acct 493, Acct 495: IL Tax Fee - - (4) (123) (219) (28) - - (374) 40 Acct 488, Acct 495: Miscellaneous 271 271 41 Acct 495: Customer Penalities & Gas True-up - - 42 Acct 495: VBA and Decoupling related - - 43 Total Other Operating Income: - - (4) (123) (219) (28) 271 - (104) 4445 Actual Return (Net Operating Income) - - 260 7,551 13,467 1,746 - - 23,025 4647 Return Income Deficiency - - (162) (4,714) (8,407) (1,090) - - (14,373) 4849 Additional Income Taxes on Deficiency: - - 17 503 897 116 - - 1,533 5051 REVENUE REQUIREMENTS: - - 719 6,110 12,834 1,918 4,019 2,024 27,623 5253545556 RATE BASE:57 Utility Plant in Service - - 1,759 23,027 62,965 23,924 - - 111,675 58 Accumulated Depreciation - S/L - - (901) (10,847) (37,590) (15,124) - - (64,462) 59 Construction Work in Progress - - 32 728 1,456 395 - - 2,612 60 Net Plant in Service - - 890 12,909 26,831 9,195 - - 49,825 6162 Gas Stored Underground: - - - 24,118 - - - - 24,118 63 Fuel Stock - - - - - - - - - 64 Working Capital Allowance - - 315 2,818 44,592 - - - 47,725 65 Materials & Supplies: - - - - 103 6 - - 109 66 Other - Deferred Taxes (M&S / CWIP) - - - - - - - - - 67 Prepayments - - 15 29 314 - - - 357 68 Cash & Bank Balances - - 163 36 315 - - - 513 69 Property, Payroll & Income Taxes Accrued: - - (12) (130) (1,204) - - (1,346) 70 TOTAL RATE BASE - - 1,371 39,779 70,950 9,201 - - 121,302 71 % of Rate Base 0.0000% 0.0000% 1.1303% 32.7938% 58.4907% 7.5853% 0.0000% 0.0000% 100.0000%
COMMODITY DEMAND CUSTOMER
May not cross-check due to rounding.
Case No. U-17273 Witness: J.C. Hoffman Malueg
Exhibit A-16 (JCHM-2) Schedule F1.3 Page 20 of 21

Michigan Public Service CommissionMichigan Gas Utilities CorporationHistorical Cost of Service Allocation StudyHistorical Year Ending December 31, 2012Revenue Requirement and Rate Base by Individual Rate Schedule
(A) (B) (C) (D) (E) (F) (G) (H) (I) (J)
GAS SUPPLY DISTRIBUTION DISTRIBUTION ENHANCEDLINE PURCHASED ACQUISITION PRODUCTION STORAGE DEMAND CUSTOMER OTHERNO. RATE: SPECIAL CONTRACT GAS COST COST DEMAND COST RELATED RELATED CUSTOMER SERVICES TOTAL
12 Operation & Maintenance Expense:3 Production:4 Purchased Gas Cost 1,340 1,340 5 Gas Supply Acquisition Cost 15 15 6 Production Demand 3 3 7 Storage Cost 18 18 8 Total - Production 1,340 15 3 18 - - - - 1,376 910 Transmission: 2 0 2 11 Distribution: 14 75 90 12 Customer Accounts and Services: - 13 Allocable 4,981 4,981 14 Transport Allocable - - 15 Customer Sales: - - 16 Administrative & General: - 12 2 9 14 - 4,983 - 5,021 17 Total Operation & Maintenance Expense: 1,340 27 5 27 31 76 9,964 - 11,469 1819 Depreciation & Amort Expense: - - 0 12 16 45 - - 73 2021 Taxes Other Than Income Taxes:22 Unemployment Comp - FED & STATE 0 0 0 0 0 0 - 0 23 Retirement Benefits - FED 0 0 0 0 3 1 - 5 24 IBS Payroll Tax 0 0 0 0 1 1 - 3 25 Michigan SBT & Real Estate/Property - - 0 16 30 16 - - 62 26 Misc - Unauthorized Ins. Tax & Franchise - - 0 0 0 0 - - 0 27 Total Taxes Other Than Income Taxes: - 0 0 16 30 20 2 - 70 2829 Other Income Before Income Taxes: - - - - - - - - - 3031 Income Taxes - - 0 16 29 15 - - 59 32 ITC - - - - - - - - - 3334 Other Income After Income Taxes: - - - - - - - - - 3536 TOTAL EXPENSES: 1,340 27 6 71 105 156 9,966 - 11,672 3738 Other Operating Income (Revenue Credits):39 Acct 487, Acct 493, Acct 495: IL Tax Fee - - (4) (288) (529) (281) - - (1,102) 40 Acct 488, Acct 495: Miscellaneous (3) (3) 41 Acct 495: Customer Penalities & Gas True-up (124) (124) 42 Acct 495: VBA and Decoupling related - - 43 Total Other Operating Income: (124) - (4) (288) (529) (281) (3) - (1,229) 4445 Actual Return (Net Operating Income) - - 405 29,108 53,586 28,454 - - 111,554 4647 Return Income Deficiency - - (404) (29,038) (53,457) (28,386) - - (111,286) 4849 Additional Income Taxes on Deficiency: - - 0 12 23 12 - - 48 5051 REVENUE REQUIREMENTS: 1,217 27 3 (134) (272) (45) 9,963 - 10,759 5253545556 RATE BASE:57 Utility Plant in Service - - 17 569 614 1,962 - - 3,161 58 Accumulated Depreciation - S/L - - (9) (268) (366) (1,016) - - (1,659) 59 Construction Work in Progress - - 0 18 14 12 - - 45 60 Net Plant in Service - - 9 319 261 958 - - 1,546 6162 Gas Stored Underground: - - - 595 - - - - 595 63 Fuel Stock - - - - - - - - - 64 Working Capital Allowance - - 3 70 1,550 - - - 1,623 65 Materials & Supplies: - - - - 1 2 - - 3 66 Other - Deferred Taxes (M&S / CWIP) - - - - - - - - - 67 Prepayments - - - 1 3 - - - 4 68 Cash & Bank Balances - - 2 1 3 - - - 6 69 Property, Payroll & Income Taxes Accrued: - - - (3) (12) - - (15) 70 TOTAL RATE BASE - - 14 982 1,807 960 - - 3,762 71 % of Rate Base 0.0000% 0.0000% 0.3635% 26.0935% 48.0361% 25.5069% 0.0000% 0.0000% 100.0000%
COMMODITY DEMAND CUSTOMER
May not cross-check due to rounding.
Case No. U-17273 Witness: J.C. Hoffman Malueg
Exhibit A-16 (JCHM-2) Schedule F1.3 Page 21 of 21

Mic
higa
n P
ublic
Ser
vice
Com
mis
sion
Mic
higa
n G
as U
tiliti
es C
orpo
ratio
nH
isto
rical
Cos
t of S
ervi
ce A
lloca
tion
Stu
dyH
isto
rical
Yea
r End
ing
Dec
embe
r 31,
201
2
CO
NS
UM
PTI
ON
CO
STS
BY
BIL
LIN
G U
NIT
(A)
(B)
(C)
(D)
(E)
(F)
(G)
(H)
TOTA
LG
AS
ENH
AN
CED
MO
NTH
LYLO
CA
LSU
PPLY
TOTA
LLI
NE
FIXE
DA
DM
IN.
FIXE
DVO
LUM
ETR
ICST
OR
AG
EA
CQ
UIS
ITIO
NM
CF
NO
.R
ATE
SC
HE
DU
LEC
HA
RG
EC
HA
RG
EC
HA
RG
ER
ATE
RA
TER
ATE
RA
TE
1R
esid
entia
l$2
0.02
-
$20.
02$0
.629
4$0
.210
6$0
.108
$0.9
482
2M
ulti-
Fam
ily -
Cla
ss I
$20.
02-
$2
0.02
$0.6
294
$0.2
106
$0.1
08$0
.948
23
Cus
t Cho
ice
- Res
iden
tial
$20.
02-
$2
0.02
$0.6
294
$0.2
106
-
$0.8
399
4C
ust C
hoic
e - M
ulti-
Fam
ily -
Cla
ss I
$20.
02-
$2
0.02
$0.6
294
$0.2
106
-
$0.8
399
5A
gg T
rans
p - R
esid
entia
l$2
0.02
$57.
84$7
7.85
$0.6
294
$0.2
106
-
$0.8
399
6M
ulti-
Fam
ily -
Cla
ss II
$36.
20-
$3
6.20
$0.6
487
$0.2
000
$0.1
07$0
.956
07
Mul
ti-Fa
mily
- C
lass
III
$36.
20-
$3
6.20
$0.6
487
$0.2
000
$0.1
07$0
.956
08
Mul
ti-Fa
mily
- C
lass
IV$3
6.20
-
$36.
20$0
.648
7$0
.200
0$0
.107
$0.9
560
9S
mal
l Gen
eral
Ser
vice
$36.
20-
$3
6.20
$0.6
487
$0.2
000
$0.1
07$0
.956
010
Cus
t Cho
ice
- Sm
all G
S$3
6.20
-
$36.
20$0
.648
7$0
.200
0-
$0
.848
711
Cus
t Cho
ice
- Mul
ti-Fa
mily
- C
lass
II$3
6.20
-
$36.
20$0
.648
7$0
.200
0-
$0
.848
712
Cus
t Cho
ice
- Mul
ti-Fa
mily
- C
lass
III
$36.
20-
$3
6.20
$0.6
487
$0.2
000
-
$0.8
487
13C
ust C
hoic
e - M
ulti-
Fam
ily -
Cla
ss IV
$36.
20-
$3
6.20
$0.6
487
$0.2
000
-
$0.8
487
14A
gg T
rans
p - S
mal
l GS
$36.
20$5
7.84
$94.
04$0
.648
7$0
.200
0-
$0
.848
715
Larg
e G
ener
al S
ervi
ce$1
54.1
2-
$1
54.1
2$0
.623
4$0
.309
0$0
.107
$1.0
391
16C
ust C
hoic
e - L
arge
GS
$154
.12
-
$154
.12
$0.6
234
$0.3
090
-
$0.9
324
17A
gg T
rans
p - L
arge
GS
$154
.12
$57.
84$2
11.9
5$0
.623
4$0
.309
0-
$0
.932
418
Tran
spor
t - T
R-1
$263
.40
$57.
84$3
21.2
4$0
.456
9$0
.081
0-
$0
.537
919
Tran
spor
t - T
R-2
$987
.16
$57.
84$1
,045
.00
$0.4
175
$0.0
633
-
$0.4
808
20Tr
ansp
ort -
TR
-3$4
,481
.98
$57.
84$4
,539
.82
$0.3
589
$0.0
616
-
$0.4
205
21S
peci
al C
ontra
ct$8
26.5
1-
$8
26.5
1$0
.000
0$0
.000
0$0
.000
$0.0
000
Case No. U-17273 Witness: J.C. Hoffman Malueg
Exhibit A-16 (JCHM-2) Schedule F1.4
Page 1 of 3

Mic
higa
n P
ublic
Ser
vice
Com
mis
sion
Mic
higa
n G
as U
tiliti
es C
orpo
ratio
nH
isto
rical
Cos
t of S
ervi
ce A
lloca
tion
Stu
dyH
isto
rical
Yea
r End
ing
Dec
embe
r 31,
201
2
CO
NS
UM
PTI
ON
CO
STS
BY
BIL
LIN
G U
NIT
(A)
(B)
(C)
(D)
(E)
(F)
(G)
(H)
(I)
GA
SG
AS
LOC
AL
SU
PP
LYSU
PPLY
LIN
EM
CF
DE
MA
ND
VOLU
MET
RIC
STO
RA
GE
STO
RA
GE
MC
FA
CQ
UIS
ITIO
NA
CQ
UIS
ITIO
NN
O.
RA
TE S
CH
ED
ULE
THR
OU
GH
PU
TC
OS
TR
ATE
CO
ST
RA
TES
ALE
SC
OS
TR
ATE
1R
esid
entia
l:2
Res
iden
tial
9,40
9,72
9
5,
937,
913
$
1,99
6,67
2$
9,
409,
729
1,01
8,97
3$
3M
ulti-
Fam
ily -
Cla
ss I
15,0
67
10
,719
$
2,96
4$
15
,067
1,62
5$
4C
ust C
hoic
e - R
esid
entia
l1,
977,
827
1,22
7,54
2$
40
1,40
9$
-
-$
5C
ust C
hoic
e - M
ulti-
Fam
ily -
Cla
ss I
1,49
2
1,
057
$
33
5$
-
-$
6A
gg T
rans
p - R
esid
entia
l6,
238
3,98
5$
1,33
1$
-
-
$
7
11,4
10,3
52
7,18
1,21
5$
$0
.629
42,
402,
711
$
$0.2
106
9,42
4,79
51,
020,
598
$
$0
.108
8 9S
mal
l Ser
vice
10M
ulti-
Fam
ily -
Cla
ss II
86,0
89
56
,655
$
16,7
12$
86
,089
9,23
2$
11M
ulti-
Fam
ily -
Cla
ss II
I20
,506
4,20
7$
4,36
2$
20
,506
2,19
6$
12M
ulti-
Fam
ily -
Cla
ss IV
36,8
19
7,
184
$
7,
466
$
36,8
193,
942
$
13
Sm
all G
ener
al S
ervi
ce2,
222,
148
1,48
7,23
5$
46
4,86
8$
2,22
2,14
823
8,52
8$
14
Cus
t Cho
ice
- Sm
all G
S2,
292,
367
1,49
6,22
5$
44
8,70
6$
-
-$
15C
ust C
hoic
e - M
ulti-
Fam
ily -
Cla
ss II
4,21
9
2,
864
$
88
1$
-
-$
16C
ust C
hoic
e - M
ulti-
Fam
ily -
Cla
ss II
I2,
008
760
$
692
$
-
-
$
17
Cus
t Cho
ice
- Mul
ti-Fa
mily
- C
lass
IV7,
603
2,29
2$
2,34
5$
-
-
$
18
Agg
Tra
nsp
- Sm
all G
S86
9,60
9
537,
052
$
16
2,38
5$
-
-$
195,
541,
368
3,59
4,47
2$
$0
.648
71,
108,
416
$
$0.2
000
2,36
5,56
125
3,89
8$
$0
.107
20 21La
rge
Ser
vice
22La
rge
Gen
eral
Ser
vice
296,
246
18
7,44
9$
93,5
18$
29
6,24
6
31
,597
$
23
Cus
t Cho
ice
- Lar
ge G
S-
-
$
-
$
-
-$
24A
gg T
rans
p - L
arge
GS
26,1
67
13
,552
$
6,11
0$
-
-
$
25
322,
413
20
1,00
1$
$0.6
234
99,6
28$
$0
.309
029
6,24
631
,597
$
$0
.107
26 27La
rge
Tran
spor
t Ser
vice
28Tr
ansp
ort -
TR
-11,
789,
329
817,
541
$
$0
.456
914
4,97
4$
$0.0
810
-
-$
29 30Tr
ansp
ort -
TR
-23,
874,
785
1,61
7,67
5$
$0
.417
524
5,18
9$
$0.0
633
-
-$
31 32Tr
ansp
ort -
TR
-33,
536,
429
1,26
9,37
7$
$0
.358
921
7,70
8$
$0.0
616
-
-$
33 34S
peci
al C
ontra
cts
35S
peci
al C
ontra
ct25
5
(269
)$
$0.0
000
(134
)$
$0.0
000
255
27$
$0.0
0036 37
GR
AN
D T
OTA
LS26
,474
,931
14
,681
,012
$
4,
218,
493
$
12,0
86,8
58
1,
306,
120
$
Case No. U-17273 Witness: J.C. Hoffman Malueg
Exhibit A-16 (JCHM-2) Schedule F1.4
Page 2 of 3

Mic
higa
n P
ublic
Ser
vice
Com
mis
sion
Mic
higa
n G
as U
tiliti
es C
orpo
ratio
nH
isto
rical
Cos
t of S
ervi
ce A
lloca
tion
Stu
dyH
isto
rical
Yea
r End
ing
Dec
embe
r 31,
201
2
CO
NS
UM
PTI
ON
CO
STS
BY
BIL
LIN
G U
NIT
(A)
(B)
(C)
(D)
(E)
(F)
(G)
TOTA
LE
NH
AN
CE
DEN
HA
NC
EDM
ON
THLY
LIN
EC
US
TOM
ER
CU
STO
ME
RFI
XED
AD
MIN
ISTR
ATI
VE
AD
MIN
.FI
XED
NO
.R
ATE
SC
HE
DU
LEC
OU
NT
CO
STS
CH
AR
GE
CO
STS
CH
AR
GE
CH
AR
GE
1R
esid
entia
l:2
Res
iden
tial
1,53
8,53
4
30
,706
,723
$
-
$
-$
$2
0.02
3M
ulti-
Fam
ily -
Cla
ss I
1,44
1
28
,575
$
-$
-
$
$20.
024
Cus
t Cho
ice
- Res
iden
tial
283,
361
5,
759,
335
$
-$
-
$
$20.
025
Cus
t Cho
ice
- Mul
ti-Fa
mily
- C
lass
I13
7
2,83
5$
-$
-
$
$20.
026
Agg
Tra
nsp
- Res
iden
tial
418
9,
071
$
24
,176
$
57.8
4$
$7
7.85
71,
823,
891
36,5
06,5
39$
$20.
028 9
Sm
all S
ervi
ce10
Mul
ti-Fa
mily
- C
lass
II2,
393
68,4
70$
-
$
-$
$3
6.20
11M
ulti-
Fam
ily -
Cla
ss II
I17
0
8,89
8$
-$
-
$
$36.
2012
Mul
ti-Fa
mily
- C
lass
IV13
3
7,88
9$
-$
-
$
$36.
2013
Sm
all G
ener
al S
ervi
ce95
,955
3,20
9,53
9$
-
$
-$
$3
6.20
14C
ust C
hoic
e - S
mal
l GS
58,7
82
2,
293,
263
$
-$
-
$
$36.
2015
Cus
t Cho
ice
- Mul
ti-Fa
mily
- C
lass
II14
6
4,32
4$
-$
-
$
$36.
2016
Cus
t Cho
ice
- Mul
ti-Fa
mily
- C
lass
III
12
94
7$
-
$
-$
$3
6.20
17C
ust C
hoic
e - M
ulti-
Fam
ily -
Cla
ss IV
12
2,
400
$
-
$
-$
$3
6.20
18A
gg T
rans
p - S
mal
l GS
5,78
6
31
9,55
2$
334,
640
$
57
.84
$
$94.
0419
163,
389
5,
915,
281
$
$36.
2020 21
Larg
e S
ervi
ce22
Larg
e G
ener
al S
ervi
ce33
7
51,3
95$
-
$
-$
$1
54.1
223
Cus
t Cho
ice
- Lar
ge G
S-
-
$
-
$
-$
$1
54.1
224
Agg
Tra
nsp
- Lar
ge G
S35
5,93
7$
2,02
4$
57
.84
$
$211
.95
2537
2
57,3
32$
$1
54.1
226 27
Larg
e Tr
ansp
ort S
ervi
ce28
Tran
spor
t - T
R-1
1,33
8
35
2,43
1$
$263
.40
77,3
85$
57
.84
$
$321
.24
29 30Tr
ansp
ort -
TR
-246
0
454,
093
$
$9
87.1
626
,605
$
57.8
4$
$1
,045
.00
31 32Tr
ansp
ort -
TR
-372
322,
703
$
$4
,481
.98
4,16
4$
57
.84
$
$4,5
39.8
233 34
Spe
cial
Con
tract
s35
Spe
cial
Con
tract
12
9,
918
$
$8
26.5
1-
$
-$
$8
26.5
136 37
1,98
9,53
4
43
,618
,298
$
46
8,99
4$
Case No. U-17273 Witness: J.C. Hoffman Malueg
Exhibit A-16 (JCHM-2) Schedule F1.4
Page 3 of 3

Mic
higa
n P
ublic
Ser
vice
Com
mis
sion
Mic
higa
n G
as U
tiliti
es C
orpo
ratio
nH
isto
rical
Cos
t of S
ervi
ce A
lloca
tion
Stu
dyH
isto
rical
Yea
r End
ing
Dec
embe
r 31,
201
2
Allo
catio
n Fa
ctor
s us
ed w
ithin
the
Gas
Cos
t of S
ervi
ce S
tudy
(A)
(B)
(C)
(D)
(E)
(F)
(G)
(H)
(I)(J
)(K
)(L
)(M
)
LIN
E
NO
.D
ES
CR
IPTI
ON
OF
ALL
OC
ATI
ON
DA
TAC
OR
PO
RA
TE T
OTA
LR
esid
entia
lM
ulti-
Fam
ily -
Cla
ss I
Mul
ti-Fa
mily
- C
lass
IIM
ulti-
Fam
ily -
Cla
ss
IIIM
ulti-
Fam
ily -
Cla
ss
IVS
mal
l Gen
eral
S
ervi
ceLa
rge
Gen
eral
S
ervi
ceTr
ansp
ort -
TR
-1Tr
ansp
ort -
TR
-2Tr
ansp
ort -
TR
-3S
OU
RC
E o
r ALL
OC
ATI
ON
FA
CTO
R1
GR
OU
P PE
AK
DEM
AN
D4,
386,
097
1,90
6,81
1
2,
567
14,3
79
4,16
8
6,
706
440,
541
12
3,40
9
232,
632
38
1,80
9
353,
279
2
Per
cent
age
1.00
000
0.
4347
4
0.00
059
0.
0032
8
0.00
095
0.
0015
3
0.10
044
0.
0281
4
0.05
304
0.
0870
5
0.08
055
G
roup
Dem
and
3 4R
esid
entia
l Cus
tom
ers
5
Gro
up P
eak
Per
cent
age
0.52
009
0.
4347
4
0.00
059
Li
ne 2
6
Ann
ual M
CF
Thro
ughp
ut11
,410
,352
9,
409,
729
15,0
67
Line
46
7
P
ropo
rtion
0.82
467
0.
0013
2
8
Res
iden
tial W
eigh
t for
Gro
up P
eak
Dem
and
0.52
009
0.
5200
9
Line
5, C
orpo
rate
Tot
al9
Wei
ghte
d P
ropo
rtion
0.52
009
0.
4289
0
0.00
069
10 11
Com
mer
cial
Sm
all C
usto
mer
s:12
G
roup
Pea
k P
erce
ntag
e0.
2295
8
0.00
328
0.
0009
5
0.00
153
0.
1004
4
Line
213
A
nnua
l MC
F Th
roug
hput
5,54
1,36
8
86
,089
20
,506
36
,819
2,
222,
148
Line
46
14
P
ropo
rtion
0.01
554
0.
0037
0
0.00
664
0.
4010
1
15
Com
. Sm
all W
eigh
t for
Coi
ncid
ent P
eak
Dem
and
0.22
958
0.
2295
8
0.22
958
0.
2295
8
Line
12,
Cor
pora
te T
otal
16
W
eigh
ted
Pro
porti
on0.
2295
8
0.00
357
0.
0008
5
0.00
153
0.
0920
7
17 18C
omm
erci
al M
ediu
m C
usto
mer
s:19
G
roup
Pea
k P
erce
ntag
e0.
0530
4
0.05
304
Li
ne 2
20
Ann
ual M
CF
Thro
ughp
ut1,
789,
329
1,78
9,32
9
Li
ne 4
621
Pro
porti
on1.
0000
0
22
Com
. Med
ium
Wei
ght f
or C
oinc
iden
t Pea
k D
eman
d0.
0530
4
Line
19,
Cor
pora
te T
otal
23
W
eigh
ted
Pro
porti
on0.
0530
4
0.05
304
24 25
Com
mer
cial
Lar
ge C
usto
mer
s:26
G
roup
Pea
k P
erce
ntag
e0.
1167
5
0.02
814
0.
0870
5
Line
227
A
nnua
l MC
F Th
roug
hput
4,19
7,45
4
29
6,24
6
3,87
4,78
5
Li
ne 4
628
Pro
porti
on0.
0705
8
0.92
313
29
C
om. L
arge
Wei
ght f
or C
oinc
iden
t Pea
k D
eman
d0.
1167
5
0.11
675
Li
ne 2
6, C
orpo
rate
Tot
al30
Wei
ghte
d P
ropo
rtion
0.11
675
0.
0082
4
0.10
777
31 32
Sup
er L
arge
Cus
tom
ers:
33
Gro
up P
eak
Per
cent
age
0.08
055
0.
0805
5
Line
234
A
nnua
l MC
F Th
roug
hput
3,53
6,42
9
3,
536,
429
Line
46
35
P
ropo
rtion
1.00
000
36
S
uper
Lar
ge W
eigh
t for
Coi
ncid
ent P
eak
Dem
and
0.08
055
Li
ne 3
3, C
orpo
rate
Tot
al37
Wei
ghte
d P
ropo
rtion
0.08
055
0.
0805
5
38 39To
tal W
eigh
ted
Pea
k D
eman
d A
lloca
tor
1.00
000
0.
4289
0
0.00
069
0.
0035
7
0.00
085
0.
0015
3
0.09
207
0.
0082
4
0.05
304
0.
1077
7
0.08
055
W
eigh
ted
Peak
Dem
and
40 41 42SA
LES
/ CO
MM
OD
ITY
12,0
86,8
58
9,40
9,72
9
15
,067
86
,089
20
,506
36
,819
2,
222,
148
296,
246
-
-
-
43
Per
cent
age
1.00
000
0.
7785
1
0.00
125
0.
0071
2
0.00
170
0.
0030
5
0.18
385
0.
0245
1
-
-
-
Sale
s44 45 46
MC
F TH
RO
UG
HPU
T26
,474
,931
9,
409,
729
15,0
67
86,0
89
20,5
06
36,8
19
2,22
2,14
8
29
6,24
6
1,78
9,32
9
3,
874,
785
3,53
6,42
9
47
Per
cent
age
1.00
000
0.
3554
2
0.00
057
0.
0032
5
0.00
077
0.
0013
9
0.08
393
0.
0111
9
0.06
759
0.
1463
6
0.13
358
M
CF
Thro
ughp
ut48 49 50
THR
OU
GH
PUT
- RES
IDEN
TIA
L11
,393
,793
9,
409,
729
-
-
-
-
-
-
-
-
-
51P
erce
ntag
e1.
0000
0
0.82
586
-
-
-
-
-
-
-
-
-
Th
ru-p
ut -
Res
iden
tial
52 53 54TH
RO
UG
HPU
T - S
MA
LL G
S &
MF
5,49
0,99
1
-
15
,067
86
,089
-
-
2,
222,
148
-
-
-
-
55P
erce
ntag
e1.
0000
0
-
0.00
274
0.
0156
8
-
-
0.40
469
-
-
-
-
Th
ru-p
ut -
Smal
l GS
& M
F56 57 58
THR
OU
GH
PUT
- LA
RG
E M
F66
,936
-
-
-
20,5
06
36,8
19
-
-
-
-
-
59P
erce
ntag
e1.
0000
0
-
-
-
0.30
635
0.
5500
7
-
-
-
-
-
Thru
-put
- La
rge
MF
60 61 62ST
OR
AG
E C
APA
CIT
Y7,
012,
166
3,56
2,42
8
5,
704
32,5
92
7,76
3
13
,939
84
1,28
3
112,
156
11
4,64
4
202,
749
15
4,86
5
63P
erce
ntag
e1.
0000
0
0.50
804
0.
0008
1
0.00
465
0.
0011
1
0.00
199
0.
1199
7
0.01
599
0.
0163
5
0.02
891
0.
0220
9
64 65G
roup
Pea
k - 5
0%0.
5000
0
0.21
737
0.
0002
9
0.00
164
0.
0004
8
0.00
076
0.
0502
2
0.01
407
0.
0265
2
0.04
352
0.
0402
7
66S
tora
ge C
apac
ity -
50%
0.50
000
0.
2540
20.
0004
10.
0023
20.
0005
50.
0009
90.
0599
90.
0080
00.
0081
70.
0144
60.
0110
467
S
tora
ge C
apac
ity A
lloca
tor -
50/
501.
0000
0
0.47
139
0.
0007
0
0.00
396
0.
0010
3
0.00
176
0.
1102
1
0.02
207
0.
0346
9
0.05
798
0.
0513
2
Stor
age
68 69 70C
UST
OM
ERS
- TO
TAL
AN
NU
AL
1,98
9,53
4
1,
538,
534
1,44
1
2,
393
170
13
3
95,9
55
337
1,
338
460
72
71P
erce
ntag
e1.
0000
0
0.77
331
0.
0007
2
0.00
120
0.
0000
9
0.00
007
0.
0482
3
0.00
017
0.
0006
7
0.00
023
0.
0000
4
Cus
tom
er
Case No. U-17273 Witness: J.C. Hoffman Malueg
Exhibit A-16 (JCHM-2) Schedule F1.5
Page 1 of 4

Mic
higa
n P
ublic
Ser
vice
Com
mis
sion
Mic
higa
n G
as U
tiliti
es C
orpo
ratio
nH
isto
rical
Cos
t of S
ervi
ce A
lloca
tion
Stu
dyH
isto
rical
Yea
r End
ing
Dec
embe
r 31,
201
2
Allo
catio
n Fa
ctor
s us
ed w
ithin
the
Gas
Cos
t of S
ervi
ce S
tudy
(A)
(B)
LIN
E
NO
.D
ES
CR
IPTI
ON
OF
ALL
OC
ATI
ON
DA
TAC
OR
PO
RA
TE T
OTA
L1
GR
OU
P PE
AK
DEM
AN
D4,
386,
097
2P
erce
ntag
e1.
0000
0
3 4R
esid
entia
l Cus
tom
ers
5
Gro
up P
eak
Per
cent
age
0.52
009
6
A
nnua
l MC
F Th
roug
hput
11,4
10,3
52
7
P
ropo
rtion
8
Res
iden
tial W
eigh
t for
Gro
up P
eak
Dem
and
9
W
eigh
ted
Pro
porti
on0.
5200
9
10 11C
omm
erci
al S
mal
l Cus
tom
ers:
12
Gro
up P
eak
Per
cent
age
0.22
958
13
A
nnua
l MC
F Th
roug
hput
5,54
1,36
8
14
Pro
porti
on15
C
om. S
mal
l Wei
ght f
or C
oinc
iden
t Pea
k D
eman
d16
Wei
ghte
d P
ropo
rtion
0.22
958
17 18
Com
mer
cial
Med
ium
Cus
tom
ers:
19
Gro
up P
eak
Per
cent
age
0.05
304
20
A
nnua
l MC
F Th
roug
hput
1,78
9,32
9
21
Pro
porti
on22
C
om. M
ediu
m W
eigh
t for
Coi
ncid
ent P
eak
Dem
and
23
W
eigh
ted
Pro
porti
on0.
0530
4
24 25C
omm
erci
al L
arge
Cus
tom
ers:
26
Gro
up P
eak
Per
cent
age
0.11
675
27
A
nnua
l MC
F Th
roug
hput
4,19
7,45
4
28
Pro
porti
on29
C
om. L
arge
Wei
ght f
or C
oinc
iden
t Pea
k D
eman
d30
Wei
ghte
d P
ropo
rtion
0.11
675
31 32
Sup
er L
arge
Cus
tom
ers:
33
Gro
up P
eak
Per
cent
age
0.08
055
34
A
nnua
l MC
F Th
roug
hput
3,53
6,42
9
35
Pro
porti
on36
S
uper
Lar
ge W
eigh
t for
Coi
ncid
ent P
eak
Dem
and
37
W
eigh
ted
Pro
porti
on0.
0805
5
38 39To
tal W
eigh
ted
Pea
k D
eman
d A
lloca
tor
1.00
000
40 41 42
SALE
S / C
OM
MO
DIT
Y12
,086
,858
43
Per
cent
age
1.00
000
44 45 46
MC
F TH
RO
UG
HPU
T26
,474
,931
47
Per
cent
age
1.00
000
48 49 50
THR
OU
GH
PUT
- RES
IDEN
TIA
L11
,393
,793
51
Per
cent
age
1.00
000
52 53 54
THR
OU
GH
PUT
- SM
ALL
GS
& M
F5,
490,
991
55P
erce
ntag
e1.
0000
0
56 57 58TH
RO
UG
HPU
T - L
AR
GE
MF
66,9
36
59
Per
cent
age
1.00
000
60 61 62
STO
RA
GE
CA
PAC
ITY
7,01
2,16
6
63
Per
cent
age
1.00
000
64 65
Gro
up P
eak
- 50%
0.50
000
66
Sto
rage
Cap
acity
- 50
%0.
5000
0
67
Sto
rage
Cap
acity
Allo
cato
r - 5
0/50
1.00
000
68 69 70
CU
STO
MER
S - T
OTA
L A
NN
UA
L1,
989,
534
71P
erce
ntag
e1.
0000
0
(C)
(D)
(E)
(F)
(G)
(H)
(I)(J
)(K
)(L
)(M
)(N
)
Cus
tom
er C
hoic
e -
Res
iden
tial
Cus
tom
er C
hoic
e -
Sm
all G
SC
usto
mer
Cho
ice
- La
rge
GS
Cus
tom
er C
hoic
e -
Mul
ti-Fa
mily
IC
usto
mer
Cho
ice
- M
ulti-
Fam
ily II
Cus
tom
er C
hoic
e -
Mul
ti-Fa
mily
III
Cus
tom
er C
hoic
e -
Mul
ti-Fa
mily
IVA
gg T
rans
port
- R
esid
entia
lA
gg T
rans
port
- S
mal
l GS
Agg
Tra
nspo
rt -
Larg
e G
SS
peci
al C
ontra
ctS
OU
RC
E o
r ALL
OC
ATI
ON
FA
CTO
R37
0,12
3
402,
274
-
34
7
864
96
5
3,09
9
1,
296
133,
984
6,
588
255
0.
0843
9
0.09
172
-
0.
0000
8
0.00
020
0.
0002
2
0.00
071
0.
0003
0
0.03
055
0.
0015
0
0.00
006
G
roup
Dem
and
0.08
439
0.
0000
8
0.00
030
Li
ne 2
1,97
7,82
7
1,
492
6,23
8
Li
ne 4
60.
1733
4
0.00
013
0.
0005
5
0.52
009
0.
5200
9
0.52
009
Li
ne 5
, Cor
pora
te T
otal
0.09
015
0.
0000
7
0.00
028
0.09
172
0.
0002
0
0.00
022
0.
0007
1
0.03
055
Li
ne 2
2,29
2,36
7
4,
219
2,00
8
7,
603
869,
609
Li
ne 4
60.
4136
8
0.00
076
0.
0003
6
0.00
137
0.
1569
3
0.22
958
0.
2295
8
0.22
958
0.
2295
8
0.22
958
Li
ne 1
2, C
orpo
rate
Tot
al0.
0949
8
0.00
017
0.
0000
8
0.00
032
0.
0360
3
Line
2Li
ne 4
6
Line
19,
Cor
pora
te T
otal
-
0.00
150
0.
0000
6
Line
2-
26
,167
25
5
Line
46
-
0.00
623
0.
0000
6
0.11
675
0.
1167
5
0.11
675
Li
ne 2
6, C
orpo
rate
Tot
al-
0.
0007
3
0.00
001
Line
2Li
ne 4
6
Line
33,
Cor
pora
te T
otal
0.09
015
0.
0949
8
-
0.00
007
0.
0001
7
0.00
008
0.
0003
2
0.00
028
0.
0360
3
0.00
073
0.
0000
1
Wei
ghte
d Pe
ak D
eman
d
-
-
-
-
-
-
-
-
-
-
255
-
-
-
-
-
-
-
-
-
-
0.
0000
2
Sale
s
1,97
7,82
7
2,
292,
367
-
1,49
2
4,
219
2,00
8
7,
603
6,23
8
86
9,60
9
26,1
67
255
0.
0747
1
0.08
659
-
0.
0000
6
0.00
016
0.
0000
8
0.00
029
0.
0002
4
0.03
285
0.
0009
9
0.00
001
M
CF
Thro
ughp
ut
1,97
7,82
7
-
-
-
-
-
-
6,
238
-
-
-
0.17
359
-
-
-
-
-
-
0.
0005
5
-
-
-
Thru
-put
- R
esid
entia
l
-
2,29
2,36
7
-
1,
492
4,21
9
-
-
-
86
9,60
9
-
-
-
0.41
748
-
0.
0002
7
0.00
077
-
-
-
0.
1583
7
-
-
Thru
-put
- Sm
all G
S &
MF
-
-
-
-
-
2,00
8
7,
603
-
-
-
-
-
-
-
-
-
0.03
000
0.
1135
9
-
-
-
-
Thru
-put
- La
rge
MF
748,
785
86
7,86
7
-
565
1,
597
760
2,
878
2,36
2
32
9,22
5
9,90
7
97
0.10
678
0.
1237
7
-
0.00
008
0.
0002
3
0.00
011
0.
0004
1
0.00
034
0.
0469
5
0.00
141
0.
0000
1
0.04
219
0.
0458
6
-
0.00
004
0.
0001
0
0.00
011
0.
0003
5
0.00
015
0.
0152
7
0.00
075
0.
0000
3
0.05
339
0.06
188
-
0.00
004
0.00
011
0.00
005
0.
0002
1
0.00
017
0.02
348
0.00
071
0.00
001
0.09
558
0.
1077
4
-
0.00
008
0.
0002
1
0.00
016
0.
0005
6
0.00
032
0.
0387
5
0.00
146
0.
0000
4
Stor
age
283,
361
58
,782
-
13
7
146
12
12
41
8
5,78
6
35
12
0.
1424
3
0.02
955
-
0.
0000
7
0.00
007
0.
0000
1
0.00
001
0.
0002
1
0.00
291
0.
0000
2
0.00
001
C
usto
mer
Case No. U-17273 Witness: J.C. Hoffman Malueg
Exhibit A-16 (JCHM-2) Schedule F1.5
Page 2 of 4

Mic
higa
n P
ublic
Ser
vice
Com
mis
sion
Mic
higa
n G
as U
tiliti
es C
orpo
ratio
nH
isto
rical
Cos
t of S
ervi
ce A
lloca
tion
Stu
dyH
isto
rical
Yea
r End
ing
Dec
embe
r 31,
201
2
Allo
catio
n Fa
ctor
s us
ed w
ithin
the
Gas
Cos
t of S
ervi
ce S
tudy
(A)
(B)
(C)
(D)
(E)
(F)
(G)
(H)
(I)(J
)(K
)(L
)(M
)
LIN
E
NO
.D
ES
CR
IPTI
ON
OF
ALL
OC
ATI
ON
DA
TAC
OR
PO
RA
TE T
OTA
LR
esid
entia
lM
ulti-
Fam
ily -
Cla
ss I
Mul
ti-Fa
mily
- C
lass
IIM
ulti-
Fam
ily -
Cla
ss
IIIM
ulti-
Fam
ily -
Cla
ss
IVS
mal
l Gen
eral
S
ervi
ceLa
rge
Gen
eral
S
ervi
ceTr
ansp
ort -
TR
-1Tr
ansp
ort -
TR
-2Tr
ansp
ort -
TR
-3S
OU
RC
E o
r ALL
OC
ATI
ON
FA
CTO
R
1SE
RVI
CES
2C
usto
mer
s - A
vera
ge16
5,79
5
128,
211
12
0
199
14
11
7,
996
28
11
2
38
6
Pag
e 1,
line
70
divi
ded
by 1
23
Wei
ghtin
g Fa
ctor
- A
ve. C
ost p
er F
oot f
or S
ervi
ces
1.00
1.00
0.94
0.94
0.94
0.94
0.94
1.27
1.27
1.27
4W
eigh
ted
Cou
nt fo
r Ser
vice
s - A
cct 3
8016
5,06
6
128,
211
12
0
188
13
10
7,
545
26
14
2
49
8
5P
erce
ntag
e1.
0000
0
0.77
673
0.
0007
3
0.00
114
0.
0000
8
0.00
006
0.
0457
1
0.00
016
0.
0008
6
0.00
030
0.
0000
5
Serv
ices
6 7 8M
ETER
S9
Cus
tom
ers
- Ave
rage
165,
795
12
8,21
1
120
19
9
14
11
7,99
6
28
112
38
6
P
age
1, li
ne 7
0 di
vide
d by
12
10 W
eigh
ting
Fact
or -
Cos
t Per
Met
er25
7.65
$
16
7.51
$
76
1.85
$
2,
657.
54$
1,
388.
40$
1,
670.
45$
1,
706.
58$
2,
256.
88$
2,
241.
74$
1,
754.
43$
11
Est
imat
ed C
ost o
f Met
ers
- Acc
t 381
60,1
17,2
05$
33,0
33,3
59$
20,1
16$
151,
926
$
37
,648
$
15
,388
$
13
,357
,336
$
47
,926
$
25
1,64
3$
85,9
34$
10,5
27$
12P
erce
ntag
e1.
0000
0
0.54
948
0.
0003
3
0.00
253
0.
0006
3
0.00
026
0.
2221
9
0.00
080
0.
0041
9
0.00
143
0.
0001
8
Met
ers
13 14 15TR
AN
SPO
RT
CU
STO
MER
S - T
OTA
L A
NN
UA
L8,
109
-
-
-
-
-
-
-
1,33
8
46
0
72
P
age
1, li
ne 7
016
Per
cent
age
1.00
000
-
-
-
-
-
-
-
0.
1650
0
0.05
673
0.
0088
8
Tran
spor
t Cus
t17 18 19
AC
CO
UN
T 38
5 D
EMA
ND
20W
eigh
ted
Dem
and
Allo
catio
n P
erce
ntag
e fo
r Acc
t 385
21
Indu
stria
l Siz
e C
usto
mer
s:0.
2503
3
-
-
-
-
-
-
0.00
824
0.
0530
4
0.10
777
0.
0805
5
Pag
e 1,
Lin
e 39
22
Per
cent
age
1.00
000
-
-
-
-
-
-
0.
0329
2
0.21
187
0.
4305
2
0.32
176
A
cct 3
85 D
eman
d23 24 25
SALA
RIE
S &
WA
GES
- FU
NC
TIO
NA
L:26
P
rodu
ctio
n63
2,41
3
6.57
87%
9.40
31%
27
Dis
tribu
tion
5,75
7,01
3
59
.887
3%85
.598
7%28
Tr
ansm
issi
on14
8,26
4
1.54
23%
2.20
45%
29
Sto
rage
187,
898
1.
9546
%2.
7938
%30
C
usto
mer
Acc
ount
ing
2,41
2,29
1
25
.093
9%-
31
C
usto
mer
Ser
vice
475,
195
4.
9432
%-
32
C
usto
mer
Sal
es-
0.00
00%
-
33TO
TAL
SA
LAR
IES
& W
AG
ES
9,61
3,07
4
10
0.00
0%10
0.00
0%34 35 36
SALA
RIE
S &
WA
GES
- R
ATE
SC
HED
ULE
:37
P
rodu
ctio
n63
2,41
3
271,
240
43
4
2,25
6
53
7
965
58
,224
5,
211
33,5
42
68,1
56
50,9
38
Wei
ghte
d P
eak
Dem
and
38
Dis
tribu
tion
5,75
7,01
3
2,
469,
164
3,95
4
20
,534
4,
891
8,78
2
53
0,02
4
47,4
36
305,
343
62
0,44
4
463,
700
W
eigh
ted
Pea
k D
eman
d39
Tr
ansm
issi
on14
8,26
4
63,5
90
102
52
9
126
22
6
13,6
50
1,22
2
7,
864
15,9
79
11,9
42
Wei
ghte
d P
eak
Dem
and
40
Sto
rage
187,
898
88
,573
13
1
745
19
3
330
20
,708
4,
146
6,51
9
10
,895
9,
642
Sto
rage
41
Cus
tom
er A
ccou
ntin
g2,
412,
291
1,86
5,45
8
1,
747
2,90
1
20
6
161
11
6,34
5
409
1,
622
558
87
Cus
tom
er42
C
usto
mer
Ser
vice
475,
195
36
7,47
5
344
57
2
41
32
22,9
19
80
32
0
110
17
Cus
tom
er43
C
usto
mer
Sal
es-
-
-
-
-
-
-
-
-
-
-
Cus
tom
er44
TOTA
L S
ALA
RIE
S &
WA
GE
S9,
613,
074
5,12
5,49
9
6,
712
27,5
36
5,99
4
10
,496
76
1,86
9
58,5
04
355,
210
71
6,14
1
536,
326
45
P
erce
ntag
e1.
0000
0
0.53
318
0.
0007
0
0.00
286
0.
0006
2
0.00
109
0.
0792
5
0.00
609
0.
0369
5
0.07
450
0.
0557
9
Sala
ries
& W
ages
Case No. U-17273 Witness: J.C. Hoffman Malueg
Exhibit A-16 (JCHM-2) Schedule F1.5
Page 3 of 4

Mic
higa
n P
ublic
Ser
vice
Com
mis
sion
Mic
higa
n G
as U
tiliti
es C
orpo
ratio
nH
isto
rical
Cos
t of S
ervi
ce A
lloca
tion
Stu
dyH
isto
rical
Yea
r End
ing
Dec
embe
r 31,
201
2
Allo
catio
n Fa
ctor
s us
ed w
ithin
the
Gas
Cos
t of S
ervi
ce S
tudy
(A)
(B)
LIN
E
NO
.D
ES
CR
IPTI
ON
OF
ALL
OC
ATI
ON
DA
TAC
OR
PO
RA
TE T
OTA
L
1SE
RVI
CES
2C
usto
mer
s - A
vera
ge16
5,79
5
3 W
eigh
ting
Fact
or -
Ave
. Cos
t per
Foo
t for
Ser
vice
s4
Wei
ghte
d C
ount
for S
ervi
ces
- Acc
t 380
165,
066
5
Per
cent
age
1.00
000
6 7 8
MET
ERS
9C
usto
mer
s - A
vera
ge16
5,79
5
10 W
eigh
ting
Fact
or -
Cos
t Per
Met
er11
Est
imat
ed C
ost o
f Met
ers
- Acc
t 381
60,1
17,2
05$
12P
erce
ntag
e1.
0000
0
13 14 15TR
AN
SPO
RT
CU
STO
MER
S - T
OTA
L A
NN
UA
L8,
109
16P
erce
ntag
e1.
0000
0
17 18 19A
CC
OU
NT
385
DEM
AN
D20
Wei
ghte
d D
eman
d A
lloca
tion
Per
cent
age
for A
cct 3
8521
In
dust
rial S
ize
Cus
tom
ers:
0.25
033
22
P
erce
ntag
e1.
0000
0
23 24 25SA
LAR
IES
& W
AG
ES -
FUN
CTI
ON
AL:
26
Pro
duct
ion
632,
413
27
D
istri
butio
n5,
757,
013
28
Tran
smis
sion
148,
264
29
S
tora
ge18
7,89
8
30
Cus
tom
er A
ccou
ntin
g2,
412,
291
31
Cus
tom
er S
ervi
ce47
5,19
5
32
Cus
tom
er S
ales
-
33
TOTA
L S
ALA
RIE
S &
WA
GE
S9,
613,
074
34 35 36SA
LAR
IES
& W
AG
ES -
RA
TE S
CH
EDU
LE:
37
Pro
duct
ion
632,
413
38
D
istri
butio
n5,
757,
013
39
Tran
smis
sion
148,
264
40
S
tora
ge18
7,89
8
41
Cus
tom
er A
ccou
ntin
g2,
412,
291
42
Cus
tom
er S
ervi
ce47
5,19
5
43
Cus
tom
er S
ales
-
44
TOTA
L S
ALA
RIE
S &
WA
GE
S9,
613,
074
45
Per
cent
age
1.00
000
(C)
(D)
(E)
(F)
(G)
(H)
(I)(J
)(K
)(L
)(M
)(N
)
Cus
tom
er C
hoic
e -
Res
iden
tial
Cus
tom
er C
hoic
e -
Sm
all G
SC
usto
mer
Cho
ice
- La
rge
GS
Cus
tom
er C
hoic
e -
Mul
ti-Fa
mily
IC
usto
mer
Cho
ice
- M
ulti-
Fam
ily II
Cus
tom
er C
hoic
e -
Mul
ti-Fa
mily
III
Cus
tom
er C
hoic
e -
Mul
ti-Fa
mily
IVA
gg T
rans
port
- R
esid
entia
lA
gg T
rans
port
- S
mal
l GS
Agg
Tra
nspo
rt -
Larg
e G
SS
peci
al C
ontra
ctS
OU
RC
E o
r ALL
OC
ATI
ON
FA
CTO
R
23,6
13
4,89
9
-
11
12
1
1
35
482
3
1
P
age
2, li
ne 7
0 di
vide
d by
12
1.00
0.94
0.94
1.00
0.94
0.94
0.94
1.00
0.94
0.94
0.94
23,6
13
4,62
2
-
11
11
1
1
35
455
3
1
0.
1430
5
0.02
800
-
0.
0000
7
0.00
007
0.
0000
1
0.00
001
0.
0002
1
0.00
276
0.
0000
2
0.00
001
Se
rvic
es
23,6
13
4,89
9
-
11
12
1
1
35
482
3
1
P
age
2, li
ne 7
0 di
vide
d by
12
197.
09$
1,60
3.84
$
-$
98.0
9$
42
2.25
$
3,
536.
50$
1,
285.
00$
20
8.49
$
1,
185.
09$
1,
347.
00$
1,
453.
00$
4,
653,
855
$
7,85
6,41
2$
-
$
1,
120
$
5,13
7$
3,
537
$
1,28
5$
7,
262
$
571,
411
$
3,
929
$
1,45
3$
0.
0774
1
0.13
068
-
0.
0000
2
0.00
009
0.
0000
6
0.00
002
0.
0001
2
0.00
950
0.
0000
7
0.00
002
M
eter
s
418
5,
786
35
P
age
2, li
ne 7
0-
-
-
-
-
-
-
0.
0515
5
0.71
353
0.
0043
2
-
Tran
spor
t Cus
t
-
-
-
-
-
-
-
-
-
0.00
073
0.
0000
1
Pag
e 2,
Lin
e 39
-
-
-
-
-
-
-
-
-
0.00
291
0.
0000
3
Acc
t 385
Dem
and
57,0
12
60,0
64
-
43
11
1
53
19
9
180
22
,785
46
0
4
W
eigh
ted
Pea
k D
eman
d51
8,99
2
546,
773
-
39
2
1,00
6
47
9
1,81
3
1,
637
207,
418
4,
190
41
W
eigh
ted
Pea
k D
eman
d13
,366
14
,081
-
10
26
12
47
42
5,34
2
10
8
1
W
eigh
ted
Pea
k D
eman
d17
,960
20
,244
-
15
40
31
105
59
7,28
1
27
4
7
S
tora
ge34
3,57
3
71,2
73
-
166
17
7
15
15
507
7,
015
42
15
Cus
tom
er67
,680
14
,040
-
33
35
3
3
10
0
1,38
2
8
3
C
usto
mer
-
-
-
-
-
-
-
-
-
-
-
Cus
tom
er1,
018,
583
726,
475
-
65
9
1,39
4
59
2
2,18
2
2,
525
251,
223
5,
083
71
0.
1059
6
0.07
557
-
0.
0000
7
0.00
015
0.
0000
6
0.00
023
0.
0002
6
0.02
613
0.
0005
3
0.00
001
Sa
larie
s &
Wag
es
Case No. U-17273 Witness: J.C. Hoffman Malueg
Exhibit A-16 (JCHM-2) Schedule F1.5
Page 4 of 4

Mic
higa
n P
ublic
Ser
vice
Com
mis
sion
Mic
higa
n G
as U
tiliti
es C
orpo
ratio
nH
isto
rical
Cos
t of S
ervi
ce A
lloca
tion
Stu
dyH
isto
rical
Yea
r End
ing
Dec
embe
r 31,
201
2
CLA
SS
IFIC
ATI
ON
OF
PLA
NT
IN S
ER
VIC
E -
13
MO
NTH
AV
G. A
ND
G/C
ALL
OC
ATE
D(A
)(B
)(C
)(D
)(E
)(F
)(G
)(H
)(I)
(J)
GA
S S
UP
PLY
EN
HA
NC
ED
LIN
EA
CC
T.C
OR
PO
RA
TEP
UR
CH
AS
ED
AC
QU
ISIT
ION
PR
OD
UC
TIO
NS
TOR
AG
ED
ISTR
IBU
TIO
NO
THE
RN
O.
DE
SC
RIP
TIO
N N
O.
TOTA
LG
AS
CO
ST
CO
ST
DE
MA
ND
CO
ST
DE
MA
ND
CU
STO
ME
RS
ER
VIC
ES
1P
RO
DU
CTI
ON
2P
rodu
ctio
n &
Gat
herin
g P
lant
325-
337
2,41
6,67
00
02,
416,
670
00
00
3U
nder
grou
nd S
tora
ge P
lant
350-
357
15,7
99,4
870
00
15,7
99,4
870
00
4TO
TAL
PR
OD
UC
TIO
N P
LT A
CC
T18
,216
,157
00
2,41
6,67
015
,799
,487
00
05 6
TRA
NS
MIS
SIO
N7
M
AIN
S36
733
,077
,108
00
00
13,9
26,5
2819
,150
,579
08
O
THE
R T
RA
NS
MIS
SIO
N E
XP
EN
SE
365,
366
, 369
8,74
0,43
20
00
08,
740,
432
00
9TO
TAL
TRA
NS
MIS
SIO
N41
,817
,540
00
00
22,6
66,9
6119
,150
,579
010 11
DIS
TRIB
UTI
ON
-GE
NE
RA
L R
ELA
TED
12In
tang
ible
302/
303
17,6
940
00
017
,694
00
13La
nd a
nd L
and
Rig
hts
374
26,0
850
00
026
,085
00
14S
truct
ures
and
Impr
ovem
ents
375
27,3
630
00
027
,363
00
15M
ains
376
9,23
9,90
80
00
04,
237,
180
5,00
2,72
80
16C
ompr
esso
r Sta
tion
Equ
ipm
ent
377
00
00
00
00
17M
easu
ring
& R
egul
atio
n E
quip
men
t - G
ener
al37
836
5,50
30
00
036
5,50
30
018
Mea
surin
g &
Reg
ulat
ion
Equ
ipm
ent -
Gat
e S
tatio
n37
9(2
,881
)0
00
0(2
,881
)0
019
Ser
vice
s38
05,
384,
128
00
00
05,
384,
128
020
Met
ers
381
2,78
7,72
80
00
00
2,78
7,72
80
21M
eter
Con
nect
ions
& In
stal
latio
ns38
20
00
00
00
022
Hou
se R
egul
ator
s38
31,
152,
987
00
00
01,
152,
987
023
Indu
stria
l Met
erin
g &
Reg
ulat
ing
Sta
tion
Equ
ip.
385
47,2
170
00
047
,217
00
24TO
TAL
DIS
TRIB
UTI
ON
-GE
NE
RA
L R
ELA
TED
19,0
45,7
340
00
04,
718,
162
14,3
27,5
720
25 26D
ISTR
IBU
TIO
N-D
IRE
CT
PLA
NT
AC
CT
27In
tang
ible
302/
303
214,
780
00
00
214,
780
00
28La
nd a
nd L
and
Rig
hts
374
316,
632
00
00
316,
632
00
29S
truct
ures
and
Impr
ovem
ents
375
332,
145
00
00
332,
145
00
30M
ains
376
112,
156,
928
00
00
51,4
32,2
2960
,724
,699
031
Com
pres
sor S
tatio
n E
quip
men
t37
70
00
00
00
032
Mea
surin
g &
Reg
ulat
ion
Equ
ipm
ent -
Gen
eral
378
4,43
6,59
60
00
04,
436,
596
00
33M
easu
ring
& R
egul
atio
n E
quip
men
t - G
ate
Sta
tion
379
(34,
969)
00
00
(34,
969)
00
34S
ervi
ces
380
65,3
54,2
590
00
00
65,3
54,2
590
35M
eter
s38
133
,838
,324
00
00
033
,838
,324
036
Met
er C
onne
ctio
ns &
Inst
alla
tions
382
00
00
00
00
37H
ouse
Reg
ulat
ors
383
13,9
95,3
260
00
00
13,9
95,3
260
38In
dust
rial M
eter
ing
& R
egul
atin
g S
tatio
n E
quip
.38
557
3,13
90
00
057
3,13
90
039
TOTA
L D
ISTR
IBU
TIO
N P
LT A
CC
T23
1,18
3,16
00
00
057
,270
,552
173,
912,
608
040
TOTA
L D
ISTR
IBU
TIO
N F
UN
CTI
ON
250,
228,
894
00
00
61,9
88,7
1518
8,24
0,17
90
41 42C
US
TOM
ER
- A
LLO
CA
BLE
00
00
00
00
43 44TO
TAL
PLA
NT
IN S
ER
VIC
E31
0,26
2,59
10
02,
416,
670
15,7
99,4
8784
,655
,675
207,
390,
759
045
100.
00%
28.9
9%71
.01%
CO
MM
OD
ITY
DE
MA
ND
CU
STO
ME
R
May
not
cro
ss-c
heck
due
to R
ound
ing
Case No. U-17273 Witness: J.C. Hoffman Malueg
Exhibit A-16 (JCHM-2) Schedule F1.6
Page 1 of 5

Mic
higa
n P
ublic
Ser
vice
Com
mis
sion
Mic
higa
n G
as U
tiliti
es C
orpo
ratio
nH
isto
rical
Cos
t of S
ervi
ce A
lloca
tion
Stu
dyH
isto
rical
Yea
r End
ing
Dec
embe
r 31,
201
2
CLA
SS
IFIC
ATI
ON
OF
DE
PR
EC
IATI
ON
RE
SE
RV
E S
/L -
13 M
ON
TH A
VG
. AN
D G
/C A
LLO
CA
TED
(A)
(B)
(C)
(D)
(E)
(F)
(G)
(H)
(I)(J
)
GA
S S
UP
PLY
EN
HA
NC
ED
LIN
EA
CC
T.C
OR
PO
RA
TEP
UR
CH
AS
ED
AC
QU
ISIT
ION
PR
OD
UC
TIO
NS
TOR
AG
ED
ISTR
IBU
TIO
NO
THE
RN
O.
DE
SC
RIP
TIO
N N
O.
TOTA
LG
AS
CO
ST
CO
ST
DE
MA
ND
CO
ST
DE
MA
ND
CU
STO
ME
RS
ER
VIC
ES
1P
RO
DU
CTI
ON
2P
rodu
ctio
n &
Gat
herin
g P
lant
325-
337
(1,2
38,0
72)
00
(1,2
38,0
72)
00
00
3U
nder
grou
nd S
tora
ge P
lant
350-
357
(7,4
42,1
08)
00
0(7
,442
,108
)0
00
4TO
TAL
PR
OD
UC
TIO
N P
LT A
CC
T(8
,680
,180
)0
0(1
,238
,072
)(7
,442
,108
)0
00
5 6TR
AN
SM
ISS
ION
7
MA
INS
367
(22,
027,
262)
00
00
(9,2
74,1
87)
(12,
753,
075)
08
O
THE
R T
RA
NS
MIS
SIO
N E
XP
EN
SE
365,
366
, 369
(5,7
46,1
21)
00
00
(5,7
46,1
21)
00
9TO
TAL
TRA
NS
MIS
SIO
N(2
7,77
3,38
3)0
00
0(1
5,02
0,30
8)(1
2,75
3,07
5)0
7 8D
ISTR
IBU
TIO
N-G
EN
ER
AL
RE
LATE
D9
Inta
ngib
le30
2/30
3(1
4,52
8)0
00
0(1
4,52
8)0
010
Land
and
Lan
d R
ight
s37
4(1
,738
)0
00
0(1
,738
)0
011
Stru
ctur
es a
nd Im
prov
emen
ts37
5(1
5,33
6)0
00
0(1
5,33
6)0
012
Mai
ns37
6(4
,586
,163
)0
00
0(2
,103
,094
)(2
,483
,069
)0
13C
ompr
esso
r Sta
tion
Equ
ipm
ent
377
00
00
00
00
14M
easu
ring
& R
egul
atio
n E
quip
men
t - G
ener
al37
8(2
06,1
82)
00
00
(206
,182
)0
015
Mea
surin
g &
Reg
ulat
ion
Equ
ipm
ent -
Gat
e S
tatio
n37
9(1
9)0
00
0(1
9)0
016
Ser
vice
s38
0(2
,629
,703
)0
00
00
(2,6
29,7
03)
017
Met
ers
381
(1,1
16,8
58)
00
00
0(1
,116
,858
)0
18M
eter
Con
nect
ions
& In
stal
latio
ns38
20
00
00
00
019
Hou
se R
egul
ator
s38
3(3
73,6
46)
00
00
0(3
73,6
46)
020
Indu
stria
l Met
erin
g &
Reg
ulat
ing
Sta
tion
Equ
ip.
385
(22,
155)
00
00
(22,
155)
00
21TO
TAL
DIS
TRIB
UTI
ON
-GE
NE
RA
L R
ELA
TED
(8,9
66,3
27)
00
00
(2,3
63,0
51)
(6,6
03,2
76)
022 23
DIS
TRIB
UTI
ON
-DIR
EC
T P
LAN
T A
CC
T24
Inta
ngib
le30
2/30
3(2
04,5
09)
00
00
(204
,509
)0
025
Land
and
Lan
d R
ight
s37
4(2
4,46
0)0
00
0(2
4,46
0)0
026
Stru
ctur
es a
nd Im
prov
emen
ts37
5(2
15,8
93)
00
00
(215
,893
)0
027
Mai
ns37
6(6
4,56
0,18
3)0
00
0(2
9,60
5,60
9)(3
4,95
4,57
4)0
28C
ompr
esso
r Sta
tion
Equ
ipm
ent
377
00
00
00
00
29M
easu
ring
& R
egul
atio
n E
quip
men
t - G
ener
al37
8(2
,902
,453
)0
00
0(2
,902
,453
)0
030
Mea
surin
g &
Reg
ulat
ion
Equ
ipm
ent -
Gat
e S
tatio
n37
9(2
62)
00
00
(262
)0
031
Ser
vice
s38
0(3
7,01
8,76
1)0
00
00
(37,
018,
761)
032
Met
ers
381
(15,
722,
197)
00
00
0(1
5,72
2,19
7)0
33M
eter
Con
nect
ions
& In
stal
latio
ns38
20
00
00
00
034
Hou
se R
egul
ator
s38
3(5
,259
,881
)0
00
00
(5,2
59,8
81)
035
Indu
stria
l Met
erin
g &
Reg
ulat
ing
Sta
tion
Equ
ip.
385
(311
,881
)0
00
0(3
11,8
81)
00
36TO
TAL
DIS
TRIB
UTI
ON
PLT
AC
CT
(126
,220
,480
)0
00
0(3
3,26
5,06
7)(9
2,95
5,41
3)0
37TO
TAL
DIS
TRIB
UTI
ON
FU
NC
TIO
N(1
35,1
86,8
07)
00
00
(35,
628,
118)
(99,
558,
689)
038 39
CU
STO
ME
R -
ALL
OC
AB
LE0
00
00
00
040 41
TOTA
L D
EP
RE
CIA
TIO
N R
ES
ER
VE
- S
TRA
IGH
T LI
NE
(171
,640
,370
)0
0(1
,238
,072
)(7
,442
,108
)(5
0,64
8,42
6)(1
12,3
11,7
64)
0
CO
MM
OD
ITY
DE
MA
ND
CU
STO
ME
R
May
not
cro
ss-c
heck
due
to R
ound
ing
Case No. U-17273 Witness: J.C. Hoffman Malueg
Exhibit A-16 (JCHM-2) Schedule F1.6
Page 2 of 5

Mic
higa
n P
ublic
Ser
vice
Com
mis
sion
Mic
higa
n G
as U
tiliti
es C
orpo
ratio
nH
isto
rical
Cos
t of S
ervi
ce A
lloca
tion
Stu
dyH
isto
rical
Yea
r End
ing
Dec
embe
r 31,
201
2
CLA
SS
IFIC
ATI
ON
OF
CO
NS
TRU
CTI
ON
WO
RK
IN P
RO
GR
ES
S(A
)(B
)(C
)(D
)(E
)(F
)(G
)(H
)(I)
(J)
GA
S S
UP
PLY
EN
HA
NC
ED
LIN
EA
CC
T.C
OR
PO
RA
TEP
UR
CH
AS
ED
AC
QU
ISIT
ION
PR
OD
UC
TIO
NS
TOR
AG
ED
ISTR
IBU
TIO
NO
THE
RN
O.
DE
SC
RIP
TIO
N N
O.
TOTA
LG
AS
CO
ST
CO
ST
DE
MA
ND
CO
ST
DE
MA
ND
CU
STO
ME
RS
ER
VIC
ES
1P
RO
DU
CTI
ON
2P
rodu
ctio
n &
Gat
herin
g P
lant
325-
337
44,3
550
044
,355
00
00
3U
nder
grou
nd S
tora
ge P
lant
350-
357
499,
738
00
049
9,73
80
00
4TO
TAL
PR
OD
UC
TIO
N P
LT A
CC
T54
4,09
30
044
,355
499,
738
00
05 6
TRA
NS
MIS
SIO
N7
M
AIN
S36
764
8,62
40
00
027
3,09
137
5,53
20
8
OTH
ER
TR
AN
SM
ISS
ION
EX
PE
NS
E36
5, 3
66, 3
6982
7,24
50
00
082
7,24
50
09
TOTA
L TR
AN
SM
ISS
ION
1,47
5,86
90
00
01,
100,
337
375,
532
010 11
DIS
TRIB
UTI
ON
-GE
NE
RA
L R
ELA
TED
12In
tang
ible
302/
303
375
00
00
375
00
13La
nd a
nd L
and
Rig
hts
374
553
00
00
553
00
14S
truct
ures
and
Impr
ovem
ents
375
580
00
00
580
00
15M
ains
376
195,
889
00
00
89,8
3010
6,06
00
16C
ompr
esso
r Sta
tion
Equ
ipm
ent
377
00
00
00
00
17M
easu
ring
& R
egul
atio
n E
quip
men
t - G
ener
al37
87,
749
00
00
7,74
90
018
Mea
surin
g &
Reg
ulat
ion
Equ
ipm
ent -
Gat
e S
tatio
n37
9(6
1)0
00
0(6
1)0
019
Ser
vice
s38
011
4,14
50
00
00
114,
145
020
Met
ers
381
59,1
010
00
00
59,1
010
21M
eter
Con
nect
ions
& In
stal
latio
ns38
20
00
00
00
022
Hou
se R
egul
ator
s38
324
,444
00
00
024
,444
023
Indu
stria
l Met
erin
g &
Reg
ulat
ing
Sta
tion
Equ
ip.
385
1,00
10
00
01,
001
00
24TO
TAL
DIS
TRIB
UTI
ON
-GE
NE
RA
L R
ELA
TED
403,
776
00
00
100,
027
303,
749
025 26
DIS
TRIB
UTI
ON
-DIR
EC
T P
LAN
T A
CC
T27
Inta
ngib
le30
2/30
30
00
00
00
028
Land
and
Lan
d R
ight
s37
40
00
00
00
029
Stru
ctur
es a
nd Im
prov
emen
ts37
50
00
00
00
030
Mai
ns37
61,
673,
954
00
00
767,
631
906,
323
031
Com
pres
sor S
tatio
n E
quip
men
t37
70
00
00
00
032
Mea
surin
g &
Reg
ulat
ion
Equ
ipm
ent -
Gen
eral
378
29,4
020
00
029
,402
00
33M
easu
ring
& R
egul
atio
n E
quip
men
t - G
ate
Sta
tion
379
00
00
00
00
34S
ervi
ces
380
12,0
560
00
00
12,0
560
35M
eter
s38
10
00
00
00
036
Met
er C
onne
ctio
ns &
Inst
alla
tions
382
00
00
00
00
37H
ouse
Reg
ulat
ors
383
00
00
00
00
38In
dust
rial M
eter
ing
& R
egul
atin
g S
tatio
n E
quip
.38
50
00
00
00
039
TOTA
L D
ISTR
IBU
TIO
N P
LT A
CC
T1,
715,
412
00
00
797,
033
918,
379
040
TOTA
L D
ISTR
IBU
TIO
N F
UN
CTI
ON
2,11
9,18
80
00
089
7,06
01,
222,
128
041 42
CU
STO
ME
R -
ALL
OC
AB
LE0
00
00
00
043 44
TOTA
L C
ON
STR
UC
TIO
N W
OR
K IN
PR
OG
RE
SS
4,13
9,15
00
044
,355
499,
738
1,99
7,39
71,
597,
660
0
CO
MM
OD
ITY
DE
MA
ND
CU
STO
ME
R
May
not
cro
ss-c
heck
due
to R
ound
ing
Case No. U-17273 Witness: J.C. Hoffman Malueg
Exhibit A-16 (JCHM-2) Schedule F1.6
Page 3 of 5

Mic
higa
n P
ublic
Ser
vice
Com
mis
sion
Mic
higa
n G
as U
tiliti
es C
orpo
ratio
nH
isto
rical
Cos
t of S
ervi
ce A
lloca
tion
Stu
dyH
isto
rical
Yea
r End
ing
Dec
embe
r 31,
201
2
CLA
SS
IFIC
ATI
ON
OF
DE
PR
EC
IATI
ON
EX
PE
NS
E S
/L -
YE
AR
EN
D T
OTA
L A
ND
G/C
ALL
OC
ATE
D(A
)(B
)(C
)(D
)(E
)(F
)(G
)(H
)(I)
(J)
GA
S S
UP
PLY
EN
HA
NC
ED
LIN
EA
CC
T.C
OR
PO
RA
TEP
UR
CH
AS
ED
AC
QU
ISIT
ION
PR
OD
UC
TIO
NS
TOR
AG
ED
ISTR
IBU
TIO
NO
THE
RN
O.
DE
SC
RIP
TIO
N N
O.
TOTA
LG
AS
CO
ST
CO
ST
DE
MA
ND
CO
ST
DE
MA
ND
CU
STO
ME
RS
ER
VIC
ES
1P
RO
DU
CTI
ON
2P
rodu
ctio
n &
Gat
herin
g P
lant
325-
337
56,8
810
056
,881
00
00
3U
nder
grou
nd S
tora
ge P
lant
350-
357
341,
063
00
034
1,06
30
00
4TO
TAL
PR
OD
UC
TIO
N P
LT A
CC
T39
7,94
40
056
,881
341,
063
00
05 6
TRA
NS
MIS
SIO
N7
M
AIN
S36
736
6,31
50
00
015
4,23
021
2,08
40
8
OTH
ER
TR
AN
SM
ISS
ION
EX
PE
NS
E36
5, 3
66, 3
6912
1,36
10
00
012
1,36
10
09
TOTA
L TR
AN
SM
ISS
ION
487,
675
00
00
275,
591
212,
084
07 8
DIS
TRIB
UTI
ON
-GE
NE
RA
L R
ELA
TED
9In
tang
ible
302/
303
700
00
070
00
10La
nd a
nd L
and
Rig
hts
374
299
00
00
299
00
11S
truct
ures
and
Impr
ovem
ents
375
241
00
00
241
00
12M
ains
376
266,
413
00
00
122,
170
144,
243
013
Com
pres
sor S
tatio
n E
quip
men
t37
70
00
00
00
014
Mea
surin
g &
Reg
ulat
ion
Equ
ipm
ent -
Gen
eral
378
12,5
900
00
012
,590
00
15M
easu
ring
& R
egul
atio
n E
quip
men
t - G
ate
Sta
tion
379
(94)
00
00
(94)
00
16S
ervi
ces
380
165,
470
00
00
016
5,47
00
17M
eter
s38
143
,839
00
00
043
,839
018
Met
er C
onne
ctio
ns &
Inst
alla
tions
382
00
00
00
00
19H
ouse
Reg
ulat
ors
383
27,5
210
00
00
27,5
210
20In
dust
rial M
eter
ing
& R
egul
atin
g S
tatio
n E
quip
.38
51,
260
00
00
1,26
00
021
TOTA
L D
ISTR
IBU
TIO
N-G
EN
ER
AL
RE
LATE
D51
7,60
80
00
013
6,53
638
1,07
20
22 23D
ISTR
IBU
TIO
N-D
IRE
CT
PLA
NT
AC
CT
24In
tang
ible
302/
303
906
00
00
906
00
25La
nd a
nd L
and
Rig
hts
374
3,88
20
00
03,
882
00
26S
truct
ures
and
Impr
ovem
ents
375
3,12
20
00
03,
122
00
27M
ains
376
3,45
4,73
80
00
01,
584,
252
1,87
0,48
60
28C
ompr
esso
r Sta
tion
Equ
ipm
ent
377
00
00
00
00
29M
easu
ring
& R
egul
atio
n E
quip
men
t - G
ener
al37
816
3,26
70
00
016
3,26
70
030
Mea
surin
g &
Reg
ulat
ion
Equ
ipm
ent -
Gat
e S
tatio
n37
9(1
,220
)0
00
0(1
,220
)0
031
Ser
vice
s38
02,
145,
753
00
00
02,
145,
753
032
Met
ers
381
568,
484
00
00
056
8,48
40
33M
eter
Con
nect
ions
& In
stal
latio
ns38
20
00
00
00
034
Hou
se R
egul
ator
s38
335
6,88
10
00
00
356,
881
035
Indu
stria
l Met
erin
g &
Reg
ulat
ing
Sta
tion
Equ
ip.
385
16,3
350
00
016
,335
00
36TO
TAL
DIS
TRIB
UTI
ON
PLT
AC
CT
6,71
2,14
70
00
01,
770,
543
4,94
1,60
30
37TO
TAL
DIS
TRIB
UTI
ON
FU
NC
TIO
N7,
229,
755
00
00
1,90
7,07
95,
322,
676
038 39
CU
STO
ME
R -
ALL
OC
AB
LE0
00
00
00
040 41
TOTA
L D
EP
RE
CIA
TIO
N E
XP
EN
SE
8,11
5,37
40
056
,881
341,
063
2,18
2,66
95,
534,
760
0
CO
MM
OD
ITY
DE
MA
ND
CU
STO
ME
R
May
not
cro
ss-c
heck
due
to R
ound
ing
Case No. U-17273 Witness: J.C. Hoffman Malueg
Exhibit A-16 (JCHM-2) Schedule F1.6
Page 4 of 5

Mic
higa
n P
ublic
Ser
vice
Com
mis
sion
Mic
higa
n G
as U
tiliti
es C
orpo
ratio
nH
isto
rical
Cos
t of S
ervi
ce A
lloca
tion
Stu
dyH
isto
rical
Yea
r End
ing
Dec
embe
r 31,
201
2
CLA
SS
IFIC
ATI
ON
OF
OP
ER
ATI
ON
& M
AIN
TEN
AN
CE
- Y
EA
R E
ND
TO
TAL
(A)
(B)
(C)
(D)
(E)
(F)
(G)
(H)
(I)(J
)
GA
S S
UP
PLY
EN
HA
NC
ED
LIN
EA
CC
T.C
OR
PO
RA
TEP
UR
CH
AS
ED
AC
QU
ISIT
ION
PR
OD
UC
TIO
NS
TOR
AG
ED
ISTR
IBU
TIO
NO
THE
RN
O.
DE
SC
RIP
TIO
N N
O.
TOTA
LG
AS
CO
ST
CO
ST
DE
MA
ND
CO
ST
DE
MA
ND
CU
STO
ME
RS
ER
VIC
ES
1P
RO
DU
CTI
ON
EX
PE
NS
E:
2
MA
NU
FAC
TUR
ED
GA
S P
RO
DU
CTI
ON
710-
742
376,
862
00
376,
862
00
00
3
NA
TUR
AL
GA
S P
RO
DU
CTI
ON
& G
ATH
ER
ING
750-
769
00
00
00
00
4
GA
S P
UR
CH
AS
ES
- C
OG
800-
810
63,7
20,5
1763
,720
,517
00
00
00
5
GA
S P
UR
CH
AS
ES
- N
on-C
OG
Rel
ated
8041
11, 8
0412
054
2,49
20
542,
492
00
00
06
G
AS
US
ED
FO
R U
TILI
TY O
PS
- C
OG
812
(186
,511
)(1
86,5
11)
00
00
00
7
OTH
ER
GA
S S
UP
PLI
ES
EX
PE
NS
E81
317
9,52
30
179,
523
00
00
08
SU
BTO
TAL
PR
OD
UC
TIO
N64
,632
,883
63,5
34,0
0672
2,01
537
6,86
20
00
09 10
UN
DE
RG
RO
UN
D S
TOR
AG
E:
814-
842
500,
601
00
050
0,60
10
00
11TO
TAL
PR
OD
UC
TIO
N65
,133
,484
63,5
34,0
0672
2,01
537
6,86
250
0,60
10
00
12 13To
tal G
as S
uppl
y A
cq. &
Dem
and
rela
ted
Pro
duct
ion
O&
M1,
098,
877
722,
015
376,
862
14
Per
cent
age
100.
00%
65.7
0%34
.30%
15 16TR
AN
SM
ISS
ION
EX
PE
NS
E:
17
MA
INS
856,
863
55,8
570
00
023
,518
32,3
390
18
OTH
ER
TR
AN
SM
ISS
ION
EX
PE
NS
E85
0, 8
57, 8
59, 8
65, 8
6727
8,01
20
00
027
8,01
20
019
TOTA
L TR
AN
SM
ISS
ION
333,
869
00
00
301,
530
32,3
390
20
Cla
ssifi
catio
n P
erce
ntag
e of
Tra
nsm
issi
on F
unct
ion
100.
00%
90.3
1%9.
69%
21 22D
ISTR
IBU
TIO
N-D
IRE
CT
PLA
NT
AC
CT
870-
894
23In
tang
ible
302/
303
3,86
70
00
03,
867
00
24La
nd a
nd L
and
Rig
hts
374
5,70
10
00
05,
701
00
25S
truct
ures
and
Impr
ovem
ents
375
5,98
00
00
05,
980
00
26M
ains
376
3,43
4,57
10
00
01,
575,
004
1,85
9,56
70
27C
ompr
esso
r Sta
tion
Equ
ipm
ent
377
00
00
00
00
28M
easu
ring
& R
egul
atio
n E
quip
men
t - G
ener
al37
815
1,59
30
00
015
1,59
30
029
Mea
surin
g &
Reg
ulat
ion
Equ
ipm
ent -
Gat
e S
tatio
n37
912
8,89
60
00
012
8,89
60
030
Ser
vice
s38
01,
952,
259
00
00
01,
952,
259
031
Met
ers
381
1,98
7,14
00
00
00
1,98
7,14
00
32M
eter
Con
nect
ions
& In
stal
lato
ins
382
00
00
00
00
33H
ouse
Reg
ulat
ors
383
821,
869
00
00
082
1,86
90
34In
dust
rial M
eter
ing
& R
egul
atin
g S
tatio
n E
quip
.38
533
,657
00
00
33,6
570
035
TOTA
L D
ISTR
IBU
TIO
N F
UN
CTI
ON
8,52
5,53
40
00
01,
904,
699
6,62
0,83
50
36
Cla
ssifi
catio
n P
erce
ntag
e of
Dis
tribu
tion
Func
tion
100.
00%
22.3
4%77
.66%
37 38C
US
TOM
ER
AC
CO
UN
TS E
XP
EN
SE
S:
39
CU
STO
ME
R -
ALL
OC
AB
LE90
1, 9
02, 9
03, 9
057,
727,
039
00
00
07,
727,
039
040
C
US
TOM
ER
- TR
AN
SP
OR
T A
LLO
CA
BLE
901,
902
, 903
, 905
274,
233
00
00
00
274,
233
41
Unc
olle
ctib
le A
ccou
nts
904
1,44
0,57
10
00
00
1,44
0,57
10
42C
US
TOM
ER
- A
LLO
CA
BLE
907-
910
690,
778
00
00
069
0,77
80
43C
US
TOM
ER
- D
irect
Ass
igna
ble
911-
917
00
00
00
00
44TO
TAL
CU
STO
ME
R10
,132
,621
00
00
09,
858,
388
274,
233
45 46C
lass
ifica
tion
Per
cent
age
of D
istri
butio
n an
d C
usto
mer
Fun
ctio
ns18
,383
,922
1,90
4,69
916
,479
,223
047
E
xclu
ding
Dire
ct A
ssig
ned
100.
00%
10.3
6%89
.64%
0.00
%48 49
AD
MIN
ISTR
ATI
VE
& G
EN
ER
AL
- ALL
OC
AB
LE92
0-93
512
,861
,528
055
5,94
029
0,17
825
1,39
31,
899,
958
9,86
4,05
90
50A
DM
INIS
TRA
TIV
E &
GE
NE
RA
L - T
RA
NS
PO
RT
920-
935
194,
761
00
00
00
194,
761
51TO
TAL
CU
STO
ME
R13
,056
,289
055
5,94
029
0,17
825
1,39
31,
899,
958
9,86
4,05
919
4,76
152 53
TOTA
L O
PE
RA
TIO
N &
MA
INTE
NA
NC
E E
XP
EN
SE
:97
,181
,797
63,5
34,0
061,
277,
955
667,
040
751,
994
4,10
6,18
726
,375
,622
468,
994
CO
MM
OD
ITY
DE
MA
ND
CU
STO
ME
R
May
not
cro
ss-c
heck
due
to R
ound
ing
Case No. U-17273 Witness: J.C. Hoffman Malueg
Exhibit A-16 (JCHM-2) Schedule F1.6
Page 5 of 5

Mic
higa
n P
ublic
Ser
vice
Com
mis
sion
Mic
higa
n G
as U
tiliti
es C
orpo
ratio
nH
isto
rical
Cos
t of S
ervi
ce A
lloca
tion
Stu
dyTr
ansl
atio
n of
Dis
tribu
tion
O&
M F
ER
C A
ccou
nts
to P
lant
Acc
ount
sH
isto
rical
Yea
r End
ing
Dec
embe
r 31,
201
2
Line
[A]
[B]
[C]
[D]
[E]
[F]
[G]
[H]
[I][J
][K
][L
][M
][N
][O
][P
][Q
][R
][S
][T
]N
o. 1A
lloc
Met
hod
Allo
c M
etho
dA
lloc
Met
hod
YEYE
TO
TAL
2A
ve P
lant
AB
CFE
RC
Tota
lD
ist O
&M
3La
nd a
nd L
and
Rig
hts
374
316,
632
0.
0013
7
870
1,07
0,51
8
374
5,70
1
4S
truct
ures
and
Impr
ovem
ents
375
332,
145
0.
0014
4
871
373,
630
375
5,98
0
5M
ains
376
112,
156,
928
0.
4851
4
112,
156,
928
0.63
1830
872
037
63,
434,
571
6C
ompr
esso
r Sta
tion
Equ
ipm
ent
377
-
-
87
30
377
-
7
Mea
surin
g &
Reg
ulat
ion
Equ
ipm
ent -
Gen
eral
378
4,43
6,59
6
0.01
919
87
41,
206,
821
37
815
1,59
3
8M
easu
ring
& R
egul
atio
n E
quip
men
t - G
ate
Sta
tion
379
(34,
969)
(0.0
0015
)
87
519
,177
37
912
8,89
6
9S
ervi
ces
380
65,3
54,2
59
0.
2826
9
65,3
54,2
59
0.36
8170
876
-
38
01,
952,
259
10M
eter
s38
1.0
33
,838
,324
0.14
637
33
,838
,324
0.69
9041
87
767
,932
38
1.0
1,
987,
140
11A
utom
ated
Met
er R
eadi
ng -
Pur
chas
es38
1.2
-
-
-
-
87
81,
103,
777
38
1.2
-
12D
eman
d D
evic
es -
Pur
chas
es38
1.3
-
-
-
-
87
958
0,96
2
38
1.3
-
13M
eter
Con
nect
ions
& In
stal
latio
ns38
2.0
-
-
880
2,48
0,37
6
382.
0
-
14
Aut
omat
ed M
eter
Inst
alla
tions
382.
2
-
-
88
115
,891
38
2.2
-
15D
eman
d D
evic
e - I
nsta
llatio
ns38
2.3
-
-
885
41,6
64
382.
3
-
16
Hou
se R
egul
ator
s38
313
,995
,326
0.06
054
13
,995
,326
0.28
9119
88
6-
383
821,
869
17
Indu
stria
l Met
erin
g &
Reg
ulat
ing
Sta
tion
Equ
ip.
385
573,
139
0.
0024
8
573,
139
0.01
1840
88
765
2,82
2
38
533
,657
18O
ther
Pro
p on
Cus
t Pre
m38
6-
-
888
-
38
6-
1930
3/30
221
4,78
0
0.00
093
88
952
,541
30
3/30
33,
867
20
231,
183,
160
48
,406
,789
177,
511,
187
890
-
8,
525,
534
2189
161
,594
2289
233
1,32
3
23
893
286,
425
** T
hese
figu
res
do n
ot in
clud
e G
&C
allo
catio
ns o
r A&
G a
lloca
tions
2489
418
0,08
1
25
8,52
5,53
4
26 27D
istr
ibut
ion
O&
M A
ccts
are
map
ped
to th
e ap
prop
riate
, cor
resp
ondi
ng P
lant
Ser
ies
of D
istr
ibut
ion
Acc
ount
s.28
This
hel
ps to
kee
p th
e C
OSS
on
an a
pple
s-to
-app
les
com
paris
on b
asis
.29 30 31 32 33
PER
CEN
TAG
ES A
SSIG
NED
/TR
AN
SLA
TED
:34 35
Pla
nt A
cct:
36FE
RC
Acc
t:37
4
37
5
37
6
377
37
8
37
9
38
0
38
1.0
381.
2
38
1.3
382.
0
38
2.2
38
2.3
383
385
38
6
30
3/30
2A
lloc
Met
hod
37(8
70)S
uper
v &
Eng
r0.
0013
7
0.
0014
4
0.48
514
-
0.
0191
9
(0
.000
15)
0.
2826
9
0.
1463
7
-
-
-
-
-
0.06
054
0.00
248
-
0.00
093
(A)
38(8
71)L
oad
Dis
patc
h0.
0013
7
0.
0014
4
0.48
514
-
0.
0191
9
(0
.000
15)
0.
2826
9
0.
1463
7
-
-
-
-
-
0.06
054
0.00
248
-
0.00
093
(A)
39(8
72)C
omp
Labr
& E
x1.
0000
0
D
irect
40(8
73)C
omp
Fuel
& P
w1.
0000
0
D
irect
41(8
74)M
ains
&S
erv
Exp
0.63
183
0.
3681
7
( C
)42
(875
)Ms&
Reg
Exp
Gen
1.00
000
Dire
ct43
(877
)Ms&
Reg
Exp
Gat
1.00
000
Dire
ct44
(878
)Mtr&
Hou
s R
egul
0.69
904
-
-
0.
2891
2
0.
0118
4
(B)
45(8
79)C
ust I
nsta
ll0.
6990
4
-
-
0.28
912
0.01
184
(B
)46
(880
)Oth
er0.
0013
7
0.
0014
4
0.48
514
-
0.
0191
9
(0
.000
15)
0.
2826
9
0.
1463
7
-
-
-
-
-
0.06
054
0.00
248
-
0.00
093
(A)
47(8
81)R
ents
0.00
137
0.00
144
0.
4851
4
-
0.01
919
(0.0
0015
)
0.28
269
0.14
637
-
-
-
-
-
0.
0605
4
0.
0024
8
-
0.
0009
3
(A
)48
(885
)Sup
erv.
& E
ngr.
0.00
137
0.00
144
0.
4851
4
-
0.01
919
(0.0
0015
)
0.28
269
0.14
637
-
-
-
-
-
0.
0605
4
0.
0024
8
-
0.
0009
3
(A
)49
(886
)Stru
ct &
Impr
v1.
0000
0
Dire
ct50
(887
)Mai
ns1.
0000
0
Dire
ct51
(888
)Com
p S
tat E
qup
1.00
000
Dire
ct52
(889
)Ms&
Reg
Exp
Gen
1.00
000
Dire
ct53
(890
)Ms&
Reg
Exp
Indu
st1.
0000
0
D
irect
54(8
91)M
s&R
eg E
xp G
at1.
0000
0
D
irect
55(8
92)S
ervi
ces
1.00
000
Dire
ct56
(893
)Mtr&
Hou
s R
egul
0.69
904
-
-
0.
2891
2
0.
0118
4
(B)
57(8
94)O
ther
Equ
ipm
t0.
0013
7
0.
0014
4
0.48
514
-
0.
0191
9
(0
.000
15)
0.
2826
9
0.
1463
7
-
-
-
-
-
0.06
054
0.00
248
-
0.00
093
(A)
58 59 60D
OLL
AR
S A
SSIG
NED
/TR
AN
SLA
TED
BA
SED
ON
PER
CEN
TAG
ES A
BO
VE:
61P
lant
Acc
t:62
FER
C A
cct:
374
375
376
37
7
378
379
380
381.
0
38
1.2
381.
3
38
2.0
382.
2
382.
3
38
3
38
5
386
303/
302
Allo
c M
etho
d63
(870
)Sup
erv
& E
ngr
1,46
6
1,53
8
519,
354
-
20
,544
(1
62)
302,
630
156,
692
-
-
-
-
-
64
,807
2,65
4
-
99
5
(A
)1,
070,
518
64
(871
)Loa
d D
ispa
tch
512
537
181,
264
-
7,
170
(5
7)
10
5,62
3
54
,688
-
-
-
-
-
22
,619
926
-
347
(A)
373,
630
65(8
72)C
omp
Labr
& E
x-
-
-
-
-
-
-
-
-
-
-
-
-
-
-
-
-
D
irect
-
66
(873
)Com
p Fu
el &
Pw
-
-
-
-
-
-
-
-
-
-
-
-
-
-
-
-
-
Dire
ct-
67(8
74)M
ains
&S
erv
Exp
-
-
76
2,50
6
-
-
-
44
4,31
5
-
-
-
-
-
-
-
-
-
-
( C )
1,20
6,82
1
68(8
75)M
s&R
eg E
xp G
en-
-
-
-
19,1
77
-
-
-
-
-
-
-
-
-
-
-
-
D
irect
19,1
77
69
(877
)Ms&
Reg
Exp
Gat
-
-
-
-
-
67
,932
-
-
-
-
-
-
-
-
-
-
-
Dire
ct67
,932
70(8
78)M
tr&H
ous
Reg
ul-
-
-
-
-
-
-
771,
585
-
-
-
-
-
31
9,12
3
13
,069
-
-
(B
)1,
103,
777
71
(879
)Cus
t Ins
tall
-
-
-
-
-
-
-
40
6,11
6
-
-
-
-
-
167,
967
6,87
9
-
-
(B
)58
0,96
2
72
(880
)Oth
er3,
397
3,
564
1,
203,
337
-
47,6
00
(375
)
70
1,18
9
36
3,05
3
-
-
-
-
-
150,
157
6,14
9
-
2,
304
(A
)2,
480,
376
73
(881
)Ren
ts22
23
7,70
9
-
30
5
(2
)
4,49
2
2,32
6
-
-
-
-
-
96
2
39
-
15
(A
)15
,891
74(8
85)S
uper
v.&
Eng
r.57
60
20,2
13
-
800
(6)
11
,778
6,09
8
-
-
-
-
-
2,
522
10
3
-
39
(A
)41
,664
75(8
86)S
truct
& Im
prv
-
-
-
-
-
-
-
-
-
-
-
-
-
-
-
-
-
Dire
ct-
76(8
87)M
ains
-
-
65
2,82
2
-
-
-
-
-
-
-
-
-
-
-
-
-
-
D
irect
652,
822
77(8
88)C
omp
Sta
t Equ
p-
-
-
-
-
-
-
-
-
-
-
-
-
-
-
-
-
D
irect
-
78
(889
)Ms&
Reg
Exp
Gen
-
-
-
-
52
,541
-
-
-
-
-
-
-
-
-
-
-
-
Dire
ct52
,541
79(8
90)M
s&R
eg E
xp In
dust
-
-
-
-
-
-
-
-
-
-
-
-
-
-
-
-
-
Dire
ct-
80(8
91)M
s&R
eg E
xp G
at-
-
-
-
-
61,5
94
-
-
-
-
-
-
-
-
-
-
-
D
irect
61,5
94
81
(892
)Ser
vice
s-
-
-
-
-
-
33
1,32
3
-
-
-
-
-
-
-
-
-
-
Dire
ct33
1,32
3
82
(893
)Mtr&
Hou
s R
egul
-
-
-
-
-
-
-
20
0,22
3
-
-
-
-
-
82,8
11
3,
391
-
-
(B)
286,
425
83(8
94)O
ther
Equ
ipm
t24
7
25
9
87
,365
-
3,
456
(2
7)
50
,908
26,3
58
-
-
-
-
-
10,9
02
44
6
-
16
7
(A
)18
0,08
1
84
5,70
1
5,98
0
3,43
4,57
1
-
15
1,59
3
12
8,89
6
1,
952,
259
1,98
7,14
0
-
-
-
-
-
821,
869
33,6
57
-
3,86
7
8,52
5,53
4
Case No. U-17273 Witness: J.C. Hoffman Malueg
Exhibit A-16 (JCHM-2) Schedule F1.7
Page 1 of 1

STATE OF MICHIGAN
BEFORE THE MICHIGAN PUBLIC SERVICE COMMISSION
* * * * * In the matter of the application of ) MICHIGAN GAS UTILITIES CORPORATION ) for authority to increase retail natural gas rates. ) Case No. U-17273 )
DIRECT TESTIMONY AND EXHIBIT OF
DAVID J. TYLER
FOR
MICHIGAN GAS UTILITIES CORPORATION
June 7, 2013

- 2 -
STATE OF MICHIGAN
BEFORE THE MICHIGAN PUBLIC SERVICE COMMISSION
* * * * *
In the matter of the application of ) MICHIGAN GAS UTILITIES CORPORATION ) for authority to increase retail natural gas rates. ) Case No. U-17273 )
QUALIFICATIONS OF
DAVID J. TYLER PART I
Q. Please state your name, business address and position. 1
A. My name is David J. Tyler. My business address is 899 S. Telegraph, Monroe, 2
Michigan 48161. I am Manager, Regulatory Services for Michigan Gas Utilities 3
Corporation (“MGUC”). MGUC is a wholly-owned subsidiary of Integrys Energy 4
Group, Inc. (“Integrys”). Integrys resulted from the February 21, 2007 merger 5
between WPS Resources Corporation and Peoples Energy Corporation. 6
7
Q. For whom are you providing testimony? 8
A. I am providing testimony on behalf of MGUC. 9
10
Q. Briefly describe your educational, professional, and utility background. 11
A. I graduated from Wayne State University in 1976 with a Bachelor of Science Degree 12
in Business Administration, majoring in Accounting. 13
14
From 1976 to 1987, I was employed by ANR Pipeline Company progressing through 15
positions of increasing responsibility and authority in the following departments: 16
Special Projects, General Accounting, General Ledger Operations, Gas Accounting, 17

- 3 -
and finally, Supervisor - Gas Accounting and Control with responsibility for the 1
monthly invoicing of all the pipeline sales customers. 2
3
In October 1987, I accepted a position with MGUC’s predecessor, Aquila Inc., d/b/a 4
Aquila Networks – MGU (“MGU/Aquila”) as a Tariff and Contract Administrator where 5
I was responsible for monitoring and controlling purchase contracts related to system 6
supplies and end-user transportation. In November 1989, I was promoted to Federal 7
Regulatory Analyst responsible for monitoring and analyzing activities at the Federal 8
Energy Regulatory Commission (“FERC”) to determine their impact upon MGUC, as 9
well as developing and recommending the positions that MGUC would take in 10
various proceedings. In July 1990, I was promoted to the position of Manager – 11
Federal Regulatory Affairs. 12
13
In August 1994, I accepted a position with SEMCO Energy Gas Company 14
(“SEMCO”) as Manager, Federal Regulatory Affairs. 15
16
In June 2001, I returned to MGU/Aquila, in my current position for MGUC, as 17
Manager, Regulatory Services for the state of Michigan. In this position, I am 18
responsible for regulatory activities within the state, including: (1) insuring 19
compliance with all Michigan Public Service Commission (“MPSC” or “Commission”) 20
orders; (2) acting as a liaison with the MPSC Staff and interveners; (3) serving as 21
the Integrys representative on the Efficiency United Steering Committee (the state 22
appointed administrator for energy optimization (“EO”) programs); and (4) providing 23
support to business unit leaders throughout the Integrys organization. In addition to 24
these duties, I am responsible for preparing analyses related to and setting MGUC’s, 25
monthly Gas Cost Recovery (“GCR”) factors, preparing the monthly 45-Day Report, 26
GCR plan and reconciliation filings, as well as EO filings. 27

- 4 -
1
Q. Have you previously testified before any regulatory agency? 2
A. Yes, I have. I have testified before the MPSC in numerous MGU/Aquila, SEMCO 3
and MGUC GCR plan and reconciliation proceedings, and in connection with take-or-4
pay proceedings involving FERC Order Nos. 500 & 528. I sponsored testimony in 5
SEMCO’s 1996 general rate case proceeding (Case No. U-11220); MGU/Aquila’s 6
2002 general rate case proceeding (Case No. U-13470), and MGUC’s general rate 7
proceedings (Case Nos. U-15549 and U-15990). I also sponsored testimony in 8
MGUC’s 2009, 2010, 2011 and 2012 EO plan and reconciliation (Case Nos. U-9
15891, U-16291, U-16292, U-16752, U-16731 and U-17290, respectively). 10
11
I have also testified before the FERC on behalf of SEMCO in ANR Pipeline’s 1994 12
general rate case proceeding, Docket No. RP94-043. 13

- 5 -
DAVID J. TYLER DIRECT TESTIMONY
PART II
Q. What is the purpose of your pre-filed direct testimony in this proceeding? 1
A. The purpose of my pre-filed direct testimony is to support the development and 2
presentation of MGUC’s rate design, and the proposed tariff sheet changes. 3
4
Q. Are you sponsoring any exhibits in this proceeding? 5
A. Yes, I am. I am sponsoring the following exhibits: 6
1. Exhibit A-6 (DJT-1), Schedule F2.1, 7 8 2. Exhibit A-6 (DJT-1), Schedule F2.2, 9
10 3. Exhibit A-6 (DJT-1), Schedule F3.1, 11
12 4. Exhibit A-6 (DJT-1), Schedule F3.2, 13
14 5. Exhibit A-6 (DJT-1), Schedule F4, 15
16 6. Exhibit A-6 (DJT-1), Schedule F5, and 17
18 7. Exhibit A-6 (DJT-1), Schedule F6. 19
20
Q. Did you cause these exhibits to be prepared? 21
A. Yes, I did. 22
23
Q. Please describe Exhibit A-6 (DJT-1), Schedule F2.1. 24
A. Exhibit A-6 (DJT-1), Schedule F2.1 is a one page summary showing for each rate 25
schedule the: 26
1. Revenues on Present Rates, including the cost of gas, 27
2. Revenues on Proposed Rates, including the cost of gas, 28
3. The proposed rate increase in dollars, including the cost of gas, and 29
4. The proposed rate increase in percent, including the cost of gas. 30
31

- 6 -
Q. Please describe Exhibit A-6 (DJT-1), Schedule F2.2. 1
A. Exhibit A-6 (DJT-1), Schedule F2.2 is a one page summary showing for each rate 2
schedule the: 3
1. Revenues on Present Rates, excluding the cost of gas, 4
2. Revenues on Proposed Rates, excluding the cost of gas, 5
3. The proposed rate increase in dollars, excluding the cost of gas, and 6
4. The proposed rate increase in percent, excluding the cost of gas. 7
8
Q. Please describe Exhibit A-6 (DJT-1), Schedule F3.1. 9
A. Exhibit A-6 (DJT-1), Schedule F3.1 shows a detailed computation, by billing 10
determinant, for each rate schedule the: 11
1. Revenues on Present Rates, including the cost of gas, 12
2. Revenues on Proposed Rates, including the cost of gas, 13
3. The proposed rate increase in dollars, including the cost of gas, and 14
4. The proposed rate increase in percent, including the cost of gas. 15
16
Q. Please describe Exhibit A-6 (DJT-1), Schedule F3.2. 17
A. Exhibit A-6 (DJT-1), Schedule F3.2 shows a detailed computation, by billing 18
determinant, for each rate schedule the: 19
1. Revenues on Present Rates, excluding the cost of gas, 20
2. Revenues on Proposed Rates, excluding the cost of gas, 21
3. The proposed rate increase in dollars, excluding the cost of gas, and 22
4. The proposed rate increase in percent, excluding the cost of gas. 23
24
Q. Please describe Exhibit A-6 (DJT-1), Schedule F4. 25
A. Exhibit A-6 (DJT-1), Schedule F4 is a comparison of typical monthly bills under 26
present and proposed rates for each rate class. 27

- 7 -
1
Q. Please describe Exhibit A-6 (DJT-1), Schedule F5. 2
A. Exhibit A-6 (DJT-1), Schedule F5 are proposed revised tariff sheets in redline format. 3
4
Q. Please describe Exhibit A-6 (DJT-1), Schedule F6. 5
A. Exhibit A-6 (DJT-1), Schedule F6 is the calculation of the proposed interim rate 6
surcharges. 7
8
The Development and Presentation of the Proposed Rate Design 9 Q. What factors did MGUC consider when developing its proposed rate design? 10
A. The following factors were considered when developing the proposed rate design: 11
1. The Cost of Service Study (“COSS”) completed by Ms. Joylyn C. Hoffman 12 Malueg, specifically Exhibit A-6 (JCHM-1), Schedule F1.4, 13
14 2. The movement of customer rates toward the actual cost of service, 15 16 3. The minimization of cross-subsidizations between rate schedules, and 17 18 4. The avoidance of large bill impacts or “rate shock”. 19
20
Q. Please explain how the COSS influenced the proposed rate design. 21
A. Consistent with cost causation ratemaking principles, MGUC is proposing to move its 22
distribution rates toward the actual cost of providing distribution service to the various 23
customer classes, as calculated by the COSS completed by Ms. Joylyn C. Hoffman 24
Malueg and shown in her Exhibit A-6 (JCHM-1). To that end, MGUC is proposing 25
adjustments in the monthly customer charges to better match the monthly fixed costs 26
incurred by MGUC in providing distribution services to these rate schedules. 27
28
Q. Please explain how the cost similarities and differences inherent to providing 29
distribution services to system sales, transportation and Choice customers 30
influenced the proposed rate design. 31
A. MGUC’S rate design is based upon the following conclusions from the COSS: 32

- 8 -
1. The only significant fixed cost difference between providing distribution 1 services to a transportation customer as compared to providing 2 distribution services to a system sales customer with the same load 3 characteristics is the cost associated with administering the more 4 complicated transportation accounts. 5
6 2. The only significant variable or “per Mcf “ cost difference between 7
providing distribution services to a system sales customer as compared 8 to providing distribution services to transportation and Choice customers 9 with the same load characteristics is the cost associated with 10 administering the gas supply and procurement functions. 11
12
These assumptions are reflected in the grouping of rate schedules in Ms. Joylyn C. 13
Hoffman Malueg’s Exhibit A-6 (JCHM-1). 14
15
Q. Are the assumptions listed above reasonable? 16
A. Yes they are, because they lead to a reasonable match between cost causation and 17
cost recovery. 18
19
Daily and Monthly Customer Charges 20 Q. Please describe the Customer Charge. 21
A. The Customer Charge is designed to recover a portion of the fixed costs of 22
transporting gas across the MGUC distribution system, regardless of whether the 23
gas commodity is being purchased from MGUC or a third party. Based on this 24
concept and the assumptions listed above, all similarly sized customers, whether 25
they are system sales, transportation or Choice customers, have equal Customer 26
Charges in the proposed rate design. 27
28
MGUC is proposing to identify its Customer Charge on both a Daily and Monthly 29
basis. The reasoning behind establishing a separate “Daily” Customer Charge is to 30
eliminate any difficulties in situations where prorating the Monthly Customer Charge 31
may be required. This generally occurs when a billing period may be less than or 32

- 9 -
extend beyond the normal 30 day period; this could be the result of meter reading 1
route changes, termination of service, or other situations. 2
3
Q. Has the Commission approved Daily customer charges for any other Michigan 4
Utilities? 5
A. Yes, it has. The Commission has authorized Daily customer charges for Upper 6
Peninsula Power Company, and for both Wisconsin Public Service Corporation’s 7
electric and gas operations. 8
9
Q. Is it reasonable for similarly sized system sales customers to have the same 10
Customer Charge as transportation and Choice customers? 11
A. Yes, it is. Due to the robust nature of MGUC’s distribution system, the likelihood of 12
interruption due to a distribution system constraint is small. Therefore, it is 13
reasonable for all similarly sized customers to pay the same Customer Charge. In 14
addition to the Customer Charge, transportation customers will pay an Enhanced 15
Administrative fee. This fee recovers the costs associated with administering the 16
more complicated transportation accounts. 17
18
Distribution Rates 19 Q. Please describe the proposed distribution rates. 20
A. The traditional distribution margin rate can be separated into two components: 21
1. A distribution service volumetric fee, and 22 2. A gas supply acquisition fee. 23
24
Q. Please describe the distribution service volumetric fee component in the 25
distribution rates. 26
A. The distribution service volumetric fee component recovers any remaining fixed 27
costs that are not recovered through the customer charge, as well as the variable 28
costs of transporting gas across MGUC’s distribution system, regardless if the gas 29

- 10 -
commodity is purchased from MGUC, taken from MGUC’s storage, or purchased 1
from a third party. Also included in the volumetric fee is a storage component which 2
recovers the costs of MGUC’s on-system storage facilities. This storage component 3
is shown as a separate item in the COSS, but was included in the rate design as a 4
part of the distribution service volumetric fee. In the rate design proposed here, all 5
similarly sized customers, whether they are system sales, transportation or Choice 6
customers, have equal distribution volumetric fees, as shown on Exhibit A-6 (DJT-1), 7
Schedules F3.1 and F3.2. 8
9
Q. Is it reasonable for similarly sized system sales customers to pay the same 10
distribution service volumetric fee component as transportation and Choice 11
customers? 12
A. Yes, it is. Due to the robust nature of MGUC’s distribution system, the likelihood of 13
interruption due to distribution system constraints is small. Therefore, it is 14
reasonable for all similarly sized customers to pay the same distribution service 15
volumetric fee component. 16
17
Q. Please describe the Gas Supply Acquisition component of the distribution 18
rates. 19
A. The Gas Supply Acquisition component is designed to recover the costs associated 20
with administering MGUC’s gas merchant function. 21
22
MGUC has calculated that the costs associated with administering the gas merchant 23
function to be equal to $806,308 for the 2014 projected test year. Specifically, the 24
gas merchant function costs primarily include the costs associated with the MGUC 25
Gas Supply Department, along with taxes and Administrative and General (“A&G”) 26

- 11 -
expense loadings. This equates to a charge of approximately $0.055 per Mcf for 1
GCR customers. 2
3
Q. Is it reasonable for system sales customers to pay a Gas Supply Acquisition 4
component, while transportation and Choice customers do not? 5
A. Yes, it is. Because system sales customers are directly benefiting from MGUC’s gas 6
merchant function, it is reasonable for these customers to pay a Gas Supply 7
Acquisition component. Transportation and Choice customers receive this service 8
from their own suppliers, and not MGUC. 9
10
While MGUC’s currently approved rate design does not include a distinct Gas Supply 11
Acquisition component, MGUC proposes to include a Gas Supply Acquisition 12
component in its rates for GCR customers emerging from the instant general rate 13
case proceeding. 14
15
Movement of the Daily/Monthly Customer Charge Toward Cost of Service 16 Q. What is MGUC's proposed Customer Charge for Residential service? 17
A. MGUC’s current Monthly Customer Charge is $11.00. The COSS prepared by Ms. 18
Joylyn C. Hoffman Malueg, specifically Exhibit A-6 (JCHM-1), however, supports a 19
$22.35 Monthly Customer Charge. In an effort to moderate the amount of the 20
increase, MGUC is proposing that the Monthly Customer Charge for Residential 21
customers only be increased to $12.00. Although this represents a 9% increase over 22
the current rate, it is still well below the $22.35 rate justified in the COSS. As 23
previously mentioned, the Company is proposing to distinguish the Customer Charge 24
on a “Daily” and “Monthly” basis for administrative efficiency. 25
26
Q. Why is MGUC proposing an increase to the Customer Charge? 27
A. MGUC is proposing to move the Customer Charge closer to the rate recommended 28

- 12 -
by its COSS. MGUC believes that if a Customer Charge is an appropriate method 1
for recovering costs from customers, then the transition of the rate toward cost of 2
service must move forward in order to eliminate the subsidization of low load factor 3
customers by high load factor customers. While MGUC realizes that there will be 4
some customers who will be negatively impacted by this change, other customers 5
are being negatively impacted by the current rate levels. MGUC must balance the 6
needs of all of its customers, some of whom will benefit from the change. MGUC 7
believes that its proposed rates are an appropriate compromise between the two 8
groups of customers during the transition of the Monthly Customer Charge rates 9
toward the actual cost of service. 10
11
Q. How does MGUC’s proposed Customer Charge compare with other Michigan 12
utilities? 13
A. The table below shows the Customer Charges currently authorized for other 14
Michigan gas utilities: 15
Customer 16 Utility Charge 17
Consumers Energy $10.50 18 DTE Energy (formerly MichCon) 10.73 19 Michigan Gas Utilities Corp. 12.00 (proposed) 20 Presque Isle E & G Co Op 12.00 21 SEMCO Energy 11.75 22 23
MGUC’s proposed Customer Charge would equal the highest authorized Customer 24
Charge in Michigan. 25
26
Cross-Subsidization Between Rate Schedules 27 Q. Please explain how MGUC's attempt to reduce the amount of cross-28
subsidization between the various rate schedules has influenced the rate 29
design MGUC has proposed. 30
A. Schedule F1.2 of Exhibit A-6 (JCHM-1), MGUC's 2014 Projected COSS – Detailed 31

- 13 -
Summary completed by Ms. Joylyn C. Hoffman Malueg, indicates that the 1
Residential and Multi-Family Class I, Customer Choice – Residential, Customer 2
Choice – Multi-Family Class I, Aggregated – Residential and Aggregated – Small GS 3
rate schedules are being heavily subsidized by the other rate schedules. With 4
MGUC’s proposed rate design, MGUC has attempted to reduce the amount of cross-5
subsidization between the rate schedules by increasing the amount of revenue 6
collected from the Residential and Multiple-Family Class I, Customer Choice – 7
Residential, Aggregated – Residential and Aggregated – Small GS rate schedules. 8
Although MGUC’s rate design does not eliminate all cross-subsidization between 9
rate schedules, it provides appropriate movement toward that goal while considering 10
rate shock and other factors. 11
12
Q. The monthly fixed charges for TR-1, TR-2 and TR-3 rates have not been 13
adjusted, while the COSS demonstrates that a reduction is appropriate for TR-14
1 and TR-2 rates and a slight increase is appropriate for TR-3 rates. Please 15
explain. 16
A. As previously mentioned, the Company must consider the impact of rate changes it 17
is proposing on each of its customers. Shifting charges between Transportation and 18
General Service customers, in an effort to reduce cross-subsidization between rate 19
classes, cannot be made immediately. This would negatively impact one class over 20
the other. Therefore, such changes are made over time through a process known as 21
“gradualism”. In this process, the Company adjusts its rates to more appropriately 22
reflect its actual cost of service, while considering such issues as “rate shock”` and 23
other factors. 24
25
Elimination of the Multi-Family Dwelling Rate 26 Q. Please explain why MGUC is proposing to eliminate the Multi-Family Dwelling 27
rate. 28

- 14 -
A. The Company is endeavoring to simplify its rate design which it believes will lead to 1
less confusion on the part of customers. By eliminating the Multi-Family rate class, 2
customer billings will be more consistent across classes, and it will reduce the total 3
number of classifications available. Currently, there are four different classifications 4
for Multi-Family service; each classification is differentiated by the hourly flow of gas. 5
Class I is designated as less than 400 cubic feet per hour (“CFH”); Class II is for 400 6
to 1,000 CFH and Classes III and IV are for customers that burn over 1,000 CFH. 7
The differentiation between Class III and Class IV has to do with whether or not there 8
is a pressure or temperature correcting device associated with the meter. Most 9
customers have no understanding of these types of differentiation and it often leads 10
to confusion and or frustration when a customer reviews tariff schedules in an 11
attempt to determine which rate class they would fall into. By eliminating the 12
classification entirely, customer confusion will be reduced. 13
14
For the 2014 projected test year, MGUC forecasts a total of 463 customers taking 15
service under the Multi-Family rate; 164 in Class I, 260 in Class II, 17 in Class III and 16
22 in Class IV. While there are not many customers in these rate classes, 17
elimination of this service classification will require fewer field inspections to 18
determine if customers are on the appropriate rate. The Company believes that 19
these benefits will outweigh the impact that a change in classifications may have on 20
any individual customer when shifting from the Multi-Family classification to either 21
Residential or Small General Service. Customers currently designated as Multi-22
Family Class I would be moved to Residential service and the other Multi-Family 23
classes would be moved to Small General service. 24
25
26
27

- 15 -
Proposed Tariff Sheet Changes 1 Q. Please explain Exhibit A-6 (DJT-1), Schedule No. F5. 2
A. Exhibit A-6 (DJT-1), Schedule F5, pages 1 – 3 summarize the changes being 3
proposed for MGUC’s natural gas tariff. Pages 4 – 24 are redlined versions of the 4
proposed tariff sheets. 5
6
Q. What revision is MGUC proposing on Tariff Sheet No. C-23.00? 7
A. The Company is inserting language which requires that a customer’s account must 8
be “current” before they will be allowed to switch from one type of service or rate 9
classification to another. The Company does, however, reserve the right to waive the 10
requirement. 11
12
Q. What revision is MGUC proposing on Tariff Sheet No. C-24.00? 13
A. The Company is inserting language that clarifies the term “month”, as it applies to 14
customer billings. 15
16
Q. What revision is MGUC proposing on Tariff Sheet No. C-34.00? 17
A. The Company is proposing to modify its existing language to reflect recent changes 18
in its operating practices. The Company now installs a gas meter at the time that it 19
runs a gas service line, as such the Fixed Monthly Surcharge under the Customer 20
Attachment Program may now be assessed when the Company installs the meter. 21
22
Q. What revision is MGUC proposing on Tariff Sheet No. C-35.00? 23
A. The Company has inserted language that clarifies in instances where there are 24
multiple metered installations, the connection fee shall be $200.00 for the first 25
account and $100.00 for each subsequent account. 26
27
28

- 16 -
Q. What revision is MGUC proposing on Tariff Sheet No. D-1.00? 1
A. This tariff sheet details the interim rate surcharges applicable to each of MGUC’s 2
various rate schedules. The surcharge rates represent an equal percentage 3
increase of margin revenues on present rates for each rate schedule, as calculated 4
on Exhibit A-6 (DJT-1), Schedule F6. 5
6
Q. What revisions is MGUC proposing on Tariff Sheet No. D-1.02? 7
A. The Company has moved the Energy Optimization Surcharge here, due to space 8
limitations on page D-1.00 and D-1.01 and eliminated its Revenue Decoupling 9
Mechanism for 2010, as it is no longer in effect 10
11
Q. What revisions is MGUC proposing on Tariff Sheet No. D-6.00? 12
A. The Company has added the designation of a Daily Customer Charge, for 13
administrative purposes. The Customer and Distribution Charges have been updated 14
consistent with MGUC’s proposed rate design. The new rates are $12.00 per month, 15
and $1.7815 per Mcf, respectively. 16
17
Q. What revisions is MGUC proposing on Tariff Sheets No. D-7.00 through 18
D-10.00? 19
A. Language applicable to the Multi-Family Dwelling Rate has been eliminated as the 20
Company is proposing to consolidate this rate with the Residential Small General 21
Service classifications. 22
23
Q. What revisions is MGUC proposing on Tariff Sheet No. D-11.00? 24
A. The Company has added the designation of a Daily Customer Charge, for 25
administrative purposes. The Customer and Distribution Charges have been updated 26
consistent with MGUC’s proposed rate design. The Monthly Customer Charge 27

- 17 -
remains unchanged at $33.00 per month, and the new Distribution Charge is 1
$1.7815 per Mcf. 2
3
Q. What revisions is MGUC proposing on Tariff Sheet No. D-13.00? 4
A. The Company has added the designation of a Daily Customer Charge, for 5
administrative purposes. The Customer and Distribution Charges have been updated 6
consistent with MGUC’s proposed rate design. The Monthly Customer Charge 7
remains unchanged at $400.00 per month, and the new Distribution Charge is 8
$1.0578 per Mcf. 9
10
Q. What revisions is MGUC proposing on Tariff Sheet No. D-15.00? 11
A. The Distribution Charges have been updated consistent with MGUC’s proposed rate 12
design. The new rate is $1.7815 per Mcf. Additional language has been added to 13
include the Supplemental Charges that may apply. 14
15
Q. What revisions is MGUC proposing on Tariff Sheet No. E-13.00? 16
A. Charges for Transportation customers have been updated consistent with MGUC’s 17
proposed rate design, as shown below: 18
19
TR-1 TR-2 TR-3 20 Customer Charge $850.00 $2,250.00 $3,050.00 21 22 Transportation Rates: 23 Peak (Nov – Mar) $0.7777 per Mcf $0.4796 per Mcf $0.4651 per Mcf 24 Off-Peak (Apr – Oct) $0.6277 per Mcf $0.3296 per Mcf $0.3151 per Mcf 25 26
The only charge that has been revised for Transportation customers is the Monthly 27
Customer Charge for TR-1 customers, all other charges and rates remain 28
unchanged. Additional language has been added to include the Supplemental 29
Charges that may apply. 30

- 18 -
1
Q. What revisions is MGUC proposing on Tariff Sheet No. E-14.00? 2
A. MGUC is proposing to update its Gas-In-Kind retention percentage. MGUC has 3
updated its throughput, Company Use, and Gas Lost-and-Unaccounted-For figures 4
to reflect the last five year’s activity. The percentage has decreased to 0.31%. 5
6
Q. What revisions is MGUC proposing on Tariff Sheet No. E-17.00? 7
A. MGUC is proposing to include the month of November in its storage injection 8
restrictions. Although November is generally considered one of the typical “winter 9
months”, the Company may still be injecting gas into its storage accounts and as 10
such, needs to expand its Authorized Tolerance Level (“ATL”) restrictions to include 11
the month of November. 12
13
Q. What revisions is MGUC proposing on Tariff Sheet No. F-2.00? 14
A. MGUC is adding language to specify the number of pricing pools that its billing 15
system can accommodate for the Choice Suppliers. The limitation is due to the 16
constraints of its third-party’s billing system which is not capable of expanding the 17
number of pricing pools available without substantial and costly modification. The 18
Company is also seeking to clarify that Choice Suppliers will be limited to adding no 19
more than two new pricing pools per month, once again due to the limitations 20
surrounding the processing of such requests by MGUC’s third-party billing partner, 21
Vertex Business Services (“Vertex”). 22
23
The Company has added language that defines the term “Pricing Category” and that 24
the Company shall issue Daily Delivery Obligations (“DDO’s”) for each of the delivery 25
pools associated with the Company’s five operating districts that have customers 26
enrolled by each Marketer under their various Pricing Categories. 27

- 19 -
1
The Company has increased the period when it will provide DDO figures to the 2
Choice Suppliers from the closing day of bid trading to seven business days prior to 3
the end of the preceding month. This will provide more time to the Choice Suppliers 4
to secure their necessary supplies. 5
6
Q. What revisions is MGUC proposing on Tariff Sheet No. F-3.00? 7
A. Language has been added to clarify that for each nominated quantity of gas a 8
Supplier intends to deliver, a corresponding nomination must be submitted for each 9
geographic delivery pool (MGUC’s five operating districts) associated with each of its 10
various pricing categories. 11
12
MGUC is also adding a provision for Gas-In-Kind volume retention to its Gas 13
Customer Choice Program. The Choice customers operate in a manner similar to 14
Transportation customers in that they deliver gas supplies into MGUC’s system. The 15
Gas-In-Kind retention percentage simply compensates the Company for moving that 16
gas on its system. 17
18
With regards to paragraph (12), the Buy/Sell provision, the Company has clarified 19
that remittance to the Supplier will take place 21 business days from the end of each 20
month, as opposed to calendar days. 21
22
Paragraph (13), the Annual Reconciliation provision, has been modified to include 23
retention of the Gas-In-Kind volumes specified in paragraph (10) above. 24
25
Q. What revisions is MGUC proposing on Tariff Sheet No. F-4.00? 26
A. MGUC is incorporating the Gas-In-Kind volume retention provisions, specified on 27

- 20 -
tariff sheet No. F-3.00, into its Annual Reconciliation. 1
2
Q. What revisions is MGUC proposing on Tariff Sheet No. F-5.00? 3
A. MGUC has re-sequenced its paragraph numbers to accommodate the Gas-In-Kind 4
provision, specified on tariff sheet No. F-3.00. 5
6
Interim Rates 7 Q. Please provide an overview of the proposed interim rate design. 8
A. As authorized by MCL 460.6a(1), MGUC intends to self-implement interim rates for 9
service rendered on and after January 1, 2014. The interim increase is $ 8,036,820. 10
The proposed rate design is set forth in Schedule F6 of Exhibit A-6 (DJT-1). A 11
proposed tariff sheet is included in Schedule F5 of Exhibit A-6 (DJT-1). 12
13
Q. How did MGUC allocate the rate increase amongst the rate schedules? 14
A. MGUC’s interim rate increase was calculated in accordance with MCL 460.6a(1), 15
which requires an equal percentage increase across all rate schedules, based on 16
margin revenues. Lastly, neither the MGUC’s COSS nor the structural rate design 17
changes proposed for final rates were considered in the development and creation of 18
the proposed interim rate levels. 19
20
Q. In its 2010/2011 GCR Reconciliation proceeding in Case No. U-16145-R, the 21
Company was directed to conduct a feasibility study to determine whether 22
transferring to daily balancing will protect GCR customers. It was further 23
directed that this feasibility study, along with a proposal for transitioning to 24
daily balancing, shall be filed in the Company’s next rate case. Has the 25
Company conducted this study and is a proposal for transitioning to daily 26
balancing included in this filing? 27

- 21 -
A. MGUC feels that daily balancing is an appropriate means to protect GCR customers 1
and to ensure that transportation customers will pay the costs related to the services 2
provided to them. However, at the present time, MGUC is not putting forth a 3
transition proposal to move toward daily balancing in this proceeding. 4
5
MGUC currently utilizes Vertex, a third-party provider, to perform its customer 6
billings. As mentioned in the pre-filed direct testimony of Mr. Brian E. Kage and 7
Michael E. Gerth, MGUC is moving forward on incorporating all its subsidiaries on a 8
consolidated billing system which will replace the billing functions performed by 9
Vertex. The consolidated billing system will incorporate daily balancing as part of its 10
design, but is not scheduled to be become operational until sometime in 2016. Since 11
the “ICE 2016” project is underway, it would not be prudent to have MGUC’s current 12
vendor develop a billing system to accommodate daily balancing only to have that 13
system replaced in a few more years. The cost of doing so would be prohibitive and 14
would not serve the customer’s interest. Therefore, MGUC has discussed delaying 15
the transition to daily balancing with Commission Staff until such time that the 16
transition to the new billing system is complete and informed Staff of its decision to 17
do so. 18
19
Q. Does this complete your pre-filed direct testimony? 20
A. Yes, it does. 21
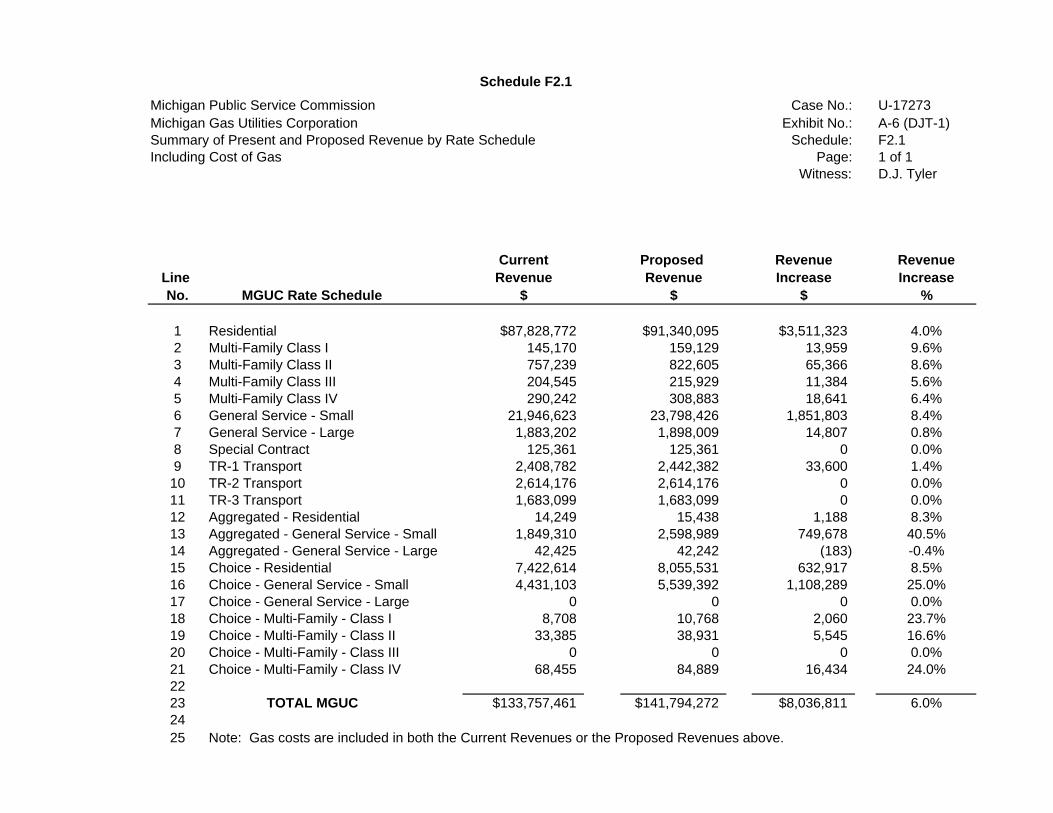
Schedule F2.1Michigan Public Service Commission Case No.: U-17273Michigan Gas Utilities Corporation Exhibit No.: A-6 (DJT-1)Summary of Present and Proposed Revenue by Rate Schedule Schedule: F2.1Including Cost of Gas Page: 1 of 1
Witness: D.J. Tyler
Current Proposed Revenue RevenueLine Revenue Revenue Increase IncreaseNo. MGUC Rate Schedule $ $ $ %
1 Residential $87,828,772 $91,340,095 $3,511,323 4.0%2 Multi-Family Class I 145,170 159,129 13,959 9.6%3 Multi-Family Class II 757,239 822,605 65,366 8.6%4 Multi-Family Class III 204,545 215,929 11,384 5.6%5 Multi-Family Class IV 290,242 308,883 18,641 6.4%6 General Service - Small 21,946,623 23,798,426 1,851,803 8.4%7 General Service - Large 1,883,202 1,898,009 14,807 0.8%8 Special Contract 125,361 125,361 0 0.0%9 TR-1 Transport 2,408,782 2,442,382 33,600 1.4%
10 TR-2 Transport 2,614,176 2,614,176 0 0.0%11 TR-3 Transport 1,683,099 1,683,099 0 0.0%12 Aggregated - Residential 14,249 15,438 1,188 8.3%13 Aggregated - General Service - Small 1,849,310 2,598,989 749,678 40.5%14 Aggregated - General Service - Large 42,425 42,242 (183) -0.4%15 Choice - Residential 7,422,614 8,055,531 632,917 8.5%16 Choice - General Service - Small 4,431,103 5,539,392 1,108,289 25.0%17 Choice - General Service - Large 0 0 0 0.0%18 Choice - Multi-Family - Class I 8,708 10,768 2,060 23.7%19 Choice - Multi-Family - Class II 33,385 38,931 5,545 16.6%20 Choice - Multi-Family - Class III 0 0 0 0.0%21 Choice - Multi-Family - Class IV 68,455 84,889 16,434 24.0%2223 TOTAL MGUC $133,757,461 $141,794,272 $8,036,811 6.0%2425 Note: Gas costs are included in both the Current Revenues or the Proposed Revenues above.

Schedule F2.2Michigan Public Service Commission Case No.: U-17273Michigan Gas Utilities Corporation Exhibit No.: A-6 (DJT-1)Summary of Present and Proposed Revenue by Rate Schedule Schedule: F2.2Excluding Cost of Gas Page: 1 of 1
Witness: D.J. Tyler
Current Proposed Revenue RevenueLine Revenue Revenue Increase IncreaseNo. MGUC Rate Schedule $ $ $ %
1 Residential $34,092,459 $37,603,782 $3,511,323 10.3%2 Multi-Family Class I 41,705 55,663 13,959 33.5%3 Multi-Family Class II 214,612 279,978 65,366 30.5%4 Multi-Family Class III 51,217 62,602 11,384 22.2%5 Multi-Family Class IV 67,007 85,648 18,641 27.8%6 General Service - Small 6,711,263 8,563,066 1,851,803 27.6%7 General Service - Large 388,399 403,206 14,807 3.8%8 Special Contract 123,770 123,770 0 0.0%9 TR-1 Transport 2,408,782 2,442,382 33,600 1.4%
10 TR-2 Transport 2,614,176 2,614,176 0 0.0%11 TR-3 Transport 1,683,099 1,683,099 0 0.0%12 Aggregated - Residential 14,249 15,438 1,188 8.3%13 Aggregated - General Service - Small 1,849,310 2,598,989 749,678 40.5%14 Aggregated - General Service - Large 42,425 42,242 (183) -0.4%15 Choice - Residential 7,422,614 8,055,531 632,917 8.5%16 Choice - General Service - Small 4,431,103 5,539,392 1,108,289 25.0%17 Choice - General Service - Large 0 0 0 0.0%18 Choice - Multi-Family - Class I 8,708 10,768 2,060 23.7%19 Choice - Multi-Family - Class II 33,385 38,931 5,545 16.6%20 Choice - Multi-Family - Class III 0 0 0 0.0%21 Choice - Multi-Family - Class IV 68,455 84,889 16,434 24.0%2223 TOTAL MGUC $62,266,739 $70,303,551 $8,036,811 12.9%2425 Note: No gas costs are included in either the Current Revenues or the Proposed Revenues above.

Schedule F3.1
Michigan Public Service Commission Case No.: U-17273Michigan Gas Utilities Corporation Exhibit No.: A-6 (DJT-1)Present and Proposed Revenue Detail Including Cost of Gas Schedule: F3.1
Page: 1 of 10Witness: D.J. Tyler
(a) (c) (d) (e) (f)
LineNo. Description Quantity Units Rate Revenue Rate Revenue
1 Residential2 Monthly Customer Charge 1,500,968 Bills $11.00 $16,510,648 $12.00 $18,011,6163 Distribution Charge 10,997,567.2 Mcf 1.5987 17,581,811 1.7265 18,987,3004 Gas Supply Acquisition Charge 10,997,567.2 Mcf 0.0000 0 0.0550 604,8665 Cost of Gas 10,997,567.2 Mcf 4.8862 53,736,313 4.8862 53,736,3136 Total Residential $87,828,772 $91,340,09578 Notice Calculation9 Monthly Customer Charges 12 Bills $11.00 $132 $12.00 $14410 Distribution Charge 88.0 Mcf 1.5987 141 1.7265 15211 Gas Supply Acquisition Charge 88.0 Mcf 0.0000 0 0.0550 512 Cost of Gas 88.0 Mcf 4.8862 430 4.8862 43013 Total Annual Residential Bill $703 $7311415 Annual Residential Increase 4.0% $28.09
16 Monthly Residential Increase 4.0% $2.34
(b)
Billing Determinants Present Proposed

Schedule F3.1
Michigan Public Service Commission Case No.: U-17273Michigan Gas Utilities Corporation Exhibit No.: A-6 (DJT-1)Present and Proposed Revenue Detail Including Cost of Gas Schedule: F3.1
Page: 2 of 10Witness: D.J. Tyler
(a) (c) (d) (e) (f)
Description Quantity Units Rate Revenue Rate Revenue
1 Multi-Family Class I2 Monthly Customer Charge 1,495 Bills $11.00 $16,445 $12.00 $17,9403 Distribution Charge 21,175.0 Mcf 1.1929 25,260 1.7265 36,5594 Gas Supply Acquisition Charge 21,175.0 Mcf 0.0000 0 0.0550 1,1655 Cost of Gas 21,175.0 Mcf 4.8862 103,465 4.8862 103,4656 Total $145,170 $159,12978 Multi-Family Class II9 Monthly Customer Charge 2,489 Bills $33.00 $82,137 $33.00 $82,13710 Distribution Charge 111,053.0 Mcf 1.1929 132,475 1.7265 191,73311 Gas Supply Acquisition Charge 111,053.0 Mcf 0.0000 0 0.0550 6,10812 Cost of Gas 111,053.0 Mcf 4.8862 542,627 4.8862 542,62713 Total $757,239 $822,6051415 Multi-Family Class III16 Monthly Customer Charge 203 Bills $88.00 $17,864 $33.00 $6,69917 Distribution Charge 31,379.7 Mcf 1.0629 33,353 1.7265 54,17718 Gas Supply Acquisition Charge 31,379.7 Mcf 0.0000 0 0.0550 1,72619 Cost of Gas 31,379.7 Mcf 4.8862 153,327 4.8862 153,32720 Total $204,545 $215,9292122 Multi-Family Class IV23 Monthly Customer Charge 129 Bills $143.00 $18,447 $33.00 $4,25724 Distribution Charge 45,686.8 Mcf 1.0629 48,560 1.7265 78,87825 Gas Supply Acquisition Charge 45,686.8 Mcf 0.0000 0 0.0550 2,51326 Cost of Gas 45,686.8 Mcf 4.8862 223,235 4.8862 223,23527 Total $290,242 $308,8832829 Total Multi-Family $1,397,197 $1,506,546
(b)
Billing Determinants Present Proposed

Schedule F3.1
Michigan Public Service Commission Case No.: U-17273Michigan Gas Utilities Corporation Exhibit No.: A-6 (DJT-1)Present and Proposed Revenue Detail Including Cost of Gas Schedule: F3.1
Page: 3 of 10Witness: D.J. Tyler
(a) (c) (d) (e) (f)
LineNo. Description Quantity Units Rate Revenue Rate Revenue
1 General Service - Small2 Monthly Customer Charge 91,160 Bills $33.00 $3,008,280 $33.00 $3,008,2803 Distribution Charge 3,118,038.6 Mcf 1.1876 3,702,983 1.7265 5,383,2944 Gas Supply Acquisition Charge 3,118,038.6 Mcf 0.0000 0 0.0550 171,4925 Cost of Gas 3,118,038.6 Mcf 4.8862 15,235,360 4.8862 15,235,3606 Total General Service - Small $21,946,623 $23,798,426
(b)
Billing Determinants Present Proposed

Schedule F3.1
Michigan Public Service Commission Case No.: U-17273Michigan Gas Utilities Corporation Exhibit No.: A-6 (DJT-1)Present and Proposed Revenue Detail Including Cost of Gas Schedule: F3.1
Page: 4 of 10Witness: D.J. Tyler
(a) (c) (d) (e) (f)
LineNo. Description Quantity Units Rate Revenue Rate Revenue
1 General Service - Large2 Monthly Customer Charge 199 Bills $400.00 $79,600 $400.00 $79,6003 Distribution Charge 305,923.4 Mcf 1.0094 308,799 1.0028 306,7804 Gas Supply Acquisition Charge 305,923.4 Mcf 0.0000 0 0.0550 16,8265 Cost of Gas 305,923.4 Mcf 4.8862 1,494,803 4.8862 1,494,8036 Total General Service - Large $1,883,202 $1,898,009
(b)
Billing Determinants Present Proposed

Schedule F3.1
Michigan Public Service Commission Case No.: U-17273Michigan Gas Utilities Corporation Exhibit No.: A-6 (DJT-1)Present and Proposed Revenue Detail Including Cost of Gas Schedule: F3.1
Page: 5 of 10Witness: D.J. Tyler
(a) (c) (d) (e) (f)
LineNo. Description Quantity Units Rate Revenue Rate Revenue
1 Special Contract2 Monthly Customer Charge 12 Bills $10,287.68 $123,452 $10,287.68 $123,4523 Distribution Charge 325.6 Mcf 0.9776 318 0.9776 3184 Gas Supply Acquisition Charge 325.6 Mcf 0.0000 0 0.0000 05 Cost of Gas 325.6 Mcf 4.8862 1,591 4.8862 1,5916 Total Special Contract $125,361 $125,361
(b)
Billing Determinants Present Proposed

Schedule F3.1
Michigan Public Service Commission Case No.: U-17273Michigan Gas Utilities Corporation Exhibit No.: A-6 (DJT-1)Present and Proposed Revenue Detail Including Cost of Gas Schedule: F3.1
Page: 6 of 10Witness: D.J. Tyler
(a) (c) (d) (e) (f)
LineNo. Description Quantity Units Rate Revenue Rate Revenue
1 TR-1 Transport2 Customer Charge 1,344 Bills $825.00 $1,108,800 $850.00 $1,142,4003 Distribution Charge - Peak 1,045,579.6 Mcf 0.7777 813,147 0.7777 813,1474 Off Peak 775,585.3 Mcf 0.6277 486,835 0.6277 486,8355 Total TR-1 Transport $2,408,782 $2,442,382
(b)
Billing Determinants Present Proposed

Schedule F3.1
Michigan Public Service Commission Case No.: U-17273Michigan Gas Utilities Corporation Exhibit No.: A-6 (DJT-1)Present and Proposed Revenue Detail Including Cost of Gas Schedule: F3.1
Page: 7 of 10Witness: D.J. Tyler
(a) (c) (d) (e) (f)
LineNo. Description Quantity Units Rate Revenue Rate Revenue
1 TR-2 Transport2 Customer Charge 468 Bills 2,250.00$ $1,053,000 2,250.00$ $1,053,0003 Distribution Charge - Peak 1,874,755.6 Mcf 0.4796 899,133 0.4796 899,1334 Off Peak 2,008,625.4 Mcf 0.3296 662,043 0.3296 662,0435 Total TR-2 Transport $2,614,176 $2,614,176
(b)
Billing Determinants Present Proposed

Schedule F3.1
Michigan Public Service Commission Case No.: U-17273Michigan Gas Utilities Corporation Exhibit No.: A-6 (DJT-1)Present and Proposed Revenue Detail Including Cost of Gas Schedule: F3.1
Page: 8 of 10Witness: D.J. Tyler
(a) (c) (d) (e) (f)
LineNo. Description Quantity Units Rate Revenue Rate Revenue
1 TR-3 Transport2 Customer Charge 84 Bills 3,050.00$ $256,200 3,050.00$ $256,2003 Distribution Charge - Peak 1,654,891.4 Mcf 0.4651 769,690 0.4651 769,6904 Off Peak 2,085,715.6 Mcf 0.3151 657,209 0.3151 657,2095 Total TR-3 Transport $1,683,099 $1,683,099
(b)
Billing Determinants Present Proposed

Schedule F3.1
Michigan Public Service Commission Case No.: U-17273Michigan Gas Utilities Corporation Exhibit No.: A-6 (DJT-1)Present and Proposed Revenue Detail Including Cost of Gas Schedule: F3.1
Page: 9 of 10Witness: D.J. Tyler
(a) (c) (d) (e) (f)
LineNo. Description Quantity Units Rate Revenue Rate Revenue
1 Aggregated - Residential2 Customer Charge 408 Bills 11.00$ $4,488 12.00$ $4,8963 Distribution Charge 6,105.8 Mcf 1.5987 9,761 1.7265 10,5424 Total $14,249 $15,43856 Aggregated - General Service - Small7 Customer Charge 5,976 Bills 33.00 $197,208 33.00 197,208$ 8 Distribution Charge 1,391,127.0 Mcf 1.1876 1,652,102 1.7265 2,401,7819 Total $1,849,310 $2,598,9891011 Aggregated - General Service - Large12 Customer Charge 36 Bills 400.00 $14,400 400.00 14,400$ 13 Distribution Charge 27,764.2 Mcf 1.0094 28,025 1.0028 27,84214 Total $42,425 $42,2421516 Total Aggregated $1,905,985 $2,656,668
(b)
Billing Determinants Present Proposed

Schedule F3.1
Michigan Public Service Commission Case No.: U-17273Michigan Gas Utilities Corporation Exhibit No.: A-6 (DJT-1)Present and Proposed Revenue Detail Including Cost of Gas Schedule: F3.1
Page: 10 of 10Witness: D.J. Tyler
(a) (c) (d) (e) (f)
LineNo. Description Quantity Units Rate Revenue Rate Revenue
1 Choice - Residential2 Customer Charge 327,805 Bills 11.00$ $3,605,855 12.00$ $3,933,6603 Distribution Charge 2,387,414.3 Mcf 1.5987 3,816,759 1.7265 4,121,8714 Total $7,422,614 $8,055,53156 Choice - General Service - Small7 Customer Charge 60,264 Bills 33.00 $1,988,712 33.00 $1,988,7128 Distribution Charge 2,056,576.8 Mcf 1.1876 2,442,391 1.7265 3,550,6809 Total $4,431,103 $5,539,3921011 Choice - General Service - Large12 Customer Charge 0 Bills 400.00 $0 400.00 $013 Distribution Charge 0.0 Mcf 1.0094 0 1.0028 014 Total $0 $01516 Choice - Multi-Family - Class I17 Customer Charge 468 Bills 11.00$ $5,148 12.00$ $5,61618 Distribution Charge 2,984.0 Mcf 1.1929 3,560 1.7265 5,15219 Total $8,708 $10,7682021 Choice - Multi-Family - Class II22 Customer Charge 636 Bills 33.00 $20,988 33.00 $20,98823 Distribution Charge 10,392.5 Mcf 1.1929 12,397 1.7265 17,94324 Total $33,385 $38,9312526 Choice - Multi-Family - Class III27 Customer Charge 0 Bills 88.00 $0 33.00 $028 Distribution Charge 0.0 Mcf 1.0629 0 1.7265 029 Total $0 $03031 Choice - Multi-Family - Class IV32 Customer Charge 132 Bills 143.00 $18,876 33.00 $4,35633 Distribution Charge 46,645.3 Mcf 1.0629 49,579 1.7265 80,53334 Total $68,455 $84,8893536 Total Choice $11,964,265 $13,729,5103738 MGUC Totals39 Monthly Customer Charge 1,994,276 Bills $28,130,548 $29,955,41740 Distribution Charge 30,005,312.1 Mcf 34,136,191 39,543,43841 Gas Supply Acquisition Charge 14,631,149.3 Mcf 0 804,69542 Cost of Gas 14,631,149.3 Mcf 71,490,722 71,490,72243 Total MGUC $133,757,461 $141,794,272
(b)
Billing Determinants Present Proposed

Schedule F3.2
Michigan Public Service Commission Case No.: U-17273Michigan Gas Utilities Corporation Exhibit No.: A-6 (DJT-1)Present and Proposed Revenue Detail Excluding Cost of Gas Schedule: F3.2
Page: 1 of 10Witness: D.J. Tyler
(a) (c) (d) (e) (f)
LineNo. Description Quantity Units Rate Revenue Rate Revenue
1 Residential2 Monthly Customer Charge 1,500,968 Bills $11.00 $16,510,648 $12.00 $18,011,6163 Distribution Charge 10,997,567.2 Mcf 1.5987 17,581,811 1.7265 18,987,3004 Gas Supply Acquisition Charge 10,997,567.2 Mcf 0.0000 0 0.0550 604,8665 Cost of Gas 10,997,567.2 Mcf 0.0000 0 0.0000 06 Total Residential $34,092,459 $37,603,78278 Notice Calculation9 Monthly Customer Charges 12 Bills $11.00 $132 $12.00 $14410 Distribution Charge 88.0 Mcf 1.5987 141 1.7265 15211 Gas Supply Acquisition Charge 88.0 Mcf 0.0000 0 0.0550 512 Cost of Gas 88.0 Mcf 0.0000 0 0.0000 013 Total Annual Residential Bill $273 $3011415 Annual Residential Increase $28.09
16 Monthly Residential Increase $2.34
(b)
Billing Determinants Present Proposed

Schedule F3.2
Michigan Public Service Commission Case No.: U-17273Michigan Gas Utilities Corporation Exhibit No.: A-6 (DJT-1)Present and Proposed Revenue Detail Excluding Cost of Gas Schedule: F3.2
Page: 2 of 10Witness: D.J. Tyler
(a) (c) (d) (e) (f)
Description Quantity Units Rate Revenue Rate Revenue
1 Multi-Family Class I2 Monthly Customer Charge 1,495 Bills $11.00 $16,445 $12.00 $17,9403 Distribution Charge 21,175.0 Mcf 1.1929 25,260 1.7265 36,5594 Gas Supply Acquisition Charge 21,175.0 Mcf 0.0000 0 0.0550 1,1655 Cost of Gas 21,175.0 Mcf 0.0000 0 0.0000 06 Total $41,705 $55,66378 Multi-Family Class II9 Monthly Customer Charge 2,489 Bills $33.00 $82,137 $33.00 $82,13710 Distribution Charge 111,053.0 Mcf 1.1929 132,475 1.7265 191,73311 Gas Supply Acquisition Charge 111,053.0 Mcf 0.0000 0 0.0550 6,10812 Cost of Gas 111,053.0 Mcf 0.0000 0 0.0000 013 Total $214,612 $279,9781415 Multi-Family Class III16 Monthly Customer Charge 203 Bills $88.00 $17,864 $33.00 $6,69917 Distribution Charge 31,379.7 Mcf 1.0629 33,353 1.7265 54,17718 Gas Supply Acquisition Charge 31,379.7 Mcf 0.0000 0 0.0550 1,72619 Cost of Gas 31,379.7 Mcf 0.0000 0 0.0000 020 Total $51,217 $62,6022122 Multi-Family Class IV23 Monthly Customer Charge 129 Bills $143.00 $18,447 $33.00 $4,25724 Distribution Charge 45,686.8 Mcf 1.0629 48,560 1.7265 78,87825 Gas Supply Acquisition Charge 45,686.8 Mcf 0.0000 0 0.0550 2,51326 Cost of Gas 45,686.8 Mcf 0.0000 0 0.0000 027 Total $67,007 $85,6482829 Total Multi-Family $374,542 $483,891
(b)
Billing Determinants Present Proposed

Schedule F3.2
Michigan Public Service Commission Case No.: U-17273Michigan Gas Utilities Corporation Exhibit No.: A-6 (DJT-1)Present and Proposed Revenue Detail Excluding Cost of Gas Schedule: F3.2
Page: 3 of 10Witness: D.J. Tyler
(a) (c) (d) (e) (f)
LineNo. Description Quantity Units Rate Revenue Rate Revenue
1 General Service - Small2 Monthly Customer Charge 91,160 Bills $33.00 $3,008,280 $33.00 $3,008,2803 Distribution Charge 3,118,038.6 Mcf 1.1876 3,702,983 1.7265 5,383,2944 Gas Supply Acquisition Charge 3,118,038.6 Mcf 0.0000 0 0.0550 171,4925 Cost of Gas 3,118,038.6 Mcf 0.0000 0 0.0000 06 Total General Service - Small $6,711,263 $8,563,066
(b)
Billing Determinants Present Proposed

Schedule F3.2
Michigan Public Service Commission Case No.: U-17273Michigan Gas Utilities Corporation Exhibit No.: A-6 (DJT-1)Present and Proposed Revenue Detail Excluding Cost of Gas Schedule: F3.2
Page: 4 of 10Witness: D.J. Tyler
(a) (c) (d) (e) (f)
LineNo. Description Quantity Units Rate Revenue Rate Revenue
1 General Service - Large2 Monthly Customer Charge 199 Bills $400.00 $79,600 $400.00 $79,6003 Distribution Charge 305,923.4 Mcf 1.0094 308,799 1.0028 306,7804 Gas Supply Acquisition Charge 305,923.4 Mcf 0.0000 0 0.0550 16,8265 Cost of Gas 305,923.4 Mcf 0.0000 0 0.0000 06 Total General Service - Large $388,399 $403,206
Present Proposed
(b)
Billing Determinants

Schedule F3.2
Michigan Public Service Commission Case No.: U-17273Michigan Gas Utilities Corporation Exhibit No.: A-6 (DJT-1)Present and Proposed Revenue Detail Excluding Cost of Gas Schedule: F3.2
Page: 5 of 10Witness: D.J. Tyler
(a) (c) (d) (e) (f)
LineNo. Description Quantity Units Rate Revenue Rate Revenue
1 Special Contract2 Monthly Customer Charge 12 Bills $10,287.68 $123,452 $10,287.68 $123,4523 Distribution Charge 325.6 Mcf 0.9776 318 0.9776 3184 Gas Supply Acquisition Charge 325.6 Mcf 0.0000 0 0.0000 05 Cost of Gas 325.6 Mcf 0.0000 0 0.0000 06 Total Special Contract $123,770 $123,770
(b)
Billing Determinants Present Proposed

Schedule F3.2
Michigan Public Service Commission Case No.: U-17273Michigan Gas Utilities Corporation Exhibit No.: A-6 (DJT-1)Present and Proposed Revenue Detail Excluding Cost of Gas Schedule: F3.2
Page: 6 of 10Witness: D.J. Tyler
(a) (c) (d) (e) (f)
LineNo. Description Quantity Units Rate Revenue Rate Revenue
1 TR-1 Transport2 Customer Charge 1,344 Bills $825.00 $1,108,800 $850.00 $1,142,4003 Distribution Charge - Peak 1,045,579.6 Mcf 0.7777 813,147 0.7777 813,1474 Off Peak 775,585.3 Mcf 0.6277 486,835 0.6277 486,8355 Total TR-1 Transport $2,408,782 $2,442,382
(b)
Billing Determinants Present Proposed

Schedule F3.2
Michigan Public Service Commission Case No.: U-17273Michigan Gas Utilities Corporation Exhibit No.: A-6 (DJT-1)Present and Proposed Revenue Detail Excluding Cost of Gas Schedule: F3.2
Page: 7 of 10Witness: D.J. Tyler
(a) (c) (d) (e) (f)
LineNo. Description Quantity Units Rate Revenue Rate Revenue
1 TR-2 Transport2 Customer Charge 468 Bills 2,250.00$ $1,053,000 2,250.00$ $1,053,0003 Distribution Charge - Peak 1,874,755.6 Mcf 0.4796 899,133 0.4796 899,1334 Off Peak 2,008,625.4 Mcf 0.3296 662,043 0.3296 662,0435 Total TR-2 Transport $2,614,176 $2,614,176
(b)
Billing Determinants Present Proposed

Schedule F3.2
Michigan Public Service Commission Case No.: U-17273Michigan Gas Utilities Corporation Exhibit No.: A-6 (DJT-1)Present and Proposed Revenue Detail Excluding Cost of Gas Schedule: F3.2
Page: 8 of 10Witness: D.J. Tyler
(a) (c) (d) (e) (f)
LineNo. Description Quantity Units Rate Revenue Rate Revenue
1 TR-3 Transport2 Customer Charge 84 Bills 3,050.00$ $256,200 3,050.00$ $256,2003 Distribution Charge - Peak 1,654,891.4 Mcf 0.4651 769,690 0.4651 769,6904 Off Peak 2,085,715.6 Mcf 0.3151 657,209 0.3151 657,2095 Total TR-3 Transport $1,683,099 $1,683,099
Present Proposed
(b)
Billing Determinants

Schedule F3.2
Michigan Public Service Commission Case No.: U-17273Michigan Gas Utilities Corporation Exhibit No.: A-6 (DJT-1)Present and Proposed Revenue Detail Excluding Cost of Gas Schedule: F3.2
Page: 9 of 10Witness: D.J. Tyler
(a) (c) (d) (e) (f)
LineNo. Description Quantity Units Rate Revenue Rate Revenue
1 Aggregated - Residential2 Customer Charge 408 Bills 11.00$ $4,488 12.00$ $4,8963 Distribution Charge 6,105.8 Mcf 1.5987 9,761 1.7265 10,5424 Total $14,249 $15,43856 Aggregated - General Service - Small7 Customer Charge 5,976 Bills 33.00 $197,208 33.00 197,208$ 8 Distribution Charge 1,391,127.0 Mcf 1.1876 1,652,102 1.7265 2,401,7819 Total $1,849,310 $2,598,9891011 Aggregated - General Service - Large12 Customer Charge 36 Bills 400.00 $14,400 400.00 14,400$ 13 Distribution Charge 27,764.2 Mcf 1.0094 28,025 1.0028 27,84214 Total $42,425 $42,2421516 Total Aggregated $1,905,985 $2,656,668
(b)
Billing Determinants Present Proposed

Schedule F3.2
Michigan Public Service Commission Case No.: U-17273Michigan Gas Utilities Corporation Exhibit No.: A-6 (DJT-1)Present and Proposed Revenue Detail Excluding Cost of Gas Schedule: F3.2
Page: 10 of 10Witness: D.J. Tyler
(a) (c) (d) (e) (f)
LineNo. Description Quantity Units Rate Revenue Rate Revenue
1 Choice - Residential2 Customer Charge 327,805 Bills 11.00$ $3,605,855 12.00$ $3,933,6603 Distribution Charge 2,387,414.3 Mcf 1.5987 3,816,759 1.7265 4,121,8714 Total $7,422,614 $8,055,53156 Choice - General Service - Small7 Customer Charge 60,264 Bills 33.00 $1,988,712 33.00 $1,988,7128 Distribution Charge 2,056,576.8 Mcf 1.1876 2,442,391 1.7265 3,550,6809 Total $4,431,103 $5,539,3921011 Choice - General Service - Large12 Customer Charge 0 Bills 400.00 $0 400.00 $013 Distribution Charge 0.0 Mcf 1.0094 0 1.0028 014 Total $0 $01516 Choice - Multi-Family - Class I17 Customer Charge 468 Bills 11.00$ $5,148 12.00$ $5,61618 Distribution Charge 2,984.0 Mcf 1.1929 3,560 1.7265 5,15219 Total $8,708 $10,7682021 Choice - Multi-Family - Class II22 Customer Charge 636 Bills 33.00 $20,988 33.00 $20,98823 Distribution Charge 10,392.5 Mcf 1.1929 12,397 1.7265 17,94324 Total $33,385 $38,9312526 Choice - Multi-Family - Class III27 Customer Charge 0 Bills 88.00 $0 33.00 $028 Distribution Charge 0.0 Mcf 1.0629 0 1.7265 029 Total $0 $03031 Choice - Multi-Family - Class IV32 Customer Charge 132 Bills 143.00 $18,876 33.00 $4,35633 Distribution Charge 46,645.3 Mcf 1.0629 49,579 1.7265 80,53334 Total $68,455 $84,8893536 Total Choice $11,964,265 $13,729,5103738 MGUC Totals39 Monthly Customer Charge 1,994,276 Bills $28,130,548 $29,955,41740 Distribution Charge 30,005,312.1 Mcf 34,136,191 39,543,43841 Gas Supply Acquisition Charge 14,631,149.3 Mcf 0 804,69542 Cost of Gas 14,631,149.3 Mcf 0 043 Total MGUC $62,266,739 $70,303,551
(b)
Billing Determinants Present Proposed

Schedule F4Michigan Public Service Commission Case No.: U-17273Michigan Gas Utilities Corporation Exhibit No.: A-6 (DJT-1)Comparison of Present and Proposed Monthly Bills Schedule: F4
Page: 1 of 8RESIDENTIAL Service Rate Witness: D.J. Tyler
(a) (b) (c) (d) (e) (f)
Line Monthly Present Net Proposed Net UnitNo. Usage Monthly Bill Monthly Bill Amount Percent Cost
(Mcf) ($/Month) ($/Month) ($/Month) (%) ($/Mcf)
1 0 $11.00 $12.00 $1.00 9.09%2 2 23.97 25.34 1.37 5.70% $12.673 5 43.42 45.34 1.91 4.41% 9.074 7 56.39 58.67 2.28 4.04% 8.385 10 75.85 78.68 2.83 3.73% 7.876 15 108.27 112.02 3.74 3.46% 7.477 20 140.70 145.35 4.66 3.31% 7.278 25 173.12 178.69 5.57 3.22% 7.159 30 205.55 212.03 6.48 3.15% 7.07
Increase

Schedule F4Michigan Public Service Commission Case No.: U-17273Michigan Gas Utilities Corporation Exhibit No.: A-6 (DJT-1)Comparison of Present and Proposed Monthly Bills Schedule: F4
Page: 2 of 8MULTI-FAMILY Service Rate Witness: D.J. Tyler
(a) (b) (c) (d) (e) (f) (g)
Monthly Present Net Proposed Net Increase UnitLine Meter Usage Monthly Bill Monthly Bill Amount Percent CostNo. Class (Mcf) ($/Month) ($/Month) ($/Month) (%) ($/Mcf)
1 Multi-Family Class I 0 $11.00 $12.00 $1.00 9.09%2 Multi-Family Class I 5 41.40 45.34 3.94 9.53% $9.073 Multi-Family Class I 10 71.79 78.68 6.89 9.59% 7.874 Multi-Family Class I 20 132.58 145.35 12.77 9.63% 7.275 Multi-Family Class I 35 223.77 245.37 21.60 9.65% 7.0167 Multi-Family Class II 0 33.00 33.00 0.00 0.00%8 Multi-Family Class II 10 93.79 99.68 5.89 6.28% 9.979 Multi-Family Class II 25 184.98 199.69 14.72 7.96% 7.9910 Multi-Family Class II 50 336.96 366.39 29.43 8.73% 7.3311 Multi-Family Class II 100 640.91 699.77 58.86 9.18% 7.001213 Multi-Family Class III 0 88.00 33.00 (55.00) -62.50%14 Multi-Family Class III 25 236.73 199.69 (37.04) -15.64% 7.9915 Multi-Family Class III 50 385.46 366.39 (19.07) -4.95% 7.3316 Multi-Family Class III 100 682.91 699.77 16.86 2.47% 7.0017 Multi-Family Class III 200 1,277.82 1,366.54 88.72 6.94% 6.8318 Multi-Family Class III 250 1,575.28 1,699.93 124.65 7.91% 6.801920 Multi-Family Class IV 0 143.00 33.00 (110.00) -76.92%21 Multi-Family Class IV 25 291.73 199.69 (92.04) -31.55% 7.9922 Multi-Family Class IV 50 440.46 366.39 (74.07) -16.82% 7.3323 Multi-Family Class IV 100 737.91 699.77 (38.14) -5.17% 7.0024 Multi-Family Class IV 200 1,332.82 1,366.54 33.72 2.53% 6.8325 Multi-Family Class IV 250 1,630.28 1,699.93 69.65 4.27% 6.80

Schedule F4Michigan Public Service Commission Case No.: U-17273Michigan Gas Utilities Corporation Exhibit No.: A-6 (DJT-1)Comparison of Present and Proposed Monthly Bills Schedule: F4
Page: 3 of 8SMALL GENERAL SERVICE Rate Witness: D.J. Tyler
(a) (b) (c) (d) (e) (f)
Line Monthly Present Net Proposed Net UnitNo. Usage Monthly Bill Monthly Bill Amount Percent Cost
(Mcf) ($/Month) ($/Month) ($/Month) (%) ($/Mcf)
1 0 $33.00 $33.00 $0.00 0.00%2 10 93.74 99.68 5.94 6.34% $9.973 25 184.85 199.69 14.85 8.03% 7.994 50 336.69 366.39 29.70 8.82% 7.335 75 488.54 533.08 44.54 9.12% 7.116 100 640.38 699.77 59.39 9.27% 7.00
Increase

Schedule F4Michigan Public Service Commission Case No.: U-17273Michigan Gas Utilities Corporation Exhibit No.: A-6 (DJT-1)Comparison of Present and Proposed Monthly Bills Schedule: F4
Page: 4 of 8LARGE GENERAL SERVICE Rate Witness: D.J. Tyler
(a) (b) (c) (d) (e) (f)
Line Monthly Present Net Proposed Net UnitNo. Usage Monthly Bill Monthly Bill Amount Percent Cost
(Mcf) ($/Month) ($/Month) ($/Month) (%) ($/Mcf)
1 0 $400.00 $400.00 $0.00 0.00%2 10 458.96 459.44 0.48 0.11% $45.943 50 694.78 697.20 2.42 0.35% 13.944 100 989.56 994.40 4.84 0.49% 9.945 250 1,873.90 1,886.00 12.10 0.65% 7.546 500 3,347.80 3,372.00 24.20 0.72% 6.747 750 4,821.70 4,858.00 36.30 0.75% 6.488 1,000 6,295.60 6,344.00 48.40 0.77% 6.349 1,250 7,769.50 7,830.00 60.50 0.78% 6.2610 1,500 9,243.40 9,316.00 72.60 0.79% 6.21
Increase

Schedule F4Michigan Public Service Commission Case No.: U-17273Michigan Gas Utilities Corporation Exhibit No.: A-6 (DJT-1)Comparison of Present and Proposed Monthly Bills Schedule: F4
Page: 5 of 8TRANSPORT Service Rate Witness: D.J. Tyler
(a) (b) (c) (d) (e) (f) (g)
Monthly Present Net Proposed Net Increase UnitLine Meter Usage Monthly Bill Monthly Bill Amount Percent CostNo. Class (Mcf) ($/Month) ($/Month) ($/Month) (%) ($/Mcf)
1 TR-1 Transport 0 825.00 850.00 $25.00 3.03%2 TR-1 Transport 500 1,181.91 1,206.91 25.00 2.12% $2.413 TR-1 Transport 1,000 1,538.82 1,563.82 25.00 1.62% 1.564 TR-1 Transport 2,000 2,252.64 2,277.64 25.00 1.11% 1.145 TR-1 Transport 3,000 2,966.46 2,991.46 25.00 0.84% 1.0067 TR-2 Transport 0 2,250.00 2,250.00 0.00 0.00%8 TR-2 Transport 1,000 2,652.01 2,652.01 0.00 0.00% 2.659 TR-2 Transport 2,500 3,255.04 3,255.04 0.00 0.00% 1.3010 TR-2 Transport 5,000 4,260.07 4,260.07 0.00 0.00% 0.8511 TR-2 Transport 10,000 6,270.15 6,270.15 0.00 0.00% 0.631213 TR-3 Transport 0 3,050.00 3,050.00 0.00 0.00%14 TR-3 Transport 2,500 4,003.65 4,003.65 0.00 0.00% 1.6015 TR-3 Transport 5,000 4,957.31 4,957.31 0.00 0.00% 0.9916 TR-3 Transport 10,000 6,864.62 6,864.62 0.00 0.00% 0.6917 TR-3 Transport 25,000 12,586.55 12,586.55 0.00 0.00% 0.5018 TR-3 Transport 50,000 22,123.09 22,123.09 0.00 0.00% 0.4419 TR-3 Transport 75,000 31,659.64 31,659.64 0.00 0.00% 0.42

Schedule F4Michigan Public Service Commission Case No.: U-17273Michigan Gas Utilities Corporation Exhibit No.: A-6 (DJT-1)Comparison of Present and Proposed Monthly Bills Schedule: F4
Page: 6 of 8AGGREGATED TRANSPORT Service Rate Witness: D.J. Tyler
(a) (b) (c) (d) (e) (f) (g)
Monthly Present Net Proposed Net Increase UnitLine Meter Usage Monthly Bill Monthly Bill Amount Percent CostNo. Class (Mcf) ($/Month) ($/Month) ($/Month) (%) ($/Mcf)
1 Aggregated - Residential 0 $11.00 $12.00 $1.00 9.09%2 Aggregated - Residential 2 14.20 15.45 1.26 8.84% $7.733 Aggregated - Residential 5 18.99 20.63 1.64 8.63% 4.134 Aggregated - Residential 7 22.19 24.09 1.89 8.54% 3.445 Aggregated - Residential 10 26.99 29.27 2.28 8.44% 2.936 Aggregated - Residential 15 34.98 37.90 2.92 8.34% 2.537 Aggregated - Residential 20 42.97 46.53 3.56 8.27% 2.338 Aggregated - Residential 25 50.97 55.16 4.20 8.23% 2.219 Aggregated - Residential 30 58.96 63.80 4.83 8.20% 2.131011 Aggregated - General Service - Small 0 33.00 33.00 0.00 0.00%12 Aggregated - General Service - Small 10 44.88 50.27 5.39 12.01% 5.0313 Aggregated - General Service - Small 25 62.69 76.16 13.47 21.49% 3.0514 Aggregated - General Service - Small 50 92.38 119.33 26.95 29.17% 2.3915 Aggregated - General Service - Small 75 122.07 162.49 40.42 33.11% 2.1716 Aggregated - General Service - Small 100 151.76 205.65 53.89 35.51% 2.061718 Aggregated - General Service - Large 0 400.00 400.00 0.00 0.00%19 Aggregated - General Service - Large 10 410.09 410.03 (0.07) -0.02% 41.0020 Aggregated - General Service - Large 50 450.47 450.14 (0.33) -0.07% 9.0021 Aggregated - General Service - Large 100 500.94 500.28 (0.66) -0.13% 5.0022 Aggregated - General Service - Large 250 652.35 650.70 (1.65) -0.25% 2.6023 Aggregated - General Service - Large 500 904.70 901.40 (3.30) -0.36% 1.8024 Aggregated - General Service - Large 750 1,157.05 1,152.10 (4.95) -0.43% 1.5425 Aggregated - General Service - Large 1,000 1,409.40 1,402.80 (6.60) -0.47% 1.4026 Aggregated - General Service - Large 1,250 1,661.75 1,653.50 (8.25) -0.50% 1.3227 Aggregated - General Service - Large 1,500 1,914.10 1,904.20 (9.90) -0.52% 1.27

Schedule F4Michigan Public Service Commission Case No.: U-17273Michigan Gas Utilities Corporation Exhibit No.: A-6 (DJT-1)Comparison of Present and Proposed Monthly Bills Schedule: F4
Page: 7 of 8CHOICE Service Rates Witness: D.J. Tyler
(a) (b) (c) (d) (e) (f) (g)
Monthly Present Net Proposed Net Increase UnitLine Meter Usage Monthly Bill Monthly Bill Amount Percent CostNo. Class (Mcf) ($/Month) ($/Month) ($/Month) (%) ($/Mcf)
1 Choice - Residential 0 $11.00 $12.00 $1.00 9.09%2 Choice - Residential 2 14.20 15.45 1.26 8.84% $7.733 Choice - Residential 5 18.99 20.63 1.64 8.63% 4.134 Choice - Residential 7 22.19 24.09 1.89 8.54% 3.445 Choice - Residential 10 26.99 29.27 2.28 8.44% 2.936 Choice - Residential 15 34.98 37.90 2.92 8.34% 2.537 Choice - Residential 20 42.97 46.53 3.56 8.27% 2.338 Choice - Residential 25 50.97 55.16 4.20 8.23% 2.219 Choice - Residential 30 58.96 63.80 4.83 8.20% 2.131011 Choice - General Service - Small 0 33.00 33.00 0.00 0.00%12 Choice - General Service - Small 10 44.88 50.27 5.39 12.01% 5.0313 Choice - General Service - Small 25 62.69 76.16 13.47 21.49% 3.0514 Choice - General Service - Small 50 92.38 119.33 26.95 29.17% 2.3915 Choice - General Service - Small 75 122.07 162.49 40.42 33.11% 2.1716 Choice - General Service - Small 100 151.76 205.65 53.89 35.51% 2.061718 Choice - General Service - Large 0 400.00 400.00 0.00 0.00%19 Choice - General Service - Large 10 410.09 410.03 (0.07) -0.02% 41.0020 Choice - General Service - Large 50 450.47 450.14 (0.33) -0.07% 9.0021 Choice - General Service - Large 100 500.94 500.28 (0.66) -0.13% 5.0022 Choice - General Service - Large 250 652.35 650.70 (1.65) -0.25% 2.6023 Choice - General Service - Large 500 904.70 901.40 (3.30) -0.36% 1.8024 Choice - General Service - Large 750 1,157.05 1,152.10 (4.95) -0.43% 1.5425 Choice - General Service - Large 1,000 1,409.40 1,402.80 (6.60) -0.47% 1.4026 Choice - General Service - Large 1,250 1,661.75 1,653.50 (8.25) -0.50% 1.3227 Choice - General Service - Large 1,500 1,914.10 1,904.20 (9.90) -0.52% 1.27

Schedule F4Michigan Public Service Commission Case No.: U-17273Michigan Gas Utilities Corporation Exhibit No.: A-6 (DJT-1)Comparison of Present and Proposed Monthly Bills Schedule: F4
Page: 8 of 8CHOICE Service Rate Witness: D.J. Tyler
(a) (b) (c) (d) (e) (f) (g)
Monthly Present Net Proposed Net Increase UnitLine Meter Usage Monthly Bill Monthly Bill Amount Percent CostNo. Class (Mcf) ($/Month) ($/Month) ($/Month) (%) ($/Mcf)
1 Choice - Multi-Family - Class I 0 $11.00 $12.00 1.00 9.09%2 Choice - Multi-Family - Class I 5 16.96 20.63 3.67 21.62% $4.133 Choice - Multi-Family - Class I 10 22.93 29.27 6.34 27.63% 2.934 Choice - Multi-Family - Class I 20 34.86 46.53 11.67 33.48% 2.335 Choice - Multi-Family - Class I 35 52.75 72.43 19.68 37.30% 2.0767 Choice - Multi-Family - Class II 0 33.00 33.00 $0.00 0.00%8 Choice - Multi-Family - Class II 10 44.93 50.27 5.34 11.88% 5.039 Choice - Multi-Family - Class II 25 62.82 76.16 13.34 21.23% 3.0510 Choice - Multi-Family - Class II 50 92.65 119.33 26.68 28.80% 2.3911 Choice - Multi-Family - Class II 100 152.29 205.65 53.36 35.04% 2.061213 Choice - Multi-Family - Class III 0 88.00 33.00 (55.00) -62.50%14 Choice - Multi-Family - Class III 25 114.57 76.16 (38.41) -33.52% 3.0515 Choice - Multi-Family - Class III 50 141.15 119.33 (21.82) -15.46% 2.3916 Choice - Multi-Family - Class III 100 194.29 205.65 11.36 5.85% 2.0617 Choice - Multi-Family - Class III 200 300.58 378.30 77.72 25.86% 1.8918 Choice - Multi-Family - Class III 250 353.73 464.63 110.90 31.35% 1.861920 Choice - Multi-Family - Class IV 0 143.00 33.00 (110.00) -76.92%21 Choice - Multi-Family - Class IV 25 169.57 76.16 (93.41) -55.09% 3.0522 Choice - Multi-Family - Class IV 50 196.15 119.33 (76.82) -39.16% 2.3923 Choice - Multi-Family - Class IV 100 249.29 205.65 (43.64) -17.51% 2.0624 Choice - Multi-Family - Class IV 200 355.58 378.30 22.72 6.39% 1.8925 Choice - Multi-Family - Class IV 250 408.73 464.63 55.90 13.68% 1.86

Case No. U-17273 Witness: David J. Tyler Exhibit A-6 (DJT-1) Schedule F5 Page 1 of 24
MICHIGAN GAS UTILITIES CORPORATION
SUMMARY OF TARIFF CHANGES Tariff Sheet No. Rule No. Paragraph Description of Changes C-23.00 C5.3 Selection of A requirement has been added that a Rate customer’s account must be “current” in order to switch rates or services.
C-24.00 C5.6 Meter Reading Language added to clarify the term “month” as and Billing used for purposes of billing. Periods C-34.00 C11 Payment of Language updated to reflect change in
Customer operating practices. Contribution C-35.00 C11 Connection Fee Language added to clarify fees for multiple
metered installations. D-1.00 D2 Supplemental Provides for Interim Rate Surcharges. Charges D-1.02 D2 Supplemental Moved the EO Surcharge for purposes of Charges tariff organization. D–6.00 D4 Rate New designation added for a Daily Customer
charge. The Customer and Distribution Charges have been updated per the proposed rate design.
D-7.00 D5 Availability & The Multi-Family Dwelling Rate is being
Definitions consolidated under Residential and Small General Services. D-8.00 D5 (all) The Multi-Family Dwelling Rate is being
consolidated under Residential and Small General Services.
D-9.00 D5 (all) The Multi-Family Dwelling Rate is being
consolidated under Residential and Small General Services.

Case No. U-17273 Witness: David J. Tyler Exhibit A-6 (DJT-1) Schedule F5 Page 2 of 24
MICHIGAN GAS UTILITIES CORPORATION
SUMMARY OF TARIFF CHANGES Tariff Sheet No. Rule No. Paragraph Description of Changes D-10.00 D5 (all) The Multi-Family Dwelling Rate is being
consolidated under Residential and Small General Services.
D–11.00 D6 Rate New designation added for a Daily Customer
charge. The Customer and Distribution Charges have been updated per the proposed rate design.
D–13.00 D7 Rate New designation added for a Daily Customer
charge. The Customer and Distribution Charges have been updated per the proposed rate design.
D-15.00 D8 Availability The Distribution Charges have been updated
per the proposed rate design. E-13.00 E5.4 Rates The Monthly Customer charges and
Transportation Rates been revised per the proposed rate design.
E-14.00 E5.7 Gas In Kind The Gas-In-Kind percentage has been
updated for the most recent 5-Year average. E-17.00 E5.10 Authorized Expanded the restrictions on storage
Tolerance Level injections to include November. Restrictions F-2.00 F1.1 General Provisions Language has been added to clarify the
number of pricing pools available and to define the term “Pricing Category”.
Language has been added to clarify that
DDO’s will be issued for each delivery pool behind the Company’s five operating districts associated with a Pricing Category.
The time frame for issuing first of the month
DDO’s has been updated.

Case No. U-17273 Witness: David J. Tyler Exhibit A-6 (DJT-1) Schedule F5 Page 3 of 24
MICHIGAN GAS UTILITIES CORPORATION
SUMMARY OF TARIFF CHANGES Tariff Sheet No. Rule No. Paragraph Description of Changes F-3.00 F1.1 General Provisions Language has been added to clarify that
nominations shall be required for each Pricing Category and associated geographic delivery pool.
A provision has been added for the retention
of Gas-In-Kind applicable to Choice supplies. The potage rate for customer billings has
been updated. F-4.00 F1.1 General Provisions The Gas-In-Kind provisions have been
incorporated into the Annual Reconciliation. F-5.00 F1.1 General Provisions Numeric sequencing has been updated to
reflect insertion of the new provision for Gas In Kind.

Case No. U-17273 Witness: D. J. Tyler Exhibit A-6 (DJT-1) Schedule F5 Page 4 of 24 MICHIGAN GAS UTILITIES CORPORATION Second Revised Sheet No. C-23.00 M.P.S.C. No. 2 – GAS Replaces First Revised Sheet No. C-23.00
Continued From Sheet No. C-22.00
C5.3 Liability. (Contd)
(c) Selection of rate.
The Company will endeavor to assist a customer in the selection of the filed rate which may be most favorable to his requirements, but the responsibility for the selection of the rate lies with the customer and the Company makes no warranty, expressed or implied, as to the rates, classifications or provisions favorable to the future service requirements of the customer.
After the customer has selected the rate under which the customer elects to take service, the customer shall not be permitted to change from that rate to another rate until at least 12 months have elapsed. The customer shall not be permitted to evade this rule by temporarily terminating service. However, the Company may, at its option, waive the provisions of this paragraph where it appears that an earlier change is requested for permanent rather than for temporary or seasonal advantage. The effective date of a rate change under this rule shall be the beginning read date of the next bill issued. The intent of this rule is to prohibit frequent shifts from rate to rate. If a customer is in arrears with the Company, the customer is not eligible to switch rate classifications until arrearages have been paid in full or the Company grants a waiver.
C5.4 Service charge for reconnection of discontinued service For Non-Payment of
Bills (other than theft or tampering).
A charge of $40.00 will be collected by the Company to offset the cost of restoring service during regular working hours to any customer whose previous service has been discontinued for nonpayment of bills or for any other breach by the customer of the Company's Rates, Rules and Regulations. If the customer specifically requests restoration of service after regular working hours and the customer is advised of the increased charge, a restoration charge of $75.00 shall be collected. This charge shall become part of the customer's arrears and will be subject to the same payment requirements applicable thereto.
C5.5 Deposits.
A reasonable cash deposit may be required of Residential customers according to Rules 9 and 10 (R460.109 and R460.110) and of Commercial customers according to Rule 13 (R460.2083), unless waived by the Company upon evidence of satisfactory credit in the opinion of the Company or if the account is guaranteed by a responsible party in lieu of deposit. Such guarantee must be in writing and specify maximum amount guaranteed by guarantor. If the customer refuses or fails to pay the required deposit or furnish a guarantor, the Company may withhold its service or discontinue its service. Interest on deposits from Residential customers shall accrue at the rate of seven percent (7%) per annum and shall be credited semi-annually or upon return of the deposit, whichever occurs first. Interest on deposits for Commercial
Continued on Sheet No. C-24.00 Issued: Effective for Service By J F Schott On and After: VP Regulatory Affairs Issued Under Authority of

Case No. U-17273 Witness: D. J. Tyler Exhibit A-6 (DJT-1) Schedule F5 Page 5 of 24
MICHIGAN GAS UTILITIES CORPORATION Second Revised Sheet No. C-24.00 M.P.S.C. No. 2 – GAS Replaces First Revised Sheet No. C-24.00
Continued from Sheet No. C-23.00 C5.5 Deposits. (contd.)
customers shall accrue at the rate of seven percent (7%) per annum and shall be credited semi-annually or upon return of the deposit, provided that such deposit is held at least six (6) months.
C5.6 Meter Reading and Billing Periods.
Bills shall be rendered once each month as nearly as is possible on a normal monthly period. The term “month” for billing purposes will mean the period between any two consecutive readings to be taken as nearly practicable every 30 days. Reasonable efforts will be made to read the customer's meter at least once in two months on or about the same day of such meter reading month. When, for any reason, an actual meter reading is not obtained, the bill will be estimated on the basis of past service records, adjusted for seasonal variations. When past records are not available, billing will be based upon whatever other data are available. Each account shall be adjusted as necessary each time an actual meter reading is obtained. Bills rendered for gas service for periods when actual meter readings were not obtained, shall have the same force and effect as those based on actual meter readings. Where the Company renders a bill for an elapsed period other than a regular billing period, the rates and charges will be prorated except that a customer who terminates service less than 28 days after the commencement of service will be billed for a month.
C5.7 Payment of Bills.
Bills for gas service furnished by the Company are due 21 days for residential customers and 21 days for non-residential customers from the date the bill is mailed (otherwise specified). Bills of the Company for service are payable at any District Customer Service Office or to a duly authorized “Payment Station” of the Company. Payment Stations are authorized to collect a fee from the customer for accepting payments.
C5.8 Delinquent Bills.
If any bill for gas service remains unpaid for a period of 26 days after it is rendered the Company shall have the right to discontinue such service upon ten days notice in writing of its intentions to so discontinue, and such discontinuance of service may be in effect until such bill has been paid.
C5.9 Charge for Nonsufficient Funds (NSF) Check.
A charge of $20.00 will be levied upon a customer for each check the customer issues the Company in payment for a gas bill when the check is returned to the Company marked NSF or closed account by the financial institution upon which the check is drawn. This charge will become part of the customer's arrears and will be subject to the same requirements applicable thereto.
Continued on Sheet No. C-25.00 Issued: Effective for Service

Case No. U-17273 Witness: D. J. Tyler Exhibit A-6 (DJT-1) Schedule F5 Page 6 of 24
MICHIGAN GAS UTILITIES CORPORATION Second Revised Sheet No. C-34.00 M.P.S.C. No. 2 – GAS Replaces First Revised Sheet No. C-34.00
Continued from Sheet No. C-33.00 C11. CUSTOMER ATTACHMENT PROGRAM
(1) Purpose
The Company proposes to make extension of its gas mains and/or service lines from time to time, at its own cost, to serve applicants whose requirements will not disturb or impair the service to prior users or will not require an expenditure out of proportion to the revenue obtainable there from.
The Company reserves the right to delay or deny a request for service under this rule, if fulfilling such a request could, in the Company's opinion, create conditions potentially adverse to the Company or its customers. Such conditions may include, but are not limited to, safety issues, system operating requirements or capital constraints. The provisions under this Rule are in addition to the existing rules and tariffs for customer gas service.
(2) Customer Contribution
A Customer Contribution shall be required equal to the Connection Fee plus any applicable Fixed Monthly Surcharge plus any Excessive Service Line Fee. The Connection Fee is not considered in the CAP model when calculating the Fixed Monthly Surcharge or Excessive Service Line Fee.
(3) Payment of Customer Contribution
For all customers other than land developers and builders the Customer Contribution shall be paid as follows:
The Connection Fee and the Excessive Service Line Fee are payable in lump sum at the time the service agreement is executed by the customer. The Connection Fee is non-refundable. The Excessive Service Line Fee is refundable if the service line has not been installed. If the service line has been installed, the Excessive Service Line Fee is non-refundable. The Fixed Monthly Surcharge shall be payable monthly throughout the surcharge period. The Fixed Monthly Surcharge will commence on the date that the customer receives gas service Company installs the meter. The customer may at any time elect to pay off the remaining Fixed Monthly Surcharge balance with a lump sum payment equal to the present value of the remaining monthly payments. If the present value of the Fixed Monthly Surcharge is less than $200.00, the Company may require the customer to make a lump sum payment. The Fixed Monthly Surcharge is assessed to the property served such that any subsequent customer requesting gas service at the property address, once notified by the Company of the amount and duration of such surcharge, shall be liable for the Fixed Monthly Surcharge. Such notification may be verbal, written or in the form of a bill which includes the Fixed Monthly Surcharge. Failure of sellers, agents, lessors or other non-company parties to notify a customer of the Fixed Monthly Surcharge shall not relieve the customer's obligation to pay the Fixed Monthly Surcharge. Failure by the customer to timely pay the Fixed Monthly Surcharge shall result in the discontinuation, termination or denial of natural gas service.
Continued on Sheet No. C-35.00 Issued: Effective for Service By J F Schott On and After: VP Regulatory Affairs Issued Under Authority of

Case No. U-17273 Witness: D. J. Tyler Exhibit A-6 (DJT-1) Schedule F5 Page 7 of 24 MICHIGAN GAS UTILITIES CORPORATION Second Revised Sheet No. C-35.00 M.P.S.C. No. 2 – GAS Replaces First Revised No. C-35.00
Continued from Sheet No. C-34.00 C11. Customer Attachment Program (Contd)
(3) Payment of Customer Contribution (Contd) For land developers and builders, the Customer Contribution shall be required in a lump sum in advance of the facility expansion.
(4) Connection Fee
The Connection Fee is equal to $200.00. The Connection Fee is not considered in the CAP Model when calculating the Fixed Monthly Surcharge or Excessive Service Line Fee.
For customers requesting a multiple metered installation, the Connection Fee shall be $100 for each additionalper account.
(5) Excessive Service Line Fee
The Excessive Service Line Fee will be assessed to a customer whose service line requirement is in excess of the Service Line Limit. The Service Line Limit for an individual service line shall be equal to the point at which the cost of the customer’s service requirements are greater than the allowance based on the Cost Of Service Model. The Company reserves the right to use a different Service Line Limit for different categories of customers. In calculating the average service line length for a project containing more than one customer, the maximum length of each service line to be included in the calculation is the Service Line Limit for a primary residential home. The Company, in its sole discretion, may waive the excessive service line fee or extend the service line limit for all attaching parties based on the economics of a proposed project. Any such waiver or extension shall not be effective unless provided in writing by the Company.
(6) Fixed Monthly Surcharge
A Fixed Monthly Surcharge (Surcharge) will be calculated for each Customer Attachment Project (Project). The Surcharge will recover the Revenue Deficiency anticipated from the proposed Project. The Surcharge is calculated such that the present value of the anticipated Surcharges collected from the Project will equal the net present value Revenue Deficiency. The Surcharge will be recoverable over a predetermined time period, not to exceed ten years. The Company will be responsible for determining the appropriate Surcharge time period. The Surcharge will be a fixed dollar amount for all customers within the Project and will expire on the same date for all customers within the Project, regardless of when the surcharge was initially assessed to the customer. The Surcharge will not be subject to adjustment, reconciliation or refund. A customer who attaches to a Project after the surcharge period has expired or a customer whose proposed attachment was beyond the scope of the original a Project, will be treated as a separate Project.
Continued on Sheet No. C-36.00
Issued: Effective for Service By J F Schott On and After: VP Regulatory Affairs Issued Under Authority of

Case No. U-17273 Witness: D. J. Tyler Exhibit A-6 (DJT-1) Schedule F5 Page 8 of 24 MICHIGAN GAS UTILITIES CORPORATION Second Revised Sheet No. D-1.00 M.P.S.C. No. 2 – GAS Replaces First Revised Sheet No. D-1.00
SECTION D
RATE SCHEDULES D1. GENERAL TERMS AND CONDITIONS OF THE TARIFF
(1) Controlled service.
All rates are subject to all provisions in Rule C2. of the Rules and Regulations of the Company which are applicable to priority of service hereunder.
(2) Territory served.
All rates apply in the territory served by the Company, comprising the cities, villages and townships in all Districts in the applicable Rules and Regulations of the Company except where specifically noted.
D2. SUPPLEMENTAL CHARGES
Each Rate Schedule may be subject to supplemental charges under Rule C11, Customer Attachment Program, a Reservation Charge, Interim Rate Increase, Uncollectible Expense Tracking Mechanism (“UETM”), Revenue Decoupling Mechanism and Energy Optimization (“EO”) surcharges required by Public Act 295, as detailed below: RESERVATION CHARGE – This charge allows for the recovery of costs related to the assets necessary to provide peak-day coverage and for the utility to serve as the “supplier of last resort” for Gas Customer Choice program customers, as required by the Commission in Case No. U-15929. The Reservation Charge as also a base component of the GCR factor, which also is comprised of a Commodity Charge. Reservation Charge $0.6448 per Mcf INTERIM RATE INCREASE SURCHARGE:
Customer Class Interim Surcharge Residential $ 0.4011 per Mcf Multi-Family $ 0.2329 per Mcf Small General Service $ 0.2559 per Mcf Large General Service $ 0.1670 per Mcf Transportation - TR-1 $ 0.1711 per Mcf TR-2 $ 0.0871 per Mcf TR-3 $ 0.0582 per Mcf
Continued on Sheet No. D-1.01 Issued: Effective for Service

Case No. U-17273 Witness: D. J. Tyler Exhibit A-6 (DJT-1) Schedule F5 Page 9 of 24 MICHIGAN GAS UTILITIES CORPORATION First Revised Sheet No. D-1.02 M.P.S.C. No. 2 – GAS Replaces Original Sheet No. D-1.02
Continued from Sheet No. D-1.01 SECTION D
RATE SCHEDULES
D2. SUPPLEMENTAL CHARGES (contd.)
REVENUE DECOUPLING MECHANISM (2011) Customer bills shall be adjusted by the decoupling surcharge or credit, per Mcf, effective September 1, 2012 through August 31, 2013, on a service rendered basis.
Rate Schedule Adjustment/Mcf Residential General and Heating ($ 0.04603) (including Transport and Choice)
Multi-Family, Class I and II $ 0.13044 (including Transport and Choice) Small General Service General and Heating $ 0.13044
(including Transport and Choice)
Multi-Family, Class III and IV $ 0.00174 (including Transport and Choice)
ENERGY OPTIMIZATION Surcharge – this charge permits, pursuant to Section 91(4) of 2008 PA 295, the adjustment of rates, to allow for recovery of the payments made by the Company in compliance with Section 91(1) of 2008 PA 295.
Customer Class EO Surcharge Residential $ 0.1811 per Mcf Multi-Family $ 0.1811 per Mcf Small General Service $ 4.17 per meter, per month Large General Service $ 215.45 per meter, per month Commercial Lighting $ 10.33 per contract, per month Special Contracts $ 221.26 per month Transportation - TR-1 $ 39.27 per meter, per month TR-2 $ 119.34 per meter, per month TR-3 $ 408.71 per meter, per month
Continued on Sheet No. D-2.00 Issued: Effective for Service By: J. F. Schott On and After: VP Regulatory Affairs Issued Under Authority of Green Bay, Wisconsin Michigan Public Service Commission Order Dated:

Case No. U-17273 Witness: D. J. Tyler Exhibit A-6 (DJT-1) Schedule F5 Page 10 of 24 MICHIGAN GAS UTILITIES CORPORATION Fourth Revised Sheet No. D-6.00 M.P.S.C. No. 2 – GAS Replaces Third Revised Sheet No. D-6.00
Continued From Sheet No. D-5.00 D4. RESIDENTIAL RATE - (General and Heating) (Contd)
RATE
Customer Charge: Daily Monthly
$ 0.3945 per customer, plus $ 12.00 per customer, plus
Distribution Charge $1.7815 per Mcf, plus
Gas Cost Recovery Charge The monthly gas cost recovery charge as set forth on Sheet No. D-2.00.
Supplemental Charges
This rate is subject to the Supplemental Charges set forth on Sheet Nos. D-1.00, D-1.01 and D-1.02.
Seasonal Service Charge
A charge of $45.00 payable in either a flat amount or three equal installments, will be made to partially cover the cost of restoring service when it has been temporarily discontinued at the customer's request.
Late Payment Charge and Due Date
A late payment charge of 2%, not compounded, net of sales tax, will be added to any bill which is delinquent. Customers participating in the Winter Protection Plan will not be assessed the late payment charge. The due date shall be 21 days following the date of mailing.
GAS ALLOCATION PROCEDURE
This rate schedule is subject to the provisions of Rule C2.7. SPECIAL TAXES
(1) In municipalities which levy special taxes, license fees, or street rentals against
the Company, and which levy has been successfully maintained, the standard of rates shall be increased within the limits of such municipalities so as to offset such special charges and thereby prevent the customers in other localities from being compelled to share any portion of such local increase.
Continued on Sheet No. D-7.00 Issued: Effective for Service By: J. F. Schott On and After: VP Regulatory Affairs Issued Under Authority of Green Bay, Wisconsin Michigan Public Service Commission

Case No. U-17273 Witness: D. J. Tyler Exhibit A-6 (DJT-1) Schedule F5 Page 11 of 24 MICHIGAN GAS UTILITIES CORPORATION First Revised Sheet No. D-7.00 M.P.S.C. No. 2 – GAS Replaces Original Sheet No. D-7.00
Continued From Sheet No. D-6.00 D4. RESIDENTIAL RATE - (General and Heating) (Contd)
(2) Bills shall be increased to offset any new or increased specific tax or excise imposed by any governmental authority upon the Company's production, transmission or sale of gas.
RULES AND REGULATIONS Service under this rate schedule shall be subject to the Standard Rules and Regulations of the Company.
D5. RESIDENTIAL MULTIPLE FAMILY DWELLING RATE - (General and Heating)
AVAILABILITY
Subject to limitations and restrictions contained in orders of the Michigan Public Service Commission in effect from time to time and in the Standard Rules and Regulations of the Company, service is available under this rate schedule to any of the Company's existing multiple family dwelling customers as of January 5, l978, for any centrally metered installations containing individual households for residential service. This rate is not available for commercial or industrial service, including swimming pool heater usage.
Any swimming pool heater usage or other commercial type usage shall be Company submetered or separately metered in order for the customer to remain on this rate schedule. The Company shall furnish the required meter and install it at the customer's expense.
DEFINITIONS
As used in this rate schedule, "residential service" means service to any multiple family dwelling customer for purposes of space heating and other domestic uses. A multiple family dwelling includes such living facilities as, for example, cooperatives, condominiums and apartments; provided, however, in order to qualify for this service, each household within such multiple family dwelling must have the normal household facilities such as bathroom, individual cooking and kitchen sink. A "multiple family dwelling" does not include such living facilities as, for example, penal or corrective institution, motels, hotels, dormitories, nursing homes, tourist homes, military barracks, hospitals, special care facilities or any other facilities primarily associated with the purchase, sale or supplying (for profit or otherwise) of a commodity, product or service by a public or private person, entity, organization or institution; these facilities will be provided service under either the Optional Rate or the General Service Rate.
Continued on Sheet No. D-8.00 Issued: Effective for Service

Case No. U-17273 Witness: D. J. Tyler Exhibit A-6 (DJT-1) Schedule F5 Page 12 of 24 MICHIGAN GAS UTILITIES CORPORATION Fourth Revised Sheet No. D-8.00 M.P.S.C. No. 2 – GAS Replaces Third Revised Sheet No. D-8.00
Continued From Sheet No. D-7.00 D5. RESIDENTIAL MULTIPLE FAMILY DWELLING RATE - (General and Heating) (Contd)
RATE
Customer Charge: (See Sheet No. D-10.00 for meter classifications.)
Daily Monthly Meter Class I $ 0.3945 per customer, plus $ 12.00 per customer, plus Meter Class II $ 1.0849 per customer, plus $ 33.00 per customer, plus Meter Class III $ 1.0849 per customer, plus $ 33.00 per customer, plus Meter Class IV $ 1.0849 per customer, plus $ 33.00 per customer, plus
Distribution Charge: (See Sheet No. D-10.00 for meter classifications.)
Meter Class I $ 1.7815 per Mcf, plusMeter Class II $ 1.7815 per Mcf, plusMeter Class III $ 1.7815 per Mcf, plusMeter Class IV $ 1.7815 per Mcf, plus
Gas Cost Recovery Charge
The monthly gas cost recovery charge as set forth on Sheet No. D-2.00.
Supplemental Charges This rate is subject to the Supplemental Charges set forth on Sheet Nos. D-1.00, D-1.01 and D-1.02.
Seasonal Service Charge
A charge of $45.00, payable in either a flat amount or three equal installments, will be made to partially cover the cost of restoring service when it has been temporarily discontinued at the customer's request.
Late Payment Charge and Due Date
A late payment charge of 2%, not compounded, net of sales tax, will be added to any bill which is delinquent. Customers participating in the Winter Protection Plan will not be assessed the late payment charge. The due date shall be 21 days following the date of mailing.
Continued on Sheet No. D-9.00 Issued: Effective for Service By: J. F. Schott On and After: VP Regulatory Affairs Issued Under Authority of Green Bay, Wisconsin Michigan Public Service Commission

Case No. U-17273 Witness: D. J. Tyler Exhibit A-6 (DJT-1) Schedule F5 Page 13 of 24 MICHIGAN GAS UTILITIES CORPORATION First Revised Sheet No. D-9.00 M.P.S.C. No. 2 – GAS Replaces Original Sheet No. D-9.00
Continued From Sheet No. D-8.00 D5. RESIDENTIAL MULTIPLE FAMILY DWELLING RATE - (General and Heating) (Contd)
GAS ALLOCATION PROCEDURE
This rate schedule is subject to the provisions of Rule C2.7.
SPECIAL TAXES
(1) In municipalities which levy special taxes, license fees, or street rentals against the Company, and which levy has been successfully maintained, the standard of rates shall be increased within the limits of such municipalities so as to offset such special charges and thereby prevent the customers in other localities from being compelled to share any portion of such local increase.
(2) Bills shall be increased to offset any new or increased specific tax or excise
imposed by any governmental authority upon the Company's production, transmission or sale of gas.
RULES AND REGULATIONS
Service under this rate schedule shall be subject to the Standard Rules and Regulations of the Company.
SPECIAL PROVISIONS The Consumer Standards and Billing Practices are not applicable to service under this rate schedule (Case No. U-4240).
Continued on Sheet No. D-10.00 Issued: Effective for Service By J F Schott On and After: VP Regulatory Affairs Issued Under Authority of Green Bay, Wisconsin Michigan Public Service Commission Dated:

Case No. U-17273 Witness: D. J. Tyler Exhibit A-6 (DJT-1) Schedule F5 Page 14 of 24 MICHIGAN GAS UTILITIES CORPORATION First Revised Sheet No. D-10.00 M.P.S.C. No. 2 – GAS Replaces Original Sheet No. D-10.00
Continued From Sheet No. D-9.00 D5. RESIDENTIAL MULTIPLE FAMILY DWELLING RATE - (General and Heating) (Contd)
METER CLASSIFICATIONS For application of the Monthly Customer Charge under this rate schedule, the Company's gas meters are designated in one of the following classifications:
Meter Class I Meter Class II Meter Class III Meter Class IV(Less than 400 CFH) (400-1000 CFH) (Over 1000 CFH) (Over 1,000 CFH) (without pressure (with pressure or or temperature temperature correcting devices) correcting devices)American AL-175-TC Sprague 1000-TC Rockwell 3000-TC Rockwell 3000-TCAmerican 225-TC American 425-TC Rockwell 5000-TC Rockwell 5000-TCAmerican AL-250-TC American 1000-TC Roots 1.5M TC Roots 1.5M-TCRockwell 175-TC Rockwell 415-TC Roots 3M Roots 3M Rockwell 250-TC Rockwell 750-TC Roots 3M TC Roots 3M TCRockwell 200-TC Rockwell 1000-TC Roots 5M Roots 5M Sprague 175-TC Rockwell 1600-TC Roots 5M TC Roots 5M TCRockwell 275-TC Roots 7M Roots 7M Roots 7M TC Roots 7M TC Roots 11M Roots 11M Roots 16M Roots 16M Roots 23M Roots 23M Roots 38M Roots 38M Rockwell T-18 Rockwell T-18 Rockwell T-30 Rockwell T-30 Rockwell T-60 Rockwell T-60 Rockwell T-140 Rockwell T-140
Continued on Sheet No. D-11.00 Issued: Effective for Service By J F Schott On and After: VP Regulatory Affairs Issued Under Authority of Green Bay, Wisconsin Michigan Public Service Commission

Case No. U-17273 Witness: D. J. Tyler Exhibit A-6 (DJT-1) Schedule F5 Page 15 of 24 MICHIGAN GAS UTILITIES CORPORATION Fourth Revised Sheet No. D-11.00 M.P.S.C. No. 2 – GAS Replaces Third Revised Sheet No. D-11.00
Continued from Sheet No. D-10.00
D6. SMALL GENERAL SERVICE RATE - (General and Heating)
AVAILABILITY
Subject to limitations and restrictions contained in orders of the Michigan Public Service Commission in effect from time to time and in the Rules and Regulations of the Company, service is available under this rate schedule to any non-residential customer for any purpose.
RATE
Customer Charge: Daily Monthly
$ 1.0849 per customer, plus $ 33.00 per customer, plus
Distribution Charge $ 1.7815 per Mcf, plus
Gas Cost Recovery Charge
The monthly gas cost recovery charge as set forth on Sheet No. D-2.00.
Supplemental Charges This rate is subject to the Supplemental Charges set forth on Sheet Nos. D-1.00, D-1.01 and D-1.02.
Seasonal Service Charge
A charge of $45.00, payable in either a flat amount or three equal installments, will be made to partially cover the cost of restoring service when it has been temporarily discontinued at the customer's request.
Delayed Payment Charge and Due Date
A delayed payment charge of 2%, shall be applied to the unpaid balance outstanding not compounded, net of sales tax, of any bill which is not paid on or before the due date shown thereon. The due date shall be 21 days following the date of mailing.
Continued on Sheet No. D-12.00 Issued: Effective for Service By: J. F. Schott On and After: VP Regulatory Affairs Issued Under Authority of Green Bay, Wisconsin Michigan Public Service Commission

Case No. U-17273 Witness: D. J. Tyler Exhibit A-6 (DJT-1) Schedule F5 Page 16 of 24 MICHIGAN GAS UTILITIES CORPORATION Fourth Revised Sheet No. D-13.00 M.P.S.C. No. 2 – GAS Replaces Third Revised Sheet No. D-13.00
Continued from Sheet No. D-12.00
D7. LARGE GENERAL SERVICE RATE - (General and Heating)
AVAILABILITY
Subject to limitations and restrictions contained in orders of the Michigan Public Service Commission in effect from time to time and in the Rules and Regulations of the Company, service is available under this rate schedule to any non-residential customer for any purpose.
RATE
Customer Charge: Daily Monthly
$ 13.1507 per customer, plus $ 400.00 per customer, plus
Distribution Charge $ 1.0578 per Mcf, plus
Gas Cost Recovery Charge The monthly gas cost recovery charge as set forth on Sheet No. D-2.00.
Supplemental Charges:
This rate is subject to the Supplemental Charges set forth on Sheet Nos. D-1.00, D-1.01 and D-1.02.
Seasonal Service Charge
A charge of $45.00, payable in either a flat amount or three equal installments, will be made to partially cover the cost of restoring service when it has been temporarily discontinued at the customer's request.
Delayed Payment Charge and Due Date
A delayed payment charge of 2% shall be applied to the unpaid balance outstanding not compounded, net of sales tax, of any bill which is not paid on or before the due date shown thereon. The due date shall be 21 days following the date of mailing.
Continued on Sheet No. D-14.00 Issued: Effective for Service By: J. F. Schott On and After: VP Regulatory Affairs Issued Under Authority of Green Bay, Wisconsin Michigan Public Service Commission

Case No. U-17273 Witness: D. J. Tyler Exhibit A-6 (DJT-1) Schedule F5 Page 17 of 24 MICHIGAN GAS UTILITIES CORPORATION Second Revised Sheet No. D-15.00 M.P.S.C. No. 2 – GAS Replaces First Revised Sheet No. D-15.00
Continued from Sheet No. D-14.00 D8. GAS LIGHTING RATE
AVAILABILITY
Subject to limitations and restrictions contained in orders of the Michigan Public Service Commission in effect from time to time and in the Rules and Regulations of the Company. Rate Schedule Distribution Charge Residential - $ 1.7815 per Mcf
Commercial - $ 1.7815 per Mcf
Street Lights - (In accordance with the terms of the service agreement) Gas Cost Recovery Charge The monthly gas cost recovery charge as set forth on Sheet No. D-2.00.
Supplemental Charges This rate is subject to the Supplemental Charges set forth on Sheet Nos. D-1.00,
D-1.01 and D-1.02 RULES AND REGULATIONS
Service under this rate schedule shall be subject to the Standard Rules and Regulations of the Company plus the following condition:
No additional gas burning devices may be attached to the service connection for light(s) served under this rate.
SPECIAL TAXES
(1) In municipalities which levy special taxes, license fees, or street rentals against
the Company, and which levy has been successfully maintained, the standard of rates shall be increased within the limits of such municipalities so as to offset such special charges and thereby prevent the customers in other localities from being compelled to share any portion of such local increase.
(2) Bills shall be increased to offset any new or increased special tax or excise
imposed by any governmental authority upon the Company's production, transmission or sale of gas.
Issued: Effective for Service By: J. F. Schott On and After: VP Regulatory Affairs Issued Under Authority of

Case No. U-17273 Witness: D. J. Tyler Exhibit A-6 (DJT-1) Schedule F5 Page 18 of 24 MICHIGAN GAS UTILITIES CORPORATION Second Revised Sheet No. E-13.00 M.P.S.C. No. 2 – GAS Replaces First Revised Sheet No. E-13.00
Continued From Sheet No. E-12.00
E5. TRANSPORTATION SERVICE AND RATES (Contd) E5.3 AGGREGATION OF ACCOUNTS OPTION.
(b) Only the subsidiary accounts will be eligible for aggregation with the master account. To
qualify as a subsidiary account a facility must be served under any of the Sales Service Rates or Transportation Service Rates. The customer, or the customer’s agent, must specify which of the other facilities will be designated as a subsidiary account. The customer may designate some or all of its other facilities as subsidiary accounts.
(c) The facility designated as the master account shall be subject to and billed under the
provisions of its transportation tariff. Facilities designated as subsidiary accounts shall be subject to all the terms and conditions of the master account tariff, except that each subsidiary account will pay the customer charge, distribution charge and all applicable Supplemental charges as set forth on Sheet Nos. D-1.00, D-1.01 and D-1.02 in effect for its designated sales or transportation rate, rather than the customer charge and transportation charge in effect for the master account.
E5.4 RATES AND CHARGES Transportation Service Rate Monthly Charges: TR-1 TR-2 TR-3
Customer Charge -
Each Meter $ 850.00 / meter $ 2,250.00 / meter $ 3,050.00 / meter
Transportation Rates:
Peak (November to March) $ 0.7777 per Mcf $ 0.4796 per Mcf $ 0.4651 per Mcf Off-Peak (April to October) $ 0.6277 per Mcf $ 0.3296 per Mcf $ 0.3151 per Mcf
Optional Discount Rates - The Company, at its discretion, may negotiate lower rates for individual customers, down to a minimum of $0.20 per Mcf.
The Company, at its option, may require the installation of a heating value measurement device and the payment by the customer of a $250.00 monthly heating value measurement charge under the following conditions:
(a) If the customer refuses to include in its gas transportation service contract a provision that
holds the Company harmless for any damages resulting from measuring errors; or
(b) If the customer demands that heating value measurement equipment be installed. Continued on Sheet No. E-14.00 Issued: Effective for Service By: J. F. Schott On and After: VP Regulatory Affairs Issued Under Authority of Green Bay, Wisconsin Michigan Public Service Commission

Case No. U-17273 Witness: D. J. Tyler Exhibit A-6 (DJT-1) Schedule F5 Page 19 of 24 MICHIGAN GAS UTILITIES CORPORATION Fourth Revised Sheet No. E-14.00 M.P.S.C. No. 2 – GAS Replaces Third Revised Sheet No. E-14.00
Continued From Sheet No. E-13.00
E5. TRANSPORTATION SERVICE AND RATES (Contd)
E5.5 GAS COST RECOVERY
Gas transported under this rate is not subject to adjustments for fluctuations in the cost of purchased gas as stated in Rule C9 of the Company’s Rules, Regulations, and Rate Schedules, M.P.S.C. No. 2.
E5.6 SUPPLEMENTAL CHARGES
This rate may be subject to the Supplemental Charges set forth on Sheet No. D-1.00, D-1.01 and D-1.02.
E5.7 GAS-IN-KIND
The Company shall retain 0.31% of all gas received at the delivery point(s) to compensate it for the company-use and lost-and-unaccounted-for gas on the Company’s system. This volume shall not be included in the quantity available for redelivery to the customer.
E5.8 MONTHLY LOAD BALANCING
MONTHLY IMBALANCES: As imbalances occur, the Company and the customer will attempt to correct them within the same month in which they occur. Failing such corrections, the Company will cash-out the imbalances as described below:
ANNUAL CONTRACT QUANTITY (ACQ) is defined as the quantity of gas, as specified in the transportation contract between the customer and the Company, that is based on the customer’s maximum historical 12-month usage (determined from the customer’ 36-month base period) plus adjustments for known or expected changes.
AUTHORIZED TOLERANCE LEVEL (ATL) is defined as 5% of the customer’s ACQ. The Company is obligated to retain excess deliveries of gas on behalf of the customer up to its ATL, without additional charge.
EXCESS DELIVERIES are defined as gas delivered to the Company, on behalf of the customer, less gas in kind and gas redelivered to the customer, on a monthly basis.
ATL BALANCE is defined as the cumulative balance of excess deliveries from month to month, up to the customer’s ATL. The ATL balance may be carried forward from month to month without additional charge. The Company will inform the customer of its current ATL balance along with its monthly billing.
Continued on Sheet No. E-15.00
Issued: Effective for Service On and By: J. F. Schott After: VP Regulatory Affairs Issued Under Authority of Green Bay, Wisconsin Michigan Public Service Commission

Case No. U-17273 Witness: D. J. Tyler Exhibit A-6 (DJT-1) Schedule F5 Page 20 of 24 MICHIGAN GAS UTILITIES CORPORATION Third Revised Sheet No. E-17.00 M.P.S.C. No. 2 – GAS Replaces Second Revised Sheet No. E-17.00
Continued From Sheet No. E-16.00 E5. TRANSPORTATION SERVICE AND RATES (Contd)
Option B – “Pooling by Pipeline” (Contd)
Deliveries are pooled together by adding the positive and negative imbalances for each customer in the pool. A fee of $25.00 per month shall be imposed on each imbalance paper pool, with the fee billed to the marketer, broker, or aggregator that is designated as the pool’s representative.
E5.9 UNAUTHORIZED USAGE OR EXCESS DELIVERIES WHEN SERVICE IS INTERRUPTED,
CURTAILED, OR AN OFO IS IN EFFECT
Penalties for unauthorized usage or excess deliveries by a customer during a period of curtailment, OFO or interruption of gas service shall be assessed charges and cashed-out in accordance with the provisions of the Company’s Rule C3.2 - CURTAILMENT OF GAS SERVICE.
E5.10 AUTHORIZED TOLERANCE LEVEL RESTRICTIONS:
(a) Monthly withdrawals from storage during February through April will be limited to 3% of
the transportation customer’s ACQ. Withdrawals in excess of that limit may be authorized but are subject to the Company’s sole judgment and prior approval pursuant to appropriate terms and conditions. Without prior approval, if in any month the volume of gas received by the Company, less the allowance for gas-in-kind plus the 3% of the transportation customer’s ACQ is less than the volume of gas taken by the customer at the point of delivery, then all excess ATL delivery volumes above the 3% threshold will be cashed out in accordance with the Negative Imbalance provisions “% Monthly Nomination Over 5%”, at the high price for the MichCon City Gate Index.
(b) Injections into storage during September and October through November will be limited
to no more than 1.0% of ACQ without approval from the Company. Injections during the September and October through November period which exceed 1.0% shall permit the Company to refuse to receive any additional volume of gas for that customer until the Company has satisfied itself that the volume of gas retained for the customer is less than the ATL. All volumes delivered in excess of the 1.0% of ACQ level will be cashed-out in accordance with the Positive Imbalance provisions “% Monthly Nomination Over 5%”, at the low price for the MichCon City Gate Index.
(c) Daily nominations cannot exceed the percentage of expected daily usage that is
imposed upon the Company by the Interstate pipelines, without approval of the Company. Nominations that exceed the limitation shall be subjected to overrun charges and imbalance penalties, as imposed by the Interstate pipelines.
(d) For purposes of this provision (Subsections (a), (b) and (c) above), pooling will be
allowed on a supplier-by-supplier basis at the city gate. Issued Effective for Service By: J. F. Schott On and After: VP Regulatory Affairs Issued Under Authority of Green Bay, Wisconsin Michigan Public Service Commission

Case No. U-17273 Witness: D. J. Tyler Exhibit A-6 (DJT-1) Schedule F5 Page 21 of 24 MICHIGAN GAS UTILITIES CORPORATION Second Revised Sheet No. F-2.00 M.P.S.C. No. 2 – GAS Replaces First Revised Sheet No. F-2.00
Continued From Sheet No. F-1.00
F1. GENERAL PROVISIONS (Contd.)
(5) Supplier Pricing: A Supplier may have as many pricing pools as desired shall be limited to no more than a total of ten (10) Pricing Categories. A Supplier will not be permitted to add more than two (2) Pricing Categories per month, unless prior approval is obtained from the Company. Each month, all customers within a Pricing Categorypricing pool shall be billed the same price, as designated by the Supplier. A Supplier shall pay a monthly Administrative Fee of $100.00 per Supplier-designated Pricing Category. A “Pricing Category” shall be defined as a pricing pool that assesses the same rate for each of the Company’s five operating districts. The Company reserves the right to require additional pools to meet operational requirements.
(6) Daily Delivery Obligations: The Company will provide each Supplier with a monthly
schedule of quantities for delivery of gas into the Company system on behalf of the Supplier's customers for each Pricing Category and delivery pools behind each of the Company’s five operating districts. Prior to the closing bid day of futures trading for the month, Seven (7) business days prior to the end of the preceding month, the Company will issue a Daily Delivery Obligation (DDO). The DDO will establish the anticipated daily quantity of gas to be delivered to the Company at the Point(s) of Receipt designated by the Company. The DDO will generally be based upon the pooled customers’ historical use for the prior year, adjusted for the prior year’s weather. This schedule may be updated by the Company on a monthly basis. The Company reserves the right to take into consideration the Supplier’s cumulative imbalance in determining each month’s DDO. The DDO is subject to intra-month changes as operational conditions dictate. If the Company requires an increase or decrease in flow requirements within any month, the Company shall issue a DDO Change Notice to the Supplier as soon as possible but no later than twenty-four (24) hours prior to the start of the Gas Day. The Company shall issue such notices in a non-discriminatory manner. Scheduled daily volumes for GCC customers for electric peakers, greenhouses, grain dryers, asphalt plants and large loads without consistent or historical load information may be determined by the Company on a different basis than set forth above.
A Supplier that fails to deliver the required DDO quantity on any day, shall pay a per MMBtu “Failure Fee” for the difference between the required DDO and the actual amount delivered in the amount of $6.00 per MMBtu ($10.00 per MMBtu during periods of Company-declared supply emergency in accordance with Rule C3.2, Curtailment of Gas Service) plus the higher of (a) the cost of gas billed to sales customers pursuant to the Company's Rule C9 or (b) the current highest spot price paid for gas delivered to ANR Pipeline Company, Panhandle Eastern Pipe Line Company, Trunkline Gas Company, the MichCon index or at Chicago city gate for the corresponding date as published in Gas Daily, plus associated firm pipeline delivery costs. In addition, the Company may assess up-stream penalties to the Supplier to the extent that the Company has identified the Supplier as the cause of the penalty. (Failure Fees collected by the Company shall be reflected as a reduction to the GCR Cost of Gas Sold and identified separately on annual reconciliation reports under Rule C9.)
A Supplier who fails to deliver gas on successive days such that its Failure Fee liability exceeds its cash deposit, letter of credit or surety bond, shall be subject to having its Authorized Supplier status revoked. Subject to Rule C2, Controlled Service, the Supplier’s customers shall become sales rate customers of the Company.
Continued on Sheet No. F-3.00

Case No. U-17273 Witness: D. J. Tyler Exhibit A-6 (DJT-1) Schedule F5 Page 22 of 24 MICHIGAN GAS UTILITIES CORPORATION Third Revised Sheet No. F-3.00 M.P.S.C. No. 2 – GAS Replaces Second Revised Sheet No. F-3.00
Continued From Sheet No. F-2.00 F1. GENERAL PROVISIONS (Contd.)
(7) Proof Of Capacity: The Supplier shall be responsible for obtaining sufficient pipeline capacity to meet its delivery obligations.
(8) Gas delivered into the Company’s system shall comply with Rule B1, Technical Standards
for Gas Service, Part 8 Gas Quality.
(9) Nominations: Each Supplier shall notify the Company's Gas Transportation Services Department of the daily quantity of gas (in MMBtu) that the Supplier is nominating for delivery on behalf of each Supplier-designated monthly Pricing Category and each associated geographic delivery pool. Such nominations shall be submitted by 11:30 AM Central time prior to the effective day of the proposed delivery.
(10) Gas-In-Kind: The Company shall retain 0.31% of all gas received at the delivery point(s)
to compensate it for company-use and lost-and-unaccounted-for gas on the Company’s system. This volume shall not be included in the quantity available for redelivery to the customer.
(11) Customer Billing: All customer billing and remittance processing functions for services
provided under Rate CC will be performed by the Company. The Supplier will be charged a monthly fee of $0.46 per customer account. The Company will be responsible for credit and collection activities for the amounts billed directly to the customer by the Company. The Supplier must, at least three business days prior to the start of each billing month, furnish to the Company, in a format acceptable to the Company, the price per Mcf or Ccf to be billed to each Supplier-designated Pricing Category on its behalf or the most recently supplied price will be used.
When a Supplier has more than one pool and delivers a monthly cumulative amount of gas to the Company that differs from the total DDO’s issued by the Company to the Supplier, the Company shall allocate any gas shortages to the highest priced pools first, when making remittances. For any monthly cumulative amounts of gas delivered to the Company in excess of the total DDO’s issued by the Company to the Supplier, the Company shall allocate such gas excess to the lowest priced pools first, when making remittances.
(12) Buy/Sell: The Company shall remit to the Supplier, approximately 21 business days from
the end of each calendar month, an amount for the cost of gas equal to the MMBtu quantities that the Supplier has delivered onto the Company's system, multiplied by the price per Mcf converted to MMBtu, billed to the Supplier's customers that month. The amount to be remitted shall be reduced for any applicable Administrative Fees, Billing Fees, and Failure Fees, amounts owed under the annual price reconciliation per Paragraph (13) below and/or other amounts owed to the Company pursuant to the Company’s tariff.
(13) Annual Reconciliation: Within 60 working days after the end of the June billing cycle, or
upon revocation of a Supplier’s Authorized Supplier status, the Company will determine if a reconciling adjustment is necessary, both price and volume will be reviewed.
The Company will compare:
(i) the weighted average price per MCF billed the customer on behalf of the Supplier with the Company’s actual weighted average cost of gas (WACOG), and
Continued on Sheet No. F-4.00

Case No. U-17273 Witness: D. J. Tyler Exhibit A-6 (DJT-1) Schedule F5 Page 23 of 24 MICHIGAN GAS UTILITIES CORPORATION Second Revised Sheet No. F-4.00 M.P.S.C. No. 2 – GAS Replaces First Revised Sheet No. F-4.00
Continued From Sheet No. F-3.00 F1. GENERAL PROVISIONS (Contd.)
(ii) the volumes delivered by the Supplier less Gas In Kind, converted to Mcf, with the billed customer consumption over the program year.
A reconciling adjustment will only be made when:
(i) the difference between the weighted average price per Mcf billed the customer on behalf of the Supplier and the Company’s actual WACOG exceeds ten percent (10%) of the Company’s actual WACOG, and
(ii) the difference between the volumes delivered by the Supplier less Gas-In-Kind,
converted to Mcf, and billed customer consumption exceeds ten percent (10%) of billed customer consumption.
The reconciling adjustment, if made, will be reflected on the next monthly remittance to the Supplier. (Amounts collected or remitted by the Company under the Annual Reconciliation mechanism shall be reflected as a component of the GCR Cost of Gas Sold and identified separately on annual reconciliation reports under Rule C9.) The following table enumerates the various pricing and supply conditions that will be considered in the annual reconciliation process:
Annual Reconciliation Pricing/Supply Conditions
1. Supplier’s weighted average price 2. Supplier’s weighted average price billed is higher than the Company’s billed is less than the Company’s actual WACOG and delivered volumes, actual WACOG and delivered volumes, less Gas-In-Kind, exceed billed customer less Gas-In-Kind, exceed billed customer consumption. consumption.
3. Supplier’s weighted average price 4. Supplier’s weighted average price
billed is higher than the Company’s billed is less than the Company’s actual WACOG and billed customer actual WACOG and billed customer consumption exceeds delivered volumes. consumption exceeds delivered volumes.
Scenario #1: Remittance to Supplier will be reduced for volumes delivered in excess of billed customer consumption, less Gas-In-Kind, at the difference between the Company’s actual WACOG and the Supplier’s weighted average price.
Scenario #2: Remittance to Supplier will be increased for amounts delivered in excess of customer billed consumption, less Gas-In-Kind, at the difference between the Company’s actual WACOG and the Supplier’s weighted average price.
Scenario #3: Remittance to Supplier will be increased for amounts billed to customers in excess of the volumes delivered at the difference between the Company’s actual WACOG and the Supplier’s weighted average price.
Scenario #4: Remittance to Supplier will be reduced for amounts billed to customers in excess of the volumes delivered at the difference between the Company’s actual WACOG and the Supplier’s weighted average price.
Continued on Sheet No. F-5.00

Case No. U-17273 Witness: D. J. Tyler Exhibit A-6 (DJT-1) Schedule F5 Page 24 of 24 MICHIGAN GAS UTILITIES CORPORATION Second Revised Sheet No. F-5.00 M.P.S.C. No. 2 – GAS Replaces First Revised Sheet No. F-5.00
Continued From Sheet No. F-4.00 F1. GENERAL PROVISIONS (Contd.)
(14) If the Commission or its Staff determines that a Supplier has not complied with the terms and conditions of the Program, The Commission or its Staff shall direct a utility or utilities to suspend the Supplier’s Authorized status until the Commission or its Staff determines that necessary changes have been made to comply with the requirements. Failure to make the necessary changes, or further non-compliance with the requirements of the terms and conditions of the Program may result in the Supplier’s termination from the Program. If a Supplier is terminated, subject to Rule C2, Controlled Service, its customers shall become sales rate customers of the Company.
(15) For purposes of reconciling amounts owed between the Company and a Supplier, the
Company will convert customer consumption from Mcf to MMBtu using daily system-average Btu content by billing cycle.
(16) Where used in this rule, the term "month," unless otherwise indicated, means billing month
when referring to customer consumption and calendar month when referring to deliveries by Suppliers.
(17) The Company may disclose, at such times as requested by the Commission or its staff, the
gas rates charged to Rate CC customers.
(18) The Company shall have the authority to issue operational flow orders (OFO’s), or take other action which it deems necessary, to ensure system reliability, even if such action may be inconsistent with other provisions of these Program Rules.
(19) The Company will act as Supplier of last resort under the Program.
(20) A Supplier must include the Company’s required tariff language in all of its contracts.
(21) If a customer has a complaint against a Supplier, the customer should try to resolve it first
with the Supplier. If the complaint is unresolved, the customer should involve the Commission by contacting the Commission Staff. Should the customer choose to involve the Company in a complaint, the Company shall forward the complaint information to the Commission Staff and the Supplier for resolution. The Company shall have no responsibility for resolving disputes between customers and Suppliers but shall provide information if requested by the customer or Commission Staff.
(22) The Transportation Standards of Conduct, Rules E4.2 and E4.3, shall apply to the GCC
program (23) The annual load requirement, DDO’s, delivery schedules, delivery shortfalls, Failure Fees
and annual reconciliations shall apply separately to each Supplier designated Pricing Category.
Continued on Sheet No. F-6.00
Issued: Effective for Service By: J. F. Schott On and After: VP Regulatory Affairs Issued Under Authority of Green Bay, Wisconsin Michigan Public Service Commission

Case No.: U-17273Witness: D.J. TylerExhibit A-6 (DJT-1)
Schedule F6Page 1 of 1
MARGIN MARGIN PROPOSED CLASS MARGIN REVENUE REVENUE MARGIN SALES SURCHARGE
RATE CLASS REVENUE ($) INCREASE (%) INCREASE ($) REVENUE ($) (MCF)(1) (2) (3) (4) (5) (6)
Residential $41,529,322 12.9328% $5,370,900 $46,900,223 13,391,087.3 $0.4011 per MCFMulti-Family 485,090 12.9328% 62,736 547,826 269,316.3 $0.2329 per MCFSmall Commercial & Industrial 12,991,676 12.9328% 1,680,186 14,671,862 6,565,742.4 $0.2559 per MCFLarge Commercial & Industrial 430,824 12.9328% 55,718 486,542 333,687.6 $0.1670 per MCFTR-1 Transport 2,408,782 12.9328% 311,523 2,720,305 1,821,164.8 $0.1711 per MCFTR-2 Transport 2,614,176 12.9328% 338,086 2,952,262 3,883,380.9 $0.0871 per MCFTR-3 Transport 1,683,099 12.9328% 217,672 1,900,771 3,740,606.9 $0.0582 per MCF
Total $62,142,969 $8,036,820 $70,179,789 30,004,986.2
$8,036,820
2) 2012 Margin Revenues
3) Proposed Interim Margin Revenue Increase (%)
4) Proposed Interim Margin Revenue Increase ($) (2) x (3)
5) Proposed Interim Margin Revenues (2) + (4)
6) 2014 Forecasted sales
7) Proposed Surcharge (4) / (6)
1) Rate Schedule Grouping (Residential = Residential General, Heating, Lighting, Choice and Aggregated Transport; Multi-Family = Multi-Family Meter Classes I - IV, Choice and Aggregated Transport; Small C&I = Small C&I General, Heating, Lighting, Choice and Aggregated Transport; Large C&I = Large C&I General, Heating, Choice and Aggregated Transport) The rates for Special Contract customers as determined by contract. Therefore, no interim increase is proposed for Special Contract Customers.
(7)
Michigan Gas Utilities CorporationAllocation of Interim Rate Increase
Equal Percentage Increase of Margin Revenues
($/MCF)

STATE OF MICHIGAN
BEFORE THE MICHIGAN PUBLIC SERVICE COMMISSION
* * * * * In the matter of the application of ) MICHIGAN GAS UTILITIES CORPORATION ) for authority to increase retail natural gas rates. ) Case No. U-17273 )
DIRECT TESTIMONY OF
JOHN R. WILDE
FOR
MICHIGAN GAS UTILITIES CORPORATION
June 7, 2013

1
STATE OF MICHIGAN
BEFORE THE MICHIGAN PUBLIC SERVICE COMMISSION
* * * * *
In the matter of the application of ) MICHIGAN GAS UTILITIES CORPORATION ) for authority to increase retail natural gas rates. ) Case No. U-17273 )
QUALIFICATIONS OF
JOHN R. WILDE PART I
Q. Please state your name, business address and position. 1
A. My name is John R. Wilde. My business address is Integrys Energy Group, Inc. 2
(“Integrys”), 700 North Adams Street, P.O. Box 19001, Green Bay, WI 54307-9001. I 3
am a Vice President for Integrys, and am responsible for the tax function for Integrys 4
and its subsidiaries including Michigan Gas Utilities Corporation (“MGUC”). I am 5
testifying on behalf of MGUC in support of its application in this proceeding for 6
authority to increase its natural gas rates. 7
8
Q. Please describe your educational, professional, and utility background. 9
A. I graduated from Saint Norbert College, De Pere, Wisconsin in 1984 with a Bachelor 10
of Business Administration degree in Accounting. I have a graduate certificate in 11
state and local taxation, as well as a Masters Degree in Taxation, from the University 12
of Wisconsin-Milwaukee. I have been employed by Integrys or its predecessors 13
since 1984, and since 1986 I have been employed in the Corporate Tax Department. 14
15
Q. Have you previously testified in any regulatory proceedings? 16
A. Yes, I have. I have testified regarding depreciation, tax compliance, tax accounting, 17

2
and regulatory tax matters before a number of regulatory bodies, including the 1
Federal Energy Regulatory Commission, and utility commissions in Illinois, Michigan, 2
Minnesota, and Wisconsin. 3

3
JOHN R. WILDE DIRECT TESTIMONY
PART II Q. What is the purpose of your pre-filed direct testimony in this docket? 1
A. I present and support MGUC’s treatment in the instant rate case of a federal tax Net 2
Operating Loss (“NOL”) carryover from 2013 and 2014 by applying long standing 3
regulatory practices related to accounting for income taxes. 4
5
Accounting for a Federal Tax Net Operating Loss (“NOL”) Carryover 6 Q. For the 2014 test year, has MGUC included a deferred tax asset related to a 7
Federal NOL? 8
A. Yes, MGUC has included a deferred tax asset (“DTA”) for a NOL carry forward. The 9
DTA represents MGUC’s stand-alone operating income NOL that arises in 2012 and 10
2013 due primarily to bonus depreciation. 11
12
Q. Has MGUC recently experienced NOLs? 13
A. Yes, MGUC has experienced Net Operating Losses in recent years, due to bonus 14
tax depreciation deductions, and adjustments related to changes in methods of 15
accounting. However, until this rate case, MGUC was not in the position of having to 16
reflect a carry forward of a NOL balance from a prior year. 17
18
Q. What caused MGUC’s NOL? 19
A. MGUC’s 2012 and 2013 NOLs being carried forward are primarily the result of the 20
enactment of extensions allowing continued bonus depreciation deductions. 21
22
Q. What is bonus depreciation and what is its purpose? 23
A. Bonus depreciation is an acceleration of tax depreciation deductions to the first year 24

4
qualified property goes in service. The acceleration is based on a set percentage of 1
the tax basis of the qualified property. Congress enacted the bonus depreciation 2
provision in an effort to stimulate investment and create jobs at various times and at 3
various levels over the past decade. Bonus depreciation provides MGUC a source of 4
zero cost capital and has kept rates lower than they otherwise would have been. 5
However, due to the number of back-to-back years MGUC and the Integrys 6
consolidated group have been entitled to bonus depreciation deductions, as of the 7
end of 2013 MGUC is in the position of carrying the tax benefit of those deductions 8
forward in the form of a NOL carry forward balance. 9
10
Q. For tax purposes, what happens when a utility has more deductions, including 11
accelerated depreciation and bonus depreciation, than it has income? 12
A. If a utility has more tax deductions than taxable income in a given tax year, it has a 13
tax NOL. 14
15
Q. How can a NOL be used? 16
A. For tax purposes, NOLs can be carried back and applied against taxable income (if 17
any) in the two prior years. Then any remaining unused NOL is carried forward until 18
utilized for up to 20 years. The determination if a standalone entity can carry a loss 19
back or forward to be benefited is subject to the consolidated group of company’s 20
taxable income position in the applicable carryback and carryforward period. 21
22
Q. What is the status of Integrys’ consolidated NOL position for 2012 and 2013? 23
A. The Integrys consolidated group will generate an NOL in both 2012 and 2013, for the 24
same primary reason MGUC is generating an NOL during those years. As a result of 25
taking advantage bonus depreciation for several years, the Integrys consolidated 26

5
group will also be in a NOL carry-forward position for 2012 and 2013. 1
2
Q. What is the status of Integrys’ consolidated NOL position for 2014? 3
A. For 2014, Integrys consolidated is assumed to be in an income position sufficient to 4
absorb the NOL carry forward from 2012 and 2013. Therefore in 2014, MGUC’s 5
NOL DTA reverses over the course of the year. 6
7
Q. If a DTA is included as zero cost capital, what is the result? 8
A. MGUC would be in violation of the tax normalization rules. 9
10
Q. Please explain the specific tax normalization rule that relates to a NOL. 11
A. The normalization rules related to a federal NOL can be summarized as a 12
requirement that the utility has to have realized the tax cash flow benefit of claiming 13
accelerated depreciation before the deferred tax liability that results from claiming 14
accelerated depreciation is included in rate base. Therefore, the tax normalization 15
rules require MGUC to carry a deferred tax asset for the NOL balance from 2012 and 16
2013 that resulted from claiming accelerated tax depreciation, until used during 17
2014. An example of MGUC NOL situation and the IRS findings in that case can be 18
found in Private Letter Ruling (“PLR”) 8818040. In that ruling, the taxpayer did not 19
realize the entire tax benefit from the ACRS [Accelerated Cost Recovery System] 20
depreciation claimed in 1985 and 1986 because the depreciation resulted in a NOL 21
carryover to 1987. Therefore, in order to reflect the tax benefit of the NOL carryover 22
to 1987, the taxpayer reduced its deferred federal income tax expense and liability 23
for 1985 and 1986 for financial reporting purposes. 24
25
26

6
Q. Will including the DTA in cost of capital in this proceeding be akin to what 1
occurred in this circumstance as described in the PLR? 2
A. Yes, it would. Recording the effects of a NOL as a DTA is the modern day 3
equivalent of the reduction in deferred tax liability in the ruling. By including the 4
DTA related to the NOL, the tax benefit recorded in the deferred tax liability related to 5
accelerated depreciation is effectively eliminated until such time as the loss is 6
realized. 7
8
Q. What effect would a normalization violation have on customers? 9
A. A violation of the normalization rules would create severe detriment for both 10
customers and MGUC. The normalization rules are long-standing and Congress has 11
been unwavering in its mandate. These rules have been in force and the impact of 12
noncompliance has been known to utilities and their regulators for the past four 13
decades. Compliance with these rules is not optional and cannot be violated directly 14
or indirectly. Thus, it is important not to take steps that would have the unintended 15
consequence of losing the ability to continue to claim the rate base reducing impacts 16
of accelerated and bonus depreciation. 17
18
Q. Although Integrys consolidated is currently forecasting an NOL position in 19
2014, what would MGUC and the Commission be required to do if the final rate 20
relief in the instant rate case resulted in a NOL for MGUC and Integrys 21
consolidated? 22
A. If both MGUC’s operating income and Integrys’ consolidated forecasted tax positions 23
project a federal NOL, an increase to the NOL DTA must be computed and included 24
in the final MGUC capital structure earning a return. 25
26

7
Q. Does this complete your pre-filed direct testimony? 1
A. Yes, it does. 2