Embed Size (px)
Citation preview
INVESTMENT MANAGEMENT COMMITTEE
June 2017


TEACHER RETIREMENT SYSTEM OF TEXAS MEETING BOARD OF TRUSTEES
AND INVESTMENT MANAGEMENT COMMITTEE
(Committee Chair and Members: Mr. Colonnetta, Chair; Mr. Corpus; Mr. Kelly;
Mr. Moss and Ms. Ramirez)
All or part of the June 1, 2017, meeting of the TRS Investment Management Committee and Board of Trustees may be held by telephone or video conference call as authorized under Sections 551.130 and 551.127 of the Texas Government Code. The Board intends to have a quorum and the presiding officer of the meeting physically present at the following location, which will be open to the public during the open portions of the meeting: 1000 Red River, Austin, Texas 78701 in the TRS East Building, 5th Floor, Boardroom.
AGENDA
June 1, 2017 – 1:00 p.m.
TRS East Building, 5th Floor, Boardroom
1. Call roll of Committee members.
2. Consider the approval of the proposed minutes of the April 6, 2017 committee meeting – Joe Colonnetta.
3. Receive an update on and review External Private Markets, including – Eric Lang:
A. A review of private equity – Neil Randall.
B. A review of real assets – Grant Walker.
C. A review of Energy, Natural Resources and Infrastructure –Carolyn Hansard.
4. Receive a Private SPN Update – Mike Pia and Courtney Villalta.
5. Receive a report on Private Markets Super 5 Priority – Eric Lang.
NOTE: The Board of Trustees (Board) of the Teacher Retirement System of Texas will not consider or act upon any item before the Investment Management Committee (Committee) at this meeting of the Committee. This meeting is not a regular meeting of the Board. However, because the full Investment Management Committee constitutes a quorum of the Board, the meeting of the Committee is also being posted as a meeting of the Board out of an abundance of caution.

Minutes of the Investment Management Committee
April 6, 2017
The Investment Management Committee of the Board of Trustees of the Teacher Retirement System of Texas met on April 6, 2017, in the boardroom located on the fifth floor of the TRS East Building offices at 1000 Red River Street, Austin, Texas.
Committee Members present: Mr. David Kelly, Chair Mr. Joe Colonnetta Mr. David Corpus Mr. Chris Moss Ms. Dolores Ramirez Other Board Members present: Ms. Karen Charleston Mr. John Elliott Dr. Greg Gibson Others present: Brian Guthrie, TRS Dr. Keith Brown, Investment Advisor Ken Welch, TRS Steve Huff, Fiduciary Counsel, Reinhart Boerner Van Deuren s.c. Carolina de Onis, TRS Steve Voss, Aon Hewitt Britt Harris, TRS Philip Mullins, TSEU Jerry Albright, TRS Jase Auby, TRS Bernie Bozzelli, TRS Jaime Llanno, TRS Steve Peterson, TRS Chi Chai, TRS Patrick Cosgrove, TRS KJ Van Ackeren, TRS Dale West, TRS Katherine Farrell, TRS Investment Management Chair Joe Colonnetta called the meeting to order at 2:14 p.m.
1. Call roll of Committee members.
Ms. Farrell called the roll. A quorum was present.
2. Consider the approval of the proposed minutes of the December 1, 2016 committee meeting – Mr. Colonnetta.
On a motion by Mr. Kelly, seconded by Mr. Moss, the proposed minutes for the December 1, 2016 Investment Management Committee meeting were approved as presented.
3. Overview of Public Internal Markets – Chi Chai, Patrick Cosgrove and KJ Van Ackeren.
Mr. Chi Chai reported GBI was established in December 2007 and since inception has generated 40 basis points of alpha annualized. Mr. Chai stated there are three portfolios: GBI Flagship, GBI Gold and GBI High Quality. He said GBI Flagship is a $24 billion global portfolio, the single largest portfolio for TRS. He reported in 2016, the GBI Flagship underperformed for the first time however, it has outperformed the benchmark eight of the past nine years.
Mr. Chai reported GBI Gold is a $100 million portfolio, created seven years ago to diversify the trust. He said the GBI US High Quality portfolio is also $100 million.
Mr. Patrick Cosgrove discussed performance. He reported the GBI Flagship is made up of three components: GBI Core, GBI Quant, and GBI Alpha Opportunity. He said GBI Core is the largest portfolio under Flagship at $20 billion. It had an investment return for the year of 7.4 percent, alpha of minus 82 basis points. Mr. Cosgrove reported the GBI Quant is $2.7 billion in assets with a return of 6.5 percent, alpha of minus 177 basis points. He said the GBI US High Quality portfolio has been an R&D portfolio with assets of $100 million, an investment return of 6.9 percent. Mr. Cosgrove reported the GBI Alpha opportunity has $482 million in assets with an investment return of a minus 1.7 percent, negative alpha of 989 basis points.
Mr. KJ Van Ackeren provided a report on the portfolio characteristics. He said there are two main takeaways when comparing the GBI portfolio to the index. First, the GBI portfolio is more value-oriented and second it is higher quality as shown in the return on equity portfolio. He said the beta to market remains around 1, indicating no significant directional risk. Mr. Ackeren discussed the 2016 accomplishments and the 2017 priorities.
4. Review Annual Trading – Bernie Bozzelli, Steve Peterson and Jaime Llano.
Mr. Bernie Bozzelli reviewed the major functions performed by the trading desk. He reported for global equity trading placed in second quartile versus peer universe. For seven straight years he said they have either been first or second quartile. Mr. Bozzelli said most of the trading is associated with implementing investment decision for IPM, asset allocation, and the risk group as well as performing transition management services for the EPU group. Mr. Bozzelli reported for 2016 the trading group executed over $70 billion in notional value, which included 79,000 equity trades in 45 different countries, 4,700 future contract trades across 59 different global future contracts and 5,500 foreign currency trades across 23 different currencies. Mr. Bozzelli reviewed the trading partner’s networks and structure. He also explained how a new broker is evaluated and selected. Mr. Steve Peterson reported on the performance of the equity desk for 2016. In comparing the trading desk with peers, he said they outperformed the median desk by three basis points. Mr. Peterson also reported they manage the passive portfolios which holds $1 billion in total assets. He said there was positive alpha in the US and the non US developed accounts and some negative alpha in the emerging markets account.

Mr. Jaime Llano reviewed the 2016 accomplishments and the 2017 priorities. He said for 2016 one goal was to minimize the amount of trades that do not settle on time to 1 percent. He reported for 2016 only .33 percent of trades did not settle on time. He said for 2017 they are working on adding a currency electronic market maker to the competitive trading system. Mr. Bozzelli then discussed the how the two exchange model of the 2000s has morphed into a multiple exchange environment due to a series of regulatory changes. He reported the IEX was approved in June 2016 by the SEC to be an exchange and it expects to receive approval to start listing stocks by this June.
5. Optimize TRS IMD Public Equity Portfolio: Phase 2 Update – Jase Auby, Dale West
and Chi Chai
Mr. Jase Auby discussed how Project Alpha is a three phase project, with the first phase covering June 2016 to December 2016. This first phase was to go out in the market and review best practices and to develop a database and metrics internally. He said they are currently in the middle of Phase 2 which covers January 2017 to June 2017. This phase is to identify all optimal alpha streams and eliminate any redundant or unproductive streams, creating an optimal single strategy for the trust. He said Phase 3, scheduled for after June 2017 is to implement these decisions.
Mr. Auby reported currently there are 49 total alpha streams in the global public equity portfolio. He stated they reviewed these streams through a descriptive and numerical lens. Mr. Auby said this process was about common language for all of the alpha streams to be reviewed and analyzed in a standardized way. Mr. Dale West provided further information on the descriptive lens analysis. Mr. Chai provided further information on the numerical lens analysis. Mr. Auby reported that once the alpha streams are reconciled, the next step is to optimize the portfolio into a single integrated portfolio.
Mr. Britt Harris reviewed IMD’s perpetual five priorities and the five super priorities for this year.
Without further discussion, the committee adjourned at 3:30 p.m. APPROVED BY THE INVESTMENT MANAGEMENT COMMITTEE OF THE BOARD OF TRUSTEES OF THE TEACHER RETIREMENT SYSTEM OF TEXAS ON THE 1st DAY OF June 2017.
______________________________ _________________ Katherine H. Farrell Date Secretary of the TRS Board of Trustees


External Private Markets
Eric Lang, Senior Managing DirectorJune 2017

2
Agenda
I. Private Markets Executive Summary
II. Private Markets Organizational Structure
III. TRICOT
IV. Private Market Environment
V. Conclusion

3
Private Markets Executive Summary
1State Street as of 03/31/17 2Energy, Natural Resources & Infrastructure (ENRI) IRR includes combined performance of ENR and Infrastructure since inception. ENRI TWR reflects ENR performance up to 09/30/16 and the combined performance of ENR and Infrastructure from 09/30/16 to 12/31/163Hamilton Lane and the Townsend Group4S&P 500 drawdown period 03/31/07 to 03/31/09, TRS Private Equity drawdown period 03/31/07 to 06/30/09, TRS Real Assets drawdown period 03/31/07 to 03/31/10 and TRS ENRI drawdown period 06/30/14 to 03/31/165Includes investments approved by Internal Investment Committee through 12/31/16
Principal Investments Performance
Portfolio Market Value% of
Portfolio No.1-YearTWR
3-YearTWR
5-YearTWR
1-YearIRR
3-YearIRR
5-YearIRR
SIIRR
Private Equity $3,524 20.7% 37 11.7% 10.5% 18.3% 12.3% 10.2% 18.2% 17.8%Real Assets 6,046 35.2% 56 12.4% 14.6% 14.0% 12.8% 15.2% 14.6% 17.3%Energy, Natural Resources & Infrastructure 1,329 25.3% 18 - - - 25.6% 17.8% 18.2% 17.6%Total $10,899 27.6% 111 - - - 13.9% 13.8% 16.0% 17.4%
Diversification Impact
Economic RegimePrivateEquity
Real Assets ENRI
Stable Value (0.36) (0.33) (0.20)
Global Equity 0.87 0.31 0.48 Real Return 0.53 0.46 0.41
GOOD DIVERSIFICATION
Risk Impact
PortfolioVolatility Draw
Down4Observed Risk ProxyS&P 500 17.7% 17.7% 45.8%Private Equity 11.6% 22.6% 29.9%Real Assets 12.4% 23.0% 41.5%ENRI 8.9% 20.9% 23.1%
Portfolio Performance1
Portfolio Market Value% of Trust
1-YearTWR
3-YearTWR
5-YearTWR
1-YearIRR
3-YearIRR
5-YearIRR
SIIRR
Expected Market Return3
PL Invested
ManagersPrivate Equity $16,998 12.3% 10.4% 10.5% 14.1% 10.3% 10.3% 14.6% 13.0% 11.0% 37 Real Assets 17,180 12.5% 9.5% 11.9% 12.0% 9.2% 11.7% 12.4% 8.6% 8.0% 37 Energy, Natural Resources & Infrastructure2 5,274 3.8% 15.4% (0.5%) - 19.4% 5.0% 5.8% 6.3% 12.3% 19 Total $39,452 28.6% - - - 10.8% 10.3% 12.6% 10.6% 9.9% 93
2016 Premier List Investment Activity5
Portfolio Funds PIs TotalPrivate Equity 15 6 21
Real Assets 12 6 18
ENRI 4 2 6
Total 31 14 45

4
ENRI$5 billion
Private Equity$17 billion
Real Assets$17 billion
TRICOTTRS London
Private Markets Organization Structure
Allen MacDonell, CFASr. Investment ManagerBBA U. of GeorgiaMBA Georgia State
Eric LangSr. Managing DirectorBBA UT AustinMBA U. of Houston
TRICOT (TRS LONDON)
Kimberly CareySr. AssociateBA Texas A&M
Laura Saxty-SmithContractor
Thomas Albright, CFASr. AssociateBA Dartmouth College
Barbara Woodard, CPASr. AssociateBBA Texas A&M
Jeff StaffordAssociateBS Pepperdine, U. Canberra
Melissa KleihegeDeal Flow AnalystBS Texas A&M
Carolyn HansardDirector – ENRIBS, MBA UT Austin
Neil RandallSr. Director – Private EquityBBA Texas A&MMS Texas A&M
Grant WalkerSr. Director – Real AssetsBBA BaylorMBA St. Edwards
Andre WeilenmannContractorBA U. of ZurichMA HSG U. of St Gallen
PRIVATE MARKETS DATA ANALYTICS AND SUPPORT
Gracie MarshProgram AnalystBA UC Davis
Private Markets$40 billion

5
TRICOT
• In 2015, TRS established a London Office (TRICOT) to be considered the “preferred destination for large, attractive, investments”
o Increased deal flow by 50%o Improved risk controlso Better due diligenceo Rapid response o Cost savings
• London office (TRICOT) staffed with four team members, led by Allen MacDonell
• Built relationships with over 50 London-based Premier List managers
• Exceeded deal flow goalo Sourced 91 opportunities ($10.2 billion)o 50% increase in deal flow; 130% increase above
2014
• Essential in TRS closing four deals totaling $455 million of co-investment o Expected net return above 12.5%o $7.6 million in annual fee savings
Goals Updates

6
6.06.57.07.58.08.59.09.5
10.010.511.0
1995
1997
1999
2001
2003
2005
2007
2009
2011
2013
2015
2017
$0
$4
$8
$12
$16
$20
$0
$20
$40
$60
$80
$100
$120
$140
1997
1999
2001
2003
2005
2007
2009
2011
2013
2015
2017
Oil
Gas
4%
5%
6%
7%
8%
9%
10%
1995
1997
1999
2001
2003
2005
2007
2009
2011
2013
2015
2017
Private Market Environment
• Private Equity and Real Assets are in high valuation environments with substantial capital inflow and energy markets are in recovery phase
o High EBITDA multiples in Private Equity and low cap rates in Real Assets continue to be a challenge to navigate
o Energy prices are off their cyclical highs
o TRS maintains Valuation Environment reports on a quarterly basis to monitor changes
Source: S&P, NCREIF, EIA
EBITDA Multiples Near Peak
Cap Rates are at their lows
Private Equity Real Assets Cap Rates
Oil Prices crashed in 2015, but strengthened
Energy Markets

7
Conclusion
• All External Private Market areas are functioning well
o TRICOT on plan and is fully integrated
o Successful cross team collaboration
• Private Equity and Real Assets are fully valued; Energy markets are stabilizing
• TRS continues to be a thought leader in private investing
• Continue to develop competitive advantages versus competition
• Focus in 2017 is the Private Markets Super Priority
• Preferred Destination for large attractive global investments


Private Equity
Neil Randall, Senior DirectorJune 2017

2
Agenda
I. Executive Summary
II. Organizational Structure
III. Capital Plan
IV. Performance
V. Market Conditions
VI. Summary
VII. Appendix

3
Executive Summary
1State Street as of 12/31/162State Street as of 3/31/173TUCS as of 12/31/164State Street as of 12/31/165Hamilton Lane6TRS Risk Group
PERFORMANCE PORTFOLIO GROWTH4
Asset Class1-Year Return
3-Year Return
5-Year Return Private Equity ($ millions) 1-Year 3-Year 5-Year
Private Equity IRR1 10.3% 10.3% 14.6% Ending Value $16,998 $16,998 $16,998Private Equity TWR2 10.4% 10.5% 14.1% less Starting Value 15,346 14,858 11,369Private Equity Benchmark2 9.6% 8.6% 11.1% less Contributions 3,249 9,456 14,397Private Equity Excess Return 0.8% 1.9% 3.0% plus Distributions 3,188 11,916 18,344
TUCS Peer Comparison3 47th 25th 5th Investment Return $1,591 $4,600 $9,576
LONG-TERM MARKET RETURN AND RISK EXPECTATIONS
StyleTarget Portfolio
Weight Strategic Goal Expected Market
Return5Public Risk
Proxy6
Buyout 70.0% Equity Alpha 11.5% 22.4%
Growth Equity / Venture 15.0% Equity Alpha 10.0% 27.2%
Credit / Special Situations 15.0% Diversification 10.0% 17.9%
Private Equity TOTAL 100.0% Equity Alpha / Diversification 11.0% 22.6%
ALLOCATION SUMMARY Style % of Portfolio % of Total Trust
12/31/2016 12/31/2015 Change 12/31/2016 12/31/2015 Change
Buyout 66.1% 67.8% (1.7%) 8.1% 8.1% 0.0%Growth Equity / Venture 16.6% 14.4% 2.2% 2.1% 1.7% 0.4%Credit / Special Situations 13.1% 13.7% (0.6%) 1.6% 1.7% (0.1%)Emerging Managers 4.2% 4.1% 0.1% 0.5% 0.5% 0.0%Private Equity TOTAL 100.0% 100.0% - 12.3% 12.0% 0.3%Target % of Total Trust 13.0% 13.0%

4
Executive Summary Role in the TRS Trust
Risk Parity 5%
Real Return
22%
Global Equity57%
PRIVATE EQUITY
Target Portfolio Weight
Expected Market Return2
Volatility
Portfolio Target Observed3Public
Risk Proxy4
Buyout 70% 11.5% 11.3% 22.4%Growth Equity / Venture 15% 10.0% 7.9% 27.2%Credit / Special Situations 15% 10.0% 18.4% 17.9%Private Equity Total 100% 11.0% 11.6% 22.6%
Performance IRR5 TWR6Policy
Benchmark TUCS Rank7
1-Year Return 10.3% 10.4% 9.6% 47th
3-Year Return 10.3% 10.5% 8.6% 25th
5-Year Return 14.6% 14.1% 11.1% 5Th
Drawdown Risk Drawdown8
S&P 500 45.8%Russell 2000 47.9%TRS Private Equity 29.9%
Stable Value16%
1TRS Risk Group; Three year quarterly observations as of 12/31/162Hamilton Lane3Hamilton Lane; TRS Private Equity portfolio from 12/31/07 through 9/30/164TRS Risk Group5State Street as of 12/31/166State Street as of 3/31/177TUCS as of 12/31/168S&P 500 drawdown period 3/31/07 to 3/31/09, Russell 2000 drawdown period 3/31/07 to 3/31/09; and TRS Private Equity drawdown period 3/31/07 to 6/30/09
Three Year Correlation1
(0.36) 0.87 0.53
Global Equity57%
Private Equity13%
TRUST ALLOCATION

5
Executive SummaryPrivate Equity Value Added
• Private Equity performance relative to Public Markets
• $8.3 billion of value added net of fees
• Since inception alpha versus MSCI ACWI: 608 bps
$0.2 $0.3 $0.4$0.9 $1.2 $1.3 $1.7
$3.1 $3.3
$5.3
$7.3$8.0
$9.2$10.1 $9.6
$8.0$8.7
$0.2 $0.3 $0.5 $0.9$1.5
$2.0$2.8
$4.7 $4.9
$6.8
$9.6
$11.4
$13.3
$14.9$15.8 $15.3
$17.0
0.0
2.0
4.0
6.0
8.0
10.0
12.0
14.0
16.0
18.0
2000 2001 2002 2003 2004 2005 2006 2007 2008 2009 2010 2011 2012 2013 2014 2015 2016
$ Bi
llion
s
Public Market MV Private Market MV
Source: State Street, Hamilton Lane; values through 12/31/16Note: Public Market values calculated by assuming investments were made in the MSCI All World index in the same size and timing as TRS Private Equity cash flows

6
Organizational Structure
Neil RandallSr. DirectorBBA Texas A&MMS Texas A&M
Michael LazorikDirectorBBA UT Austin
Tamara PolewikSr. Investment ManagerBA Dartmouth CollegeMBA U. of Chicago
Scott RamsowerSr. Investment ManagerBBA Texas A&M
Brad ThawleySr. Investment ManagerBBA Bucknell U.
Allen MacDonell, CFASr. Investment ManagerBBA U. of GeorgiaMBA Georgia State
Shelby Wanstrath, CFASr. Investment ManagerBBA SMUMS SMUMBA London Business
Will Carpenter, CFAInvestment ManagerBBA Texas A&MMS Texas A&M
Joseph HurtekantAssociateBBA U. of Notre Dame
Kaitlin SpensleyAssociateBBA U. Richmond
Thomas Albright, CFA Sr. AssociateBA Dartmouth College
Justin WangAssociateBBA UT Austin
Carter WareAssociateBA U. of Virginia
Samuel DobberpuhlAnalystBA Pepperdine U.
Andre WeilenmannAssociateBA U. of ZurichMA HSG U. of St. Gallen
Advisors and ConsultantsBlackRock and Hamilton Lane
TRICOT (PRIVATE EQUITY)

7
This slide was intentionally left blank.

8
PerformanceAsset Growth, Allocation, and Returns
1State Street as of 12/31/162State Street as of 3/31/17; excludes Emerging Managers3State Street as of 3/31/174State Street as of 12/31/165Hamilton Lane
Growth ($ millions)1 1-Year 3-Year 5-YearEnding Value $16,998 $16,998 $16,998
less Starting Value 15,346 14,858 11,369
less Contributions 3,249 9,456 14,397
plus Distributions 3,188 11,916 18,344
Investment Return $1,591 $4,600 $9,576
Premier List Investments2 Total
CommittedSince
1/2016
CommittedSince
1/2013Number of Invested Premier Managers 37 19 35
Percent Committed in Funds 88% 83% 81%
Percent Committed in Principal Investments 12% 17% 19%
Style
Allocation Investment Returns Expected Market Return5
2016 2013 20111-Year TWR3
3-Year TWR3
SI IRR4
Buyout 66.1% 74.1% 74.6% 10.2% 11.7% 13.8% 11.5%Growth Equity / Venture 16.6% 9.3% 8.4% 10.0% 11.2% 9.6% 10.0%Credit / Special Situations 13.1% 13.2% 13.4% 11.4% 4.7% 11.5% 10.0%Emerging Managers 4.2% 3.4% 3.6% 10.5% 10.8% 9.1% 11.5%
Private Equity Total 100.0% 100.0% 100.0% 10.4% 10.5% 13.0% 11.0%
Private Equity % of Trust
0%
2%
4%
6%
8%
10%
12%
14%
PE % of Trust PE Target

9
PerformanceTRS Vintage Year Comparison
Source: State Street as of 12/31/16, SSPEI as of 12/31/16; excludes Emerging Managers
• Outperformed benchmark in over 75% of vintage years since 2000
13.2%
25.0%
12.5%
28.4%
15.6%
10.5%
8.1%8.9%
15.8% 15.5%
13.4%
17.2%
13.2%12.3%
5.5%
12.5%
0.6%
10.5%
17.0%
19.8%
17.7%
13.0%
9.7%
6.4%
9.5%
11.8%13.0%
11.8%
15.3%14.3%
11.1% 11.6%
8.4%
-2.0%
-5.0%
0.0%
5.0%
10.0%
15.0%
20.0%
25.0%
30.0%
2000 2001 2002 2003 2004 2005 2006 2007 2008 2009 2010 2011 2012 2013 2014 2015 2016TRS Vintage Year IRR (SI) SSPEI Vintage Year Benchmark
2000 2001 2002 2003 2004 2005 2006 2007 2008 2009 2010 2011 2012 2013 2014 2015 2016($ millions)Committed $275 $856 $238 $456 $464 $497 $2,363 $4,276 $3,743 $2,809 $806 $1,595 $3,168 $3,057 $2,457 $3,503 $3,765Net Called 273 852 237 445 433 462 2,251 3,965 3,396 2,510 710 1,376 2,571 1,812 1,333 1,490 611 Unfunded 2 4 1 11 31 35 112 311 347 299 96 219 597 1,245 1,124 2,013 3,154

10
PerformancePE Principal Investments
• Private Equity continues to focus on being a Preferred Destination for Principal Investments for our partners
• Committed $500 million to six Principal Investments in 2016
• Plan was $1.0 billion in Principal Investments; commitments were lower due to conservative baselines
Source: State Street as of 12/31/16
Investment NumberTotal
CommitmentTotal
FundedTotal
DistributionsNet Asset
Value SI IRRInvestment
Multiple
Co-Invest 25 $2,260 $1,966 $768 $2,201 20.2% 1.5x
Direct 2 375 375 142 416 10.7% 1.5x
Co-Invest Funds (BlackRock) 3 1,050 789 430 713 19.0% 1.5x
Sidecar Funds 7 906 192 0 193 1.0% 1.0x
TOTAL PRIVATE EQUITY PRINCIPAL INVESTMENTS 37 $4,590 $3,322 $1,340 $3,524 17.8% 1.5x

11
Current Rates
$ Dry Powder
$ Raised
$ Invested
$ Distributed
LeverageMultiple
PriceMultiple
Source: Preqin, St. Louis Federal Reserve, Dealogic, S&P LCD, Bloomberg, Credit Suisse
2016 (Today) 2007 (Peak) 2009 (Trough)
Attractive (To Buyer) Unattractive (To Buyer)
What has stayed the same?• Price and leverage remain historically high
• PE firms are actively selling and generating large distributions
What metrics are transitioning to Unattractive?• 2016 transaction volume reached its highest level since
the peak in 2007 (although still ~50% of the 2007)
• Fundraising levels (and dry powder) have been steadily increasing
What to watch?• Rate declines have led to historically low cost of debt
• A significant upward trend in rates could have a material impact on future valuations
Market Conditions

12
Market Conditions
Source: Preqin, St. Louis Federal Reserve, Dealogic, S&P LCD, Bloomberg, Credit Suisse
Long-Term Average(excl. 2006-2007)
2016 "Today"
2009 "Trough"
2007 "Peak"
2002 "Pre-Peak"
Supply of CapitalCapital Raised ($ billions) $210 $355 $169 $373 $94Number of Funds Raised 629 756 529 810 431Percent of US GDP 1.4% 1.9% 1.2% 2.5% 0.8%Demand for CapitalTotal Value of PE-Backed Buyout Transactions ($ billions) $201 $272 $94 $804 $90Number of Closed Buyout Deals 847 496 812 1,502 578Percent of Transactions > $1 billion 7.5% 16.5% 3.8% 12.5% 4.0%Average LBO Size ($ millions) $244 $548 $116 $535 $156Largest LBO ($ millions) $9,608 $18,982 $5,286 $43,797 $4,971RealizationsTotal Value of PE-Backed Exits ($ billions) $203 $333 $94 $298 $26Number of Companies 1,081 1,818 858 1,368 256Dry PowderTotal Amount ($ billions) $607 $914 $737 $693 $180Percent of Dollars Invested 299% 336% 783% 86% 200%Pricing (EV/EBITDA Multiple)Sponsor-Backed Buyouts Average 8.2x 10.0x 7.7x 9.7x 6.6x Strategic Buyers Average 8.5x 9.6x 8.3x 8.7x 7.3x Public Market Average (MSCI US) 11.2x 13.0x 8.3x 11.2x 12.0x DebtDebt Availability (1=hard to access; 10=easy to access) 5 8 2 10 5Total Leveraged Loan and High Yield Volume ($ billions) $414 $705 $219 $562 $130Typical Pricing 7.1% 5.5% 7.4% 8.3% 8.6%Average Debt/EBITDA Multiple 4.9x 5.5x 4.0x 6.2x 4.0x Average % Debt Used in Transactions 63% 59% 54% 69% 63%

13
Summary
2016 2017
• Commit up to $4.2 billion
• Continue Texas Way of investing
• Maintain conservative baselines in high valuation environment
• Improve cost structure to ensure TRS retains alpha
• Prepare for TRICOT team transition in 2018
• Successful ILPA template implementation
• Continue to be a preferred global destination for large, attractive investments
• Generated 11.0% 10-year return – top decile TUCS performance1
• Returned 10.3% and 14.6%, respectively for 3- and 5-year periods –top quartile TUCS performance for both periodso Added 3-year and 5-year alpha of 188 and 301 basis points, respectively2
• American Investment Council ranked TRS first for annualized 10-year PE performance
• Integrated TRICOT within Private Markets; doubled European deal flow despite downturn in activity due to Brexit
• Market conditions: Predominantly overvalued from a long-term perspective; record high dry powder
• Private Equity allocation below long-term target but on track to meet the 13% target by the end of 2017
• Committed approximately $3.8 billion to 22 investmentso $3.1 billion to 15 Premier List Fundso $507 million to 6 Principal Investments3
o $150 million to Emerging Managers
1TUCS as of 12/31/162State Street as of 3/31/173Includes $205 million to 3 sidecar investments

APPENDIX

15
Private Equity Strategy Definitions
Buyout
• Encompasses broad spectrum of small buyout managers to global platforms with >$100 billion in AUM. Emphasis on managers with substantial operational expertise and ability to generate co-investment
Growth Equity & Venture Capital
• Emphasis on larger managers (>$750 million in fund size) investing in the full range of early stage venture to growth capital
Credit & Special Situations
• Managers with expertise spanning liquid trading strategies, mezzanine, distress-for-control, and asset purchases

16
This slide was intentionally left blank.

17
This slide was intentionally left blank.

18
This slide was intentionally left blank.

19
This slide was intentionally left blank.

20
This slide was intentionally left blank.

21
This slide was intentionally left blank.

22
This slide was intentionally left blank.

23
This slide was intentionally left blank.

24
This slide was intentionally left blank.

25
This slide was intentionally left blank.

26
This slide was intentionally left blank.

27
This slide was intentionally left blank.

28
This slide was intentionally left blank.

Real Assets
Grant Walker, Senior DirectorJune 2017

2
Agenda
I. Executive Summary
II. Organizational Structure
III. Capital Plan
IV. Performance
V. Market Conditions
VI. Fiduciary Audit Update
VII. Summary
VIII. Appendix

3
Executive Summary
PERFORMANCE PORTFOLIO GROWTH4
Asset Class1-Year Return
3-Year Return
5-Year Return Real Assets ($ millions) 1-Year 3-Year 5-Year
Real Assets IRR1 9.2% 11.7% 12.4% Ending Value $17,180 $17,180 $17,180Real Assets TWR2 9.5% 11.9% 12.0% less Starting Value 16,402 14,020 10,345Real Assets Benchmark TWR2 7.8% 11.0% 11.2% less Contributions 3,421 9,651 14,293Real Assets Excess Return TWR 1.7% 0.9% 0.8% plus Distributions 4,134 11,589 15,628
TUCS Peer Comparison3 26th 33rd 18th Investment Return $1,492 $5,098 $8,170
LONG-TERM MARKET RETURN AND RISK EXPECTATIONS
StyleTarget Portfolio
Weight Strategic Goal Expected Market
Return5Public Risk
Proxy6
Core 40.0% Diversification/Beta/Inflation Protection 7.0% 16.6%Value-Add 12.5% Return Enhancement/Inflation Protection 7.5% 22.6%Opportunistic 35.0% Return Enhancement 9.5% 32.9%Real Assets Special Situations (RASS) 12.5% Relative Value 8.0% 19.6%Other Real Assets 0.0% Inflation Protection 7.0% 33.2%REAL ASSETS TOTAL 100.0% Diversification/Inflation Protection 8.0% 23.0%
ALLOCATION SUMMARYStyle % of Portfolio % of Total Trust7
12/31/2016 12/31/2015 Change 12/31/2016 12/31/2015 ChangeCore 34.2% 33.1% 1.1% 4.3% 4.6% (0.4%)Value-Add 17.3% 12.8% 4.5% 2.2% 1.8% 0.4%Opportunistic 30.1% 30.7% (0.6%) 3.7% 4.3% (0.6%)Real Assets Special Situations (RASS) 13.8% 10.9% 2.9% 1.7% 1.5% 0.2%Other Real Assets 1.6% 10.4% (8.8%) 0.2% 1.5% (1.3%)Emerging Managers 3.0% 2.1% 0.9% 0.4% 0.3% 0.1%REAL ASSETS TOTAL 100.0% 100.0% - 12.5% 14.0% (1.5%)Target % of Total Trust 14.0% 16.0%
1 State Street as of 12/31/16, excludes ENRI2 State Street as of 03/31/17 3 TUCS as of 12/31/164 State Street as of 12/31/16, excludes ENRI, includes Emerging Managers5 Townsend 6 TRS Risk Group7 RA Allocation target decreased from 16.0% to 14.0% as of 09/30/16

4
Executive SummaryRole in the TRS Trust
1 TRS Risk Group; Three year quarterly observations as of 12/31/162 Townsend3 Townsend; TRS Real Assets portfolio from 12/31/06 through 09/30/164 TRS Risk Group5 State Street as of 12/31/16 6 TUCS as of 12/31/16 7 S&P 500 drawdown period 03/31/07 to 03/31/09, REITs drawdown period 03/31/07 to 03/31/09, and TRS Real Assets drawdown period 03/31/07 to 03/31/10
Risk Parity 5%
Real Return
22%
Real Assets 14%
Global Equity57%
REAL ASSETSTarget
Portfolio Weight
Expected Market Return2
Volatility
Portfolio Target Observed3Public
Risk Proxy4
Core 40.0% 7.0% 7.1% 16.6%Value-Add 12.5% 7.5% 14.9% 22.6%Opportunistic 35.0% 9.5% 18.5% 32.9%RASS 12.5% 8.0% 17.9% 19.6%Other Real Assets 0.0% 7.0% 6.6% 33.2%Real Assets Total 100.0% 8.0% 12.4% 23.0%
Performance5 IRR TWRPolicy
Benchmark TUCS Rank6
1-Year Return 9.2% 9.5% 7.8% 26th
3-Year Return 11.7% 11.9% 11.0% 33rd
5-Year Return 12.4% 12.0% 11.2% 18th
Drawdown Risk Drawdown7
S&P 500 45.8%REITs (MSCI US REITs) 66.4%TRS Real Assets 41.5%
Stable Value16%
Three Year Correlation1
(0.33) 0.31 0.46
Global Equity57%
TRUST ALLOCATION

5
Organization Structure
Craig Rochette, CFA, CAIASr. Investment ManagerBS U. of Arizona
Jennifer WenzelSr. Investment ManagerBBA UT Austin
Matt HalsteadInvestment ManagerBBA, MPA UT Austin
Jared Morris, CFAInvestment ManagerBBA Texas A&MMS Texas A&M
Allen MacDonell, CFASr. Investment ManagerBBA U. of GeorgiaMBA Georgia State
Joyce ChowSr. AssociateAB PrincetonMBA Wharton
Brendan CooperSr. AssociateBA Carleton College MS Univ. of Minnesota
Malorie LeeSr. AnalystBBA Texas A&M
Stephanie DaulSr. AnalystBBA Texas State
Kimberly CareySr. AssociateBA Texas A&M
Haley TrainorSr. AnalystBS Northwestern
Gracie MarshProgram AnalystBA UC Davis
VacantAnalyst
Andre WeilenmannContractorBA U. of ZurichMA HSG U. of St Gallen
Advisors and ConsultantsTownsend Group and LaSalle
TRICOT (REAL ASSETS)
Grant WalkerSr. DirectorBBA BaylorMBA St. Edwards

6
This slide was intentionally left blank.

7
PerformanceAsset Growth, Allocation, and Returns
1State Street as of 12/31/16, excludes ENRI, includes Emerging Managers2State Street as of 12/31/16, excludes ENRI3Townsend as of 12/31/16 4State Street as of 03/31/17 5Townsend
Portfolio Growth ($ millions)1 1-Year 3-Year 5-YearEnding Value $17,180 $17,180 $17,180
less Starting Value 16,402 14,020 10,345
less Contributions 3,421 9,651 14,293
plus Distributions 4,134 11,589 15,628
Investment Return $1,492 $5,098 $8,170
Premier List Investments2 Total2
CommittedSince
1/2016
CommittedSince
1/2013Number of Invested Premier Managers 37 17 28
Percent Committed in Funds 66% 61% 59%
Percent Committed in Principal Investments 34% 39% 41%
StyleTRS
Leverage3Typical
Leverage
Allocation Investment Returns (TWR)4Expected
Market Return52016 2013 2011 1-Year 3-Year 5-YearCore 32.5% 25 - 50% 34.2% 32.1% 35.5% 9.6% 13.0% 12.6% 7.0%Value-Add 43.2% 40 - 65% 17.3% 11.9% 10.4% 11.2% 13.5% 15.5% 7.5%Opportunistic 43.5% 55 - 80% 30.1% 35.3% 33.0% 5.9% 9.7% 10.6% 9.5%RASS 57.3% Varies 13.8% 9.8% 11.8% 14.3% 12.7% 13.8% 8.0%Other Real Assets 13.1% < 70% 1.6% 9.7% 9.1% 12.8% 12.2% 9.9% 7.0%Emerging Managers 33.2% 55 - 80% 3.0% 1.1% 0.2% 9.4% 13.6% 12.6% 9.5%Real Assets Total 42.6% 100.0% 100.0% 100.0% 9.5% 11.9% 12.0% 8.0%
Real Assets % of Trust
0%
2%
4%
6%
8%
10%
12%
14%
16%
RA % of Trust RA Target

8
PerformanceTRS Real Estate Vintage Year Comparison1
Source: State Street TWRs for real estate portfolio as of 12/31/16 1Vintage year comparison includes emerging managers, excludes ENRI
2006 2007 2008 2009 2010 2011 2012 2013 2014 2015 2016($ millions)Committed $1,176 $3,644 $3,111 $2,442 $3,588 $1,390 $1,972 $1,869 $3,376 $3,910 $4,801 Net Called 1,116 3,551 2,967 1,898 3,158 1,171 1,495 1,427 1,966 1,839 1,301Unfunded 60 93 144 545 429 219 477 441 1,410 2,071 3,500
2.0%
-0.3%
2.8%
15.3%14.2%
10.3% 10.9%
18.6%17.7%
9.3%
29.4%
5.6% 4.5% 3.3% 5.5%
13.0%12.6% 12.0%
12.8% 12.7% 14.0%
9.1%
-5.0%
0.0%
5.0%
10.0%
15.0%
20.0%
25.0%
30.0%
35.0%
2006 2007 2008 2009 2010 2011 2012 2013 2014 2015 2016
TRS Vintage Yr TWR (SI) ODCE TWR Benchmark

9
Performance RA Principal Investments
• Real Assets has focused on becoming a Preferred Destination for Principal Investments with our partners (refer to the Appendix for a detailed explanation of Principal Investment types)
• Committed approximately $1.6 billion to Principal Investments (including sidecars) in 2016
Source: State Street as of 12/31/16
Investment Number Total Commitment
Total Funded
Total Distributions
Net Asset Value SI IRR Investment
MultipleDirect 9 $2,429 $2,285 $1,392 $1,962 19.3% 1.6xCo-Invest 15 1,806 1,456 946 1,065 19.0% 1.4xCo-Invest Funds (LaSalle) 3 900 512 517 243 20.2% 1.5xSingle LP 13 3,143 4,354 3,284 2,345 15.0% 1.3xSidecar 16 1,386 741 554 431 18.7% 1.3x
TOTAL REAL ASSETS PRINCIPAL INVESTMENTS 56 $9,663 $9,349 $6,693 $6,046 17.3% 1.4x
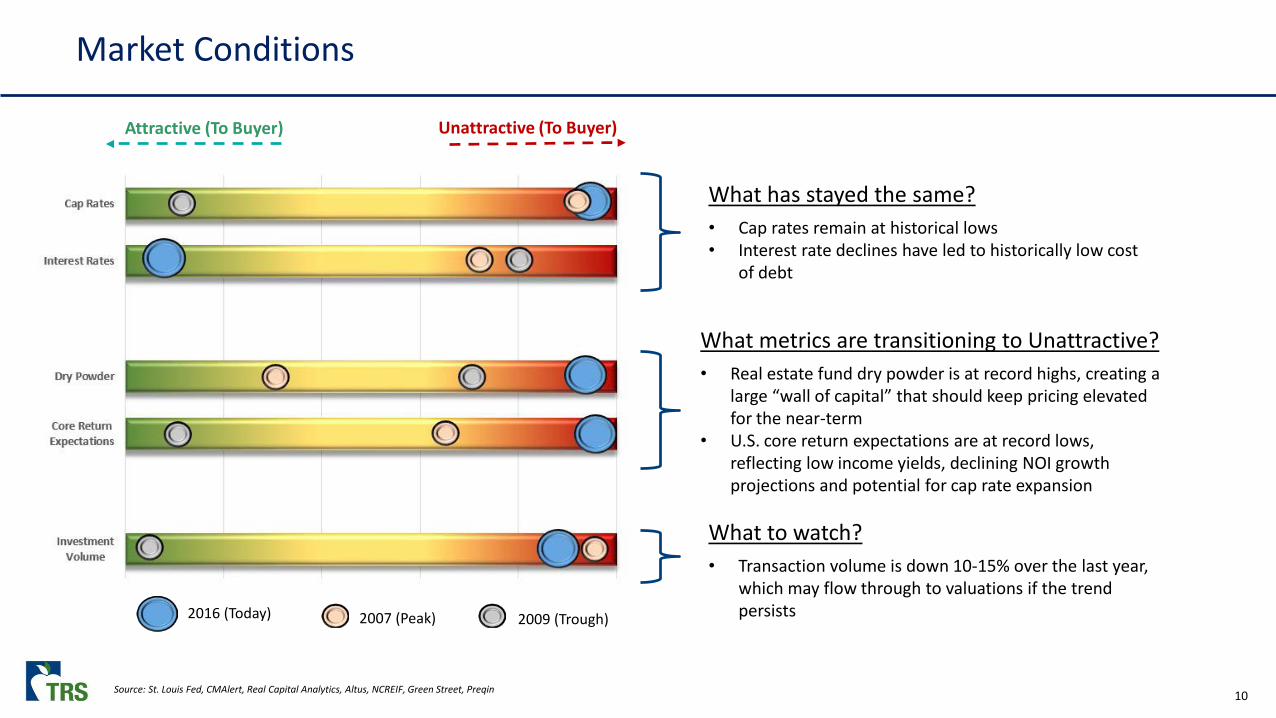
10Source: St. Louis Fed, CMAlert, Real Capital Analytics, Altus, NCREIF, Green Street, Preqin
2016 (Today) 2007 (Peak) 2009 (Trough)
Attractive (To Buyer) Unattractive (To Buyer)
What has stayed the same?• Cap rates remain at historical lows• Interest rate declines have led to historically low cost
of debt
What metrics are transitioning to Unattractive?• Real estate fund dry powder is at record highs, creating a
large “wall of capital” that should keep pricing elevated for the near-term
• U.S. core return expectations are at record lows, reflecting low income yields, declining NOI growth projections and potential for cap rate expansion
What to watch?• Transaction volume is down 10-15% over the last year,
which may flow through to valuations if the trend persists
Market Conditions

11
Market ConditionsDomestic Only
Source: NCREIF, Real Capital Analytics, Preqin, Commercial Mortgage Alert1 Foreign direct buyers of U.S. real estate
10-Year Average
2016 “Today”
2009 "Trough"
2007"Peak"
2004"Pre-Peak"
FundraisingNumber of Funds Raised 155 155 101 160 94Fund Capital Raised ($ billion) $55 $69 $26 $61 $27Dry Powder ($ billion) $99 $133 $95 $84 $37REIT Capital Offerings ($ billion) $53 $70 $35 $36 $39
TransactionsAll Transaction Volume ($ billion) $334 $494 $69 $573 $370% of US GDP 2.0% 2.6% 0.5% 4.0% 2.8%Cross-Border Trans. Volume ($ billion) 1 $41 $66 $5 $48 $25Cross-Border Share of All Transactions1 11% 13% 7% 8% 7%PricingTransactional Cap Rates – All RE 6.8% 6.3% 7.4% 6.7% 7.5%Institutional Implied Core Cap Rates 5.4% 4.5% 6.5% 5.1% 6.9%Inst. Cap Rate Spread to UST 2.6% 2.7% 3.3% 0.5% 2.7%DebtCMBS Issuance $69 $76 $3 $229 $93Average Percent Debt 60 - 70% 60 - 70% 65 - 70% 65 - 85% 65 - 70%Availability (1=hard to access; 10=easy) 6 6 2 10 5Terms NA Normal Standards Tight Standards Covenant Light Normal StandardsInterest Rate 4.25 - 6.25% 3.75 - 5.75% 5.0 – 7.0% 4.5 - 6.5% 4.5 – 6.5%

12
Market Conditions
Capital Markets
• U.S. RE fundamentals have moved slowly through the cycle, due to modest levels of new supply and steady demand
• U.S. capital markets have moved quicker – valuations are unlikely to further “mature” (rise)
• Across nearly all markets, there are no bargains – capital markets are ahead of fundamentalso Lone exception may be the U.K., where capital markets have fallen without a corresponding change in
fundamentalsReal Estate Fundamentals

13
Fiduciary Audit UpdateFiduciary Audit Overall Recommendation
TRS utilizes leading or prevailing policies and practices in all areas assessed by Funston.
No. Recommendation ImplementedIn-Process
Target Completion Date No Further Action1 Real Assets Principal Investing Program Expansion ✓2 Graduating Emerging Manager Funds ✓3 Standardization of Data Collection and Templates ✓4 Annual Capital Plan Reporting ✓5 Explore Potential Benefit of Foreign Currency Hedging ✓6 Portfolio Review Guidelines ✓7 Compliance Map ✓8 Replicate Aspects of the Strategic Partner Network (SPN) Q4 20179 Conduct Targeted Fee Audits Q4 2017
10 Valuation Audits Q4 201711 Active Direct Real Estate Investing Cost/Benefit Analysis Q4 201712 Compliance Charter; Improved Reporting and Coordination of Compliance Activities Q4 2017; Q3 201813 Consider Adoption of Leverage Limits ✓14 Consider Reference to Inflation Protection/Hedging in the Investment Policy Statement (IPS) ✓15 Consider Implementing Improvements to the Real Assets Benchmark ✓16 Consider Annual Limit on Commitments ✓

14
Summary
1 TUCS as of 12/31/16
• Generated 12.0% 5-year TWR – exceeded long-term return target over 5 years
• Top 20 percent amongst peers over a 5-year period1
• Real estate values are generally above pre-GFC peaks
• Reallocated Infrastructure portfolio to ENRI
• Exceeded TRICOT operating goals for 2016
• Committed approximately $4.2 billion to 20 investments
o $2.4 billion to 12 Premier List funds (excluding Sidecars and including SPNs)
o $1.6 billion to 6 Principal Investments (including Sidecars)
o $209 million to Emerging Managers
• Commit $2.0 billion
• Continue Texas Way of investing
• Complete the Fiduciary Audit Recommendations
• On track to meet 14% Trust Policy Target by end of 2018
• Expand TRICOT’s real estate capabilities with Real Assets team expertise
• Continue to be a preferred global destination for attractive investments
2016 Summary 2017 Priorities

APPENDIX

16
Real Asset Strategy Definitions
Core• Institutional quality, best-located and best-leased assets in the market in each of the traditional property types (office, multifamily,
retail, industrial)• Leverage limit is 50% loan-to-value (LTV)
Value-Add• Return-enhancing strategies executed at the property level designed to enhance value through execution of one or more of the
following strategies: lease-up, rehabilitation, repositioning• Typical leverage is 50% to 65% LTV
Opportunistic• Broad range of risk and return via opportunity funds, specialized investments, and mezzanine debt or equity with the majority of
strategies involving some level of development or distress• Leverage is usually 70% LTV and higher
Real Assets Special Situations (RASS)• Publicly traded shares of listed REITs (Real Estate Investment Trusts) and REOCs (Real Estate Operating Companies) or other real asset
related entities, public or private real asset debt
Other Real Assets (ORA)• Land and other opportunistic investments providing inflation protection with relatively low expected volatility

17
This slide was intentionally left blank.

18
This slide was intentionally left blank.

19
This slide was intentionally left blank.

20
Market ConditionsDomestic Only
• Average commercial property values are now 23% above the 2007 peak
• The industrial (warehouse) property sector has outperformed recently with values up 12% year-over-year
o The growth of e-commerce has been the major driver of warehouse demand
• There are wide value disparities depending on location, property type and asset quality
o The retail property sector is particularly bifurcated between thriving Class A shopping centers and failing malls
• U.S. core real estate returns have finally decelerated after six consecutive years ofdouble-digit returns
• Yield compression stalled in 2016 bringing property-level unlevered returns close to the long-term average (8.2% unlevered)
Source: Real Capital Analytics, NCREIF
80
100
120
140
160
180
200
220
240
2004 2005 2006 2007 2008 2009 2010 2011 2012 2013 2014 2015 2016 2017
Apartment Office Industrial Retail
Real Capital Analytics U.S. Commercial Property Price Index
NCREIF NPI Unlevered Return Attribution
-25%
-20%
-15%
-10%
-5%
0%
5%
10%
15%
20%
25%
2005 2006 2007 2008 2009 2010 2011 2012 2013 2014 2015 2016
Yield Compression
Cash Flow Yield
Cash Flow Growth
20.2%16.8% 15.8%
-6.5%
13.2%
-17.0%
14.3%
10.7% 11.0% 12.0%13.5%
8.0%

21
Market ConditionsDomestic Only
• Against the 10-year U.S. Treasury yield, U.S. cap rates maintain a reasonable spread compared to history
o Recent interest rate hikes may factor in to cap rates flattening, but there is no evidence of cap rate expansion yet
• The gap is historically wide between core cap rates for institutional-quality assets and the rest of the commercial real estate universe
• Cross-border investment has increased significantly over the last three years
o 2016 showed some drop-off in volume consistent with the broader market
o The bulk of the increase can be attributed to Asian (primarily Chinese) capital
o Foreign capital tends to focus on large “trophy” assets in prime coastal markets
Source: Real Capital Analytics, NCREIF
Cap Rate Yields v. 10-Year Treasury
Direct Acquisitions by Cross-Border Investors
0%
2%
4%
6%
8%
10%
2003 2004 2005 2006 2007 2008 2009 2010 2011 2012 2013 2014 2015 2016
All RE Cap Rates NPI Core Cap Rates 10-year Treasury
0
20
40
60
80
100
120
'03 '04 '05 '06 '07 '08 '09 '10 '11 '12 '13 '14 '15 16
Europe Mid-East Canada Asia Rest of WorldRolling 4Q ($B)

22
This slide was intentionally left blank.

23
This slide was intentionally left blank.

24
This slide was intentionally left blank.

25
This slide was intentionally left blank.

26
Types of Principal Investments
Co-Investment (Alongside a Fund)
Direct (Two Types)
Single Limited Partnership (LP) Fund
Sidecar (Two Types)
What: A specific investment opportunity that is brought to TRS by an existing manager
Why: Manager needs more capital than is available in the main fund (due to size, concentration, etc.)• TRS equity invests
alongside main fund and GP serves as fiduciary of the co-investment vehicle
• RA terms are usually negotiated as half (50% discount) compared to the main fund fees/promote, PE terms are ‘0%/0%’
• Typically in/out on same timing & terms as GP
What: A specific investment that can be underwritten and evaluated immediately
Why: Allows TRS to capitalize on a specific investment opportunity in real-time
With a Manager• Majority of capital comes from
TRS• TRS underwrites the investment
alongside manager• Unlike a Co-Investment – TRS
may have the ability to control hold period and exit decision
Without a Manager• All capital comes from TRS • TRS underwrites the investment
and receives a prudent investor letter from external advisors
• Unlike a Co-Investment – TRS has ability to control hold period and exit decision
What: Fund created with a specific strategy to invest over an Investment period. No pre-specified assets.
Why: Create a vehicle to target a specific strategy and invest over a period of time
• Usually 100% TRS capital• TRS has opt-out rights
(negative control) and reviews each investment
• Can be open-ended and recycle capital
• Terms are market driven (but less than a commingled fund)
• TRS has ability to control hold period and exit decision
What: Fund created alongside a main fund
Why: Fees and/or promote are lower than main fund and negotiated in advance
TRS Control (PI) – TRS has opt-out rights and more control over which deals are put into the sidecar• TRS controls decision to invest
in a specific investment alongside the fund
• Gives manager pre-committed co-investment capital for deals with short time-lines
Manager Controlled (Non-PI) –Manager has discretion for when to allocate sidecar capital to opportunities – either pro-rata in every deal or manager drives investment decision• Purpose: Lower overall blended
fee drag for TRS

Energy, Natural Resources & Infrastructure (ENRI)
Carolyn Hansard, DirectorJune 2017

2
Agenda
I. Executive Summary
II. Organizational Structure
III. Capital Plan
IV. Performance
V. Market Conditions
VI. Summary
VII. Appendix

3
Executive SummaryConsolidation of Infrastructure with ENR
PERFORMANCE AS OF 12/31/16
PortfolioEnding
Market Value
Investment Returns
1-YR 3-YR 5-YRSince
Inception4
Energy & Natural Resources (ENR) IRR1 $2,781 28.4% (3.3%) (2.1%) (0.3%)
Infrastructure IRR1 2,493 11.4% 15.1% 15.7% 13.4%
Energy, Natural Resources & Infrastructure (ENRI) IRR1,3 $5,274 19.4% 5.0% 5.8% 6.3%
Energy, Natural Resources & Infrastructure (ENRI) TWR2,3 $5,274 15.4% (0.5%) - (0.4%)
1 State Street as of 12/31/16, includes Emerging Managers2 State Street, TRS IMD as of 3/31/173 ENRI IRR includes combined performance of ENR and Infrastructure since inception. ENRI TWR reflects ENR performance up to 9/30/16 and the combined performance of ENR and Infrastructure from 9/30/16 to 3/31/174 ENR IRR Inception Date: 10/28/04; Infrastructure IRR Inception Date: 5/22/08; ENRI IRR Inception Date: 10/28/04; ENRI TWR Inception Date: 9/30/13
• September 2013: Energy & Natural Resources strategy established, 3% target allocation adopted in Policy
• September 2016: Infrastructure included in Energy & Natural Resources and establish ENRI portfolio, 5%target allocation adopted in Policy

4
Executive Summary
1 State Street as of 12/31/16, includes Emerging Managers; ENRI IRR includes combined performance of ENR and Infrastructure since inception2 Cambridge Associates as of 12/31/16; ENRI Benchmark comprised of 40.0% Cambridge Associates Natural Resources, 40.0% Cambridge Associates Infrastructure, and 20.0% CPI3 ENR IRR Inception Date: 10/28/04; Infrastructure IRR Inception Date: 5/22/08; ENRI IRR Inception Date: 10/28/04; ENRI Benchmark Inception Date: 10/01/044 Hamilton Lane5 TRS Risk Group6 ENRI Allocation target increased from 3.0% to 5.0% given addition of Infrastructure as of 9/30/16; Data assumes Infrastructure was part of ENRI portfolio since inception
PERFORMANCE PORTFOLIO GROWTH1
Asset Class1-Year Return
3-Year Return
Since Inception3 ENRI ($ millions) 1-Year 3-Year
Energy & Natural Resources (ENR) IRR1 28.4% (3.3%) (0.3%) Ending Value $5,274 $5,274Infrastructure IRR1 11.4% 15.1% 13.4% less Starting Value 3,652 3,363ENRI IRR1 19.4% 5.0% 6.3% less Contributions 1,551 3,749ENRI Benchmark IRR2 10.8% 2.7% 6.7% plus Distributions 726 2,437ENRI Excess Return IRR 8.6% 2.3% (0.4%) Investment Return $797 $599
LONG-TERM MARKET RETURN AND RISK EXPECTATIONS
StyleTarget Portfolio
Weight Strategic Goal Expected Market
Return4Public Risk
Proxy5
Energy Diversified 45.0% High Inflation Beta 11.0% 31.2%Infrastructure 45.0% Med Inflation Beta 9.0% 14.8%Natural Resources 10.0% High Inflation Beta 7.0% 18.6%ENRI TOTAL 100.0% Diversification 9.7% 20.9%
ALLOCATION SUMMARY1
Style % of Portfolio % of Total Trust6
12/31/2016 12/31/2015 Change 12/31/2016 12/31/2015 ChangeEnergy Diversified 44.7% 33.9% 10.8% 1.7% 0.9% 0.8%Infrastructure 47.2% 55.2% (8.0%) 1.8% 1.6% 0.2%Natural Resources 8.1% 10.9% (2.8%) 0.3% 0.3% -ENRI TOTAL 100.0% 100.0% - 3.8% 2.8% 1.0%Target % of Total Trust 5.0% 3.0% 2.0%

5
Executive SummaryRole in the TRS Trust
Risk Parity 5%
Real Return
22%
ENRI5%
Global Equity57%
ENERGY, NATURAL RESOURCES & INFRASTRUCTURE (ENRI)Target
Portfolio Weight
Expected Market Return2
InflationBeta
Volatility
Portfolio Target ObservedPublic
Risk Proxy1
Energy Diversified 45.0% 11.0% beta > 1.0 16.7% 31.2%Infrastructure 45.0% 9.0% 0.5<beta<1.0 6.6% 14.8%Natural Resources 10.0% 7.0% beta > 1.0 15.0% 18.6%ENRI Total 100.0% 9.7% 1.0 < Target 8.9% 20.9%
Performance IRR4 TWR5Policy
Benchmark6
1-Year Return 19.4% 15.4% 10.8%3-Year Return 5.0% (0.5%) 2.7%Since Inception3 6.3% (0.4%) 6.7%
Drawdown Risk Drawdown7
S&P 500 45.8%S&P 500 Energy Sector 56.0%Natural Resources Benchmark 34.2%
Stable Value16%
1 TRS Risk Group; Three year quarterly observations as of 12/31/162 Hamilton Lane3 ENRI IRR Inception Date: 10/28/04; ENRI TWR Inception Date: 9/30/13; ENRI Benchmark Inception Date: 10/01/044 State Street as of 12/31/16, includes Emerging Managers5 State Street, TRS IMD as of 3/31/176 Cambridge Associates as of 12/31/16; ENRI Benchmark comprised of 40.0% Cambridge Associates Natural Resources, 40.0% Cambridge Associates Infrastructure, and 20.0% CPI7 S&P 500 drawdown period 3/31/07 to 3/31/09, S&P 500 Energy drawdown period 6/30/08 to 3/31/09, Cambridge Associates Natural Resources drawdown period 6/30/14 to 3/31/16
Three Year Correlation1
(0.20) 0.48 0.41
Global Equity57%
TRUST ALLOCATION

6
Organizational Structure
Carolyn HansardDirectorBS UT AustinMBA UT Austin
Advisors and Consultants
Hamilton Lane (Fund Advisor)Townsend (Fund Advisor)
Tudor, Pickering, Holt & Co. (Principal Investments)
VacantAssociate
Carter WareAssociateBA University of Virginia(Shared with PE)
Edgar MayorgaAnalystBA UT Austin
Justin WangAssociateBBA UT Austin(Shared with PE)
VacantInvestment Manager
VacantSr. Investment Manager
Thomas Albright, CFASr. AssociateBA Dartmouth College
Andre WeilenmannContractorBA University of ZurichMA HSG University of St. Gallen
Allen MacDonell, CFASr. Investment ManagerBBA University of GeorgiaMBA Georgia State
TRICOT (ENRI)

7
This slide was intentionally left blank.

8
PerformanceAsset Growth, Allocation, and Returns
1 State Street as of 12/31/16, includes Emerging Managers; Performance includes Infrastructure since inception2 Includes investments approved by Investment Committee through 12/31/16, includes Emerging Managers3 State Street as of 12/31/16; Note: ENRI portfolio approved in policy adopted on 09/30/16, NAV prior to this does not include Infrastructure4 Energy Diversified inception date: 10/28/04; Infrastructure inception date: 5/22/08; Natural Resources inception date: 2/11/10; ENRI inception date: 10/28/045 Hamilton Lane
Growth ($ millions)1 1-Year 3-YearEnding Value $5,274 $5,274
less Starting Value 3,652 3,363
less Contributions 1,551 3,749
plus Distributions 726 2,437
Investment Return $797 $599
Premier List Investments2 Total
CommittedSince
1/2016
CommittedSince
1/2013Number of Invested Premier Managers 19 7 18
Percent Committed in Funds 81% 68% 72%
Percent Committed in Principal Investments 19% 32% 28%
Style
Allocation1 Investment Returns (IRR)1
Expected Market Return52016 2013 2011 1-Year 3-Year
Since Inception4
Energy Diversified 44.7% 38.2% 43.5% 33.5% (7.4%) (4.0%) 11.0%Infrastructure 47.2% 46.2% 46.8% 11.4% 15.1% 13.7% 9.0%Natural Resources 8.1% 15.6% 9.7% 8.6% 13.0% 14.2% 7.0%
ENRI Total 100.0% 100.0% 100.0% 19.4% 5.0% 6.3% 9.7%
ENRI % of Trust3
0%
1%
2%
3%
4%
5%
6%
2014 2015 2016
ENRI % of Trust ENRI Target

9
16%5%
20%
3%
(100%)
11% 8% 8%20%
77%
(20%)(10%)
0%10%20%30%40%50%60%70%80%90%
100%ENRI Vintage Year IRR
2007 2008 2009 2010 2011 2012 2013 2014 2015 2016($ millions)Committed $100 $950 $325 $2,051 $100 $615 $1,519 $1,615 $2,063 $1,245Net Called 96 878 317 1,945 100 482 960 436 531 599Unfunded 4 72 8 106 0 133 559 1,179 1,532 646
PerformanceTRS Vintage Year Comparison
Source: State Street as of 12/31/16, includes Emerging Managers
(100%)

10
PerformanceENRI Principal Investments
• ENRI has focused on becoming a Preferred Destination for Principal Investments with our partners
• Committed approximately $400 million to Principal Investments (including sidecars) in 2016
Source: State Street as of 12/31/161 TPH Co-Invest Fund performance as of 9/30/16
Investment NumberTotal
Commitment Total FundedTotal
Distributions Net Asset Value SI IRRInvestment
MultipleCo-Invest 8 $1,013 $655 $392 $525 18.9% 1.3x
Direct 1 400 400 301 398 14.7% 1.4x
Co-Invest Funds (TPH)1 2 300 169 60 89 (9.1%) 0.9x
Sidecar 5 345 188 151 161 48.6% 1.3x
Single LP 2 700 155 39 156 22.6% 1.2x
TOTAL ENRI PRINCIPAL INVESTMENTS 18 $2,758 $1,567 $942 $1,329 17.6% 1.3x

11
Market ConditionsCommodity Macro
Source: Bloomberg; International Energy Agency; Wood Mackenzie; Tudor, Pickering, Holt & Co.
Natural Gas Inventories (US)
Historical Oil and Gas Prices World Oil Supply-Demand Forecast
Crude Inventories (OECD)
2,400
2,600
2,800
3,000
3,200
3,400
Jan Feb Mar Apr May Jun Jul Aug Sep Oct Nov Dec
Mill
ion
Barr
els
5-Year Max
5-Year Min
5-Year Norm
2017
$0$1$2$3$4$5$6$7
$25
$45
$65
$85
$105
Jan-14 Jul-14 Jan-15 Jul-15 Jan-16 Jul-16 Jan-17
Gas (
S/M
MBt
u)
Oil
($/B
arre
l)
Oil (LHS) Natural Gas (RHS)
500
1,500
2,500
3,500
Jan Feb Apr May Jul Sep Oct Dec
Gas S
tora
ge, B
cf 5-Year Norm
5-Year Max
5-Year Min2017
80
85
90
95
100
105
-3.0
-2.0
-1.0
0.0
1.0
2.0
3.0
2013 2014 2015 2016 2017 2018
Mill
ions
of B
arre
ls/Da
y
Mill
ions
of B
arre
ls/Da
y
Implied stock change (LS) Global Supply (RS) Global Demand (RS)
Projections

12
Market ConditionsOil Drilling Economics (10% IRR)
US Currently Produces the Marginal Barrel as the “Short-Cycle” Producer
Source: Tudor, Pickering, Holt & Co.; TPH Asset Management Estimates*Size of bubbles equates to % of world production for cash costs and drilling economics **Drilling economics defined as the flat oil price needed to generate 10% IRR
Green = Drilling EconomicsBlue = Cash Costs
Drilling economics set an equilibrium price over the long-termCash costs set short-term prices during down markets
$26/bbl: Trough Price
This Cycle
Permian Core$30
OPEC$35
Eagle Ford$40
Russia$40
US Shale$45
Permian Non-core$50
US Avg.$50
Rest of World$70
Permian Core$15
OPEC$10 Eagle Ford
$15
Russia$20
US Shale$20
Permian Non-core$17
US Avg.$22
Rest of World$28
$0
$10
$20
$30
$40
$50
$60
$70
$80

13
655
1,454
0
200
400
600
800
1000
1200
1400
1600
Jun-14 Oct-14 Feb-15 Jun-15 Oct-15 Feb-16 Jun-16 Oct-16 Feb-17Gas Oil/Other
$116.9
$72.2
$35.3
$56.9
$0
$20
$40
$60
$80
$100
$120
$140
2014 2015 2016E 2017E
Capi
tal E
xpen
ditu
res
($BN
)
US Land Rig Count by Hydrocarbon Target1
US activity now 149% off bottom with Permian accounting for 38% of recoveryUS rig count peaked on 10/27/2014 with a combined 2,109 rigs online
Divestitures ($ billions)
US Drilling Capex2
Financial Markets
$28.0 $27.3
$42.0
$78.0
$0
$10
$20
$30
$40
$50
$60
$70
$80
2014 2015 2016E Announcements
BG BP CVX EC ENI GALP PBR RDS REP STO TOT XOM YPF
25%
45%
65%
85%
105%
Jan-14 Apr-14 Jul-14 Oct-14 Jan-15 Apr-15 Jul-15 Oct-15 Jan-16 Apr-16 Jul-16 Oct-16 Jan-17
S&P1500 Energy Crude (WTI) High Yield Energy Bonds (H0EN)
Source: TPH Asset Management, Bloomberg, TPH Research, Rig Data1 Oil/Other indicates rigs that are oil-directed and oil-and-gas-directed; gas indicates rigs that are exclusively gas-directed 2 TPH Securities research universe of 34 upstream E&Ps
Market ConditionsIndustry Fundamentals

14
Market ConditionsAcquisitions and Divestitures
Source: Tudor, Pickering, Holt & Co.
A&D Transaction Volume ($ billions)
$22.4
3.1
$16.3
$20.2
$27.9
$17.7
$4.3
$8.7 $8.1 $9.4
$4.9
$15.7
$20.1 $19.8
$11.6
$0
$5
$10
$15
$20
$25
$30
$35
$40
$45
Q1 2014 Q2 2014 Q3 2014 Q4 2014 Q1 2015 Q2 2015 Q3 2015 Q4 2015 Q1 2016 Q2 2016 Q3 2016 Q4 2016 Q1 2017 Q2 2017YTD
Permian Marcellus/Utica Eagle Ford Bakken Mid-Continent
Diversified Rockies Gulf Coast GoM Haynesville
East Texas California DJ Limestone Implied Q2 2017 Total
2014 Total:$82.1
2015 Total: $30.5 (-63% YoY)
2016 Total: $60.5 (+98% YoY)
2017 Annualized:$79.8 (+32% YoY)

15
Market ConditionsFinancial Market Update
Source: Tudor, Pickering, Holt & Co.
Capital Markets Activity: 2008 – Present
• Energy companies pursued secondary equity issuances in 2016 at a rapid pace
• Companies averse to issuing debt; High-yield markets were stable (mostly refinance) and investment grade issuance was down in 2016
• The forecast for 2017 is based on Q1 run-rates
$20 $21 $27 $36 $39 $40 $47 $34 $47 $47$9 $16$36
$38$53 $46
$48
$31$30 $36
$27$31
$33 $25
$51
$24$40
$48 $31 $17
$0
$20
$40
$60
$80
$100
$120
$140
$160
2008 2009 2010 2011 2012 2013 2014 2015 2016 2017E
$ Bi
llion
s
US Equity High Yield Debt Investment Grade Debt

16
500
700
900
1,100
1,300
1,500
2008 2009 2010 2011 2012 2013 2014 2015 2016 2017
Tota
l Ret
urn
Inde
x Va
lue
S&P 500 Energy Index
50
60
70
80
90
100
110
2008 2009 2010 2011 2012 2013 2014 2015 2016 2017
Aver
age
Secu
rity
Pric
e
Energy HY Total HY Market HY Dislocation Execution
Market ConditionsENRI Dislocation Investments
Source: Bloomberg; Bank of America Merrill Lynch
• TRS Energy Task Force assembled December 2014 as oil prices had fallen 38% to $66/barrel from a high of $107/barrel
• As a result, ENRI made two illiquid investments and two liquid investments to capitalize on the Energy market dislocation
• As credit markets recovered, we exited the High Yield trade in July 2016
Public S&P 500 Energy Equity Performance Energy High Yield Avg Price Relative to High Yield Market
Public Equity Dislocation Execution Realization

17
This slide was intentionally left blank.

18
Summary
1 Relative to 12/31/16 ENRI Benchmark performance
2016 Summary 2017 Priorities
• Commit approximately $1.5 billion
• Continue Texas Way of investing
• Build out ENRI Investment Team
o Fill open positions
o Addition of TPH Secondee for Principal Investment support
• Monitor and act on cyclical Energy investment opportunities
• Continue to be a preferred global destination for attractive investments
• Generated 19.4% 1-year IRR and 5.0% 3-year IRR
o Added 1-Year alpha of 860 basis points1
o Added 3-Year alpha of 230 basis points1
• Performance has recovered from the decline in energy prices experienced in 2014 and 2015
• Energy Dislocation investments performing ahead of plan with since-inception returns of 23%
• Integrated Infrastructure portfolio to further build-out ENRI profit center
• Committed approximately $1.2 billion to 6 investments
o $840 million to 4 Premier List manager funds (including SPNs)
o $400 million to 2 Principal Investments (including Sidecars)

APPENDIX

20
ENRI Strategies
Expected Returns
StrategyCurrentWeight
Target Weight 10% 11-14% 14%+
Energy Diversified 45% 45%
• N/A • Enhanced Reserves• Energy Financing• Aggregates• Mineral Interests• Services and Tech
• Upstream PE• Reserve Development
Infrastructure 47% 45%
• Bridges• Ports• Transportation• Services
• Power Generation• MLPs• Contracted Midstream• Refining
• Midstream and PowerDevelopment
Natural Resources 8% 10%
• Agriculture• Timber• Domestic Farmland
• International Farmland• Agribusiness
• Agribusiness
High Inflation Sensitivity (Inflation Beta > 1.0) Medium Inflation Sensitivity (0.5 < Inflation Beta < 1.0)

21
This slide was intentionally left blank.

22
This slide was intentionally left blank.

23
This slide was intentionally left blank.

24
This slide was intentionally left blank.

25
This slide was intentionally left blank.

26
This slide was intentionally left blank.

27
This slide was intentionally left blank.


Private SPN Deep Dive
Mike Pia, DirectorCourtney Villalta, Senior Investment ManagerJune 2017

2
Agenda
I. SPR Team Overview
II. Private SPN Portfolio (SPN-Strategic and SPN-Tactical Value)
III. Accomplishments and Priorities

3
Strategic Portfolio
Real Return
Stable Value
PublicMarkets
PrivateMarkets
Today’sFocus
Strategic Partnership Network Allocation Targets and Ranges
Opportunistic (25%±10%)
US Treasuries (20%, -10% to 45%)
Cash (2%, 0% to 5%)
Other Debt (0%, -5% to 20%)
Tactical Value
USA Investable Market(34%, 15% to 50%)
Non-US Dev (20%, 9% to 35%)
Emerging (14%, 3% to 30%)
Private Equity (35%±10%)
Credit (10%±10%)
US TIPS (10%, -5% to 20%)
REITs (0%, -5% to 10%)
Commodities (0%, -3% to 10%)
Real Assets (30%±10%)
Private Markets SPN• $10 billion among two global firms• $8 billion Strategic Portfolio
o Initial investments: Q1 2012
o Target: 13% net annualized return
o Perpetual capital through Year 10
• $2 billion Tactical Value Portfolioo Initial investments: Q3 2015
o Target: 10% net annualized return
PrivateMarkets
Global Equity
Key Features of Strategic Partnership

4
Mike Pia, CFA, CAIADirectorBS Mechanical Engineering, United States Naval AcademyMS Software Engineering, University of West FloridaMBA, Texas Christian University
Christopher WhiteAssociateBS Engineering Management, United States Military AcademyMBA Finance, UT Austin
ANALYTICS TEAM
PUBLIC MARKETS PRIVATE MARKETS
INVESTMENTS TEAM MARKET INTELLIGENCE TEAM
Courtney Villalta Senior Investment ManagerBS Finance, St. Edward’s University
Susan White Analytics and Support BS French, The Pennsylvania State UniversityClaritas Investment Certification
Curt Rogers, CAIA, CFA, FRMDirectorBS & MS Aeronautical Engineering, Massachusetts Institute of TechnologyMBA Finance, UT Austin
Jean-Benoit Daumerie, CFAInvestment ManagerBS Engineering, University of PennsylvaniaMBA, Rice University
Blake HolmanAssociateBA Communications, TX State UniversityMBA, University of Colorado
Matt Wey, CPAAssociateBBA Accounting, Texas A&MMS Finance & Mathematics, Texas A&M
Phillip Auth, CFAInvestment ManagerBS Economics, University of New MexicoMBA International Finance, UT Austin
Strategic Partnerships & Research Group (SPR)

5
This slide was intentionally left blank.

6
This slide was intentionally left blank.

7
This slide was intentionally left blank.

8
This slide was intentionally left blank.

9
This slide was intentionally left blank.

10
This slide was intentionally left blank.

11
This slide was intentionally left blank.

12
This slide was intentionally left blank.

13
This slide was intentionally left blank.

14
2016 Accomplishments 2017 Priorities
• $1.6 billion in projected 2017 commitments for SPN-Strategic portfolio
• ~$1 billion in projected 2017 investments for SPN-Tactical Value portfolio
• Continuation of SPN “forced multiplier” concept:o Continue roll-out of market and portfolio review calls
across the Trust
• Enhanced portfolio monitoring and data analytics within SPN portfolios to provide greater asset-level transparency
• SPN Summitso Spring Summit held in Austin on April 20th (see
appendix for summary notes)o 5th annual joint public/private Summit to be held on
July 19th in New Yorko Fall Summit to be held in Austin on November 29th
• Develop/Complete 2017 Research Projects• 2017 Training Exchange Program
Accomplishments and PrioritiesPrivate Markets SPN
• SPN-Strategic performance increased by 221 basis points, year-over-year, to 10.6% ITD net IRR
• Committed $1.3 billion to nine new investments within the SPN-Strategic portfolio
• Invested ~$1 billion of capital (of $2 billion) within SPN-Tactical Value strategyo Strong early performance: 22.8% ITD net IRR
• Completed three SPN Summits
• Successful 2016 Training Exchange Program in NYC
• Completed 2016 “Blank Canvas” Research Projects

APPENDIX
15

16
This slide was intentionally left blank.

17
This slide was intentionally left blank.

18
•Manage, oversee and monitor four unique long-term investment relationships in the public markets around the world
•Work closely with two industry-leading private markets partners to identify and allocate capital to attractive private opportunities
• Integrate global-macro-based products and services into public and private investment decisions across the Trust to enhance returns
•Use and disseminate views and positioning data from partners to provideinsight and support to other groups in the Trust
•Work with heavily resourced partners to provide customized, timely investment research and training that meets the needs of the IMD
• Leverage the TRS investment network to develop new products and superior processes to help ensure that the IMD is world-class in every respect
SPR Mandates
Center of Excellence
Headlight Systems
Research Provider
Market Intelligence
Public Investments
Private Investments

19
ProgramAssets Annualized Return % Annualized Alpha % Tracking Error % Information Ratio
NAV($ millions) % of Trust 1-Year 3-Year Since
Incept. 1-Year 3-Year Since Incept. 1-Year 3-Year Since
Incept. 1-Year 3-Year Since Incept.
BlackRock 1,794 1.3 11.2 6.0 6.6 1.2 1.2 1.0 2.3 1.9 2.0 0.5 0.6 0.5
JP Morgan 1,893 1.4 11.7 5.5 7.1 1.7 0.7 1.5 1.0 1.6 2.2 1.8 0.4 0.7
Morgan Stanley 1,718 1.2 9.1 3.1 6.1 -0.9 -1.7 0.4 1.9 2.4 1.9 -0.5 -0.7 0.2
Neuberger Berman 1,719 1.2 10.2 3.7 6.0 0.2 -1.2 0.4 1.6 2.1 2.1 0.1 -0.6 0.2
Total Public SPN 7,124 5.2 10.6 4.6 6.5 0.6 -0.2 0.8 1.4 1.4 1.4 0.4 -0.2 0.6
Targets Portfolio/Firm: 2.0 Firm: 2.5 Firm: 0.8
Public Markets SPN PerformanceAs of March 31, 2017
Source: State Street and TRS IMD


Super Five Priority – Private Markets Update
Eric Lang, Sr. Managing DirectorJune 2017

2
Agenda
I. Executive SummaryII. Blank Canvas OverviewIII. TeamIV. TasksV. Conclusion

3
I. Executive Summary
• Today, we provide our second update on the IMD’s top five priorities
• Specifically, we discuss the Private Markets priority
Beta Management
• Reduce Deflation Hedge
• Re-Allocate Currency Risk
• Evaluate Use of Leverage
• Prepare for Cycle Transition
James
• Global Equity Best Practices Transition
• Hedge Funds Fee Modification 70/30 Gross Alpha Split
• Rebalance Hedge Fund Strategy
AlphaProduction
Jase
• Illiquid Credit
• Evaluate Internal TAA
• Expand Alternative Risk Premia Overlay
Mohan
Private Markets
• Determine Conservative Baselines
• Improved Access to GP’s and Allocations
• Better Fee Structure (70% Alpha)
• Increase Energy Exposure
Eric
CIOIssues
• Modify Organization
• Evaluate Global Footprint
• Executive Management Growth
• Career Ladder
• Compensation Alignment
Jerry
AbsoluteReturns

4
II. Blank Canvas Overview
• All major markets are fully valuedo Bonds: +1.8%o Equity: +6.2%o Private RE: +6.6%o Private Equity: +8.6%
• Potential Opportunitieso Energyo Illiquid Credit
• Potential shift into a reflationary biased regime
Blank Canvas Expected Return Review (Beta)

5
II. Blank Canvas Overview
• Private Markets continue to provide a useful source of active return
• The current allocation is at the low end of the recommended range to illiquid assets (PE, RE, Infrastructure, Energy)
Blank Canvas Asset Allocation Review
Blank Canvas Expected Return Review (Alpha)

6
III. Team
The project team’s nine members represent various areas of the Trust
Eric LangSr. Managing DirectorPrivate Markets
Team Lead
Neil RandallSr. Director Private Equity
Grant WalkerSr. Director Real Assets
Carolyn HansardDirectorEnergy, Natural Resources & Infrastructure
Mike PiaDirectorStrategic Partnerships & Research
Courtney Villalta Sr. Investment ManagerStrategic Partnerships & Research
Ralph Linn, CFA Sr. DirectorInternal Public Markets
David DeStefanoSr. DirectorInternal Public Markets
Ken StandleyDeputy Chief of StaffSr. Associate

7
IV. Tasks - Conservative Baselines
• Blank Canvas partners and working groups recommended higher Private Markets allocation to optimize Trust returns
• Private assets provide an adequate source of alpha• PE and RE are currently fully valued• We recognize lower expected return environment for the
asset class
• Goal: Increase allocation to Private Markets using conservative baselines given the current market environment• Maintain our Texas Way investing approach
o We will ‘stay the course’ using current capital plans including disciplined principal investment selection
• Alpha has become increasing important in this low return environment o Alpha creation is more achievable in illiquid non-transparent Private Markets
Rationale: Execution:
• Capital planning models to manage allocation targets• Valuation environment review• Create “Keys to Success” metrics for principal investments
to GPs and management accountable

8
IV. Tasks - Improved Access
• Best ideas are being spread amongst many LPs with TRS receiving its pro-rata share
• Co-invest environment is becoming increasingly competitive• Some peers are willing to write big checks quickly
• Goal: Create proprietary relationships relative to other LPs in order to increase access to attractive investment ideas and deal flow
• Increase outward facing relationships with GPs to improve TRS competitive positioning among LPs• Develop additional key partnerships with select GPs to increase deal flow and improve alignment• Expand use of side cars with Premier List managers to generate additional PI access going forward
Rationale: Execution:
• Key Partnerships will need to be customized for select GPs• Deal flow monitoring• Execute on existing side car process• New agreements with proprietary capital allocation

9
IV. Tasks - Better Cost Structure
• In current GP friendly fundraising environment, a paradigm shift to pay carry as a percentage of alpha is difficult
• TRS is better served to optimize current incentive structures with downside protection
• Goal: Agreements that will allow TRS to retain a higher percentage of gross alpha in low return environments
• Focal points to include: o Maintaining (or establishing) Preferred Returnso Minimizing catch-upo Maximizing no fee/carry co-investo Focus GPs on relative returns to public markets
Rationale: Execution:
• Analysis of fee structures and models• Key relationships focus• Review of competitive market environment• Focus private markets returns relative to public markets

10
IV. Tasks - Increase Energy Exposure
• Energy valuations may be attractive• We may shift to a reflationary environment• Infrastructure and other natural resources also provide a
hedge to reflation
• Goal: Prepare for shift to reflationary based regime• Increase Trust allocation to potentially inflationary sensitive private investments
o Increase energy investments while recognizing the volatility of the commodityo Increase exposure to infrastructure and natural resources
• Focus on downside protection (hedging production) and consider public / flex capital to grow allocation early
Rationale: Execution:
• Capital planning models• Valuation environment review• Dedicate resources based on other private market areas• Appropriate hedging practices

11
V. Conclusion
• TRS will increase Private Equity and Real Assets allocation • TRS will increase its exposure to energy and reflationary investments given
attractive deal flow• All increases will be within current IPS bands• We maintain our disciplined Texas Way investing approach through the
following:o Conservative baselineso Better cost structureso Improved access