Embed Size (px)
Citation preview

Good People to Grow With
Touching Hearts Spreading Smiles
since 1937
Presentation to Analysts
June 2015
(in INR)

Continuing Tradition of Quiet & Dignified Service to the Society
Good People to Grow With

INVESTOR RELATIONS CELL
INDEX
3
Particulars Page No. Particulars Page No.
Mile Stones 4-5 NPA Details 29-34
Consolidated Change in Shareholding Pattern 6 Profitability 35-38
Foreign Branches 7 Profitability - Details of Income 39-42
Joint Ventures 8 Net Profit 43
Highlights 9
Ratios - Cost & Yield Ratios &
NIM 44
I.T. Initiatives 10-14
Investments - Domestic &
Foreign 45-46
Major Business Parameters 15 Capital Adequacy 47
Deposits, CASA, Domestic Deposits - category
wise 16-18 Productivity 48
Advances 19-24 Financial Inclusion 49-50
Restructured Accounts 25-28

44
Milestones IOB Young at 78 Years
1937 Opening of Bank Branch simultaneously in India & Abroad
1938 Opening Branch in Kuala Lumpur
1941 Opening Branch in Singapore
1945 Opening Branch in Colombo
1955 Opening Branch in Hong Kong
1957 Bank established its own training centre
1960s Was a decade of inorganic expansion for the Bank. The Bank took over:
The Coimbatore Standard Bank Ltd., The Nanjinnad Bank Ltd.,
The Coimbatore Vasunthara Bank Ltd., The Kulitalai Bank Ltd.,
The Srinivasaperumal Bank and The Venkateswara Bank
1964 Inauguration of IOB’s Head Office in Mount Road – A monument of highest banking tradition
1969 Nationalisation of the Bank
1973 Formation of United Asian Bank Berhad (Indian Bank / IOB / United Commercial Bank)
1974 Official Language Department established in 1974
1977 Bank opened its Tsim Tsa Tsui Branch at Kowloon side of Hongkong
1990 Took over Bank of Tamilnad
1991 Bank moved its Staff College premises to a own spacious learning zone at Koyambedu
2000 Initial Public Offer. Follow on Public Offer in 2003
2005 Launched Debit Card
55
Milestones - IOB Young at 78 Years
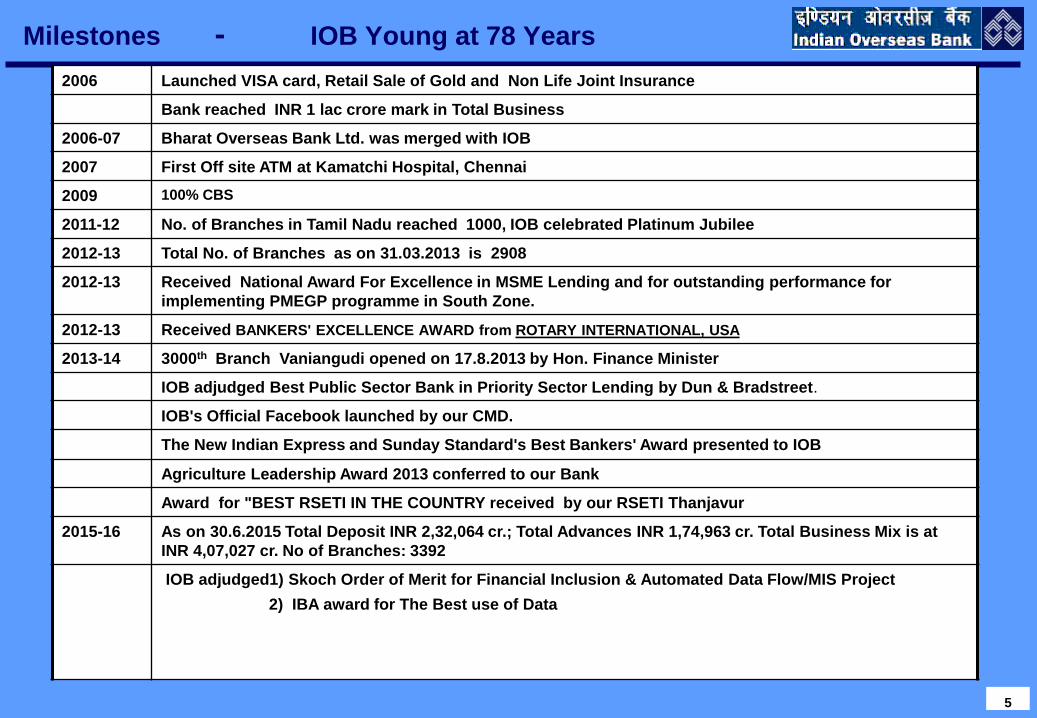
2006 Launched VISA card, Retail Sale of Gold and Non Life Joint Insurance
Bank reached INR 1 lac crore mark in Total Business
2006-07 Bharat Overseas Bank Ltd. was merged with IOB
2007 First Off site ATM at Kamatchi Hospital, Chennai
2009 100% CBS
2011-12 No. of Branches in Tamil Nadu reached 1000, IOB celebrated Platinum Jubilee
2012-13 Total No. of Branches as on 31.03.2013 is 2908
2012-13 Received National Award For Excellence in MSME Lending and for outstanding performance for
implementing PMEGP programme in South Zone.
2012-13 Received BANKERS' EXCELLENCE AWARD from ROTARY INTERNATIONAL, USA
2013-14 3000th Branch Vaniangudi opened on 17.8.2013 by Hon. Finance Minister
IOB adjudged Best Public Sector Bank in Priority Sector Lending by Dun & Bradstreet.
IOB's Official Facebook launched by our CMD.
The New Indian Express and Sunday Standard's Best Bankers' Award presented to IOB
Agriculture Leadership Award 2013 conferred to our Bank
Award for "BEST RSETI IN THE COUNTRY received by our RSETI Thanjavur
2015-16 As on 30.6.2015 Total Deposit INR 2,32,064 cr.; Total Advances INR 1,74,963 cr. Total Business Mix is at
INR 4,07,027 cr. No of Branches: 3392
IOB adjudged1) Skoch Order of Merit for Financial Inclusion & Automated Data Flow/MIS Project
2) IBA award for The Best use of Data
6
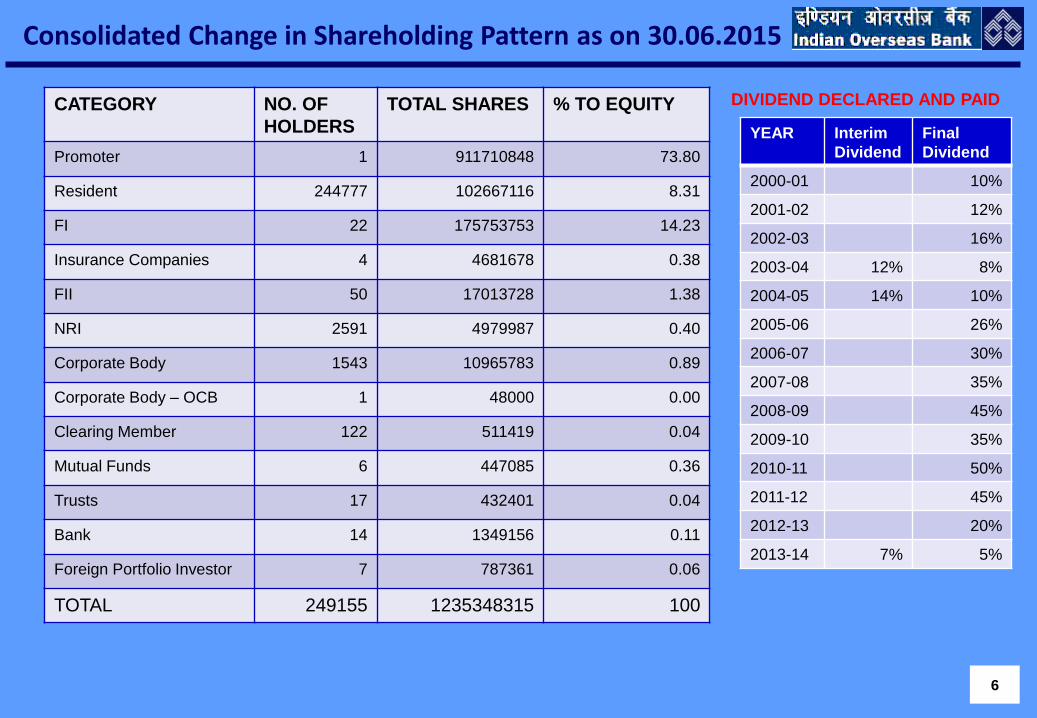
Consolidated Change in Shareholding Pattern as on 30.06.2015
DIVIDEND DECLARED AND PAID
YEAR Interim
Dividend
Final
Dividend
2000-01 10%
2001-02 12%
2002-03 16%
2003-04 12% 8%
2004-05 14% 10%
2005-06 26%
2006-07 30%
2007-08 35%
2008-09 45%
2009-10 35%
2010-11 50%
2011-12 45%
2012-13 20%
2013-14 7% 5%
CATEGORY NO. OF
HOLDERS
TOTAL SHARES % TO EQUITY
Promoter 1 911710848 73.80
Resident 244777 102667116 8.31
FI 22 175753753 14.23
Insurance Companies 4 4681678 0.38
FII 50 17013728 1.38
NRI 2591 4979987 0.40
Corporate Body 1543 10965783 0.89
Corporate Body – OCB 1 48000 0.00
Clearing Member 122 511419 0.04
Mutual Funds 6 447085 0.36
Trusts 17 432401 0.04
Bank 14 1349156 0.11
Foreign Portfolio Investor 7 787361 0.06
TOTAL 249155 1235348315 100
7
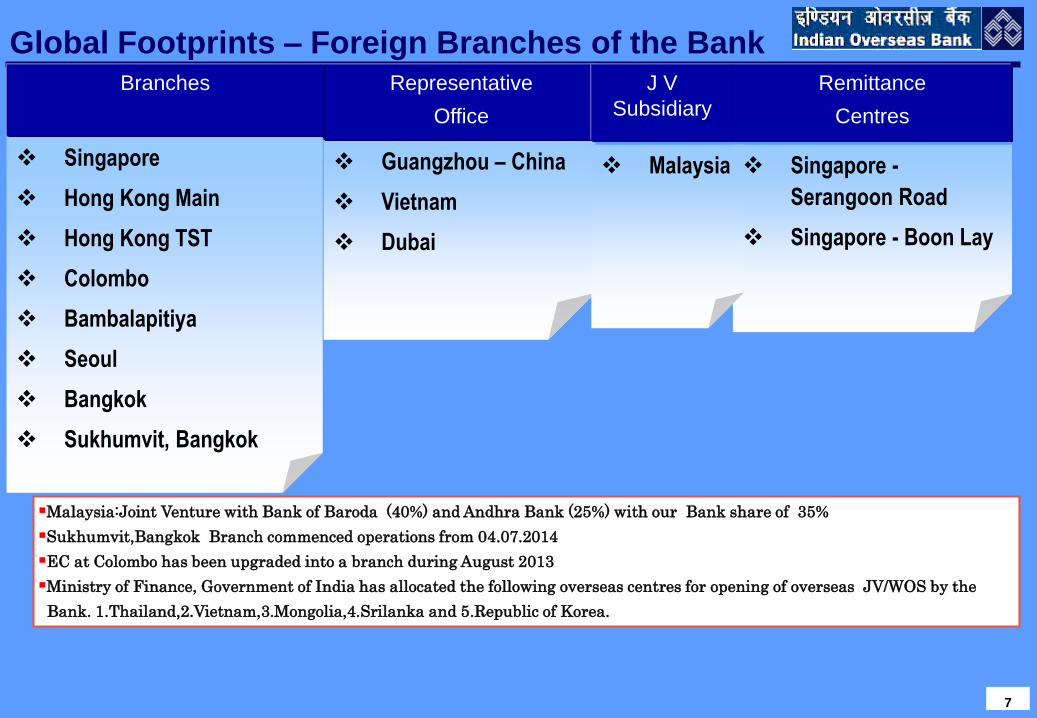
Global Footprints – Foreign Branches of the Bank
Singapore -
Serangoon Road
Singapore - Boon Lay
Guangzhou – China
Vietnam
Dubai
Remittance
Centres
Representative
Office
Branches
Singapore
Hong Kong Main
Hong Kong TST
Colombo
Bambalapitiya
Seoul
Bangkok
Sukhumvit, Bangkok
Malaysia:Joint Venture with Bank of Baroda (40%) and Andhra Bank (25%) with our Bank share of 35%
Sukhumvit,Bangkok Branch commenced operations from 04.07.2014
EC at Colombo has been upgraded into a branch during August 2013
Ministry of Finance, Government of India has allocated the following overseas centres for opening of overseas JV/WOS by the
Bank. 1.Thailand,2.Vietnam,3.Mongolia,4.Srilanka and 5.Republic of Korea.
J V
Subsidiary
Malaysia
88
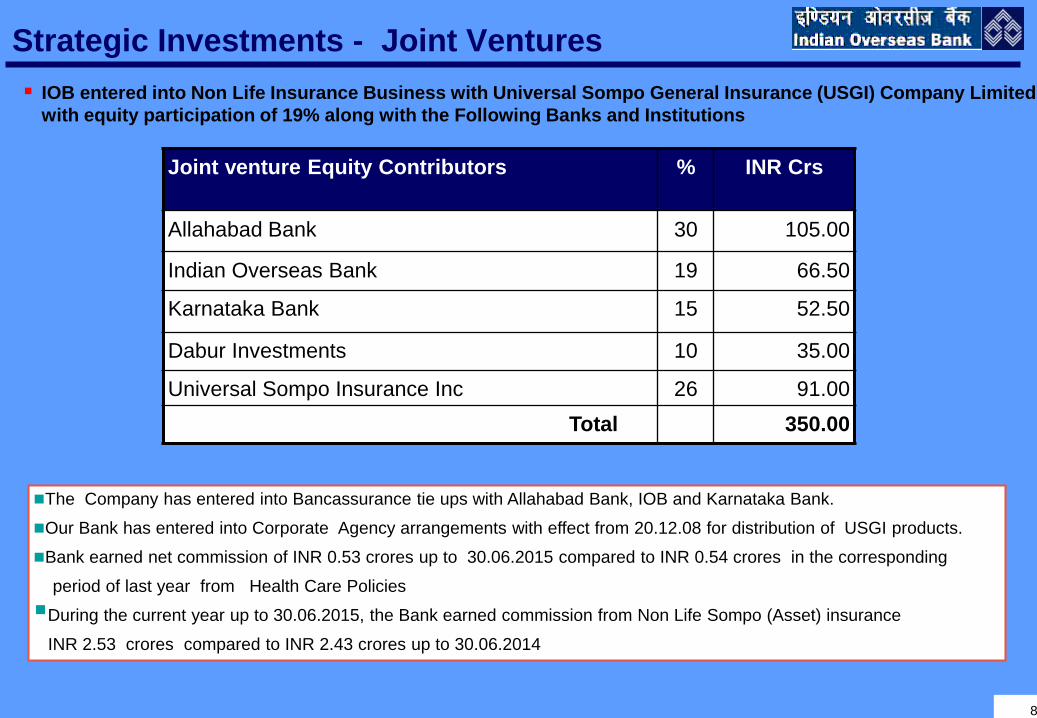
Strategic Investments - Joint Ventures
IOB entered into Non Life Insurance Business with Universal Sompo General Insurance (USGI) Company Limited
with equity participation of 19% along with the Following Banks and Institutions
Joint venture Equity Contributors % INR Crs
Allahabad Bank 30 105.00
Indian Overseas Bank 19 66.50
Karnataka Bank 15 52.50
Dabur Investments 10 35.00
Universal Sompo Insurance Inc 26 91.00
Total 350.00
The Company has entered into Bancassurance tie ups with Allahabad Bank, IOB and Karnataka Bank.
Our Bank has entered into Corporate Agency arrangements with effect from 20.12.08 for distribution of USGI products.
Bank earned net commission of INR 0.53 crores up to 30.06.2015 compared to INR 0.54 crores in the corresponding
period of last year from Health Care Policies
During the current year up to 30.06.2015, the Bank earned commission from Non Life Sompo (Asset) insurance
INR 2.53 crores compared to INR 2.43 crores up to 30.06.2014
9
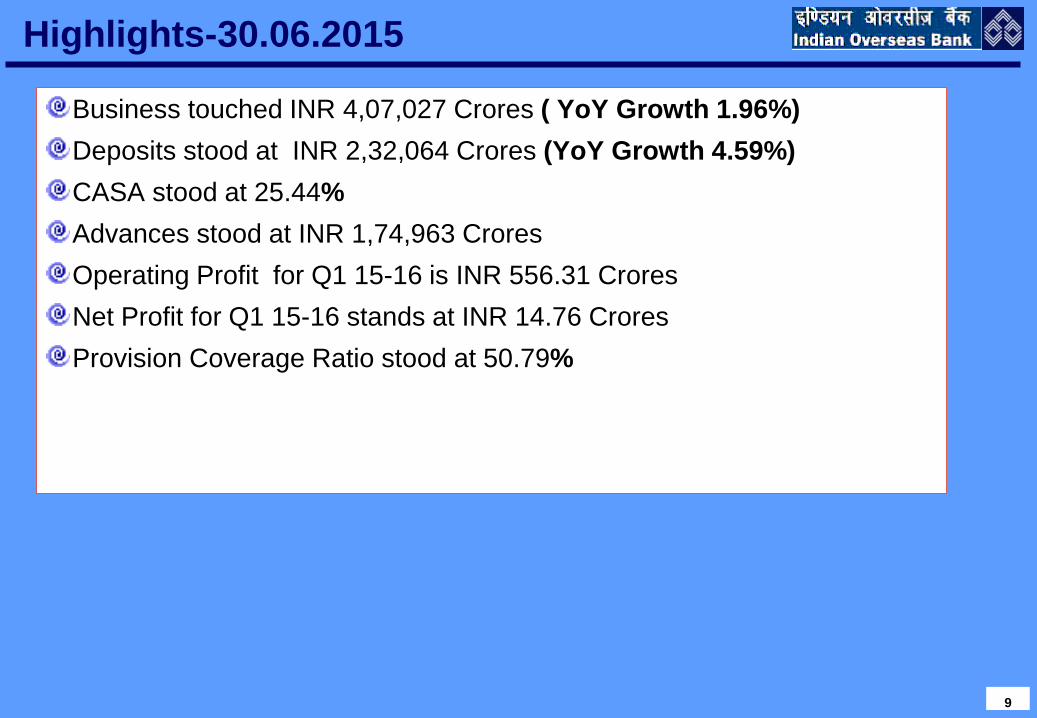
Highlights-30.06.2015
Business touched INR 4,07,027 Crores ( YoY Growth 1.96%)
Deposits stood at INR 2,32,064 Crores (YoY Growth 4.59%)
CASA stood at 25.44%
Advances stood at INR 1,74,963 Crores
Operating Profit for Q1 15-16 is INR 556.31 Crores
Net Profit for Q1 15-16 stands at INR 14.76 Crores
Provision Coverage Ratio stood at 50.79%

10
IT Initiatives
IT Organization Structure :
Developing software in-house, resulted in perfect alignment of Business and IT aspirations, reduced cost,
increased agility and the all-important flavor of domain knowledge. Three Data centers have revolutionalised the
BCP-DR readiness of the Bank. The Data centers are connected to the network nodes situated mostly at our
Regional Offices. Apart from network redundancy, this has given us double bandwidth at half the cost, because
of competition. The excess band-with has been tapped to introduce Video Conferencing and IP-Video/Audio
telephony.
For effective IT Governance, IT Strategy Committee, a Top level IT Steering Committee have been formed in
addition to the existing IT security Committee.
Infrastructure Space:
Our Bank is one of the first Public sector Banks to establish 3 way DR setup for CBS to ensure Zero data loss.
For other critical applications necessary Infrastructure is in place at DR.
Core Banking Solution:
The Bank is moving to the COTS CBS model which is widely used by all other PSB’s in India. M/S HP India
Sales Private Ltd., has been selected as System Integrator for CBS Migration Project through an RFP process
and Bank has entered into contractual agreement with them for implementation.
Payment Gateway :
Payment Gateway for payment of utility bills like mobile payment, insurance premium, other banks’ credit cards,
telephone bill payments etc., using debit cards has been implemented. 11 aggregators with12000 plus sub
merchants and 17 Direct Merchants.

11
IT Initiatives
Alternate Delivery Channels :
Internet Banking:
Bank has home-grown internet Banking suite, with contemporary offerings; Multiple scheduling of payments to
Deposit/RTGS/NEFT/ Loan Accounts
8.71 lacs registrations on 30.06.2015 with a monthly average transactions of 17.29 lacs.
OTP facility enabled
Intra Bank, Inter Bank and Bulk Funds transfers facility.
Term deposits transactions including special rate deposits
Tax payments, EB payments of certain states etc.,
Utility and Bill payments through more than 10 aggregators.
Can effect PPF remittances
Students of certain universities pay their college fees.
Credit Card Dues and view their last three month’s statements.
Seed their AADHAAR Number with their Bank accounts.
Register their PAN number through our Internet Banking.
Bilingual (English and Hindi) of Internet Banking Site implemented.
Missed Call from Registered Mobile to 044-4222 0004 for knowing the balance of their account.
E-PAYMENT of major state VAT has been made online.
Electronic Transactions:
As on 30.06.2015, electronic transactions vs paper based transactions is at the ratio 69.40: 30.60.
12
IT Initiatives
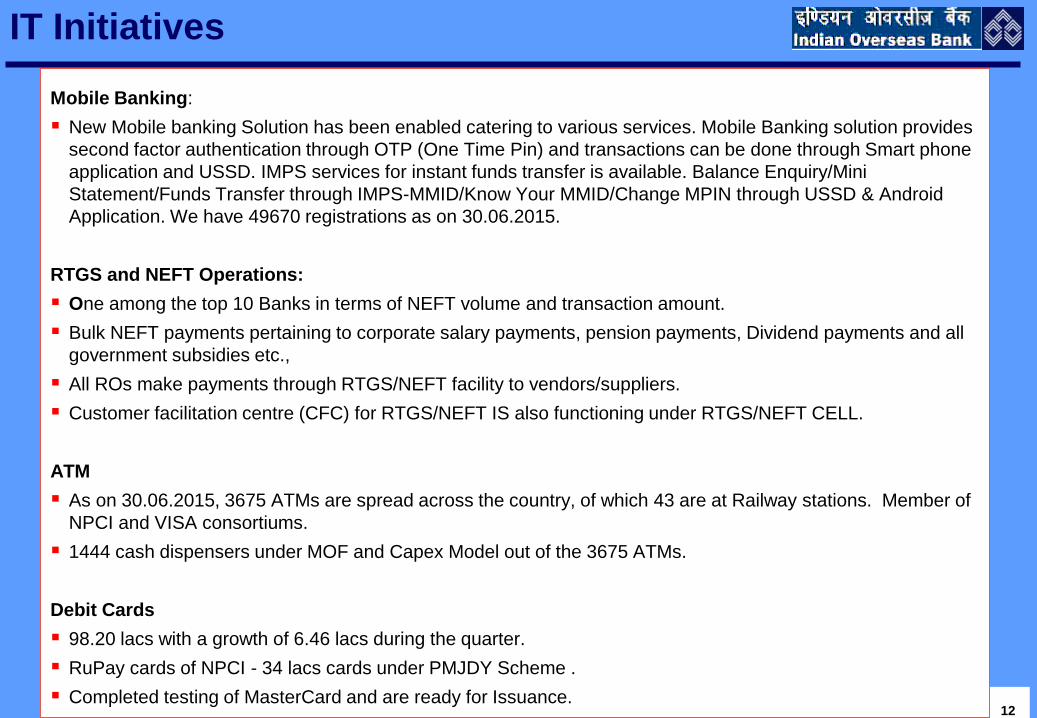
Mobile Banking:
New Mobile banking Solution has been enabled catering to various services. Mobile Banking solution provides
second factor authentication through OTP (One Time Pin) and transactions can be done through Smart phone
application and USSD. IMPS services for instant funds transfer is available. Balance Enquiry/Mini
Statement/Funds Transfer through IMPS-MMID/Know Your MMID/Change MPIN through USSD & Android
Application. We have 49670 registrations as on 30.06.2015.
RTGS and NEFT Operations:
One among the top 10 Banks in terms of NEFT volume and transaction amount.
Bulk NEFT payments pertaining to corporate salary payments, pension payments, Dividend payments and all
government subsidies etc.,
All ROs make payments through RTGS/NEFT facility to vendors/suppliers.
Customer facilitation centre (CFC) for RTGS/NEFT IS also functioning under RTGS/NEFT CELL.
ATM
As on 30.06.2015, 3675 ATMs are spread across the country, of which 43 are at Railway stations. Member of
NPCI and VISA consortiums.
1444 cash dispensers under MOF and Capex Model out of the 3675 ATMs.
Debit Cards
98.20 lacs with a growth of 6.46 lacs during the quarter.
RuPay cards of NPCI - 34 lacs cards under PMJDY Scheme .
Completed testing of MasterCard and are ready for Issuance.

13
IT Initiatives
Credit Cards
51,060 credit as at the end of June 2015.
We have moved Staff Credit Card to Credit Card Web Based Module and is under pilot run.
IOBonline is effectively used by the department for recovery of over dues through branches.
CTS – Implementation
860 branches covering 53 regions. - average number of instruments of handled by CBOs at Delhi, Mumbai and
Chennai is 80000.
GENNEXT:
Branch to cater to the needs of techsavy younger generation of customers has been opened in Chennai,
Bangalore and Manipal.
Aadhaar :
Linking of Aadhaar numbers to account number through Branch channel as well as through Internet Banking is in
operation.
Financial Inclusion Project:
Financial inclusion application enables funds transfer, deposits and remittances towards advances in real time
and it is also BC-interoperable enabling any customer to transact through any Business Correspondent. We have
also implemented e-kyc as part of customer acquisition project through Business Correspondents.
14
IT Initiatives
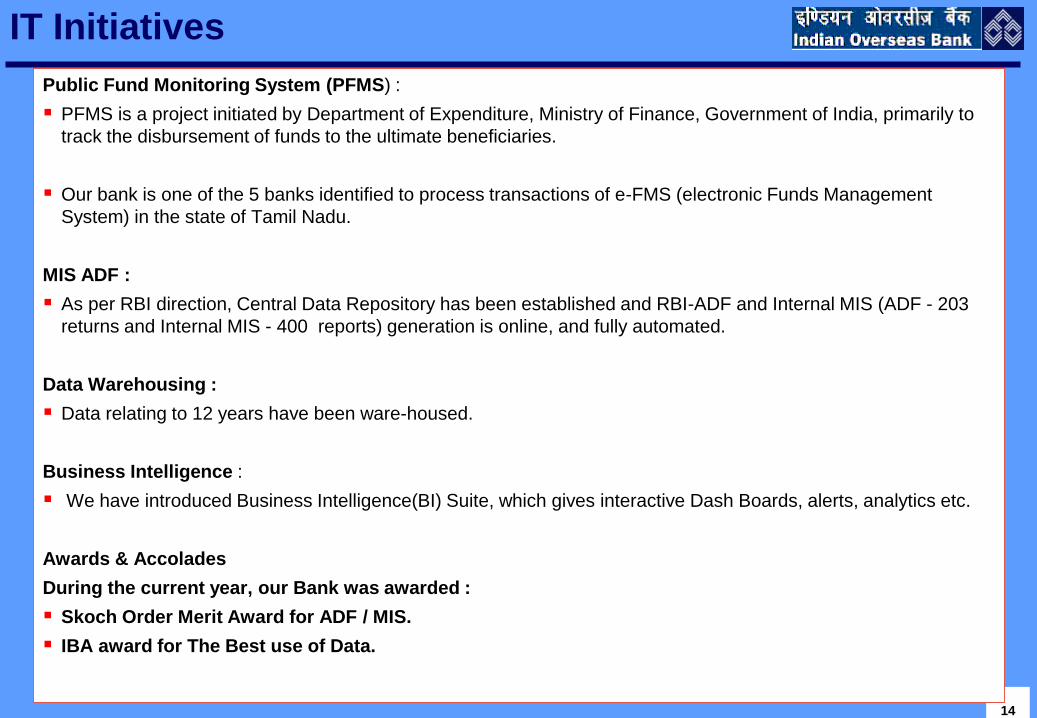
Public Fund Monitoring System (PFMS) :
PFMS is a project initiated by Department of Expenditure, Ministry of Finance, Government of India, primarily to
track the disbursement of funds to the ultimate beneficiaries.
Our bank is one of the 5 banks identified to process transactions of e-FMS (electronic Funds Management
System) in the state of Tamil Nadu.
MIS ADF :
As per RBI direction, Central Data Repository has been established and RBI-ADF and Internal MIS (ADF - 203
returns and Internal MIS - 400 reports) generation is online, and fully automated.
Data Warehousing :
Data relating to 12 years have been ware-housed.
Business Intelligence :
We have introduced Business Intelligence(BI) Suite, which gives interactive Dash Boards, alerts, analytics etc.
Awards & Accolades
During the current year, our Bank was awarded :
Skoch Order Merit Award for ADF / MIS.
IBA award for The Best use of Data.

1515
Major Business ParametersQuarter ending INR Crs
Key Performance indicators Jun 14 Sep 14 Dec 14 Mar 15 Jun 15
Business Mix 399189 420739 411355 425090 407027
Deposits 221880 239224 232823 246049 232064
Advances (Gross) 177309 181515 178532 179041 174963
Operating Profit 686 729 726 1180 556
Net Profit 272 -246 -516 35 15
NIM (%) 2.24 2.07 2.05 1.87 1.92
Gross NPA 10351 13334 14501 14922 16451
Net NPA 6644 9109 9511 9813 10640
Return on Assets (%) 0.39 -ve -ve 0.05 0.02
Return on Equity (%) 8.24 -ve -ve 1.09 0.47
Book Value (INR) 107.86 105.66 101.65 100.75 100.90
16
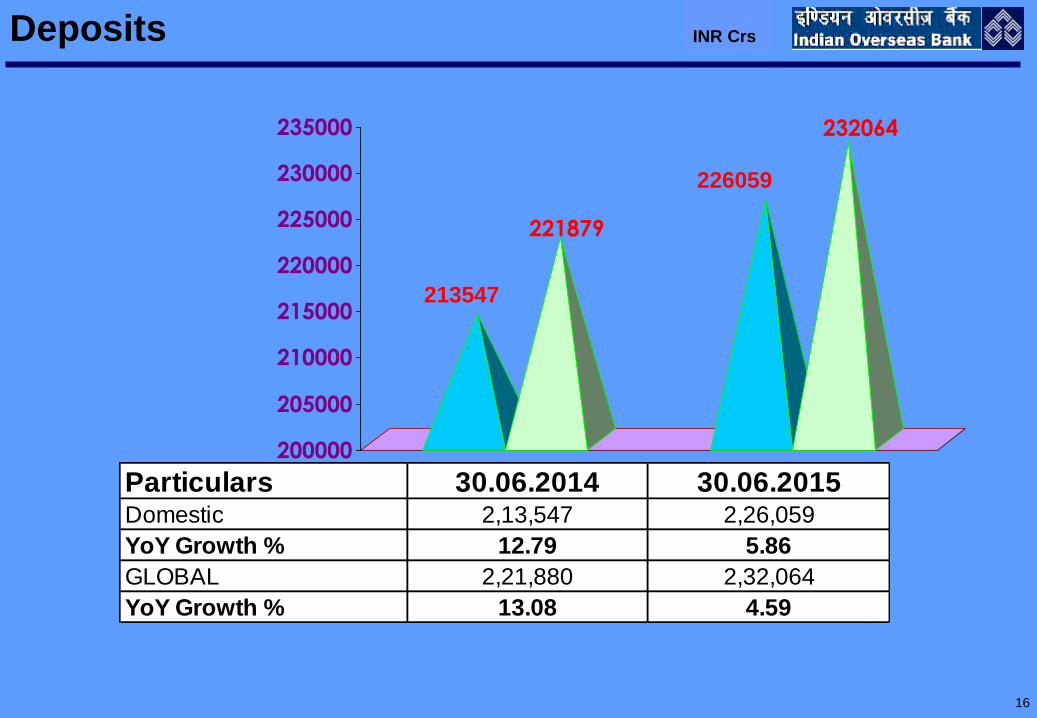
213547
221879
226059
232064
200000
205000
210000
215000
220000
225000
230000
235000
Deposits INR Crs
Particulars 30.06.2014 30.06.2015Domestic 2,13,547 2,26,059
YoY Growth % 12.79 5.86
GLOBAL 2,21,880 2,32,064
YoY Growth % 13.08 4.59
17
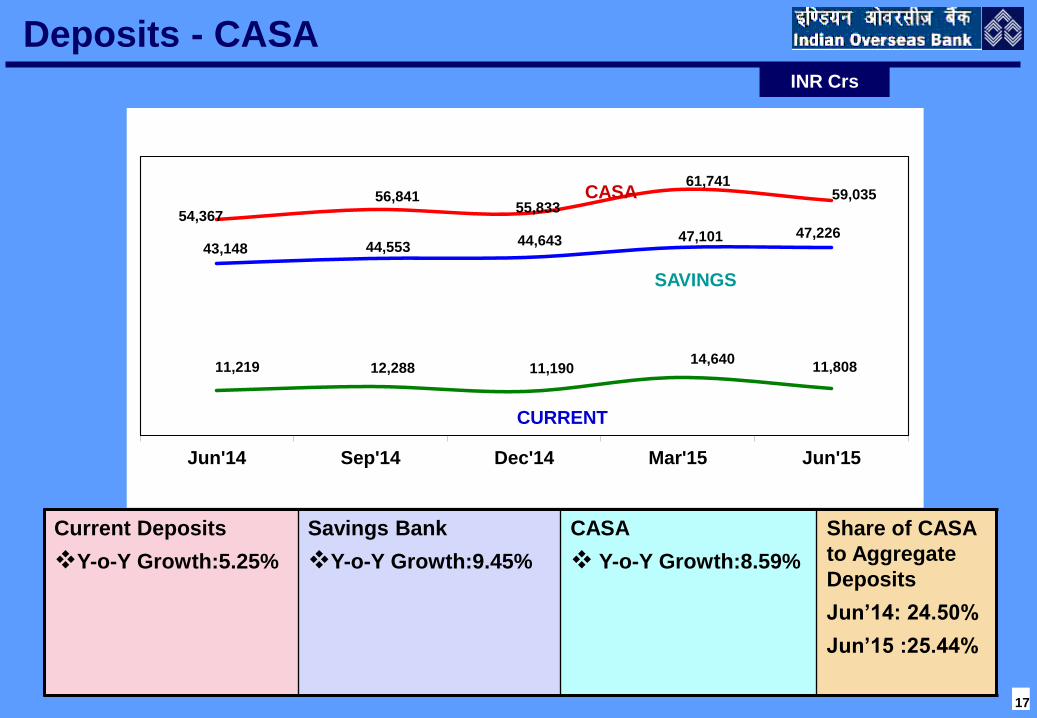
54,367
56,84155,833
61,74159,035
43,148 44,553 44,643 47,101 47,226
11,219 12,288 11,19014,640
11,808
Jun'14 Sep'14 Dec'14 Mar'15 Jun'15
CASA
SAVINGS
CURRENT
Current Deposits
Y-o-Y Growth:5.25%
Savings Bank
Y-o-Y Growth:9.45%
CASA
Y-o-Y Growth:8.59%
Share of CASA
to Aggregate
Deposits
Jun’14: 24.50%
Jun’15 :25.44%
Deposits - CASAINR Crs

18
Domestic Deposit-Category Wise
June 2015 INR Crs
Rural, 16,474
(7%) Semi Urban, 26,659(12%)
Urban, 53,584(24%)
Metro, 1,29,329
(57%)

19
158560177309
158961174963
0
20000
40000
60000
80000
100000
120000
140000
160000
180000
Gross AdvancesINR Crs
Particulars 30.06.2014 30.06.2015Domestic 1,58,560 1,58,961
YoY Growth % 9.48 0.25
GLOBAL 1,77,309 1,74,963
YoY Growth % 6.25 -1.32

20
Domestic Advances-Category Wise
June 2015 INR Crs
Rural, 15,504(10%)
Semi Urban, 19,148(12%)
Urban, 32,887( 21%)
Metro, 91,789(57%)
2121
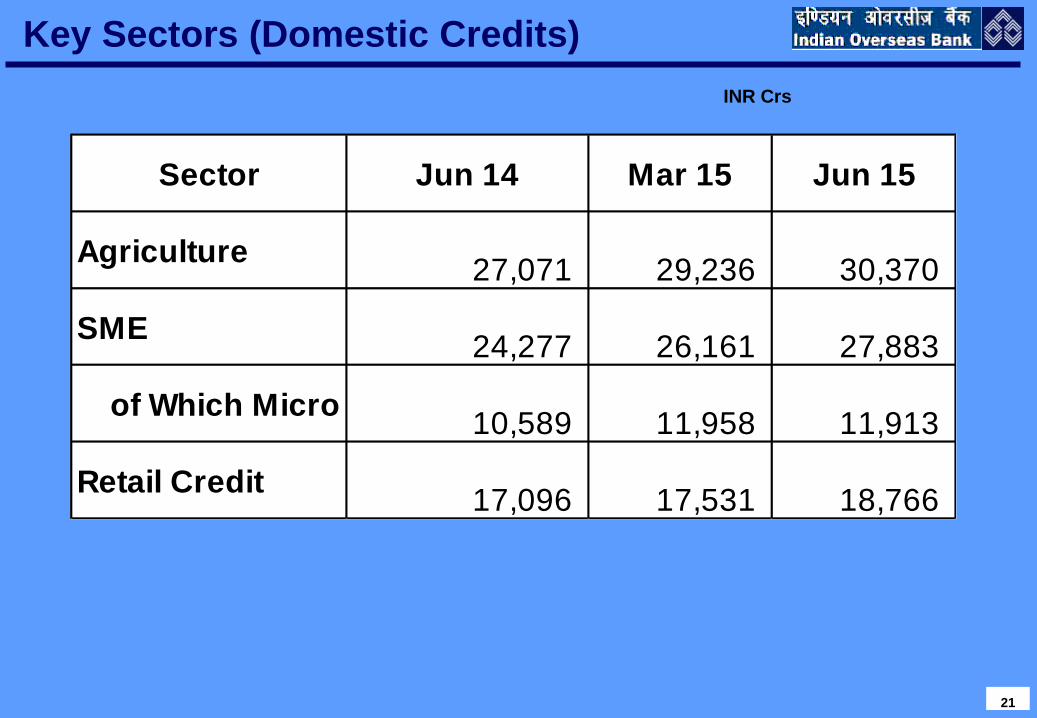
Key Sectors (Domestic Credits)
INR Crs
Sector Jun 14 Mar 15 Jun 15
Agriculture27,071 29,236 30,370
SME24,277 26,161 27,883
of Which Micro10,589 11,958 11,913
Retail Credit17,096 17,531 18,766
2222
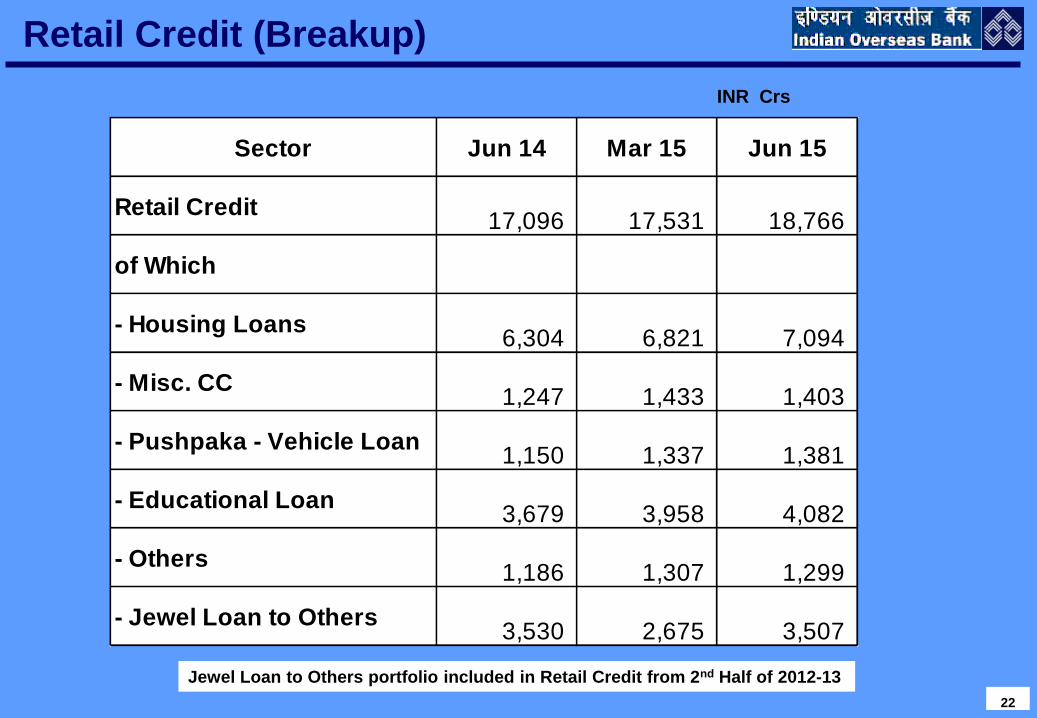
Retail Credit (Breakup)
INR Crs
Jewel Loan to Others portfolio included in Retail Credit from 2nd Half of 2012-13
Sector Jun 14 Mar 15 Jun 15
Retail Credit17,096 17,531 18,766
of Which
- Housing Loans6,304 6,821 7,094
- Misc. CC1,247 1,433 1,403
- Pushpaka - Vehicle Loan1,150 1,337 1,381
- Educational Loan3,679 3,958 4,082
- Others1,186 1,307 1,299
- Jewel Loan to Others3,530 2,675 3,507

2323
Advances to Sensitive Sectors - Domestic
INR Crs (FUND + NON FUND)
* Includes Non-Priority Housing Loans
Sector Jun 14 Mar 15 Jun 15
CAPITAL MARKET684 533 532
REAL ESTATE22,460 23,361 23,256
of Which
HOUSING LOAN*8,757 9,449 9,782
COMMERCIAL REAL ESTATE8,773 8,348 8,104
OTHERS
(DIRECT & INDIRECT) 4,930 5,564 5,370
24
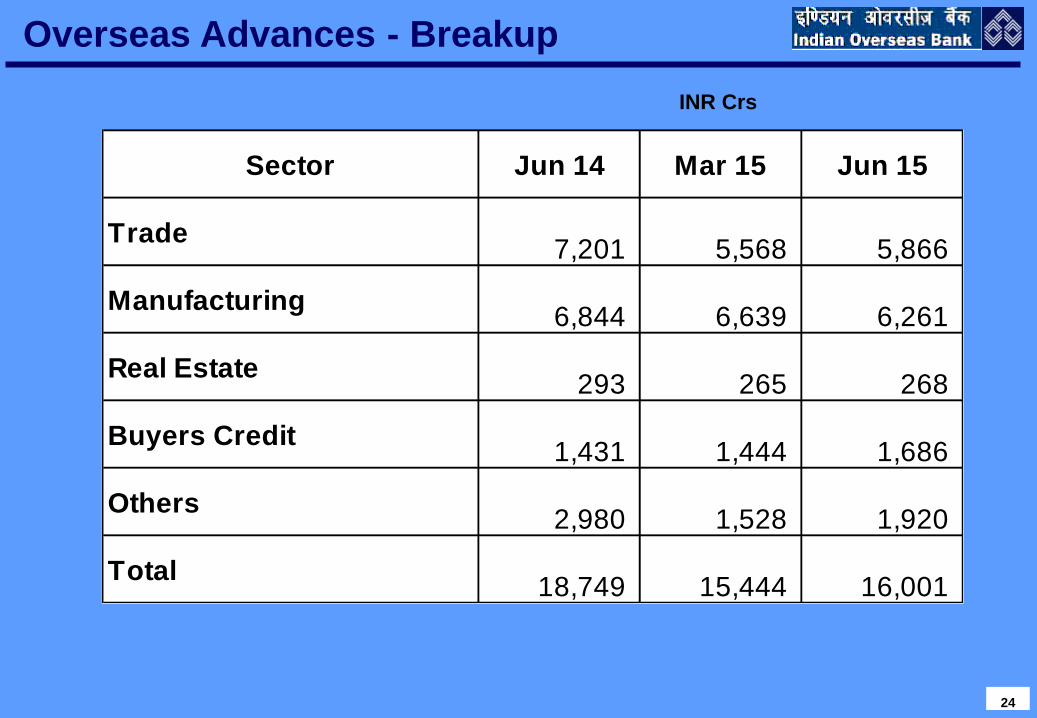
INR Crs
Overseas Advances - Breakup
Sector Jun 14 Mar 15 Jun 15
Trade7,201 5,568 5,866
Manufacturing6,844 6,639 6,261
Real Estate293 265 268
Buyers Credit1,431 1,444 1,686
Others 2,980 1,528 1,920
Total18,749 15,444 16,001
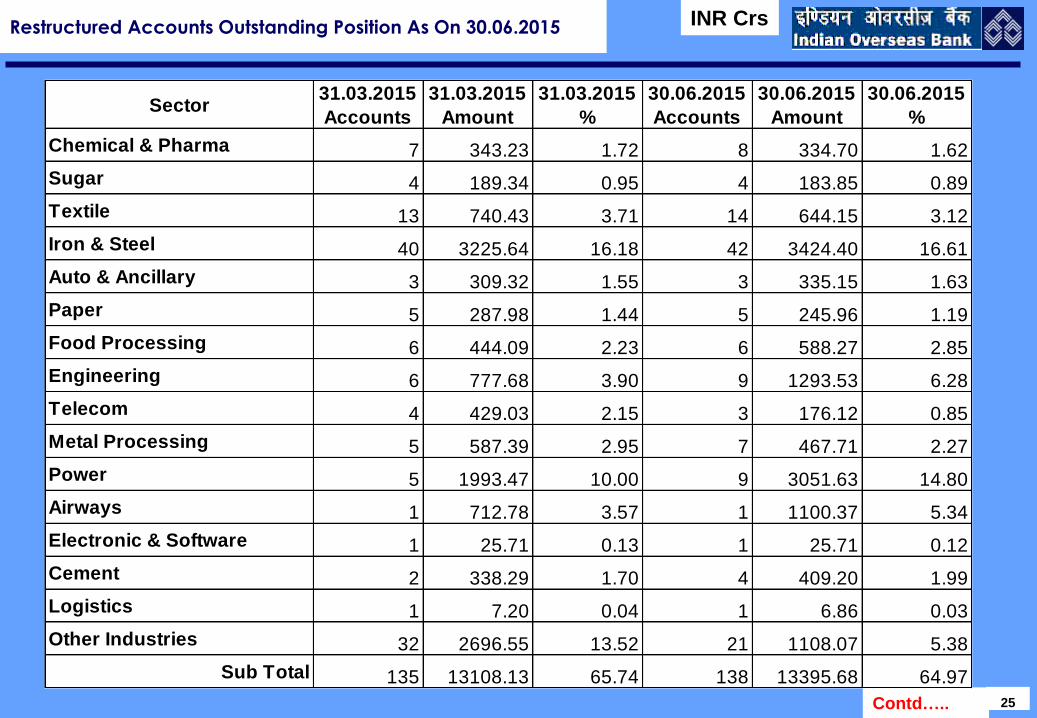
Restructured Accounts Outstanding Position As On 30.06.2015
25
INR Crs
Contd…..
Sector31.03.2015
Accounts
31.03.2015
Amount
31.03.2015
%
30.06.2015
Accounts
30.06.2015
Amount
30.06.2015
%
Chemical & Pharma 7 343.23 1.72 8 334.70 1.62
Sugar 4 189.34 0.95 4 183.85 0.89
Textile 13 740.43 3.71 14 644.15 3.12
Iron & Steel 40 3225.64 16.18 42 3424.40 16.61
Auto & Ancillary 3 309.32 1.55 3 335.15 1.63
Paper 5 287.98 1.44 5 245.96 1.19
Food Processing 6 444.09 2.23 6 588.27 2.85
Engineering 6 777.68 3.90 9 1293.53 6.28
Telecom 4 429.03 2.15 3 176.12 0.85
Metal Processing 5 587.39 2.95 7 467.71 2.27
Power 5 1993.47 10.00 9 3051.63 14.80
Airways 1 712.78 3.57 1 1100.37 5.34
Electronic & Software 1 25.71 0.13 1 25.71 0.12
Cement 2 338.29 1.70 4 409.20 1.99
Logistics 1 7.20 0.04 1 6.86 0.03
Other Industries 32 2696.55 13.52 21 1108.07 5.38
Sub Total 135 13108.13 65.74 138 13395.68 64.97
26
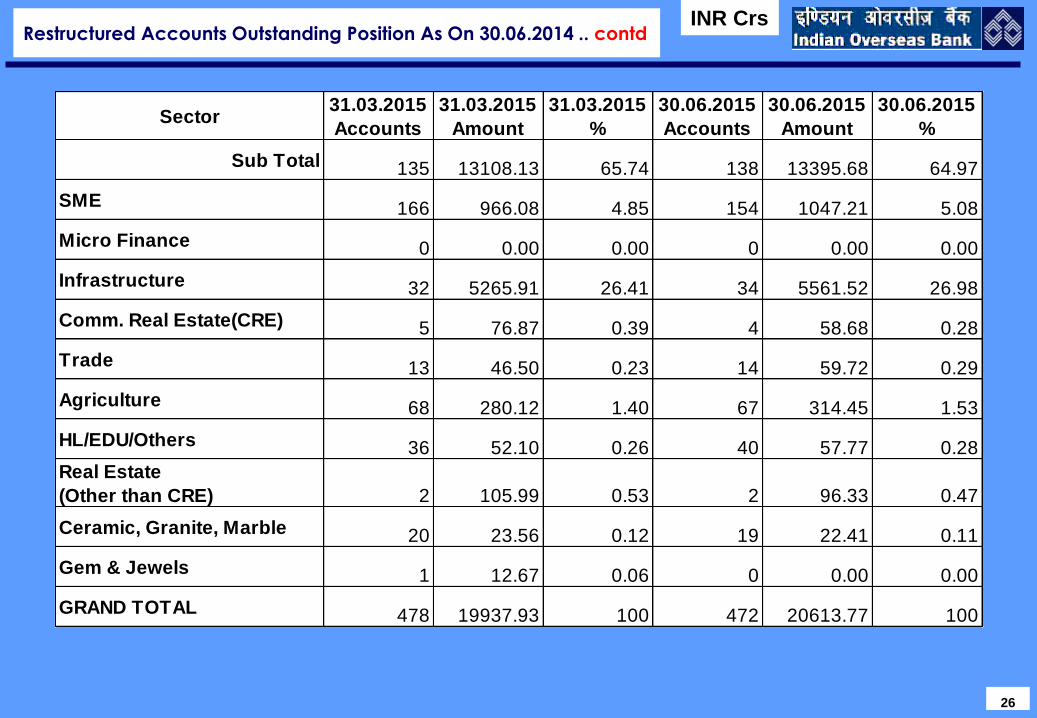
Restructured Accounts Outstanding Position As On 30.06.2014 .. contdINR Crs
Sector31.03.2015
Accounts
31.03.2015
Amount
31.03.2015
%
30.06.2015
Accounts
30.06.2015
Amount
30.06.2015
%
Sub Total 135 13108.13 65.74 138 13395.68 64.97
SME 166 966.08 4.85 154 1047.21 5.08
Micro Finance 0 0.00 0.00 0 0.00 0.00
Infrastructure 32 5265.91 26.41 34 5561.52 26.98
Comm. Real Estate(CRE) 5 76.87 0.39 4 58.68 0.28
Trade 13 46.50 0.23 14 59.72 0.29
Agriculture 68 280.12 1.40 67 314.45 1.53
HL/EDU/Others 36 52.10 0.26 40 57.77 0.28
Real Estate
(Other than CRE) 2 105.99 0.53 2 96.33 0.47
Ceramic, Granite, Marble 20 23.56 0.12 19 22.41 0.11
Gem & Jewels 1 12.67 0.06 0 0.00 0.00
GRAND TOTAL 478 19937.93 100 472 20613.77 100
27
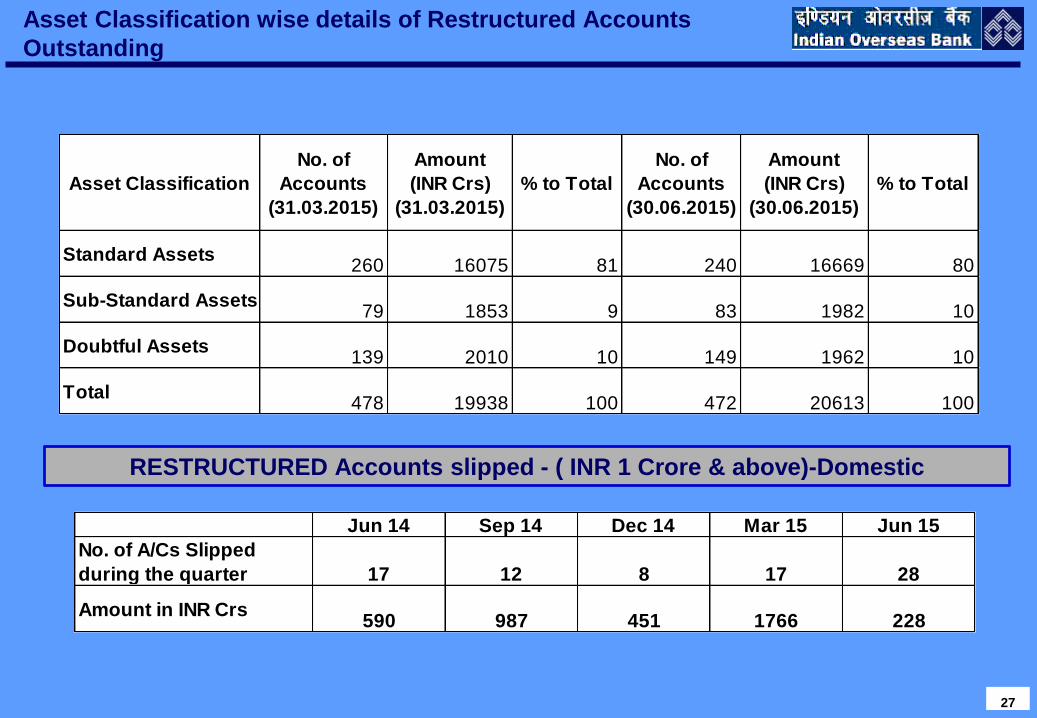
Asset Classification wise details of Restructured Accounts
Outstanding
Asset Classification
No. of
Accounts
(31.03.2015)
Amount
(INR Crs)
(31.03.2015)
% to Total
No. of
Accounts
(30.06.2015)
Amount
(INR Crs)
(30.06.2015)
% to Total
Standard Assets260 16075 81 240 16669 80
Sub-Standard Assets79 1853 9 83 1982 10
Doubtful Assets139 2010 10 149 1962 10
Total478 19938 100 472 20613 100
Jun 14 Sep 14 Dec 14 Mar 15 Jun 15
No. of A/Cs Slipped
during the quarter 17 12 8 17 28
Amount in INR Crs590 987 451 1766 228
RESTRUCTURED Accounts slipped - ( INR 1 Crore & above)-Domestic

RESTRUCTURED ACCOUNTS
(INCLUDES ALL F.B. FACILITIES OF THE BORROWER)
Domestic Foreign Global
> 1 crore < 1 crore Total
As on 31.03.2015 O/S 19890.75 47.19 19937.93 545.61 20483.54
Additions during Q1 of
2015-16
556.64 0 556.64 0 556.64
Less:
Recovery/Slippage
during Q1 of 2015-16
-121.06 1.88 -119.18 0 -119.18
As on 30.06.2015 O/S 20568.45 45.31 20613.75 558.89 21159.36
28
INR Cr
2929
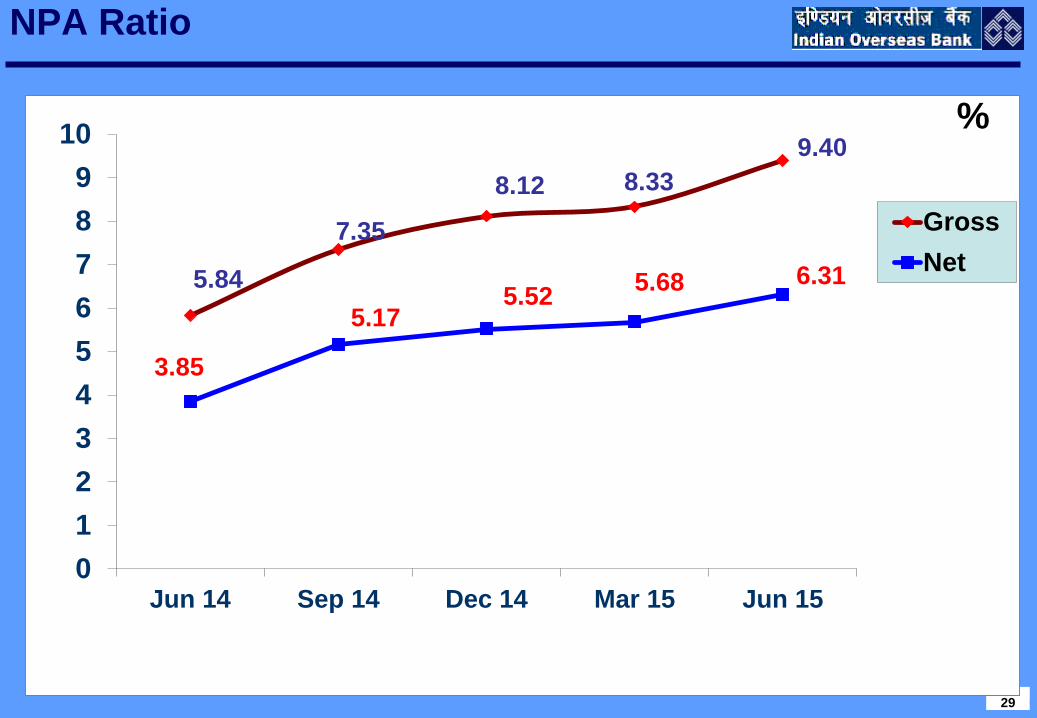
NPA Ratio
5.84
7.35
8.12 8.33
9.40
3.85
5.175.52
5.68 6.31
0
1
2
3
4
5
6
7
8
9
10
Jun 14 Sep 14 Dec 14 Mar 15 Jun 15
Gross
Net
%
3030
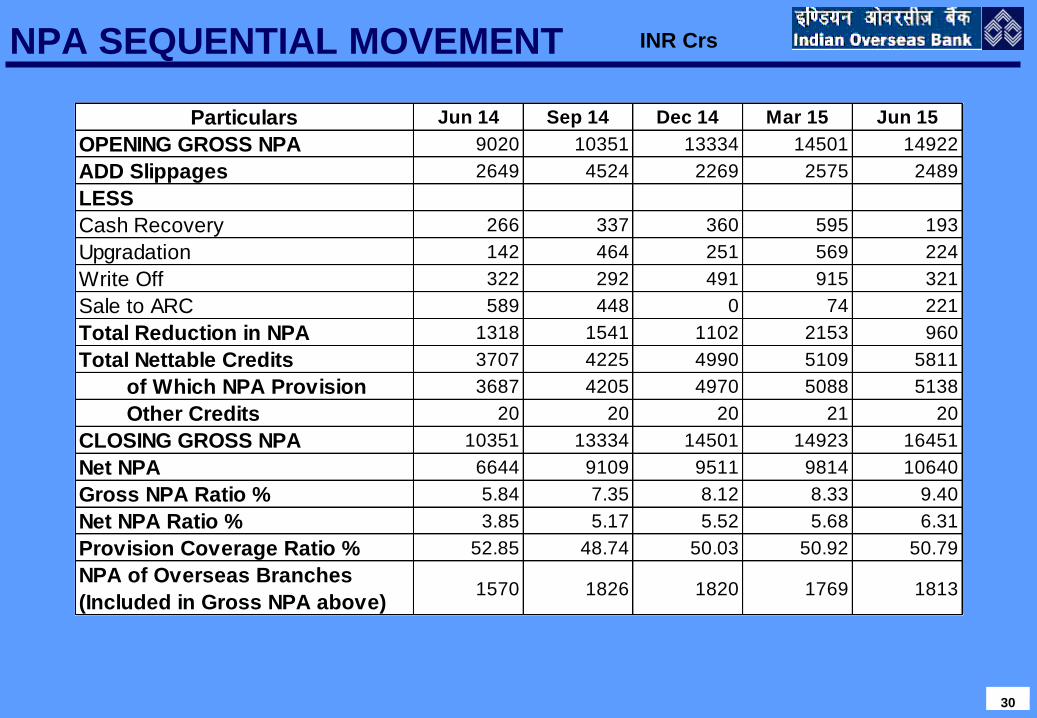
NPA SEQUENTIAL MOVEMENT INR Crs
Particulars Jun 14 Sep 14 Dec 14 Mar 15 Jun 15
OPENING GROSS NPA 9020 10351 13334 14501 14922
ADD Slippages 2649 4524 2269 2575 2489
LESS
Cash Recovery 266 337 360 595 193
Upgradation 142 464 251 569 224
Write Off 322 292 491 915 321
Sale to ARC 589 448 0 74 221
Total Reduction in NPA 1318 1541 1102 2153 960
Total Nettable Credits 3707 4225 4990 5109 5811
of Which NPA Provision 3687 4205 4970 5088 5138
Other Credits 20 20 20 21 20
CLOSING GROSS NPA 10351 13334 14501 14923 16451
Net NPA 6644 9109 9511 9814 10640
Gross NPA Ratio % 5.84 7.35 8.12 8.33 9.40
Net NPA Ratio % 3.85 5.17 5.52 5.68 6.31
Provision Coverage Ratio % 52.85 48.74 50.03 50.92 50.79
NPA of Overseas Branches
(Included in Gross NPA above)1570 1826 1820 1769 1813

Sector Wise Break Up of NPAs
as of 30.06.2015 (Domestic)
31
INR Cr
CategoryNPA as of
30.06.2015
% to Total
Domestic NPA
Agriculture 1643.78 11.23
Industry 9122.31 62.32
Services 3019.16 20.63
Personal 852.86 5.82
Total 14638.11 100
of Which
Commercial Real Estate 290.33 1.98
32
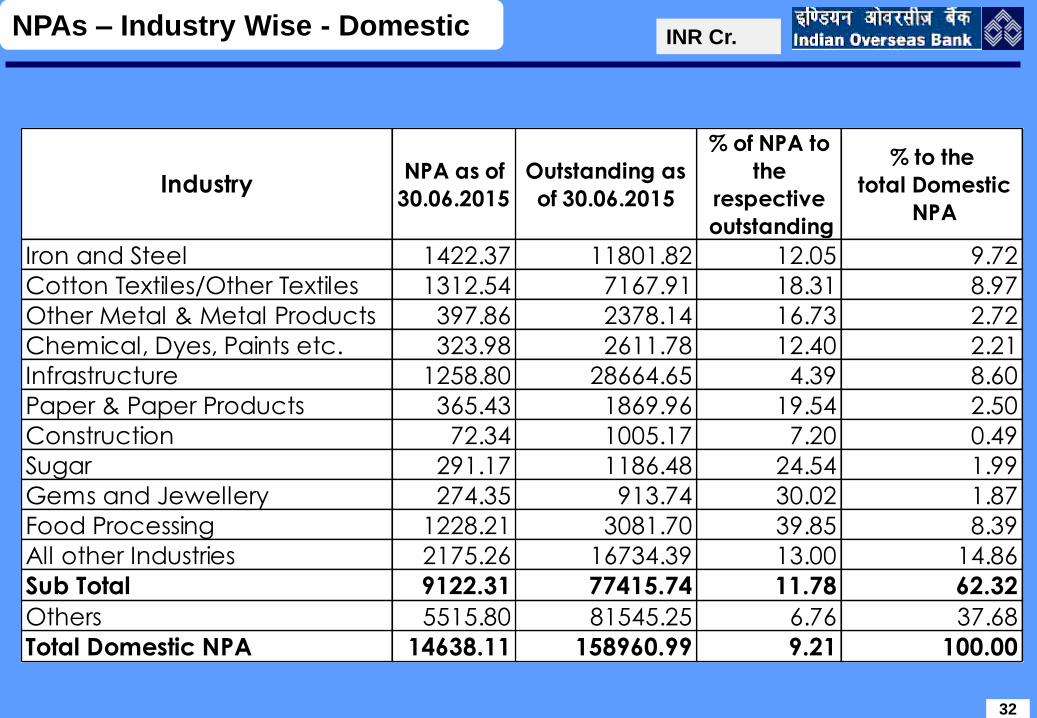
INR Cr. NPAs – Industry Wise - Domestic
IndustryNPA as of
30.06.2015
Outstanding as
of 30.06.2015
% of NPA to
the
respective
outstanding
% to the
total Domestic
NPA
Iron and Steel 1422.37 11801.82 12.05 9.72
Cotton Textiles/Other Textiles 1312.54 7167.91 18.31 8.97
Other Metal & Metal Products 397.86 2378.14 16.73 2.72
Chemical, Dyes, Paints etc. 323.98 2611.78 12.40 2.21
Infrastructure 1258.80 28664.65 4.39 8.60
Paper & Paper Products 365.43 1869.96 19.54 2.50
Construction 72.34 1005.17 7.20 0.49
Sugar 291.17 1186.48 24.54 1.99
Gems and Jewellery 274.35 913.74 30.02 1.87
Food Processing 1228.21 3081.70 39.85 8.39
All other Industries 2175.26 16734.39 13.00 14.86
Sub Total 9122.31 77415.74 11.78 62.32
Others 5515.80 81545.25 6.76 37.68
Total Domestic NPA 14638.11 158960.99 9.21 100.00
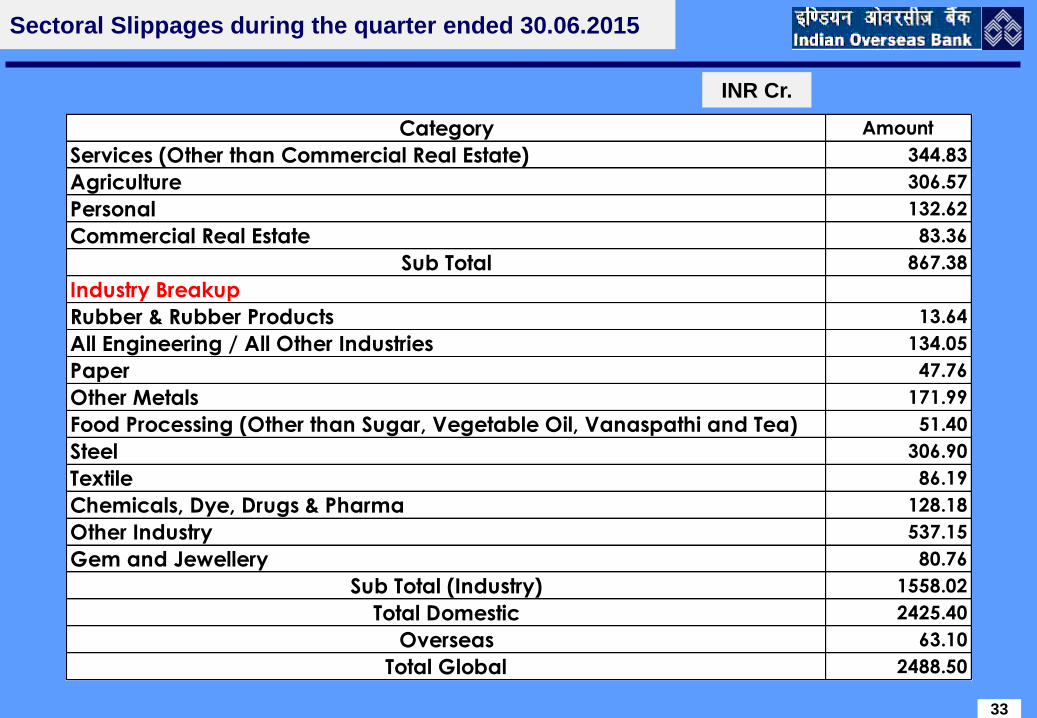
Sectoral Slippages during the quarter ended 30.06.2015
33
INR Cr.
Category Amount
Services (Other than Commercial Real Estate) 344.83
Agriculture 306.57
Personal 132.62
Commercial Real Estate 83.36
Sub Total 867.38
Industry Breakup
Rubber & Rubber Products 13.64
All Engineering / All Other Industries 134.05
Paper 47.76
Other Metals 171.99
Food Processing (Other than Sugar, Vegetable Oil, Vanaspathi and Tea) 51.40
Steel 306.90
Textile 86.19
Chemicals, Dye, Drugs & Pharma 128.18
Other Industry 537.15
Gem and Jewellery 80.76
Sub Total (Industry) 1558.02
Total Domestic 2425.40
Overseas 63.10
Total Global 2488.50
34
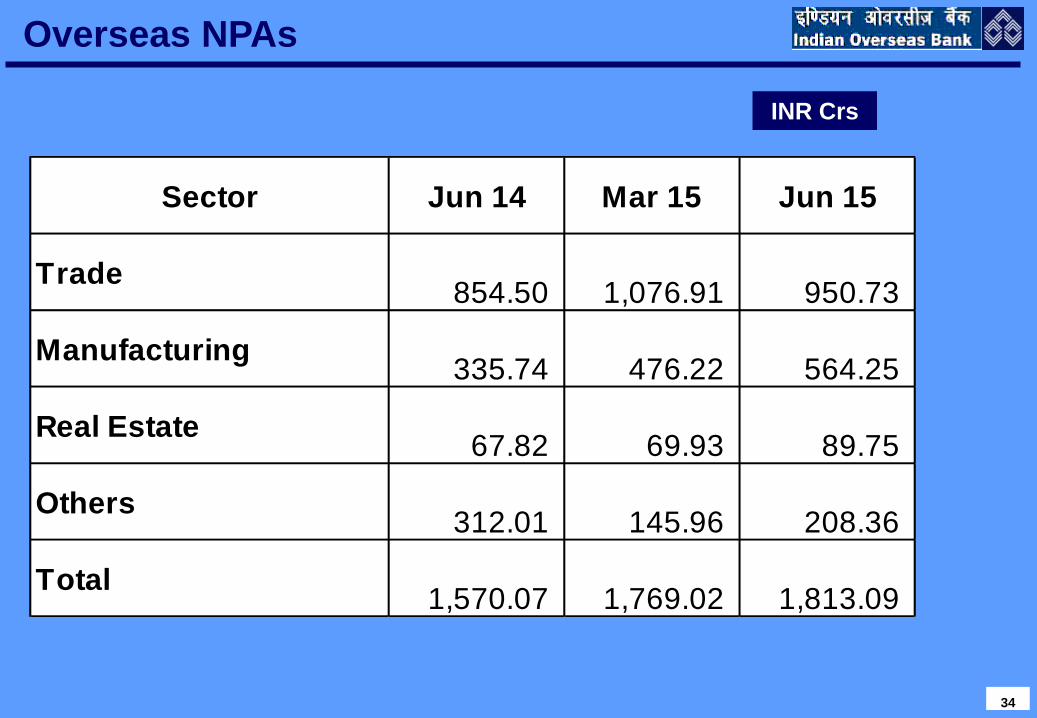
INR Crs
Overseas NPAs
Sector Jun 14 Mar 15 Jun 15
Trade854.50 1,076.91 950.73
Manufacturing335.74 476.22 564.25
Real Estate67.82 69.93 89.75
Others 312.01 145.96 208.36
Total1,570.07 1,769.02 1,813.09

3535
Profitability (Quarter Sequential)
1427 1344 13571256 1329
686 729 726
1180556
272-245 -516
35 15
-1000
-500
0
500
1000
1500
2000
Jun 14 Sep 14 Dec 14 Mar 15 Jun 15
Net Interest Income
Operating Profit
Net Profit
INR Crs
3636
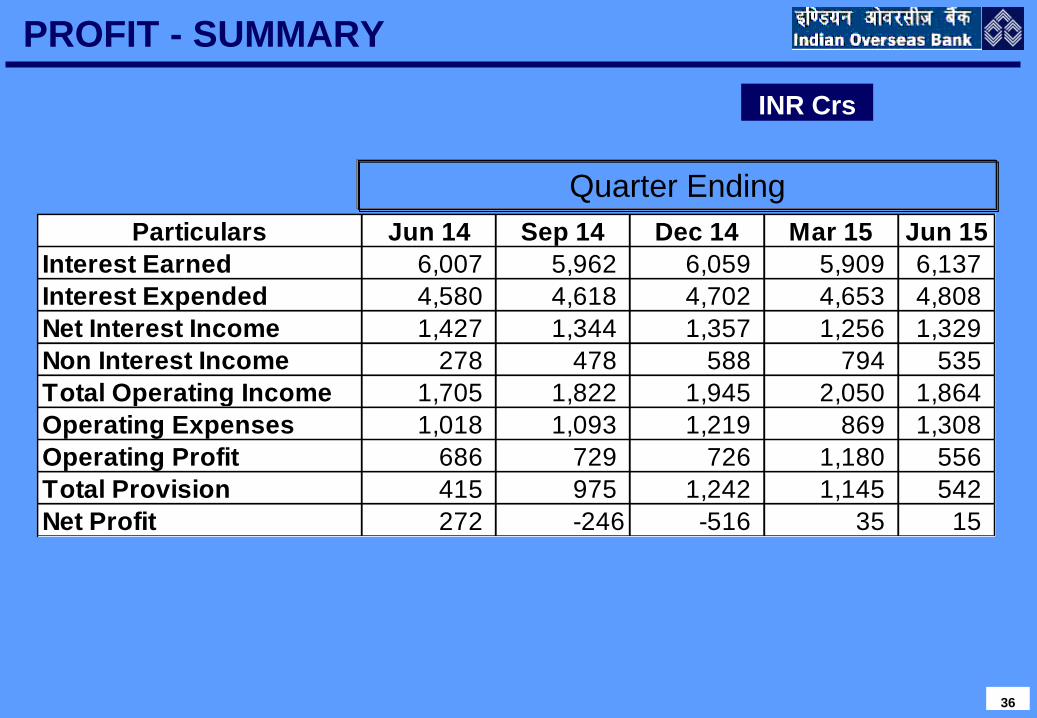
PROFIT - SUMMARY
INR Crs
Quarter Ending
Particulars Jun 14 Sep 14 Dec 14 Mar 15 Jun 15
Interest Earned 6,007 5,962 6,059 5,909 6,137
Interest Expended 4,580 4,618 4,702 4,653 4,808
Net Interest Income 1,427 1,344 1,357 1,256 1,329
Non Interest Income 278 478 588 794 535
Total Operating Income 1,705 1,822 1,945 2,050 1,864
Operating Expenses 1,018 1,093 1,219 869 1,308
Operating Profit 686 729 726 1,180 556
Total Provision 415 975 1,242 1,145 542
Net Profit 272 -246 -516 35 15

3737
PROFITABILITY - Q1
INR Crs
Particulars Q1 14-15 Q1 15-16 Variance %
TOTAL INCOME 6284.68 6672.11 6.16
Interest Earned 6007.04 6137.27 2.17
Other Income 277.64 534.84 92.64
TOTAL EXPENDITURE
(Excl. Provisions and Contingencies)5598.27 6115.8 9.24
Interest Expended 4580.16 4808.25 4.98
Operating Expenses 1018.11 1307.55 28.43
1) Payments to and Provisions for Employees 684.34 947.39 38.44
2) Other Operating Expenses 333.77 360.16 7.91
OPERATING PROFIT
(Profit before Provisions and
Contingencies)
686.41 556.31 -18.95
Total Provisions and Contingences 414.69 541.55 30.59
of Which
Provision for NPAs 524.33 974.64 85.88
Provision for Taxes 115.42 -122.02 -205.72
Others -225.06 -311.07 38.22
NET PROFIT 271.72 14.76 -94.57
3838
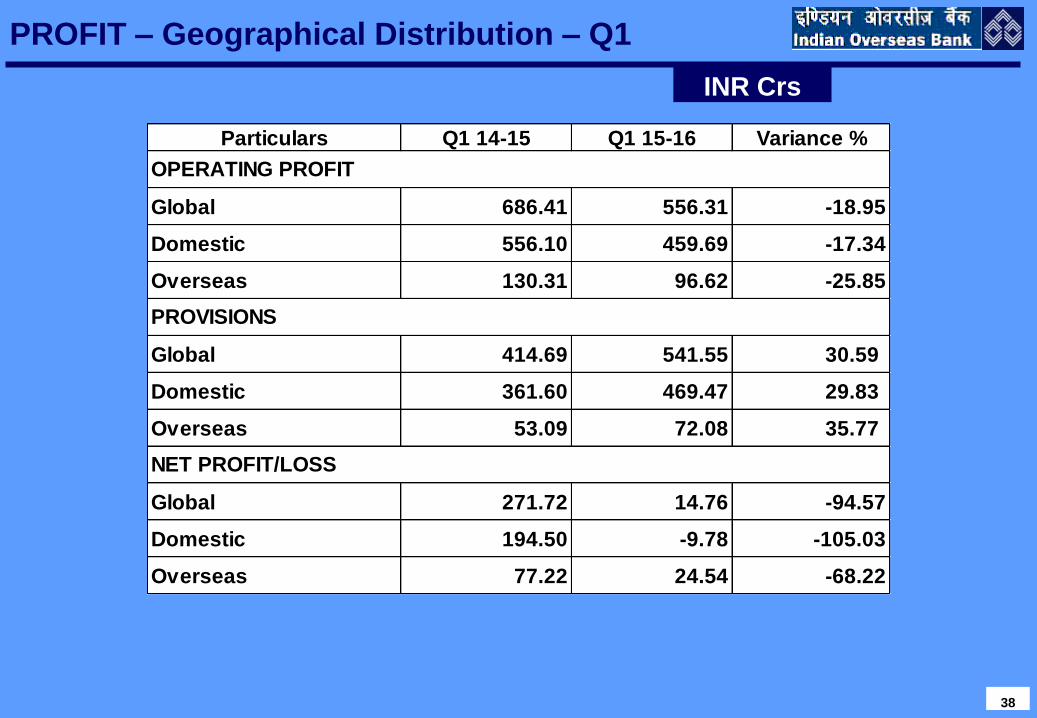
PROFIT – Geographical Distribution – Q1
INR Crs
Particulars Q1 14-15 Q1 15-16 Variance %
Global 686.41 556.31 -18.95
Domestic 556.10 459.69 -17.34
Overseas 130.31 96.62 -25.85
Global 414.69 541.55 30.59
Domestic 361.60 469.47 29.83
Overseas 53.09 72.08 35.77
Global 271.72 14.76 -94.57
Domestic 194.50 -9.78 -105.03
Overseas 77.22 24.54 -68.22
OPERATING PROFIT
PROVISIONS
NET PROFIT/LOSS
3939
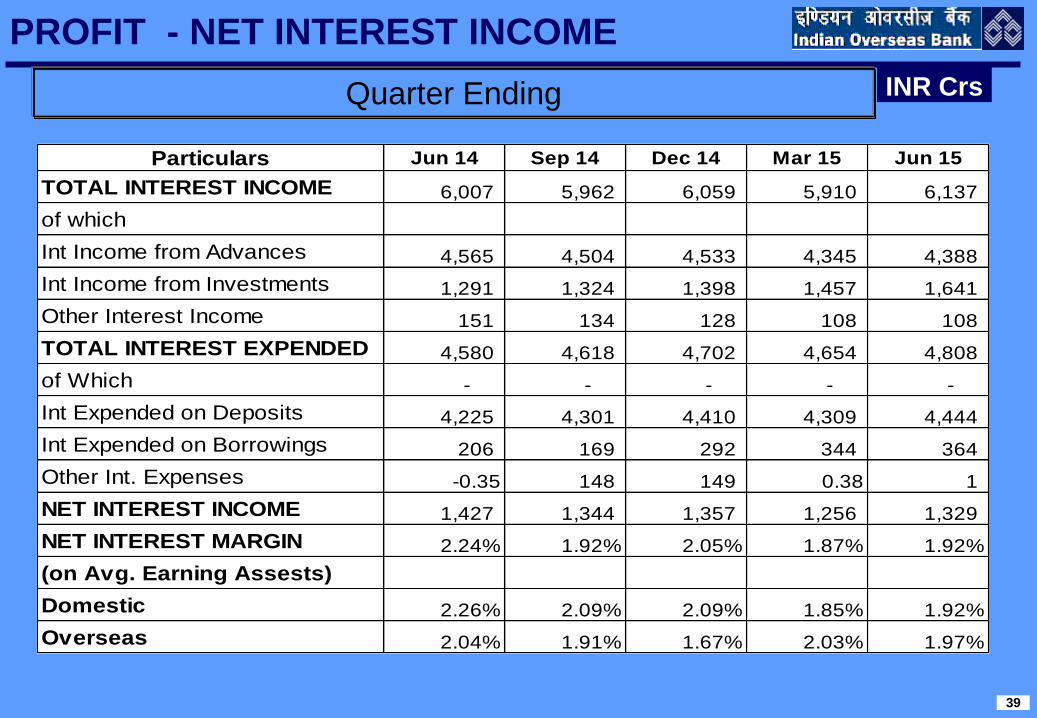
PROFIT - NET INTEREST INCOME
INR CrsQuarter Ending
Particulars Jun 14 Sep 14 Dec 14 Mar 15 Jun 15
TOTAL INTEREST INCOME 6,007 5,962 6,059 5,910 6,137
of which
Int Income from Advances 4,565 4,504 4,533 4,345 4,388
Int Income from Investments 1,291 1,324 1,398 1,457 1,641
Other Interest Income 151 134 128 108 108
TOTAL INTEREST EXPENDED 4,580 4,618 4,702 4,654 4,808
of Which - - - - -
Int Expended on Deposits 4,225 4,301 4,410 4,309 4,444
Int Expended on Borrowings 206 169 292 344 364
Other Int. Expenses -0.35 148 149 0.38 1
NET INTEREST INCOME 1,427 1,344 1,357 1,256 1,329
NET INTEREST MARGIN 2.24% 1.92% 2.05% 1.87% 1.92%
(on Avg. Earning Assests)
Domestic 2.26% 2.09% 2.09% 1.85% 1.92%
Overseas 2.04% 1.91% 1.67% 2.03% 1.97%

4040
PROFIT - NET INTEREST INCOME
INR Crs
Particulars Q1 14-15 Q1 15-16 Variance %
TOTAL INTEREST INCOME 6007.04 6137.27 2.17
of which
Int Income from Advances 4564.61 4388.18 -3.87
Int Income from Investments 1290.98 1640.97 27.11
Other Interest Income 151.45 108.12 -28.61
TOTAL INTEREST EXPENDED 4580.16 4808.25 4.98
of Which
Int Expended on Deposits 4225.14 4444.05 5.18
Int Expended on Borrowings 355.37 364.19 2.48
Other Int. Expenses
NET INTEREST INCOME 1426.88 1329.02 -6.86
NET INTEREST MARGIN 2.24% 1.92%
(on Avg. Earning Assests)
Domestic 2.26% 1.92%
Overseas 2.04% 1.97%

4141
Non Interest Income (Quarterly Comparison)
INR Crs
Quarter Ending
Particulars Jun 14 Sep 14 Dec 14 Mar 15 Jun 15
Total Non Interest Income 278 478 588 794 535
of which
Exchange / Commission 236 243 228 295 255
Profit on Sale of Investments 90 46 126 274 80
Profit on Revaln. Of Investments -253 0 0 0 -2
Other Non Interest Income 117 134 141 120 202

4242
Non Interest Income -Q1-2015-16
INR Crs
Particulars Q1 14-15 Q1 15-16 Variance %
Total Non Interest Income 277.64 534.84 92.64
of which
Exchange / Commission 236.41 254.66 7.72
Profit on Sale of Investments 89.89 79.64 -ve
Profit on Revaln. Of Investments -253.48 -1.54 -ve
Recovery in Writtern off Accounts 88.07 90.17 2.38
Other Non Interest Income 116.75 110.80 -ve
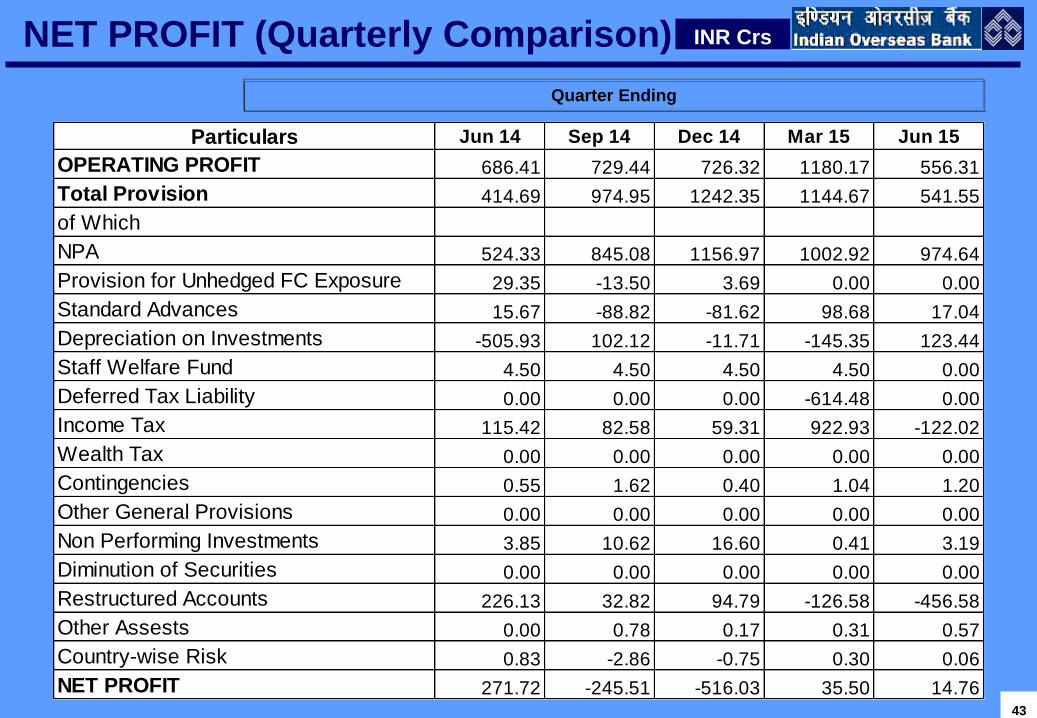
4343
NET PROFIT (Quarterly Comparison) INR Crs
Quarter Ending
Particulars Jun 14 Sep 14 Dec 14 Mar 15 Jun 15
OPERATING PROFIT 686.41 729.44 726.32 1180.17 556.31
Total Provision 414.69 974.95 1242.35 1144.67 541.55
of Which
NPA 524.33 845.08 1156.97 1002.92 974.64
Provision for Unhedged FC Exposure 29.35 -13.50 3.69 0.00 0.00
Standard Advances 15.67 -88.82 -81.62 98.68 17.04
Depreciation on Investments -505.93 102.12 -11.71 -145.35 123.44
Staff Welfare Fund 4.50 4.50 4.50 4.50 0.00
Deferred Tax Liability 0.00 0.00 0.00 -614.48 0.00
Income Tax 115.42 82.58 59.31 922.93 -122.02
Wealth Tax 0.00 0.00 0.00 0.00 0.00
Contingencies 0.55 1.62 0.40 1.04 1.20
Other General Provisions 0.00 0.00 0.00 0.00 0.00
Non Performing Investments 3.85 10.62 16.60 0.41 3.19
Diminution of Securities 0.00 0.00 0.00 0.00 0.00
Restructured Accounts 226.13 32.82 94.79 -126.58 -456.58
Other Assests 0.00 0.78 0.17 0.31 0.57
Country-wise Risk 0.83 -2.86 -0.75 0.30 0.06
NET PROFIT 271.72 -245.51 -516.03 35.50 14.76

4444
Cost & Yield Ratios (Quarterly Comparison)
Particulars Jun 14 Sep 14 Dec 14 Mar 15 Jun 15
Avg. Cost of Deposits (%) 7.69 7.69 7.60 7.50 7.45
Avg. Yield on Advances (%) 10.14 9.98 9.97 9.60 9.76
Avg. Yield on Investments (%) 7.23 7.30 7.24 7.04 7.16
Avg. Cost of Funds (%) 7.60 7.59 7.51 7.40 7.36
Avg. Yield on Funds (%) 9.44 9.21 9.16 8.80 8.87
Net Interest Margin (%) 2.24% 2.07% 2.05% 1.87% 1.92%
Particulars Jun 14 Sep 14 Dec 14 Mar 15Mar 15
(Annual)Jun 15
Cost to Income Ratio (%) 59.73 59.99 62.66 42.43 55.83 70.15
Return on Assets (%) 0.39 -ve -ve 0.05 -ve 0.02
Return on Equity (%) 8.24 -ve -ve 1.09 -ve 0.47
Earning per Share (INR) 8.80 -ve -ve 1.15 1.15 0.48
Book Value per Share (INR) 107.86 105.66 101.65 100.75 100.75 100.90

4545
INVESTMENTS - Domestic
31.03.2015 30.06.2015
AFS HTM HFT TOTAL AFS HTM HFT TOTAL
SLR Investments 12127.68 53436.39 301.05 65865.12 25940 53508.44 122.16 79570.60
Of which
Government. Securities 12127.66 53433.28 301.05 65861.99 25939.98 53505.33 122.16 79567.47
Other Approved
Securities0.020 3.11 0 3.13 0.02 3.11 0 3.13
M Duration (for SLR) 6.04 5.93
Non SLR Investments 10084.10 299.92 11.31 10395.33 8259.88 289.49 8.17 8557.53
M Duration (Non SLR) 3.73 5.02
M Duration
(Entire Portfolio)5.85 5.88
Total 22211.78 53736.31 312.36 76260.44 34199.88 53797.92 130.33 88128.13
INR Crs

4646
INVESTMENTS – Foreign -30.06.2015
Type of InvestmentBook Value
(Gross)
Total
Provision
G - Sec 2,606.55 0.14
Bonds - Others 9.52 -
MTN,FCCB 894.29 58.86
Shares 0.09 -
Joint Venture - Malaysia 199.58 -
Total 3,710.03 59.00
INR Crs
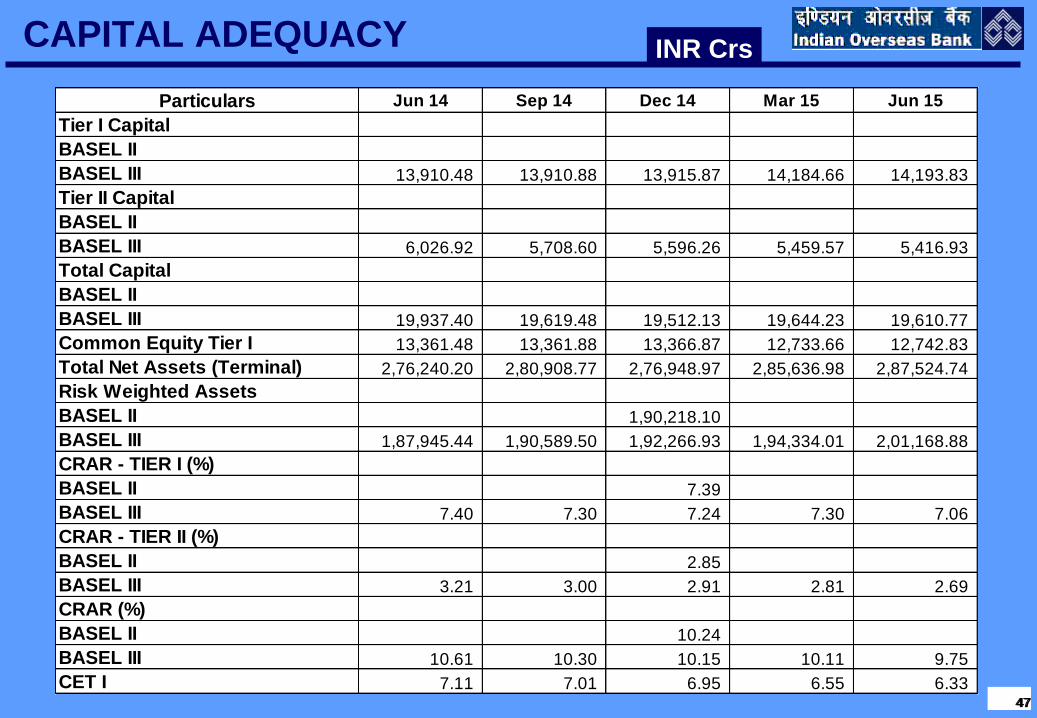
4747
CAPITAL ADEQUACY INR Crs
Particulars Jun 14 Sep 14 Dec 14 Mar 15 Jun 15
Tier I Capital
BASEL II
BASEL III 13,910.48 13,910.88 13,915.87 14,184.66 14,193.83
Tier II Capital
BASEL II
BASEL III 6,026.92 5,708.60 5,596.26 5,459.57 5,416.93
Total Capital
BASEL II
BASEL III 19,937.40 19,619.48 19,512.13 19,644.23 19,610.77
Common Equity Tier I 13,361.48 13,361.88 13,366.87 12,733.66 12,742.83
Total Net Assets (Terminal) 2,76,240.20 2,80,908.77 2,76,948.97 2,85,636.98 2,87,524.74
Risk Weighted Assets
BASEL II 1,90,218.10
BASEL III 1,87,945.44 1,90,589.50 1,92,266.93 1,94,334.01 2,01,168.88
CRAR - TIER I (%)
BASEL II 7.39
BASEL III 7.40 7.30 7.24 7.30 7.06
CRAR - TIER II (%)
BASEL II 2.85
BASEL III 3.21 3.00 2.91 2.81 2.69
CRAR (%)
BASEL II 10.24
BASEL III 10.61 10.30 10.15 10.11 9.75
CET I 7.11 7.01 6.95 6.55 6.33

4848
PRODUCTIVITY
120.16
125.86 126.10123.68
119.89
90
100
110
120
130
Jun 14 Sep 14 Dec 14 Mar 15 Jun 15
Business perBranch
12.77 12.8512.61
13.24
12.83
8
9
10
11
12
13
14
Jun 14 Sep 14 Dec 14 Mar 15 Jun 15
Business perEmployee
INR Crs

49
Financial Inclusion
Basic Savings Bank Deposit Accounts(BSBDA): As per the guidelines issued by Reserve Bank of India,
our branches are opening BSBD Accounts to bring the excluded segment of population into banking fold.
General Purpose Credit Cards(GCC),Kissan Credit cards(KCC) and Temporary Over Draft(TOD) against
BSBD Accounts are granted to meet their credit requirements.
Smart Card Banking: To extend banking service to the villages and provide banking outlet in un-banked
centers, our Bank has introduced Smart Card Banking. Under this method villagers can operate their account
with Bio-metric Smart Card at the Hand Held Device with a Business Correspondent
Progress under Financial Inclusion Furnished below:
#Data is based on the recent RBI guidelines on reporting GCC data
Particulars30.06.2014
(Nos.)
31.03.2015
(Nos.)
30.06.2015
(Nos.)
No Frills SB Accounts Opened 59,60,808 90,29,868 92,63,860
General Purpose Credit Cards Granted 4,43,359 4,37,657 5,65,482
Branches Under Smart Card Banking 885 1,088 1,103
Villages Covered Under Smart Card Banking 3,882 4,251 4,285
Business Correspondents Engaged 2,487 2,601 2,861
Bio Metric Smart Card Issued 11,92,263 16,73,126 18,19,309
Smart Card Banking Coverage - Regions 56 56 56
Smart Card Banking Coverage - State/Union Territory 21/2 21/2 21/2
50
Corporate Social Responsibility
IOB-Sampoorna Project – A Total Village Development Project
IOB Sampoorna is an innovative rural development project aimed at Total Village Development.
IOB-Sampoorna is a unique Project encompassing several livelihood initiatives in the villages to
ensure all-inclusive growth of rural population.
It comprises of credit and non-credit components such as Financial Inclusion, I.T. Enabled
banking operations with Bio-metric Smart Cards under Business Correspondent model, Tree
Planting and Social Forestry, Cleaning Water Bodies, Health Care, Skill Training for youth in
computer, Rural Business Process Outsourcing, Promotion of non-conventional energy and
Rural Tourism.

5151
Thank You