Embed Size (px)
Citation preview

July 2021
FLOW WORLD SERIESInvestment InsightsPerspectives on opportunity and risk in a world where flows can dominate fundamentals
FOR INSTITUTIONAL INVESTOR USE ONLY / NOT FOR PUBLIC VIEWING OR DISTRIBUTION
Welcome to Flow World 2
Flow World Reloaded 4
Flow World Revolutions 8

Page 2 of 12
Large-scale trading activity periodically creates short-term dislocations. Portfolio Manager Aneet Chachra considers the investment opportunity around these flow-driven price moves.
Many of the uncertainties of 2020 are resolved for now. The U.S. election is decided, the stimulus bill has passed, the Federal Reserve is holding rates near zero, and vaccinations have started. Most investors need to save money for retirement. But with inflation-adjusted bond yields negative around the world, savings are being disproportionately channeled into equities and other risky assets.
Stocks are historically expensive based on most valuation measures, but attractive relative to current interest rates. However, they are also much more volatile than cash or high-quality bonds. Equities provide immediate liquidity at uncertain prices.
Meanwhile, there is strong growth in price-insensitive strategies with fixed trading rules. Passive funds are the obvious example: hold minimal cash, buy after receiving contributions, sell after redemptions, and add/delete per schedule. But many other styles are similarly constrained. For example, volatility-targeting strategies must sell when volatility is rising and buy when volatility is falling. Target-date, 60/40, risk parity, trend following, factor funds, etc. likewise follow set instructions after changes in price, volatility and correlation.
The post-COVID surge in option trading is an accelerant. Most retail investors do not hedge their option positions, but market makers do. Option market growth increases hedging flows in the underlying assets. The inherent leverage of options, margin trading and retail interest in speculative stocks escalates price moves in both directions.
In this environment, flows often matter more than fundamentals. Inflexible strategies that must trade typically induce a price response to incentivize flexible buyers/sellers. These flow-driven price moves also increase volatility unrelated to any actual change in the asset.
This “Flow World” dynamic creates opportunities for alternative strategies that are designed to capture dislocations. For example, large corporate stock or bond sales require discretionary capital to
WELCOME TO FLOW WORLDInvestment Insights Series
Aneet Chachra, CFAPortfolio Manager
Key Takeaways ■ There has been strong growth in price-insensitive strategies with fixed trading rules, including passive funds.
■ Inflexible strategies that must trade typically induce a price response to incentivize buyers/sellers.
■ This is a favorable backdrop for alternative strategies designed to benefit from higher volatility and greater flow effects.
FOR INSTITUTIONAL INVESTOR USE ONLY / NOT FOR PUBLIC VIEWING OR DISTRIBUTION
Notice that the stiffest tree is most easily cracked, while the bamboo or willow survives by bending with the wind.”
Bruce Lee
January 2021

Page 3 of 12
deploy cash and risk-taking capacity. Governments and central banks transact enormous quantities of sovereign debt over a short window. Flows periodically cause equity share class anomalies while bank structured product issuance and hedging distort referenced markets. Passive funds, factor rotation and option activity similarly lead to short-term buying/selling pressures.
These examples all involve directly or indirectly intermediating flows from participants who are raising/investing money, or constrained due to mandate or strategy. Such inflexible flows are generally growing in size due to larger issuance, increased passive share and higher option volumes. This shift is happening while flexible, multi-day discretionary participants like active managers and bank trading desks are broadly shrinking.
Investors face difficult choices to balance portfolio return and volatility. In this low-conviction Flow World market environment, large buys/sells can result in disproportionate price impact relative to other assets.
Conversely, this backdrop is favorable for alternative market-neutral strategies designed to benefit from higher volatility and greater flow effects. These are skill-based approaches that build upon experience, access and infrastructure to target attractive and differentiated returns.
Finally, this flow-driven market regime could suddenly change, and new uncertainties can and will emerge. It is important to also allocate to strategies that seek positive returns during periods of sustained market stress and large underlying moves. Pairing short-term with longer horizon strategies can help investors capture current market opportunities while being prepared for the unexpected.
FLOW WORLD SERIES
FOR INSTITUTIONAL INVESTOR USE ONLY / NOT FOR PUBLIC VIEWING OR DISTRIBUTION

Can investors ride the pickup in issuance and option volumes in 2021? Aneet Chachra and David Elms consider how flexible, flow-driven strategies acting as price makers to intermediate flow mismatches can benefit.
FLOW WORLD RELOADEDInvestment Insights Series
Aneet Chachra, CFAPortfolio Manager
Key Takeaways ■ Large-scale issuance is reloading the opportunity set available to flexible strategies designed to capture dislocations and benefit from flow-driven effects.
■ US Treasury issuance is likely to remain elevated in 2021 with the recent passage of another large stimulus and an infrastructure bill expected to follow. US IPOs are at a 20-year high, while option trading volumes have tripled since the start of 2020.
■ The post-COVID boom creates a favorable environment for flexible, flow-driven approaches. But harvesting price anomalies requires experience, access and infrastructure.
FOR INSTITUTIONAL INVESTOR USE ONLY / NOT FOR PUBLIC VIEWING OR DISTRIBUTION
David ElmsHead of Diversified Alternatives, Portfolio Manager
We are always in a process of becoming and nothing is fixed.
Have no rigid system in you, and you’ll be flexible to change with the ever changing.
Open yourself and flow, my friend.
Bruce Lee
At the start of 2021, we published, Welcome to Flow World, to introduce and explain our view that markets were in a regime where flows would dominate fundamentals.
If you haven’t read it - here’s the two-line summary:
The influence of inflexible “price taker” market participants is expanding, just as flexible “price maker” players are losing share. This creates less signal and more noise in asset price moves.
In this sequel, we discuss how the current “Flow World” environment is broadly positive for flexible strategies that can step in as price makers to intermediate flow mismatches. We also show why we believe the opportunity set for such strategies is improving as underlying markets expand and issuance grows.
Flows impact pricesMost passive strategies have largely fixed rules to minimize tracking error. For example, net inflows to ETFs and other tracking funds result in the underlying basket being bought while outflows drive asset sales. Thematic funds that focus on a particular sector typically have much higher turnover than “vanilla” index funds. This is because their flows are usually more volatile, and they require larger rebalancing trades compared to broad market-cap weighted indices. Other popular strategies are rule-based as well; factor/smart beta exposures need to be adjusted not just for flows but also for changes in the factor basket. Similarly, volatility-target products are forced buyers when realized volatility is falling but forced sellers when volatility is rising.
March 2021
Page 4 of 12
FLOW WORLD SERIES
Exhibit 1: US Treasury gross issuance has surged (2000–2021)
US
Tre
asur
y gr
oss
issu
ance
(U
S$
billi
ons)
0
5,000
10,000
15,000
20,000
25,000
2021
YTD
2020
2019
2018
2017
2016
2015
2014
2013
2012
2011
2010
2009
2008
2007
2006
2005
2004
2003
2002
2001
2000
Importantly, other market activities indirectly create directional flows – e.g. retail investors have been active buyers of equity call options. Market makers generally need to buy more of the underlying asset when its price is increasing, and vice-versa. In the bond market, mortgage convexity affects interest rates as hedgers need to rapidly adjust their duration exposure via swaps or futures. Finally, new financial products also create flows – e.g. when a company goes public or sells a convertible bond, a bank sells a structured note, or a government issues debt.
All of the above flows impact prices although their effect can vary from unobservable to significant. The size of this price adjustment depends on many factors including the size and urgency of the transactions, the depth of the underlying market, the level of volatility, and the availability of flexible buyers/sellers that can match with these inflexible flows.
There was a substantial pickup particularly in issuance and option flows in 2020 and this momentum has continued strongly into 2021. Higher activity levels are generally a tailwind for flexible strategies that capture dislocations and benefit from flow-driven effects.
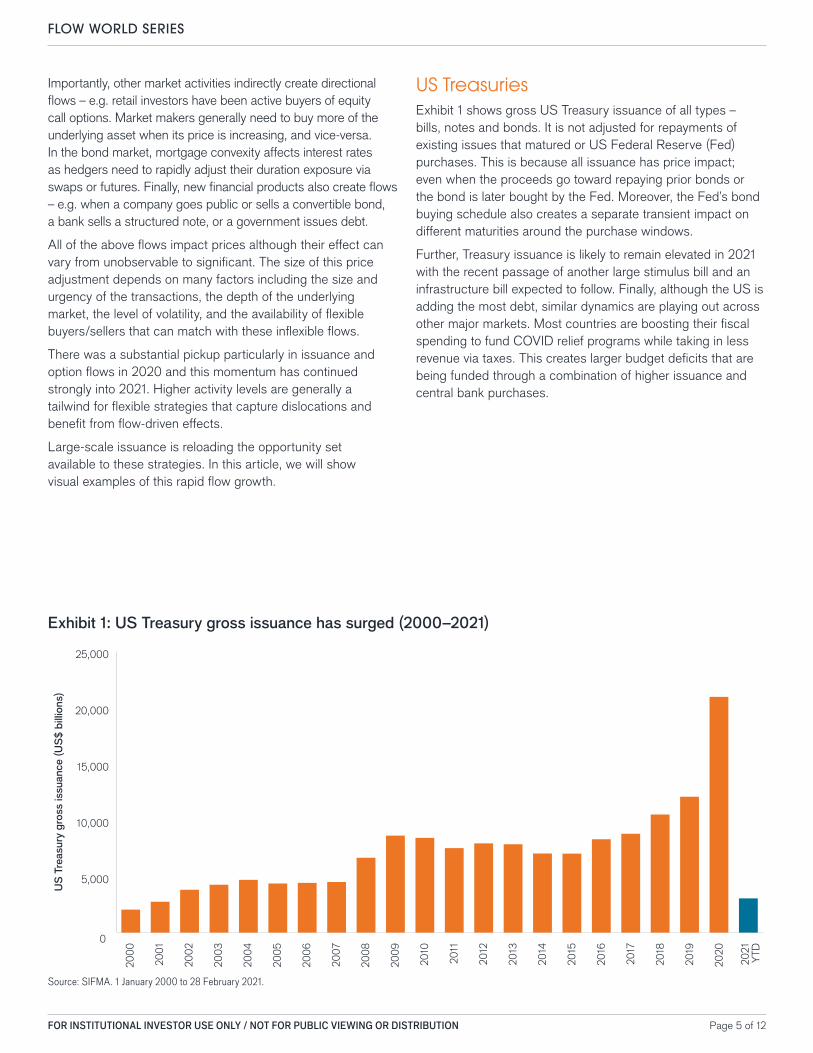
Large-scale issuance is reloading the opportunity set available to these strategies. In this article, we will show visual examples of this rapid flow growth.
US TreasuriesExhibit 1 shows gross US Treasury issuance of all types – bills, notes and bonds. It is not adjusted for repayments of existing issues that matured or US Federal Reserve (Fed) purchases. This is because all issuance has price impact; even when the proceeds go toward repaying prior bonds or the bond is later bought by the Fed. Moreover, the Fed’s bond buying schedule also creates a separate transient impact on different maturities around the purchase windows.
Further, Treasury issuance is likely to remain elevated in 2021 with the recent passage of another large stimulus bill and an infrastructure bill expected to follow. Finally, although the US is adding the most debt, similar dynamics are playing out across other major markets. Most countries are boosting their fiscal spending to fund COVID relief programs while taking in less revenue via taxes. This creates larger budget deficits that are being funded through a combination of higher issuance and central bank purchases.
Source: SIFMA. 1 January 2000 to 28 February 2021.
FOR INSTITUTIONAL INVESTOR USE ONLY / NOT FOR PUBLIC VIEWING OR DISTRIBUTION Page 5 of 12

Page 6 of 12
FLOW WORLD SERIES
Equity IPOs and secondary offeringsActivity in the equity market is similarly strong. Despite the interruption due to COVID, initial public offering (IPO) activity roared back in the back half of 2020 to the highest level since 1999. Well over 200 US IPOs have been issued in just the first two months of 2021, marking the quickest start to a year ever, and already surpassing the annual totals of many other years.
Activity begets activity. Typically, a pickup in IPO issuance (as Exhibit 2 shows) will drive subsequent flows. For example, post-IPO, options get listed and the stock is a potential
Exhibit 3: US total equity issuance (2000–2021)
Source: Bloomberg, 1 January 2000 to 28 February 2021.
Tota
l equ
ity is
suan
ce (
US
$ bi
llion
s)
0
50
100
150
200
250
300
350
400
2021
YTD
2020
2019
2018
2017
2016
2015
2014
2013
2012
2011
2010
2009
2008
2007
2006
2005
2004
2003
2002
2001
2000
addition to various ETFs and indices. Following lockup expiration, there are often block trades and secondary offerings as early holders seek to monetize their gains. Newly public firms also often do other financing transactions and are possibly an acquirer or acquisition target.
Robust flows have already extended into follow-on and other equity offerings (Exhibit 3), and this is likely to continue while investor demand is strong and deal pricing is attractive to companies.
FOR INSTITUTIONAL INVESTOR USE ONLY / NOT FOR PUBLIC VIEWING OR DISTRIBUTION
Source: Bloomberg, 1 January 2000 to 28 February 2021.
Exhibit 2: US IPOs at a 20-year high (2000–2021)
Tota
l num
ber
of IP
Os
0
50
100
150
200
250
300
350
400
450
2021
YTD
2020
2019
2018
2017
2016
2015
2014
2013
2012
2011
2010
2009
2008
2007
2006
2005
2004
2003
2002
2001
2000
Page 7 of 12
FLOW WORLD SERIES
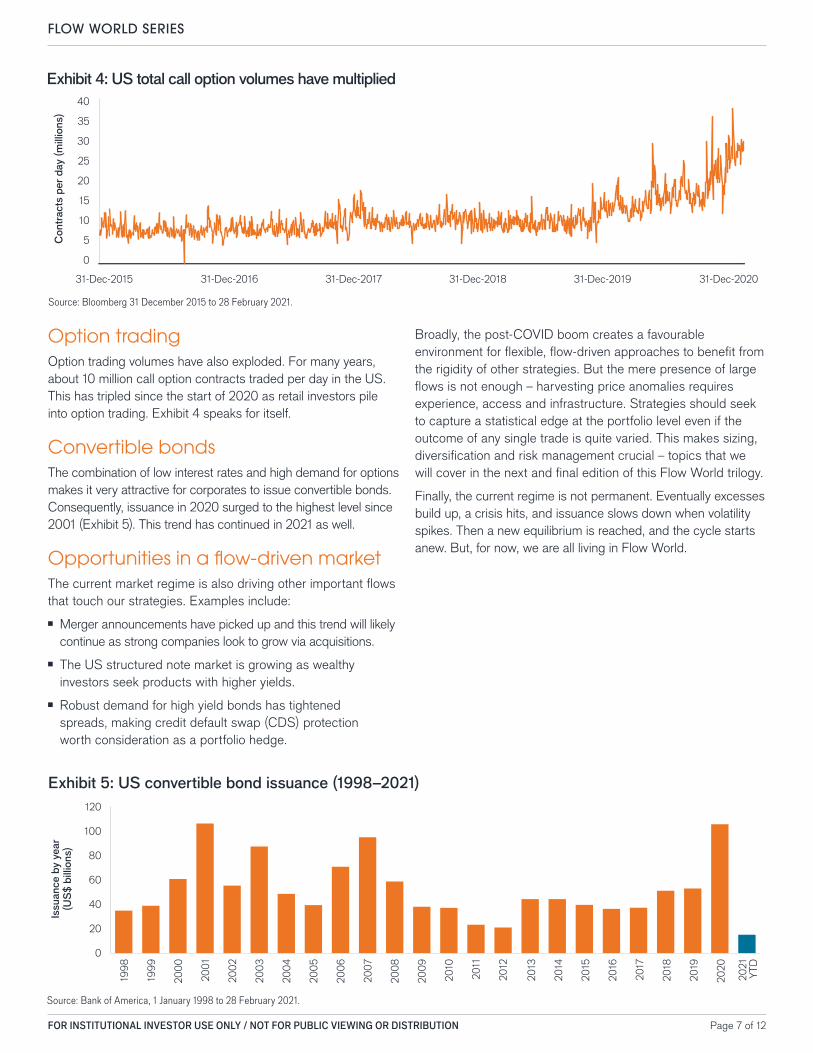
Option tradingOption trading volumes have also exploded. For many years, about 10 million call option contracts traded per day in the US. This has tripled since the start of 2020 as retail investors pile into option trading. Exhibit 4 speaks for itself.
Convertible bondsThe combination of low interest rates and high demand for options makes it very attractive for corporates to issue convertible bonds. Consequently, issuance in 2020 surged to the highest level since 2001 (Exhibit 5). This trend has continued in 2021 as well.
Opportunities in a flow-driven marketThe current market regime is also driving other important flows that touch our strategies. Examples include:
■ Merger announcements have picked up and this trend will likely continue as strong companies look to grow via acquisitions.
■ The US structured note market is growing as wealthy investors seek products with higher yields.
■ Robust demand for high yield bonds has tightened spreads, making credit default swap (CDS) protection worth consideration as a portfolio hedge.
Broadly, the post-COVID boom creates a favourable environment for flexible, flow-driven approaches to benefit from the rigidity of other strategies. But the mere presence of large flows is not enough – harvesting price anomalies requires experience, access and infrastructure. Strategies should seek to capture a statistical edge at the portfolio level even if the outcome of any single trade is quite varied. This makes sizing, diversification and risk management crucial – topics that we will cover in the next and final edition of this Flow World trilogy.
Finally, the current regime is not permanent. Eventually excesses build up, a crisis hits, and issuance slows down when volatility spikes. Then a new equilibrium is reached, and the cycle starts anew. But, for now, we are all living in Flow World.
FOR INSTITUTIONAL INVESTOR USE ONLY / NOT FOR PUBLIC VIEWING OR DISTRIBUTION
Exhibit 4: US total call option volumes have multiplied
Source: Bloomberg 31 December 2015 to 28 February 2021.
Con
trac
ts p
er d
ay (
mill
ions
)
0
5
10
15
20
25
30
35
40
31-Dec-202031-Dec-201931-Dec-201831-Dec-201731-Dec-201631-Dec-2015
Exhibit 5: US convertible bond issuance (1998–2021)
Source: Bank of America, 1 January 1998 to 28 February 2021.
Issu
ance
by
year
(US
$ bi
llion
s)
0
20
40
60
80
100
120
2021
YTD
2020
2019
2018
2017
2016
2015
2014
2013
2012
2011
2010
2009
2008
2007
2006
2005
2004
2003
2002
2001
2000
1999
1998

Page 8 of 12
How should investors manage risk in a world where flows can dominate fundamentals? In this third article of the "Flow World" series, Aneet Chachra, Portfolio Manager, and David Elms, Head of Diversified Alternatives, evaluate trade sizing, diversification and risk management in a modern portfolio.
This is the third and final instalment of our flow world trilogy. Earlier Insights:
Part 1 - Welcome to Flow World (January 2021)
Part 2 - Flow World Reloaded (March 2021)
Our view from the start of 2021 was “Flow World,” a market where flows dominate over fundamentals, with liquidity sloshing from one sector to the next. Tide in, tide out. Flow surges were met with increased supply, whether SPACs (Special Purpose Acquisition Companies), convertible bonds, call options or new cryptocurrencies. These issuance waves now appear to be receding.
Although most asset classes have performed well year-to-date (to 14 June 2021), these flow waves created significantly different investor outcomes. Some market participants with high leverage and inappropriate position sizing struggled due to sudden volatility spikes and margin calls. But flows also created opportunities for flexible strategies to capture price moves in both directions.
The key challenge with flow-driven anomalies is not just identifying and sourcing them, but diversification and risk management. Most investors focus on the risk/reward of individual trades. That is only part of the picture – monitoring correlations, building repeatable strategies, compounding returns and avoiding/mitigating large portfolio losses are also important to achieve consistent results over time.
FLOW WORLD REVOLUTIONSInvestment Insights Series
Aneet Chachra, CFAPortfolio Manager
Key Takeaways ■ Although most asset classes have performed well thus far in 2021, large price moves due to flows have created significantly different investor outcomes.
■ The portfolio challenge is not just identifying and sourcing individual trades, but also executing repeatable strategies and avoiding/mitigating large losses.
■ The combination of low correlation and small positive edges builds differentiated strategies with persistent returns.
David ElmsHead of Diversified Alternatives, Portfolio Manager
FOR INSTITUTIONAL INVESTOR USE ONLY / NOT FOR PUBLIC VIEWING OR DISTRIBUTION
“You must be shapeless, formless, like water.
When you pour water in a cup, it becomes the cup.
When you pour water in a teapot, it becomes the teapot.
Become like water, my friend.”
Bruce Lee
June 2021
Page 9 of 12
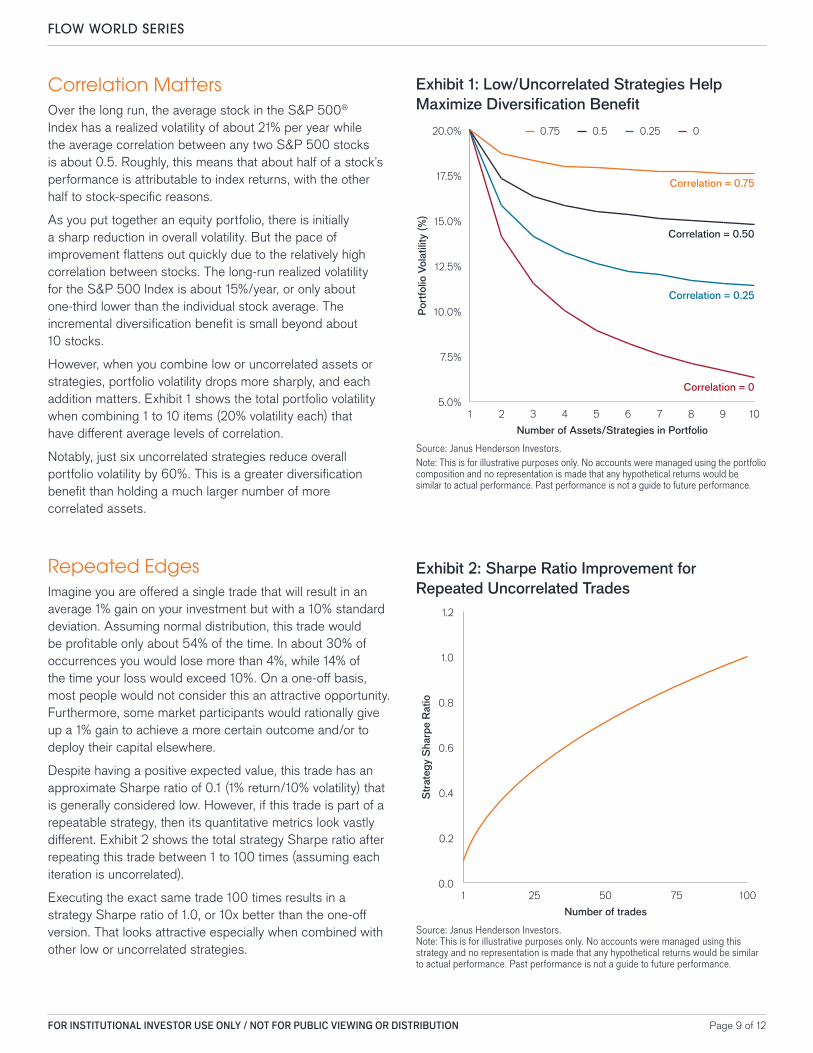
Correlation MattersOver the long run, the average stock in the S&P 500® Index has a realized volatility of about 21% per year while the average correlation between any two S&P 500 stocks is about 0.5. Roughly, this means that about half of a stock’s performance is attributable to index returns, with the other half to stock-specific reasons.
As you put together an equity portfolio, there is initially a sharp reduction in overall volatility. But the pace of improvement flattens out quickly due to the relatively high correlation between stocks. The long-run realized volatility for the S&P 500 Index is about 15%/year, or only about one-third lower than the individual stock average. The incremental diversification benefit is small beyond about 10 stocks.
However, when you combine low or uncorrelated assets or strategies, portfolio volatility drops more sharply, and each addition matters. Exhibit 1 shows the total portfolio volatility when combining 1 to 10 items (20% volatility each) that have different average levels of correlation.
Notably, just six uncorrelated strategies reduce overall portfolio volatility by 60%. This is a greater diversification benefit than holding a much larger number of more correlated assets.
Repeated EdgesImagine you are offered a single trade that will result in an average 1% gain on your investment but with a 10% standard deviation. Assuming normal distribution, this trade would be profitable only about 54% of the time. In about 30% of occurrences you would lose more than 4%, while 14% of the time your loss would exceed 10%. On a one-off basis, most people would not consider this an attractive opportunity. Furthermore, some market participants would rationally give up a 1% gain to achieve a more certain outcome and/or to deploy their capital elsewhere.
Despite having a positive expected value, this trade has an approximate Sharpe ratio of 0.1 (1% return/10% volatility) that is generally considered low. However, if this trade is part of a repeatable strategy, then its quantitative metrics look vastly different. Exhibit 2 shows the total strategy Sharpe ratio after repeating this trade between 1 to 100 times (assuming each iteration is uncorrelated).
Executing the exact same trade 100 times results in a strategy Sharpe ratio of 1.0, or 10x better than the one-off version. That looks attractive especially when combined with other low or uncorrelated strategies.
FLOW WORLD SERIES
Exhibit 1: Low/Uncorrelated Strategies Help Maximize Diversification Benefit
Source: Janus Henderson Investors. Note: This is for illustrative purposes only. No accounts were managed using this strategy and no representation is made that any hypothetical returns would be similar to actual performance. Past performance is not a guide to future performance.
5.0%
7.5%
10.0%
12.5%
15.0%
17.5%
20.0%
10987654321
00.250.50.75
Number of Assets/Strategies in PortfolioP
ortf
olio
Vol
atili
ty (
%)
Correlation = 0.75
Correlation = 0.50
Correlation = 0.25
Correlation = 0
0.0
0.2
0.4
0.6
0.8
1.0
1.2
1007550251
Number of trades
Str
ateg
y S
harp
e R
atio
FOR INSTITUTIONAL INVESTOR USE ONLY / NOT FOR PUBLIC VIEWING OR DISTRIBUTION
Exhibit 2: Sharpe Ratio Improvement for Repeated Uncorrelated Trades
Source: Janus Henderson Investors. Note: This is for illustrative purposes only. No accounts were managed using the portfolio composition and no representation is made that any hypothetical returns would be similar to actual performance. Past performance is not a guide to future performance.

Page 10 of 12
FLOW WORLD SERIES
Diversification and Tail RisksThe combination of low correlation and small positive edges builds differentiated strategies with persistent returns. However, actual market outcomes are not normally distributed. Deployed capital is exposed to tail risk greater than modeled expectations.
2021 has been a strong reminder of the limitations of models. On multiple occasions, buying/selling flows overwhelmed available liquidity. Many popular stocks doubled or fell 50% within a day, causing large realized losses for hedge funds, family offices and banks.
With that in mind, we update the earlier trade example to include tail risk:
1. 99% probability of a +1.5% profit normally distributed with a 10% standard deviation
2. 1% probability of a -48.5% loss (tail event)
In both the original and updated examples, the expected per-trade gain is exactly the same (+1% profit per trade, on average). Naively, we would expect the total gain from a set of 100 such trades to be around +100% (+1% profit per trade x 100 trades).
To test this on both examples, we generated the distribution of outcomes for sets of 100 trades via several thousand Monte Carlo simulations¹. Individual trades within each set utilized 100% of allocated capital.
For the updated example that incorporates realistic tail risk, both the probability and magnitude of large drawdowns were significantly higher than the original example. Despite each model set being 100 trades with a substantial 1% per trade edge, about one-quarter of simulated sets surprisingly ended with less capital than they started with, and about 10% of simulations lost more than half of their starting capital.
Incorporating tail risk resulted in drawdowns about twice as bad as the original model, despite both examples having the same average per trade return. One or more large losses can have a severe impact. This can be mitigated through conservative trade sizing and diversification. For example, if we limit each individual trade to 5% of allocated capital (instead of 100%), then very few simulations resulted in a capital loss, and none were large.
The other tail risk is an unexpected rise in correlations across trades due to broad market risk. Using an option overlay at the portfolio level can help hedge unexpected macro events. Carrying this “insurance” comes at a cost in normal times – however it provides valuable offsets during crisis periods.
Putting it all Together - The Rules of Flow World1. Take advantage of flow pressures by finding “willing losers”
– mandated, systematic, non-economic or behaviorally biased participants
2. Recognize that adding a correlated asset does not help portfolio diversification much
3. Seek modest but consistent edges – wide variance in outcomes discourages competition
4. Be willing to accept idiosyncratic risk on individual trades
5. Run a large number of strategies/trades across asset classes, sectors, and geography
6. Size carefully to mitigate individual trade risks and use portfolio level hedges to minimize coincident drawdown risk
The flexible and adaptive are the winners in flow world.
¹ Monte Carlo simulations are used to model the probability of different outcomes when random variables are considered, for the purpose of better understanding the potential impact of various risks on prediction and forecasting models.
FOR INSTITUTIONAL INVESTOR USE ONLY / NOT FOR PUBLIC VIEWING OR DISTRIBUTION

Page 11 of 12
FLOW WORLD SERIES
FOR INSTITUTIONAL INVESTOR USE ONLY / NOT FOR PUBLIC VIEWING OR DISTRIBUTION
About the Authors Aneet Chachra, CFAAneet Chachra is a Portfolio Manager at Janus Henderson Investors on the Multi Strategy and Global Diversified Risk Premia strategies. Prior to joining Henderson in 2012, Mr. Chachra was an equity analyst at Citigroup. Before Citigroup, he was a strategist at Outpost Investment Group, where he generated trade ideas, researched thematic issues and published investment commentary. Mr. Chachra also developed quantitative trading strategies and portfolio analytics at JWM Partners. He began his career in 2000 at Morgan Stanley developing tools for interest rate derivatives and corporate bonds. Mr. Chachra’s research work has been quoted in numerous financial publications.
Mr. Chachra holds a BASc degree in engineering and a BA degree in economics from the University of Waterloo in Canada. He also holds the Chartered Financial Analyst designation and the Investment Management Certificate. He has 21 years of financial industry experience.
David ElmsDavid Elms is Head of Diversified Alternatives and a Portfolio Manager for Janus Henderson Investors responsible for enhanced index, risk premia and hedge portfolios. Prior to joining Henderson in 2002, Mr. Elms spent eight years as a founding partner at Portfolio Partners. He was initially based in Melbourne, where he managed derivatives and enhanced index portfolios, and was later seconded to Aviva in London in a corporate strategy role following Aviva’s acquisition of Portfolio Partners. Earlier, he spent three years as associate director at County NatWest Investment Management, Melbourne, where he was responsible for equities and equity derivative trading as well as quantitative research.
Mr. Elms received a BCom degree (Hons) from the University of Melbourne, Australia. He has 30 years of financial industry experience.

FLOW WORLD SERIES
FOR MORE INFORMATION, PLEASE VISIT JANUSHENDERSON.COM
IMPORTANT INFORMATIONThe views presented are as of the date published. They are for information purposes only and should not be used or construed as investment, legal or tax advice or as an offer to sell, a solicitation of an offer to buy, or a recommendation to buy, sell or hold any security, investment strategy or market sector. Nothing in this material shall be deemed to be a direct or indirect provision of investment management services specific to any client requirements. Opinions and examples are meant as an illustration of broader themes, are not an indication of trading intent, are subject to change and may not reflect the views of others in the organization. It is not intended to indicate or imply that any illustration/example mentioned is now or was ever held in any portfolio. No forecasts can be guaranteed and there is no guarantee that the information supplied is complete or timely, nor are there any warranties with regard to the results obtained from its use. Janus Henderson Investors is the source of data unless otherwise indicated, and has reasonable belief to rely on information and data sourced from third parties. Past performance is no guarantee of future results. Investing involves risk, including the possible loss of principal and fluctuation of value.Not all products or services are available in all jurisdictions. This material or information contained in it may be restricted by law, may not be reproduced or referred to without express written permission or used in any jurisdiction or circumstance in which its use would be unlawful. Janus Henderson is not responsible for any unlawful distribution of this material to any third parties, in whole or in part. The contents of this material have not been approved or endorsed by any regulatory agency.Janus Henderson Investors is the name under which investment products and services are provided by the entities identified in the following jurisdictions: (a) Europe by Janus Capital International Limited (reg no. 3594615), Henderson Global Investors Limited (reg. no. 906355), Henderson Investment Funds Limited (reg. no. 2678531), Henderson Equity Partners Limited (reg. no.2606646), (each registered in England and Wales at 201 Bishopsgate, London EC2M 3AE and regulated by the Financial Conduct Authority) and Henderson Management S.A. (reg no. B22848 at 2 Rue de Bitbourg, L-1273, Luxembourg and regulated by the Commission de Surveillance du Secteur Financier); (b) the U.S. by SEC registered investment advisers that are subsidiaries of Janus Henderson Group plc; (c) Canada through Janus Capital Management LLC only to institutional investors in certain jurisdictions; (d) Singapore by Janus Henderson Investors (Singapore) Limited (Co. registration no. 199700782N). This advertisement or publication has not been reviewed by Monetary Authority of Singapore; (e) Hong Kong by Janus Henderson Investors Hong Kong Limited. This material has not been reviewed by the Securities and Futures Commission of Hong Kong; (f) Taiwan R.O.C by Janus Henderson Investors Taiwan Limited (independently operated), Suite 45 A-1, Taipei 101 Tower, No. 7, Sec. 5, Xin Yi Road, Taipei (110). Tel: (02) 8101-1001. Approved SICE licence number 023, issued in 2018 by Financial Supervisory Commission; (g) South Korea by Janus
Henderson Investors (Singapore) Limited only to Qualified Professional Investors (as defined in the Financial Investment Services and Capital Market Act and its sub-regulations); (h) Japan by Janus Henderson Investors (Japan) Limited, regulated by Financial Services Agency and registered as a Financial Instruments Firm conducting Investment Management Business, Investment Advisory and Agency Business and Type II Financial Instruments Business; (i) Australia and New Zealand by Janus Henderson Investors (Australia) Limited (ABN 47 124 279 518) and its related bodies corporate including Janus Henderson Investors (Australia) Institutional Funds Management Limited (ABN 16 165 119 531, AFSL 444266) and Janus Henderson Investors (Australia) Funds Management Limited (ABN 43 164 177 244, AFSL 444268); (j) the Middle East by Janus Capital International Limited, regulated by the Dubai Financial Services Authority as a Representative Office. No transactions will be concluded in the Middle East and any enquiries should be made to Janus Henderson. We may record telephone calls for our mutual protection, to improve customer service and for regulatory record keeping purposes.Outside the U.S.: For use only by institutional, professional, qualified and sophisticated investors, qualified distributors, wholesale investors and wholesale clients as defined by the applicable jurisdiction. Not for public viewing or distribution.Not all products or services are available in all jurisdictions. This material or information contained in it may be restricted by law, may not be reproduced or referred to without express written permission or used in any jurisdiction or circumstance in which its use would be unlawful. Janus Henderson is not responsible for any unlawful distribution of this material to any third parties, in whole or in part. The contents of this material have not been approved or endorsed by any regulatory agency. Diversification neither assures a profit nor eliminates the risk of experiencing investment losses. Alternative investments include, but are not limited to, commodities, real estate, currencies, hedging strategies, futures, structured products, and other securities intended to be less correlated to the market. They may be subject to increased risk and are not suitable for all investors.Actively managed portfolios may fail to produce the intended results. No investment strategy can ensure a profit or eliminate the risk of loss.Options (calls and puts) involve risks. Option trading can be speculative in nature and carries a substantial risk of loss.Janus Henderson, Janus, Henderson, Intech, Knowledge Shared and Knowledge Labs are trademarks of Janus Henderson Group plc or one of its subsidiaries. © Janus Henderson Group plc.
C-0721-38614 03-30-22 366-15-438614 07-21
Note on simulated returns: The hypothetical, back-tested performance shown is for illustrative purposes only and does not represent actual performance of any client account. No accounts were managed using the portfolio composition for the periods shown and no representation is made that the hypothetical returns would be similar to actual performance had accounts actually been managed in this manner. Hypothetical, back tested or simulated performance has many inherent limitations only some of which are described herein. The hypothetical performance shown herein has been constructed with the benefit of hindsight and does not reflect the impact that certain economic and market factors might have had on the decision-making process. No hypothetical, back tested or simulated performance can completely account for the impact of financial risk in actual performance. Therefore, it will invariably show better rates of return. The hypothetical performance results herein may not be realized in the actual management of accounts. No representation or warranty is made as to the
reasonableness of the assumptions made or that all assumptions used in construction the hypothetical returns have been stated or fully considered. Assumption changes may have a material impact on the returns presented. This material is not representative of any particular client’s experience. Investors should not assume that they will have an investment experience similar to the hypothetical, back tested or simulated performance shown. There are frequently material differences between hypothetical, back tested or simulated performance results and actual results subsequently achieved by any investment strategy. Prospective investors are encouraged to contact the investment manager to discuss the methodologies and assumptions used to calculate the hypothetical performance shown herein.Index performance does not reflect the expenses of managing a portfolio as an index is unmanaged and not available for direct investment. The performance of any index herein is not illustrative of the performance of any security.
FOR INSTITUTIONAL INVESTOR USE ONLY / NOT FOR PUBLIC VIEWING OR DISTRIBUTION