Embed Size (px)
Citation preview

July 2018 M&A and Investment Summary
2 | M&A and Investment Summary July 2018
Table of Contents
Overview of Monthly M&A and Investment Activity 31
Monthly M&A and Investment Activity by Industry Segment 92
Additional Monthly M&A and Investment Activity Data 413
About Petsky Prunier 584
Securities offered through Petsky Prunier Securities, LLC, member of FINRA.
This M&A and Investment Summary has been prepared by and is being distributed in the United States by Petsky Prunier, a broker dealer registered with the U.S. SEC and a member ofFINRA.

3 | M&A and Investment Summary July 2018
M&A and Investment Summary for All Segments
Transaction Distribution
▪ A total of 714 deals were announced in July 2018, of which 371 were worth $43.3 billion in aggregate reported value
• July was the most active month of the past 36 months, highlighted by record activity in the Agency & Marketing Services segment
▪ Software was the most active segment with 262 deals announced— 155 of these transactions reported $15.4 billion in value
▪ Digital Media/Commerce was also active with 138 transactions, 92 of which were worth a reported $5.8 billion
▪ Strategic buyers announced 358 deals (71 reported $25.4 billion in value)
▪ VC/Growth Capital investors announced 322 transactions (292 reported $10.7 billion in value)
▪ Private Equity investors announced 34 deals during the month (eight reported $7.1 billion in value)
*Note, transactions valued at $6 billion or more have been excluded from totals to limit comparative distortions. The aggregate total for July does not include Broadcom’s pending $18.4 billion TEV acquisition
of CA Technologies
# % $MM % # $MM # $MM # $MM
Software 262 37% $15,370.4 35% 107 $8,029.2 13 $4,040.0 142 $3,301.2
Digital Media/Commerce 138 19% 5,846.7 14% 47 1,184.9 3 - 88 4,661.8
Business Services 96 13% 5,868.7 14% 78 5,396.0 6 - 12 472.7
Marketing Technology 85 12% 1,960.9 5% 32 1,006.1 1 - 52 954.8
Agency & Marketing Services 60 8% 5,471.7 13% 51 4,839.0 8 625.7 1 7.0
Digital Advertising 33 5% 1,594.7 4% 19 983.1 0 - 14 611.6
Traditional Media 27 4% 3,462.2 8% 19 3,215.2 1 65.0 7 182.0
Information 13 2% 3,722.2 9% 5 775.0 2 2,400.0 6 547.2
Total 714 100% 43,297.5 100% 358 25,428.5 34 7,130.7 322 10,738.3
July 2018
BUYER/INVESTOR BREAKDOWN
Transactions Reported Value Strategic Buyout Venture/Growth Capital
4 | M&A and Investment Summary July 2018
622 552 609 554 514 615 583 654 659 668 685 713
$33.7
$23.4
$37.8
$25.0
$98.1
$54.4
$36.8
$28.6
$57.9
$35.5
$46.3
$61.6
$-
$10.0
$20.0
$30.0
$40.0
$50.0
$60.0
$70.0
$80.0
$90.0
$100.0
$110.0
$120.0
Aug-17 Sep-17 Oct-17 Nov-17 Dec-17 Jan-18 Feb-18 Mar-18 Apr-18 May-18 Jun-18 Jul-18
Transaction Distribution
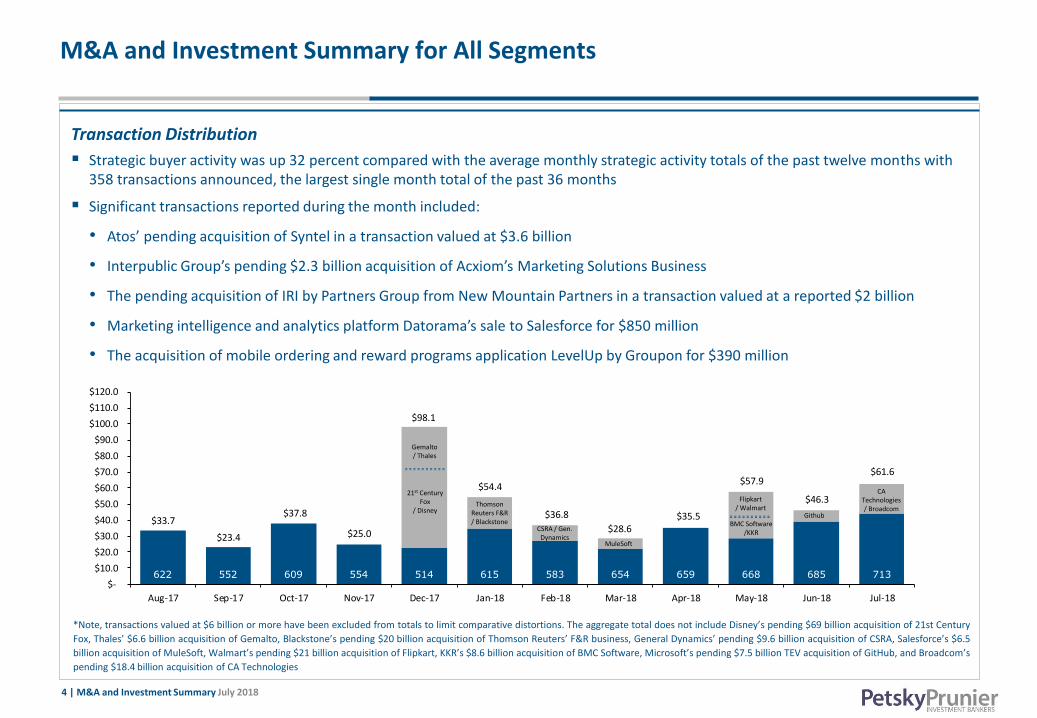
▪ Strategic buyer activity was up 32 percent compared with the average monthly strategic activity totals of the past twelve months with 358 transactions announced, the largest single month total of the past 36 months
▪ Significant transactions reported during the month included:
• Atos’ pending acquisition of Syntel in a transaction valued at $3.6 billion
• Interpublic Group’s pending $2.3 billion acquisition of Acxiom’s Marketing Solutions Business
• The pending acquisition of IRI by Partners Group from New Mountain Partners in a transaction valued at a reported $2 billion
• Marketing intelligence and analytics platform Datorama’s sale to Salesforce for $850 million
• The acquisition of mobile ordering and reward programs application LevelUp by Groupon for $390 million
CA Technologies / Broadcom
21st Century Fox
/ Disney
Gemalto / Thales
Thomson Reuters F&R / Blackstone
CSRA / Gen.Dynamics
MuleSoft
*Note, transactions valued at $6 billion or more have been excluded from totals to limit comparative distortions. The aggregate total does not include Disney’s pending $69 billion acquisition of 21st Century
Fox, Thales’ $6.6 billion acquisition of Gemalto, Blackstone’s pending $20 billion acquisition of Thomson Reuters’ F&R business, General Dynamics’ pending $9.6 billion acquisition of CSRA, Salesforce’s $6.5
billion acquisition of MuleSoft, Walmart’s pending $21 billion acquisition of Flipkart, KKR’s $8.6 billion acquisition of BMC Software, Microsoft’s pending $7.5 billion TEV acquisition of GitHub, and Broadcom’s
pending $18.4 billion acquisition of CA Technologies
M&A and Investment Summary for All Segments
Flipkart / Walmart
BMC Software /KKR
Github

5 | M&A and Investment Summary July 2018
Selected Transactions with Valuation Information Disclosed($ in Millions)
Target Subsegment Buyer/Investor Ent. Value TTM Rev TTM EBITDA EV/REV EV/EBITDA
Agency & Marketing Services
MediaMonks B.V. Digital Agency S4 Capital 350.3$ 129.0$ -$ 2.7x NA
Giant Creative Strategy Healthcare Agency Huntsworth PLC 80.0 32.0 7.0 2.5x 11.4x
Indigo Slate, Inc. Digital Agency Zensar Technologies Ltd. 18.0 20.0 - 0.9x NA
The Door LLC Public Relations Dolphin Entertainment, Inc. 12.2 5.5 - 2.2x NA
Business Services
Syntel, Inc. BPO Atos SE 3,540.7 966.2 264.3 3.7x 13.4x
Basefarm AS IT Consulting/Systems Integration Orange Business Services 409.8 120.1 - 3.4x NA
LIfeWorks Corporation Ltd. HR Consulting Morneau Shepell Ltd. 326.2 83.8 29.0 3.9x 11.2x
Donnelley Language Solutions BPO SDL Plc 77.5 71.4 7.4 1.1x 10.5x
iSYS RTS GmbH IT Consulting/Systems Integration Minda Industries Limited 7.3 7.1 - 1.0x NA
Digital Advertising
Finanzcheck.de Comparison Shopping Scout24 AG 333.1 42.0 - 7.9x NA
Bola Webinformatin GmbH Affil iate/CPA Network Better Collective A/S 42.4 10.2 - 4.2x NA
ComFree Commonsense Network, Inc. Vertical Search Purplebricks Group Plc 38.6 36.4 3.4 1.1x 11.5x
Impact Mobile, Inc. Mobile Marketing IMImobile PLC 20.9 8.5 3.2 2.5x 6.5xNA
Digital Media/Commerce
10bis.Co.Il Ltd. eCommerce Takeaway.com 157.3 15.9 6.8 9.9x 23.0x
Purch, B2C Business Division Niche Content Future US, Inc. 132.5 63.5 10.1 2.1x 13.1x
Quartz Media LLC Niche Content Uzabase, Inc. 110.0 37.8 - 2.9x NA
KeyDrive S.A. Domain Portfolio/Marketplace CentralNic Ltd. 55.0 58.0 6.0 0.9x 9.2x
DeeZee eCommerce CCC S.A. 6.8 10.0 - 0.7x NA
Information
Sportradar AG Product/Price Information CPP Investment Board 2,400.0 1,195.2 179.3 2.0x 13.4x
The Gordian Group Product/Price Information Fortive Corporation 775.0 130.0 - 6.0x NA NA
Marketing Technology
4 Global Divisions, GfK Group Market Research Ipsos Group 122.6 239.0 - 0.5x NA
TapInfluence, Inc. Social Technology IZEA, Inc. 7.0 5.9 - 1.2x NA
Software
Accruent LLC Financial Software Fortive Corporation 2,000.0 270.0 - 7.4x NA
EZE Software Group LLC Financial Software SS&C Technologies Holdings, Inc. 1,450.0 280.0 105.0 5.2x 13.8x
Banking Circle A/S Financial Software EQT Ventures 300.0 71.7 - 4.2x NA
MetaPack Limited ERP Software Stamps.com, Inc. 224.7 47.5 - 4.7x NA
Indus Software Technologies Pvt. Ltd. Financial Software Ebix, Inc. 29.0 22.0 - 1.3x NA
Taliance Group Financial Software Altus Group Limited 23.0 5.0 - 4.6x NA
Electronic Data Processing PLC ERP Software Kerridge Commercial Systems Limited 15.8 6.8 0.7 2.3x 21.4x
B2 Group S.a.R.L. Financial Software Gresham Technologies plc 9.9 19.7 - 0.5x NA
Shire Systems Ltd. ERP Software Elecosoft plc 8.4 2.4 - 3.4x NA
Traditional Media
Fairfax Media Ltd. Newspaper Publishing Nine Entertainment Co. 1,864.2 1,301.0 179.8 1.4x 10.4x
Bonnier Broadcasting Sweden AB Broadcast Television Telia Company AB 1,149.8 897.8 50.7 1.3x 22.7x
RLJ Entertainment, Inc. Entertainment Media Digital Entertainment Holdings LLC 195.2 91.0 14.2 2.1x 13.7x
Selected Transactions With Multiples Information

6 | M&A and Investment Summary July 2018
Securities in Registration($ in Millions)
Aggregate
Date Company Name Country Segment Offering Value Rev EBITDA
Jul-18 EventBrite, Inc. United States Marketing Technology NA NA NA
Jul-18 Pintec Technology Holdings Limited China Software 70.0 784.5 10.3
Jun-18 SurveyMonkey Inc. United States Marketing Technology NA NA NA
May-18 Advantage Solutions Inc. United States Agency & Marketing Services 100.0 2,150.4 405.1
Apr-18 HeadHunter Group PLC Russia Software 250.0 75.7 31.6
Jun-17 Ancestry.com LLC United States Digital Media/Commerce NA NA NA
LTM

7 | M&A and Investment Summary July 2018
LTM IPO Performance
Initial Offering Final Price Stock Price at Close Stock Price on % Change from
Date PPLLC Segment Company Name Country Price Range Per Share on 1st Trading Day Jul 31, 2018 1st Trading Day
Jul -18 Software Aurora Mobi le Limited China $8.50-$10.50 8.50 $8.80, up 3.5% 7.65 (13.1%)
Jul -18 Digi ta l Media/Commerce Cango Inc. China 10.00-12.00 11.00 12.52, up 13.8% 10.75 (14.1%)
Jul -18 Bus iness Services Endava plc United Kingdom 17.00-19.00 20.00 25.2, up 26.0% 23.91 (5.1%)
Jul -18 Digi ta l Media/Commerce Opera Limited Norway 10.00-12.00 12.00 13.11, up 9.3% 12.09 (7.8%)
Jul -18 Digi ta l Media/Commerce Pinduoduo Inc. China 16.00-19.00 19.00 26.70, up 40.5% 22.59 (15.4%)
Jul -18 Software Tenable Holdings , Inc. United States 20.00-22.00 23.00 30.25, up 31.5% 29.90 (1.2%)
Jun-18 Software Avalara, Inc. United States 21.00-23.00 24.00 44.94, up 87.3% 38.34 (14.7%)
Jun-18 Software Domo, Inc. United States 19.00-22.00 21.00 27.30, up 30.0% 16.61 (39.2%)
Jun-18 Digi ta l Advertis ing EverQuote, Inc. United States 15.00-17.00 18.00 18.02, up 0.1% 15.03 (16.6%)
Jun-18 Software i3 Vertica ls , Inc. United States 11.00-13.00 13.00 18.35, up 41.2% 15.31 (16.6%)
Jun-18 Digi ta l Media/Commerce Uxin Limited China 10.50-12.50 9.00 9.67, up 7.4% 6.16 (36.3%)
May-18 Software GreenSky, Inc. United States 21.00-23.00 23.00 25.36, up 10.3% 17.30 (31.8%)
May-18 Software EVO Payments , Inc. United States 14.00-16.00 16.00 19.02, up 18.9% 21.15 11.2%
May-18 Digi ta l Media/Commerce HUYA Inc. China 10.00-12.00 12.00 16.06, up 33.8% 32.20 100.5%
May-18 Software Plura ls ight, Inc. United States 12.00-14.00 15.00 20.00, up 33.3% 23.21 16.1%
May-18 Software Carbon Black, Inc. United States 15.00-17.00 19.00 23.94, up 26.0% 20.76 (13.3%)
Apr-18 Software Ceridian HCM Holding Inc. United States 19.00-21.00 22.00 28.90, up 31.4% 32.76 13.4%
Apr-18 Software DocuSign, Inc. United States 26.00-28.00 29.00 39.73, up 37.0% 53.90 35.7%
Apr-18 Software Pivotal Software, Inc. United States 14.00-16.00 15.00 15.73, up 4.9% 22.95 45.9%
Apr-18 Software Smartsheet Inc. United States 12.00-14.00 15.00 19.55, up 30.3% 21.50 10.0%
Apr-18 Marketing Technology Zuora, Inc. United States 11.00-13.00 14.00 20.00, up 42.8% 24.53 22.7%
Mar-18 Digi ta l Media/Commerce Bi l ibi l i Inc. China 10.50-12.50 11.50 11.24, down 2.2% 11.71 4.2%
Mar-18 Software Dropbox, Inc. United States 18.00-20.00 21.00 28.48, up 35.6% 26.77 (6.0%)
Mar-18 Digi ta l Media/Commerce iQIYI, Inc. China 17.00-19.00 18.00 15.55, down 13.6% 32.02 105.9%
Mar-18 Software Zscaler, Inc. United States 13.00-15.00 16.00 33.00, up 106.3% 35.31 7.0%
Feb-18 Software Cardlytics , Inc. United States 13.00-15.00 13.00 13.37, up 2.8% 18.82 40.8%
Jan-18 Software PagSeguro Digi ta l Ltd. Brazi l 17.50-20.50 21.50 29.20, up 35.8% 26.92 (7.8%)
Dec-17 Digi ta l Advertis ing iCl ick Interactive As ia Group Limited Hong Kong 8.00-9.00 8.00 9.00, up 12.0% 5.74 (36.2%)

8 | M&A and Investment Summary July 2018
LTM IPO Performance
Initial Offering Final Price Stock Price at Close Stock Price on % Change from
Date PPLLC Segment Company Name Country Price Range Per Share on 1st Trading Day Jul 31, 2018 1st Trading Day
Nov-17 Software Bandwidth Inc. United States $20.00-$22.00 20.00 $21.19, up 6.0% 35.04 65.4%
Nov-17 Digi ta l Media/Commerce PPDAI Group Inc. China 16.00-19.00 13.00 13.33 up 2.5% 4.54 (65.9%)
Nov-17 Software Sai lPoint Technologies Holdings , Inc. United States 9.00-11.00 12.00 13.00 up 8.3% 24.09 85.3%
Nov-17 Marketing Technology SendGrid, Inc. United States 13.50-15.50 16.00 18.00 up 12.5% 25.53 41.8%
Nov-17 Digi ta l Media/Commerce Sogou Inc. China 11.00-13.00 13.00 13.50 up 3.8% 9.21 (31.8%)
Nov-17 Digi ta l Media/Commerce Sti tch Fix, Inc. United States 18.00-20.00 15.00 15.15, flat 28.66 89.2%
Oct-17 Software Alta i r Engineering Inc. United States 11.00-13.00 13.00 18.31, up 40.8% 35.10 91.7%
Oct-17 Software ForeScout Technologies , Inc. United States 20.00-22.00 22.00 25.49 up 15.9% 33.96 33.2%
Oct-17 Digi ta l Media/Commerce CarGurus , Inc. United States 13.00-15.00 16.00 27.58 up 72.4% 43.35 57.2%
Oct-17 Software MongoDB, Inc. United States 20.00-22.00 24.00 32.07 up 33.6% 54.11 68.7%
Oct-17 Digi ta l Media/Commerce Sea Limited Singapore 12.00-14.00 15.00 16.20 up 8.4% 14.10 (13.0%)
Sep-17 Digi ta l Media/Commerce Secoo Holding Limited China 12.00-14.00 13.00 10.01 down 23.1% 11.75 17.4%
Sep-17 Bus iness Services BEST Inc. China $10.00-$12.00 10.00 $10.52 up 5.2% 9.63 (8.5%)
Sep-17 Digi ta l Media/Commerce Roku, Inc. United States 12.00-14.00 14.00 23.50 up 65% 45.42 93.3%
Sep-17 Digi ta l Media/Commerce Despegar.com, Corp. Argentina 23.00-26.00 26.00 31.92 up 23.1% 21.02 (34.1%)
9 | M&A and Investment Summary July 2018
Digital Media/Commerce
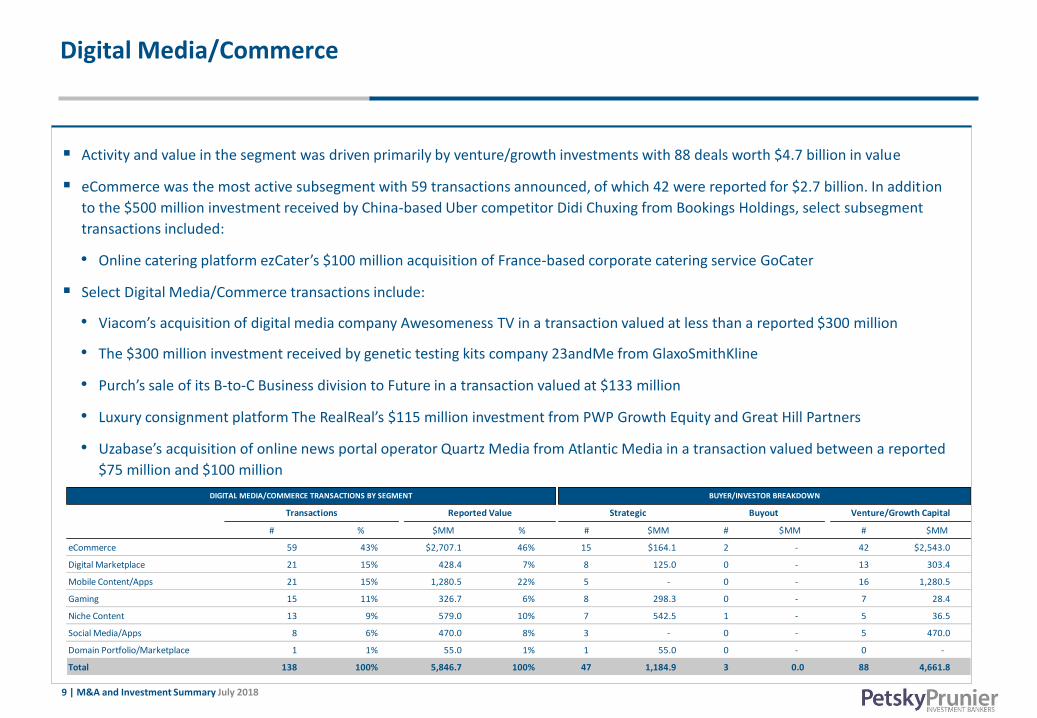
▪ Activity and value in the segment was driven primarily by venture/growth investments with 88 deals worth $4.7 billion in value
▪ eCommerce was the most active subsegment with 59 transactions announced, of which 42 were reported for $2.7 billion. In addition
to the $500 million investment received by China-based Uber competitor Didi Chuxing from Bookings Holdings, select subsegment
transactions included:
• Online catering platform ezCater’s $100 million acquisition of France-based corporate catering service GoCater
▪ Select Digital Media/Commerce transactions include:
• Viacom’s acquisition of digital media company Awesomeness TV in a transaction valued at less than a reported $300 million
• The $300 million investment received by genetic testing kits company 23andMe from GlaxoSmithKline
• Purch’s sale of its B-to-C Business division to Future in a transaction valued at $133 million
• Luxury consignment platform The RealReal’s $115 million investment from PWP Growth Equity and Great Hill Partners
• Uzabase’s acquisition of online news portal operator Quartz Media from Atlantic Media in a transaction valued between a reported
$75 million and $100 million
* Walmart’s pending $21 billion TEV acquisition of Flipkart has been excluded to limit comparative distortions
# % $MM % # $MM # $MM # $MM
eCommerce 59 43% $2,707.1 46% 15 $164.1 2 - 42 $2,543.0
Digital Marketplace 21 15% 428.4 7% 8 125.0 0 - 13 303.4
Mobile Content/Apps 21 15% 1,280.5 22% 5 - 0 - 16 1,280.5
Gaming 15 11% 326.7 6% 8 298.3 0 - 7 28.4
Niche Content 13 9% 579.0 10% 7 542.5 1 - 5 36.5
Social Media/Apps 8 6% 470.0 8% 3 - 0 - 5 470.0
Domain Portfolio/Marketplace 1 1% 55.0 1% 1 55.0 0 - 0 -
Total 138 100% 5,846.7 100% 47 1,184.9 3 0.0 88 4,661.8
BUYER/INVESTOR BREAKDOWN
Transactions Reported Value Strategic Buyout Venture/Growth Capital
DIGITAL MEDIA/COMMERCE TRANSACTIONS BY SEGMENT

10 | M&A and Investment Summary July 2018
Digital MediaPublic Company Valuation (1/2)
*Note: Alphabet Inc. pricing represents (Nasdaq:GOOGL)
($ in Millions, except stock price data)
Stock Price Chg % From Equity Ent. LTM LTM Margin LTM LTM Multiples
Company Name 07/31/18 52WK High Value Value Revenue EBITDA EBITDA Rev Growth EV/Rev EV/EBITDA
Alphabet Inc. $1,227.22 -5% $ 850,264.8 $ 751,991.8 $ 123,898.0 $ 38,205.0 30.8% 24.8% 6.1x 19.7x
Apple Inc. 190.29 -9% 921,558.7 965,188.7 255,274.0 78,533.0 30.8% 14.2% 3.8x 12.3x
Facebook, Inc. 172.58 -21% 498,276.2 456,088.2 48,497.0 27,395.0 56.5% 46.2% 9.4x 16.6x
Fitbit, Inc. 5.93 -24% 1,430.9 772.5 1,510.5 (148.1) NM -12.7% 0.5x NM
Glu Mobile Inc. 5.33 -21% 744.4 682.9 333.0 (40.7) NM 49.2% 2.1x NM
GoPro, Inc. 5.84 -51% 800.1 787.4 1,149.6 (96.5) NM -11.3% 0.7x NM
IAC/InterActiveCorp 147.25 -12% 12,322.8 13,289.2 3,541.5 404.8 11.4% 14.9% 3.8x 32.8x
j2 Global, Inc. 84.84 -7% 4,166.5 4,839.9 1,143.8 415.2 36.3% 23.2% 4.2x 11.7x
Leaf Group Ltd. 11.70 -3% 275.0 228.5 141.3 (14.3) NM 19.9% 1.6x NM
The Meet Group, Inc. 4.06 -17% 294.3 318.6 152.8 23.0 15.0% 56.2% 2.1x 13.9x
Netflix, Inc. 337.45 -20% 146,945.1 151,380.8 13,878.7 1,439.8 10.4% 36.2% 10.9x NM
Pandora Media, Inc. 6.74 -23% 1,795.0 2,130.2 1,478.0 (272.5) NM 2.8% 1.4x NM
RealNetworks, Inc. 3.59 -28% 134.9 80.5 72.8 (17.5) NM -4.6% 1.1x NM
Remark Holdings, Inc. 3.60 -76% 119.3 136.8 72.0 (27.6) NM 19.3% 1.9x NM
Roku, Inc. 45.42 -23% 4,614.1 4,453.3 549.2 (13.6) NM 30.7% 8.1x NM
Snap Inc. 12.50 -41% 15,874.8 14,069.6 906.0 (1,545.5) NM 75.8% 15.5x NM
TheStreet, Inc. 2.29 -8% 112.6 99.4 61.9 4.2 6.8% -1.3% 1.6x 23.6x
Twitter, Inc. 31.87 -33% 24,031.76 21,066.83 2,696.61 586.07 21.7% 9.8% 7.8x 35.9x
XO Group Inc. 28.18 -21% 709.5 592.8 162.3 22.7 14.0% 3.0% 3.7x 26.1x
Zynga Inc. 3.79 -17% 3,251.2 2,615.8 883.2 75.4 8.5% 13.7% 3.0x 34.7x
Average 3.8x 23.9x
*Calculation is market cap weighted and excludes revenue multiples that are 2.0 standard deviations above the mean (12.5x) and EBITDA multiples that are 1.0 standard deviations above the mean (32.1x)
US-Based Digital Media and Internet

11 | M&A and Investment Summary July 2018
Digital Media Public Company Valuation (2/2)
($ in Millions, except stock price data)
Stock Price Chg % From Equity Ent. LTM LTM Margin LTM LTM Multiples
Company Name Headquarters 07/31/18 52WK High Value Value Revenue EBITDA EBITDA Rev Growth EV/Rev EV/EBITDA
Baidu, Inc. China $247.18 -13% $ 86,539.5 $ 77,371.5 $ 14,189.1 $ 4,794.5 33.8% 26.5% 5.5x 16.1x
Bilibili Inc. * China 11.71 -48% 3,261.0 3,707.0 464.2 19.0 4.1% 0.0% 8.0x NM
CyberAgent, Inc. Japan 52.46 -16% 6,599.7 6,276.5 3,733.6 406.2 10.9% 16.5% 1.7x 15.5x
DeNA Co., Ltd. Japan 18.81 -27% 2,730.4 1,874.3 1,312.5 381.7 29.1% -3.1% 1.4x 4.9x
G5 Entertainment AB (publ) Sweden 46.58 -30% 416.5 404.3 155.4 17.0 10.9% 69.5% 2.6x 23.8x
Gree, Inc. Japan 5.53 -33% 1,296.6 529.9 703.0 97.5 13.9% 19.2% 0.8x 5.4x
HolidayCheck Group AG * Germany 4.47 -1% 254.6 224.7 163.8 (1.6) NM 16.2% 1.4x NM
HUYA Inc. * China 32.20 -37% 6,489.8 6,323.7 419.2 (0.9) NM 0.0% 15.1x NM
International Game Technology PLC United Kingdom 25.28 -18% 5,154.7 12,684.9 4,976.2 1,487.4 29.9% 0.3% 2.5x 8.5x
iQIYI, Inc. China 32.02 -31% 22,829.0 20,999.6 3,144.6 1,006.1 32.0% 0.0% 6.7x 20.9x
mixi, Inc. Japan 26.25 -55% 2,053.2 657.5 1,780.5 770.5 43.3% -8.7% 0.4x 0.9x
Meitu, Inc. * China 0.77 -57% 3,235.6 2,444.4 695.8 (30.3) NM 186.8% 3.5x NM
NCSOFT Corporation South Korea 345.96 -22% 7,351.7 5,962.3 1,878.8 741.9 39.5% 103.1% 3.2x 8.0x
NAVER Corporation South Korea 642.56 -26% 18,510.4 19,059.0 4,620.0 1,194.9 25.9% 0.0% 4.1x 16.0x
NetEase, Inc. China 258.00 -32% 33,882.8 28,648.7 8,709.0 1,532.0 17.6% 24.4% 3.3x 18.7x
NEXON Co., Ltd. Japan 14.34 -21% 12,791.9 9,426.1 2,360.1 1,159.5 49.1% 25.1% 4.0x 8.1x
Opera Limited * Norway 12.09 -23% 1,326.6 1,292.5 142.9 27.4 19.2% 0.0% 9.0x 47.1x
Pacific Online Limited China 0.14 -32% 155.2 87.1 148.1 21.9 14.8% -1.1% 0.6x 4.0x
Phoenix New Media Limited * China 4.14 -49% 299.5 209.3 249.5 5.0 2.0% 10.5% 0.8x 42.1x
Renren Inc. * China 2.04 -89% 140.8 249.9 321.6 (93.9) NM 337.4% 0.8x NM
Sea Limited * Singapore 14.10 -18% 4,723.9 4,302.7 475.3 (584.8) NM 30.9% 9.1x NM
Sogou Inc. China 9.21 -41% 3,562.8 2,518.9 1,084.9 147.2 13.6% 52.6% 2.3x 17.1x
Sohu.com Limited China 25.20 -40% 980.7 140.8 1,966.7 106.5 5.4% 18.6% 0.1x 1.3x
Spotify Technology S.A. * Luxembourg 182.83 -8% 32,868.8 31,219.1 5,358.8 (295.2) NM 0.0% 5.8x NM
Weibo Corporation * China 82.75 -42% 18,428.9 17,396.4 1,300.7 476.7 36.7% 76.8% 13.4x 36.5x
WeMade Entertainment Co., Ltd. South Korea 34.60 -37% 574.4 381.8 104.4 16.1 15.4% 0.9% 3.7x 23.7x
Yandex N.V. Netherlands 35.96 -19% 11,783.7 11,024.6 1,714.9 386.1 22.5% 27.8% 6.4x 28.6x
YY Inc. China 93.23 -35% 5,891.7 3,837.9 2,004.8 464.1 23.1% 42.6% 1.9x 8.3x
Average 3.4x 16.0x
*Calculation is market cap weighted and excludes revenue multiples that are 2.0 standard deviations above the mean (11.9x) and EBITDA multiples that are 1.0 standard deviations above the mean (30.0x)
Internationally-based Digital Media and Internet

12 | M&A and Investment Summary July 2018
eCommercePublic Company Valuation (1/2)
($ in Millions, except stock price data)
Stock Price Chg % From Equity Ent. LTM LTM Margin LTM LTM Multiples
Company Name 07/31/18 52WK High Value Value Revenue EBITDA EBITDA Rev Growth EV/Rev EV/EBITDA
1-800-FLOWERS.COM, Inc. $14.50 -3% $ 936.8 $ 867.9 $ 1,161.5 $ 74.0 6.4% -2.3% 0.7x 11.7x
Alphabet Inc. 1,227.22 -5% 850,264.8 751,991.8 123,898.0 38,205.0 30.8% 24.8% 6.1x 19.7x
Amazon.com, Inc. 1,777.44 -5% 866,930.7 885,669.7 208,125.0 20,631.0 9.9% 38.6% 4.3x 42.9x
Apple Inc. 190.29 -9% 921,558.7 965,188.7 255,274.0 78,533.0 30.8% 14.2% 3.8x 12.3x
Blucora, Inc. 34.75 -14% 1,632.6 1,872.8 551.8 105.0 19.0% 12.3% 3.4x 17.8x
Blue Apron Holdings, Inc. 2.37 -64% 454.5 444.6 774.5 (119.9) NM -14.3% 0.6x NM
Booking Holdings Inc. 2,028.72 -9% 97,733.5 99,855.7 13,189.9 5,114.3 38.8% 19.8% 7.6x 19.5x
CarGurus, Inc. 43.35 -4% 4,679.1 4,537.1 348.5 17.2 4.9% 53.8% 13.0x NM
Carvana Co. 43.00 -14% 1,368.8 1,873.9 1,060.2 (154.0) NM 134.9% 1.8x NM
CDW Corporation 84.09 -5% 12,761.4 16,299.6 15,836.4 1,198.5 7.6% 9.6% 1.0x 13.6x
Chegg, Inc. 27.70 -7% 3,156.7 2,967.4 287.3 10.8 3.7% 13.4% 10.3x NM
Copart, Inc. 57.39 -5% 13,330.4 13,526.9 1,735.1 703.8 40.6% 23.8% 7.8x 19.2x
eBay Inc. 33.45 -29% 33,100.4 38,334.4 10,065.0 3,001.0 29.8% 7.8% 3.8x 12.8x
Etsy, Inc. 40.86 -11% 4,881.8 4,553.9 465.3 63.1 13.6% 22.4% 9.8x 72.2x
EVINE Live Inc. 1.42 -18% 93.2 133.6 648.4 13.7 2.1% -1.1% 0.2x 9.7x
Expedia Group, Inc. 133.84 -13% 20,002.5 21,275.5 10,672.8 1,157.8 10.8% 13.0% 2.0x 18.4x
FTD Companies, Inc. 3.61 -81% 100.2 268.8 1,085.7 42.2 3.9% -2.0% 0.2x 6.4x
GrubHub Inc. 121.89 -14% 10,997.7 10,638.2 840.5 178.9 21.3% 46.0% 12.7x 59.5x
IAC/InterActiveCorp 147.25 -12% 12,322.8 13,289.2 3,541.5 404.8 11.4% 14.9% 3.8x 32.8x
Liberty TripAdvisor Holdings, Inc. 16.65 -9% 1,253.2 4,442.2 1,571.0 225.0 14.3% -0.7% 2.8x 19.7x
Liquidity Services, Inc. 7.05 -12% 226.3 126.6 233.2 (19.5) NM -18.8% 0.5x NM
Match Group, Inc. 36.12 -26% 10,025.5 10,997.6 1,439.3 442.1 30.7% 24.5% 7.6x 24.9x
Overstock.com, Inc. 35.65 -60% 1,030.2 886.8 1,757.7 (82.0) NM -3.4% 0.5x NM
PetMed Express, Inc. 37.13 -36% 757.7 663.2 281.5 55.6 19.8% 9.8% 2.4x 11.9x
Qurate Retail Group, Inc. $21.29 -27% 10,161.1 16,643.1 10,381.0 1,763.0 17.0% 1.6% 1.6x 9.4x
Shutterfly, Inc. 82.26 -18% 2,727.8 2,898.6 1,198.0 174.5 14.6% 4.7% 2.4x 16.6x
Shutterstock, Inc. 46.07 -13% 1,606.3 1,321.4 602.5 47.5 7.9% 16.4% 2.2x 27.8x
Spark Networks SE 11.85 -23% 153.2 146.6 102.8 (2.9) NM 16.5% 1.4x NM
Stamps.com Inc. 261.00 -9% 4,678.13 4,571.82 520.72 204.72 39.3% 24.1% 8.8x 22.3x
Stitch Fix, Inc. 28.66 -19% 2,804.9 2,517.6 1,166.5 44.9 3.8% 26.3% 2.2x 56.1x
U.S. Auto Parts Network, Inc. 1.37 -56% 47.9 48.3 300.9 11.6 3.8% -0.8% 0.2x 4.2x
Wayfair Inc. 108.82 -15% 9,692.1 9,529.8 5,696.7 (263.6) NM 45.0% 1.7x NM
Average 3.0x 15.7x
*Calculation is market cap weighted and excludes revenue multiples that are 2.0 standard deviations above the mean (11.5x) and EBITDA multiples that are 1.0 standard deviations above the mean (40.9x)
US-based eCommerce

13 | M&A and Investment Summary July 2018
eCommercePublic Company Valuation (2/2)
($ in Millions, except stock price data)
Internationally-based eCommerce
Stock Price Chg % From Equity Ent. LTM LTM Margin LTM LTM Multiples
Company Name Headquarters 07/31/18 52WK High Value Value Revenue EBITDA EBITDA Rev Growth EV/Rev EV/EBITDA
58.com Inc. China $67.26 -25% $ 9,912.2 $ 9,448.7 $ 1,682.0 $ 387.1 23.0% 30.7% 5.6x 24.4x
Alibaba Group Holding Limited * China 187.23 -12% 481,082.4 478,844.1 39,893.8 14,744.1 37.0% 58.1% 12.0x 32.5x
Cango Inc. China 10.75 -23% 1,624.4 1,873.5 176.3 71.1 40.3% 0.0% 10.6x 26.4x
Cnova N.V. * France 5.01 -10% 1,725.6 2,039.7 2,619.8 11.2 0.4% 21.8% 0.8x NM
Despegar.com, Corp. Argentina 21.02 -43% 1,452.4 1,085.6 547.5 75.7 13.8% 24.1% 2.0x 14.3x
JD.com, Inc. * China 35.86 -29% 51,180.4 49,321.4 61,728.5 431.5 0.7% 38.5% 0.8x NM
Jumei International Holding Limited China 2.02 -52% 303.1 (51.4) 894.0 3.1 0.3% -7.3% NM NM
LightInTheBox Holding Co., Ltd. * China 1.77 -50% 120.0 66.8 317.2 (15.0) NM 6.5% 0.2x NM
MercadoLibre, Inc. * Argentina 342.91 -18% 15,142.0 15,081.6 1,449.4 95.1 6.6% 51.5% 10.4x NM
Netshoes (Cayman) Limited * Brazil 2.46 -88% 76.4 154.5 572.5 (26.9) NM 5.8% 0.3x NM
PChome Online Inc. * Taiwan 4.46 -36% 522.9 296.4 1,056.5 (38.2) NM 18.5% 0.3x NM
Pinduoduo Inc. * China 22.59 -18% 25,024.9 25,258.6 492.8 (92.4) NM 0.0% 51.3x NM
Rakuten, Inc. Japan 7.03 -44% 9,475.3 13,395.2 9,173.5 1,438.3 15.7% 19.7% 1.5x 9.3x
Secoo Holding Limited * China 11.75 -20% 594.1 580.7 634.6 17.2 2.7% 46.7% 0.9x 33.8x
Travelport Worldwide Limited United Kingdom 18.90 -7% 2,382.0 4,480.3 2,524.3 416.5 16.5% 5.2% 1.8x 10.8x
trivago N.V. * Germany 4.15 -77% 1,455.8 1,340.8 1,124.4 (88.0) NM -1.8% 1.2x NM
Uxin Limited * China 6.16 -41% 1,801.1 3,454.7 355.7 (282.6) NM 0.0% 9.7x NM
Vipshop Holdings Limited China 9.65 -50% 6,359.5 5,771.3 12,247.1 584.2 4.8% 27.3% 0.5x 9.9x
Average 2.5x 17.9x
*Calculation is market cap weighted and excludes revenue multiples that are 2.0 standard deviations above the mean (31.1x) and EBITDA multiples that are 1.0 standard deviations above the mean (30.5x)
14 | M&A and Investment Summary July 2018
Digital Advertising
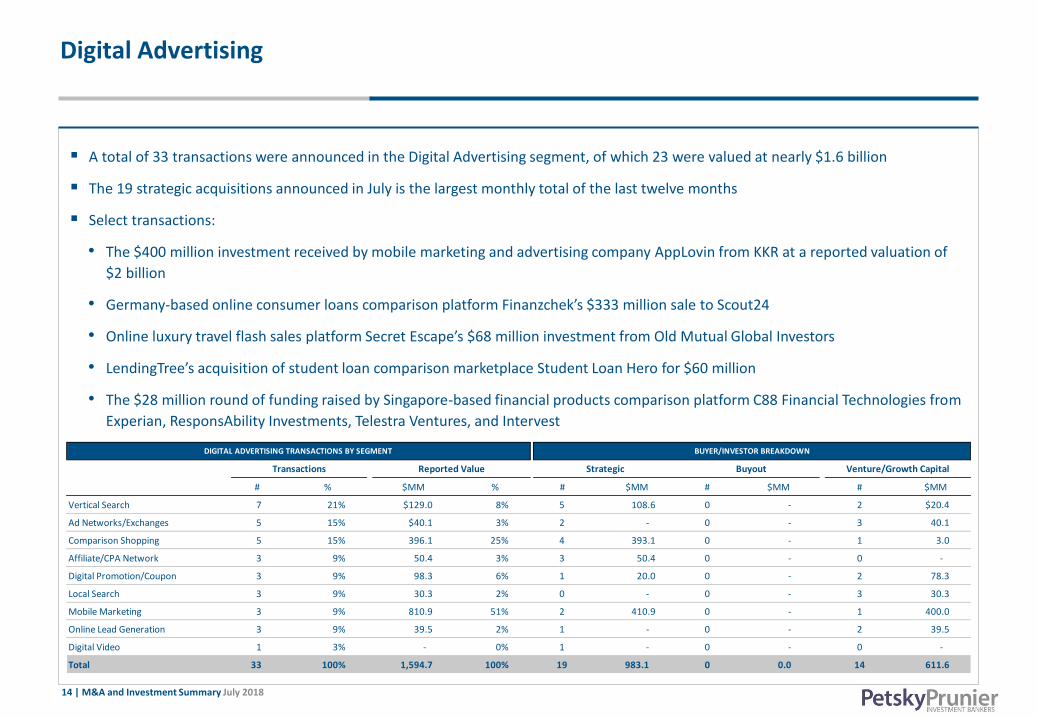
▪ A total of 33 transactions were announced in the Digital Advertising segment, of which 23 were valued at nearly $1.6 billion
▪ The 19 strategic acquisitions announced in July is the largest monthly total of the last twelve months
▪ Select transactions:
• The $400 million investment received by mobile marketing and advertising company AppLovin from KKR at a reported valuation of
$2 billion
• Germany-based online consumer loans comparison platform Finanzchek’s $333 million sale to Scout24
• Online luxury travel flash sales platform Secret Escape’s $68 million investment from Old Mutual Global Investors
• LendingTree’s acquisition of student loan comparison marketplace Student Loan Hero for $60 million
• The $28 million round of funding raised by Singapore-based financial products comparison platform C88 Financial Technologies from
Experian, ResponsAbility Investments, Telestra Ventures, and Intervest
# % $MM % # $MM # $MM # $MM
Vertical Search 7 21% $129.0 8% 5 108.6 0 - 2 $20.4
Ad Networks/Exchanges 5 15% $40.1 3% 2 - 0 - 3 40.1
Comparison Shopping 5 15% 396.1 25% 4 393.1 0 - 1 3.0
Affiliate/CPA Network 3 9% 50.4 3% 3 50.4 0 - 0 -
Digital Promotion/Coupon 3 9% 98.3 6% 1 20.0 0 - 2 78.3
Local Search 3 9% 30.3 2% 0 - 0 - 3 30.3
Mobile Marketing 3 9% 810.9 51% 2 410.9 0 - 1 400.0
Online Lead Generation 3 9% 39.5 2% 1 - 0 - 2 39.5
Digital Video 1 3% - 0% 1 - 0 - 0 -
Total 33 100% 1,594.7 100% 19 983.1 0 0.0 14 611.6
DIGITAL ADVERTISING TRANSACTIONS BY SEGMENT BUYER/INVESTOR BREAKDOWN
Transactions Reported Value Strategic Buyout Venture/Growth Capital

15 | M&A and Investment Summary July 2018
Digital AdvertisingPublic Company Valuation (1/2)
($ in Millions, except stock price data)
US-based Digital Advertising
Stock Price Chg % From Equity Ent. LTM LTM Margin LTM LTM Multiples
Company Name 07/31/18 52WK High Value Value Revenue EBITDA EBITDA Rev Growth EV/Rev EV/EBITDA
Alliance Data Systems Corporation $224.88 -19% $ 12,458.3 $ 33,132.1 $ 7,806.7 $ 1,772.5 22.7% 5.3% 4.2x 18.7x
Alphabet Inc. 1,227.22 -5% 850,264.8 751,991.8 123,898.0 38,205.0 30.8% 24.8% 6.1x 19.7x
ANGI Homeservices Inc. 15.71 -8% 7,549.4 7,624.1 841.0 (58.2) NM 56.3% 9.1x NM
AutoWeb, Inc. 3.88 -61% 50.0 35.6 131.8 (4.6) NM -15.6% 0.3x NM
Care.com, Inc. 18.02 -21% 563.4 501.4 182.0 13.3 7.3% 7.3% 2.8x 37.7x
DHI Group, Inc. 2.10 -35% 108.6 129.9 188.0 25.3 13.4% -12.8% 0.7x 5.1x
EverQuote, Inc. 15.03 -32% 372.8 437.9 135.2 (3.6) NM 0.0% 3.2x NM
Facebook, Inc. 172.58 -21% 498,276.2 456,088.2 48,497.0 27,395.0 56.5% 46.2% 9.4x 16.6x
Fluent, Inc. 2.35 -66% 176.8 235.5 227.1 (1.4) NM 15.5% 1.0x NM
Groupon, Inc. 4.68 -22% 2,642.4 2,148.2 2,751.6 52.4 1.9% -6.0% 0.8x 41.0x
Inuvo, Inc. 0.66 -47% 21.2 22.4 82.8 (1.6) NM 18.3% 0.3x NM
LendingTree, Inc. 238.80 -41% 3,060.7 3,012.4 697.6 85.1 12.2% 45.1% 4.3x 35.4x
QuinStreet, Inc. 13.26 -12% 625.0 577.9 374.4 16.7 4.5% 25.9% 1.5x 34.7x
Quotient Technology Inc. 14.75 -17% 1,391.2 1,183.9 351.4 16.7 4.8% 21.6% 3.4x 70.8x
Redfin Corporation 24.50 -22% 2,144.0 1,954.5 390.1 (17.8) NM 36.7% 5.0x NM
RhythmOne plc 2.67 -51% 208.6 220.8 255.1 5.8 2.3% 71.2% 0.9x 37.8x
Snap Inc. * 12.50 -41% 15,874.8 14,069.6 906.0 (1,545.5) NM 75.8% 15.5x NM
Telaria, Inc. 3.73 -30% 194.6 122.0 47.3 (15.8) NM 6700.1% 2.6x NM
The Rubicon Project, Inc. 2.88 -32% 143.2 23.9 120.1 (54.7) NM -47.2% 0.2x NM
The Trade Desk, Inc. 84.32 -14% 3,551.7 3,412.8 340.5 82.8 24.3% 50.7% 10.0x 41.2x
TiVo Corporation 12.15 -40% 1,493.53 2,194.05 810.53 208.52 25.7% 10.1% 2.7x 10.5x
Travelzoo 13.00 -39% 162.0 142.5 110.6 7.3 6.6% 2.0% 1.3x 19.5x
TripAdvisor, Inc. 57.99 -7% 7,968.0 7,325.0 1,571.0 169.0 10.8% 2.5% 4.7x 43.3x
TrueCar, Inc. 11.12 -44% 1,122.4 955.8 328.5 (20.3) NM 12.7% 2.9x NM
Twitter, Inc. 31.87 -33% 24,031.8 21,066.8 2,696.6 586.1 21.7% 9.8% 7.8x 35.9x
Web.com Group, Inc. 25.15 -4% 1,251.9 1,865.1 750.8 142.0 18.9% 0.1% 2.5x 13.1x
Yelp Inc. 36.88 -24% 3,085.5 2,270.9 871.7 39.3 4.5% 15.8% 2.6x 57.8x
Yext, Inc. 21.14 NA 2,047.3 1,923.1 184.2 (63.7) NM 37.3% 10.4x NM
Zillow Group, Inc. * 56.37 -14% 11,177.4 10,744.0 1,130.9 69.9 6.2% 24.8% 9.5x 153.8x
Average 2.8x 21.7x
*Calculation i s market cap weighted and excludes revenue multiples that are 2.0 s tandard deviations above the mean (12.3x)and EBITDA multiples that are 1.0 s tandard deviations above the mean (73.2x)

16 | M&A and Investment Summary July 2018
Digital AdvertisingPublic Company Valuation (2/2)
($ in Millions, except stock price data)
Internationally-based Digital Advertising
Stock Price Chg % From Equity Ent. LTM LTM Margin LTM LTM Multiples
Company Name Headquarters 07/31/18 52WK High Value Value Revenue EBITDA EBITDA Rev Growth EV/Rev EV/EBITDA
Cliq Digital AG Germany $5.44 -53% $ 33.7 $ 40.2 $ 84.7 $ 6.5 7.6% 8.0% 0.5x 6.2x
Criteo S.A. France 32.13 -38% 2,131.6 1,670.0 2,339.4 255.2 10.9% 14.1% 0.7x 6.5x
iClick Interactive Asia Group Limited Hong Kong 5.74 -50% 275.3 247.8 134.6 (11.2) NM 36.5% 1.8x NM
MakeMyTrip Limited India 32.75 -21% 3,339.9 2,951.0 675.3 (197.0) NM 50.9% 4.4x NM
Matomy Media Group Ltd. Israel 0.44 -69% 42.9 65.4 212.1 11.6 5.5% -25.5% 0.3x 5.6x
Metaps Inc. Japan 23.68 -44% 318.7 280.3 186.2 (1.5) NM 52.1% 1.5x NM
Pacific Online Limited China 0.14 -32% 155.2 87.1 148.1 21.9 14.8% -1.1% 0.6x 4.0x
Perion Network Ltd. Israel 1.06 -24% 82.2 90.7 272.9 20.9 7.6% -8.7% 0.3x 4.3x
Rightmove plc * United Kingdom 63.87 -9% 5,763.5 5,744.6 336.3 251.4 74.7% 10.0% 17.1x 22.9x
Septeni Holdings Co., Ltd. Japan 1.61 -62% 203.3 74.8 138.8 15.2 10.9% 0.5% 0.5x 4.9x
Taptica International Ltd Israel 4.25 -37% 287.6 291.5 210.9 31.3 14.8% 67.6% 1.4x 9.3x
Tencent Holdings Limited * China 45.26 -25% 427,732.76 433,820.49 41,722.22 16,924.27 40.6% 54.4% 10.4x 25.6x
TradeDoubler AB (publ) Sweden 0.24 -58% 10.49 17.40 125.37 1.51 1.2% -11.5% 0.1x 11.5x
XLMedia PLC Jersey 1.41 -52% 310.6 273.8 137.6 41.9 30.4% 32.8% 2.0x 6.5x
Yandex N.V. * Netherlands 35.96 -19% 11,783.7 11,024.6 1,714.9 386.1 22.5% 27.8% 6.4x 28.6x
Average 2.3x 13.6x
*Calculation is market cap weighted and excludes revenue multiples that are 2.0 standard deviations above the mean (12.8x)and EBITDA multiples that are 1.0 standard deviations above the mean (20.3x)

17 | M&A and Investment Summary July 2018
Marketing Technology
▪ The Marketing Technology segment announced 85 transactions in July, of which 48 reported nearly $2.0 billion in value
▪ The Analytics & Targeting subsegment continues to drive segment activity and has been the most active Marketing Technology
subsegment in ten of the past 12 months
▪ Select transactions:
• The $225 million in financing received by MediaMath from Searchlight Capital Partners
• Customer engagement software provider Freshworks’ $100 million investment from Sequoia Capital, Accel Partners, and CapitalG
• The $40 million round of funding raised by market research and consumer behavior solutions company GlobalWebIndex from
Stripes Group
• Facebook’s acquisition of natural language and text processing solutions company Bloomsbury AI for $27 million
• The acquisitions of customer experience software measurement firm FeedbackNow and machine learning solutions provider
Glimpzit by Forrester Research
# % $MM % # $MM # $MM # $MM
Analytics & Targeting 15 18% $1,157.3 59% 4 $850.0 0 - 11 $307.3
Search & Discovery 9 11% 50.5 3% 4 26.5 0 - 5 24.0
Commerce Management 6 7% 57.7 3% 2 - 0 - 4 57.7
CRM 6 7% 152.5 8% 1 - 0 - 5 152.5
MRM/Workflow Management 6 7% 61.0 3% 0 - 1 - 5 61.0
Product/Price Software 5 6% 151.2 8% 0 - 0 - 5 151.2
Creative Production Platform 4 5% 7.1 0% 2 - 0 - 2 7.1
Other 34 40% 323.6 17% 19 129.6 0 - 15 140.0
Total 85 100% 1,960.9 100% 32 1,006.1 1 0.0 52 954.8
MARKETING TECHNOLOGY TRANSACTIONS BY SEGMENT BUYER/INVESTOR BREAKDOWN
Transactions Reported Value Strategic Buyout Venture/Growth Capital

18 | M&A and Investment Summary July 2018
Marketing TechnologyPublic Company Valuation (1/2)
($ in Millions, except stock price data)
Stock Price Chg % From Equity Ent. LTM LTM Margin LTM LTM Multiples
Company Name 07/31/18 52WK High Value Value Revenue EBITDA EBITDA Rev Growth EV/Rev EV/EBITDA
Adobe Systems Incorporated $244.68 -7% $ 119,810.66 $ 115,360.73 $ 8,121.98 $ 2,912.67 35.9% 24.5% 14.2x 39.6x
Alteryx, Inc. 38.99 -12% 2,363.0 2,184.1 145.9 (13.6) NM 52.1% 15.0x NM
AppFolio, Inc. 72.20 -8% 2,470.8 2,418.1 165.4 21.1 12.8% 33.2% 14.6x 114.5x
Blackbaud, Inc. 99.81 -17% 4,717.8 5,168.4 829.5 140.8 17.0% 9.3% 6.2x 36.7x
Brightcove Inc. 8.55 -20% 307.1 279.7 162.4 (9.0) NM 5.9% 1.7x NM
Cardlytics, Inc. 18.82 -27% 381.4 350.1 136.2 (16.7) NM 13.2% 2.6x NM
ChannelAdvisor Corporation 13.90 -11% 376.8 322.4 125.7 (5.1) NM 9.1% 2.6x NM
Cision Ltd. 15.08 -12% 1,967.5 3,160.2 665.1 216.1 32.5% 24.1% 4.8x 14.6x
eBay Inc. 33.45 -29% 33,100.4 38,334.4 10,065.0 3,001.0 29.8% 7.8% 3.8x 12.8x
Endurance International Group
Holdings, Inc.
8.20 -25% 1,171.5 2,954.3 1,168.6 305.2 26.1% -0.2% 2.5x 9.7x
Five9, Inc. 31.90 -19% 1,840.1 1,806.7 212.1 7.1 3.4% 24.0% 8.5x 254.1x
GoDaddy Inc. 73.62 -8% 11,545.7 13,532.8 2,469.2 376.8 15.3% 23.1% 5.5x 35.9x
HubSpot, Inc. 124.10 -13% 4,766.6 4,540.5 441.4 (35.4) NM 38.6% 10.3x NM
IBM Corporation 144.93 -15% 132,287.5 166,289.5 80,771.0 17,033.0 21.1% 3.0% 2.1x 9.8x
LivePerson, Inc. 23.20 -8% 1,408.7 1,351.2 233.8 8.8 3.7% 8.4% 5.8x 154.1x
Marin Software Incorporated 5.55 -64% 31.9 12.7 70.1 (22.7) NM -24.7% 0.2x NM
MicroStrategy Incorporated 130.15 -9% 1,492.5 792.9 506.7 40.8 8.0% -0.9% 1.6x 19.4x
MINDBODY, Inc. 37.35 -18% 1,781.5 1,701.9 211.7 (15.8) NM 32.5% 8.0x NM
Nuance Communications, Inc. 14.77 -21% 4,363.5 6,053.4 1,968.0 288.1 14.6% -0.2% 3.1x 21.0x
Oracle Corporation 47.68 -11% 189,821.5 183,835.5 39,831.0 16,346.0 41.0% 5.6% 4.6x 11.2x
PayPal Holdings, Inc. 82.14 -11% 97,226.9 88,839.9 14,525.0 2,638.0 18.2% 23.5% 6.1x 33.7x
PROS Holdings, Inc. 37.14 -10% 1,216.3 1,293.6 183.6 (44.7) NM 15.6% 7.0x NM
PTC Inc. 91.91 -9% 11,605.2 11,977.5 1,235.7 141.3 11.4% 7.8% 9.7x 84.8x
salesforce.com, inc. 137.15 -8% 101,890.1 98,719.1 11,089.0 1,044.7 9.4% 25.0% 8.9x 94.5x
SendGrid, Inc. 25.53 -20% 1,184.3 1,018.7 128.3 5.9 4.6% 34.2% 7.9x 172.0x
Square, Inc. 64.65 -12% 25,904.9 25,329.3 2,684.7 (12.6) NM 41.0% 9.4x NM
Tableau Software, Inc. 103.07 -8% 8,404.6 7,539.0 992.8 (123.9) NM 14.2% 7.6x NM
Teradata Corporation 38.29 -14% 4,644.6 4,229.6 2,202.0 134.0 6.1% 0.9% 1.9x 31.6x
Verint Systems Inc. 44.90 -9% 2,874.1 3,268.2 1,163.4 121.9 10.5% 8.0% 2.8x 26.8x
Veritone, Inc. 14.93 -80% 269.4 214.9 15.7 (53.0) NM 57.8% 13.7x NM
Web.com Group, Inc. 25.15 -4% 1,251.9 1,865.1 750.8 142.0 18.9% 0.1% 2.5x 13.1x
Zendesk, Inc. 54.47 -14% 5,695.0 5,456.9 506.2 (99.2) NM 38.9% 10.8x NM
Adjusted Weighted Average 4.7x 22.0x
*Calculation is market cap weighted and excludes revenue multiples that are 2.0 standard deviations above the mean (14.8x)and EBITDA multiples that are 1.0 standard deviations above the mean (112.9x)
US-based Marketing Technology

19 | M&A and Investment Summary July 2018
Marketing TechnologyPublic Company Valuation (2/2)
($ in Millions, except stock price data)
Stock Price Chg % From Equity Ent. LTM LTM Margin LTM LTM Multiples
Company Name Headquarters 07/31/18 52WK High Value Value Revenue EBITDA EBITDA Rev Growth EV/Rev EV/EBITDA
Baozun Inc. China 57.85 -14% $ 3,275.63 $ 3,195.84 $ 679.89 $ 51.60 7.6% 20.9% 4.7x 61.9x
Bitauto Holdings Limited China 24.32 -55% 1,737.0 5,530.5 1,494.7 (75.5) NM 50.7% 3.7x NM
ChinaCache International Holdings Ltd. China 1.25 -74% 33.30 62.40 131.03 (37.22) NM -19.1% 0.5x NM
MercadoLibre, Inc. Argentina 342.91 -18% 15,142.0 15,081.6 1,449.4 95.1 6.6% 51.5% 10.4x 158.5x
Open Text Corporation Canada 37.20 -8% 9,949.8 12,013.3 2,815.2 991.5 35.2% 22.9% 4.3x 12.1x
SAP SE Germany 116.68 -5% 139,265.0 142,551.1 27,598.9 7,244.2 26.2% 2.1% 5.2x 19.7x
SharpSpring, Inc. United States 10.45 -16% 88.3 84.1 15.8 (6.9) NM 30.3% 5.3x NM
Shopify Inc. Canada 138.21 -22% 14,707.5 13,133.3 853.6 (48.2) NM 67.7% 15.4x NM
The Sage Group plc United Kingdom 8.16 -24% 8,837.3 9,697.5 2,490.0 654.1 26.3% 11.2% 3.9x 14.8x
United Internet AG Germany 53.66 -23% 10,726.4 13,083.5 5,573.9 1,241.3 22.3% 19.3% 2.3x 10.5x
Weborama SA France 12.87 -26% 43.8 45.2 43.1 3.1 7.3% 13.0% 1.0x 14.3x
Wix.com Ltd. Israel 95.00 -15% 4,454.4 4,104.4 513.5 (34.3) NM 44.3% 8.0x NM
Adjusted Weighted Average 4.1x 22.2x
*Calculation is market cap weighted and excludes revenue multiples that are 2.0 standard deviations above the mean (14.5x)and EBITDA multiples that are 1.0 standard deviations above the mean (96.3x)
Internationally-based Marketing Technology
20 | M&A and Investment Summary July 2018
Agency & Marketing Services
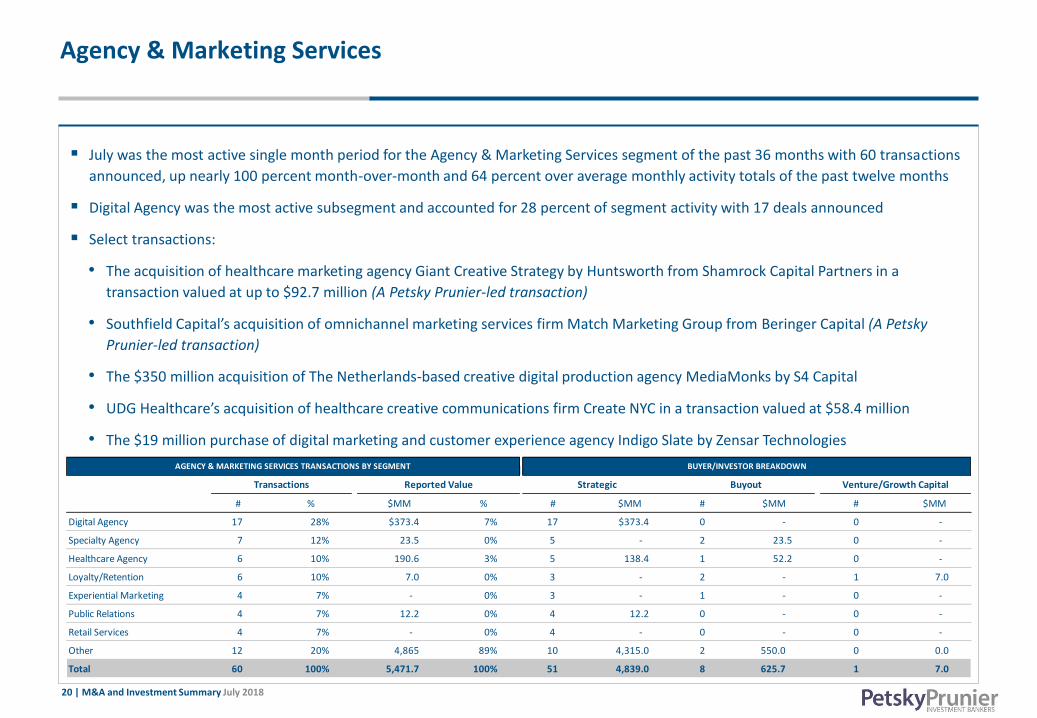
▪ July was the most active single month period for the Agency & Marketing Services segment of the past 36 months with 60 transactions
announced, up nearly 100 percent month-over-month and 64 percent over average monthly activity totals of the past twelve months
▪ Digital Agency was the most active subsegment and accounted for 28 percent of segment activity with 17 deals announced
▪ Select transactions:
• The acquisition of healthcare marketing agency Giant Creative Strategy by Huntsworth from Shamrock Capital Partners in a
transaction valued at up to $92.7 million (A Petsky Prunier-led transaction)
• Southfield Capital’s acquisition of omnichannel marketing services firm Match Marketing Group from Beringer Capital (A Petsky
Prunier-led transaction)
• The $350 million acquisition of The Netherlands-based creative digital production agency MediaMonks by S4 Capital
• UDG Healthcare’s acquisition of healthcare creative communications firm Create NYC in a transaction valued at $58.4 million
• The $19 million purchase of digital marketing and customer experience agency Indigo Slate by Zensar Technologies
• Incomm’s acquisition of gift card packaging and digital gifting solutions company Gift Card Impressions
• The acquisition of digital experience consultancy Infield Digital by HS2 Solutions# % $MM % # $MM # $MM # $MM
Digital Agency 17 28% $373.4 7% 17 $373.4 0 - 0 -
Specialty Agency 7 12% 23.5 0% 5 - 2 23.5 0 -
Healthcare Agency 6 10% 190.6 3% 5 138.4 1 52.2 0 -
Loyalty/Retention 6 10% 7.0 0% 3 - 2 - 1 7.0
Experiential Marketing 4 7% - 0% 3 - 1 - 0 -
Public Relations 4 7% 12.2 0% 4 12.2 0 - 0 -
Retail Services 4 7% - 0% 4 - 0 - 0 -
Other 12 20% 4,865 89% 10 4,315.0 2 550.0 0 0.0
Total 60 100% 5,471.7 100% 51 4,839.0 8 625.7 1 7.0
AGENCY & MARKETING SERVICES TRANSACTIONS BY SEGMENT BUYER/INVESTOR BREAKDOWN
Transactions Reported Value Strategic Buyout Venture/Growth Capital

21 | M&A and Investment Summary July 2018
Agency Public Company Valuation
($ in Millions, except stock price data)
Stock Price Chg % From Equity Ent. LTM LTM Margin LTM LTM Multiples
Company Name Headquarters 07/31/18 52WK High Value Value Revenue EBITDA EBITDA Rev Growth EV/Rev EV/EBITDA
Cello Health plc United Kingdom $1.62 -10% $ 169.5 $ 167.4 $ 228.8 $ 16.2 7.1% 2.4% 0.7x 10.3x
Dentsu Inc. Japan 41.91 -14% 11,814.5 14,327.0 8,861.5 1,627.3 18.4% NM 1.6x 8.8x
Enero Group Limited Australia 0.75 -7% 63.4 36.9 143.8 9.7 6.7% -4.7% 0.3x 3.8x
Hakuhodo DY Holdings Inc Japan 15.32 -7% 5,710.8 4,665.0 12,570.3 568.2 4.5% 6.3% 0.4x 8.2x
Huntsworth plc United Kingdom 1.53 -18% 500.7 552.5 270.4 38.0 14.0% 9.1% 2.0x 14.5x
M&C Saatchi plc * United Kingdom 4.64 -17% 399.5 398.3 339.9 22.9 6.7% 11.6% 1.2x 17.4x
MDC Partners Inc. United States 5.10 -58% 305.0 1,414.4 1,485.3 186.4 12.6% 0.7% 1.0x 7.6x
Next Fifteen Communications Group plc United Kingdom 6.81 -5% 534.5 548.9 279.5 45.3 16.2% 15.1% 2.0x 12.1x
Omnicom Group Inc. United States 68.83 -17% 15,443.6 19,206.2 15,385.2 2,351.5 15.3% -0.2% 1.2x 8.2x
OPT Holding, Inc. * Japan 21.84 -9% 494.0 479.5 795.5 30.8 3.9% 17.1% 0.6x 15.6x
Publicis Groupe S.A. France 63.97 -14% 14,749.8 18,362.4 10,843.5 2,220.3 20.5% -5.4% 1.7x 8.3x
The Interpublic Group of Companies, Inc. United States 22.55 -13% 8,654.4 10,397.3 8,094.7 1,166.0 14.4% 5.2% 1.3x 8.9x
UDG Healthcare plc * Ireland 11.01 -12% 2,739.2 2,782.9 1,316.2 160.9 12.2% 17.1% 2.1x 17.3x
WPP plc United Kingdom 15.63 -25% 19,721.3 26,214.4 20,633.1 3,190.0 15.5% 6.1% 1.3x 8.2x
1.4x 8.5xAdjusted Weighted Average
*Calculation is market cap weighted and excludes revenue multiples that are 2.0 standard deviations above the mean (2.4x)and EBITDA multiples that are 1.0 standard deviations above the mean (14.8x)
22 | M&A and Investment Summary July 2018
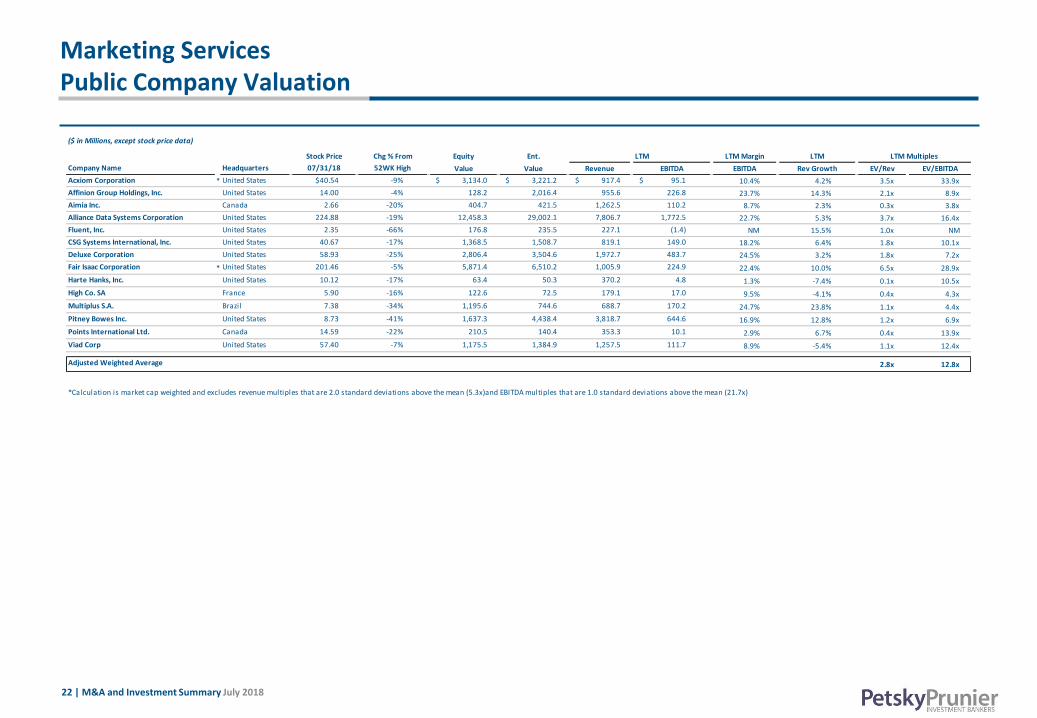
Marketing ServicesPublic Company Valuation
($ in Millions, except stock price data)
Stock Price Chg % From Equity Ent. LTM LTM Margin LTM LTM Multiples
Company Name Headquarters 07/31/18 52WK High Value Value Revenue EBITDA EBITDA Rev Growth EV/Rev EV/EBITDA
Acxiom Corporation * United States $40.54 -9% $ 3,134.0 $ 3,221.2 $ 917.4 $ 95.1 10.4% 4.2% 3.5x 33.9x
Affinion Group Holdings, Inc. United States 14.00 -4% 128.2 2,016.4 955.6 226.8 23.7% 14.3% 2.1x 8.9x
Aimia Inc. Canada 2.66 -20% 404.7 421.5 1,262.5 110.2 8.7% 2.3% 0.3x 3.8x
Alliance Data Systems Corporation United States 224.88 -19% 12,458.3 29,002.1 7,806.7 1,772.5 22.7% 5.3% 3.7x 16.4x
Fluent, Inc. United States 2.35 -66% 176.8 235.5 227.1 (1.4) NM 15.5% 1.0x NM
CSG Systems International, Inc. United States 40.67 -17% 1,368.5 1,508.7 819.1 149.0 18.2% 6.4% 1.8x 10.1x
Deluxe Corporation United States 58.93 -25% 2,806.4 3,504.6 1,972.7 483.7 24.5% 3.2% 1.8x 7.2x
Fair Isaac Corporation * United States 201.46 -5% 5,871.4 6,510.2 1,005.9 224.9 22.4% 10.0% 6.5x 28.9x
Harte Hanks, Inc. United States 10.12 -17% 63.4 50.3 370.2 4.8 1.3% -7.4% 0.1x 10.5x
High Co. SA France 5.90 -16% 122.6 72.5 179.1 17.0 9.5% -4.1% 0.4x 4.3x
Multiplus S.A. Brazil 7.38 -34% 1,195.6 744.6 688.7 170.2 24.7% 23.8% 1.1x 4.4x
Pitney Bowes Inc. United States 8.73 -41% 1,637.3 4,438.4 3,818.7 644.6 16.9% 12.8% 1.2x 6.9x
Points International Ltd. Canada 14.59 -22% 210.5 140.4 353.3 10.1 2.9% 6.7% 0.4x 13.9x
Viad Corp United States 57.40 -7% 1,175.5 1,384.9 1,257.5 111.7 8.9% -5.4% 1.1x 12.4x
2.8x 12.8xAdjusted Weighted Average
*Calculation is market cap weighted and excludes revenue multiples that are 2.0 standard deviations above the mean (5.3x)and EBITDA multiples that are 1.0 standard deviations above the mean (21.7x)

23 | M&A and Investment Summary July 2018
Traditional Media
▪ Of the 27 transactions recorded in the Traditional Media segment in July, 11 announced $3.5 billion in reported value
▪ Entertainment Media logged its 12th consecutive month as the most active subsegment with 12 deals announced
▪ Select transactions from the segment included:
• Nine Entertainment’s acquisition of Australia-based newspaper publisher Fairfax Media in a transaction valued at $1.9 billion
• Television broadcaster Bonnier Broadcasting’s $1.1 billion sale to Telia
• The acquisition of digital channel and OTT content company RLJ Entertainment by AMC Networks in a transaction valuing that
company at $195 million
• Mayfair Equity Partners’ $60 million acquisition of visual effects studio Pixomondo
• The $30 million investment received by teen-focused scripted television production company Brat from Anchorage Capital
• The purchase of live entertainment company Vstar Entertainment Group by Cirque du Soleil
# % $MM % # $MM # $MM # $MM
Entertainment Media 12 44% $395.2 11% 7 $201.2 1 $65.0 4 $129.0
B-to-B Media 5 19% - 0% 5 - 0 - 0 -
Digital Place-Based Media 3 11% 53.0 2% 1 - 0 - 2 53.0
Newspaper Publishing 2 7% 1,864.2 54% 2 1,864.2 0 - 0 -
Traditional Outdoor 2 7% - 0% 2 - 0 - 0 -
Broadcast Television 1 4% 1,149.8 33% 1 1,149.8 0 - 0 -
Consumer Book Publishing 1 4% - 0% 1 - 0 - 0 -
Radio 1 4% - 0% 0 - 0 - 1 -
Total 27 100% 3,462.2 100% 19 3,215.2 1 65.0 7 182.0
TRADTIONAL MEDIA TRANSACTIONS BY SEGMENT BUYER/INVESTOR BREAKDOWN
Transactions Reported Value Strategic Buyout Venture/Growth Capital

24 | M&A and Investment Summary July 2018
Traditional MediaPublic Company Valuation (1/3)
($ in Millions, except stock price data)
Stock Price Chg % From Equity Ent. LTM LTM Margin LTM LTM Multiples
Company Name Headquarters 07/31/18 52WK High Value Value Revenue EBITDA EBITDA Rev Growth EV/Rev EV/EBITDA
CBS Corporation United States $52.67 -22% $ 20,030.0 $ 29,589.0 $ 14,319.0 $ 3,112.0 21.7% 8.5% 2.1x 9.5x
Discovery, Inc. United States 26.58 -8% 18,129.3 38,571.3 7,567.0 2,579.0 34.1% 15.5% 5.1x 15.0x
Twenty-First Century Fox, Inc. * United States 45.00 -10% 82,901.8 97,539.8 29,207.0 6,497.0 22.2% 2.8% 3.3x 15.0x
Viacom, Inc. United States 29.05 -18% 11,954.3 21,959.3 12,904.0 2,958.0 22.9% -0.1% 1.7x 7.4x
The Walt Disney Company United States 113.56 -1% 168,835.4 193,990.4 56,916.0 17,254.0 30.3% 2.5% 3.4x 11.2x
Adjusted Weighted Average 3.3x 11.2x
($ in Millions, except stock price data)
B-to-B Media
Stock Price Chg % From Equity Ent. LTM LTM Margin LTM LTM Multiples
Company Name Headquarters 07/31/18 52WK High Value Value Revenue EBITDA EBITDA Rev Growth EV/Rev EV/EBITDA
Ascential plc United Kingdom $5.51 -10% $ 2,204.3 $ 2,578.1 $ 527.3 $ 138.9 26.4% 38.5% 4.9x 18.6x
Centaur Media Plc United Kingdom $0.58 -21% 84.0 81.7 92.8 6.9 7.4% 16.2% 0.9x 11.9x
Emerald Expositions Events, Inc. United States $19.30 -21% 1,405.7 1,932.1 352.5 168.1 47.7% 3.4% 5.5x 11.5x
Euromoney Institutional Investor PLC United Kingdom $17.81 -6% 1,912.4 1,976.0 552.6 149.3 27.0% 11.2% 3.6x 13.2x
Informa plc United Kingdom 10.35 -9% 12,949.3 16,568.4 2,374.3 749.2 31.6% 11.6% 7.0x 22.1x
MCH Group AG Switzerland 38.50 -52% 231.2 364.7 498.8 57.2 11.5% 12.6% 0.7x 6.4x
ITE Group plc United Kingdom 1.09 -58% 804.1 903.0 222.3 29.5 13.3% 12.8% 4.1x 30.6x
Tarsus Group plc Ireland 4.04 -8% 456.5 587.5 149.8 50.2 33.5% 39.8% 3.9x 11.7x
TechTarget, Inc. * United States 28.42 -18% 781.5 780.2 112.3 17.8 15.9% 6.8% 6.9x 43.8x
Adjusted Weighted Average 6.1x 20.0x
($ in Millions, except stock price data)
Radio Broadcasting
Stock Price Chg % From Equity Ent. LTM LTM Margin LTM LTM Multiples
Company Name Headquarters 07/31/18 52WK High Value Value Revenue EBITDA EBITDA Rev Growth EV/Rev EV/EBITDA
Beasley Broadcast Group, Inc. United States $6.45 -55% $ 177.4 $ 376.5 $ 234.2 $ 41.5 17.7% 19.4% 1.6x 9.1x
Emmis Communications Corporation United States 4.85 -17% 62.7 170.1 136.3 15.8 11.6% -31.4% 1.2x 10.8x
Entercom Communications Corp. * United States 7.55 -39% 1,066.6 2,883.8 794.4 115.7 14.6% 69.9% 3.6x 24.9x
Pandora Media, Inc. United States 6.74 -23% 1,795.0 2,130.2 1,478.0 (272.5) NM 2.8% 1.4x NM
Salem Media Group, Inc. United States 4.95 -30% 129.6 379.4 262.6 41.6 15.9% -4.4% 1.4x 9.1x
Sirius XM Holdings Inc. * United States 7.02 -9% 31,506.5 37,890.9 5,590.9 2,026.3 36.2% 7.1% 6.8x 18.7x
Spanish Broadcasting System, Inc. United States 0.00 NA 2.2 410.4 137.3 38.5 28.1% -4.9% 3.0x 10.7x
Townsquare Media, Inc. United States 6.48 -41% 122.4 630.8 513.3 97.7 19.0% 0.6% 1.2x 6.5x
Urban One, Inc. United States 2.15 -10% 99.7 1,027.5 438.4 115.3 26.3% -2.2% 2.3x 8.9x
Adjusted Weighted Average 2.1x 8.7x
*Calculation is market cap weighted and excludes revenue multiples that are 2.0 standard deviations above the mean (6.1x)and EBITDA multiples that are 1.0 standard deviations above the mean (18.6x)
Large Cap Diversified Media
*Calculation is market cap weighted and excludes revenue multiples that are 2.0 standard deviations above the mean (5.8x)and EBITDA multiples that are 1.0 standard deviations above the mean (15.0x)
*Calculation is market cap weighted and excludes revenue multiples that are 2.0 standard deviations above the mean (8.7x)and EBITDA multiples that are 1.0 standard deviations above the mean (30.7x)

25 | M&A and Investment Summary July 2018
Traditional MediaPublic Company Valuation (2/3)
($ in Millions, except stock price data)
Broadcast, Cable, and Satellite Television
Stock Price Chg % From Equity Ent. LTM LTM Margin LTM
Company Name Headquarters 07/31/18 52WK High Value Value Revenue EBITDA EBITDA Rev Growth EV/Rev EV/EBITDA
Altice Europe N.V. Netherlands $3.34 -86% $ 4,706.2 $ 48,710.5 $ 28,784.6 $ 10,912.9 37.9% 15.5% 1.7x 4.5x
AMC Networks Inc. United States $60.29 -13% 3,464.3 6,315.6 2,877.2 895.3 31.1% 2.9% 2.2x 7.1x
Sky plc * United Kingdom 19.98 -1% 34,317.0 42,948.9 17,925.5 2,635.1 14.7% 5.2% 2.4x 16.3x
CVC Limited Australia 2.01 -6% 240.8 192.8 43.4 33.4 77.1% 14.9% 4.4x 5.8x
CBS Corporation United States 52.67 -22% 20,030.0 29,589.0 14,319.0 3,112.0 21.7% 8.5% 2.1x 9.5x
Charter Communications, Inc. United States 304.58 -25% 70,621.1 150,164.1 42,571.0 15,600.0 36.6% 4.3% 3.5x 9.6x
Comcast Corporation United States 35.78 -19% 163,941.6 225,187.6 87,179.0 28,388.0 32.6% 3.5% 2.6x 7.9x
Discovery, Inc. * United States 26.58 -8% 18,129.3 38,571.3 7,567.0 2,579.0 34.1% 15.5% 5.1x 15.0x
DISH Network Corporation United States 31.56 -48% 14,754.8 29,038.4 13,986.7 2,731.4 19.5% -5.8% 2.1x 10.6x
Entravision Communications Corporation United States 4.85 -39% 430.8 478.7 549.2 301.1 54.8% 108.3% 0.9x 1.6x
GCI Liberty, Inc. * United States NA NA 5,241.4 7,630.6 80.2 (33.8) NM -72.2% 95.1x NM
Gray Television, Inc. United States 15.45 -13% 1,348.7 2,742.1 905.5 301.3 33.3% 7.5% 3.0x 9.1x
Grupo Televisa, S.A.B. Mexico 3.98 -23% 11,588.0 17,074.1 5,032.0 1,869.1 37.1% 3.0% 3.4x 9.1x
Liberty Global plc United Kingdom 28.23 -29% 21,910.4 65,508.8 15,686.0 7,189.0 45.8% -3.3% 4.2x 9.1x
Nexstar Media Group, Inc. United States 74.45 -17% 3,404.9 7,641.3 2,507.0 853.4 34.0% 80.6% 3.0x 9.0x
Stolt-Nielsen Limited United Kingdom 17.12 -3% 923.0 3,459.2 2,076.9 454.3 21.9% 8.5% 1.7x 7.6x
Sinclair Broadcast Group, Inc. United States 25.80 -36% 2,637.6 5,821.1 2,772.5 739.5 26.7% -0.4% 2.1x 7.9x
TEGNA Inc. United States 11.03 -29% 2,378.9 5,567.2 1,946.0 639.4 32.9% -2.8% 2.9x 8.7x
The E.W. Scripps Company * United States 13.10 -32% 1,070.1 1,632.5 987.7 97.2 9.8% 14.6% 1.7x 16.8x
Adjusted Weighted Average 2.9x 8.6x
($ in Millions, except stock price data)
Entertainment Media
Stock Price Chg % From Equity Ent. LTM LTM Margin LTM
Company Name Headquarters 07/31/18 52WK High Value Value Revenue EBITDA EBITDA Rev Growth EV/Rev EV/EBITDA
Cineplex Inc. Canada $22.44 -34% $ 1,421.1 $ 1,842.2 $ 1,203.3 $ 176.6 14.7% 3.9% 1.5x 10.4x
Eros International Plc United States 13.45 -20% 863.2 1,199.0 261.3 61.0 23.3% 3.3% 4.6x 19.7x
Lions Gate Entertainment Corp. United States 23.85 -35% 4,974.4 7,427.8 4,129.1 501.1 12.1% 29.0% 1.8x 14.8x
Live Nation Entertainment, Inc. United States 49.28 -7% 10,302.5 11,372.9 10,761.7 643.9 6.0% 21.0% 1.1x 17.7x
Twenty-First Century Fox, Inc. United States 45.00 -10% 82,901.8 97,539.8 29,207.0 6,497.0 22.2% 2.8% 3.3x 15.0x
Liberty Global plc United Kingdom 28.23 -29% 21,910.4 65,508.8 15,686.0 7,189.0 45.8% -3.3% 4.2x 9.1x
Village Roadshow Limited Australia 1.41 -54% 228.6 538.9 779.3 61.9 7.9% -8.3% 0.7x 8.7x
World Wrestling Entertainment, Inc. * United States 79.11 -8% 6,168.9 6,041.1 867.2 135.5 15.6% 13.9% 7.0x 44.6x
Adjusted Weighted Average 3.4x 14.2x
LTM Multiples
*Calculation is market cap weighted and excludes revenue multiples that are 2.0 standard deviations above the mean (7.7x)and EBITDA multiples that are 1.0 standard deviations above the mean (30.7x)
*Calculation is market cap weighted and excludes revenue multiples that are 2.0 standard deviations above the mean (50.0x)and EBITDA multiples that are 1.0 standard deviations above the mean (13.0x)
LTM Multiples

26 | M&A and Investment Summary July 2018
Traditional MediaPublic Company Valuation (3/3)
($ in Millions, except stock price data)
Out-of-Home Media
Stock Price Chg % From Equity Ent. LTM LTM Margin LTM LTM Multiples
Company Name Headquarters 07/31/18 52WK High Value Value Revenue EBITDA EBITDA Rev Growth EV/Rev EV/EBITDA
AirMedia Group Inc. * China $0.53 -82% $ 33.3 $ (36.7) $ 19.7 $ (101.6) NM NA NM 0.4x
APG|SGA SA Switzerland 355.69 -24% 1,065.1 1,044.4 303.4 70.8 23.3% -3.6% 3.4x 14.7x
Clear Channel Outdoor Holdings, Inc. United States 4.45 -23% 1,608.4 6,860.6 2,684.9 573.3 21.4% 2.9% 2.6x 12.0x
Clear Media Limited Hong Kong 0.76 -37% 414.1 379.7 262.2 114.5 43.7% 6.1% 1.4x 3.3x
JCDecaux SA France 32.70 -24% 6,956.6 7,610.7 3,543.1 576.1 16.3% 0.9% 2.1x 13.2x
Lamar Advertising Company (REIT) United States 73.63 -7% 7,249.7 9,867.6 1,555.9 667.4 42.9% 3.2% 6.3x 14.8x
National CineMedia, Inc. United States 8.26 -7% 652.6 1,819.1 434.4 191.9 44.2% -2.0% 4.2x 9.5x
NTN Buzztime, Inc. United States 4.56 -46% 11.5 14.0 21.8 1.3 5.8% -1.2% 0.6x 11.1x
Outfront Media Inc. United States 21.25 -19% 2,957.7 5,199.2 1,527.8 388.8 25.4% 2.1% 3.4x 13.4x
Stingray Digital Group Inc. Canada 6.59 -23% 371.1 398.1 98.4 22.2 22.5% 25.1% 4.0x 18.0x
TOM Group Limited * Hong Kong 0.29 -6% 1,120.2 1,475.9 121.8 14.8 12.1% -2.5% 12.1x 99.8x
Adjusted Weighted Average 3.9x 13.5x
($ in Millions, except stock price data)
Publishing
Stock Price Chg % From Equity Ent. LTM LTM Margin LTM LTM Multiples
Company Name Headquarters 07/31/18 52WK High Value Value Revenue EBITDA EBITDA Rev Growth EV/Rev EV/EBITDA
A.H. Belo Corporation United States $4.40 -24% $ 95.5 $ 41.6 $ 237.2 $ 3.0 1.3% -8.2% 0.2x 13.8x
Daily Mail and General Trust plc United Kingdom 9.78 -3% 3,268.5 3,979.6 2,127.6 235.1 11.1% -2.4% 1.9x 16.9x
Emmis Communications Corporation United States 4.85 -17% 62.7 170.1 136.3 15.8 11.6% -31.4% 1.2x 10.8x
Gannett Co., Inc. United States 10.57 -15% 1,193.7 1,352.8 3,096.0 298.5 9.6% -2.1% 0.4x 4.5x
Glacier Media Inc. Canada 0.62 -10% 68.4 113.3 146.5 8.7 6.0% -3.8% 0.8x 13.0x
John Wiley & Sons, Inc. United States 63.15 -12% 3,627.0 3,817.2 1,796.1 338.8 18.9% 4.5% 2.1x 11.3x
Meredith Corporation United States 53.15 -26% 2,361.0 5,645.3 1,904.8 347.9 18.3% 11.8% 3.0x 16.2x
News Corporation United States 15.07 -13% 8,834.7 7,314.7 8,411.0 784.0 9.3% 2.4% 0.9x 9.3x
Scholastic Corporation * United States 41.76 -13% 1,461.1 1,077.1 1,628.4 46.5 2.9% -6.5% 0.7x 23.2x
The E.W. Scripps Company United States 13.10 -32% 1,070.1 1,632.5 987.7 97.2 9.8% 14.6% 1.7x 16.8x
The McClatchy Company United States 9.75 -12% 75.6 836.5 860.5 98.0 11.4% -8.8% 1.0x 8.5x
The New York Times Company United States 24.80 -8% 4,088.8 3,826.3 1,675.1 262.4 15.7% 8.0% 2.3x 14.6x
Adjusted Weighted Average 1.6x 12.3x
*Calculation is market cap weighted and excludes revenue multiples that are 2.0 standard deviations above the mean (3.0x)and EBITDA multiples that are 1.0 standard deviations above the mean (18.1x)
*Calculation is market cap weighted and excludes revenue multiples that are 2.0 standard deviations above the mean (9.5x)and EBITDA multiples that are 1.0 standard deviations above the mean (37.1x)

27 | M&A and Investment Summary July 2018
Software
▪ Within the Software segment, more than $8.0 billion in reported value involved strategic buyers while $3.3 billion in venture/growth
capital investments were announced
▪ Activity was driven primarily by the Financial Software subsegment, which announced 43 transactions worth more than $7.1 billion
▪ Select transactions:
• EQT’s acquisition of Micro Focus’ SUSE open source infrastructure business in a transaction valued at $2.5 billion
• The $2 billion acquisition of real estate and facilities management software company Accurent by Fortive from Genstar Capital
• TPG Capital’s $1.5 billion sale of investment technology solutions company Eze Software to SS&C Technologies
• SoftBank-backed ARM’s $600 million acquisition of data management and analytics platform provider Treasure Data
• The acquisition of MetaPack, a provider of delivery management systems for eCommerce businesses, by Stamps.com in a
transaction valuing the company at $230 million
• Facebook’s acquisition of team collaboration and workplace communications platform Redkix for a reported $100 million
* Broadcom’s pending $18.4 billion acquisition of CA Technologies has been excluded to limit comparative distortions
# % $MM % # $MM # $MM # $MM
Financial 43 16% $7,124.4 46% 18 $6,186.9 2 $300.0 23 $637.5
Security 38 15% 658.8 4% 15 352.1 1 - 22 306.7
Healthcare 30 11% 464.2 3% 10 - 2 - 18 464.2
ERP 25 10% 412.5 3% 16 280.3 0 - 9 132.2
HR 22 8% 664.7 4% 10 307.0 2 - 10 357.7
Other 104 40% 6,045.8 39% 38 903 6 3,740 60 1,402.9
Total 262 100% 15,370.4 100% 107 8,029.2 13 4,040.0 142 3,301.2
SOFTWARE TRANSACTIONS BY SEGMENT BUYER/INVESTOR BREAKDOWN
Transactions Reported Value Strategic Buyout Venture/Growth Capital

28 | M&A and Investment Summary July 2018
SoftwarePublic Company Valuation (1/3)
($ in Millions, except stock price data)
Stock Price Chg % From Equity Ent. LTM LTM Margin LTM LTM Multiples
Company Name Headquarters 07/31/18 52WK High Value Value Revenue EBITDA EBITDA Rev Growth EV/Rev EV/EBITDA
Alfa Financial Software Holdings PLC United Kingdom 2.15 -70% $ 645.1 $ 604.1 $ 118.6 $ 46.4 39.1% 19.8% 5.1x 13.0x
Apptio, Inc. United States 33.57 -14% 1,466.2 1,327.4 212.5 (14.6) NM 22.0% 6.2x NM
Avalara, Inc. United States 38.34 -35% 2,545.2 2,960.9 225.6 (43.0) NM 27.0% 13.1x NM
BlackLine, Inc. United States 42.70 -15% 2,282.0 2,168.0 203.6 (18.4) NM 37.6% 10.6x NM
Coupa Software Incorporated * United States 61.31 -9% 3,494.6 3,230.4 202.0 (41.4) NM 38.6% 16.0x NM
Ebix, Inc. United States 79.35 -9% 2,503.7 2,849.6 393.1 132.3 33.7% 28.3% 7.2x 21.5x
Fidessa group plc United Kingdom 50.55 -8% 1,948.5 1,827.4 478.4 89.4 18.7% 6.6% 3.8x 20.4x
First Data Corporation United States 23.26 -4% 21,718.6 42,693.6 8,540.0 2,997.0 35.1% 8.0% 5.0x 14.2x
GreenSky, Inc. United States 17.30 -36% 995.4 1,537.2 345.9 151.6 43.8% 24.8% 4.4x 10.1x
Guidewire Software, Inc. United States 86.20 -10% 6,918.7 6,226.7 593.5 17.2 2.9% 25.1% 10.5x NM
i3 Verticals, Inc. United States 15.31 -21% 402.7 514.6 277.5 20.2 7.3% 0.0% 1.9x 25.5x
Intuit Inc. United States 204.24 -7% 52,405.6 50,919.6 5,818.0 1,808.0 31.1% 14.3% 8.8x 28.2x
Model N, Inc. United States 18.65 -8% 569.4 571.8 148.2 (11.1) NM 25.8% 3.9x NM
Performant Financial Corporation United States 2.15 -39% 110.8 142.5 156.0 20.2 13.0% 14.5% 0.9x 7.0x
Q2 Holdings, Inc. United States 59.15 -7% 2,511.8 2,392.8 204.3 (13.0) NM 26.9% 11.7x NM
RealPage, Inc. * United States 55.10 -11% 4,965.1 5,513.0 774.3 132.3 17.1% 26.7% 7.1x 41.7x
SS&C Technologies Holdings, Inc. United States 53.07 -13% 12,635.4 14,547.9 2,174.3 659.1 30.3% 35.6% 6.7x 22.1x
Tyler Technologies, Inc. * United States 224.99 -9% 8,614.3 8,424.6 889.4 198.8 22.4% 11.7% 9.5x 42.4x
Zuora, Inc. United States 24.53 -35% 2,636.4 2,449.5 187.3 (51.8) NM 0.0% 13.1x NM
Adjusted Weighted Average 7.9x 23.5x
($ in Millions, except stock price data)
Healthcare Software
Stock Price Chg % From Equity Ent. LTM LTM Margin LTM LTM Multiples
Company Name Headquarters 07/31/18 52WK High Value Value Revenue EBITDA EBITDA Rev Growth EV/Rev EV/EBITDA
Allscripts Healthcare Solutions, Inc. United States 12.24 -24% $ 2,178.1 $ 4,254.6 $ 2,006.2 $ 117.2 5.8% 21.0% 2.1x 36.3x
athenahealth, Inc. United States 150.71 -8% 6,104.1 6,145.7 1,286.5 242.5 18.8% 11.7% 4.8x 25.3x
Cegedim SA France 38.62 -25% 538.1 815.5 549.3 59.3 10.8% 6.6% 1.5x 13.8x
Cerner Corporation United States 62.08 -16% 20,599.0 20,123.2 5,148.9 1,311.6 25.5% 4.6% 3.9x 15.3x
Civitas Solutions, Inc. United States 16.35 -18% 599.6 1,310.1 1,540.9 150.8 9.8% 7.2% 0.9x 8.7x
Computer Programs and Systems, Inc. United States 31.20 -10% 421.4 561.7 284.0 34.9 12.3% 8.8% 2.0x 16.1x
Cotiviti Holdings, Inc. United States 44.64 0% 4,186.4 4,723.4 747.4 288.8 38.6% 14.7% 6.3x 16.4x
Craneware plc United Kingdom 28.19 -12% 751.7 701.0 62.1 18.8 30.2% 16.1% 11.3x 37.4x
HealthEquity, Inc. * United States 75.50 -9% 4,684.5 4,414.6 244.0 76.0 31.2% 28.6% 18.1x 58.1x
McKesson Corporation United States 125.60 -30% 25,091.2 34,431.2 209,913.0 3,930.0 1.9% 5.0% 0.2x 8.8x
Medidata Solutions, Inc. * United States 74.31 -16% 4,399.0 4,368.8 587.0 90.7 15.5% 15.2% 7.4x 48.2x
NantHealth, Inc. United States 3.23 -39% 350.7 501.0 89.8 (53.0) NM 12.2% 5.6x NM
Quality Systems, Inc. United States 20.13 -15% 1,292.1 1,309.5 533.3 40.5 7.6% 2.9% 2.5x 32.3x
Streamline Health Solutions, Inc. United States 1.25 -56% 23.9 33.3 24.7 0.7 2.8% -6.2% 1.3x 47.8x
Veeva Systems Inc. * United States 75.63 -11% 10,848.3 9,930.0 721.3 170.3 23.6% 23.5% 13.8x 58.3x
Adjusted Weighted Average 4.4x 15.0x
*Calculation is market cap weighted and excludes revenue multiples that are 2.0 standard deviations above the mean (14.1x)and EBITDA multiples that are 1.0 standard deviations above the mean (36.5x)
Financial & Credit/Risk Management Software
*Calculation is market cap weighted and excludes revenue multiples that are 2.0 standard deviations above the mean (15.9x)and EBITDA multiples that are 1.0 standard deviations above the mean (48.0x)

29 | M&A and Investment Summary July 2018
SoftwarePublic Company Valuation (2/3)
($ in Millions, except stock price data)
HR Software
Stock Price Chg % From Equity Ent. LTM LTM Margin LTM
Company Name Headquarters 07/31/18 52WK High Value Value Revenue EBITDA EBITDA Rev Growth EV/Rev EV/EBITDA
51job, Inc. China $91.77 -20% $ 5,717.6 $ 4,935.4 $ 494.1 $ 156.6 31.7% 28.7% 10.0x 31.5x
Benefitfocus, Inc. United States 30.10 -25% 956.0 1,023.9 267.0 0.5 0.2% 10.5% 3.8x NM
Castlight Health, Inc. United States 3.30 -45% 449.0 378.7 145.4 (52.5) NM 25.6% 2.6x NM
Ceridian HCM Holding Inc. United States 32.76 -23% 4,478.4 5,764.5 772.6 114.8 14.9% 0.0% 7.5x 50.2x
Cornerstone OnDemand, Inc. United States 49.40 -11% 2,850.0 2,769.3 503.5 (26.9) NM 15.6% 5.5x NM
DHI Group, Inc. United States 2.10 -35% 108.6 129.9 188.0 25.3 13.4% -12.8% 0.7x 5.1x
Domo, Inc. United States 16.61 -42% 414.5 438.7 116.2 (165.9) NM 0.0% 3.8x NM
Paycom Software, Inc. United States 106.25 -22% 6,275.5 6,242.6 498.0 117.6 23.6% 30.1% 12.5x 53.1x
Paylocity Holding Corporation * United States 58.00 -12% 3,053.9 2,924.4 357.0 31.1 8.7% 25.8% 8.2x 94.1x
Pluralsight, Inc. United States 23.21 -22% 1,460.4 1,996.3 193.9 (84.8) NM 0.0% 10.3x NM
The Ultimate Software Group, Inc. United States 276.89 -7% 8,638.9 8,463.7 1,035.5 110.0 10.6% 20.3% 8.2x 76.9x
Workday, Inc. United States 124.02 -11% 26,788.3 24,932.1 2,281.8 (170.4) NM 33.7% 10.9x NM
Adjusted Weighted Average 9.7x 55.7x
($ in Millions, except stock price data)
Security Software
Stock Price Chg % From Equity Ent. LTM LTM Margin LTM
Company Name Headquarters 07/31/18 52WK High Value Value Revenue EBITDA EBITDA Rev Growth EV/Rev EV/EBITDA
Absolute Software Corporation Canada $5.64 -17% $ 227.0 $ 195.4 $ 92.7 $ 14.1 15.2% 3.0% 2.1x 13.9x
Check Point Software Technologies Ltd. Israel 112.67 -5% 17,600.6 15,918.8 1,880.7 945.3 50.3% 4.0% 8.5x 16.8x
Cisco Systems, Inc. United States 42.29 -9% 198,884.9 172,591.9 48,619.0 14,494.0 29.8% 0.2% 3.5x 11.9x
Cheetah Mobile Inc. China 8.52 -53% 1,194.5 800.7 785.7 115.6 14.7% 6.2% 1.0x 6.9x
CyberArk Software Ltd. Israel 60.71 -13% 2,189.3 1,863.9 274.4 27.4 10.0% 20.0% 6.8x 68.0x
FireEye, Inc. United States 15.53 -20% 2,928.7 2,831.6 776.4 (142.5) NM 4.7% 3.6x NM
Fortinet, Inc. United States 62.91 -17% 10,575.0 9,271.1 1,631.2 215.6 13.2% 17.9% 5.7x 43.0x
Gemalto N.V. Netherlands 58.37 0% 5,279.7 6,084.3 3,568.3 427.3 12.0% -5.0% 1.7x 14.2x
Imperva, Inc. United States 46.25 -20% 1,604.6 1,210.1 344.0 5.4 1.6% 17.2% 3.5x NM
Juniper Networks, Inc. United States 26.34 -12% 9,196.7 8,211.7 4,784.0 918.7 19.2% -8.0% 1.7x 8.9x
Mimecast Limited * United Kingdom 35.91 -23% 2,142.7 2,078.6 261.9 13.2 5.0% 40.4% 7.9x 157.2x
Palo Alto Networks, Inc. United States 198.26 -10% 18,414.4 17,337.0 2,124.1 (20.2) NM 28.5% 8.2x NM
Proofpoint, Inc. United States 114.05 -12% 5,838.1 5,908.1 611.5 (37.7) NM 37.6% 9.7x NM
SecureWorks Corp. United States 12.82 NA 1,047.4 971.2 480.4 (39.4) NM 8.3% 2.0x NM
Symantec Corporation United States 20.22 -41% 12,567.5 15,431.5 4,827.0 1,234.0 25.6% 12.0% 3.2x 12.5x
Tenable Holdings, Inc. United States 29.90 -12% 2,723.3 2,977.9 206.4 (43.0) NM 0.0% 14.4x NM
Trend Micro Incorporated Japan 58.89 -3% 8,105.2 6,823.3 1,427.0 489.2 34.3% 10.4% 4.8x 13.9x
VeriSign, Inc. United States 145.23 -9% 17,706.2 18,318.7 1,189.7 784.8 66.0% 3.4% 15.4x 23.3x
Zscaler, Inc. * United States 35.31 -20% 4,223.3 3,935.9 170.5 (28.9) NM 51.3% 23.1x NM
Adjusted Weighted Average 5.0x 14.5x
LTM Multiples
LTM Multiples
*Calculation is market cap weighted and excludes revenue multiples that are 2.0 standard deviations above the mean (14.4x)and EBITDA multiples that are 1.0 standard deviations above the mean (83.5x)
*Calculation is market cap weighted and excludes revenue multiples that are 2.0 standard deviations above the mean (18.1x)and EBITDA multiples that are 1.0 standard deviations above the mean (75.5x)

30 | M&A and Investment Summary July 2018
SoftwarePublic Company Valuation (3/3)
($ in Millions, except stock price data)
Engineering Software
Stock Price Chg % From Equity Ent. LTM LTM Margin LTM
Company Name Headquarters 07/31/18 52WK High Value Value Revenue EBITDA EBITDA Rev Growth EV/Rev EV/EBITDA
ANSYS, Inc. United States $168.88 -9% $ 14,188.8 $ 13,299.0 $ 1,124.7 $ 458.4 40.8% 10.7% 11.8x 29.0x
Dassault Systèmes SE France 149.56 -2% 38,891.2 36,501.2 3,859.8 1,050.9 27.2% 4.1% 9.5x 34.7x
PTC Inc. * United States 91.91 -9% 11,605.2 11,977.5 1,235.7 141.3 11.4% 7.8% 9.7x 84.8x
Synopsys, Inc. United States 89.43 -6% 13,326.0 13,283.7 2,938.3 532.1 18.1% 13.8% 4.5x 25.0x
Trimble Inc. United States 35.30 -23% 8,797.5 9,645.5 2,911.4 503.0 17.3% 19.2% 3.3x 19.2x
Adjusted Weighted Average 8.5x 30.1x
($ in Millions, except stock price data)
Infrastructure Software
Stock Price Chg % From Equity Ent. LTM LTM Margin LTM LTM Multiples
Company Name Headquarters 07/31/18 52WK High Value Value Revenue EBITDA EBITDA Rev Growth EV/Rev EV/EBITDA
Adobe Systems Incorporated United States $244.68 -7% $ 119,810.7 $ 115,360.7 $ 8,122.0 $ 2,912.7 35.9% 24.5% 14.2x 39.6x
Aurora Mobile Limited China 7.65 -22% 878.7 932.2 60.4 (12.5) NM 0.0% 15.4x NM
Atlassian Corporation Plc United Kingdom 72.41 -9% 16,944.9 16,031.1 874.0 4.5 0.5% 41.0% 18.3x NM
Bandwidth Inc. United States 35.04 -14% 620.8 564.0 185.1 18.7 10.1% 18.3% 3.0x 30.1x
CA, Inc. United States 44.21 0% 18,487.3 18,002.3 4,235.0 1,323.0 31.2% 4.9% 4.3x 13.6x
Cloudera, Inc. United States 13.39 -40% 1,984.4 1,555.1 390.6 (207.5) NM 37.5% 4.0x NM
Commvault Systems, Inc. * United States 64.90 -11% 2,968.2 2,506.5 709.6 16.0 2.3% 7.6% 3.5x 156.6x
DocuSign, Inc. United States 53.90 -19% 8,439.9 8,718.4 560.8 (267.3) NM 0.0% 15.5x NM
Dropbox, Inc. United States 26.77 -38% 10,718.6 10,042.6 1,175.2 (376.5) NM 30.6% 8.5x NM
Endurance International Group Holdings, Inc. United States 8.20 -25% 1,171.5 2,954.3 1,168.6 305.2 26.1% -0.2% 2.5x 9.7x
First Data Corporation United States 23.26 -4% 21,718.6 42,693.6 8,540.0 2,997.0 35.1% 8.0% 5.0x 14.2x
Hortonworks Inc. United States 17.42 -21% 1,377.0 1,287.6 284.9 (176.4) NM 43.1% 4.5x NM
IBM Corporation United States 144.93 -15% 132,287.5 166,289.5 80,771.0 17,033.0 21.1% 3.0% 2.1x 9.8x
Nutanix, Inc. United States 48.89 -25% 8,344.5 7,843.6 1,025.1 (299.5) NM 39.8% 7.7x NM
Okta, Inc. United States 49.65 -19% 5,293.0 5,005.8 291.3 (108.7) NM 61.1% 17.2x NM
Rapid7, Inc. United States 27.81 -18% 1,285.7 1,156.4 210.2 (46.0) NM 25.2% 5.5x NM
Pivotal Software, Inc. United States 22.95 -27% 5,902.2 5,257.4 544.0 (131.7) NM 0.0% 9.7x NM
salesforce.com, inc. United States 137.15 -8% 101,890.1 98,719.1 11,089.0 1,044.7 9.4% 25.0% 8.9x 94.5x
ServiceNow, Inc. United States 175.96 -10% 31,087.8 30,195.3 2,276.3 37.7 1.7% 38.5% 13.3x NM
Smartsheet Inc. United States 21.50 -34% 2,163.8 2,235.2 125.3 (49.9) NM 0.0% 17.8x NM
Synchronoss Technologies, Inc. United States 4.23 -75% 178.4 282.6 400.0 (20.8) NM 8.2% 0.7x NM
Talend S.A. France 59.15 -8% 1,752.7 1,658.5 162.5 (29.3) NM 40.0% 10.2x NM
Twilio Inc. United States 57.89 -11% 5,544.4 5,236.4 440.8 (63.2) NM 44.3% 11.9x NM
Varonis Systems, Inc. United States 59.78 -28% 1,718.7 1,560.0 244.1 (18.7) NM 32.4% 6.4x NM
Adjusted Weighted Average 8.8x 41.1x
LTM Multiples
*Calculation is market cap weighted and excludes revenue multiples that are 2.0 standard deviations above the mean (19.8x)and EBITDA multiples that are 1.0 standard deviations above the mean (98.9x)
*Calculation is market cap weighted and excludes revenue multiples that are 2.0 standard deviations above the mean (15.1x)and EBITDA multiples that are 1.0 standard deviations above the mean (65.0x)

31 | M&A and Investment Summary July 2018
Information
▪ Information activity in July remained consistent with the average monthly activity levels of the past 12 months with 13 transactions
reporting more than $3.7 billion in value
▪ The Financial Information and Healthcare Information subsegments accounted for 54 percent of activity throughout the month and
nearly 50 percent of total segment activity over the past twelve months
▪ Select transactions from the segment include:
• The 37 percent stake taken by CPP Investment Board and Technology Crossover Ventures in sports data company Sportradar from
EQT in a transaction valuing the company at $2.4 billion
• Fortive’s acquisition of construction cost data company The Gordian Group in a transaction valued at $775 million
• Small business legal solutions provider LegalZoom’s $500 million investment from Francisco Partners, GPI Capital, Franklin
Templeton Investments, and Neuberger Berman Investment Advisers
• The acquisition of specialty finance credit reporting agency and data provider DataX by Equifax
# % $MM % # $MM # $MM # $MM
Product/Price Information 4 31% 3,202.3 86% 2 775.0 1 2,400.0 1 27.3
Healthcare Information 3 23% $12.5 0% 1 - 1 - 1 $12.5
Financial Information 2 15% 1.7 0% 0 - 0 - 2 1.7
Legal Information 2 15% 500.0 13% 1 - 0 - 1 500.0
Credit/Risk Management Information 1 8% - 0% 1 - 0 - 0 -
Geo-Demo Information 1 8% 5.7 0% 0 - 0 - 1 5.7
Total 13 100% 3,722.2 100% 5 775.0 2 2,400.0 6 547.2
INFORMATION TRANSACTIONS BY SEGMENT BUYER/INVESTOR BREAKDOWN
Transactions Reported Value Strategic Buyout Venture/Growth Capital

32 | M&A and Investment Summary July 2018
InformationPublic Company Valuation (1/2)
($ in Millions, except stock price data)
Financial & Credit/Risk Management Information
Stock Price Chg % From Equity Ent. LTM LTM Margin LTM
Company Name Headquarters 07/31/18 52WK High Value Value Revenue EBITDA EBITDA Rev Growth EV/Rev EV/EBITDA
Broadridge Financial Solutions, Inc. United States $112.98 -6% $ 13,322.6 $ 14,173.5 $ 4,355.3 $ 821.7 18.9% 15.5% 3.3x 17.2x
Computershare Limited Australia 13.52 -3% 7,342.5 8,419.6 2,229.5 549.4 24.6% 9.8% 3.8x 15.3x
CoreLogic, Inc. United States 48.70 -13% 3,942.0 5,664.1 1,870.6 409.6 21.9% -2.2% 3.0x 13.8x
CoStar Group, Inc. * United States 415.85 -7% 15,133.2 14,167.0 1,072.3 286.5 26.7% 19.8% 13.2x 49.4x
The Dun & Bradstreet Corporation United States 125.89 -6% 4,668.6 5,827.5 1,779.2 501.7 28.2% 4.0% 3.3x 11.6x
Envestnet, Inc. * United States 58.60 -7% 2,649.6 3,028.7 723.9 85.2 11.8% 19.8% 4.2x 35.5x
Equifax Inc. United States 125.50 -14% 15,111.7 17,473.8 3,415.8 982.8 28.8% 3.7% 5.1x 17.8x
Experian plc Ireland 24.57 -4% 22,243.1 25,495.9 4,662.0 1,432.0 30.7% 7.5% 5.5x 17.8x
FactSet Research Systems Inc. United States 201.36 -7% 7,723.9 8,055.1 1,330.9 431.8 32.4% 12.6% 6.1x 18.7x
Fair Isaac Corporation United States 201.46 -5% 5,871.4 6,510.2 1,005.9 224.9 22.4% 10.0% 6.5x 28.9x
Fidelity National Information Services, Inc. United States 103.13 -6% 33,911.3 42,225.3 8,889.0 2,558.0 28.8% -3.0% 4.8x 16.5x
IHS Markit Ltd. United Kingdom 53.03 -2% 20,788.6 25,098.8 3,789.8 1,225.2 32.3% 13.2% 6.6x 20.5x
Moody's Corporation United States 171.12 -9% 32,837.9 36,746.2 4,530.2 2,136.3 47.2% 18.1% 8.1x 17.2x
Morningstar, Inc. United States 132.00 -6% 5,628.0 5,401.1 968.9 264.7 27.3% 14.4% 5.6x 20.4x
MSCI Inc. * United States 166.19 -6% 14,794.9 16,023.9 1,371.2 726.2 53.0% 14.4% 11.7x 22.1x
Reis, Inc. United States 21.35 -11% 247.0 230.8 47.8 7.9 16.6% 2.2% 4.8x 29.1x
S&P Global Inc. United States 200.44 -8% 50,410.7 53,669.7 6,277.0 3,072.0 48.9% 8.2% 8.6x 17.5x
SEI Investments Co. United States 59.94 -23% 9,400.2 8,706.7 1,604.7 468.3 29.2% 10.2% 5.4x 18.6x
SS&C Technologies Holdings, Inc. United States 53.07 -13% 12,635.4 14,547.9 2,174.3 659.1 30.3% 35.6% 6.7x 22.1x
Thomson Reuters Corporation Canada 41.45 -12% 29,320.6 36,589.9 11,381.0 2,527.0 22.2% 17.3% 3.2x 14.5x
Verisk Analytics, Inc. United States 110.62 -4% 18,220.0 20,865.3 2,301.9 1,045.4 45.4% 13.4% 9.1x 20.0x
Workiva Inc. United States 25.25 -9% 1,078.9 1,017.2 215.9 (42.4) NM 16.1% 4.7x NM
Adjusted Weighted Average 6.1x 18.0x
*Calculation is market cap weighted and excludes revenue multiples that are 2.0 standard deviations above the mean (11.4x)and EBITDA multiples that are 1.0 standard deviations above the mean (29.7x)
LTM Multiples

33 | M&A and Investment Summary July 2018
InformationPublic Company Valuation (2/2)
($ in Millions, except stock price data)
Marketing Information
Stock Price Chg % From Equity Ent. LTM LTM Margin LTM LTM Multiples
Company Name Headquarters 07/31/18 52WK High Value Value Revenue EBITDA EBITDA Rev Growth EV/Rev EV/EBITDA
Acxiom Corporation * United States $40.54 -9% $ 3,134.0 $ 3,221.2 $ 917.4 $ 95.1 10.4% 4.2% 3.5x 33.9x
Alliance Data Systems Corporation United States 224.88 -19% 12,458.3 33,132.1 7,806.7 1,772.5 22.7% 5.3% 4.2x 18.7x
Cello Health plc United Kingdom 1.62 -10% 169.5 167.4 228.8 16.2 7.1% 2.4% 0.7x 10.3x
Ebiquity plc United Kingdom 0.65 -59% 48.3 87.5 118.1 16.7 14.1% 4.6% 0.7x 5.2x
Harte Hanks, Inc. United States 10.12 -17% 63.4 50.3 370.2 4.8 1.3% -7.4% 0.1x 10.5x
InnerWorkings, Inc. United States 8.86 -26% 457.9 533.3 1,148.5 36.6 3.2% 5.6% 0.5x 14.6x
Intage Holdings Inc. Japan 10.35 -23% 425.7 350.8 475.5 51.3 10.8% 5.2% 0.7x 6.8x
Ipsos SA France 33.49 -16% 1,458.7 2,023.1 2,021.5 232.2 11.5% -2.8% 1.0x 8.7x
Nielsen Holdings plc United Kingdom 23.56 -45% 8,368.7 16,829.7 6,659.0 1,657.0 24.9% 4.1% 2.5x 10.2x
Pearson plc United Kingdom 12.12 -4% 9,392.0 10,514.4 5,714.8 749.5 13.1% -8.5% 1.8x 14.0x
System1 Group PLC United Kingdom 3.41 -70% 42.7 35.3 37.8 3.0 8.0% -13.7% 0.9x 11.7x
YouGov plc * United Kingdom 6.36 -3% 670.9 643.0 159.1 21.3 13.4% 14.2% 4.0x 30.1x
Adjusted Weighted Average 2.9x 14.4x
($ in Millions, except stock price data)
Other Information
Stock Price Chg % From Equity Ent. LTM LTM Margin LTM LTM Multiples
Company Name Headquarters 07/31/18 52WK High Value Value Revenue EBITDA EBITDA Rev Growth EV/Rev EV/EBITDA
Fluent, Inc. United States $ 2.35 -66% $ 176.8 $ 235.5 $ 227.1 $ (1.4) NM 15.5% 1.0x NM
Forrester Research, Inc. United States 46.25 -3% 831.8 695.4 344.8 31.5 9.1% 5.2% 2.0x 22.1x
Gartner, Inc. * United States 135.43 -5% 12,356.7 15,142.5 3,807.5 507.1 13.3% 38.6% 4.0x 29.9x
HealthStream, Inc. United States 28.08 -9% 907.1 741.5 254.6 29.0 11.4% 10.4% 2.9x 25.6x
IQVIA Holdings Inc. United States 121.94 -3% 24,703.4 34,759.4 8,475.0 1,786.0 21.1% 8.6% 4.1x 19.5x
Informa plc United Kingdom 10.35 -9% 12,949.3 16,568.4 2,374.3 749.2 31.6% 11.6% 7.0x 22.1x
National Research Corporation United States 37.95 -10% 933.9 898.5 118.3 38.0 32.1% 5.8% 7.6x 23.7x
NIC Inc. United States 16.40 -13% 1,090.8 928.5 347.2 86.5 24.9% 6.1% 2.7x 10.7x
Premier, Inc. United States 37.40 -4% 1,997.3 2,055.1 1,630.4 666.1 40.9% 20.5% 1.3x 3.1x
Proofpoint, Inc. * United States 114.05 -12% 5,838.1 5,908.1 611.5 (36.0) NM 37.5% 9.7x NM
Reed Elsevier plc(1) United Kingdom 21.80 -6% 42,969.3 51,219.6 9,637.7 2,930.6 30.4% -0.5% 5.3x 17.5x
Wolters Kluwer N.V. Netherlands 60.34 -3% 16,537.1 18,963.1 4,984.2 1,402.4 28.1% -3.2% 3.8x 13.5x
Adjusted Weighted Average 4.8x 17.7x
*Calculation is market cap weighted and excludes revenue multiples that are 2.0 standard deviations above the mean (4.7x)and EBITDA multiples that are 1.0 standard deviations above the mean (23.5x)
(1) All financials are representative of the Reed Elsevier combined businesses, except per stock data, which represents Reed Elsevier (LSE:REL)
*Calculation is market cap weighted and excludes revenue multiples that are 2.0 standard deviations above the mean (9.6x)and EBITDA multiples that are 1.0 standard deviations above the mean (26.6x)

34 | M&A and Investment Summary July 2018
Business & IT Services
▪ The Business & IT Services segment announced 96 transactions in July worth nearly $5.9 billion in value
▪ IT Consulting transactions accounted for 55 percent of all transactions throughout the month with 53 deals announced
▪ The 78 strategic transactions announced in the segment was the largest single month total of the past 12 months
▪ In addition to Atos’ pending $3.6 billion acquisition of Syntel, select transaction from the segment include:
• The acquisition of SWC Technology Partners, an award-winning IT solutions provider to middle market companies in the Midwest, byBDO USA (A Petsky Prunier-led transaction)
• Getronics Group’s $815 million acquisition of enterprise-level infrastructure services provider Pomeroy Group from Clearlake Capital
• ABRY Partners’ sale of IT and managed services provider Basefarm to Orange Business Services for a reported $409 million
• SDL’s acquisition of Donnelley Financial Solutions’ translation services division Donnelley Language Solutions for $78 million
• The $50 million acquisition of technology services provider Intellinet Corporation by Vietnam-based FPT Software
• UDG Healthcare’s acquisition of pharmaceutical commercialization consulting firm Smart Analyst for $24 million
• Marlin Equity Partners’ acquisition of NCC Group’s software testing business
# % $MM % # $MM # $MM # $MM
IT Consulting 53 55% $1,424.9 24% 47 $1,406.9 4 - 2 $18.0
Corporate Training 21 22% 475.5 8% 12 20.8 1 - 8 454.7
Healthcare Consulting 7 7% 24.0 0% 6 24.0 0 - 1 -
BPO 3 3% 3,618.2 62% 3 3,618.2 0 - 0 -
Staffing 3 3% - 0% 3 - 0 - 0 -
Financial Consulting 2 2% - 0% 1 - 0 - 1 -
HR Consulting 2 2% 326.2 6% 2 326.2 0 - 0 -
Other 5 5% 0.0 0% 4 0.0 1 0.0 0 0.0
Total 96 100% 5,868.7 100% 78 5,396.0 6 0.0 12 472.7
BUSINESS SERVICES TRANSACTIONS BY SEGMENT BUYER/INVESTOR BREAKDOWN
Transactions Reported Value Strategic Buyout Venture/Growth Capital

35 | M&A and Investment Summary July 2018
Business & IT ServicesPublic Company Valuation (1/3)
($ in Millions, except stock price data)
Consulting
Stock Price Chg % From Equity Ent. LTM LTM Margin LTM
Company Name Headquarters 07/31/18 52WK High Value Value Revenue EBITDA EBITDA Rev Growth EV/Rev EV/EBITDA
Accenture plc Ireland 159.33 -6% $ 102,090.4 $ 98,542.5 $ 38,573.6 $ 6,276.1 16.3% 12.8% 2.6x 15.7x
CRA International, Inc. * United States 54.12 -8% 436.1 435.6 393.4 28.2 7.2% 14.7% 1.1x 15.5x
FTI Consulting, Inc. United States 78.96 -2% 2,943.4 3,198.5 1,926.5 252.5 13.1% 8.8% 1.7x 12.7x
Information Services Group, Inc. United States 4.10 -11% 181.8 262.9 271.9 23.7 8.7% 16.6% 1.0x 11.1x
Navigant Consulting, Inc. United States 21.76 -16% 983.3 1,161.0 950.5 125.7 13.2% 0.2% 1.2x 9.2x
ICF International, Inc. United States 73.65 -9% 1,385.1 1,597.3 1,253.6 111.2 8.9% 4.6% 1.3x 14.4x
Huron Consulting Group Inc. United States 43.65 -10% 938.0 1,280.3 753.5 90.3 12.0% 3.0% 1.7x 14.2x
The Hackett Group, Inc. United States 18.03 -6% 530.2 525.6 265.7 41.4 15.6% 1.0% 2.0x 12.7x
Adjusted Weighted Average 1.5x 12.3x
($ in Millions, except stock price data)
HR Services
Stock Price Chg % From Equity Ent. LTM LTM Margin LTM
Company Name Headquarters 07/31/18 52WK High Value Value Revenue EBITDA EBITDA Rev Growth EV/Rev EV/EBITDA
Automatic Data Processing, Inc. United States 134.99 -5% $ 59,466.1 $ 59,174.9 $ 13,325.8 $ 2,918.1 21.9% 7.6% 4.4x 20.3x
Barrett Business Services, Inc. United States 91.88 -7% 671.5 651.4 934.4 38.4 4.1% 8.7% 0.7x 17.0x
Capita plc United Kingdom 2.12 -76% 3,518.4 5,211.5 5,436.2 535.5 9.8% -5.1% 1.0x 9.7x
DHI Group, Inc. United States 2.10 -35% 108.6 129.9 188.0 27.2 14.5% -12.8% 0.7x 4.8x
Edenred SA France 39.40 -3% 9,362.3 10,912.9 1,512.1 536.7 35.5% 8.5% 7.2x 20.3x
Insperity, Inc. * United States 95.10 -11% 3,994.8 3,742.6 3,558.7 177.2 5.0% 14.4% 1.1x 21.1x
Marsh & McLennan Companies, Inc. United States 83.36 -5% 42,095.1 47,392.1 14,760.0 3,505.0 23.7% 9.4% 3.2x 13.5x
Paychex, Inc. United States 69.02 -6% 24,778.1 24,353.9 3,380.9 1,425.5 42.2% 7.3% 7.2x 17.1x
TriNet Group, Inc. United States 53.85 -10% 3,799.2 3,991.2 3,378.0 284.0 8.4% 5.9% 1.2x 14.1x
WageWorks, Inc. United States 52.80 -20% 2,092.8 1,445.2 461.7 91.7 19.9% 33.1% 3.1x 15.8x
Adjusted Weighted Average 4.4x 17.3x
*Calculation is market cap weighted and excludes revenue multiples that are 2.0 standard deviations above the mean (2.2x)and EBITDA multiples that are 1.0 standard deviations above the mean (14.5x)
*Calculation is market cap weighted and excludes revenue multiples that are 2.0 standard deviations above the mean (8.1x)and EBITDA multiples that are 1.0 standard deviations above the mean (20.5x)
LTM Multiples
LTM Multiples

36 | M&A and Investment Summary July 2018
Business & IT ServicesPublic Company Valuation (2/3)
($ in Millions, except stock price data)
IT Consulting
Stock Price Chg % From Equity Ent. LTM LTM Margin LTM LTM Multiples
Company Name Headquarters 07/31/18 52WK High Value Value Revenue EBITDA EBITDA Rev Growth EV/Rev EV/EBITDA
Accenture plc Ireland 159.33 -6% $ 102,090.4 $ 98,542.5 $ 38,573.6 $ 6,276.1 16.3% 12.8% 2.6x 15.7x
Amdocs Limited United States 67.58 -6% 9,632.5 9,114.6 3,952.0 746.1 18.9% 3.2% 2.3x 12.2x
Bechtle AG Germany 89.82 -2% 3,772.4 3,735.2 4,585.9 239.9 5.2% 16.6% 0.8x 15.6x
Booz Allen Hamilton Holding Corporation United States 47.27 -1% 6,737.0 8,389.3 6,295.7 620.5 9.9% 6.6% 1.3x 13.5x
Business & Decision SA France 9.06 -8% 71.4 107.3 255.5 5.9 NA -7.0% 0.4x 18.3x
Capgemini SE France 128.50 -8% 21,419.1 24,216.1 15,142.9 1,883.1 12.4% 3.3% 1.6x 12.9x
Cerner Corporation United States 62.08 -16% 20,599.0 20,123.2 5,148.9 1,311.6 25.5% 4.6% 3.9x 15.3x
CGI Group Inc. Canada 64.49 -4% 17,935.1 19,137.5 8,603.3 1,444.0 16.8% 4.6% 2.2x 13.3x
Cognizant Technology Solutions Corporation United States 81.50 -4% 47,750.8 43,693.8 15,512.0 3,203.0 20.6% 9.8% 2.8x 13.6x
ConvergeOne Holdings, Inc. United States 9.50 -5% 725.8 1,355.0 1,042.3 78.3 7.5% 0.0% 1.3x 17.3x
Digi International Inc. * United States 13.50 -8% 366.5 314.1 207.8 15.1 7.3% 11.1% 1.5x 20.8x
DXC Technology Company United States 84.74 -21% 24,062.0 30,143.0 24,556.0 5,019.0 20.4% 222.8% 1.2x 6.0x
Endava plc * United Kingdom 23.91 -9% 1,267.3 1,287.2 279.6 45.1 16.1% 0.0% 4.6x 28.6x
Globant S.A. * Luxembourg 55.44 -8% 1,982.2 1,942.3 444.4 59.8 13.5% 31.4% 4.4x 32.5x
Hexaware Technologies Limited India 6.79 -17% 2,014.7 1,909.0 610.9 96.5 15.8% 10.4% 3.1x 19.8x
International Business Machines Corporation United States 144.93 -15% 132,287.5 166,289.5 80,771.0 17,033.0 21.1% 3.0% 2.1x 9.8x
Infosys Limited India 19.92 -2% 43,497.7 40,086.0 11,119.0 2,977.0 26.8% 7.3% 3.6x 13.5x
ITS Group France 8.78 -2% 67.4 76.5 214.8 9.6 4.5% -5.2% 0.4x 8.0x
Larsen & Toubro Limited India 19.00 -11% 26,637.8 39,980.6 18,318.6 2,274.2 12.4% 10.5% 2.2x 17.6x
Navigant Consulting, Inc. United States 21.76 -16% 983.3 1,161.0 950.5 125.7 13.2% 0.2% 1.2x 9.2x
NTT Data Corporation Japan 11.38 -11% 15,954.4 19,532.1 19,416.1 2,899.9 14.9% 0.0% 1.0x 6.7x
Perficient, Inc. United States 26.32 -6% 922.7 973.2 487.6 57.0 11.7% 6.4% 2.0x 17.1x
Presidio, Inc. United States 13.96 -29% 1,293.4 2,153.7 2,821.0 216.8 7.7% -0.7% 0.8x 9.9x
Reply S.p.A. Italy 67.76 -3% 2,534.7 2,468.7 1,118.3 145.9 13.0% 12.1% 2.2x 16.9x
SQLi France 32.59 -40% 142.4 172.3 254.5 15.5 6.1% 11.0% 0.7x 11.1x
Syntel, Inc. United States 40.59 -1% 3,367.7 3,507.4 966.2 264.3 27.4% 3.7% 3.6x 13.3x
Tata Consultancy Services Limited * India 28.31 -4% 108,369.7 102,907.9 18,659.6 4,992.3 26.8% 8.1% 5.5x 20.6x
Wipro Limited India 4.04 -17% 18,179.2 15,200.6 8,008.0 1,483.3 18.5% -0.4% 1.9x 10.2x
Adjusted Weighted Average 2.4x 14.0x
*Calculation is market cap weighted and excludes revenue multiples that are 2.0 standard deviations above the mean (4.9x)and EBITDA multiples that are 1.0 standard deviations above the mean (20.9x)
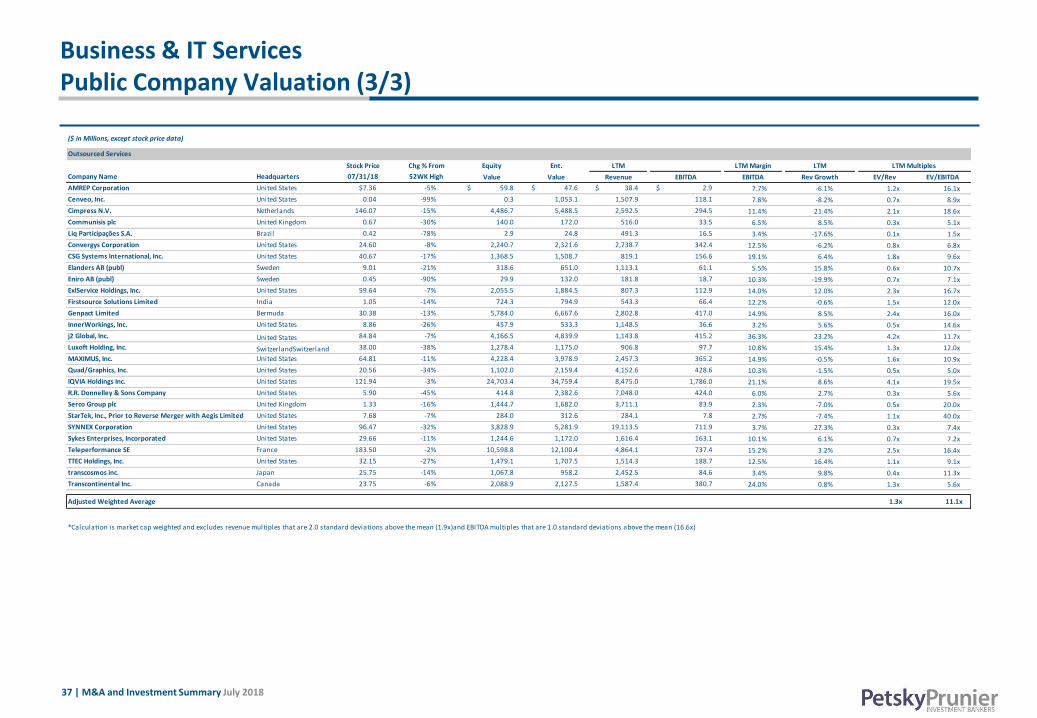
37 | M&A and Investment Summary July 2018
Business & IT ServicesPublic Company Valuation (3/3)
($ in Millions, except stock price data)
Outsourced Services
Stock Price Chg % From Equity Ent. LTM LTM Margin LTM LTM Multiples
Company Name Headquarters 07/31/18 52WK High Value Value Revenue EBITDA EBITDA Rev Growth EV/Rev EV/EBITDA
AMREP Corporation United States $7.36 -5% $ 59.8 $ 47.6 $ 38.4 $ 2.9 7.7% -6.1% 1.2x 16.1x
Cenveo, Inc. United States 0.04 -99% 0.3 1,053.1 1,507.9 118.1 7.8% -8.2% 0.7x 8.9x
Cimpress N.V. Netherlands 146.07 -15% 4,486.7 5,488.5 2,592.5 294.5 11.4% 21.4% 2.1x 18.6x
Communisis plc United Kingdom 0.67 -30% 140.0 172.0 516.0 33.5 6.5% 8.5% 0.3x 5.1x
Liq Participações S.A. Brazil 0.42 -78% 2.9 24.8 491.3 16.5 3.4% -17.6% 0.1x 1.5x
Convergys Corporation United States 24.60 -8% 2,240.7 2,321.6 2,738.7 342.4 12.5% -6.2% 0.8x 6.8x
CSG Systems International, Inc. United States 40.67 -17% 1,368.5 1,508.7 819.1 156.6 19.1% 6.4% 1.8x 9.6x
Elanders AB (publ) Sweden 9.01 -21% 318.6 651.0 1,113.1 61.1 5.5% 15.8% 0.6x 10.7x
Eniro AB (publ) Sweden 0.45 -90% 29.9 132.0 181.8 18.7 10.3% -19.9% 0.7x 7.1x
ExlService Holdings, Inc. United States 59.64 -7% 2,055.5 1,884.5 807.3 112.9 14.0% 12.0% 2.3x 16.7x
Firstsource Solutions Limited India 1.05 -14% 724.3 794.9 543.3 66.4 12.2% -0.6% 1.5x 12.0x
Genpact Limited Bermuda 30.38 -13% 5,784.0 6,667.6 2,802.8 417.0 14.9% 8.5% 2.4x 16.0x
InnerWorkings, Inc. United States 8.86 -26% 457.9 533.3 1,148.5 36.6 3.2% 5.6% 0.5x 14.6x
j2 Global, Inc. United States 84.84 -7% 4,166.5 4,839.9 1,143.8 415.2 36.3% 23.2% 4.2x 11.7x
Luxoft Holding, Inc. SwitzerlandSwitzerland 38.00 -38% 1,278.4 1,175.0 906.8 97.7 10.8% 15.4% 1.3x 12.0x
MAXIMUS, Inc. United States 64.81 -11% 4,228.4 3,978.9 2,457.3 365.2 14.9% -0.5% 1.6x 10.9x
Quad/Graphics, Inc. United States 20.56 -34% 1,102.0 2,159.4 4,152.6 428.6 10.3% -1.5% 0.5x 5.0x
IQVIA Holdings Inc. United States 121.94 -3% 24,703.4 34,759.4 8,475.0 1,786.0 21.1% 8.6% 4.1x 19.5x
R.R. Donnelley & Sons Company United States 5.90 -45% 414.8 2,382.6 7,048.0 424.0 6.0% 2.7% 0.3x 5.6x
Serco Group plc United Kingdom 1.33 -16% 1,444.7 1,682.0 3,711.1 83.9 2.3% -7.0% 0.5x 20.0x
StarTek, Inc., Prior to Reverse Merger with Aegis Limited United States 7.68 -7% 284.0 312.6 284.1 7.8 2.7% -7.4% 1.1x 40.0x
SYNNEX Corporation United States 96.47 -32% 3,828.9 5,281.9 19,113.5 711.9 3.7% 27.3% 0.3x 7.4x
Sykes Enterprises, Incorporated United States 29.66 -11% 1,244.6 1,172.0 1,616.4 163.1 10.1% 6.1% 0.7x 7.2x
Teleperformance SE France 183.50 -2% 10,598.8 12,100.4 4,864.1 737.4 15.2% 3.2% 2.5x 16.4x
TTEC Holdings, Inc. United States 32.15 -27% 1,479.1 1,707.5 1,514.3 188.7 12.5% 16.4% 1.1x 9.1x
transcosmos inc. Japan 25.75 -14% 1,067.8 958.2 2,452.5 84.6 3.4% 9.8% 0.4x 11.3x
Transcontinental Inc. Canada 23.75 -6% 2,088.9 2,127.5 1,587.4 380.7 24.0% 0.8% 1.3x 5.6x
Adjusted Weighted Average 1.3x 11.1x
*Calculation is market cap weighted and excludes revenue multiples that are 2.0 standard deviations above the mean (1.9x)and EBITDA multiples that are 1.0 standard deviations above the mean (16.6x)

38 | M&A and Investment Summary July 2018
PPLLC IndicesValuation Summary
Public Company Index MEAN MEDIAN W. AVG ADJ. W. AVG*
US-based Digital Media and Internet 4.5x 3.3x 6.2x 3.8x
Internationally-based Digital Media and Internet 4.2x 3.2x 5.6x 3.4x
US-based eCommerce 4.0x 2.4x 4.8x 3.0x
Internationally-based eCommerce 6.5x 1.5x 12.1x 2.5x
US-based Digital Advertising 4.3x 2.9x 7.3x 2.8x
Internationally-based Digital Advertising 3.2x 1.4x 10.3x 2.3x
US-based Marketing Technology 6.4x 5.9x 6.8x 4.7x
Internationally-based Marketing Technology 6.2x 4.5x 6.1x 5.4x
Agency 1.2x 1.3x 1.4x 1.4x
Marketing Services 1.8x 1.1x 3.5x 2.8x
Traditional Media 4.5x 2.5x 4.2x 3.6x
Software 7.0x 6.4x 7.0x 6.9x
Information 4.8x 4.1x 7.0x 6.6x
Business Services 1.4x 1.1x 2.7x 2.2x
As of close of business on 07/31/18
Current Summary Trading Valuation Information
Revenue Multiples (TTM)
*Calculation is market cap weighted and excludes revenue multiples that are 3 standard deviations above the mean and EBITDA multiples that are 2
standard deviations above the mean

39 | M&A and Investment Summary July 2018
PPLLC IndicesValuation Summary
Public Company Index MEAN MEDIAN W. AVG ADJ. W. AVG*
US-based Digital Media and Internet 22.7x 21.6x 15.2x 23.9x
Internationally-based Digital Media and Internet 16.9x 16.0x 14.8x 16.0x
US-based eCommerce 23.4x 18.8x 24.3x 15.7x
Internationally-based eCommerce 20.2x 19.4x 26.4x 17.9x
US-based Digital Advertising 37.1x 35.0x 19.9x 18.7x
Internationally-based Digital Advertising 11.3x 6.5x 6.5x 13.6x
US-based Marketing Technology 45.9x 32.6x 31.7x 22.0x
Internationally-based Marketing Technology 42.1x 14.9x 27.5x 19.4x
Agency 10.7x 8.9x 8.8x 8.5x
Marketing Services 12.3x 9.6x 17.9x 12.7x
Traditional Media 14.9x 11.3x 12.8x 11.6x
Software 30.5x 21.8x 23.3x 19.0x
Information 19.9x 17.8x 25.2x 18.1x
Business Services 12.2x 12.4x 14.4x 13.0x
As of close of business on 07/31/18
Current Summary Trading Valuation Information
EBITDA Multiples (TTM)
*Calculation is market cap weighted and excludes revenue multiples that are 3 standard deviations above the mean and EBITDA multiples that are 2
standard deviations above the mean

40 | M&A and Investment Summary July 2018
Marketing Technology
Digital Advertising
PPLLC IndicesLTM Share Pricing Trends
LTM Index Performance
• S&P 500 – 13.7 %
• Digital Media/Commerce – 29.3 %
• Traditional Media – (2.9 %)
LTM Index Performance
• S&P 500 – 13.7 %
• Marketing Technology – 13.2 %
LTM Index Performance
• S&P 500 – 13.7 %
• Digital Advertising – 26.2 %
LTM Index Performance
• S&P 500 – 13.7 %
• Agency – (13.8 %)
• Marketing Services – 12.2 %
Digital Media/Commerce and Traditional Media
Software LTM Index Performance
• S&P 500 – 13.7 %
• Software – 16.5 %
Agency & Marketing Services
Information & Business Services LTM Index Performance
• S&P 500 – 13.7 %
• Information – 14.1 %
• Business Services – 16.6 %
v
Note: LTM as of 7/31/2018
v
80%
95%
110%
125%
140%
155%
170%
Aug-17 Oct-17 Dec-17 Feb-18 Apr-18 Jun-18
Ind
ex P
erfo
rman
ce (
%)
Traditional Media S&P 500 Index (^SPX) Digital Media/Commerce
80%
90%
100%
110%
120%
130%
140%
150%
Aug-17 Oct-17 Dec-17 Feb-18 Apr-18 Jun-18
Ind
ex P
erfo
rman
ce (
%)
Digital Advertising S&P 500 Index (^SPX)
80%
90%
100%
110%
120%
130%
140%
150%
Aug-17 Oct-17 Dec-17 Feb-18 Apr-18 Jun-18
Ind
ex P
erfo
rman
ce (
%)
Marketing Technology S&P 500 Index (^SPX)
80%
90%
100%
110%
120%
130%
140%
150%
Aug-17 Oct-17 Dec-17 Feb-18 Apr-18 Jun-18
Ind
ex P
erfo
rman
ce (
%)
Agency Marketing Services S&P 500 Index (^SPX)
80%
90%
100%
110%
120%
130%
140%
150%
Aug-17 Oct-17 Dec-17 Feb-18 Apr-18 Jun-18
Ind
ex P
erfo
rman
ce (
%)
Software S&P 500 Index (^SPX)
80%
90%
100%
110%
120%
130%
140%
150%
Aug-17 Oct-17 Dec-17 Feb-18 Apr-18 Jun-18
Ind
ex P
erfo
rman
ce (
%)
Information Business Services S&P 500 Index (^SPX)

41 | M&A and Investment Summary July 2018
All Segments($ in Millions)
Strategic TransactionsStrategicValues Disclosed Target Target Segment Buyer/Investor Reported TV
Syntel , Inc. Bus iness Services Atos SE 3,540.7$ Charles River Development Information State Street Corporation 2,600.0 Acxiom Marketing Solutions Unit Agency & Marketing Services Interpubl ic Group of Companies , Inc. 2,300.0 IRI Agency & Marketing Services Partners Group 2,000.0 Accruent LLC Software Fortive Corporation 2,000.0 Fa i rfax Media Ltd. Traditional Media Nine Enterta inment Co. 1,864.2 EZE Software Group LLC Software SS&C Technologies Holdings , Inc. 1,450.0 Bonnier Broadcasting Sweden AB Traditional Media Tel ia Company AB 1,149.8 Datorama, Inc. Marketing Technology Sales force.com 850.0 Pomeroy IT Solutions , Inc. Bus iness Services Getronics 815.0 The Gordian Group Information Fortive Corporation 775.0 Treasure Data, Inc. Software ARM Holdings plc 600.0 Basefarm AS Bus iness Services Orange Bus iness Services 409.8 LevelUp Digi ta l Advertis ing GrubHub, Inc. 390.0 MediaMonks B.V. Agency & Marketing Services S4 Capita l 350.3 Finanzcheck.de Digi ta l Advertis ing Scout24 AG 333.1 LIfeWorks Corporation Ltd. Bus iness Services Morneau Shepel l Ltd. 326.2 AwesomenessTV Digi ta l Media/Commerce Viacom, Inc. 300.0 PeopleDoc, Inc. Software Ultimate Software 300.0 Skymoons, Inc. Digi ta l Media/Commerce iQiyi .com 298.3 MetaPack Limited Software Stamps.com, Inc. 224.7 RLJ Enterta inment, Inc. Traditional Media Digi ta l Enterta inment Holdings LLC 195.2 10bis .Co.Il Ltd. Digi ta l Media/Commerce Takeaway.com 157.3 Prevoty, Inc. Software Imperva, Inc. 140.0 Purch, B2C Bus iness Divis ion Digi ta l Media/Commerce Future US, Inc. 132.5 4 Global Divis ions , GfK Group Marketing Technology Ipsos Group 122.6 Inmac Wstore S.A.S. Bus iness Services Bechtle AG 116.8 Quartz Media LLC Digi ta l Media/Commerce Uzabase, Inc. 110.0 Spookfish Limited Software EagleView Technologies , Inc. 101.9 Redkix, Inc. Software Facebook 100.0 Icebrg, Inc. Software Gigamon, Inc. 100.0 GoCater SAS Digi ta l Media/Commerce ezCater, Inc. 100.0 Solebit Labs Software Mimecast Ltd. 96.1 Giant Creative Strategy Agency & Marketing Services Huntsworth PLC 80.0 Donnel ley Language Solutions Bus iness Services SDL Plc 77.5 Zooz Mobi le Ltd. Software PayU Group 75.0 Fibaro Software Nice S.p.A. 73.0 MonDocteur SAS Digi ta l Advertis ing Doctol ib SAS 70.1 Student Loan Hero, Inc. Digi ta l Advertis ing Tree.com, Inc. 60.0 Create Group NYC Agency & Marketing Services UDG Healthcare plc 58.4 KeyDrive S.A. Digi ta l Media/Commerce Centra lNic Ltd. 55.0 Intel l inet, Corp. Bus iness Services FPT 50.0

42 | M&A and Investment Summary July 2018
All Segments($ in Millions)
Strategic TransactionsStrategicValues Disclosed Target Target Segment Buyer/Investor Reported TV
Bola Webinformatin GmbH Digi ta l Advertis ing Better Col lective A/S 42.4$ ComFree Commonsense Network, Inc. Digi ta l Advertis ing Purplebricks Group Plc 38.6 Syngin Technology LLC Software Wal lenius Wi lhelmsen ASA 31.4 Indus Software Technologies Pvt. Ltd. Software Ebix, Inc. 29.0 Bloomsbury AI Limited Marketing Technology Facebook 26.5 I-NEW Unified Mobi le Solutions Software cyan AG 25.0 Machinio, Inc. Digi ta l Media/Commerce Liquidi ty Services , Inc. 25.0 SmartAnalyst Bus iness Services UDG Healthcare plc 24.0 Ta l iance Group Software Altus Group Limited 23.0 Impact Mobi le, Inc. Digi ta l Advertis ing IMImobi le PLC 20.9 StudyBlue, Inc. Bus iness Services Chegg, Inc. 20.8 NightStay.in Digi ta l Advertis ing One97 Communications 20.0 Indigo Slate, Inc. Agency & Marketing Services Zensar Technologies Ltd. 18.0 Intego, Inc. Software Kape Technologies plc 16.0 Electronic Data Process ing PLC Software Kerridge Commercia l Systems Limited 15.8 The Door LLC Agency & Marketing Services Dolphin Enterta inment, Inc. 12.2 B2 Group S.a .R.L. Software Gresham Technologies plc 9.9 Technica l Associates Group Agency & Marketing Services Publ i tek Limited 8.4 Shire Systems Ltd. Software Elecosoft plc 8.4 LeapRate Digi ta l Advertis ing Catena Media 8.0 Figur8 Cloud Solutions Bus iness Services Al lCloud 8.0 iSYS RTS GmbH Bus iness Services Minda Industries Limited 7.3 TapInfluence, Inc. Marketing Technology IZEA, Inc. 7.0 PerfectCard DAC Software EML Payment Solutions Limited 7.0 DeeZee Digi ta l Media/Commerce CCC S.A. 6.8 That Lot Agency & Marketing Services Interpubl ic Group of Companies , Inc. 6.7 Sierra/Affini ty LLC Traditional Media Enterta inment One Ltd. 6.0 Zack Darl ing Creative Associates LLC Agency & Marketing Services Kush Bottles , Inc. 5.1 Chainl inks Lab, Inc. Software AXS Blockchain Solutions , Inc. 3.1

43 | M&A and Investment Summary July 2018
All Segments($ in Millions)
Strategic TransactionsStrategicUndisclosed Target Target Segment Buyer/Investor Reported TV
Arrow Digi ta l Agency & Marketing Services Softvis ion LLC -$ Avantine Agency & Marketing Services beon.Worldwide - Brand Integri ty, Inc. Agency & Marketing Services Reward Gateway - BzzAgent, Inc. Agency & Marketing Services PowerReviews, LLC - Catchi Limited Agency & Marketing Services Havas - Cl i fford French Agency & Marketing Services Endeavor LLC - Compdata Surveys & Consulting Agency & Marketing Services Salary.com, Inc. - Creative Sa les & Marketing Group, Inc. Agency & Marketing Services KeyImpact Sa les & Systems, Inc. - Cross fini ty Digi ta l As ia Pte. Ltd. Agency & Marketing Services oRo Co., Ltd. - East Media s rl Agency & Marketing Services Triboo Digi ta le S.r.l . - Everyday Influencers LLC Agency & Marketing Services United Ta lent Agency, Inc. - focus4media Agency & Marketing Services Mood Media Corporation - Fus ion Learning Limited Agency & Marketing Services Home Marketing Limited - Global Mind S.A. Agency & Marketing Services Dentsu Aegis Network, Inc. - Gyros i ty Projects LLC Agency & Marketing Services Stadiumred Group - Healthcircle Advertis ing Limited Agency & Marketing Services Fishawack Group of Companies - IEG LLC Agency & Marketing Services Engine Shop, LLC - Integrated Retai l Limited Agency & Marketing Services Vestcom International , Inc. - KingEcl ient SL Agency & Marketing Services J. Walter Thompson Company - Language Connect International Limited Agency & Marketing Services The Hut Group - Level 2 Des ign, Inc. Agency & Marketing Services Opus Events Agency - mai lcommerce GmbH Agency & Marketing Services Audience Serv GmbH - McVeigh Associates Ltd. Agency & Marketing Services Fourth Wal l Events , Inc. - Miss ion Media Limited Agency & Marketing Services Troika Media Group, Inc. - NexusEngage Ltd. Agency & Marketing Services NEARBUY Group - Octane Strategies , Inc. Agency & Marketing Services NATIONAL Publ ic Relations Inc. - Ontwice Interactive Services S.L. Agency & Marketing Services Alkemy SpA - PayerSciences LLC Agency & Marketing Services Publ icis Groupe S.A. - PR Vein LLC Agency & Marketing Services Marque Media - Publ ic Identi ty, Inc. (Japan) Agency & Marketing Services Nikkei , Inc. - RLA Col lective, Inc. Agency & Marketing Services Ruder Finn Group - SoftVu LLC Agency & Marketing Services LoyaltyExpress , Inc. - Squareweave Agency & Marketing Services Rabid Technologies Ltd. - Stel lar Loyalty, Inc. Agency & Marketing Services Cheetah Digi ta l - Stone Temple Consulting Agency & Marketing Services Perficient, Inc. - Tenzing Agency Pty. Ltd. Agency & Marketing Services Hoorah - The Arland Group Agency & Marketing Services Shaker Recruitment Marketing - Tyger Shark, Inc. Agency & Marketing Services Larche Communications , Inc. - userADgents SAS Agency & Marketing Services High Co. SA - Webcredible Agency & Marketing Services Inviqa Group Limited - Whitespace (Scotland) Limited Agency & Marketing Services Dentsu Aegis Network, Inc. - 360 Solutions (UK) Limited Bus iness Services Arrow Bus iness Communications Ltd -

44 | M&A and Investment Summary July 2018
All Segments($ in Millions)
Strategic TransactionsStrategicUndisclosed Target Target Segment Buyer/Investor Reported TV
3Ci Bus iness Services MAU Workforce Solutions -$ A Systems Bus iness Services Evernex SA - Accelero Digi ta l Solutions Ltd. Bus iness Services Aprose Solutions Ltd. - Adorable IO LLC Bus iness Services 8th Light, Inc. - Al l ied Bus iness Schools , Inc. Bus iness Services Real Estate Express - Alpine Achievement Systems, Inc. Bus iness Services Il luminate Education, Inc. - AMI-Partners , Inc. Bus iness Services Analysys Mason Limited - Arete Consulting Services , Inc. Bus iness Services Bluenet Technologies , Inc. - Ataata, Inc. Bus iness Services Mimecast Ltd. - Aureon HR Bus iness Services Oas is Outsourcing, Inc. - Azimuth Securi ty Bus iness Services L3 Technologies , Inc. - Bi tCraft Sp. Z o.o. Bus iness Services Netguru Spolka Z Orgraniczona - Blaze Studios Bus iness Services Baycentric LLC - Bra inConsult AG Bus iness Services T&N AG - Bruneau Group, Inc. Bus iness Services Epiq Systems, Inc. - CentreSource, Inc. Bus iness Services Gun.io, Inc. - Cloud-IT Bus iness Services ITCloud.ca - Coders4Africa , Inc. Bus iness Services Gebeya, Inc. - Codit Holding BVBA Bus iness Services Tel indus B.V. - Columbus, SAP Enterprise Resource Biz Unit Bus iness Services i tel l igence AG - Compass Cl inica l Consulting Bus iness Services Tier 1 Performance Solutions , LLC - DaLand Solutions LLC Bus iness Services Nutmeg State Financia l Credit Union - Fazzi Associates , Inc. Bus iness Services Mediware Information Systems, Inc. - Fishtree, Inc. Bus iness Services Fol lett Corporation - HL Trad SARL Bus iness Services Technicis Trans lation - HSE Offshore Limited Bus iness Services Remote Medica l International , Inc. - Indusa Technica l Corp. Bus iness Services Synoptek, Inc. - InfoHedge Technologies LLC Bus iness Services Thrive Networks , Inc. - Insti tute for the Advancement of Behaviora l Healthcare Bus iness Services Healthcare Made Practica l - IO Education LLC Bus iness Services Il luminate Education, Inc. - Iteach Bus iness Services Learners Edge - Lightspeed Technologies , Inc. Bus iness Services integraONE - Linchpin Labs Bus iness Services L3 Technologies , Inc. - Math Adventures Bus iness Services BYJU - Mavisystems Oy Bus iness Services Digia Plc - Mobi le Project Srl Bus iness Services Finlogic S.p.A. - Myrios S.R.L. Bus iness Services PITECO SpA - Northforge Innovations USA Inc. Bus iness Services IP Infus ion, Inc. - NotSoSecure Global Services Limited Bus iness Services Claranet Limited - Officine CST S.p.A. Bus iness Services Cerberus Capita l Management, LP - Onl ineforce Sweden AB Bus iness Services Wetai l AB - P3ople4u, Inc. Bus iness Services Yumeshin Holdings Co., Ltd. -

45 | M&A and Investment Summary July 2018
All Segments($ in Millions)
Strategic TransactionsStrategicUndisclosed Target Target Segment Buyer/Investor Reported TV
PGE Solutions Pte Ltd. Bus iness Services IT Group, Inc. -$ Powerstorm Technologies LLC Bus iness Services 10Pearls LLC - Quinso B.V. Bus iness Services ORBIS AG - REAN Cloud Bus iness Services Hitachi Vantara Corporation - Reasoning Mind, Inc. Bus iness Services Imagine Learning, Inc. - Red Ape Solutions Sdn Bhd Bus iness Services Omesti Berhad - Regulatory Profess ionals , Inc. Bus iness Services Premier Research International LLC - SchoolCity, Inc. Bus iness Services Il luminate Education, Inc. - SCSI International Bus iness Services TRIGO Group - Securestorm Ltd. Bus iness Services Falanx Group Ltd. - Sensata Limited Bus iness Services Excal ibur Communications Ltd. - Sentronex Limited Bus iness Services EACS Ltd. - Snowed in Studios , Inc. Bus iness Services Keywords Studios plc - Socrative, Inc. Bus iness Services Showbie, Inc. - SWC Technology Partners , Inc. Bus iness Services BDO USA, LLP - Telel ingua International Bus iness Services Technicis Technology - thinqonl ine Bus iness Services VIGA Ltd. - Town + Country Bus iness Services Care.com, Inc. - V-NEO, Inc. Bus iness Services GFT Technologies AG - Wi lkinson-Kent Consulting Pty Ltd. Bus iness Services AfterDark Technology Pty Ltd. - Xendo Holding B.V. Bus iness Services ProPharma Group - Yokozuna Data Bus iness Services Keywords Studios plc - Zielpuls GmbH Bus iness Services EDAG Engineering GmbH - Zumasys , Inc. Bus iness Services NexusTek, Inc. - Amazing Pixel Digi ta l Advertis ing Snack-Rede De Canais Ltda - Finty.com Digita l Advertis ing Credit Card Compare - Jobi Joba Digi ta l Advertis ing RegionsJob SAS - LOB, Inc. Digi ta l Advertis ing Rakuten, Inc. - Looking4Parking.com Digita l Advertis ing Manchester Ai rports Group plc. - Newly Pty Ltd. Digi ta l Advertis ing HealthcareLink Pty Ltd. - Rukkus , Inc. Digi ta l Advertis ing TickPick,LLC - Solar Power Rocks Digi ta l Advertis ing Wave Solar LLC - W4 Performance Ad Market Digi ta l Advertis ing Digi ta l Media Solutions - Widespace AB Digi ta l Advertis ing Sel lbranch AB - 42Floors , Inc. Digi ta l Media/Commerce Knotel , Inc. - ALIVE Digi ta l Media/Commerce TTC Protocol - Araba.com Digita l Media/Commerce Garaj Sepeti - Artplant AS Digi ta l Media/Commerce Toadman Interactive AB - Buster, Inc. Digi ta l Media/Commerce The BusBank - Cabfind Limited Digi ta l Media/Commerce CMAC Group - Cl ick&pay Digi ta l Media/Commerce Zaggle Prepaid Ocean Services Pvt. Ltd. - CQ-Rol l Ca l l Group Digi ta l Media/Commerce Fisca lNote, Inc. -

46 | M&A and Investment Summary July 2018
All Segments($ in Millions)
Strategic TransactionsStrategicUndisclosed Target Target Segment Buyer/Investor Reported TV
Curios i tyChina.com Digita l Media/Commerce Farfetch UK Limited -$ Feedo.cz Digi ta l Media/Commerce AGS 92 - FindMe Digi ta l Media/Commerce Tracker.com - FleetRight, Inc. Digi ta l Media/Commerce Never Idle LLC - Flubit Limited Digi ta l Media/Commerce MonetaryUnit.org - Galore, Inc. Digi ta l Media/Commerce Care.com, Inc. - HandyGames.com GmbH Digi ta l Media/Commerce THQ Nordic AB - Ideal e-Commerce Limited Digi ta l Media/Commerce Synertone Communication Corporation - Ideal Shopping Direct plc Digi ta l Media/Commerce Aurel ius Alpha Limited - Industria l Toys , Inc. Digi ta l Media/Commerce Electronic Arts , Inc. - MakeTime, Inc. Digi ta l Media/Commerce Xometry Inc. - Meditation Studio LLC Digi ta l Media/Commerce Muse (choosemuse.com) - Moola Systems Limited Digi ta l Media/Commerce JLT Employee Benefi ts - Noupe.com Digita l Media/Commerce JotForm, Inc. - Plexchat, Inc. Digi ta l Media/Commerce Warner Brothers Enterta inment, Inc. - Pressbox LLC Digi ta l Media/Commerce Procter & Gamble Company - Revenu8, Inc. Digi ta l Media/Commerce j2 Global , Inc. - Ris ing Star Games Digi ta l Media/Commerce Thunderful AB - Screen Junkies Digi ta l Media/Commerce FANDOM - Seismic Games, Inc. Digi ta l Media/Commerce Niantic, Inc. - StorageStuff.Bid LLC Digi ta l Media/Commerce StorageTreasures LLC - TechSwarms Digi ta l Media/Commerce Techendo - Tigon Mobi le Co., Ltd. Digi ta l Media/Commerce Longtu Korea, Inc. - Tomereta Digi ta l Media/Commerce NTT Docomo, Inc. - Trusted Labs , Inc. Digi ta l Media/Commerce Care.com, Inc. - United Games LLC/United League LLC Digi ta l Media/Commerce Investview, Inc. - UrbanYou Digi ta l Media/Commerce Oneflare Pty Ltd. - Veluxe, Inc. Digi ta l Media/Commerce GLAMSQUAD, Inc. - Wel l todo LLC Digi ta l Media/Commerce SensorRX, Inc. - YesMyWine Digi ta l Media/Commerce Sino Vis ion Worldwide Holdings Limited - DataX Ltd Information Equifax, Inc. - Globe Bus iness Media Group Information Law Bus iness Research Limited - Inform Information Systems Ltd. Information Profess ional Datasolutions , Inc. - SPR Global Technologies Ltd. Information RXB Healthcare Technologies Ltd. - Boostervi l le, Inc. Marketing Technology Beyond (getbeyond.com) - Botplan, Inc. Marketing Technology Hel loAlex, Inc. - Butter AI Corporation Marketing Technology Box, Inc. - Corr.BI Marketing Technology Celtinel - E-ISG Asset Intel l igence Marketing Technology AssetWorks , LLC - ELEAD1ONE Marketing Technology CDK Global LLC - EmotionReader Marketing Technology Kairos AR, Inc. - FanVictor.com Marketing Technology Ven Solutions -

47 | M&A and Investment Summary July 2018
All Segments($ in Millions)
Strategic TransactionsStrategicUndisclosed Target Target Segment Buyer/Investor Reported TV
FeedbackNow Marketing Technology Forrester Research, Inc. -$ Flowroute LLC Marketing Technology West Corporation - FSCWire Marketing Technology Issuer Direct Corporation - Handwriting.io Marketing Technology BlueSky ETO - HawXeye, Inc. Marketing Technology Bossa Nova Robotics - Hubee.tv Marketing Technology Alpha Networks S.A. - I l lumination Research LLC Marketing Technology Radius Global Market Research - Ins ightpool Marketing Technology TrendKite - Linkdex Marketing Technology Authori tas Ltd. - LiveBotter Marketing Technology Eloquant SA - Made by Mouses Marketing Technology Guapa E-commerce - Mobi logy, Inc. Marketing Technology ZephyrTel - National Research Center for Col lege & Univers i ty Admiss ions Marketing Technology ACT, Inc. - PeerApp Ltd. Marketing Technology ZephyrTel - Placeit Marketing Technology Envato Pty Ltd. - PowerBoutique Marketing Technology Oxatis SA - Stories .bi Marketing Technology Workday, Inc. - Uninsta l l .io Marketing Technology MaNaDr Mobi le Health - Union Metrics Software, Inc. Marketing Technology TrendKite - VoltDelta Marketing Technology ZephyrTel - 3C Deutschland GmbH Software Bertelsmann SE & Co. KGaA - Abacus Labs , Inc. Software Certi fy, Inc. - AblePlus Solutions Pvt. Ltd. Software OYO Rooms - Aces Health, Inc. Software Firs t Foundry, Inc. - Acumyn, Inc. Software Elekta AB - Adaware.com Software Claranova S.A. - Agribotix LLC Software AgEagle Aeria l Systems, Inc. - AiTech.net Software Evolve IP LLC - Alert Services Corporation Software HealthLink Dimens ions , LLC - Al ienVault, Inc. Software AT&T, Inc. - Al l i zhealth Pvt. Ltd. Software Vivant.me - Aptean, Inc. Software Superion LLC - Assemble Systems, Inc. Software Autodesk, Inc. - Avecto Limited Software Bomgar Corporation - Blue Software LLC Software Esko-Graphics bvba - Blue Yonder GmbH Software JDA Software Group, Inc. - Bra inloop AG Software Di l igent Corporation - Bus iness Animals s .r.o. Software VimVic.cz, s ro - Cafeteria Bus iness of Goodbox Software SmartQ - CapControls Software Certent, Inc. - Centi le Holdings B.V. Software Within Reach Group B.V. - CML Software Limited Software MRI Software LLC -

48 | M&A and Investment Summary July 2018
All Segments($ in Millions)
Strategic TransactionsStrategicUndisclosed Target Target Segment Buyer/Investor Reported TV
Compassmax Software SPOT Bus iness Systems, LLC. -$ Controle LLC Software Epiq Systems, Inc. - CRYPTO.com Software Monaco Technology - CyKick Labs Ltd. Software Safe-T Data Ltd. - Data443 Risk Mitigation, Inc. Software LandStar, Inc. - DeePhi Technology Co., Ltd. Software Xi l inx, Inc. - Dependable Global Solutions , Inc. Software Integri ty Appl ications Incorporated - DesertMicro, Inc. Software AMCS Group - Expernova Software Questel SAS - Flashnet SA Software ENGIE SA - FundAmerica LLC Software Prime Trust LLC - Gl impzIt Software Forrester Research, Inc. - Grizel la LLC Software Truckstop.com - Health eTools Software Population Health Innovations , Inc. - HealthCast, Inc. Software Identi ty Automation, Inc. - HighGround, Inc. Software YouEarnedIt, Inc. - Houserie, Inc. Software Overstock.com, Inc. - Humantech, Inc. Software Veloci tyEHS - IMSware.de Software RIB Software SE - Invenias Limited Software Bul lhorn, Inc. - Investor Force Holdings Software Investment Metrics - IronGrid Data Services LLC Software VideoAmp, Inc. - Just Intel l igence GmbH Software catinedo AG - Kogentix, Inc. Software Accenture plc - Libra Soft Software Five Degrees Solutions B.V. - Marsh ClearSight LLC Software Riskconnect, Inc. - Matrix Mi l l Ltd. Software Niantic, Inc. - Medi-App Software GlobalSpace Technologies Limited - Medica l Columbus AG Software Global Healthcare Exchange LLC - Miss ions Software Slack Technologies , Inc. - Mosaik Solutions , LLC Software j2 Global , Inc. - MWA Intel l igence, Inc. Software Konica Minolta Bus iness Solutions USA, Inc. - Nexos is , Inc. Software DataRobot Inc. - NueMD Software AdvancedMD Software, Inc. - Parentix B.V. Software Exact Holding N.V. - Pink Web Appl ications BV Software Visma AS - Podium Data, Inc. Software Ql ik Technologies , Inc. - Promob Software Solutions Software 20-20 Technologies , Inc. - Propsys Software MRI Software LLC - Redstone Soft Co., Ltd. Software Genians , Inc. - Res i trader Software Optimal Blue LLC - Robidus .nl Software Aegon N.V. -

49 | M&A and Investment Summary July 2018
All Segments($ in Millions)
Strategic TransactionsStrategicUndisclosed Target Target Segment Buyer/Investor Reported TV
SABIO GmbH Software Serviceware SE -$ Safe Banking Systems LLC Software Accuity.com - Sca leFT, Inc. Software Okta, Inc. - Segoni Futur Software Meusburger Georg GmbH & Co Kg - Si ft Securi ty, Inc. Software Netskope, Inc. - SimpleOrder Ltd. Software Upserve, Inc. - Stride.com Software Slack Technologies , Inc. - Swyx Solutions AG Software Within Reach Group B.V. - TC Technology Software SSP Innovations LLC - Tracks Inspector B.V. Software Magnet Forens ics , Inc. - Transparix Software B.V. Software Logis tyx Technologies LLC - TriTech Software Systems Software Superion LLC - Trusted Metrics , Inc. Software SolarWinds , Inc. - USA Payrol l , Inc. Software Asure Software, Inc. - viaDirect Solutions Software PlayMaker Health - VI-grade GmbH Software Spectris plc - Vi rtual Towns & Schools Software CivicPlus , Inc. - WayKonect Software TOTAL S.A. - Ynformed B.V. Software Royal HaskoningDHV - Zopper Software PhonePe Internet Private Limited - AdLine LLC Traditional Media Maer Group - Atomic Fiction Traditional Media Deluxe Enterta inment - Deutsche Pens ions Traditional Media Frankfurt Bus iness Media GmbH - Edi tions La Plage Traditional Media Hachette Livre SA - Fania Records and Publ ishing Traditional Media Concord Mus ic Group, Inc. - Ful l Fatham Five Traditional Media Talent-Web - Hectic Digi ta l LLC Traditional Media InVis ion Communications , Inc. - Incheba Expo Praha Traditional Media ABF a .s . - Loudoun Times-Mirror Traditional Media The Ogden Newspapers , Inc. - Mega-info Media Co., Ltd. Traditional Media Luenmei Quantum Co., Ltd. - National Speakers Bureau, Inc. Traditional Media Premiere Speakers Bureau - Red Star Outdoor Traditional Media Branded Cities Network LLC - Smart Rai l World Ltd. Traditional Media DVV Media Group GmbH - The Escapis t Traditional Media Enthus iast Gaming, Inc. - VStar Enterta inment Group Traditional Media Cirque du Solei l , Inc. -

50 | M&A and Investment Summary July 2018
All Segments($ in Millions)
Buyout Transactions Buyout DealsValues Disclosed Target Target Segment Buyer/Investor Reported TV
SUSE Software EQT Partners 2,540.0$ Sportradar AG Information CPP Investment Board 2,400.0 NAVEX Global Software BC Partners Limited 1,200.0 Affinion Insurance Solutions Agency & Marketing Services Mi l l Point Capita l LLC 550.0 Banking Circle A/S Software EQT Ventures 300.0 PIXOMONDO LLC Traditional Media Mayfa ir Equity Partners 65.0 SRAXmd Agency & Marketing Services Halyard Capita l 52.2 The Appointment Group Agency & Marketing Services Apiary Capita l 23.5
Buyout DealsUndisclosed Target Target Segment Buyer/Investor Reported TV
Brandt Information Services LLC Agency & Marketing Services NexPhase Capita l -$ Match Marketing Group Agency & Marketing Services Southfield Capita l Advisors - Muscle Up Marketing LLC Agency & Marketing Services Clearview Capita l , LLC - National Gi ft Card Corporation Agency & Marketing Services LaSal le Capita l Group, LP - PLI Card Markeing Solutions Agency & Marketing Services Platinum Equity, LLC - Fi loBlu S.P.A. Bus iness Services Ardian SA - Improving Holdings , LLC Bus iness Services Trini ty Hunt Partners - InfoCare Norge AS Bus iness Services Katalysator AS - Orchard Rock Ltd. Bus iness Services Mi lamber Ventures - Van Pool Transportation LLC Bus iness Services Audax Private Equity - Winxnet Inc. Bus iness Services The Rivers ide Company - Private Sport Shop SAS Digi ta l Media/Commerce Bridgepoint Capita l Limited - RBmedia Digi ta l Media/Commerce Kohlberg Kravis Roberts & Company L.P. - TBO Group Digi ta l Media/Commerce Standard Chartered Private Equity - CRF Health Information Genstar Capita l , LP - WMD Group GmbH Marketing Technology Pinova Capita l - ADS Data Systems, Inc. Software Bluff Point Associates - basys , Inc. Software Windrose Health Investors - Beel ine.com, Inc. Software New Mountain Capita l , LLC - Blockmint Technologies , Inc. Software SMC Ventures - Centri fy Corporation Software Thoma Bravo, Inc. - Genius Sports Group Limited Software Apax Partners L.P. - HomeZen, Inc. Software Breakout Capita l - Profess ional Systems Software & Technology LLC Software PennSpring Capita l - Therapy Brands Software Lightyear Capita l LLC - Yanzi Networks AB Software Pegasus Capita l Advisors , L. P. -
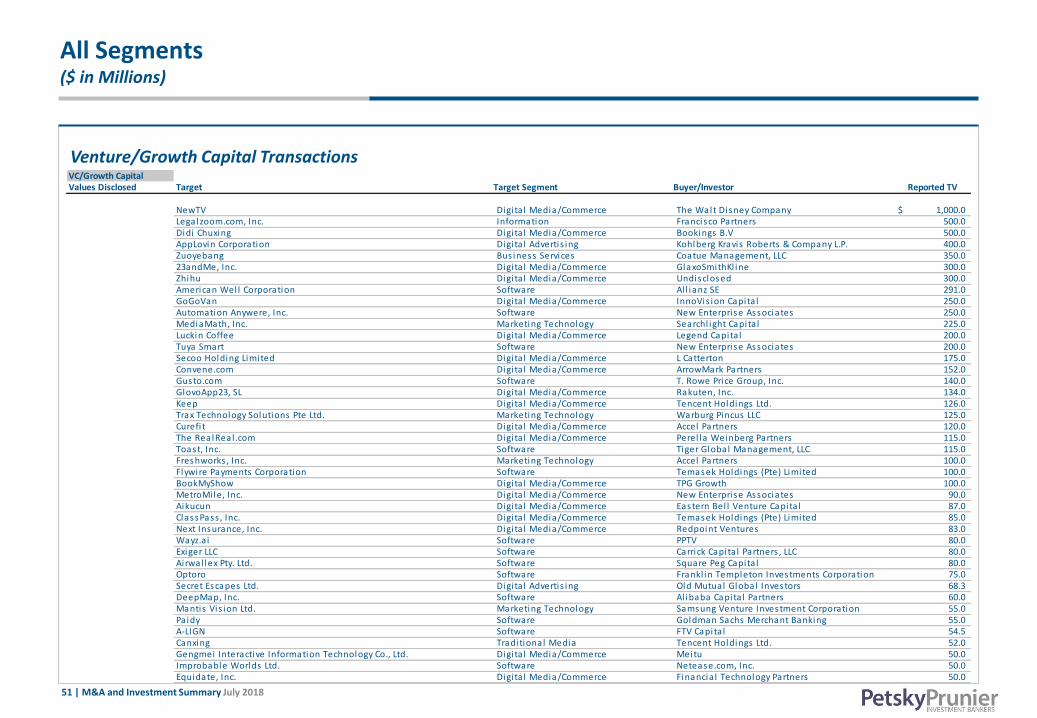
51 | M&A and Investment Summary July 2018
All Segments($ in Millions)
Venture/Growth Capital TransactionsVC/Growth CapitalValues Disclosed Target Target Segment Buyer/Investor Reported TV
NewTV Digi ta l Media/Commerce The Walt Disney Company 1,000.0$ Legalzoom.com, Inc. Information Francisco Partners 500.0 Didi Chuxing Digi ta l Media/Commerce Bookings B.V 500.0 AppLovin Corporation Digi ta l Advertis ing Kohlberg Kravis Roberts & Company L.P. 400.0 Zuoyebang Bus iness Services Coatue Management, LLC 350.0 23andMe, Inc. Digi ta l Media/Commerce GlaxoSmithKl ine 300.0 Zhihu Digi ta l Media/Commerce Undisclosed 300.0 American Wel l Corporation Software Al l ianz SE 291.0 GoGoVan Digi ta l Media/Commerce InnoVis ion Capita l 250.0 Automation Anywere, Inc. Software New Enterprise Associates 250.0 MediaMath, Inc. Marketing Technology Searchl ight Capita l 225.0 Luckin Coffee Digi ta l Media/Commerce Legend Capita l 200.0 Tuya Smart Software New Enterprise Associates 200.0 Secoo Holding Limited Digi ta l Media/Commerce L Catterton 175.0 Convene.com Digita l Media/Commerce ArrowMark Partners 152.0 Gusto.com Software T. Rowe Price Group, Inc. 140.0 GlovoApp23, SL Digi ta l Media/Commerce Rakuten, Inc. 134.0 Keep Digi ta l Media/Commerce Tencent Holdings Ltd. 126.0 Trax Technology Solutions Pte Ltd. Marketing Technology Warburg Pincus LLC 125.0 Curefi t Digi ta l Media/Commerce Accel Partners 120.0 The RealReal .com Digita l Media/Commerce Perel la Weinberg Partners 115.0 Toast, Inc. Software Tiger Global Management, LLC 115.0 Freshworks , Inc. Marketing Technology Accel Partners 100.0 Flywire Payments Corporation Software Temasek Holdings (Pte) Limited 100.0 BookMyShow Digita l Media/Commerce TPG Growth 100.0 MetroMi le, Inc. Digi ta l Media/Commerce New Enterprise Associates 90.0 Aikucun Digi ta l Media/Commerce Eastern Bel l Venture Capita l 87.0 ClassPass , Inc. Digi ta l Media/Commerce Temasek Holdings (Pte) Limited 85.0 Next Insurance, Inc. Digi ta l Media/Commerce Redpoint Ventures 83.0 Wayz.a i Software PPTV 80.0 Exiger LLC Software Carrick Capita l Partners , LLC 80.0 Ai rwal lex Pty. Ltd. Software Square Peg Capita l 80.0 Optoro Software Frankl in Templeton Investments Corporation 75.0 Secret Escapes Ltd. Digi ta l Advertis ing Old Mutual Global Investors 68.3 DeepMap, Inc. Software Al ibaba Capita l Partners 60.0 Mantis Vis ion Ltd. Marketing Technology Samsung Venture Investment Corporation 55.0 Pa idy Software Goldman Sachs Merchant Banking 55.0 A-LIGN Software FTV Capita l 54.5 Canxing Traditional Media Tencent Holdings Ltd. 52.0 Gengmei Interactive Information Technology Co., Ltd. Digi ta l Media/Commerce Meitu 50.0 Improbable Worlds Ltd. Software Netease.com, Inc. 50.0 Equidate, Inc. Digi ta l Media/Commerce Financia l Technology Partners 50.0

52 | M&A and Investment Summary July 2018
All Segments($ in Millions)
Venture/Growth Capital TransactionsVC/Growth CapitalValues Disclosed Target Target Segment Buyer/Investor Reported TV
Prescient Co., Inc. Software Eldridge Industries 50.0$ Dia lpad, Inc. Software Andreessen Horowitz 50.0 PPRO Financia l Ltd. Software PayPal , Inc. 50.0 Greenhouse Software, Inc. Software Riverwood Capita l , LLC 50.0 Monday.com Software Ins ight Venture Partners 50.0 League, Inc. Software TELUS Ventures 47.1 Meero Digi ta l Media/Commerce Alven Capita l Partners 45.0 Oas is Labs , Inc. Software Accel Partners 45.0 Grover Group GmbH Digi ta l Media/Commerce Circulari ty Capita l 43.3 GlobalWebIndex Marketing Technology Stripes Group 40.0 Gui ld Education, Inc. Software Bessemer Venture Partners 40.0 Culture Amp Pty Ltd. Software Blackbird Ventures 40.0 Even Respons ible Finance, Inc. Digi ta l Media/Commerce Khos la Ventures 40.0 Fastly, Inc. Software Swisscom Ventures 40.0 Movi le Marketing Technology Naspers Ltd. 40.0 Swift (Esports ) Traditional Media Bessemer Venture Partners 37.0 Cogito Corporation Marketing Technology Goldman Sachs Merchant Banking 37.0 Nurx, Inc. Digi ta l Media/Commerce Kleiner Perkins Caufield & Byers 36.0 DivvyPay, Inc. Software Ins ight Venture Partners 35.0 Volta Charging, Inc. Traditional Media Activate Capita l 35.0 Centivo, Inc. Digi ta l Media/Commerce Bain Capita l Ventures 34.0 Cosentia l , Inc. Marketing Technology JMI Equity 34.0 Ol ive, Inc. Software Oak HC/FT 32.8 Resca le, Inc. Software Ini tia l i zed Capita l 32.0 Galvanize, Inc. Bus iness Services Catalyst Investors , LLC 32.0 GrubMarket, Inc. Digi ta l Media/Commerce GGV Capita l 32.0 Verana Health, Inc. Software Google Ventures 30.0 Groundspeed Analytics , Inc. Software Oak HC/FT 30.0 Scandit AG Software Google Ventures 30.0 FinAccel Pte Ltd. Software Square Peg Capita l 30.0 Brat, Inc. Traditional Media Anchorage Capita l 30.0 Framebridge, Inc. Digi ta l Media/Commerce T. Rowe Price Group, Inc. 30.0 7Net Bus iness Services Sinovation Ventures 30.0 ThetaRay Software Jerusalem Venture Partners 30.0 C88 Financia l Technologies Pte Ltd. Digi ta l Advertis ing Experian plc 28.0 Patientco Holdings , Inc. Software Accel -KKR, LLC 28.0 Ski l l share, Inc. Digi ta l Media/Commerce Union Square Ventures 28.0 AnyVis ion Group Software Bosch Sicherheitssysteme GmbH 28.0 Nervos Network Software Sequoia Capita l 28.0 BIMobject AB Information EQT Ventures 27.3 Stem, Inc. Software BNP Paribas 26.0 Ta l ly Technologies , Inc. Digi ta l Media/Commerce Kleiner Perkins Caufield & Byers 25.0

53 | M&A and Investment Summary July 2018
All Segments($ in Millions)
Venture/Growth Capital TransactionsVC/Growth CapitalValues Disclosed Target Target Segment Buyer/Investor Reported TV
RFPIO, Inc. Marketing Technology K1 Investment Management, LLC 25.0$ Tractable Ltd. Software Ins ight Venture Partners 25.0 TransferMate Ltd. Software ING Group 24.6 Sess ionM, Inc. Marketing Technology Sales force Ventures 23.8 Espress ive, Inc. Software General Catalyst Partners LLC 23.0 Seeq Corporation Software Chevron Technology Ventures LLC 23.0 higi SH l lc Software Flare Capita l Partners 21.3 Digi ta l Moneybox Limited Digi ta l Media/Commerce Eight Roads Ventures 21.1 The Money Box Digi ta l Media/Commerce Eight Roads Ventures 21.1 Viz.Ai , Inc. Software Kleiner Perkins Caufield & Byers 21.0 Verodin, Inc. Software Bessemer Venture Partners 21.0 Unacademy Bus iness Services Sequoia Capita l India 21.0 ada-as ia .com Digita l Advertis ing Sumitomo Corporation 20.0 Simon Data, Inc. Marketing Technology Polaris Partners 20.0 EyeView, Inc. Marketing Technology Nauta Capita l 20.0 r4 Technologies , Inc. Software Pi lot Growth Equity Partners 20.0 Real i , Inc. Marketing Technology Zeev Ventures 20.0 Openpath Securi ty, Inc. Software Emergence Capita l Partners 20.0 Fever Labs , Inc. Digi ta l Advertis ing Accel Partners 20.0 PaySend Group Software Marcorp Financia l 20.0 Skyl ine AI Ltd. Software Sequoia Capita l 18.0 Tikin Media Traditional Media Sequoia Capita l 18.0 Tamr, Inc. Software New Enterprise Associates 18.0 Radi flow Ltd. Software ST Engineering Ventures 18.0 Albert Technologies Ltd. Digi ta l Advertis ing Hargreave Hale 18.0 LoginRadius , Inc. Marketing Technology ForgePoint Capita l 17.0 21Buttons App S.L. Digi ta l Media/Commerce Idinvest Partners 17.0 WindWard Software XL Innovate 16.5 Veridium, Inc. Software Citrix Systems, Inc. 16.5 Livible, Inc. Digi ta l Media/Commerce Global Logis tic Properties , Inc. 16.0 Naadam, Inc. Digi ta l Media/Commerce Vanterra Capita l 16.0 Pi -top Bus iness Services Hambro Perks 16.0 AntWorks Software SBI Investment 15.0 Ra iseMe Digi ta l Advertis ing Sales force Ventures 15.0 Brightpearl Ltd. Software Cipio Partners GmbH 15.0 PocketWatch, Inc. Digi ta l Media/Commerce Greycroft Partners LLC 15.0 Swing Education, Inc. Digi ta l Media/Commerce Google Ventures 15.0 Kyl igence, Inc. Software Eight Roads Ventures 15.0 AgotoZ Technology Software Northern Light Venture Capita l 15.0 Cloud9 Technologies LLC Software Barclays Capita l 14.0 Survata, Inc. Marketing Technology Industry Ventures , LLC 14.0 Siempl i fy Ltd. Software Jump Capita l 14.0
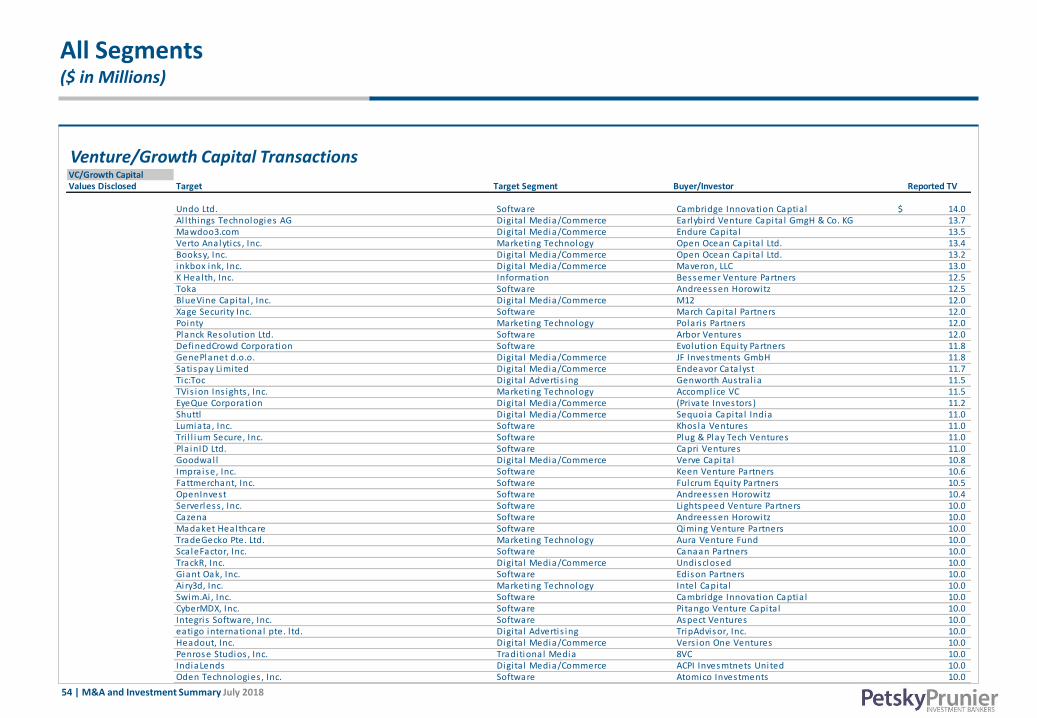
54 | M&A and Investment Summary July 2018
All Segments($ in Millions)
Venture/Growth Capital TransactionsVC/Growth CapitalValues Disclosed Target Target Segment Buyer/Investor Reported TV
Undo Ltd. Software Cambridge Innovation Captia l 14.0$ Al l things Technologies AG Digi ta l Media/Commerce Earlybird Venture Capita l GmgH & Co. KG 13.7 Mawdoo3.com Digita l Media/Commerce Endure Capita l 13.5 Verto Analytics , Inc. Marketing Technology Open Ocean Capita l Ltd. 13.4 Booksy, Inc. Digi ta l Media/Commerce Open Ocean Capita l Ltd. 13.2 inkbox ink, Inc. Digi ta l Media/Commerce Maveron, LLC 13.0 K Health, Inc. Information Bessemer Venture Partners 12.5 Toka Software Andreessen Horowitz 12.5 BlueVine Capita l , Inc. Digi ta l Media/Commerce M12 12.0 Xage Securi ty Inc. Software March Capita l Partners 12.0 Pointy Marketing Technology Polaris Partners 12.0 Planck Resolution Ltd. Software Arbor Ventures 12.0 DefinedCrowd Corporation Software Evolution Equity Partners 11.8 GenePlanet d.o.o. Digi ta l Media/Commerce JF Investments GmbH 11.8 Satispay Limited Digi ta l Media/Commerce Endeavor Catalyst 11.7 Tic:Toc Digi ta l Advertis ing Genworth Austra l ia 11.5 TVis ion Ins ights , Inc. Marketing Technology Accompl ice VC 11.5 EyeQue Corporation Digi ta l Media/Commerce (Private Investors ) 11.2 Shuttl Digi ta l Media/Commerce Sequoia Capita l India 11.0 Lumiata, Inc. Software Khos la Ventures 11.0 Tri l l ium Secure, Inc. Software Plug & Play Tech Ventures 11.0 Pla inID Ltd. Software Capri Ventures 11.0 Goodwal l Digi ta l Media/Commerce Verve Capita l 10.8 Impraise, Inc. Software Keen Venture Partners 10.6 Fattmerchant, Inc. Software Fulcrum Equity Partners 10.5 OpenInvest Software Andreessen Horowitz 10.4 Serverless , Inc. Software Lightspeed Venture Partners 10.0 Cazena Software Andreessen Horowitz 10.0 Madaket Healthcare Software Qiming Venture Partners 10.0 TradeGecko Pte. Ltd. Marketing Technology Aura Venture Fund 10.0 Sca leFactor, Inc. Software Canaan Partners 10.0 TrackR, Inc. Digi ta l Media/Commerce Undisclosed 10.0 Giant Oak, Inc. Software Edison Partners 10.0 Ai ry3d, Inc. Marketing Technology Intel Capita l 10.0 Swim.Ai , Inc. Software Cambridge Innovation Captia l 10.0 CyberMDX, Inc. Software Pitango Venture Capita l 10.0 Integris Software, Inc. Software Aspect Ventures 10.0 eatigo international pte. l td. Digi ta l Advertis ing TripAdvisor, Inc. 10.0 Headout, Inc. Digi ta l Media/Commerce Vers ion One Ventures 10.0 Penrose Studios , Inc. Traditional Media 8VC 10.0 IndiaLends Digi ta l Media/Commerce ACPI Invesmtnets United 10.0 Oden Technologies , Inc. Software Atomico Investments 10.0

55 | M&A and Investment Summary July 2018
All Segments($ in Millions)
Venture/Growth Capital TransactionsVC/Growth CapitalValues Disclosed Target Target Segment Buyer/Investor Reported TV
Unify Square, Inc. Bus iness Services Primepulse 10.0$ SentryHealth Software OCA Ventures 9.5 Smarter Sorting Software Undisclosed 9.3 Get Spi ffy, Inc. Digi ta l Media/Commerce Bul l Ci ty Venture Partners 9.0 Klang Games GmbH Digi ta l Media/Commerce Northzone 9.0 Journera, Inc. Software Andreessen Horowitz 9.0 Aurora Labs Software Fraser McCombs Ventures 8.4 Molson Group Ld. Digi ta l Media/Commerce Bus iness Growth Fund plc 8.3 CrowdStreet, Inc. Software Grotech Ventures 8.0 snap40 Ltd. Software Accelerated Digi ta l Ventures 8.0 EV Connect Software Montage Capita l 8.0 Al lCloud Bus iness Services Hal lett Capita l 8.0 Happeo Company Oy Software DN Capita l 8.0 LoanSnap Holdings , Inc. Software True Ventures 8.0 Bizzy Indones ia Digi ta l Advertis ing Sinar Mas Indones ia 8.0 productboard, Inc. Marketing Technology Kleiner Perkins Caufield & Byers 8.0 Vi rtudent, Inc. Software .406 Ventures , LLC 8.0 MEDUX Marketing Technology Sonae Investment Management 8.0 SkinVis ion B.V. Digi ta l Media/Commerce LEO Pharma 7.6 LogicGate, Inc. Software Jump Capita l 7.5 TrueLayer Ltd. Software Northzone 7.5 OCTI, Inc. Digi ta l Media/Commerce Shasta Ventures 7.5 Chartbeat, Inc. Marketing Technology North Atlantic Capita l Corporation 7.0 HealthCrowd Software TVC Capita l , LLC 7.0 Cl ick Therapeutics , Inc. Digi ta l Media/Commerce Sanofi Ventures 7.0 Zorroa Corporation Marketing Technology Gradient Ventures 7.0 Blast.com Digita l Media/Commerce CreditEase 7.0 Mention Me Ltd. Agency & Marketing Services Eight Roads Ventures 7.0 Trigo Vis ion Ltd. Marketing Technology Hetz Ventures 7.0 Rimidi , Inc. Software Cox Enterprises , Inc. 6.6 Blavi ty, Inc. Digi ta l Media/Commerce Google Ventures 6.5 Eventbase Technology, Inc. Marketing Technology Madrona Venture Group 6.5 QC Ware Corp. Software Goldman Sachs Merchant Banking 6.5 Tradeteq Limited Software Accelerated Digi ta l Ventures 6.3 Outl ier AI, Inc. Marketing Technology Ridge Ventures 6.2 LoanTap Financia l Technologies Pvt. Ltd. Digi ta l Media/Commerce Shunwei Capita l 6.2 Seatfrog Ops Ltd. Digi ta l Media/Commerce Octopus Ventures , LLC 6.0 Ol io Exchange Ltd. Digi ta l Media/Commerce Accel Partners 6.0 Oura Health Oy Digi ta l Media/Commerce Bold Capita l Parnters 5.8 Ursa Space Systems, Inc. Information RRE Ventures LLC 5.7 Armored Things , Inc. Software iNovia Capita l 5.5 Standard Cognition Corporation Marketing Technology CRV 5.5

56 | M&A and Investment Summary July 2018
All Segments($ in Millions)
Venture/Growth Capital TransactionsVC/Growth CapitalValues Disclosed Target Target Segment Buyer/Investor Reported TV
PactSafe, Inc. Software Mercury Fund 5.5$ Instant Magazine Marketing Technology Newion Investments 5.4 Kindly Care, Inc. Digi ta l Advertis ing Javel in Venture Partners 5.4 ParkCloud, Ltd. Digi ta l Media/Commerce Mercia Fund Management 5.3 MeWe Digi ta l Media/Commerce (Private Investors ) 5.2 Dremio Corporation Software Cisco Investments 5.0 Waldo Digi ta l Media/Commerce PROfounders Capita l 5.0 Digi ta l Comply, Inc. Software Bain Capita l Ventures 5.0 ZEPL Software Softbank Ventures 5.0 Lodgi fy.com Marketing Technology Nauta Capita l 5.0 Ci ty Home Digi ta l Media/Commerce Airbnb, Inc. 5.0 Unblockable, Inc. Digi ta l Media/Commerce Lightspeed Venture Partners 5.0 Swivel .work Digi ta l Media/Commerce Firs t Round Capita l 4.8 BinaryVR, Inc. Marketing Technology Atinum Invesstment 4.5 Nestio, Inc. Marketing Technology Trini ty Ventures 4.5 HungerBox Digi ta l Media/Commerce LionRock Capita l 4.5 As iaCol lect Holdings Pte. Ltd. Software SIG As ia Investments 4.5 Trucker Tools LLC Software Undisclosed 4.4 Kenzie Academy, Inc. Bus iness Services Learn Capita l Venture Partners 4.2 Cozystay.com Digita l Media/Commerce Tujia .com 4.0 Anchanto Pte Ltd. Software MDI Ventures 4.0 Labelbox, Inc. Software Kleiner Perkins Caufield & Byers 3.9 Fami ly Zone Cyber Safety Limited Software Tel lus Matrix Group 3.7 Indus .a i Software UP2398 3.7 Veri tonic, Inc. Marketing Technology Newark Venture Partners 3.5 Blueprint Power, Inc. Software Congruent Ventures 3.5 zecOps , Inc. Software KPN Ventures 3.5 DPOrganizer Software Paladin Capita l 3.5 Postie, Inc. Marketing Technology Crosscut Ventures 3.5 ProtoPie.io Marketing Technology Korea Investment Partners 3.5 Bright Network Ltd. Software Maven Capita l 3.3 Voltaware Ltd. Software BP Technology Ventures 3.3 Stronghold Insti tutional Services Limited Digi ta l Media/Commerce Freestyle Capita l 3.3 Squadle, Inc. Software Companyon Capita l 3.0 Li febit, Ltd. Software Pentech Ventures LLP 3.0 FRVR Limited Digi ta l Media/Commerce Accel Partners 3.0 Digi ta l Risks LLC Digi ta l Advertis ing Concentric Partners 3.0 Dirt Protocol Software Lightspeed Venture Partners 3.0 Velasca s .r.l . Digi ta l Media/Commerce P101 2.9 Wicket Labs , Inc. Marketing Technology Madrona Venture Group 2.8 Deck Commerce Marketing Technology Arsenal Capita l Partners , Inc. 2.7 CloudTrade Software Calculus Capita l Limited 2.6

57 | M&A and Investment Summary July 2018
All Segments($ in Millions)
Venture/Growth Capital TransactionsVC/Growth CapitalValues Disclosed Target Target Segment Buyer/Investor Reported TV
DOBCO Medica l Systems Software Fortino Capita l 2.6$ DataStories International NV Marketing Technology Newion Investments 2.6 Wi l low (hiwi l low.com) Digi ta l Media/Commerce Wildcat Capita l Management 2.5 The a i Corporation Limited Software Undisclosed 2.5 CapLinked, Inc. Software Alphabit Fund 2.5 Fuel Games Digi ta l Media/Commerce Sora Capita l 2.4 Sigma Ratings , Inc. Software finTech Col lective 2.4 Inbox Health, Inc. Software LaunchCapita l LLC 2.4 Viniexport s .r.l . Digi ta l Media/Commerce Inveready 2.3 AmazingCo Group Pty Ltd. Digi ta l Advertis ing Rampersand 2.3 SpotAngels Digi ta l Media/Commerce Streaml ined Ventures 2.3 Agora Images S.L. Digi ta l Media/Commerce Mnext Venture Capita l 2.3 Krome Photos , Inc. Digi ta l Media/Commerce Evolution Corporate Advisors 2.3 Landbot.io Software Nauta Capita l 2.2 AdQuick, Inc. Digi ta l Advertis ing Ini tia l i zed Capita l 2.1 Sokowatch Software Lynett Capita l 2.0 Knock Knock Digi ta l Media/Commerce London Venture Partners 2.0 Proggio Software Mangrove Capita l Partners 2.0 TowerIQ, Inc. Software Hyperplane Venture Capita l 2.0 Carepoynt Software Undisclosed 2.0 Neat Ltd. Digi ta l Media/Commerce Portag3 Ventures 2.0 Harper Wi lde, Inc. Digi ta l Media/Commerce CRV 2.0 Casechek, Inc. Software Brandsma Asset Management 1.8 Checkbox.a i Software (Private Investors ) 1.8 Perch Interactive Marketing Technology The Visual i ty Corporation 1.7 Kapwing, Inc. Marketing Technology Kleiner Perkins Caufield & Byers 1.7 Kel l i fy S.p.A. Information (Private Investors ) 1.7 Juggle Jobs Ltd. Software Oxford Capita l Partners Limited 1.7 Col l i s ion Management Systems Software BGF 1.6 W2 Global Data Solutions Limited Software Mercia Fund Management 1.6 Groww.in Digi ta l Media/Commerce Ins ignia Ventures Partners 1.6 The Ken Digi ta l Media/Commerce Omidyar Network 1.5 Spiro Technologies , Inc. Marketing Technology NXT Ventures 1.5 Modumate, Inc. Software LaunchCapita l LLC 1.5 CompanionLabs Systems, Inc. Marketing Technology Next Sparc LLC 1.5 Bl ink Identi ty, Inc. Marketing Technology Sinai Ventures 1.5 Cel l -Ed, Inc. Bus iness Services Lumina Foundation 1.5 Trel l Digi ta l Media/Commerce Sprout Venture Partners 1.3 3DLOOK, Inc. Marketing Technology U.Ventures 1.0 Pa ladin, PBC Software Hyde Park Venture Partners 1.0

58 | M&A and Investment Summary July 2018
Petsky Prunier: Maximizing Shareholder Value
▪ M&A Advisory and Sell-Side Representation
▪ Privately-Owned Companies
▪ Entrepreneur-Led Businesses
▪ Private Equity Portfolio Companies
▪ VC-Backed Companies
▪ Corporate Divestitures
▪ Selected Buy-Side Engagements
▪ Capital Raising and Private Placements
▪ Advertising & Marketing
▪ eCommerce
▪ Digital Media
▪ Technology
▪ Information
▪ Business Services
▪ Healthcare Services
▪ Business Current Situation Assessment and
Profit Improvement Planning
▪ Opportunity Mapping: Strategic Planning & Development
▪ Competitive Landscape Analysis
▪ M&A Transaction Due Diligence Support
▪ Buy-Side Targeting Criteria & Integration Strategy
▪ Custom Market Research
▪ Publishing, Speaking, and Thought Leadership
▪ Top-ranked, global investment bank dedicated to digital advertising and marketing, eCommerce, digital media, technology, information,
business services, and healthcare services industries
▪ Extensive sell-side M&A and capital raise expertise, with a transaction closing rate unmatched at our level of deal volume
▪ Founded in 1999
▪ More than 50 focused professionals; growth of 40% since 2011
▪ New York, Las Vegas, Chicago, Boston, Charlotte
▪ Deep relationships across a broad spectrum of strategic buyers, as well as private equity, growth equity, and VC groups and lenders
▪ Strategic consulting firm Winterberry Group – one of the largest industry-specific advisors providing strategic and transactional services
▪ Global reach enhanced through our partnerships in China and India
▪ Securities transactions are processed through Petsky Prunier Securities LLC, a member of FINRA and an affiliated entity

59 | M&A and Investment Summary July 2018
Ranked #1 by Bloomberg For Mid-Market Internet & Advertising Transactions
Bloomberg M&A League TablesTOP ADVISORS SERVING THE MIDDLE MARKET INTERNET & ADVERTISING SECTORS
2011-2017
Rank Advisor Deal Count
1 Petsky Prunier 114
2 Goldman Sachs 104
3 KPMG Corporate Finance 78
4 Morgan Stanley 77
5 PwC 76
6 Jordan Edmiston 74
7 JP Morgan 64
7 GCA Savvian 64
9 Ernst & Young 63
10 Rothschild 60
Based on number of deals announced in 2011‐2017 valued at $500 million or less. Internet and Advertising is defined by Bloomberg.
▪ With more than 75 transactions closed in the last 36 months, and more than 140 transactions closed since 2011 (across all industries
in addition to Internet and Advertising), Petsky Prunier is one of the most active M&A practices within the marketing and
advertising, eCommerce, and media industries

60 | M&A and Investment Summary July 2018
Representative Recent Transactions
*For a more comprehensive list, please click here.
a portfolio company of
a portfolio company of
has been sold to
has sold a majority stake to
a portfolio company of
has been sold to
a portfolio company of has sold its auto insurance, home insurance,
mortgage, and technology assets
to
(NASDAQ: QNST)
has received a growth investment fromhas received a strategic investment from
has made a majority investment in
(STAR: REY)has announced a
definitive merger agreement with
a portfolio company of
(NASDAQ: CG)
has successfully completed a Series B Financing led by
a division of
has been sold to
a consortium of family office and private equity investors
a portfolio company of
has been sold to
a portfolio company of
has been sold to
has been sold to
an indirect subsidiary of
(NYSE: MRK)
has been sold to
has been sold to
a portfolio company of
has been sold to
a portfolio company of a portfolio company of
has been sold to
(LON:HNT)
has been sold to
has received a significant investment from