Embed Size (px)
Citation preview

July 2013 – V0.8 Adult - Daily Fluid Prescription & Balance chart

July 2013 – V0.8 Adult - Daily Fluid Prescription & Balance chart
Aims and outcomes of session.Aims and outcomes of session.
Aim:
� To instruct staff on the
correct completion of the
Outcomes:
Demonstrate the ability to:
� calculate and complete
fluid prescription.
� correctly administer fluids.
� correctly complete a fluid
balance chart.
2
adult
daily fluid prescription &
balance chart.

July 2013 – V0.8 Adult - Daily Fluid Prescription & Balance chart 3
Front

July 2013 – V0.8 Adult - Daily Fluid Prescription & Balance chart 4
Back

July 2013 – V0.8 Adult - Daily Fluid Prescription & Balance chart
� Chart must be used for adults
� from their 16th birthday
� throughout each of the 5 HSC Trusts
� Except for patients
� cared for in ICUs, HDUs, specialist units
� with diabetic ketoacidosis
� with acute burns.
� who may use different fluid prescription charts.
5

July 2013 – V0.8 Adult - Daily Fluid Prescription & Balance chart
1. Labelling1. Labelling
6
� Stick on labels and complete hospital, ward & date
� on both sides of chart
Front
Backand

July 2013 – V0.8 Adult - Daily Fluid Prescription & Balance chart
2. Insert patient’s weight in kgs2. Insert patient’s weight in kgs
7
The weight used must be a recent weight
Indicate whether estimated or measured & when.

July 2013 – V0.8 Adult - Daily Fluid Prescription & Balance chart
3. Insert yesterday’s fluid balance details3. Insert yesterday’s fluid balance details
8

July 2013 – V0.8 Adult - Daily Fluid Prescription & Balance chart 9
For information onFor information on
Prescribing fluids
Administering fluids
Completing fluid balance chart
Recording intake
Recording output
Recording balance
Start next days chart
Cumulative totalling
� slide 10
� slide 22
�slide 23
�slide 23
�slide 28
�slide 31
�slide 32
�slide 33
July 2013 – V0.8 Adult - Daily Fluid Prescription & Balance chart
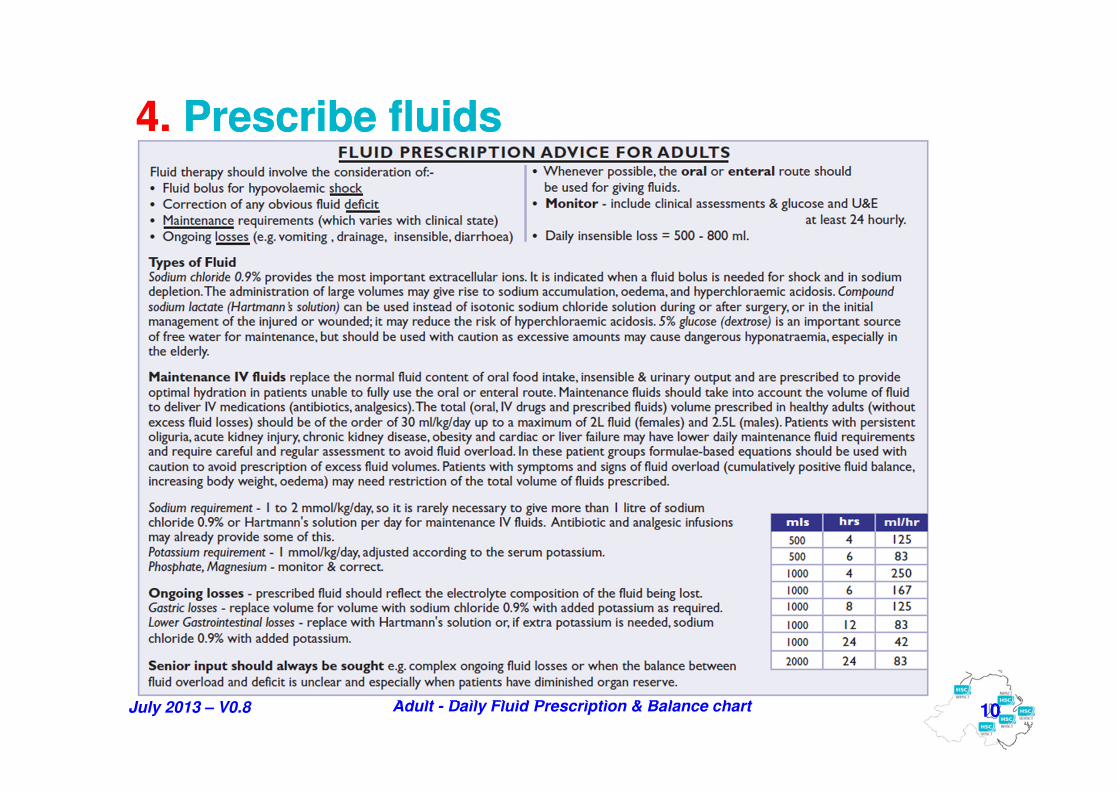
� Back of chart contains a fluid guidance panel,
� based upon considering
� Fluid bolus for shock,
� Correction of any fluid deficit,
� Maintenance fluid – if required,
� Balancing any ongoing losses.
� Clinical assesment & monitoring are emphasised.
� Seek Senior input if help is needed.
10
4. Prescribe fluids4. Prescribe fluids

July 2013 – V0.8 Adult - Daily Fluid Prescription & Balance chart
4. Prescribe fluids4. Prescribe fluids
*
* Medicines must be recorded in Drug Kardex
11

July 2013 – V0.8 Adult - Daily Fluid Prescription & Balance chart 12
4. Prescribe fluids4. Prescribe fluids
HARTMANN’S SOLUTION
5% GLUCOSE SOLUTION
0.9% SODIUM CHLORIDE
Infusion fluids can also be identified by their Letter
A
B
C

July 2013 – V0.8 Adult - Daily Fluid Prescription & Balance chart 13
Method for prescribing fluids:-Method for prescribing fluids:-
Shock � Fluid Bolus If fluid bolus required �
� calculate volume
� prescribe
� record indication as
B 01/01/xxxx 500 mls12:00 0.9% SODIUM CHLORIDE
B
BB
B
July 2013 – V0.8 Adult - Daily Fluid Prescription & Balance chart 14
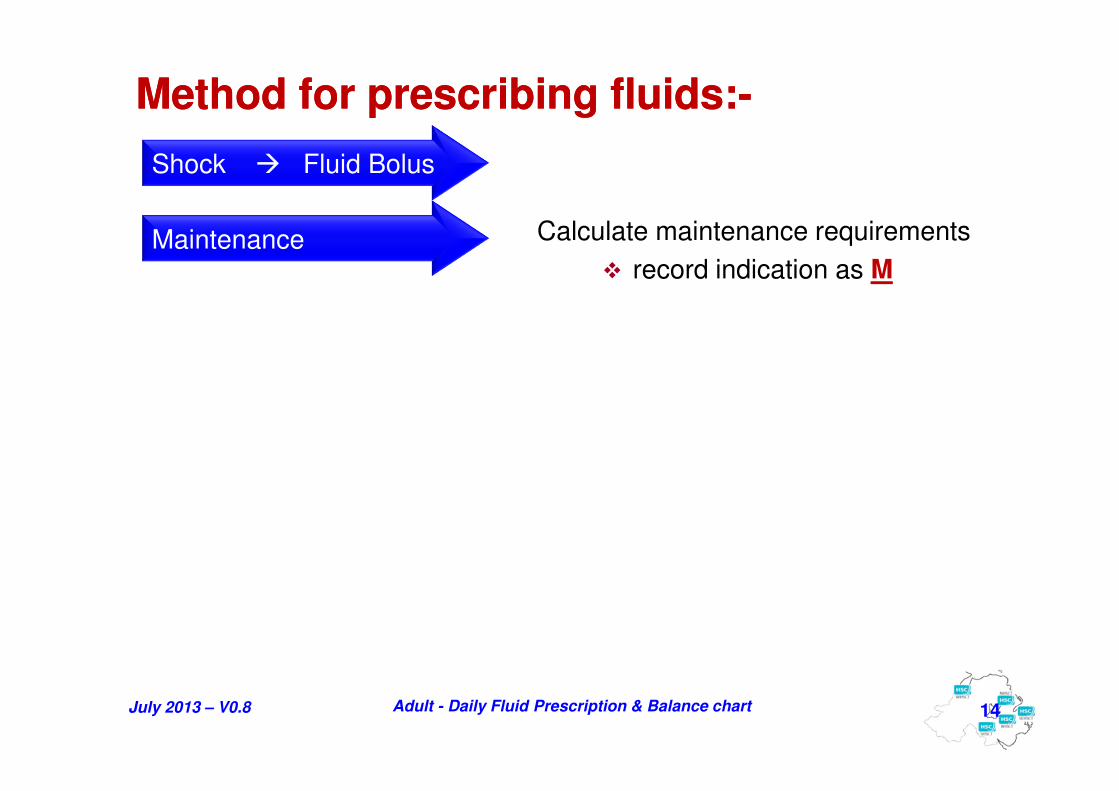
Method for prescribing fluids:-Method for prescribing fluids:-
Maintenance Calculate maintenance requirements
� record indication as M
Shock � Fluid Bolus

July 2013 – V0.8 Adult - Daily Fluid Prescription & Balance chart 15
Method for prescribing fluids:-Method for prescribing fluids:-
Maintenance Calculate maintenance requirements
� record indication as M
Shock � Fluid Bolus
B 01/01/xxxx 500 mls 0.9% SODIUM CHLORIDE
M 01/01/xxxx 500mls12.30
M
5% GLUCOSE
12:00

July 2013 – V0.8 Adult - Daily Fluid Prescription & Balance chart 16
Method for prescribing fluids:-Method for prescribing fluids:-
Correct deficit Is there a fluid deficit?
� calculate correction
� prescribe
� record indication as D
Shock � Fluid Bolus
Maintenance
July 2013 – V0.8 Adult - Daily Fluid Prescription & Balance chart 17
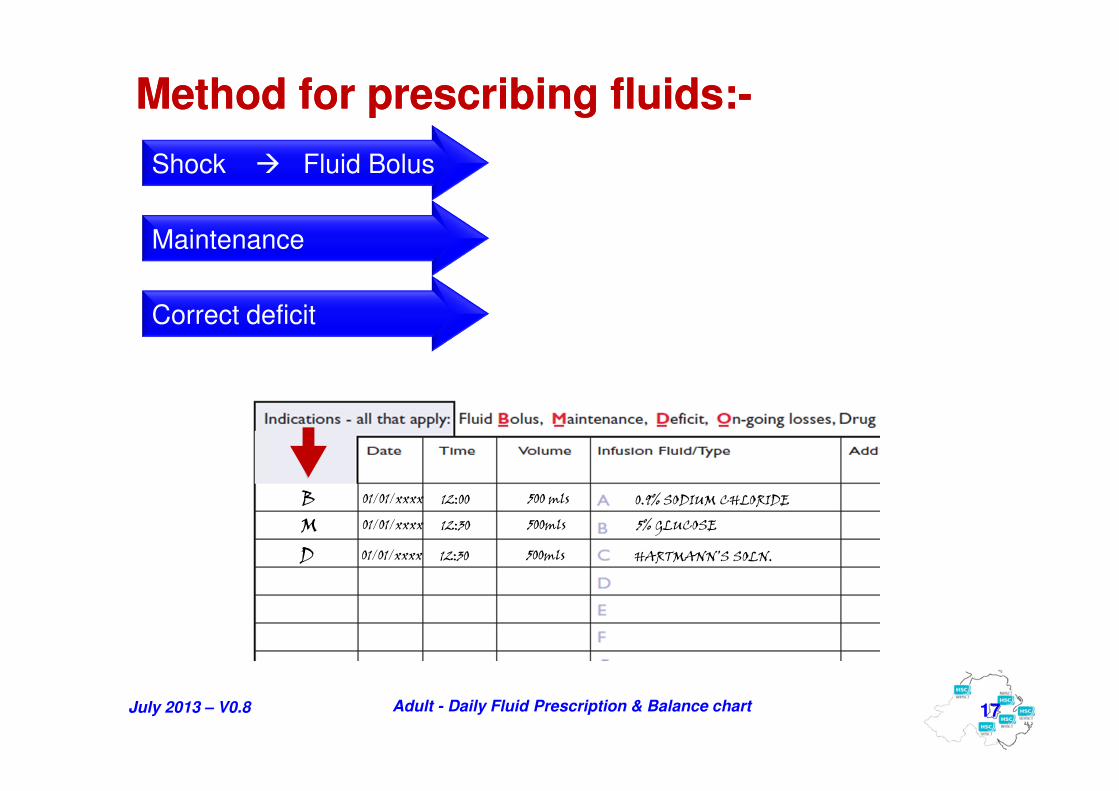
Method for prescribing fluids:-Method for prescribing fluids:-
Correct deficit
Shock � Fluid Bolus
Maintenance
B 01/01/xxxx 500 mls12:00 0.9% SODIUM CHLORIDE
M 01/01/xxxx 500mls12:30
D 01/01/xxxx 500mls12:30 HARTMANN’S SOLN.
5% GLUCOSE
July 2013 – V0.8 Adult - Daily Fluid Prescription & Balance chart 18
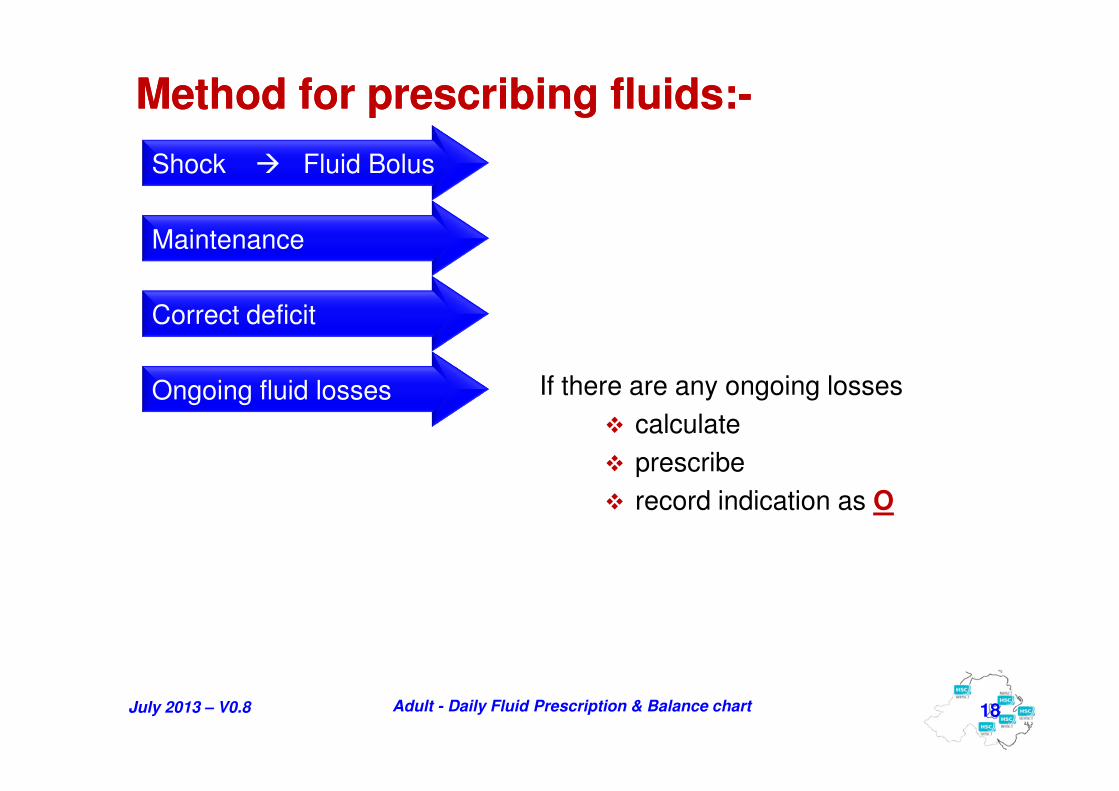
Method for prescribing fluids:-Method for prescribing fluids:-
Ongoing fluid losses If there are any ongoing losses
� calculate
� prescribe
� record indication as O
Correct deficit
Shock � Fluid Bolus
Maintenance

July 2013 – V0.8 Adult - Daily Fluid Prescription & Balance chart 19
Method for prescribing fluids:-Method for prescribing fluids:-
Ongoing fluid losses
Correct deficit
Shock � Fluid Bolus
Maintenance
B 01/01/xxxx 500 mls12:00 0.9% SODIUM CHLORIDE
M 01/01/xxxx 500mls12:30 5% GLUCOSE
D 01/01/xxxx 500mls12:30 HARTMANN’S SOLN.
O 01/01/xxxx 500mls17:00 0.9% SODIUM CHLORIDE

July 2013 – V0.8 Adult - Daily Fluid Prescription & Balance chart 20
B 01/01/xx 500 mls12:00 0.9% SODIUM CHLORIDE Over 30 minutes Xxxx. Xxxxx
M 01/01/xx 500 mls1230 5% GLUCOSE 65 mls/hr Xxxx. Xxxxx
D 01/01/xx 500 mls1230 HARTMANN’S SOLN. 80 mls/hr Xxxx. Xxxxx
O 01/01/xx 500 mls1700 0.9% SODIUM CHLORIDE 40mls/hr Xxxx. Xxxxx40mmol KCl
Example 1:
Based on 70 kg adult.
4. Prescribe fluids4. Prescribe fluids
M 01/01/xx 1000 mls2030 HARTMANN’S SOLN. 60 mls/hr Xxxx. Xxxxx

July 2013 – V0.8 Adult - Daily Fluid Prescription & Balance chart 21
B 01/01/xx 500 mls12:00 0.9% SODIUM CHLORIDE Over 30 minutes Xxxx. Xxxxx
M+D 01/01/xx 1000mls1230 HARTMANN’S SOLN. 120 mls/hr Xxxx. Xxxxx
O 01/01/xx 500 mls1700 0.9% SODIUM CHLORIDE 40mls/hr Xxxx. Xxxxx40 mmol KCl
Example 2:
Alternatively, indications may be combined.
4. Prescribe fluids4. Prescribe fluids
M 01/01/xx 1000 mls2030 HARTMANN’S SOLN. 60 mls/hr Xxxx. Xxxxx

July 2013 – V0.8 Adult - Daily Fluid Prescription & Balance chart 22
5. Administer fluids5. Administer fluids
When completing this section, the following double checks are made:-• Correct patient• Correct medicine• Correct dose • Correct time• Correct route
B 01/01/xx 500 mls12:00 0.9% SODIUM CHLORIDE Over 30 minutes Xxxx. Xxxxx
M+D 01/01/xx 1000 mls1230 HARTMANN’S SOLUTION 120 mls/hr Xxxx. Xxxxx
O 01/01/xx 500 mls1700 0.9% SODIUM CHLORIDE 40 mls/hr Xxxx. Xxxxx40 mmol KCl
- including Batch number & Expiry dateInfusion pump details
Check

July 2013 – V0.8 Adult - Daily Fluid Prescription & Balance chart
6. Record intake6. Record intake
23
� Record
� Site
� Amount
� Type
� for each type of fluid
� every hour

July 2013 – V0.8 Adult - Daily Fluid Prescription & Balance chart
16G16G16G16GRight handRight handRight handRight hand
20G20G20G20GLeft ACFLeft ACFLeft ACFLeft ACFNG tubeNG tubeNG tubeNG tube
100100100100
100100100100
100100100100
100100100100
100100100100
40404040
40404040
404040404040404040404040
40404040
40404040
4040404040404040
40404040
404040404040404040404040
40404040
100100100100
100100100100100100100100
100100100100100100100100
6. Record intake6. Record intake
24
� Record
� Site
� Amount
� Type
� for each type of fluid
� every hour D5WD5WD5WD5W
0.9% Sodium Chloride0.9% Sodium Chloride0.9% Sodium Chloride0.9% Sodium Chloride
Hartmann’sHartmann’sHartmann’sHartmann’s
EnsureEnsureEnsureEnsure
40404040
4040404040404040
40404040
40404040
4040404040404040
40404040
40404040
40404040
40404040

July 2013 – V0.8 Adult - Daily Fluid Prescription & Balance chart
16G16G16G16GRight handRight handRight handRight hand
20G20G20G20GLeft ACFLeft ACFLeft ACFLeft ACFNG tubeNG tubeNG tubeNG tube
40404040
4040404040404040
40404040
40404040
4040404040404040
40404040
40404040
40404040
40404040
100100100100
100100100100
100100100100
100100100100
100100100100
40404040
40404040
404040404040404040404040
40404040
40404040
4040404040404040
40404040
404040404040404040404040
40404040
100100100100
100100100100100100100100
100100100100100100100100
6. Record intake6. Record intake
25
� Record
� Site
� Amount
� Type*
� for each type of fluid
� every hour
* = identify with letter if wish
BBBB
CCCC
DDDD
EnsureEnsureEnsureEnsure

July 2013 – V0.8 Adult - Daily Fluid Prescription & Balance chart
16G16G16G16GRight handRight handRight handRight hand
20G20G20G20GLeft ACFLeft ACFLeft ACFLeft ACFNG tubeNG tubeNG tubeNG tube
40404040
4040404040404040
40404040
40404040
4040404040404040
40404040
40404040
40404040
40404040
100100100100
100100100100
100100100100
100100100100
100100100100
40404040
40404040
404040404040404040404040
40404040
40404040
4040404040404040
40404040
404040404040404040404040
40404040
100100100100
100100100100
100100100100
PARACETAMOLPARACETAMOLPARACETAMOLPARACETAMOL
6. Record intake – IV drugs6. Record intake – IV drugs
26
� If feasible
� Record all IV drugs
(e.g. paracetamol or
antibiotics) in one
column
� e.g. column
indicated
BBBB
CCCC
PARACETAMOLPARACETAMOLPARACETAMOLPARACETAMOL
PARACETAMOLPARACETAMOLPARACETAMOLPARACETAMOL
CIPROFLOXACINCIPROFLOXACINCIPROFLOXACINCIPROFLOXACIN200200200200
CIPROFLOXACINCIPROFLOXACINCIPROFLOXACINCIPROFLOXACIN
200200200200
EnsureEnsureEnsureEnsure

July 2013 – V0.8 Adult - Daily Fluid Prescription & Balance chart 27
7. Record intake totals7. Record intake totals
1560156015601560440440440440
2000200020002000
July 2013 – V0.8 Adult - Daily Fluid Prescription & Balance chart
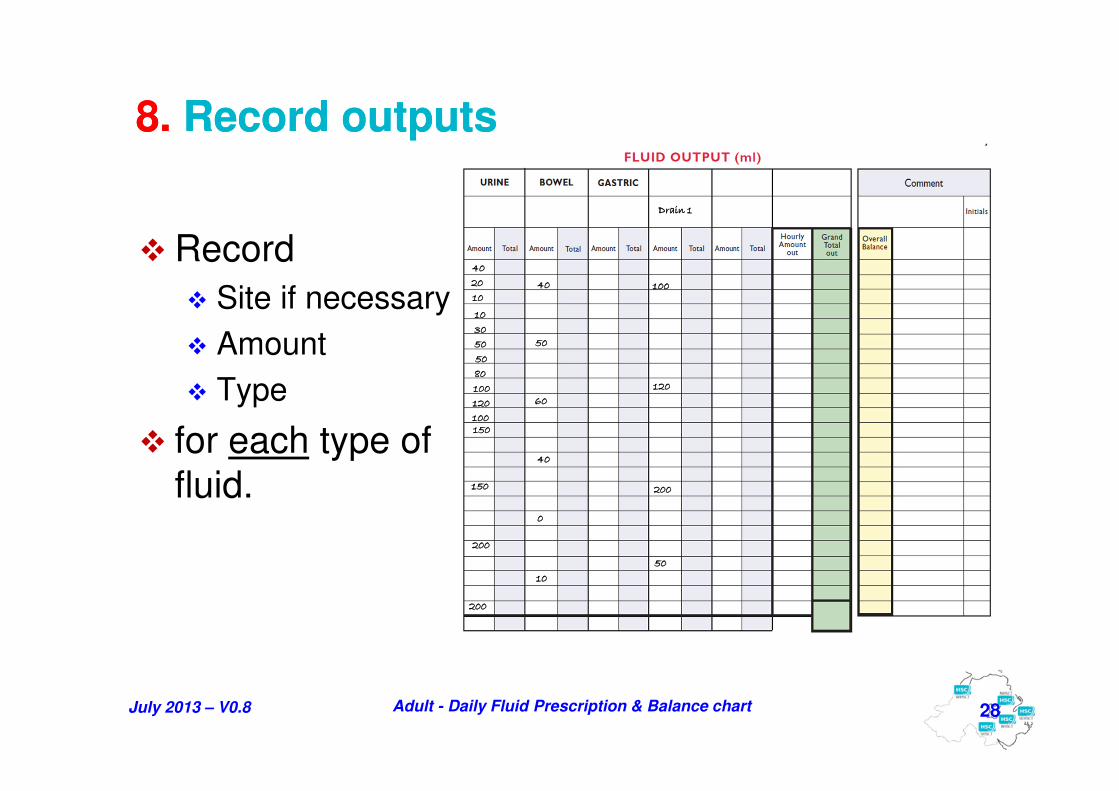
8. Record outputs8. Record outputs
� Record
� Site if necessary
� Amount
� Type
� for each type of
fluid.
28
30303030
10101010
50505050
50505050
80808080
100100100100
10101010
120120120120
20202020
40404040
200200200200
Drain 1Drain 1Drain 1Drain 1
100100100100
120120120120
50505050
200200200200
50505050
40404040
60606060
40404040
10101010
0000
150150150150
150150150150
200200200200
100100100100

July 2013 – V0.8 Adult - Daily Fluid Prescription & Balance chart 29
9. Record Signature9. Record Signature
Record signature or initials
when making entries onto chart

July 2013 – V0.8 Adult - Daily Fluid Prescription & Balance chart 30
10. Record output totals10. Record output totals
1310131013101310200200200200
4704704704701980198019801980
July 2013 – V0.8 Adult - Daily Fluid Prescription & Balance chart 31
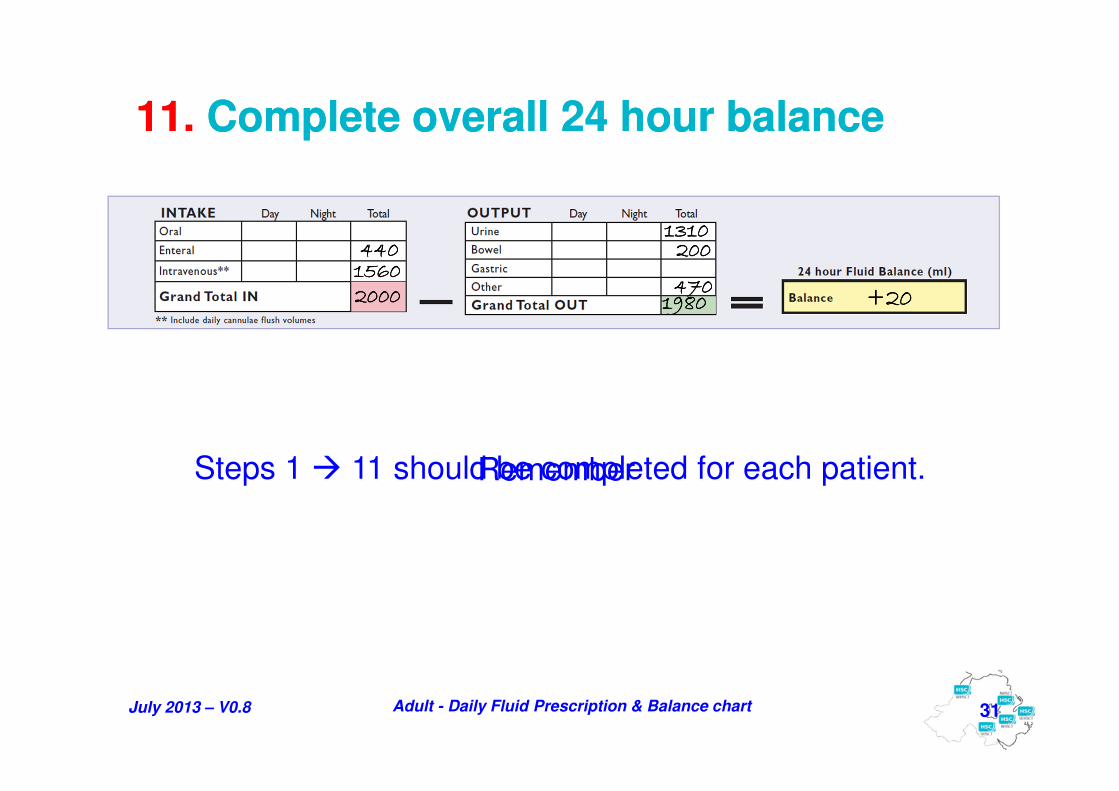
11. Complete overall 24 hour balance11. Complete overall 24 hour balance
19801980198019802000200020002000 +20+20+20+20
Steps 1 � 11 should be completed for each patient.Remember
1560156015601560440440440440
1310131013101310200200200200
470470470470

July 2013 – V0.8 Adult - Daily Fluid Prescription & Balance chart 32
12. Start next day’s chart12. Start next day’s chart
2000200020002000 ++++202020201980198019801980
FrontBack
i. Labelling
ii. Weight
iii. Volumes

July 2013 – V0.8 Adult - Daily Fluid Prescription & Balance chart
� It is commonly done for each individual fluid.
� And fluids can be totalled hourly
� Can total Output fluids only
� Not every patient needs it done
� Some will never need it
� Some will only need it for a while
33
or both Input and Output.
Cumulative TotalsCumulative Totals

July 2013 – V0.8 Adult - Daily Fluid Prescription & Balance chart
� Decision to calculate and record cumulative totals depends on:-
� the severity of the patient’s illness.
� Hospital site, service directorate, unit or ward policy.
� For example, cumulative totalling may be required with:-
� Hourly urine output measurement.
� Postoperative patients.
� Receiving both oral and intravenous fluid administration.
� Patients with gastrointestinal fluid loss and drainage problems.
� Patients with electrolyte problems.
� Complex and/or Unstable patients.
34
Cumulative TotalsCumulative Totals

July 2013 – V0.8 Adult - Daily Fluid Prescription & Balance chart
6a. Intake – Cumulative total for each fluid6a. Intake – Cumulative total for each fluid
35
� Cumulative totals for
� each type of fluid
16G16G16G16GRight handRight handRight handRight hand
20G20G20G20GLeft ACFLeft ACFLeft ACFLeft ACFNG tubeNG tubeNG tubeNG tube
40404040
4040404040404040
40404040
40404040
4040404040404040
40404040
40404040
40404040
40404040
100100100100
100100100100
100100100100
100100100100
100100100100
40404040
40404040
404040404040404040404040
40404040
40404040
4040404040404040
40404040
404040404040404040404040
40404040
100100100100
100100100100100100100100
100100100100100100100100
CCCC
BBBB
DDDD
EnsureEnsureEnsureEnsure

July 2013 – V0.8 Adult - Daily Fluid Prescription & Balance chart
16G16G16G16GRight handRight handRight handRight hand
20G20G20G20GLeft ACFLeft ACFLeft ACFLeft ACFNG tubeNG tubeNG tubeNG tube
40404040
4040404040404040
40404040
40404040
4040404040404040
40404040
40404040
40404040
40404040
100100100100
100100100100
100100100100
100100100100
100100100100
40404040
40404040
404040404040404040404040
40404040
40404040
4040404040404040
40404040
404040404040404040404040
40404040
100100100100
100100100100100100100100
100100100100100100100100
CCCC
2000200020002000
BBBB
CCCC
6a. Intake – Cumulative total for each fluid6a. Intake – Cumulative total for each fluid
36
� Cumulative totals for
� each type of fluid
� This will allow a
40404040
80808080120120120120
160160160160200200200200
440440440440
280280280280
360360360360
320320320320
400400400400
240240240240
100100100100
200200200200
300300300300400400400400
500500500500
100100100100
200200200200300300300300
400400400400500500500500
540540540540
580580580580
620620620620
660660660660700700700700
1020102010201020
740740740740780780780780
820820820820860860860860900900900900
940940940940980980980980
1060106010601060
DDDD
440440440440 1060106010601060 500500500500
Grand Total in
EnsureEnsureEnsureEnsure

July 2013 – V0.8 Adult - Daily Fluid Prescription & Balance chart 37
����
Cumulative Totals – may be an instructionCumulative Totals – may be an instruction

July 2013 – V0.8 Adult - Daily Fluid Prescription & Balance chart
16G16G16G16GRight handRight handRight handRight hand
20G20G20G20GLeft ACFLeft ACFLeft ACFLeft ACFNG tubeNG tubeNG tubeNG tube
40404040
4040404040404040
40404040
40404040
4040404040404040
40404040
40404040
40404040
40404040
100100100100
100100100100
100100100100
100100100100
100100100100
40404040
40404040
404040404040404040404040
40404040
40404040
4040404040404040
40404040
404040404040404040404040
40404040
100100100100
100100100100100100100100
100100100100100100100100
CCCC
6b. Intake – Hourly cumulative totals6b. Intake – Hourly cumulative totals
38
� Cumulative totals
to be calculated
� each hour
� to get an
Hourly amount in
and then
Grand Total in
BBBB
DDDD
EnsureEnsureEnsureEnsure

July 2013 – V0.8 Adult - Daily Fluid Prescription & Balance chart
16G16G16G16GRight handRight handRight handRight hand
20G20G20G20GLeft ACFLeft ACFLeft ACFLeft ACFNG tubeNG tubeNG tubeNG tube
40404040
4040404040404040
40404040
40404040
4040404040404040
40404040
40404040
40404040
40404040
100100100100
100100100100
100100100100
100100100100
100100100100
40404040
40404040
404040404040404040404040
40404040
40404040
4040404040404040
40404040
404040404040404040404040
40404040
100100100100
100100100100100100100100
100100100100100100100100
CCCC
6b. Intake – Hourly cumulative totals 6b. Intake – Hourly cumulative totals
39
� Worked example
40404040
40404040
80808080
140140140140140140140140
140140140140140140140140
14014014014040404040
80808080
180180180180
140140140140
40404040
140140140140
140140140140140140140140
40404040
40404040
4040404040404040
4040404040404040
980980980980
1160116011601160
13001300130013001440144014401440
220220220220360360360360
500500500500640640640640
780780780780
80808080
40404040
820820820820900900900900
1580158015801580
1720172017201720
1800180018001800
1840184018401840
1880188018801880
1960196019601960
1760176017601760
1920192019201920
2000200020002000
BBBB
DDDD
EnsureEnsureEnsureEnsure
July 2013 – V0.8 Adult - Daily Fluid Prescription & Balance chart
16G16G16G16GRight handRight handRight handRight hand
20G20G20G20GLeft ACFLeft ACFLeft ACFLeft ACFNG tubeNG tubeNG tubeNG tube
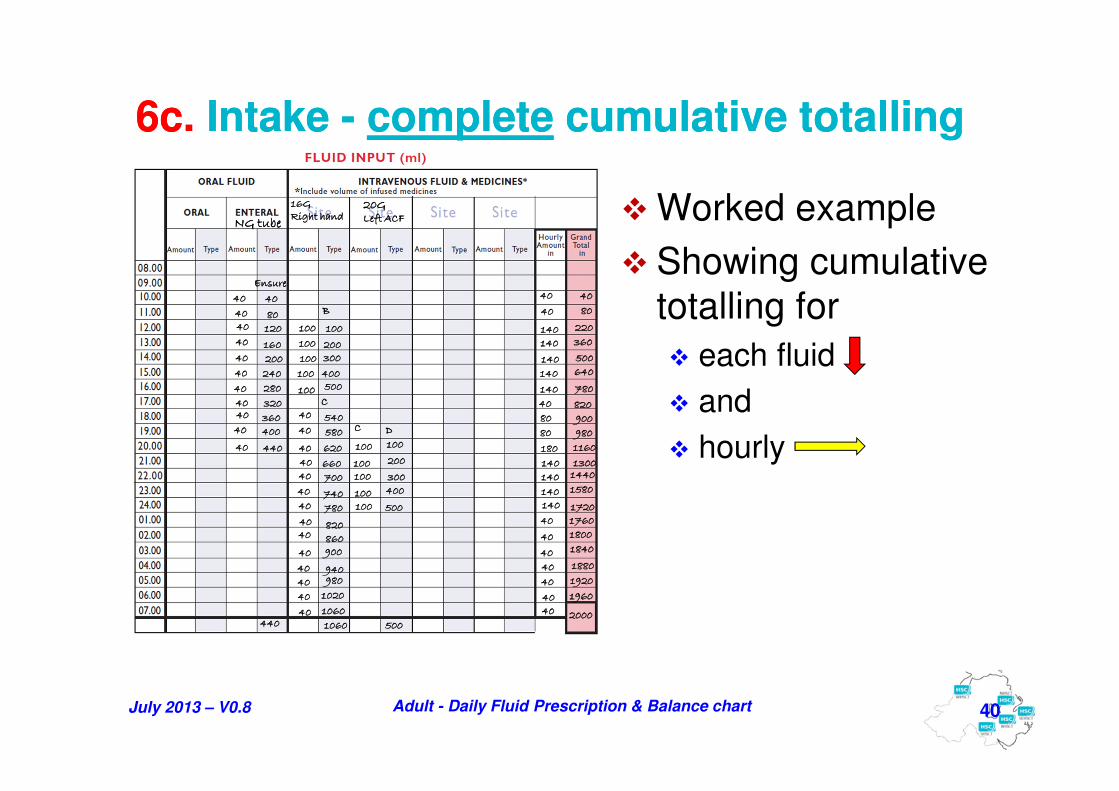
6c. Intake - complete cumulative totalling 6c. Intake - complete cumulative totalling
40
� Worked example
� Showing cumulative
totalling for
� each fluid
� and
� hourly
40404040
40404040
80808080
140140140140140140140140
140140140140140140140140
14014014014040404040
80808080
180180180180
140140140140
40404040
140140140140
140140140140140140140140
40404040
40404040
4040404040404040
4040404040404040
980980980980
1160116011601160
13001300130013001440144014401440
220220220220360360360360
500500500500640640640640
780780780780
80808080
40404040
820820820820900900900900
1580158015801580
1720172017201720
1800180018001800
1840184018401840
1880188018801880
1960196019601960
1760176017601760
1920192019201920
40404040
4040404040404040
40404040
40404040
4040404040404040
40404040
40404040
40404040
40404040
100100100100
100100100100
100100100100
100100100100
100100100100
40404040
40404040
404040404040404040404040
40404040
40404040
4040404040404040
40404040
404040404040404040404040
40404040
100100100100
100100100100100100100100
100100100100100100100100
CCCC
2000200020002000
BBBB
CCCC
40404040
80808080120120120120
160160160160200200200200
440440440440
280280280280
360360360360
320320320320
400400400400
240240240240
100100100100
200200200200
300300300300400400400400
500500500500
100100100100
200200200200300300300300
400400400400500500500500
540540540540
580580580580
620620620620
660660660660700700700700
1020102010201020
740740740740780780780780
820820820820860860860860900900900900
940940940940980980980980
1060106010601060
DDDD
440440440440 1060106010601060 500500500500
EnsureEnsureEnsureEnsure

July 2013 – V0.8 Adult - Daily Fluid Prescription & Balance chart 41
7. Record intake totals7. Record intake totals
1560156015601560440440440440
2000200020002000
with Day & Night totals if requested by Senior Staff
400400400400 40404040580580580580 980980980980

July 2013 – V0.8 Adult - Daily Fluid Prescription & Balance chart
8a. Output – cumulative total for each fluid8a. Output – cumulative total for each fluid
� Cumulative totals
to be calculated
for
� each type of fluid
42
100100100100
120120120120
50505050
200200200200
30303030
10101010
50505050
50505050
80808080
100100100100
10101010
120120120120
20202020
40404040
200200200200
50505050
40404040
60606060
40404040
10101010
0000
150150150150
150150150150
200200200200
100100100100
Drain 1Drain 1Drain 1Drain 1

July 2013 – V0.8 Adult - Daily Fluid Prescription & Balance chart
100100100100
120120120120
50505050
200200200200
30303030
10101010
50505050
50505050
80808080
100100100100
10101010
120120120120
20202020
40404040
200200200200
50505050
40404040
60606060
40404040
10101010
0000
150150150150
150150150150
200200200200
100100100100
Drain 1Drain 1Drain 1Drain 1
8a. Output – cumulative total for each fluid8a. Output – cumulative total for each fluid
� Cumulative totals
to be calculated
for
� each type of fluid
� This will allow a
43
40404040
190190190190
150150150150
90909090
200200200200
190190190190
70707070
60606060
40404040
210210210210
160160160160
110110110110
80808080
390390390390
290290290290
100100100100
220220220220
420420420420
470470470470
510510510510
1310131013101310
610610610610760760760760
910910910910
1110111011101110
1310131013101310 200200200200 4704704704701980198019801980
Grand Total out

July 2013 – V0.8 Adult - Daily Fluid Prescription & Balance chart
100100100100
120120120120
50505050
200200200200
30303030
10101010
50505050
50505050
80808080
100100100100
10101010
120120120120
20202020
40404040
200200200200
50505050
40404040
60606060
40404040
10101010
0000
150150150150
150150150150
200200200200
100100100100
8b. Output – Hourly cumulative totals8b. Output – Hourly cumulative totals
� Cumulative totals
to be calculated
for
� each hour
� to get an
Hourly amount out
and then
Grand Total out
44
Drain 1Drain 1Drain 1Drain 1

July 2013 – V0.8 Adult - Daily Fluid Prescription & Balance chart
100100100100
120120120120
50505050
200200200200
30303030
10101010
50505050
50505050
80808080
100100100100
10101010
120120120120
20202020
40404040
200200200200
50505050
40404040
60606060
40404040
10101010
0000
150150150150
150150150150
200200200200
100100100100
8b. Output – Hourly cumulative totals8b. Output – Hourly cumulative totals
� Cumulative totals
to be calculated
for
� each hour
� to get an
Hourly amount out
and then
Grand Total out
45
40404040200200200200
210210210210220220220220
250250250250
350350350350
400400400400
480480480480700700700700
880880880880
1170117011701170
1770177017701770
1980198019801980
1780178017801780
1520152015201520
980980980980
1130113011301130
1720172017201720
40404040160160160160
1010101010101010
30303030
100100100100
50505050
80808080220220220220
180180180180
40404040
50505050
200200200200
10101010
350350350350
100100100100
150150150150
200200200200
Drain 1Drain 1Drain 1Drain 1

July 2013 – V0.8 Adult - Daily Fluid Prescription & Balance chart
8c. Output – complete cumulative totalling 8c. Output – complete cumulative totalling
46
40404040200200200200
210210210210220220220220
250250250250
350350350350
400400400400
480480480480700700700700
880880880880
1170117011701170
1770177017701770
1980198019801980
1780178017801780
1520152015201520
980980980980
1130113011301130
1720172017201720
40404040160160160160
1010101010101010
30303030
100100100100
50505050
80808080220220220220
180180180180
40404040
50505050
200200200200
10101010
350350350350
100100100100
150150150150
200200200200
100100100100
120120120120
50505050
200200200200
30303030
10101010
50505050
50505050
80808080
100100100100
10101010
120120120120
20202020
40404040
200200200200
50505050
40404040
60606060
40404040
10101010
0000
150150150150
150150150150
200200200200
100100100100
40404040
190190190190
150150150150
90909090
200200200200
190190190190
70707070
60606060
40404040
210210210210
160160160160
110110110110
80808080
390390390390
290290290290
100100100100
220220220220
420420420420
470470470470
510510510510
1310131013101310
610610610610760760760760
910910910910
1110111011101110
1310131013101310 200200200200 470470470470
� Worked example
� Showing
cumulative
totalling for
� each fluid
� hourly
Drain 1Drain 1Drain 1Drain 1
July 2013 – V0.8 Adult - Daily Fluid Prescription & Balance chart 47
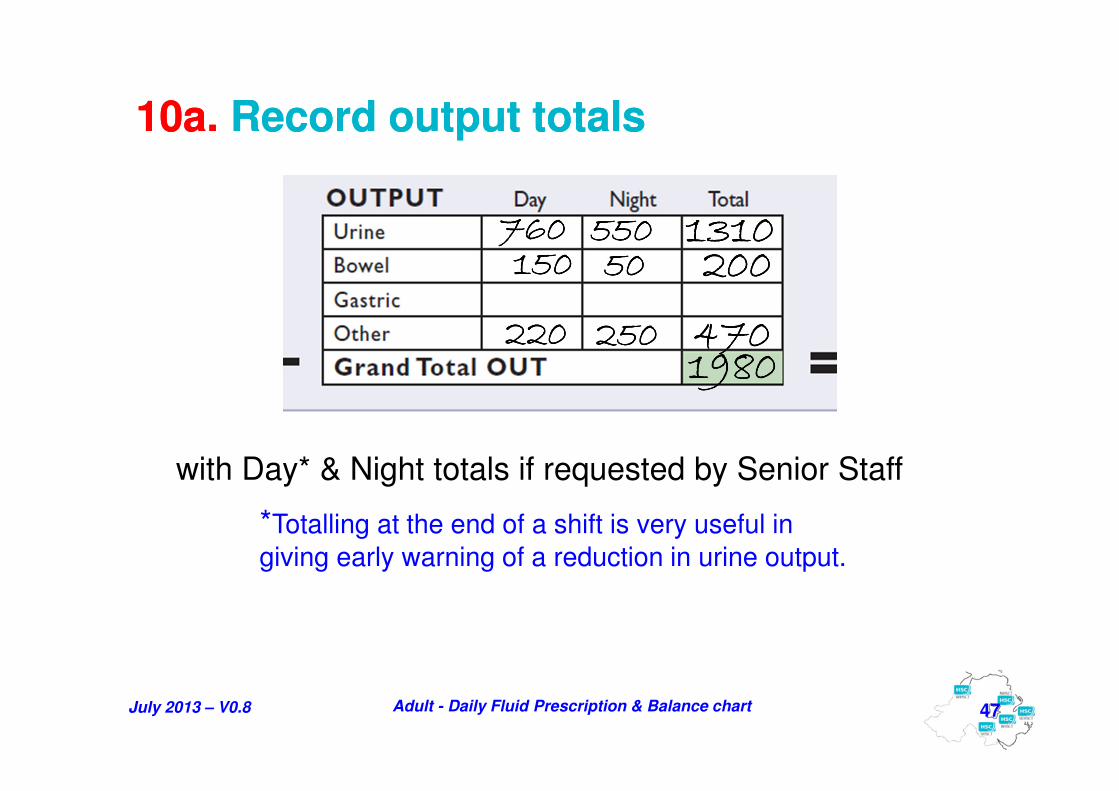
10a. Record output totals10a. Record output totals
1310131013101310200200200200
4704704704701980198019801980
with Day* & Night totals if requested by Senior Staff
55055055055050505050
250250250250
760760760760150150150150
220220220220
*Totalling at the end of a shift is very useful in
giving early warning of a reduction in urine output.

July 2013 – V0.8 Adult - Daily Fluid Prescription & Balance chart
11a. Calculate overall hourly balance11a. Calculate overall hourly balance
48
� Calculate the overall
balance
� each hour
980980980980
1160116011601160
13001300130013001440144014401440
220220220220
360360360360500500500500
640640640640780780780780
80808080
40404040
820820820820
900900900900
1580158015801580
1720172017201720
1800180018001800
1840184018401840
1880188018801880
1960196019601960
1760176017601760
1920192019201920
2000200020002000
40404040
200200200200
210210210210
220220220220
250250250250
350350350350
400400400400
480480480480700700700700
880880880880
1170117011701170
1770177017701770
1980198019801980
1780178017801780
1520152015201520
980980980980
1130113011301130
1720172017201720
---- 40404040
---- 200200200200
---- 170170170170
---- 140140140140
---- 30303030
10101010
100100100100
160160160160
80808080---- 60606060
---- 80808080
---- 150150150150
30303030
130130130130
270270270270
200200200200240240240240
280280280280
110110110110
120120120120
140140140140
180180180180
20202020
60606060
40404040
40404040
80808080
140140140140
140140140140
140140140140140140140140
14014014014040404040
80808080
180180180180
140140140140
40404040
140140140140140140140140140140140140
40404040
40404040
40404040
40404040
40404040
40404040
40404040
160160160160
10101010
10101010
30303030
100100100100
50505050
80808080220220220220
180180180180
40404040
50505050
200200200200
10101010
350350350350
100100100100
150150150150
200200200200

July 2013 – V0.8 Adult - Daily Fluid Prescription & Balance chart 49
11a. Complete overall 24 hour balance11a. Complete overall 24 hour balance
19801980198019802000200020002000 +20+20+20+20
with Day & Night totals if requested by Senior Staff
1560156015601560440440440440
1310131013101310200200200200
470470470470
55055055055050505050
250250250250
760760760760150150150150
220220220220
400400400400 40404040580580580580 980980980980

July 2013 – V0.8 Adult - Daily Fluid Prescription & Balance chart 50
Fluid Prescription/Balance ChartFluid Prescription/Balance Chart


![Elastix Book Comunicaciones Unificadas Con Elastix Vol1 V0.8[2]](https://img.dokumen.tips/doc/110x75/557b2878d8b42a71798b518e/elastix-book-comunicaciones-unificadas-con-elastix-vol1-v082.jpg)
![Funciones Hiperbólicas [v0.8]](https://img.dokumen.tips/doc/110x75/55cf8ad355034654898e19b6/funciones-hiperbolicas-v08.jpg)